the vortex - justice policy institute · the vortex: the concentrated racial impact of drug...
TRANSCRIPT
A Justice Policy Institute ReportDecember 2007
The VortexThe Concentrated Racial
Impact of Drug Imprisonment
and the Characteristics of
Punitive Counties
� TheVortex:TheConcentratedRacialImpactofDrugImprisonmentandtheCharacteristicsofPunitiveCounties
The Justice Policy Institute is a public policy
institute dedicated to ending society’s reliance
on incarceration and promoting effective
solutions to social problems.

Contents
2 I. IntroduCtIon Incarceration rates for drug offenses have risen dramatically
6 II. Context Who uses drugs? Who is admitted to prison for drug offenses?
10 SeCtIon III. Who is most affected by drug admissions at the county level?
13 SeCtIon IV. What are the spending practices of counties that admit drug offenders at high rates?
16 SeCtIon V. What are the sociodemographic characteristics of counties that incarcerate drug offenders at high rates?
�0MultipleVariableAnalysis
21 VI. reCommendatIonS a call for evidence-based drug enforcement practice
23 appendIx a The198countiesanalyzedinthisstudywithoveralldrugadmissionrate,whitedrugadmissionrate,AfricanAmericandrugadmissionrate,andtheratioofAfricanAmericantowhitedrugadmissionrates
27 appendIx B Distributionofsocialstructuralvariables
27 appendIx C Correlationsbetweendrugimprisonmentrateandsocialstructuralvariables
27 appendIx d U.S.Statesexaminedinthisstudy,byU.S.CensusBureauRegions
28 appendIx e Ordinaryleastsquaresestimatesfromregressionofdrugimprisonmentratesonsociodemographic,budget,indexcrimerate,andregionvariablesfor198large-populationcounties/municipalities(�00�)
29 endnotes

� TheVortex:TheConcentratedRacialImpactofDrugImprisonmentandtheCharacteristicsofPunitiveCounties
African Americans made up 13 percent of the total U.S. population, but ac-counted for 53 percent of sentenced drug offenders in state prisons in 2003.
Over the course of the last 35 years, the rate at which the U.S. places its citizens in jails and prisons has risen dramatically. For the first 70 years of the twentieth century, U.S. incarceration rates remained relatively stable at a rate of about 100 per 100,000 citizens. Since 1970, the U.S. has experienced a large and rapid increase in the rate at which people are
housed in federal and state correctional facilities. Currently, the U.S. incarcera-tion rate is 491 per 100,000.1
The exceptional growth in the prison population has been driven in large part by the rate at which individuals are incarcerated for drug offenses.2 Be-tween 1995 and 2003, the number of people in state and federal prisons in-carcerated for drug offenses increased
by 21 percent, from 280,182 to 337,872.3 From 1996 to 2002, the number of those in jail for drug offenses increased by approximately 47 percent, from 111,545 to 164,372.4 This does not include people imprisoned for other offenses where drugs, the drug trade, or other drug activities were a feature of the offense.
The increase in incarceration of drug offenders trans-lates directly to an increase in prison expenditures. The American Correctional Association estimates that, in 2005, the average cost of incarcerating one person for one day was approximately $67.55. The cost of incarcerating drug offenders in state or federal prisons amounts to a staggering eight billion dollars per year.5
There is little evidence to suggest that high rates of incarceration affect drug use rates or deter drug users. Researchers have previously found that decreases in crime in the 1990s were not attributable to an in-crease in the number of prisons or the increase in the incarceration rate.6 A Justice Policy Institute (JPI) study further substantiated these findings by inves-tigating the relationship of incarceration to the rate of drug use in states. In fact, when observed over a three-year period, states with high incarceration rates tended to have higher rates of drug use.7
The growing rate of incarceration for drug offenses is not borne equally by all members of society. African Americans are disproportionately incarcerated for drug offenses in the U.S., though they use and sell drugs at similar rates to whites.8 As of 2003, twice as many African Americans as whites were incarcerated for drug offenses in state prisons in the U.S.9 African Americans made up 13 percent of the total U.S. pop-ulation, but accounted for 53 percent of sentenced drug offenders in state prisons in 2003.10
Over the last several years, JPI has studied drug im-prisonment and racial disparities in admission rates for drug offenses at the state level. While this state-level information concerning drug offenses and racial
I. IntroduCtIon: Incarceration rates for drug offenses have risen dramatically
Sources: U.S. Bureau of the Census, American Community Survey; Bu-reau of Justice Statistics (BJS), Prisoners in 2005, Prisoners in 2003, and Profile of Jail Inmates, 2002; Council of Europe, SPACE I Survey, 2003*Estimated using 2002 BJS data. **Four of the 27 European Union countries did not have data available by offense type for 2002. Those countries are Austria, Belgium, Czech Republic, and Poland. Combined, their populations make up approxi-mately 14 percent of the total EU population. This data includes current EU members.
u.S. population (2003) 282,909,885
TOTAL U.S. Prisoners 2,085,620
Federal Prisoners 86,972
State Prisoners 250,900
Jailed Prisoners 170,751*
TOTAL 508,623
european union population (2003) 483,297,500
TOTAL EU Prisoners 600,619
Prisoners for Drug Offenses 55,830**
Dru
g O
ffen
ses
table 1. though the european union has 200 million more inhabitants than the united States, the u.S. incarcerates nearly 10 times as many people for drug offenses.
JusticePolicyInstitute �
disparities has been important for consideration in state policy and laws concerning drug offenses, it has become apparent that local policies shape the day-to-day identification of drug users and their entry into the criminal justice system. It is particularly impor-tant to examine the relationship between racial dis-parities and social policies at the local level.
This report describes the relationship between drug admission rates and the structural and demographic characteristics of counties—budgets and spending for law enforcement, unemployment rates, poverty rates, and the percentage of the population that is African American.
In summary, this report finds that:
• While tens of millions of people use illicit drugs, prison and policing responses to drug behavior have a concentrated impact on a subset of the pop-ulation. In 2002, there were 19.5 million illicit drug users, 1.5 million drug arrests, and 175,000 people admitted to prison for a drug offense.11 While there is some variation in reported drug use rates between different counties and different states, there is much greater variation between one locality’s propensity to send people to prison for a drug offense compared to another’s.
• Whites and African Americans report using and selling drugs at similar rates, but African Ameri-cans go to prison for drug offenses at higher rates than whites. Survey research shows that whites and African Americans report illicit drug use and illicit drug sales at similar rates.12 However, at the local level, African Americans are admitted to prison for drug offenses at much higher rates than whites. In 2002, African Americans were admitted to prison for drug offenses at 10 times the rate of whites in the 198 largest population counties in the country.13 Ninety-seven percent (193 out of 198) of large-population counties have racial disparities in drug admission rates. In Appendix A, JPI reports drug admission rates, by race, for each of the 198 large-population counties that are the focus of this study.
• Counties that spend more on policing and the judicial system imprison people for drug offenses at higher rates than counties that spend less on law enforcement. Counties that spend a larger pro-portion of their budgets on policing or the judicial system imprison more people for drug offenses. Similarly, those counties that have higher per capita spending on law enforcement or the judiciary send more people to prison for drug offenses. These find-
ings were statistically significant and stood the test of multivariate analyses that controlled for other fac-tors, including crime rates, region, poverty, unem-ployment, the proportion of the population that is African American, and other spending practices.
• Counties with higher poverty rates send people to prison for drug offenses at higher rates than coun-ties with lower poverty rates. The overall drug admission rate for the 10 counties with the highest percent of people living in poverty is six times higher than for the 10 counties with the lowest poverty rates. A multivari-ate analysis controlling for crime rates, region, unemployment, the proportion of the popu-lation that is African American, and spending prac-tices revealed that the correlation between poverty and drug admission rates is statistically significant.
• Counties with higher unemployment rates im-prison people for drug offenses at higher rates than those counties with lower unemployment rates. The 10 counties with the highest unemploy-ment rates had drug admission rates that were, on average, nearly four times that of the counties with the lowest rates of unemployment. Though these findings were not statistically significant in the mul-tivariate analysis, they require further discussion and research in this report.
• Counties with larger proportions of African Americans in the community sent people to prison for drug offenses at higher rates. The drug impris-onment rate in the quartile of counties in which Af-rican Americans make up the largest percent of the population has nearly twice the imprisonment rate of the quartile of counties with the smallest percentage of African Americans. The positive relationship be-tween drug admissions and the percentage of African Americans in the community proved to be statisti-cally significant in a multivariate analysis controlling for crime rates, region, poverty, unemployment, and spending practices.
methodology
For this report, we combined data from multiple sources to calculate county-level rates of admission to state prisons for drug offenses. We calculated these rates for the entire population, and separately for the white and African American subpopulations of each
Ninety-seven percent (193 out of 198) of large-population counties have racial disparities in drug admission rates.

� TheVortex:TheConcentratedRacialImpactofDrugImprisonmentandtheCharacteristicsofPunitiveCounties
county. We then conducted analyses to determine the characteristics of counties that are associated with rates of drug admissions. We linked data sources at the county level using Federal Information Process-ing Standards (FIPS) State and County Codes.
This report focuses on counties or municipalities with populations of 250,000 or more. In 2002, the U.S. population was approximately 288 million.14 Fifty-seven percent of the U.S. population (167 million individuals) lived in the 227 large-popula-tion counties or municipalities that had populations larger than 250,000 in 2002. This report analyzed data for the 198 large-population counties for which data was available, representing 147,633,335 million people, or 51.2 percent of the U.S. population.
The primary source of information for this report is the most recent data available from the National Cor-rections Reporting Program (NCRP).15 The NCRP is the only data source available for examining an-nual admissions to state prisons by jurisdiction, race, offense, and other variables. The NCRP provides in-dividual-level data on each admission to state prisons in a given year. We aggregated this individual-level data at the county level. In 2002, these data existed for 38 states. The Department of Justice has gathered and released this data annually since 1983.
This report focuses on 2002 because it is the year for which the most recent NCRP data is available. For the current research, the measure of rates of admis-sion to prison for drug offenses includes only admis-sions for which a drug behavior was the offense with the longest associated sentence. The National Cor-rections Reporting Program data report up to three offenses associated with each prison admission, and highlights the offense with the lengthiest sentence. In a substantial percentage of cases for which a drug behavior was the offense with the longest associated sentence, the type of drug offense was listed as “un-specified.” Because of this ambiguous reporting of data by the NCRP, admission to prison for all types of drug offenses was combined into one composite measure per county.1
This report also focuses on 2002 because of the avail-ability of data from the U.S. Census Bureau’s 2002 Census of County and Municipal Governments.16
1 Other research derived from the 1997 Survey of State and Federal Inmates indicates that 54.5 percent of inmates had been convicted for trafficking, 27.1 for possession, and 15.6 for possession with intent to distribute. An additional 2.8 percent were convicted for some other offense. King, Ryan S. and Mauer, Marc (2002), “Distorted Priorities: Drug Offenders in State Prisons.” Sentencing Project: Washington, DC.
What is a county?
The U.S. Census Bureau states that a county is the primary legal division of every state except Alaska and Louisiana. A number of geographic enti-ties are not legally designated as counties, but are recognized by the U.S. Census Bureau as equivalent to counties for data presentation purposes. These include the boroughs, cities, municipalities, and census areas in Alaska; parishes in Louisiana; and cities that are independent of any county in Maryland, Missouri, Nevada, and Virginia. Most of the jurisdictions ex-amined in this report are true “counties.” A few of the jurisdictions ex-amined here are cities or municipalities that have county-like government structures. These include St. Louis City, MO, and New York City.
Counties traditionally are charged with performing state-mandated duties such as education, transportation (roads), record keeping, courts, policing, and jails. Increasingly, counties have been administering programs related to business development, child welfare, and employment, among others. The National Association of Counties reports that 35 percent of county revenue comes from taxes, with the remaining revenue coming from state and federal sources.
What is a drug admission?
A drug admission is an event in which a person is admitted to a state prison for a drug offense.
The drug admission rate is the number of drug admissions per 100,000 in the general population in a given year. County-level drug admission rates reflect the number of state prison admissions that are the result of sentences that were imposed in each particular county. As such, the drug admission rate is a measure of action taken by criminal justice institutions against individuals residing in particular jurisdictions.
In this report, we use the term “drug imprisonment rate” or “rate of ad-mission to prison for drug offenses” as synonyms of the drug admission rate.
Most research into the social correlates of criminal justice processes uses the incarceration rate as the outcome variable. The incarceration rate is the number of individuals who are housed in prison at any given time, for every 100,000 people in the population. The number of people in prison in a given year includes individuals who were admitted to prison during that year or in any previous year.
Given this basic distinction between the prison admission rate and the incarceration rate, the prison admission rate is a much better measure of action taken within specific jurisdictions, for a specified time period. The use of prison admissions data allows us to examine the relationships be-tween jurisdictions’ demographic structure, budgetary decisions, and use of prison in a temporally-focused manner.
I. IntroduCtIon Incarceration Rates Have Risen
JusticePolicyInstitute �
This rich data source provides detailed county-level expenditure data in multiple categories. Within the borders that define the geographic areas of counties are city and town governments with independent budgets through which services are provided—above and beyond the services provided by the county. De-tailed budgetary information for these municipalities was also collected by the U.S. Census Bureau as part of the 2002 Census of Governments. This combi-nation of county and municipal budget information within county lines allows for comprehensive county-level expenditure estimates, regardless of whether the ultimate source of the expenditure was local, state, or federal.
This report also uses data from the FBI’s Uniform Crime Report,17 the U.S. Bureau of the Census,18 and the U.S. Department of Labor’s Bureau of La-bor Statistics.19
In order to closely examine relationships between imprisonment rates and county characteristics, JPI aggregated individual-level prison admissions at the county level and linked this data to county-level de-mographic data from Census Bureau sources. JPI created four variables representing spending prac-tices: per capita policing expenditures, per capita judicial expenditures, percent of the county budget devoted to policing, and percent of the county bud-get devoted to judicial expenditures. JPI also created three variables representing key demographic char-acteristics of counties, including the poverty rate, unemployment rate, and percent of African Ameri-cans in the county. We also examined county-level crime rates. We conducted a number of bivariate and multiple variable analyses to examine the char-acteristics of counties that are associated with drug admission rates.
In this report, total population refers to people of all ages, races, and ethnicities. African American refers to individuals who, regardless of ethnicity, are cat-egorized as either “black alone,” or “black, in combi-nation with one or more other races.” White refers to individuals who, regardless of ethnicity, are catego-rized as either “white alone” or “white, in combina-tion with one or more other races.” Because ethnicity is not taken into account in the data sets utilized in this report, Latino or Hispanic data is not available.
� TheVortex:TheConcentratedRacialImpactofDrugImprisonmentandtheCharacteristicsofPunitiveCounties
the drug admissions vortex: annual rates of drug use, arrests, and prison admissions
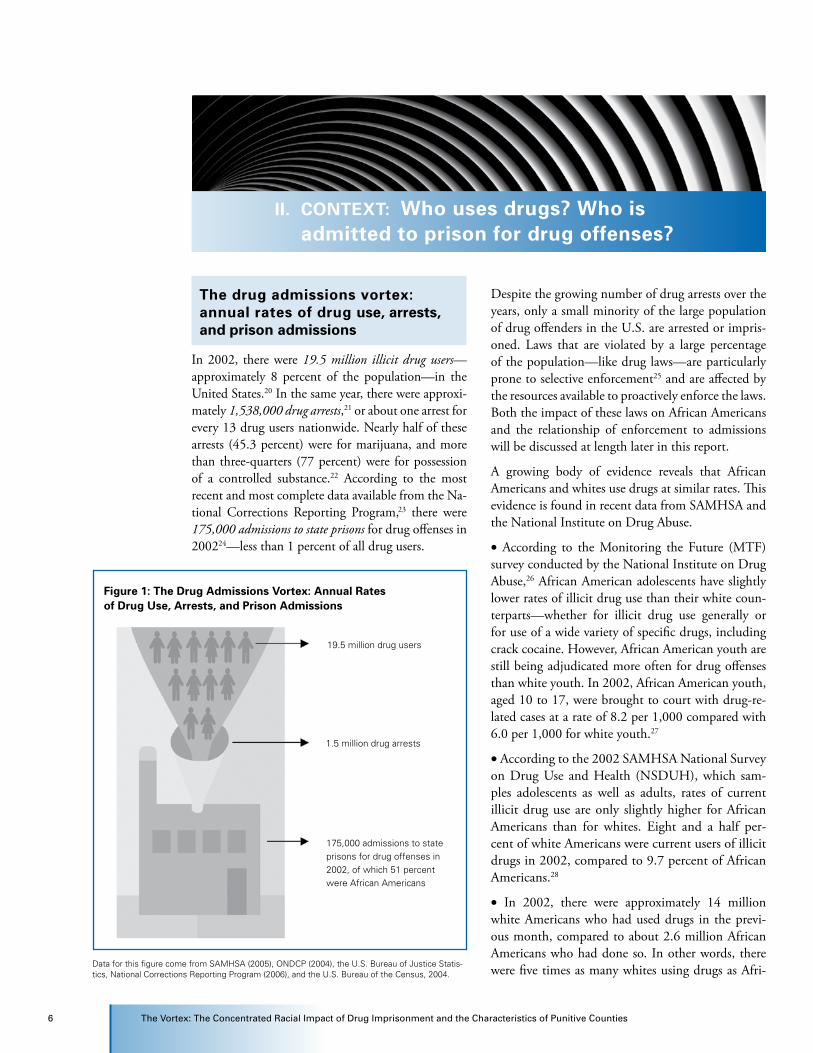
In 2002, there were 19.5 million illicit drug users—approximately 8 percent of the population—in the United States.20 In the same year, there were approxi-mately 1,538,000 drug arrests,21 or about one arrest for every 13 drug users nationwide. Nearly half of these arrests (45.3 percent) were for marijuana, and more than three-quarters (77 percent) were for possession of a controlled substance.22 According to the most recent and most complete data available from the Na-tional Corrections Reporting Program,23 there were 175,000 admissions to state prisons for drug offenses in 200224—less than 1 percent of all drug users.
Despite the growing number of drug arrests over the years, only a small minority of the large population of drug offenders in the U.S. are arrested or impris-oned. Laws that are violated by a large percentage of the population—like drug laws—are particularly prone to selective enforcement25 and are affected by the resources available to proactively enforce the laws. Both the impact of these laws on African Americans and the relationship of enforcement to admissions will be discussed at length later in this report.
A growing body of evidence reveals that African Americans and whites use drugs at similar rates. This evidence is found in recent data from SAMHSA and the National Institute on Drug Abuse.
• According to the Monitoring the Future (MTF) survey conducted by the National Institute on Drug Abuse,26 African American adolescents have slightly lower rates of illicit drug use than their white coun-terparts—whether for illicit drug use generally or for use of a wide variety of specific drugs, including crack cocaine. However, African American youth are still being adjudicated more often for drug offenses than white youth. In 2002, African American youth, aged 10 to 17, were brought to court with drug-re-lated cases at a rate of 8.2 per 1,000 compared with 6.0 per 1,000 for white youth.27
• According to the 2002 SAMHSA National Survey on Drug Use and Health (NSDUH), which sam-ples adolescents as well as adults, rates of current illicit drug use are only slightly higher for African Americans than for whites. Eight and a half per-cent of white Americans were current users of illicit drugs in 2002, compared to 9.7 percent of African Americans.28
• In 2002, there were approximately 14 million white Americans who had used drugs in the previ-ous month, compared to about 2.6 million African Americans who had done so. In other words, there were five times as many whites using drugs as Afri-
II. Context: Who uses drugs? Who is admitted to prison for drug offenses?
Data for this figure come from SAMHSA (2005), ONDCP (2004), the U.S. Bureau of Justice Statis-tics, National Corrections Reporting Program (2006), and the U.S. Bureau of the Census, 2004.
Figure 1: the drug admissions Vortex: annual rates of drug use, arrests, and prison admissions
19.5 million drug users
1.5 million drug arrests
175,000 admissions to state prisons for drug offenses in 2002, of which 51 percent were African Americans
JusticePolicyInstitute �
can Americans.29 However, our analyses indicate that African Americans are admitted to prison for drug offenses at nearly 10 times the rate of whites.30
• SAMHSA reported that in 2002, 24 percent of crack cocaine users were African American and 72 percent were white or Hispanic, yet more than 80
percent of defendants sentenced for crack cocaine offenses were African American.31
• Similarly, research indicates that racial patterns of drug sales tend to correspond to racial pat-terns of drug use, and that African Americans are no more likely to be involved in drug delivery than whites. In a report released by the Office of Juvenile Justice and De-linquency Prevention, the results of the National Longitudinal Sur-vey of Youth showed that 13 per-cent of African American youth reported selling drugs, compared with 17 percent of white youth.32 However, in 2003, African American youth were arrested for drug abuse violations at nearly twice the rate of whites.33
of the drug users who are admitted to prison, the vast majority are people of color.
African Americans and other minority groups are disproportionately represented among those who are placed in U.S. prisons for drug offenses, despite government-sponsored research indicating little racial variation in drug use34 and drug delivery or distribution.35
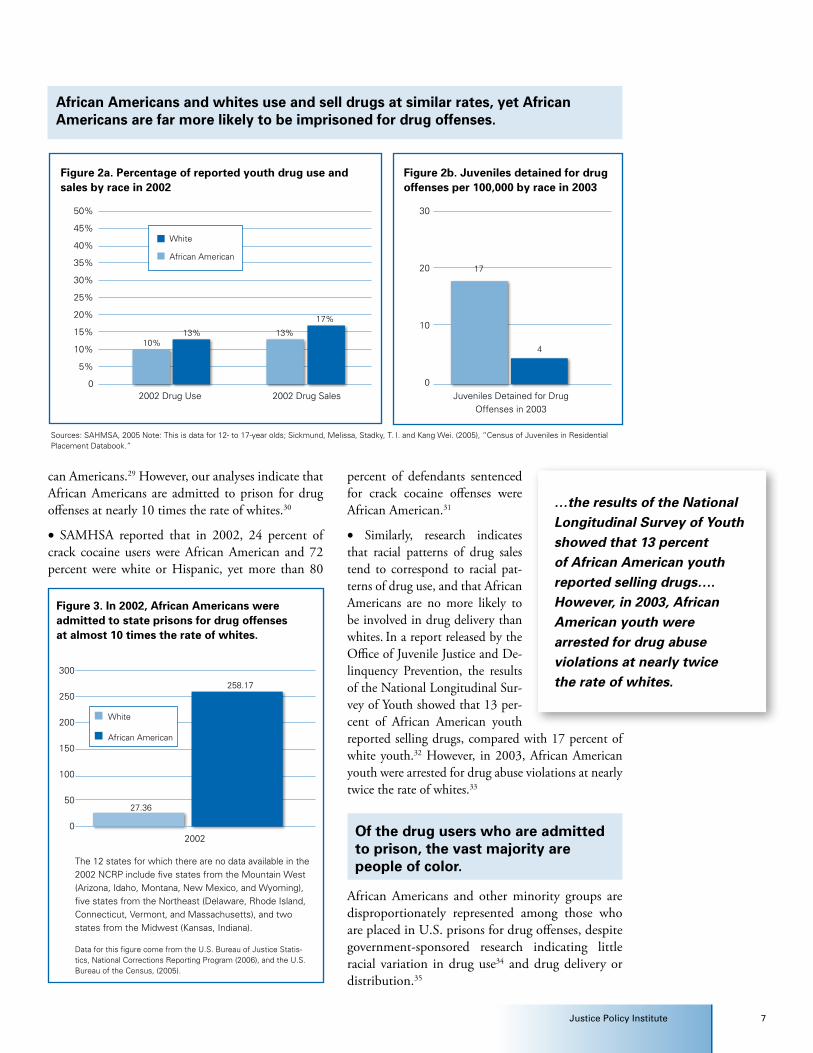
Figure 2a. percentage of reported youth drug use and sales by race in 2002
Sources: SAHMSA, 2005 Note: This is data for 12- to 17-year olds; Sickmund, Melissa, Stadky, T. I. and Kang Wei. (2005), “Census of Juveniles in Residential Placement Databook.”
2002 Drug Use 2002 Drug Sales
50%
45%
40%
35%
30%
25%
20%
15%
10%
5%
0
10%
african americans and whites use and sell drugs at similar rates, yet african americans are far more likely to be imprisoned for drug offenses.
13% 13%
17%
White
African American
Figure 2b. Juveniles detained for drug offenses per 100,000 by race in 2003
Juveniles Detained for Drug Offenses in 2003
30
20
10
0
4
17
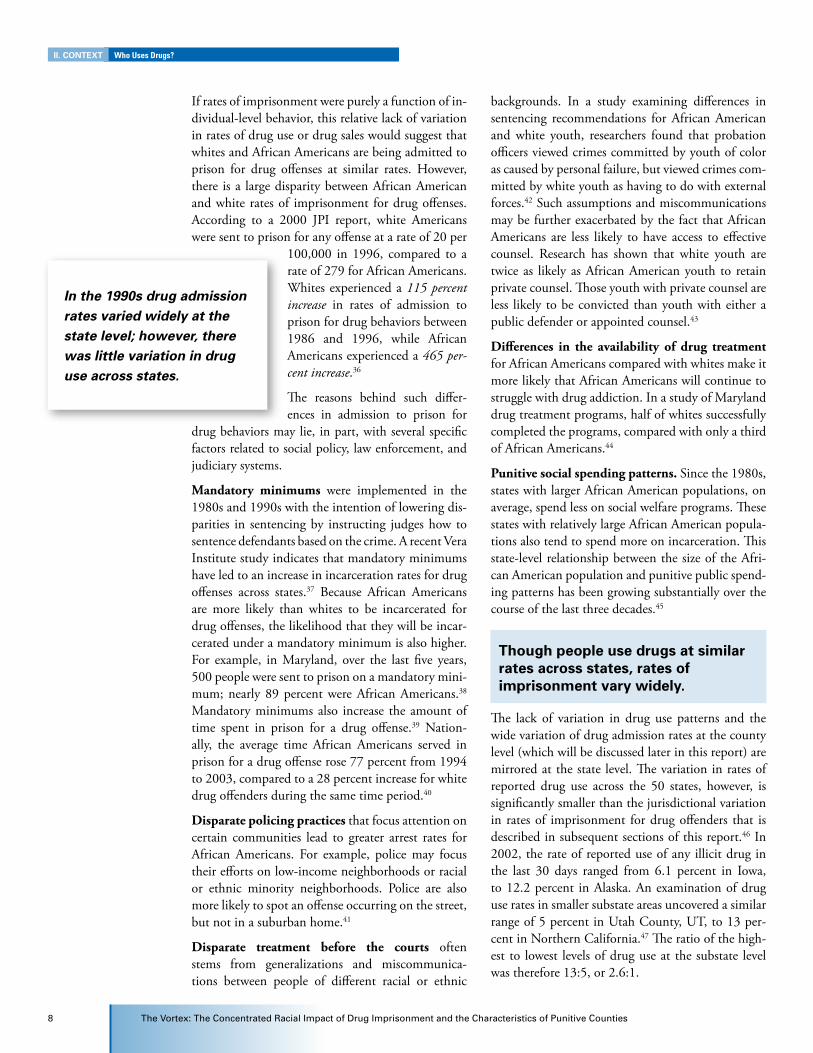
Figure 3. In 2002, african americans were admitted to state prisons for drug offenses at almost 10 times the rate of whites.
2002
The 12 states for which there are no data available in the 2002 NCRP include five states from the Mountain West (Arizona, Idaho, Montana, New Mexico, and Wyoming), five states from the Northeast (Delaware, Rhode Island, Connecticut, Vermont, and Massachusetts), and two states from the Midwest (Kansas, Indiana).
Data for this figure come from the U.S. Bureau of Justice Statis-tics, National Corrections Reporting Program (2006), and the U.S. Bureau of the Census, (2005).
300
250
200
150
100
50
0
27.36
258.17
White
African American
…the results of the National Longitudinal Survey of Youth showed that 13 percent of African American youth reported selling drugs….However, in 2003, African American youth were arrested for drug abuse violations at nearly twice the rate of whites.
8 TheVortex:TheConcentratedRacialImpactofDrugImprisonmentandtheCharacteristicsofPunitiveCounties
If rates of imprisonment were purely a function of in-dividual-level behavior, this relative lack of variation in rates of drug use or drug sales would suggest that whites and African Americans are being admitted to prison for drug offenses at similar rates. However, there is a large disparity between African American and white rates of imprisonment for drug offenses. According to a 2000 JPI report, white Americans were sent to prison for any offense at a rate of 20 per
100,000 in 1996, compared to a rate of 279 for African Americans. Whites experienced a 115 percent increase in rates of admission to prison for drug behaviors between 1986 and 1996, while African Americans experienced a 465 per-cent increase.36
The reasons behind such differ-ences in admission to prison for
drug behaviors may lie, in part, with several specific factors related to social policy, law enforcement, and judiciary systems.
Mandatory minimums were implemented in the 1980s and 1990s with the intention of lowering dis-parities in sentencing by instructing judges how to sentence defendants based on the crime. A recent Vera Institute study indicates that mandatory minimums have led to an increase in incarceration rates for drug offenses across states.37 Because African Americans are more likely than whites to be incarcerated for drug offenses, the likelihood that they will be incar-cerated under a mandatory minimum is also higher. For example, in Maryland, over the last five years, 500 people were sent to prison on a mandatory mini-mum; nearly 89 percent were African Americans.38 Mandatory minimums also increase the amount of time spent in prison for a drug offense.39 Nation-ally, the average time African Americans served in prison for a drug offense rose 77 percent from 1994 to 2003, compared to a 28 percent increase for white drug offenders during the same time period.40
Disparate policing practices that focus attention on certain communities lead to greater arrest rates for African Americans. For example, police may focus their efforts on low-income neighborhoods or racial or ethnic minority neighborhoods. Police are also more likely to spot an offense occurring on the street, but not in a suburban home.41
Disparate treatment before the courts often stems from generalizations and miscommunica-tions between people of different racial or ethnic
backgrounds. In a study examining differences in sentencing recommendations for African American and white youth, researchers found that probation officers viewed crimes committed by youth of color as caused by personal failure, but viewed crimes com-mitted by white youth as having to do with external forces.42 Such assumptions and miscommunications may be further exacerbated by the fact that African Americans are less likely to have access to effective counsel. Research has shown that white youth are twice as likely as African American youth to retain private counsel. Those youth with private counsel are less likely to be convicted than youth with either a public defender or appointed counsel.43
Differences in the availability of drug treatment for African Americans compared with whites make it more likely that African Americans will continue to struggle with drug addiction. In a study of Maryland drug treatment programs, half of whites successfully completed the programs, compared with only a third of African Americans.44
Punitive social spending patterns. Since the 1980s, states with larger African American populations, on average, spend less on social welfare programs. These states with relatively large African American popula-tions also tend to spend more on incarceration. This state-level relationship between the size of the Afri-can American population and punitive public spend-ing patterns has been growing substantially over the course of the last three decades.45
though people use drugs at similar rates across states, rates of imprisonment vary widely.
The lack of variation in drug use patterns and the wide variation of drug admission rates at the county level (which will be discussed later in this report) are mirrored at the state level. The variation in rates of reported drug use across the 50 states, however, is significantly smaller than the jurisdictional variation in rates of imprisonment for drug offenders that is described in subsequent sections of this report.46 In 2002, the rate of reported use of any illicit drug in the last 30 days ranged from 6.1 percent in Iowa, to 12.2 percent in Alaska. An examination of drug use rates in smaller substate areas uncovered a similar range of 5 percent in Utah County, UT, to 13 per-cent in Northern California.47 The ratio of the high-est to lowest levels of drug use at the substate level was therefore 13:5, or 2.6:1.
II. Context Who Uses Drugs?
In the 1990s drug admission rates varied widely at the state level; however, there was little variation in drug use across states.

JusticePolicyInstitute 9
The ratio of highest to lowest state drug imprison-ment rates, on the other hand, was much higher, at 27:1. In the mid-1990s, the state of Maine had the lowest rate of admission to prison for drug behav-iors—approximately five admissions per 100,000 people. California had the highest rate of drug ad-missions, at 134 per 100,000.48
In the 1990s drug admission rates varied widely at the state level; however, there was little variation in drug use across states. The percent of drug use varied from a low of 4.8 percent in West Virginia to a high of 8.2 in Washington. The rate of admission for drug offenses varied from 10.57 per 100,000 in West Vir-ginia to 145.9 per 100,000 in California.
table 2. In 1999, drug admission rates varied widely across states, though there was very little variation in drug use rates.
State1999 Admission Rate per 100,000
Percent of Illicit Drug Users in the Last Month (1999)
ten States with Highest admission rates
California 145.90 7.8
Louisiana 141.47 5.4
Georgia 93.11 5.7
New Jersey 89.90 7.2
Illinois 84.10 6.3
Missouri 79.93 6.1
South Carolina 73.29 5.1
North Carolina 71.20 5.8
New York 71.12 6.6
Tennessee 60.02 5.2
ten States with Lowest admission rates
Ohio 52.47 6.0
Virginia 44.71 4.5
Washington 35.79 8.2
Oklahoma 34.75 5.1
Wisconsin 30.82 6.3
Michigan 27.56 7.1
Pennsylvania 26.70 6.3
Oregon 21.62 7.3
Minnesota 18.39 6.1
West Virginia 10.57 4.8
Source: Schiraldi, V. and Ziedenberg, J. (2003), “Cost and Benefits? The Impact of Drug Imprisonment in New Jersey.” Washington, DC: Justice Policy Institute.
10 TheVortex:TheConcentratedRacialImpactofDrugImprisonmentandtheCharacteristicsofPunitiveCounties
This report focuses on admissions to prison from 198 counties with a population of 250,000 or more in 2002. These jurisdictions account for more than half (51 percent) of the total U.S. population. The 110,522 individuals who were admitted to state prison for drug offenses from these counties in 2002 are about 60 percent of the 175,000 drug admissions reported in that year. In these large-population coun-ties, the overall rate of admission to prison for drug of-fenses in 2002 was 75 per 100,000 in the population.
despite similar patterns of drug use, african americans are far more likely than whites to be admitted for drug offenses at the county level.
African Americans make up more than half (51 per-cent) of all admissions to prison for drug offenses. Despite the fact that white drug users outnumber black users by a factor of five49 there were more than twice as many African Americans (62,087) as whites (28,314) admitted to prison for drug offenses from large-population counties in 2002.
The rate of admission to prison for drug offenses is more than 10 times higher for African Americans (262.16 per 100,000) than it is for whites (24.85 per 100,000).
ninety-seven percent (193 out of 198) of large-population counties have racial disparities in drug admission rates.
Racially disparate rates of admission to prison for drug offenses are nearly universal among large-popu-lation counties in the U.S. Even counties with the lowest overall rates of admission to prison for drug offenses display wide racial disparities in those ad-mission rates. Four of the five counties that did not witness racially disparate drug admissions had very small percentages of African Americans in their pop-ulations (Rockingham, NH = .89 percent; Washing-ton, OR = 1.95 percent; Utah, UT = 0.64 percent; San Luis Obispo, CA= 2.4 percent), and the fifth (Clayton, GA = 58 percent) had a sizable majority of African Americans.
The highest county-level drug admission rate for whites is 149.5 per 100,000 in Kern, CA. The high-est county-level rate for African Americans is nearly seven times higher—at 1013.9 per 100,000 in the population in San Francisco, CA.
SeCtIon III: Who is most affected by drug admissions at the county level?
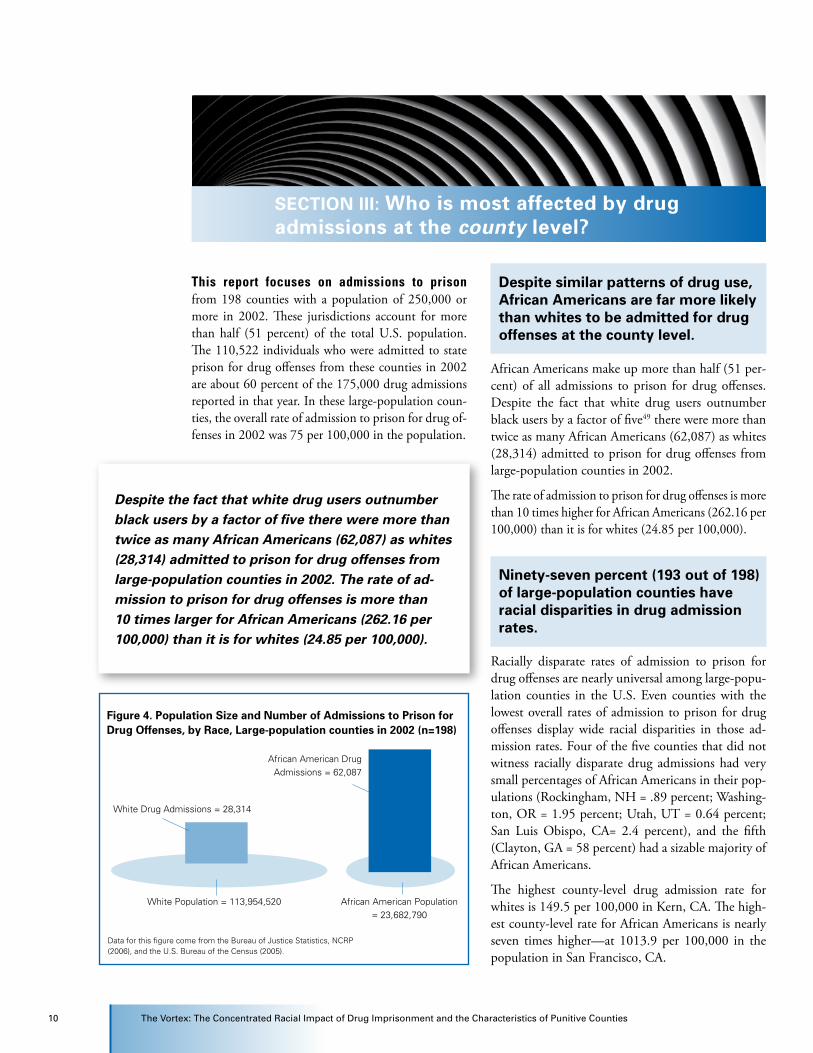
Data for this figure come from the Bureau of Justice Statistics, NCRP (2006), and the U.S. Bureau of the Census (2005).
Figure 4. population Size and number of admissions to prison for drug offenses, by race, Large-population counties in 2002 (n=198)
White Drug Admissions = 28,314
African American Drug Admissions = 62,087
White Population = 113,954,520 African American Population = 23,682,790
Despite the fact that white drug users outnumber black users by a factor of five there were more than twice as many African Americans (62,087) as whites (28,314) admitted to prison for drug offenses from large-population counties in 2002. The rate of ad-mission to prison for drug offenses is more than 10 times larger for African Americans (262.16 per 100,000) than it is for whites (24.85 per 100,000).
JusticePolicyInstitute 11
This report focuses on admissions to prison from 198 counties with a population of 250,000 or more in 2002. These jurisdictions account for more than half (51 percent) of the total U.S. population. The 110,522 individuals who were admitted to state prison for drug offenses from these counties in 2002 are about 60 percent of the 175,000 drug admissions reported in that year. In these large-population coun-ties, the overall rate of admission to prison for drug of-fenses in 2002 was 75 per 100,000 in the population.
despite similar patterns of drug use, african americans are far more likely than whites to be admitted for drug offenses at the county level.
African Americans make up more than half (51 per-cent) of all admissions to prison for drug offenses. Despite the fact that white drug users outnumber black users by a factor of five49 there were more than twice as many African Americans (62,087) as whites (28,314) admitted to prison for drug offenses from large-population counties in 2002.
The rate of admission to prison for drug offenses is more than 10 times higher for African Americans (262.16 per 100,000) than it is for whites (24.85 per 100,000).
ninety-seven percent (193 out of 198) of large-population counties have racial disparities in drug admission rates.
Racially disparate rates of admission to prison for drug offenses are nearly universal among large-popu-lation counties in the U.S. Even counties with the lowest overall rates of admission to prison for drug offenses display wide racial disparities in those ad-mission rates. Four of the five counties that did not witness racially disparate drug admissions had very small percentages of African Americans in their pop-ulations (Rockingham, NH = .89 percent; Washing-ton, OR = 1.95 percent; Utah, UT = 0.64 percent; San Luis Obispo, CA= 2.4 percent), and the fifth (Clayton, GA = 58 percent) had a sizable majority of African Americans.
The highest county-level drug admission rate for whites is 149.5 per 100,000 in Kern, CA. The high-est county-level rate for African Americans is nearly seven times higher—at 1013.9 per 100,000 in the population in San Francisco, CA.
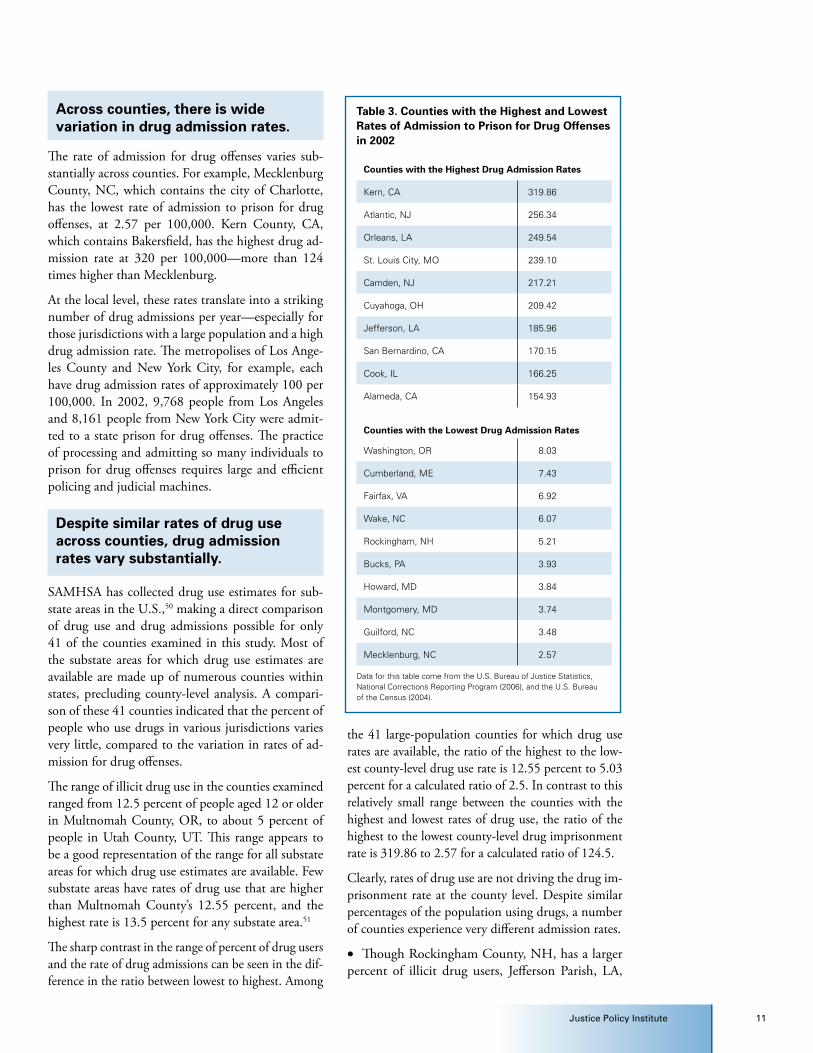
across counties, there is wide variation in drug admission rates.
The rate of admission for drug offenses varies sub-stantially across counties. For example, Mecklenburg County, NC, which contains the city of Charlotte, has the lowest rate of admission to prison for drug offenses, at 2.57 per 100,000. Kern County, CA, which contains Bakersfield, has the highest drug ad-mission rate at 320 per 100,000—more than 124 times higher than Mecklenburg.
At the local level, these rates translate into a striking number of drug admissions per year—especially for those jurisdictions with a large population and a high drug admission rate. The metropolises of Los Ange-les County and New York City, for example, each have drug admission rates of approximately 100 per 100,000. In 2002, 9,768 people from Los Angeles and 8,161 people from New York City were admit-ted to a state prison for drug offenses. The practice of processing and admitting so many individuals to prison for drug offenses requires large and efficient policing and judicial machines.
despite similar rates of drug use across counties, drug admission rates vary substantially.
SAMHSA has collected drug use estimates for sub-state areas in the U.S.,50 making a direct comparison of drug use and drug admissions possible for only 41 of the counties examined in this study. Most of the substate areas for which drug use estimates are available are made up of numerous counties within states, precluding county-level analysis. A compari-son of these 41 counties indicated that the percent of people who use drugs in various jurisdictions varies very little, compared to the variation in rates of ad-mission for drug offenses.
The range of illicit drug use in the counties examined ranged from 12.5 percent of people aged 12 or older in Multnomah County, OR, to about 5 percent of people in Utah County, UT. This range appears to be a good representation of the range for all substate areas for which drug use estimates are available. Few substate areas have rates of drug use that are higher than Multnomah County’s 12.55 percent, and the highest rate is 13.5 percent for any substate area.51
The sharp contrast in the range of percent of drug users and the rate of drug admissions can be seen in the dif-ference in the ratio between lowest to highest. Among
the 41 large-population counties for which drug use rates are available, the ratio of the highest to the low-est county-level drug use rate is 12.55 percent to 5.03 percent for a calculated ratio of 2.5. In contrast to this relatively small range between the counties with the highest and lowest rates of drug use, the ratio of the highest to the lowest county-level drug imprisonment rate is 319.86 to 2.57 for a calculated ratio of 124.5.
Clearly, rates of drug use are not driving the drug im-prisonment rate at the county level. Despite similar percentages of the population using drugs, a number of counties experience very different admission rates.
• Though Rockingham County, NH, has a larger percent of illicit drug users, Jefferson Parish, LA,
III. ??????????????? Who Is Most Affected?
table 3. Counties with the Highest and Lowest rates of admission to prison for drug offenses in 2002
Counties with the Highest drug admission rates
Kern, CA 319.86
Atlantic, NJ 256.34
Orleans, LA 249.54
St. Louis City, MO 239.10
Camden, NJ 217.21
Cuyahoga, OH 209.42
Jefferson, LA 185.96
San Bernardino, CA 170.15
Cook, IL 166.25
Alameda, CA 154.93
Counties with the Lowest drug admission rates
Washington, OR 8.03
Cumberland, ME 7.43
Fairfax, VA 6.92
Wake, NC 6.07
Rockingham, NH 5.21
Bucks, PA 3.93
Howard, MD 3.84
Montgomery, MD 3.74
Guilford, NC 3.48
Mecklenburg, NC 2.57
Data for this table come from the U.S. Bureau of Justice Statistics, National Corrections Reporting Program (2006), and the U.S. Bureau of the Census (2004).
1� TheVortex:TheConcentratedRacialImpactofDrugImprisonmentandtheCharacteristicsofPunitiveCounties
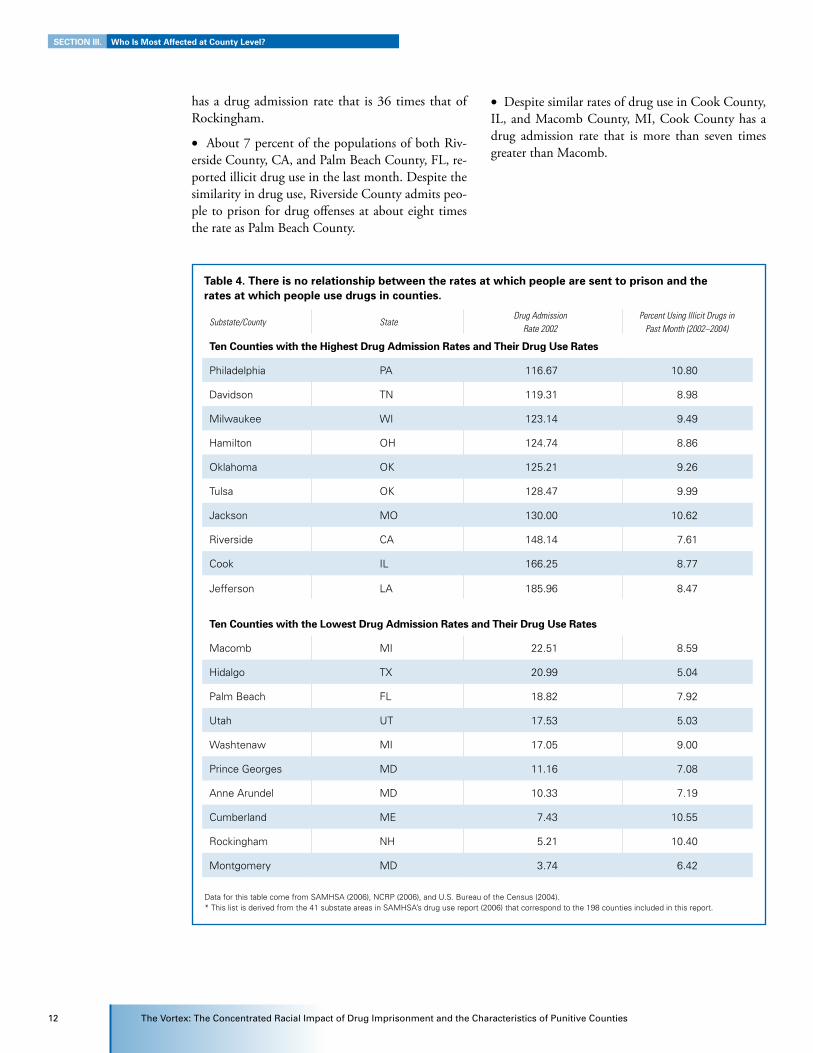
Data for this table come from SAMHSA (2006), NCRP (2006), and U.S. Bureau of the Census (2004).* This list is derived from the 41 substate areas in SAMHSA’s drug use report (2006) that correspond to the 198 counties included in this report.
table 4. there is no relationship between the rates at which people are sent to prison and the rates at which people use drugs in counties.
Substate/County StateDrug Admission
Rate 2002Percent Using Illicit Drugs in
Past Month (2002–2004)
ten Counties with the Highest drug admission rates and their drug use rates
Philadelphia PA 116.67 10.80
Davidson TN 119.31 8.98
Milwaukee WI 123.14 9.49
Hamilton OH 124.74 8.86
Oklahoma OK 125.21 9.26
Tulsa OK 128.47 9.99
Jackson MO 130.00 10.62
Riverside CA 148.14 7.61
Cook IL 166.25 8.77
Jefferson LA 185.96 8.47
ten Counties with the Lowest drug admission rates and their drug use rates
Macomb MI 22.51 8.59
Hidalgo TX 20.99 5.04
Palm Beach FL 18.82 7.92
Utah UT 17.53 5.03
Washtenaw MI 17.05 9.00
Prince Georges MD 11.16 7.08
Anne Arundel MD 10.33 7.19
Cumberland ME 7.43 10.55
Rockingham NH 5.21 10.40
Montgomery MD 3.74 6.42
has a drug admission rate that is 36 times that of Rockingham.
• About 7 percent of the populations of both Riv-erside County, CA, and Palm Beach County, FL, re-ported illicit drug use in the last month. Despite the similarity in drug use, Riverside County admits peo-ple to prison for drug offenses at about eight times the rate as Palm Beach County.
• Despite similar rates of drug use in Cook County, IL, and Macomb County, MI, Cook County has a drug admission rate that is more than seven times greater than Macomb.
SeCtIon III. Who Is most affected at County Level?
JusticePolicyInstitute 1�
The vast differences in drug admission rates across counties—despite similarities in the percent of drug users—suggest that there are differences in the way counties construct policies concerning drug offenses. This section of the report will examine the extent to which highly variable resources of police forces and judicial departments across the U.S. have an impact on their local drug imprisonment rates.
Levels of funding permit resource-driven discretion.
Individual criminal behaviors recorded by local po-lice forces are the basic building blocks of the Uni-form Crime Reports (UCR), which are the crime rates that are heralded in the press and analyzed on an annual basis. Police forces have been significantly enhancing their resources and capacity to detect and record crimes since the 1970s. This enhanced capac-ity was at least partially responsible for violent crime rates that trended steadily upward in the 1970s and 1980s—despite the fact that victimization rates dur-ing the same time period held steady.52
Police forces have varying amounts of discretion as to whether they will record an incident as an official crime, depending on the incident. Violent crimes are the least ambiguous, and the presence of victims necessitates ac-tion and reporting by police.53 For violent crimes, the person engaging in the illegal behavior is the primary actor in the production of the crime—the agents of the criminal justice system are essentially reactive.
On the other end of the spectrum, local police forces have a great deal of discretion when it comes to polic-ing and recording drug offenses, and a jurisdiction’s prosecutors and judicial branch have discretion in the application of charges and sentences for those arrested. Drug offenses are quite common and rela-tively constant. They rarely have clearly defined vic-tims that necessitate formal reporting procedures by
the police. Rates of victimless crimes such as drug offenses tend to have strong correlations with the number of personnel assigned to police those specific behaviors.54 In order to observe, arrest, and make an official crime statistic of a person engaging in a drug offense, police must be in proactive pursuit.
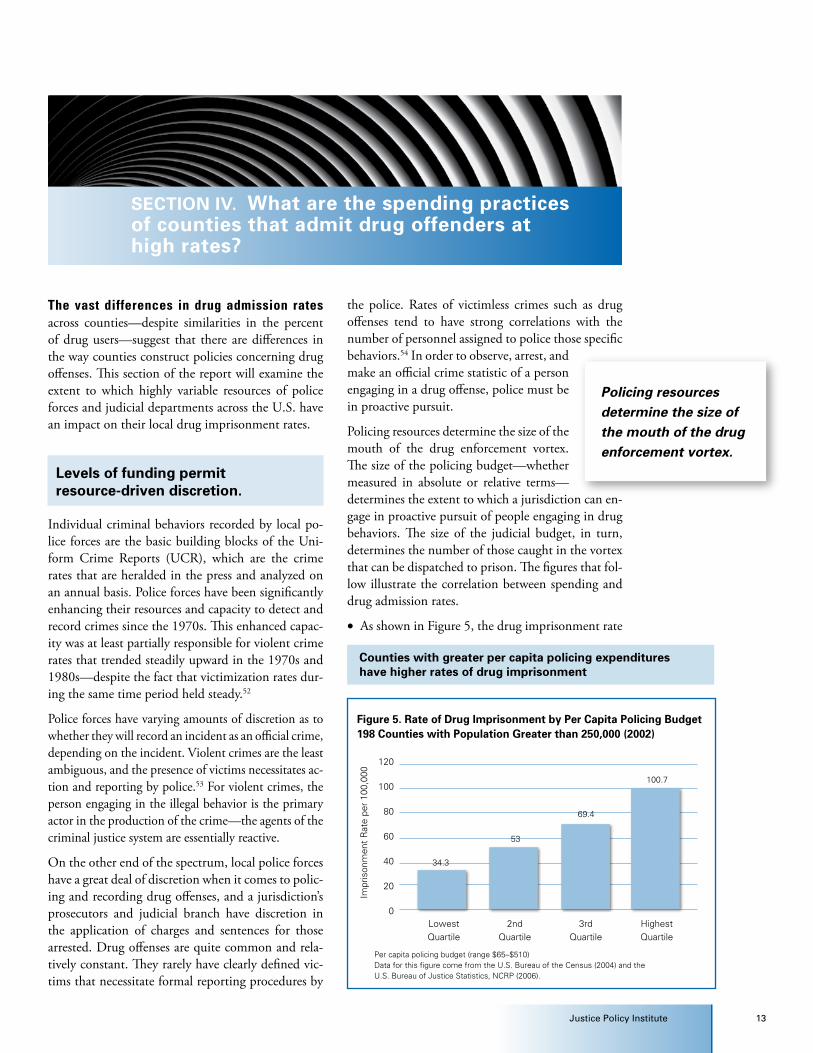
Policing resources determine the size of the mouth of the drug enforcement vortex. The size of the policing budget—whether measured in absolute or relative terms—determines the extent to which a jurisdiction can en-gage in proactive pursuit of people engaging in drug behaviors. The size of the judicial budget, in turn, determines the number of those caught in the vortex that can be dispatched to prison. The figures that fol-low illustrate the correlation between spending and drug admission rates.
• As shown in Figure 5, the drug imprisonment rate
SeCtIon IV. What are the spending practices of counties that admit drug offenders at high rates?
Figure 5. rate of drug Imprisonment by per Capita policing Budget 198 Counties with population Greater than 250,000 (2002)
Per capita policing budget (range $65–$510)Data for this figure come from the U.S. Bureau of the Census (2004) and the U.S. Bureau of Justice Statistics, NCRP (2006).
120
100
80
60
40
20
0
34.3
53
69.4
100.7
Impr
ison
men
t R
ate
per
100,
000
LowestQuartile
2ndQuartile
3rdQuartile
HighestQuartile
Counties with greater per capita policing expenditures have higher rates of drug imprisonment
Policing resources determine the size of the mouth of the drug enforcement vortex.
1� TheVortex:TheConcentratedRacialImpactofDrugImprisonmentandtheCharacteristicsofPunitiveCounties
in the quartile of counties with the highest per capita policing expenditures (100 per 100,000) is about three times greater than the drug imprisonment rate in the quartile of counties with the lowest per capita policing expenditures (34 per 100,000).
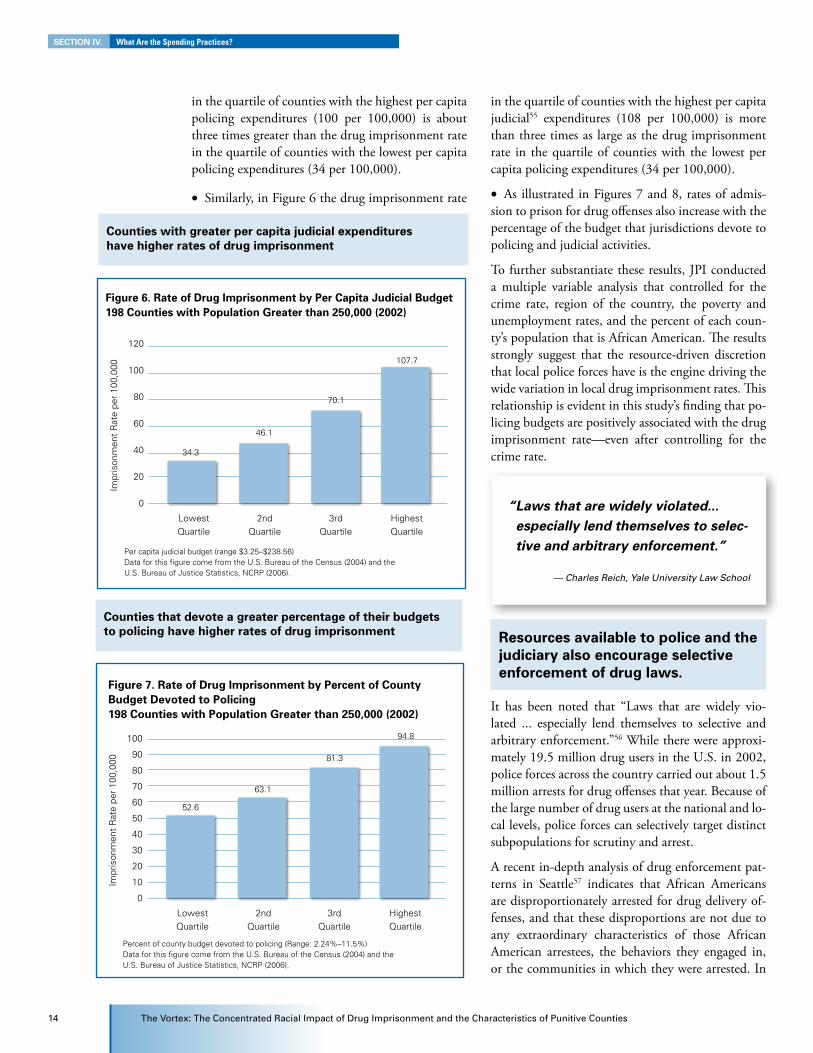
• Similarly, in Figure 6 the drug imprisonment rate
in the quartile of counties with the highest per capita judicial55 expenditures (108 per 100,000) is more than three times as large as the drug imprisonment rate in the quartile of counties with the lowest per capita policing expenditures (34 per 100,000).
• As illustrated in Figures 7 and 8, rates of admis-sion to prison for drug offenses also increase with the percentage of the budget that jurisdictions devote to policing and judicial activities.
To further substantiate these results, JPI conducted a multiple variable analysis that controlled for the crime rate, region of the country, the poverty and unemployment rates, and the percent of each coun-ty’s population that is African American. The results strongly suggest that the resource-driven discretion that local police forces have is the engine driving the wide variation in local drug imprisonment rates. This relationship is evident in this study’s finding that po-licing budgets are positively associated with the drug imprisonment rate—even after controlling for the crime rate.
resources available to police and the judiciary also encourage selective enforcement of drug laws.
It has been noted that “Laws that are widely vio-lated ... especially lend themselves to selective and arbitrary enforcement.”56 While there were approxi-mately 19.5 million drug users in the U.S. in 2002, police forces across the country carried out about 1.5 million arrests for drug offenses that year. Because of the large number of drug users at the national and lo-cal levels, police forces can selectively target distinct subpopulations for scrutiny and arrest.
A recent in-depth analysis of drug enforcement pat-terns in Seattle57 indicates that African Americans are disproportionately arrested for drug delivery of-fenses, and that these disproportions are not due to any extraordinary characteristics of those African American arrestees, the behaviors they engaged in, or the communities in which they were arrested. In
Figure 6. rate of drug Imprisonment by per Capita Judicial Budget 198 Counties with population Greater than 250,000 (2002)
Per capita judicial budget (range $3.25–$238.56)Data for this figure come from the U.S. Bureau of the Census (2004) and the U.S. Bureau of Justice Statistics, NCRP (2006).
120
100
80
60
40
20
0
34.3
46.1
70.1
107.7
Impr
ison
men
t R
ate
per
100,
000
LowestQuartile
2ndQuartile
3rdQuartile
HighestQuartile
SeCtIon IV. What Are the Spending Practices?
Counties with greater per capita judicial expenditures have higher rates of drug imprisonment
Counties that devote a greater percentage of their budgets to policing have higher rates of drug imprisonment
Figure 7. rate of drug Imprisonment by percent of County Budget devoted to policing 198 Counties with population Greater than 250,000 (2002)
Percent of county budget devoted to policing (Range: 2.24%–11.5%)Data for this figure come from the U.S. Bureau of the Census (2004) and the U.S. Bureau of Justice Statistics, NCRP (2006).
100
90
80
70
60
50
40
30
20
10
0
52.6
63.1
81.3
94.8
Impr
ison
men
t R
ate
per
100,
000
LowestQuartile
2ndQuartile
3rdQuartile
HighestQuartile
“ Laws that are widely violated... especially lend themselves to selec-tive and arbitrary enforcement.”
— Charles Reich, Yale University Law School
JusticePolicyInstitute 1�
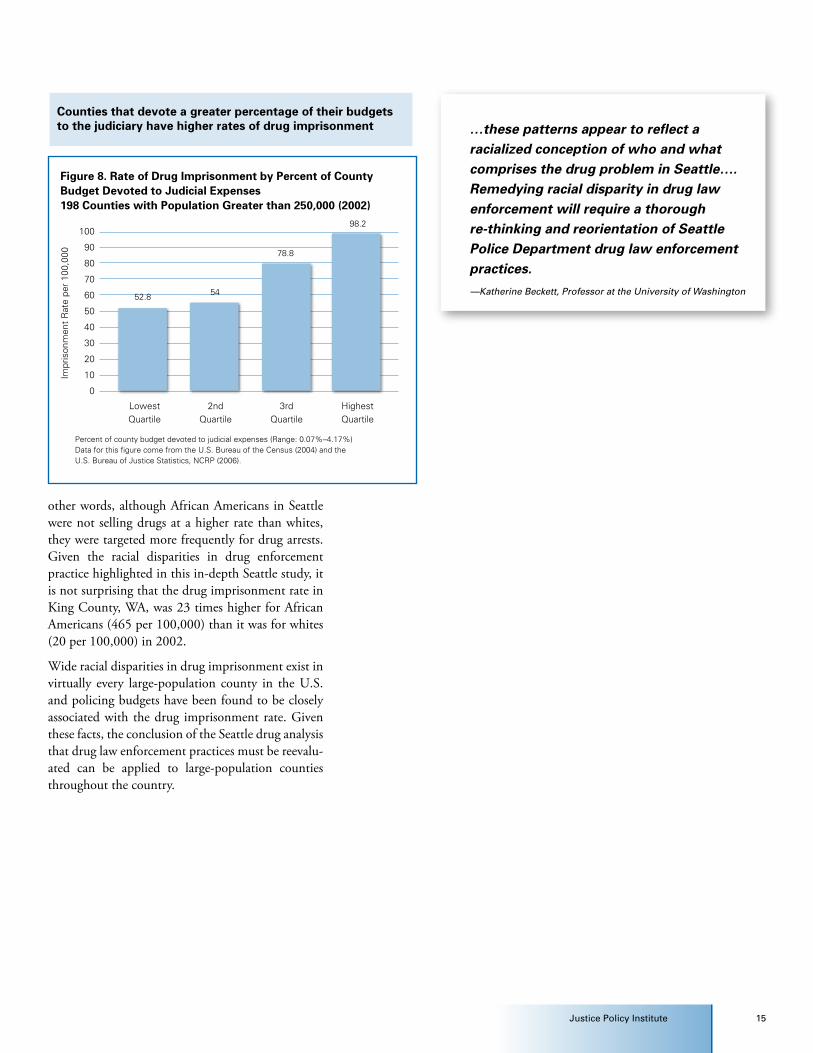
other words, although African Americans in Seattle were not selling drugs at a higher rate than whites, they were targeted more frequently for drug arrests. Given the racial disparities in drug enforcement practice highlighted in this in-depth Seattle study, it is not surprising that the drug imprisonment rate in King County, WA, was 23 times higher for African Americans (465 per 100,000) than it was for whites (20 per 100,000) in 2002.
Wide racial disparities in drug imprisonment exist in virtually every large-population county in the U.S. and policing budgets have been found to be closely associated with the drug imprisonment rate. Given these facts, the conclusion of the Seattle drug analysis that drug law enforcement practices must be reevalu-ated can be applied to large-population counties throughout the country.
Figure 8. rate of drug Imprisonment by percent of County Budget devoted to Judicial expenses 198 Counties with population Greater than 250,000 (2002)
Percent of county budget devoted to judicial expenses (Range: 0.07%–4.17%)Data for this figure come from the U.S. Bureau of the Census (2004) and the U.S. Bureau of Justice Statistics, NCRP (2006).
100
90
80
70
60
50
40
30
20
10
0
52.8 54
78.8
98.2
Impr
ison
men
t R
ate
per
100,
000
LowestQuartile
2ndQuartile
3rdQuartile
HighestQuartile
Counties that devote a greater percentage of their budgets to the judiciary have higher rates of drug imprisonment …these patterns appear to reflect a
racialized conception of who and what comprises the drug problem in Seattle…. Remedying racial disparity in drug law enforcement will require a thorough re-thinking and reorientation of Seattle Police Department drug law enforcement practices.
—Katherine Beckett, Professor at the University of Washington
1� TheVortex:TheConcentratedRacialImpactofDrugImprisonmentandtheCharacteristicsofPunitiveCounties
The wide racial disparity in drug imprisonment rates does not reflect the fact that whites and African Americans use illegal drugs at roughly the same rate59 and that whites and African Americans are engaged in selling a wide variety of drugs at similar rates.60 Simi-larly, the significant intercounty variation in the drug admission rate does not reflect the reality of minimal variation in rates of drug use across state and local jurisdictions.61 Since relatively constant patterns of individual-level drug use do not appear to be driv-ing the widely varying racial and cross-jurisdiction drug admission rates, it is necessary to examine the sociodemographic characteristics of places that may be associated with these disparities in prison admis-sion rates.
Sociodemographic structure
As described earlier in this report, a majority of Americans live in jurisdictions with populations of 250,000 or more. These large-population counties are not monolithic in their sociodemographic struc-
ture. There is significant variation in poverty rates, unemployment rates, and the racial/ethnic composition of these large population centers. Previous criminal justice research has explored the relationship between criminal jus-tice outcomes and the poverty rate,62 unemployment rate,63 and the percent-age of the population that is African American.64
The current research generally indicates that wider bands of disadvantaged so-cial strata within counties are associated with punitive practices with regard to
policing, prosecuting, and ultimately imprisoning individuals who have engaged in drug behaviors. The drug imprisonment rate can be seen as a mea-sure of the “ease with which a society imposes pun-
ishment.”65 Social and behavioral research generally indicates that punishment is easier to dispense upon individuals with whom one feels little commonal-ity.66 For those who create and implement criminal justice policies at the federal, state, or local levels, this fact often translates into prison populations that vastly underrepresent people from privileged social positions, and overrepresent the segments of society that superficially appear to have little in common with them.
This report is the first to examine the relationships between these sociodemographic structures and the specific annual rate at which people are admitted to prison for drug offenses. Results of our analysis indi-cate that the drug imprisonment rate is related to the strength of local labor markets and the ways that our communities are racially and economically stratified. On average, counties with higher unemployment rates, higher poverty rates, and larger percentages of African American citizens tend to have higher rates of admission to prison for drug offenses.
poverty rate
Prisons in the U.S. are disproportionately populated by individuals who were living in poverty prior to their imprisonment. Half of those in prison in the early 1990s had annual incomes of less than $10,000 in the year prior to the arrest that led to their impris-onment. One-fifth had pre-arrest annual incomes that were less than $3,000.67
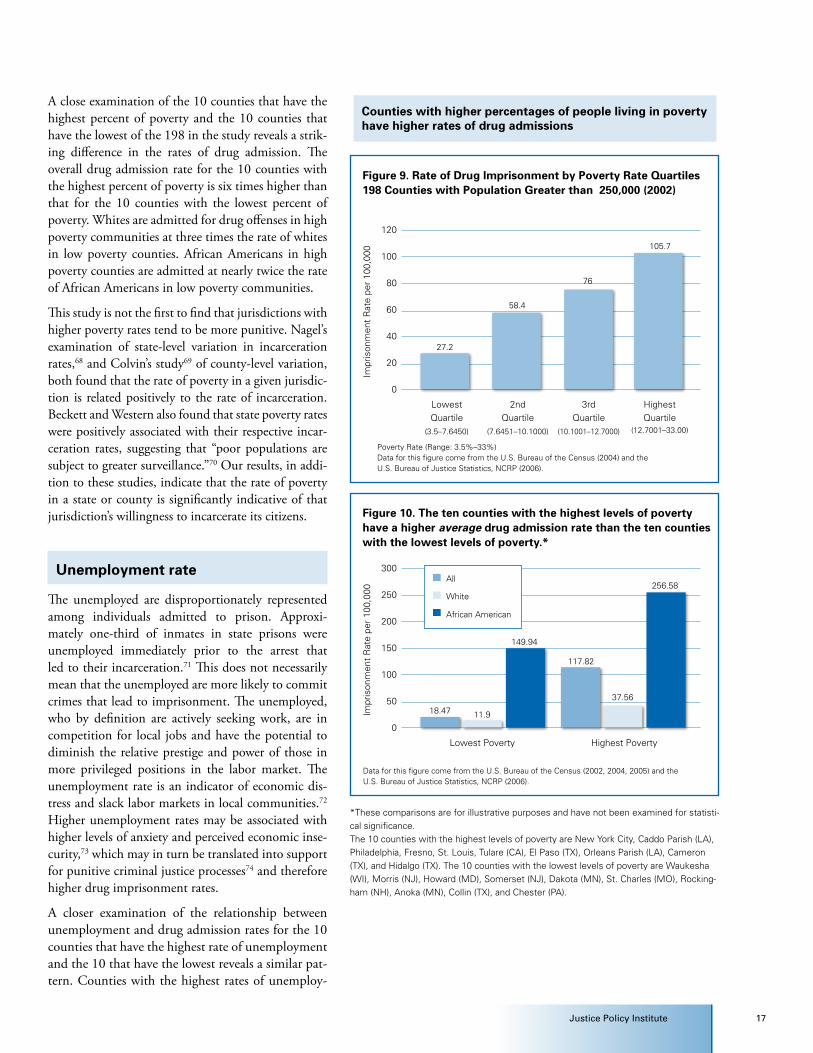
As shown in Figure 10, the drug imprisonment rate in the quartile of counties with the highest poverty rates (106 per 100,000) is approximately four times larger than the drug imprisonment rate in the quar-tile of counties with the lowest poverty rates (27 per 100,000). These findings were further substantiated in a multiple variable analysis that also revealed a sig-nificant positive relationship.
SeCtIon V. What are the sociodemographic characteristics of counties that incarcerate drug offenders at high rates?
Results of our analysis indicate that the drug imprisonment rate is related to the strength of local labor markets and the ways that our com-munities are racially and economically stratified.
JusticePolicyInstitute 1�
A close examination of the 10 counties that have the highest percent of poverty and the 10 counties that have the lowest of the 198 in the study reveals a strik-ing difference in the rates of drug admission. The overall drug admission rate for the 10 counties with the highest percent of poverty is six times higher than that for the 10 counties with the lowest percent of poverty. Whites are admitted for drug offenses in high poverty communities at three times the rate of whites in low poverty counties. African Americans in high poverty counties are admitted at nearly twice the rate of African Americans in low poverty communities.
This study is not the first to find that jurisdictions with higher poverty rates tend to be more punitive. Nagel’s examination of state-level variation in incarceration rates,68 and Colvin’s study69 of county-level variation, both found that the rate of poverty in a given jurisdic-tion is related positively to the rate of incarceration. Beckett and Western also found that state poverty rates were positively associated with their respective incar-ceration rates, suggesting that “poor populations are subject to greater surveillance.”70 Our results, in addi-tion to these studies, indicate that the rate of poverty in a state or county is significantly indicative of that jurisdiction’s willingness to incarcerate its citizens.
unemployment rate
The unemployed are disproportionately represented among individuals admitted to prison. Approxi-mately one-third of inmates in state prisons were unemployed immediately prior to the arrest that led to their incarceration.71 This does not necessarily mean that the unemployed are more likely to commit crimes that lead to imprisonment. The unemployed, who by definition are actively seeking work, are in competition for local jobs and have the potential to diminish the relative prestige and power of those in more privileged positions in the labor market. The unemployment rate is an indicator of economic dis-tress and slack labor markets in local communities.72 Higher unemployment rates may be associated with higher levels of anxiety and perceived economic inse-curity,73 which may in turn be translated into support for punitive criminal justice processes74 and therefore higher drug imprisonment rates.
A closer examination of the relationship between unemployment and drug admission rates for the 10 counties that have the highest rate of unemployment and the 10 that have the lowest reveals a similar pat-tern. Counties with the highest rates of unemploy-
Figure 9. rate of drug Imprisonment by poverty rate Quartiles 198 Counties with population Greater than 250,000 (2002)
Poverty Rate (Range: 3.5%–33%)Data for this figure come from the U.S. Bureau of the Census (2004) and the U.S. Bureau of Justice Statistics, NCRP (2006).
120
100
80
60
40
20
0
27.2
58.4
76
105.7
Impr
ison
men
t R
ate
per
100,
000
LowestQuartile
(3.5–7.6450)
2ndQuartile
(7.6451–10.1000)
3rdQuartile
(10.1001–12.7000)
HighestQuartile
(12.7001–33.00)
Counties with higher percentages of people living in poverty have higher rates of drug admissions
V. ???????????? What Are the Sociodemographic Characteristics?
*These comparisons are for illustrative purposes and have not been examined for statisti-cal significance. The 10 counties with the highest levels of poverty are New York City, Caddo Parish (LA), Philadelphia, Fresno, St. Louis, Tulare (CA), El Paso (TX), Orleans Parish (LA), Cameron (TX), and Hidalgo (TX). The 10 counties with the lowest levels of poverty are Waukesha (WI), Morris (NJ), Howard (MD), Somerset (NJ), Dakota (MN), St. Charles (MO), Rocking-ham (NH), Anoka (MN), Collin (TX), and Chester (PA).
Figure 10. the ten counties with the highest levels of poverty have a higher average drug admission rate than the ten counties with the lowest levels of poverty.*
Data for this figure come from the U.S. Bureau of the Census (2002, 2004, 2005) and the U.S. Bureau of Justice Statistics, NCRP (2006).
300
250
200
150
100
50
0
18.47Impr
ison
men
t R
ate
per
100,
000
Lowest Poverty Highest Poverty
11.9
149.94
117.82
37.56
256.58White
African American
All

18 TheVortex:TheConcentratedRacialImpactofDrugImprisonmentandtheCharacteristicsofPunitiveCounties
ment have an overall drug admission rate that is nearly four times the rate of counties with the lowest rates of unemployment. A similar pattern holds true for both whites and African Americans.
The relationship between the unemployment rate and drug imprisonment is of borderline significance in our multiple variable analysis. This suggests that other county-level sociodemographic and enforce-ment characteristics are potentially related to unem-ployment rates, and are more closely related to the drug imprisonment rate.
racial distributions
The high rate of imprisonment of African Americans for drug offenses clearly has an important adverse impact on communities. A growing body of public health research describes a wide range of objectively identified social ills that are the result of extremely high rates of imprisonment in local communities of color,75 including reduced employment rates,76 reduced family income and stability,77 high rates of homelessness,78 reduced number of citizens who are eligible to vote,79 increased foster care placements and the associated risk of psychological and educational problems for children,80 and reduced health and well being among women in the community.81
Our results indicate that the proportional size of the African American population in a community has a clear relationship with the rate of drug admissions. The drug imprisonment rate in the quartile of coun-ties in which African Americans make up the larg-est percentage of the population (93.6 per 100,000) has nearly twice the drug imprisonment rate as the quartile of counties with the smallest percentage of African Americans (49.6 per 100,000).
A closer examination of the relationship between racial distributions and drug admission rates for the 10 counties that have the highest percentage of African Americans and the 10 that have the lowest reveals a similar pattern. The overall drug admis-sion rate is six times higher for counties with high percentages of African Americans, relative to those with the lowest percentage. In counties with higher percentages of African Americans, whites are admit-ted for drug offenses at four times the rate of coun-ties with lower percentages of African Americans. African Americans are admitted at more than twice the rate in counties with higher percentages of Afri-can Americans.
Figure 11. rate of drug Imprisonment by unemployment rate 198 Counties with population Greater than 250,000 (2002)
Percent of population that is unemployed (Range: 3.2%–12%)Data for this figure come from the U.S. Bureau of the Census (2004) and the U.S. Bureau of Justice Statistics, NCRP (2006).
Impr
ison
men
t R
ate
per
100,
000
120
100
80
60
40
20
0
33.7
64.1 72.3
102.6
LowestQuartile
2ndQuartile
3rdQuartile
HighestQuartile
Counties with larger unemployment rates have higher rates of drug imprisonment
*These comparisons are for illustrative purposes and have not been examined for statis-tical significance.The 10 counties with the highest unemployment rates are Santa Clara (CA), San Joaquin (CA), Cameron (TX), Monterey (CA), Clark (WA), Stanislaus (CA), Kern (CA), Hidalgo (TX), Fresno, and Tulare (CA). The 10 counties with the lowest unemployment rates are Lan-caster (NE), Cumberland (ME), Chesterfield (VA), Prince William (VA), Dane (WI), Fairfax (VA), Howard (MD), Montgomery (MD), Polk (IA), and Knox (TN).
Figure 12. the ten counties that have the highest rates of unem-ployment, on average, also have higher drug admission rates than the ten counties with the lowest rates of unemployment*
Data for this figure come from the U.S. Bureau of the Census (2004, 2005), U.S. Bureau of Justice Statistics, NCRP (2006), and the U.S. Department of Labor (2007).
Impr
ison
men
t R
ate
per
100,
000
Lowest Unemployment Highest Unemployment
450
400
350
300
250
200
150
100
50
0
167.67
105.64
45.3
427.15
18.2729.56
White
African American
All
SeCtIon V. What Are the Sociodemographic Characteristics?

JusticePolicyInstitute 19
The results of this study indicate that the severely dis-proportionate impact of drug imprisonment on Afri-can Americans is related directly to the level of African American representation in local counties, and there-fore to the persistent ways in which our local commu-nities are stratified by race. This relationship between African American representation and drug imprison-ment persists even after controlling for region, crime, and important economic and labor market indicators in our multiple variable analysis. Other research82 has indicated that the relationship between the size of the African American population and punitive criminal justice outcomes is continuing to grow over time.
* These comparisons are for illustrative purposes and have not been examined for statistical significance.The 10 counties with the highest percentages of African Americans are Fulton (GA), Philadelphia, Caddo Parish (LA), Richland (SC), Shelby (TN), St. Louis, Dekalb (GA), Clayton (GA), Prince Georges (MD), and Orleans Parish (LA). The 10 counties with the lowest percentages of African Americans are Utah County (UT), Hidalgo (TX), Cameron (TX), Rockingham (NH), Larimer (CO), Waukesha (WI), Clackamas (OR), Boulder (CO), Jefferson (CO), and Lane (OR).
Figure 14. the overall drug admission rate for the ten counties with the highest average percentage of african americans is almost ten times that of the ten counties with the lowest average percentage.*
Data for this figure come from the U.S. Bureau of the Census (2004, 2005) and the U.S. Bureau of Justice Statistics, NCRP (2006).
Impr
ison
men
t R
ate
per
100,
000
Lowest Percentage Highest Percentage
180
160
140
120
100
80
60
40
20
0
44.03
175.38
11.6419.22
White
African American
All
69.02
112.42
Counties with larger percentages of african americans have higher rates of drug imprisonment.
Figure 13. rate of drug Imprisonment by percent of population that is african american 198 Counties with population Greater than 250,000 (2002)
Percent of population that is African American (Range: 0.64%–68.0%) Data for this figure come from the U.S. Bureau of the Census (2005) and the U.S. Bureau of Justice Statistics, NCRP (2006).
Impr
ison
men
t R
ate
per
100,
000
Lowest Quartile
2nd Quartile
3rd Quartile
Highest Quartile
100
90
80
70
60
50
40
30
20
10
0
72.1
49.6
72.4
93.6
A growing body of public health research describes a wide range of objectively identified social ills that are the result of extremely high rates of imprisonment in local communities of color…
�0 TheVortex:TheConcentratedRacialImpactofDrugImprisonmentandtheCharacteristicsofPunitiveCounties
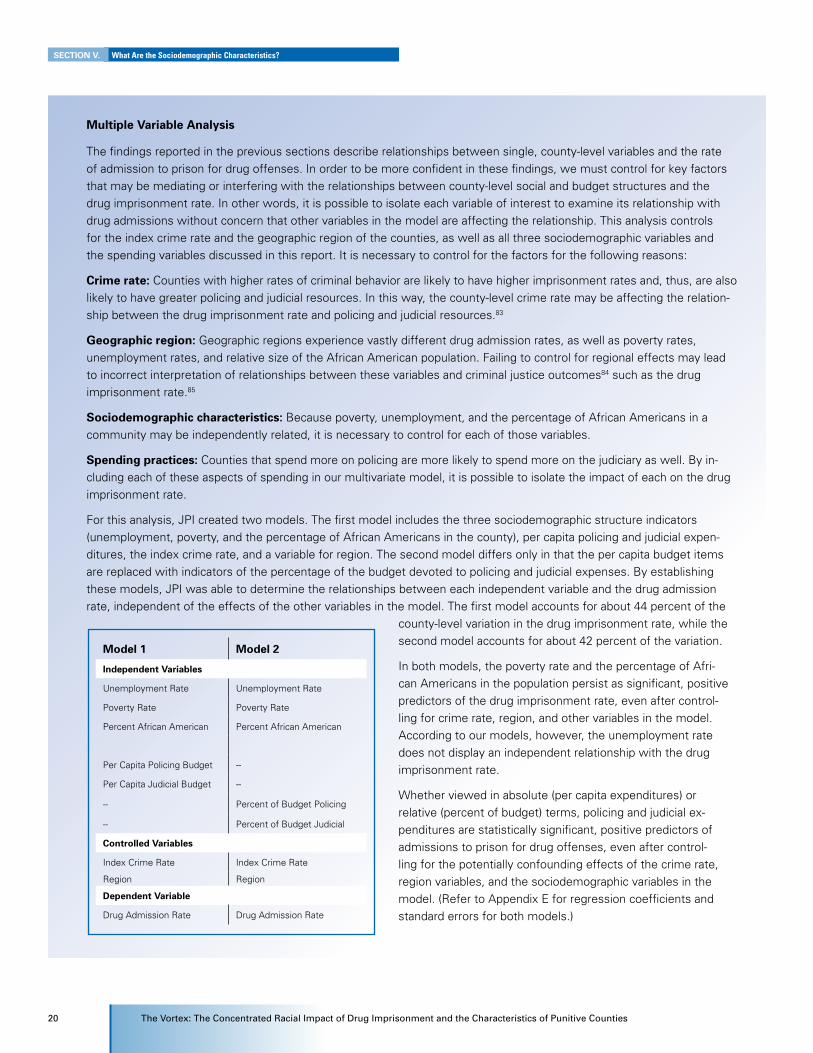
model 1 model 2
Independent Variables
Unemployment Rate Unemployment Rate
Poverty Rate Poverty Rate
Percent African American Percent African American
Per Capita Policing Budget --
Per Capita Judicial Budget --
-- Percent of Budget Policing
-- Percent of Budget Judicial
Controlled Variables
Index Crime Rate Index Crime Rate
Region Region
dependent Variable
Drug Admission Rate Drug Admission Rate
multiple Variable analysis
The findings reported in the previous sections describe relationships between single, county-level variables and the rate of admission to prison for drug offenses. In order to be more confident in these findings, we must control for key factors that may be mediating or interfering with the relationships between county-level social and budget structures and the drug imprisonment rate. In other words, it is possible to isolate each variable of interest to examine its relationship with drug admissions without concern that other variables in the model are affecting the relationship. This analysis controls for the index crime rate and the geographic region of the counties, as well as all three sociodemographic variables and the spending variables discussed in this report. It is necessary to control for the factors for the following reasons:
Crime rate: Counties with higher rates of criminal behavior are likely to have higher imprisonment rates and, thus, are also likely to have greater policing and judicial resources. In this way, the county-level crime rate may be affecting the relation-ship between the drug imprisonment rate and policing and judicial resources.83
Geographic region: Geographic regions experience vastly different drug admission rates, as well as poverty rates, unemployment rates, and relative size of the African American population. Failing to control for regional effects may lead to incorrect interpretation of relationships between these variables and criminal justice outcomes84 such as the drug imprisonment rate.85
Sociodemographic characteristics: Because poverty, unemployment, and the percentage of African Americans in a community may be independently related, it is necessary to control for each of those variables.
Spending practices: Counties that spend more on policing are more likely to spend more on the judiciary as well. By in-cluding each of these aspects of spending in our multivariate model, it is possible to isolate the impact of each on the drug imprisonment rate.
For this analysis, JPI created two models. The first model includes the three sociodemographic structure indicators (unemployment, poverty, and the percentage of African Americans in the county), per capita policing and judicial expen-ditures, the index crime rate, and a variable for region. The second model differs only in that the per capita budget items are replaced with indicators of the percentage of the budget devoted to policing and judicial expenses. By establishing these models, JPI was able to determine the relationships between each independent variable and the drug admission rate, independent of the effects of the other variables in the model. The first model accounts for about 44 percent of the
county-level variation in the drug imprisonment rate, while the second model accounts for about 42 percent of the variation.
In both models, the poverty rate and the percentage of Afri-can Americans in the population persist as significant, positive predictors of the drug imprisonment rate, even after control-ling for crime rate, region, and other variables in the model. According to our models, however, the unemployment rate does not display an independent relationship with the drug imprisonment rate.
Whether viewed in absolute (per capita expenditures) or relative (percent of budget) terms, policing and judicial ex-penditures are statistically significant, positive predictors of admissions to prison for drug offenses, even after control-ling for the potentially confounding effects of the crime rate, region variables, and the sociodemographic variables in the model. (Refer to Appendix E for regression coefficients and standard errors for both models.)
SeCtIon V. What Are the Sociodemographic Characteristics?
JusticePolicyInstitute �1
The relationships between social structure and drug imprisonment, as well as disparities in drug imprisonment rates between African Americans and whites that are nearly universal across coun-ties, strongly suggest a need for a more evidence-based approach to drug enforcement practices in the United States.
Evidence-based drug enforcement practices means that rates of drug arrests and imprisonment would have a direct empirical link to rates of specific drug behaviors within county borders, and within groups defined by race/ethnicity, labor market status, or other relevant stratification factors. To facilitate this rational and fair approach to drug enforcement, fed-eral and state legislatures must provide funding for county-level probability surveys and ethnographic research to reliably determine the rates of specific types of drug behaviors across categories of race/ethnicity. State and local officials must then be held accountable to ensure that rates of drug arrests and imprisonment be no more disparate across counties or social stratification categories than rates of relevant drug behaviors.
With detailed data on drug use rates and patterns within counties, local police and prosecutors could be held accountable for disproportional disparities in drug imprisonment rates between African Americans and whites, or across other sociodemographic cate-gories. In order to reduce racial disproportions in the drug imprisonment rate, local police and prosecutors would need to reduce their emphasis on policing and prosecuting drug behaviors in largely African Ameri-can neighborhoods.
If federal, state, or local governments will not fund the administration of local drug use surveys, re-search and advocacy organizations should fund this evidence-generating research and form community oversight boards to compare the results to publicly available information on drug imprisonment rates by race and other relevant social categorizations.
This data would help hold jurisdictions accountable for disparities in arrests and imprisonment outcomes that occur within their borders.
evidence-based drug enforcement: toward de-escalation of the drug war
The drug war is primarily being waged against Af-rican American citizens of our local jurisdictions, despite solid evidence that they are no more likely than their white counterparts to be engaged in drug use86 or drug delivery behaviors.87 If evidence-based drug enforcement were to take place so that whites were punished for their drug behaviors at similar rates as African Americans, the push for de-escalation of drug en-forcement through legislative means would be led by whites and others in more privileged positions who presently sup-port or are ambivalent about current drug control policy.
As David Cole noted, “The white majority can ‘afford’ the costs associated with mass incarceration because the incarcerated mass is disproportionately nonwhite.”88 If drug laws were enforced among whites as they are among African Americans, those who are currently privileged by the status quo would no longer be able to “afford” punitive drug laws and drug enforcement practices. If these laws and practices were to become “unaffordable” to privileged subpopulations through equitable hyper-enforcement, they would quickly become a thing of the past.
Alternatively, the more appropriate reduction of the drug enforcement effort against African Ameri-cans—so that it is proportional to their rates of drug use and delivery behaviors in the commu-nity—would bring African American drug impris-
VI. reCommendatIonS: a call for evidence-based drug enforcement practice
“ The white majority can ‘afford’ the costs associated with mass incarceration because the incarcerated mass is disproportionately non-white.”
—David Cole, Georgetown University
Law School

�� TheVortex:TheConcentratedRacialImpactofDrugImprisonmentandtheCharacteristicsofPunitiveCounties
onment rates into line with those of whites. This equalization would, in effect, be a rational de facto de-escalation of the drug war that is currently being waged in a way that disproportionately and unfairly targets African Americans.
Careful consideration of public safety funding
The social construction of the drug imprisonment rate in a county begins with the purposeful percep-tion of drug offenses by the police and subsequent arrests. Additional steps toward the drug imprison-ment rate include decisions made by local prosecu-tors about the type of crimes that individuals should be charged with once they have been arrested. These innumerable social acts and decisions are carried out within the localized social contexts of racial and eth-nic distributions, poverty rates, and resources avail-able for policing and judicial functions.
Research presented in this report clearly indicates that county-level public expenditures on policing and the judicial branch are strongly related to the rates at which local individuals are admitted to state prison for drug offenses. This report also indicates that counties with higher poverty rates, higher un-employment rates, and larger percentages of African Americans are generally the most likely to send their fellow citizens to state prison for drug offenses. Local decision makers must carefully consider whether pu-nitive and exclusionary patterns of public spending on drug enforcement is in the best interest of their diverse constituencies and communities.
In order to illustrate the importance of these public safety decisions and their consequences, we have iso-lated two counties for comparison. Orleans Parish, LA, and Lancaster County, NE, have similar index crime rates, at 6753 and 6207, respectively. Twice as much is spent on policing, however, in Orleans Par-ish. Policing accounts for approximately 6 percent of all public expenditures in Orleans Parish, compared to about 3 percent in Lancaster County. Expressed in per capita terms, $222 is spent on policing for every citizen of Orleans Parish, relative to $113 in Lan-caster County.
These disparate funding levels, which reflect public safety spending decisions made by local decision makers, have a dramatic impact on the extent to which individuals are admitted to prison for drug of-fenses from each locale. The drug imprisonment rate in Orleans Parish (250 per 100,000) is more than
10 times higher than Lancaster County’s rate (20 per 100,000).
The sociodemographic contexts in which these local decisions are made are important as well. Rates of poverty and unemployment are considerably higher in Orleans Parish than they are in Lancaster County. In Orleans and other counties with high drug im-prisonment rates, public policing dollars may be better spent on a wide variety of social, health, and educational programs that reduce poverty and create jobs for local citizens. Since the 1980s, there has been a growing trend at the federal, state, and local levels to reduce expenditures on social welfare programs in favor of increased spending on penal institutions89 and law enforcement. Reversing this trend is critical to reducing the drug imprisonment rate, and its se-verely disproportionate impact on African American communities throughout the United States.
While this report carefully examines the role of law enforcement funding, it should not be read as an indictment of the behavior of individual police of-ficers. Individual police officers are performing dif-ficult jobs, and most individuals who are imprisoned for drug behaviors reach that outcome because they broke established drug laws. However, millions of additional individuals break those same laws every day, far beyond the scrutiny and interest of police forces across the country. The results of the current research cast a bright light on the drug imprisonment outcomes of selective drug policing—which is made possible by the wide range of policing resources that are available across jurisdictions in the U.S.
VI. reCommendatIonS Evidence-Based Drug Enforcement

JusticePolicyInstitute ��
appendix a. the 198 counties analyzed in this study with overall drug admission rate, white drug admission rate, african american drug admission rate, and the ratio of african american to white drug admission rates.
County State
Drug Admission
Rate
White Drug Admission
Rate
African American Drug Admission
Rate
Ratio of African American to white drug
admission rates
MECKLENBURG NC 2.57 2.24 3.70 2
GUILFORD NC 3.48 .35 9.05 26
MONTGOMERY MD 3.74 .62 13.71 22
HOWARD MD 3.84 1.02 18.99 19
BUCKS PA 3.93 1.93 56.09 29
ROCKINGHAM NH 5.21 4.97 .00 0
WAKE NC 6.07 .78 26.42 34
FAIRFAX VA 6.92 3.31 38.95 12
CUMBERLAND ME 7.43 4.21 45.16 11
WASHINGTON OR 8.03 6.59 .00 0
CLACKAMAS OR 9.38 8.35 45.75 5
ANNE ARUNDEL MD 10.33 3.37 49.68 15
BOULDER CO 11.10 4.93 27.23 6
PRINCE GEORGES MD 11.16 3.21 13.87 4
HILLSBOROUGH NH 11.21 9.86 63.87 6
WESTMORELAND PA 12.49 4.75 311.42 66
LUZERNE PA 12.71 6.86 271.29 40
MORRIS NJ 13.37 4.66 229.72 49
WAUKESHA WI 14.57 11.69 276.50 24
FORT BEND TX 15.52 1.91 34.99 18
MONTGOMERY PA 15.79 5.10 135.80 27
SEMINOLE FL 16.77 5.17 111.01 21
ANOKA MN 16.79 15.33 66.76 4
GLOUCESTER NJ 16.79 5.17 117.03 23
MARION FL 16.88 4.65 105.64 23
WASHTENAW MI 17.05 2.64 111.90 42
UTAH UT 17.53 16.30 .00 0
BALTIMORE MD 18.04 6.33 57.43 9
BERGEN NJ 18.32 8.06 153.09 19
CUMBERLAND NC 18.79 3.33 40.79 12
PALM BEACH FL 18.82 5.01 88.82 18
BURLINGTON NJ 19.18 4.83 86.31 18
COLLIN TX 19.23 11.57 79.18 7
FORSYTH NC 19.37 .44 72.05 164
DAKOTA MN 19.51 14.85 139.00 9
ERIE NY 19.79 3.41 103.66 30
LANCASTER NE 20.19 14.23 179.04 13
INGHAM MI 20.26 4.26 133.11 31
NORTHAMPTON PA 20.49 14.64 175.01 12
HIDALGO TX 20.99 1.17 42.27 36
LANCASTER PA 21.52 14.54 188.81 13
WESTCHESTER NY 21.55 2.70 100.78 37
GWINNETT GA 21.67 14.15 66.31 5
DU PAGE IL 21.85 11.69 199.61 17
MACOMB MI 22.51 11.94 276.14 23
OAKLAND MI 22.53 7.22 143.92 20
PASCO FL 22.63 12.32 344.99 28
MANATEE FL 23.17 7.15 183.43 26
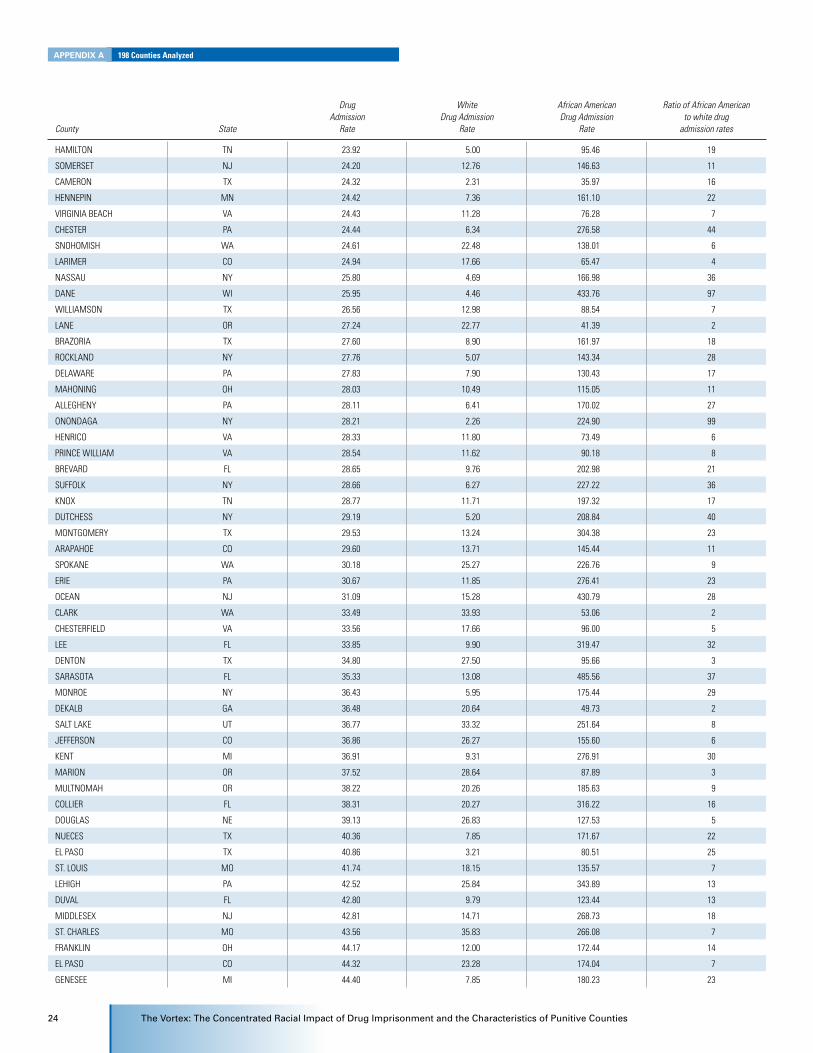
�� TheVortex:TheConcentratedRacialImpactofDrugImprisonmentandtheCharacteristicsofPunitiveCounties
County State
Drug Admission
Rate
White Drug Admission
Rate
African American Drug Admission
Rate
Ratio of African American to white drug
admission rates
HAMILTON TN 23.92 5.00 95.46 19
SOMERSET NJ 24.20 12.76 146.63 11
CAMERON TX 24.32 2.31 35.97 16
HENNEPIN MN 24.42 7.36 161.10 22
VIRGINIA BEACH VA 24.43 11.28 76.28 7
CHESTER PA 24.44 6.34 276.58 44
SNOHOMISH WA 24.61 22.48 138.01 6
LARIMER CO 24.94 17.66 65.47 4
NASSAU NY 25.80 4.69 166.98 36
DANE WI 25.95 4.46 433.76 97
WILLIAMSON TX 26.56 12.98 88.54 7
LANE OR 27.24 22.77 41.39 2
BRAZORIA TX 27.60 8.90 161.97 18
ROCKLAND NY 27.76 5.07 143.34 28
DELAWARE PA 27.83 7.90 130.43 17
MAHONING OH 28.03 10.49 115.05 11
ALLEGHENY PA 28.11 6.41 170.02 27
ONONDAGA NY 28.21 2.26 224.90 99
HENRICO VA 28.33 11.80 73.49 6
PRINCE WILLIAM VA 28.54 11.62 90.18 8
BREVARD FL 28.65 9.76 202.98 21
SUFFOLK NY 28.66 6.27 227.22 36
KNOX TN 28.77 11.71 197.32 17
DUTCHESS NY 29.19 5.20 208.84 40
MONTGOMERY TX 29.53 13.24 304.38 23
ARAPAHOE CO 29.60 13.71 145.44 11
SPOKANE WA 30.18 25.27 226.76 9
ERIE PA 30.67 11.85 276.41 23
OCEAN NJ 31.09 15.28 430.79 28
CLARK WA 33.49 33.93 53.06 2
CHESTERFIELD VA 33.56 17.66 96.00 5
LEE FL 33.85 9.90 319.47 32
DENTON TX 34.80 27.50 95.66 3
SARASOTA FL 35.33 13.08 485.56 37
MONROE NY 36.43 5.95 175.44 29
DEKALB GA 36.48 20.64 49.73 2
SALT LAKE UT 36.77 33.32 251.64 8
JEFFERSON CO 36.86 26.27 155.60 6
KENT MI 36.91 9.31 276.91 30
MARION OR 37.52 28.64 87.89 3
MULTNOMAH OR 38.22 20.26 185.63 9
COLLIER FL 38.31 20.27 316.22 16
DOUGLAS NE 39.13 26.83 127.53 5
NUECES TX 40.36 7.85 171.67 22
EL PASO TX 40.86 3.21 80.51 25
ST. LOUIS MO 41.74 18.15 135.57 7
LEHIGH PA 42.52 25.84 343.89 13
DUVAL FL 42.80 9.79 123.44 13
MIDDLESEX NJ 42.81 14.71 268.73 18
ST. CHARLES MO 43.56 35.83 266.08 7
FRANKLIN OH 44.17 12.00 172.44 14
EL PASO CO 44.32 23.28 174.04 7
GENESEE MI 44.40 7.85 180.23 23
appendIx a 198 Counties Analyzed
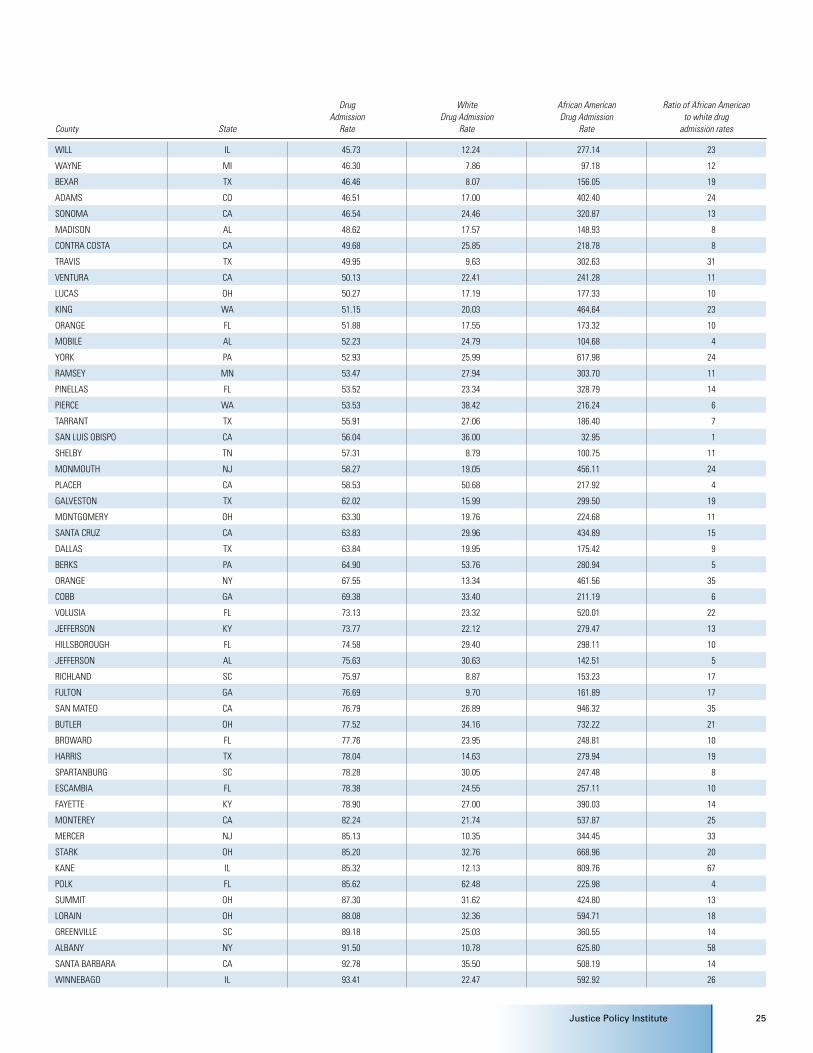
JusticePolicyInstitute ��
County State
Drug Admission
Rate
White Drug Admission
Rate
African American Drug Admission
Rate
Ratio of African American to white drug
admission rates
WILL IL 45.73 12.24 277.14 23
WAYNE MI 46.30 7.86 97.18 12
BEXAR TX 46.46 8.07 156.05 19
ADAMS CO 46.51 17.00 402.40 24
SONOMA CA 46.54 24.46 320.87 13
MADISON AL 48.62 17.57 148.93 8
CONTRA COSTA CA 49.68 25.85 218.78 8
TRAVIS TX 49.95 9.63 302.63 31
VENTURA CA 50.13 22.41 241.28 11
LUCAS OH 50.27 17.19 177.33 10
KING WA 51.15 20.03 464.64 23
ORANGE FL 51.88 17.55 173.32 10
MOBILE AL 52.23 24.79 104.68 4
YORK PA 52.93 25.99 617.98 24
RAMSEY MN 53.47 27.94 303.70 11
PINELLAS FL 53.52 23.34 328.79 14
PIERCE WA 53.53 38.42 216.24 6
TARRANT TX 55.91 27.06 186.40 7
SAN LUIS OBISPO CA 56.04 36.00 32.95 1
SHELBY TN 57.31 8.79 100.75 11
MONMOUTH NJ 58.27 19.05 456.11 24
PLACER CA 58.53 50.68 217.92 4
GALVESTON TX 62.02 15.99 299.50 19
MONTGOMERY OH 63.30 19.76 224.68 11
SANTA CRUZ CA 63.83 29.96 434.89 15
DALLAS TX 63.84 19.95 175.42 9
BERKS PA 64.90 53.76 280.94 5
ORANGE NY 67.55 13.34 461.56 35
COBB GA 69.38 33.40 211.19 6
VOLUSIA FL 73.13 23.32 520.01 22
JEFFERSON KY 73.77 22.12 279.47 13
HILLSBOROUGH FL 74.58 29.40 298.11 10
JEFFERSON AL 75.63 30.63 142.51 5
RICHLAND SC 75.97 8.87 153.23 17
FULTON GA 76.69 9.70 161.89 17
SAN MATEO CA 76.79 26.89 946.32 35
BUTLER OH 77.52 34.16 732.22 21
BROWARD FL 77.76 23.95 248.81 10
HARRIS TX 78.04 14.63 279.94 19
SPARTANBURG SC 78.28 30.05 247.48 8
ESCAMBIA FL 78.38 24.55 257.11 10
FAYETTE KY 78.90 27.00 390.03 14
MONTEREY CA 82.24 21.74 537.87 25
MERCER NJ 85.13 10.35 344.45 33
STARK OH 85.20 32.76 668.96 20
KANE IL 85.32 12.13 809.76 67
POLK FL 85.62 62.48 225.98 4
SUMMIT OH 87.30 31.62 424.80 13
LORAIN OH 88.08 32.36 594.71 18
GREENVILLE SC 89.18 25.03 360.55 14
ALBANY NY 91.50 10.78 625.80 58
SANTA BARBARA CA 92.78 35.50 508.19 14
WINNEBAGO IL 93.41 22.47 592.92 26
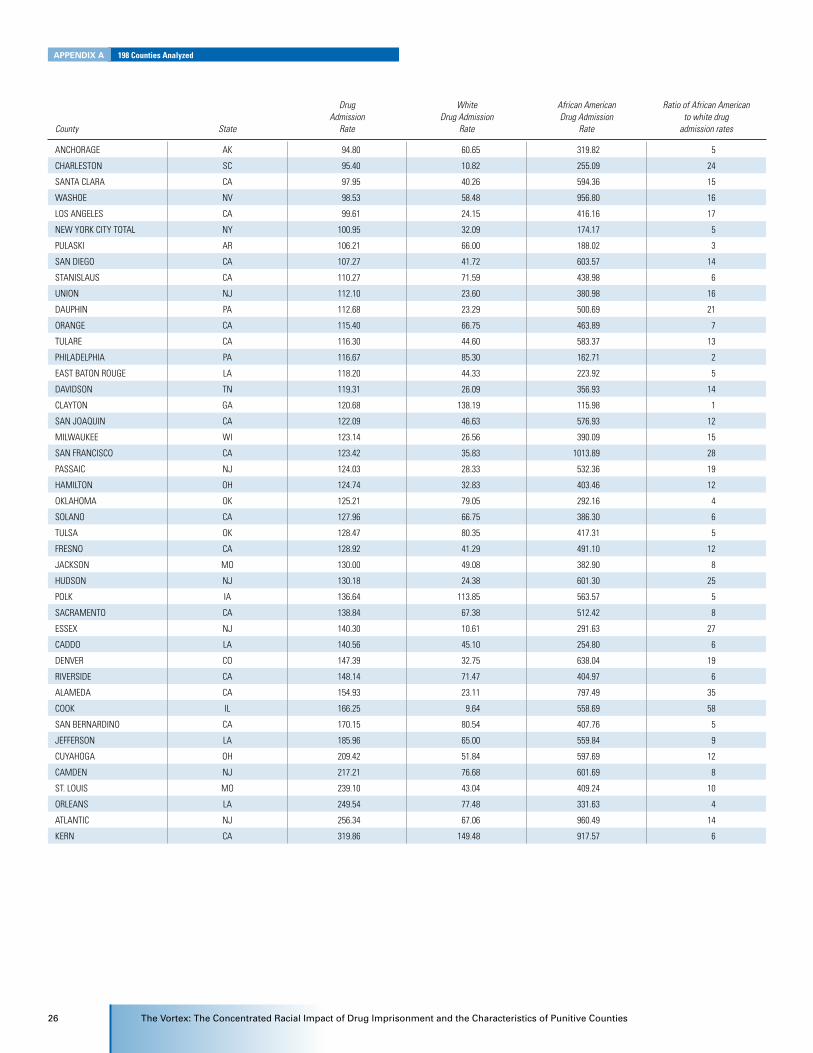
�� TheVortex:TheConcentratedRacialImpactofDrugImprisonmentandtheCharacteristicsofPunitiveCounties
County State
Drug Admission
Rate
White Drug Admission
Rate
African American Drug Admission
Rate
Ratio of African American to white drug
admission rates
ANCHORAGE AK 94.80 60.65 319.82 5
CHARLESTON SC 95.40 10.82 255.09 24
SANTA CLARA CA 97.95 40.26 594.36 15
WASHOE NV 98.53 58.48 956.80 16
LOS ANGELES CA 99.61 24.15 416.16 17
NEW YORK CITY TOTAL NY 100.95 32.09 174.17 5
PULASKI AR 106.21 66.00 188.02 3
SAN DIEGO CA 107.27 41.72 603.57 14
STANISLAUS CA 110.27 71.59 438.98 6
UNION NJ 112.10 23.60 380.98 16
DAUPHIN PA 112.68 23.29 500.69 21
ORANGE CA 115.40 66.75 463.89 7
TULARE CA 116.30 44.60 583.37 13
PHILADELPHIA PA 116.67 85.30 162.71 2
EAST BATON ROUGE LA 118.20 44.33 223.92 5
DAVIDSON TN 119.31 26.09 356.93 14
CLAYTON GA 120.68 138.19 115.98 1
SAN JOAQUIN CA 122.09 46.63 576.93 12
MILWAUKEE WI 123.14 26.56 390.09 15
SAN FRANCISCO CA 123.42 35.83 1013.89 28
PASSAIC NJ 124.03 28.33 532.36 19
HAMILTON OH 124.74 32.83 403.46 12
OKLAHOMA OK 125.21 79.05 292.16 4
SOLANO CA 127.96 66.75 386.30 6
TULSA OK 128.47 80.35 417.31 5
FRESNO CA 128.92 41.29 491.10 12
JACKSON MO 130.00 49.08 382.90 8
HUDSON NJ 130.18 24.38 601.30 25
POLK IA 136.64 113.85 563.57 5
SACRAMENTO CA 138.84 67.38 512.42 8
ESSEX NJ 140.30 10.61 291.63 27
CADDO LA 140.56 45.10 254.80 6
DENVER CO 147.39 32.75 638.04 19
RIVERSIDE CA 148.14 71.47 404.97 6
ALAMEDA CA 154.93 23.11 797.49 35
COOK IL 166.25 9.64 558.69 58
SAN BERNARDINO CA 170.15 80.54 407.76 5
JEFFERSON LA 185.96 65.00 559.84 9
CUYAHOGA OH 209.42 51.84 597.69 12
CAMDEN NJ 217.21 76.68 601.69 8
ST. LOUIS MO 239.10 43.04 409.24 10
ORLEANS LA 249.54 77.48 331.63 4
ATLANTIC NJ 256.34 67.06 960.49 14
KERN CA 319.86 149.48 917.57 6
appendIx a 198 Counties Analyzed
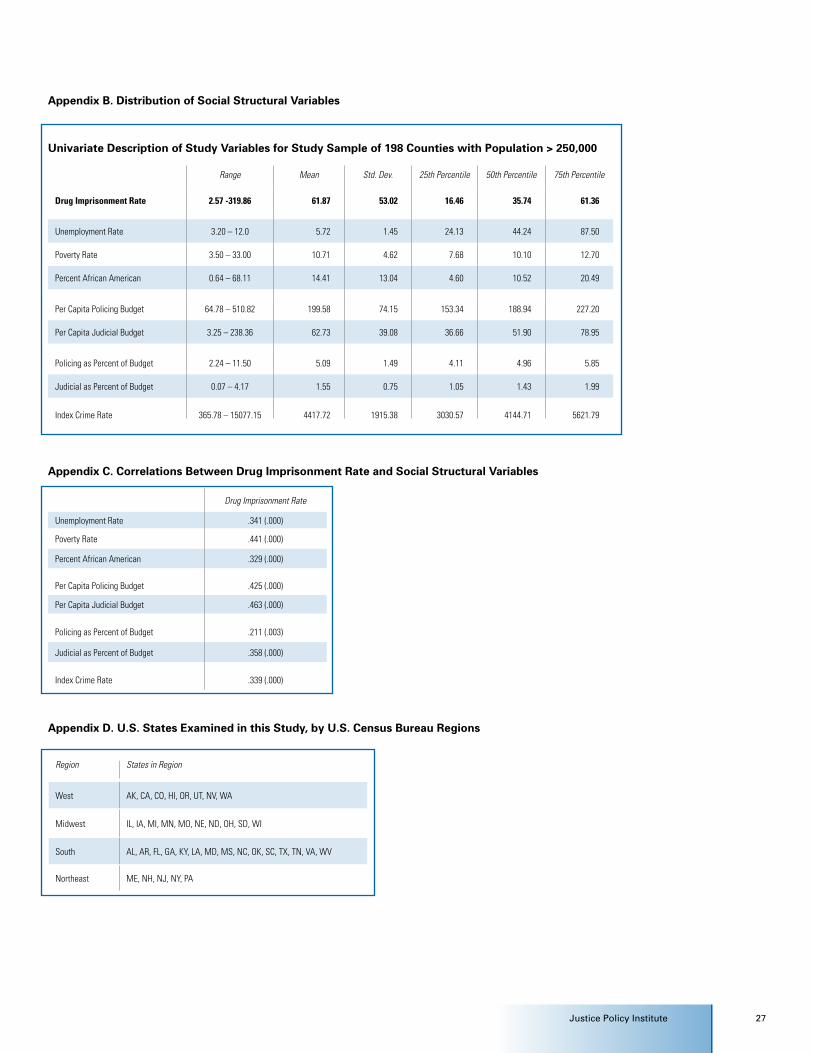
JusticePolicyInstitute ��
appendix B. distribution of Social Structural Variables
univariate description of Study Variables for Study Sample of 198 Counties with population > 250,000
Range Mean Std. Dev. 25th Percentile 50th Percentile 75th Percentile
Drug Imprisonment Rate 2.57 -319.86 61.87 53.02 16.46 35.74 61.36
Unemployment Rate 3.20 – 12.0 5.72 1.45 24.13 44.24 87.50
Poverty Rate 3.50 – 33.00 10.71 4.62 7.68 10.10 12.70
Percent African American 0.64 – 68.11 14.41 13.04 4.60 10.52 20.49
Per Capita Policing Budget 64.78 – 510.82 199.58 74.15 153.34 188.94 227.20
Per Capita Judicial Budget 3.25 – 238.36 62.73 39.08 36.66 51.90 78.95
Policing as Percent of Budget 2.24 – 11.50 5.09 1.49 4.11 4.96 5.85
Judicial as Percent of Budget 0.07 – 4.17 1.55 0.75 1.05 1.43 1.99
Index Crime Rate 365.78 – 15077.15 4417.72 1915.38 3030.57 4144.71 5621.79
appendix C. Correlations Between drug Imprisonment rate and Social Structural Variables
Drug Imprisonment Rate
Unemployment Rate .341 (.000)
Poverty Rate .441 (.000)
Percent African American .329 (.000)
Per Capita Policing Budget .425 (.000)
Per Capita Judicial Budget .463 (.000)
Policing as Percent of Budget .211 (.003)
Judicial as Percent of Budget .358 (.000)
Index Crime Rate .339 (.000)
appendix d. u.S. States examined in this Study, by u.S. Census Bureau regions
Region States in Region
West AK, CA, CO, HI, OR, UT, NV, WA
Midwest IL, IA, MI, MN, MO, NE, ND, OH, SD, WI
South AL, AR, FL, GA, KY, LA, MD, MS, NC, OK, SC, TX, TN, VA, WV
Northeast ME, NH, NJ, NY, PA

�8 TheVortex:TheConcentratedRacialImpactofDrugImprisonmentandtheCharacteristicsofPunitiveCounties
appendix e. ordinary Least Squares estimates from regression of drug Imprisonment rates on Sociodemographic, Budget, Index Crime rate, and region Variables for 198 Large-population Counties/municipalities (2002)
Variable Model 1 Model 2
Coefficient(Std. Error)
Coefficient(Std. Error)
Unemployment Rate -.609(3.061)
-.636(3.101)
Poverty Rate .3.776**(1.062)
3.987**(1.077)
Percent African American .939** (.314)
1.114**(.310)
Per Capita Policing Budget .148**(.045)
__
Per Capita Judicial Budget .278**(.095)
__
Percent of Budget Policing __ 6.803**(2.024)
Percent of Budget Judicial __ 12.858**(4.363)
Index Crime Rate .0005(.002)
.002(.002)
Northeast 19.407*(9.405)
31.889**(9.256)
Midwest 16.586(9.559)
26.795**(9.311)
West 28.886*(11.515)
47.416**(10.695)
Intercept -51.425 -79.504
R2 .436 .421
Note: Coefficients are unstandardized.* p < .05; ** p < .01
appendIx e Ordinary Least Squares Estimates
JusticePolicyInstitute �9
endnoteS
1 U.S. Department of Justice, Bureau of Justice Statistics (2005). “Key Facts at a Glance: Incarceration Rate 1980-2005.” http://www.ojp.usdoj.gov/bjs/glance/tables/incrttab.htm accessed on January 11, 2007.
2 Mauer, M. (1999), Race to Incarcerate. New York: The New Press. Schiraldi, V., Holman, B., Beatty, P. (2000), “Poor Prescription: The Cost of Imprisoning Drug Offenders in the United States.” Washington, D.C.: Justice Policy Institute.
3 Harrison, P.M. and Beck, A. J. (2006), “Prisoners in 2005.” Washington, D.C.: U.S. Department of Justice. Beck, A.J. and Mumola, C.J. (1999), “Prisoners in 1998.” Washington, D.C.: U.S. Department of Justice.
4 Harlow, C.W. (1998), “Profile of Jail Inmates 1996.” Washington, D.C.: U.S. Department of Justice. James, D.J. (2004), “Profile of Jail Inmates 2002.” Washington, D.C.: U.S. Department of Justice.
5 American Correctional Association (2006), “2006 Directory of Adult and Juvenile Correctional Departments, Institutions, Agencies and Probation and Parole Authorities, 67th Edition.” Alexandria, VA: ACA. Harrison, P.M. and Beck, A. J. (2006), “Prisoners in 2005.” Washington, D.C.: U.S. Department of Justice.
6 Spelling, W. (2000), “The Limited Importance of Prison Expansion.” In The American Crime Drop, eds. Blumstein, Alfred and Wallman, Joel. Boston: Cambridge University Press. Rosenfeld, R. (2000), “Patterns in Adult Homicide: 1980–1995.” In The American Crime Drop, eds. Blumstein, Alfred and Wallman, Joel. Boston: Cambridge University Press. Clear, T. R. (2003), “The Problem with ‘Addition by Subtraction’: The Prison-Crime Relationship in Low Income Communities,” In Invisible Punishment: The Collateral Consequences of Mass Imprisonment. Eds. Mauer and Chesney-Lind. New York: New Press.
7 Schiraldi, V., Holman, B., Beatty, P. (2000), “Poor Prescription: The Cost of Imprisoning Drug Offenders in the United States.” Washington, D.C.: Justice Policy Institute.
8 SAMHSA (2005). Results from the 2002 National Survey on Drug Use and Health: Detailed Tables. Prevalence Estimates, Standard Errors, and Sample Sizes.
9 Harrison, P.M. and Beck, A. J. (2006), “Prisoners in 2005.” Washington, D.C.: U.S. Department of Justice.
10 U.S. Bureau of the Census (2000). Selected Population Group: Black or African American alone or in combination with one or more other races. Web page: http://factfinder.census.gov/servlet/SAFFIteratedFacts?_event=&geo_id=01000U.S.&_geoContext=01000U.S.&_street=&_county=&_cityTown=&_state=&_zip=&_lang=en&_sse=on&ActiveGeoDiv=&_useEV=&pctxt=fph&pgsl=010&_submenuId=factsheet_2&ds_name=DEC_2000_SAFF&_ci_nbr=005&qr_name=DEC_2000_SAFF_R1010®=DEC_2000_SAFF_R1010%3A005&_keyword=&_industry= referenced April 9, 2007. Harrison, P.M. and Beck, A. J. (2006), “Prisoners in 2005.” Washington, D.C.: U.S. Department of Justice.
11 SAMHSA (2005). Results from the 2002 National Survey on Drug Use and Health: Detailed Tables. Prevalence Estimates, Standard Errors, and Sample Sizes. Office of National Drug Control Policy (2004). National Drug Control Strategy, Data Supplement. Table 34. Web page: http://www.whitehousedrugpolicy.gov/publications/policy/ndcs04/data_suppl_2004.pdf accessed on January 28, 2007. U.S. Department of Justice, Bureau of Justice Statistics. National Corrections Reporting Program, 2002: [United States] [Computer file].
12 SAMHSA (2005). Results from the 2002 National Survey
on Drug Use and Health: Detailed Tables. Prevalence Estimates, Standard Errors, and Sample Sizes. Snyder, H.N. and Sickmund, M. (March 2006), Juvenile Offenders and Victims: 2006 National Report. Office of Juvenile Justice and Delinquency Prevention.
13 This data is from U.S. Department of Justice, Bureau of Justice Statistics. National Corrections Reporting Program National Corrections Reporting Program, 2002: [United States] [Computer file].
14 U.S. Bureau of the Census (2003). Statistical Abstracts of the United States. Mini Historical Statistics. Web page: http://www.census.gov/statab/hist/HS-01.pdf referenced on January 20, 2007.
15 U.S. Department of Justice, Bureau of Justice Statistics. National Corrections Reporting Program, 2002: [United States] [Computer file]. Conducted by U.S. Department of Commerce, Bureau of the Census. ICPSR ed. Ann Arbor, MI: Inter-university Consortium for Political and Social Research [producer and distributor], 2006.
16 U.S. Bureau of the Census (2005). 2002 Census of Governments, Volume 4, Number 5. Compendium of Government Finances: 2002. GC02(4)-5. U.S. Government Printing Office, Washington DC. Raw data obtained from the following web page: http://www.census.gov/govs/www/02censustechdoc.html. Accessed on January 20, 2007.
17 Federal Bureau of Investigation (2002). Uniform Crime Report. Washington, D.C.: U.S. Department of Justice.
18 U.S. Bureau of the Census (2005). Annual Estimates of the Population by Sex, Race Alone, or in Combination and Hispanic or Latino Origin for Counties: April 1, 2000 to July 1, 2005. Web page: http://www.census.gov/popest/counties/ asrh/CC-EST2005-RACE5.html accessed on January 20, 2007. U.S. Bureau of the Census (2002). Small Area Income and Poverty Estimates. 2002 State and County Files and Description. Web page: http://www.census.gov/hhes/www/saipe/stcty/sc02ftpdoc.html accessed on January 20, 2007. U.S. Bureau of the Census (2004). County level population estimates for 2002 obtained from the following web page: http://www.census.gov/popest/archives/2000s/vintage_2002/#county, accessed on January 21, 2007. U.S. Bureau of the Census (2005). Annual Estimates of the Population by Sex, Race Alone or in Combination and Hispanic or Latino Origin for Counties: April 1, 2000 to July 1, 2005. Web page: http://www.census.gov/popest/counties/asrh/CC-EST2005-RACE5.html accessed on January 20, 2007.
19 U.S. Department of Labor, Bureau of Labor Statistics (2007). Local Area Unemployment Characteristics. Web page: http://www.bls.gov/lau/ accessed on January 28, 2007.
20 SAMHSA (2005). Results from the 2002 National Survey on Drug Use and Health: Detailed Tables. Prevalence Estimates, Standard Errors, and Sample Sizes.
21 Office of National Drug Control Policy (2004). National Drug Control Strategy, Data Supplement. Table 34. Web page: http://www.whitehousedrugpolicy.gov/publications/policy/ndcs04/data_suppl_2004.pdf accessed on January 28, 2007.
22 Office of National Drug Control Policy (2004). National Drug Control Strategy, Data Supplement. Table 34. Web page: http://www.whitehousedrugpolicy.gov/publications/policy/ndcs04/data_suppl_2004.pdf accessed on January 28, 2007.
23 U.S. Department of Justice, Bureau of Justice Statistics. National Corrections Reporting Program, 2002: [United States] [Computer file].
24 This is an underestimate of total drug admissions in the U.S. in 2002, as the NCRP does not contain data for 12 states. The 12 states for which there are no data available in the 2002 NCRP include five states from the Mountain West (Arizona, Idaho, Montana, New Mexico, and Wyoming), five states
�0 TheVortex:TheConcentratedRacialImpactofDrugImprisonmentandtheCharacteristicsofPunitiveCounties
from the Northeast (Delaware, Rhode Island, Connecticut, Vermont, and Massachusetts), and two states from the Midwest (Kansas, Indiana).
25 Reich, C. (1973). “The Law and the Corporate State.” In Chambliss, W., (ed.), Sociological Readings in the Conflict Perspective. pp. 445–454. Reading, MA: Addison-Wesley Publishing Company.
26 Johnston, L., O’Malley, P., and Bachman, J. (2003), “Monitoring the Future National Results on Adolescent Drug Use: Overview of Key Findings 2002.” NIH Publication No. 03-5374. Bethesda: MD: National Institute on Drug Abuse.
27 Snyder, H.N. and Sickmund, M. (March 2006), “Juvenile Offenders and Victims: 2006 National Report.” Office of Juvenile Justice and Delinquency Prevention.
28 SAMHSA (2005). Results from the 2002 National Survey on Drug Use and Health: Detailed Tables. Prevalence Estimates, Standard Errors, and Sample Sizes.
29 SAMHSA (2005). Results from the 2002 National Survey on Drug Use and Health: Detailed Tables. Prevalence Estimates, Standard Errors, and Sample Sizes.
30 U.S. Department of Justice, Bureau of Justice Statistics. National Corrections Reporting Program, 2002: [United States] [Computer file]. Conducted by U.S. Department of Commerce, Bureau of the Census. ICPSR ed. Ann Arbor, MI: Inter-university Consortium for Political and Social Research [producer and distributor], 2006. U.S. Bureau of the Census, Annual Population Estimates 2000 to 2006, http://www.census.gov/popest/states/NST-ann-est.html accessed on May 14, 2007.
31 SAMHSA (2005). Results from the 2002 National Survey on Drug Use and Health: Detailed Tables. Prevalence Estimates, Standard Errors, and Sample Sizes, U.S. Sentencing Commission (2006). 2006 Sourcebook on Federal Sentencing Statistics, Table 34. Washington, DC: U.S. Sentencing Commission.
32 Snyder, Howard N. and Sickmund, Melissa (2006), “Juvenile Offenders and Victims: 2006 National Report.” Washington, D.C.: Office of Juvenile Justice and Delinquency Prevention. D.C.
33 Snyder, Howard N. and Sickmund, Melissa (2006), “Juvenile Offenders and Victims: 2006 National Report.” Washington, D.C.: Office of Juvenile Justice and Delinquency Prevention. D.C.
34 SAMHSA (2005). Results from the 2002 National Survey on Drug Use and Health: Detailed Tables. Prevalence Estimates, Standard Errors, and Sample Sizes. Johnston, L., O’Malley, P., and Bachman, J. (2003), “Monitoring the Future National Results on Adolescent Drug Use: Overview of Key Findings 2002.” NIH Publication No. 03-5374. Bethesda: MD: National Institute on Drug Abuse.
35 Riley, J. (1997), “Crack, Powder Cocaine, and Heroin: Drug Purchase and Use Patterns in Six U.S. Cities.” Washington D.C.: National Institute of Justice and the Office of National Drug Control Policy; Pennell, S., Ellett, J., Rienick, C., and Grimes, J. (1999), “Meth Matters: Report on Methamphetamine Users in Five Western Cities.” Washington, D.C.: Office of Justice Programs, National Institute of Justice.
36 Schiraldi, V., Holman, B., Beatty, P. (2000), “Poor Prescription: The Cost of Imprisoning Drug Offenders in the United States.” Washington, D.C.: Justice Policy Institute.
37 Stemen, D., Rengifo, A., and Wilson, J. (2005), “Of Fragmentation and Ferment: The Impact of State Sentencing Policies on Incarceration Rates, 1975–2002.” Vera Institute of Justice.
38 Justice Policy Institute (2007), “Maryland’s Mandatory Minimum Drug Sentencing Laws: Their Impact on Incarceration, State Resources, and Communities of Color.”
Washington, D.C.: Justice Policy Institute.39 Justice Policy Institute (2007), “Maryland’s Mandatory
Minimum Drug Sentencing Laws: Their Impact on Incarceration, State Resources, and Communities of Color.” Washington, D.C.: Justice Policy Institute.
40 U.S. Department of Justice, Bureau of Justice Statistics (1998), “Compendium of Federal Justice Statistics, 1994, Table 6.11, at 85.” Washington, D.C.: Bureau of Justice Statistics; U.S. Department of Justice, Bureau of Justice Statistics (2004), “Compendium of Federal Justice Statistics, 2003, Table 7.16 at 112.” Washington, D.C.: Bureau of Justice Statistics.
41 Hoytt, E.H., Schiraldi, V., Smith, B.V., and Ziedenberg, J. (2002), “Pathways to Juvenile Detention Reform: Reducing Racial Disparities in Juvenile Detention.” Baltimore, MD: Annie E. Casey Foundation.
42 Bridges, G.S. and Steen, S. (1998), “Racial Disparities in Official Assessments of Juvenile Offenders; Attributional Stereotypes as Mediating Mechanisms.” American Sociological Review, Volume 63.
43 Hoytt, E.H., Schiraldi, V., Smith, B.V., and Ziedenberg, J. (2002), “Pathways to Juvenile Detention Reform: Reducing Racial Disparities in Juvenile Detention.” Baltimore, MD: Annie E. Casey Foundation.
44 Schiraldi, V. and Ziedenberg, J. (2003), “Race and Incarceration in Maryland.” Washington, D.C.: Justice Policy Institute.
45 Beckett, K., Western, B., (2001), “Governing Social Marginality: Welfare, Incarceration, and the Transformation of State Policy.” Chapter 4 in Garland, D. (ed.), Mass Imprisonment: Social Causes and Consequences. Thousand Oaks, CA: Sage Publications.
46 Wright, D. (2003), “State Estimates of Substance Use from the 2001 National Household Survey on Drug Abuse: Volume I. Findings.” (DHHS Publication No. SMA 03-3775, NHSDA Series H-19). Rockville, MD: Substance Abuse and Mental Health Services Administration, Office of Applied Studies.
47 SAMHSA, Office of Applied Studies (2006). Substate Estimates From the 2002–2004 National Surveys on Drug Use and Health. Rockville, MD: Substance Abuse and Mental Health Services Administration.
48 Schiraldi, V., Holman, B., Beatty, P. (2000), “Poor Prescription: The Cost of Imprisoning Drug Offenders in the United States.” Washington, D.C.: Justice Policy Institute.
49 Schiraldi, V., Holman, B., Beatty, P. (2000), “Poor Prescription: The Cost of Imprisoning Drug Offenders in the United States.” Washington, D.C.: Justice Policy Institute.
50 SAMHSA, Office of Applied Studies (2006). Substate Estimates from the 2002–2004 National Surveys on Drug Use and Health. Rockville, MD: Substance Abuse and Mental Health Services Administration.
51 SAMHSA, Office of Applied Studies (2006). Substate Estimates from the 2002–2004 National Surveys on Drug Use and Health. Rockville, MD: Substance Abuse and Mental Health Services Administration.
52 Jencks (1991), “Is Violent Crime Increasing?” The American Prospect. (Winter): 98—109; O’Brien, R. (1996), “Police Productivity and Crime Rates: 1973–1992.” Criminology. 34(2): 183–207.
53 O’Brien, R. (1996), “Police Productivity and Crime Rates: 1973–1992.” Criminology. 34(2): 183–207.
54 Black, D. (1970), “Production of Crime Rates,” American Sociological Review. 34: 733–748.
55 Judicial expenses refer to administration of the courts and activities associated with courts including prosecutorial and defendant programs, law libraries, probate functions, and juries.
endnoteS
JusticePolicyInstitute �1
56 Reich, C. (1973), “The Law and The Corporate State.” In Chambliss, W. (ed.) Sociological Readings in the Conflict Perspective. Reading, MA: Addison-Wesley Publishing Company.
57 Beckett, K (2004), “Race and Drug Law Enforcement in Seattle.” http://www.defender.org/files/Beckett-20040503.pdf accessed on January 15, 2007.
58 Beckett, K (2004), “Race and Drug Law Enforcement in Seattle.” http://www.defender.org/files/Beckett-20040503.pdf accessed on January 15, 2007, p. 87.
59 SAMHSA (2005). Results from the 2002 National Survey on Drug Use and Health: Detailed Tables. Prevalence Estimates, Standard Errors, and Sample Sizes; Johnston, L., O’Malley, P., and Bachman, J. (2003), “Monitoring the Future National Results on Adolescent Drug Use: Overview of Key Findings 2002.” NIH Publication No. 03-5374. Bethesda: MD: National Institute on Drug Abuse.
60 Riley, J. (1997), “Crack, Powder Cocaine, and Heroin: Drug Purchase and Use Patterns in Six U.S. Cities.” Washington D.C.: National Institute of Justice and the Office of National Drug Control Policy; Pennell, S., Ellett, J., Rienick, C., Grimes, J. (1999), “Meth Matters: Report on Methamphetamine Users in Five Western Cities.” Washington, D.C.: Office of Justice Programs, National Institute of Justice; Beckett, K. (2004), “Race and Drug Law Enforcement in Seattle.” http://www.defender.org/files/Beckett-20040503.pdf accessed on January 15, 2007.
61 SAMHSA, Office of Applied Studies (2006). Substate Estimates from the 2002–2004 National Surveys on Drug Use and Health. Rockville, MD: Substance Abuse and Mental Health Services Administration.
62 Reiman, J. (1998), The Rich Get Richer and the Poor Get Prison: Ideology, Class, and Criminal Justice. Boston: Allyn and Bacon; McGarrell, E. (1993), “Institutional Theory and the Stability of a Conflict Model of the Incarceration Rate.” Justice Quarterly. 10(1): 7-27; Colvin, M. (1990), “Labor Markets, Industrial Monopolization, Welfare and Imprisonment.” Sociological Quarterly. 31: 441-457; Beckett, K., and Western, B., (2001), “Governing Social Marginality: Welfare, Incarceration, and the Transformation of State Policy.” In Garland, D. (Ed.) Mass Imprisonment: Social Causes and Consequences. Thousand Oaks, CA: Sage Publications.
63 Reiman, J. (1998). The Rich Get Richer and the Poor Get Prison: Ideology, Class, and Criminal Justice. Boston: Allyn and Bacon; Western, B., and Beckett, K. (1999). “How Unregulated Is the U.S. Labor Market? The Penal System as a Labor Market Institution,” American Journal of Sociology. 104(4): 1030–1060; Box, S., and Hale, C. (1985), “Unemployment, Imprisonment and Prison Overcrowding,” Contemporary Crises. 9: 209-228; Inverarity, J., and McCarthy, D. (1988), “Punishment and Social Structure Revisited: Unemployment and Imprisonment in the U.S: 1948–1984.” Sociological Quarterly. 29: 263–279; Inverarity, J., and Grattet, R. (1989), “Institutional Responses to Unemployment: A Comparison of U.S. Trends, 1948–1985.” Contemporary Crises. 13: 351–370.
64 Beckett, K., and Western, B., (2001), “Governing Social Marginality: Welfare, Incarceration, and the Transformation of State Policy.” In Garland, D. (ed.) Mass Imprisonment: Social Causes and Consequences. Thousand Oaks, CA: Sage Publications; McGarrell, 1993. Nagel, J. (1982), “The Relationship Between Crime and Incarceration Among the American States.” Policy Studies Review. 2(2): 193–200; Joubert, P., Picou, S., and McIntosh, A. (1981), “U.S. Social Structure, Crime, and Punishment.” Criminology. 19: 344–359.
65 Mauer, M. (2001), “Drug Policy and the Criminal Justice
System.” Washington: D.C.: The Sentencing Project.66 Mauer, M. (2001), “Drug Policy and the Criminal Justice
System.” Washington: D.C.: The Sentencing Project.67 Reiman, J. (1998), The Rich Get Richer and the Poor Get
Prison: Ideology, Class, and Criminal Justice. Boston: Allyn and Bacon.
68 Nagel, W. (1977), “On Behalf of a Moratorium on Prison Construction.” Crime and Delinquency. 1977: 154-172.
69 Colvin, M. (1990), “Labor Markets, Industrial Monopolization, Welfare and Imprisonment.” Sociological Quarterly. 31: 441-457.
70 Beckett, K., and Western, B., (2001), “Governing Social Marginality: Welfare, Incarceration, and the Transformation of State Policy.” In Garland, D. (ed.) Mass Imprisonment: Social Causes and Consequences. Thousand Oaks, CA: Sage Publications., p. 44.
71 Reiman, J. (1998), The Rich Get Richer and the Poor Get Prison: Ideology, Class, and Criminal Justice. Boston: Allyn and Bacon.
72 Feser, E., Sweeney, S. (2003), “Out-Migration, Depopulation, and the Geography of U.S. Economic Distress.” International Regional Science Review. 26(1): 38–67.
73 Burchell, B. (1992), “Towards a Social-Psychology of the Labor-Market – or Why We Need to Understand the Labor Market Before We Can Understand Unemployment.” Journal of Occupational and Organizational Psychology. 65: 345–354.
74 D’Alessio, S., Stolzenberg, L. (2002), “A Multilevel Analysis of the Relationship Between Labor Surplus and Pretrial Incarceration.” Social Problems. 49(2): 178-193; Hochstetler, A., Shover, N. (1997), “Street Crime, Labor Surplus, and Criminal Punishment, 1980–1990.” Social Problems. 44(3): 358–368; Chiricos, T., Delone, M. (1992), “Labor Surplus and Imprisonment: A Review and Assessment of Theory and Evidence.” Social Problems. 39: 421–426.
75 Hagan, J., and Dinovitzer, R. (1999), “Collateral Consequences of Imprisonment for Children, Communities, and Prisoners.” In Tonry M., and Petersilia J. (eds), Crime and Justice: A Review of Research. Chicago: University of Chicago Press.
76 Western, B., Kling, J., and Weiman, D. (2001), “The Labor Market Consequences of Incarceration.” Crime and Delinquency. 47: 410–427.
77 Wilson, W.J. (1987), The Truly Disadvantaged: The Inner City, the Underclass, and Public Policy. Chicago: University of Chicago Press.
78 Richie, B.E. (2001), “Challenges Incarcerated Women Face as They Return to Their Communities: Findings from Life History Interviews.” Crime and Delinquency. 47: 368–369.
79 Fellner, J., Mauer, M. (1998), “Losing the Vote: The Impact of Felony Disenfranchisement Laws in the United States.” Washington, D.C.: Human Rights Watch and the Sentencing Project.
80 Phillips, S., and Bloom, B. (1998), “In Whose Best Interests? The Impact of Changing Public Policy on Relatives Caring for Children with Incarcerated Parents.” Child Welfare. 77: 531–541; Gabel, S. (2003), “Behavioral Problems in Sons of Incarcerated or Otherwise Absent Fathers.” In Harris, O., and Miller, R. (eds.), Impacts of Incarceration on the African American Family. New Brunswick, NJ: Transaction Publishers.
81 Freudenberg, N. (2001), “Jails, Prisons, and the Health of Urban Populations: A Review of the Impact of the Correctional System on Community Health.” Journal of Urban Health. 78: 214–235; Freudenberg, N. (2002), “Adverse Effects of U.S. Jail and Prison Policies on the Health and Well-Being of Women of Color.” American Journal of Public Health. 92(12): 1895–1899.
82 Beckett, K., and Western, B., (2001), “Governing Social

�� TheVortex:TheConcentratedRacialImpactofDrugImprisonmentandtheCharacteristicsofPunitiveCounties
Marginality: Welfare, Incarceration, and the Transformation of State Policy.” In Garland, D. (ed.) Mass Imprisonment: Social Causes and Consequences. Thousand Oaks, CA: Sage Publications, p. 44.
83 The information used in this control comes from the FBI’s county-level index crime rate.
84 Carroll, L., Doubet, M. (1983), “U.S. Social Structure and Imprisonment: A Comment.” Criminology. 21: 449–456.
85 The information used for this control comes from the Census Bureau’s four-category region indicator for each jurisdiction.
86 SAMHSA (2005). Results from the 2002 National Survey on Drug Use and Health: Detailed Tables. Prevalence Estimates, Standard Errors, and Sample Sizes; Johnston, L., O’Malley, P., and Bachman, J. (2003), “Monitoring the Future National Results on Adolescent Drug Use: Overview of Key Findings 2002.” NIH Publication No. 03-5374. Bethesda: MD: National Institute on Drug Abuse.
87 Riley, J. (1997), “Crack, Powder Cocaine, and Heroin: Drug Purchase and Use Patterns in Six U.S. Cities.” Washington D.C.: National Institute of Justice and the Office of National Drug Control Policy; Pennell, S., Ellett, J., Rienick, C., Grimes, J. (1999), “Meth Matters: Report on Methamphetamine Users in Five Western Cities.” Washington, D.C.: Office of Justice Programs, National Institute of Justice.
88 Cole, D. (1999), No Equal Justice: Race and Class in the American Criminal Justice System. New York: The New Press, 1999, p. 8.
89 Beckett, K., and Western, B., (2001), “Governing Social Marginality: Welfare, Incarceration, and the Transformation of State Policy.” In Garland, D. (ed.) Mass Imprisonment: Social Causes and Consequences. Thousand Oaks, CA: Sage Publications, p. 44.
endnoteS
Beatty,Phillip,AmandaPetteruti,andJasonZieden-
berg(�00�).The Vortex: The Concentrated Racial
Impact of Drug Imprisonment and the Characteris-
tics of Punitive Counties. Washington,DC:Justice
PolicyInstitute.
JusticePolicyInstitute ��
about the authors
Phillip Beatty is a Sociologist with a PhD from American University. As a Consul-tant to the Justice Policy Institute since 1999, his data analyses have served as the basis for a number of JPI reports related to drug policy and prison admission rates. Beatty authored and researched several reports concerning drug policy, including Poor Prescrip-tion: The Cost of Imprisoning Drug Offenders in the United States, Cost and Benefits? The Impact of Drug Imprisonment in New Jersey, and Drugs and Disparity: The Racial Impact of Illinois’ Practice of Transferring Young Drug Offenders to Adult Court.
Amanda Petteruti is a researcher and policy analyst with approximately seven years of combined experience in education and criminal justice policy. Early in her career, she organized a writing program for youth at the National Campaign to Stop Violence and provided general support to the National Juvenile Defender Center. Prior to joining the staff of the Justice Policy Institute, she conducted research on issues pertaining to urban education at the Council of the Great City Schools. Petteruti has earned a Master of Arts in education policy and leadership from the University of Maryland College Park and a Bachelor of Arts in sociology from Bates College. Petteruti has contributed to several reports related to education policy and co-authored Education and Public Safety, Employment, Wages and Public Safety, Housing and Public Safety, and Drug Treatment and Public Safety.
Jason Ziedenberg is the co-founder and Executive Director of the Justice Policy Institute, one of the nation’s leading prison reform think tank. His research and policy work on juvenile and criminal justice policy is frequently used by nonprofits, founda-tions, think tanks, law enforcement, community organizations, government, and the media. He has written over a dozen policy briefs and reports that have sought to reduce the inappropriate use of prison for drug offenders, including Maryland’s Man-datory Minimum Drug Sentencing Laws: Their Impact on Incarceration, State Resources and Communities of Color; Proposition 36: Five Years Later; Efficacy and Impact: The Criminal Justice Response to Marijuana Policy in the United States; Treatment or Incar-ceration: National and State Findings on the Efficacy and Cost Savings of Drug Treatment Versus Imprisonment, and Cost and Benefits? The Impact of Drug Imprisonment in New Jersey. He is the recipient of two Media Advocacy Awards from the National Council on Crime and Delinquency for exceptional research and communications work in sup-port of prison reform. Ziedenberg has served on the California Governor’s Juvenile Justice Reform Working Group and the Mayor of Washington DC’s transition team on corrections. He has represented JPI’s research and analysis before the U.S. Congress, state legislators, city and county councils, and various national and state commissions considering juvenile and criminal justice reform. Ziedenberg has a Master in Science from the Columbia University School of Journalism in New York City, and a Bachelor of Arts from the University of Toronto.
acknowledgements
This report would not have been possible without the generous support of the Drug Policy Alliance, the Butler Family Fund, the Open Society Institute, and the Public Welfare Foundation. The report was edited by Bonita Sennott and designed by Lynn Riley Design. JPI staff includes Jason Ziedenberg, Amanda Petteruti, Nastassia Walsh, Laura Jones, LaWanda Johnson, and Debra Glapion.

www.justicepolicy.org