the water footprint of humanity – the global dimension of water management
TRANSCRIPT

The water footprint of humanityThe global dimension of water management
Arjen HoekstraUniversity of Twente, the Netherlands

The total water footprint of the average consumer in the world
3.8% of the water footprint relates to home water use
22% of the water footprint does not lie within the country of the consumer, but other parts of the world
96.2% of the water footprint is ‘invisible’, related to the products bought on the market
91.5% agricultural products, 4.7% industrial products
Source: Hoekstra & Mekonnen (2012) The Water Footprint of Humanity, PNAS
3800 litre/day

► Globalization of water
► The water footprint concept
► WF of a product
► WF of nations
► WF of business
► What can we do?
Overview of presentation

Production
Globalization of water
Water consumption and pollutionrelated to production for export;water is not factored intothe price of traded commodities
Consumption
Water saving, but alsowater dependency
TRADE Trade
Source: Hoekstra & Chapagain (2008) Globalization of Water, Blackwell, Oxford, UK
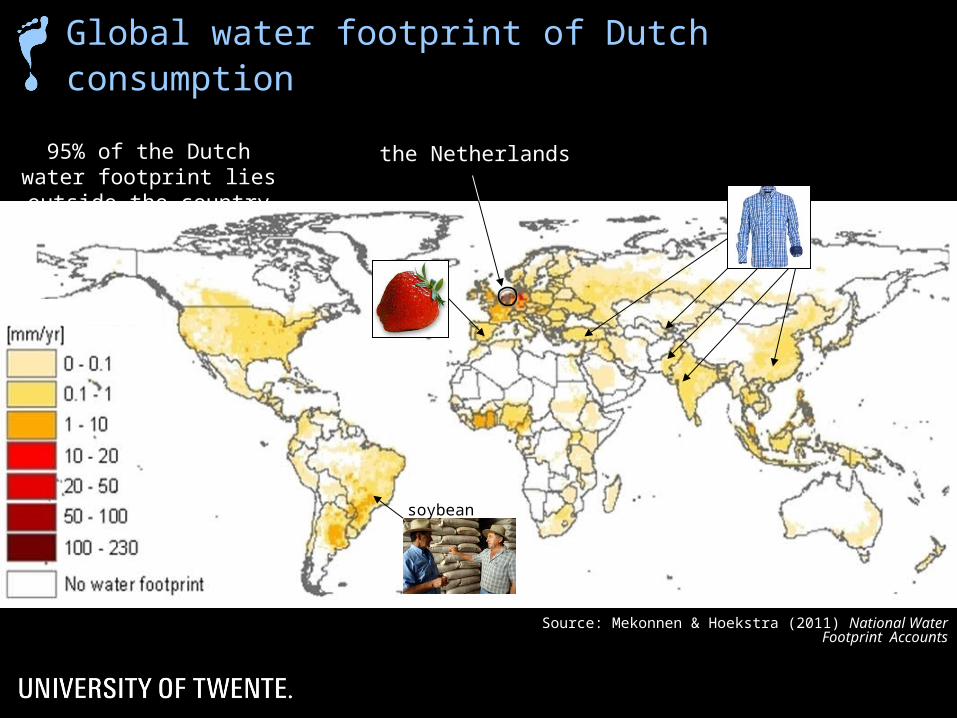
soybean
Global water footprint of Dutch consumption
Source: Mekonnen & Hoekstra (2011) National Water Footprint Accounts
the Netherlands95% of the Dutch water footprint lies outside the country

Cotton for export
19892008
Cotton from the Aral Sea Basin, Central Asia
Source: NASA

Flowers from KenyaDecline of lake level in Lake Naivasha
Source: Mekonnen & Hoekstra (2010)Mitigating the water footprint of export
cut flowers from the Lake Naivasha Basin,Water Resources Management
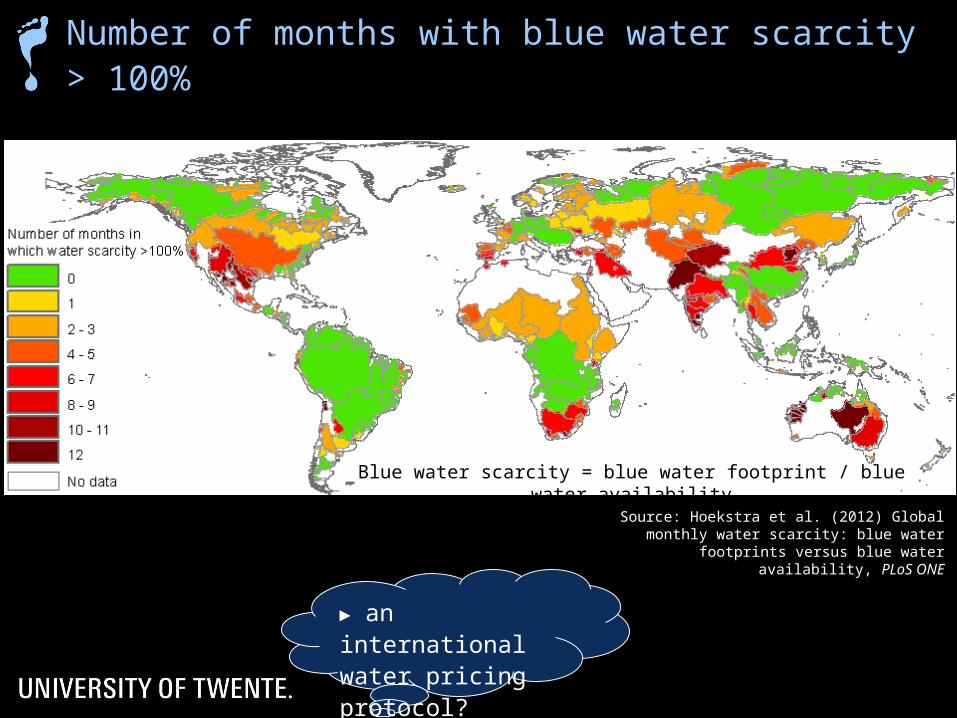
Source: Hoekstra et al. (2012) Global monthly water scarcity: blue water footprints versus blue water availability, PLoS ONE
► an international water pricing protocol?
Number of months with blue water scarcity > 100%
Blue water scarcity = blue water footprint / blue water availability

The water footprintconcept

the volume of fresh water used to produce the product, summed over the various steps of the production chain.
when and where the water was used:a water footprint includes a temporal and spatial dimension.
The water footprint of a product
Source: Hoekstra et al. (2011) The Water Footprint Assessment Manual, Earthscan, London, UK

Green water footprintvolume of rainwater evaporated or
incorporated into a product
Blue water footprintvolume of surface or groundwater
evaporated or incorporated into a product
Grey water footprintvolume of polluted water
The water footprint of a product
Source: Hoekstra et al. (2011) The Water Footprint Assessment Manual, Earthscan, London, UK

Direct water footprint Indirect water footprint
Green water footprint Green water footprint
Blue water footprint Blue water footprint
Grey water footprint Grey water footprint
Waterconsumption
Water pollution
Gross water withdrawal
Traditionalwater usestatistics
Components of a water footprint
Source: Hoekstra et al. (2011) The Water Footprint Assessment Manual, Earthscan, London, UK
Return flow= Net water withdrawal

Grey water footprint
• volume of polluted freshwater that associates with the production of a product in its full supply-chain.
• calculated as the volume of water that is required to assimilate pollutants based on ambient water quality standards.
Source: Hoekstra et al. (2011) The Water Footprint Assessment Manual, Earthscan, London, UK

Grey water footprint
Process
Freshwater body
Load = Effl ×ceffl Abstr × cact
Substance intake = Abstr × cact
Substance output = Effl ×ceffl
Critical load = R (cmax - cnat)
Source: Hoekstra et al. (2011) The Water Footprint Assessment Manual, Earthscan, London, UK

The water footprintof a product
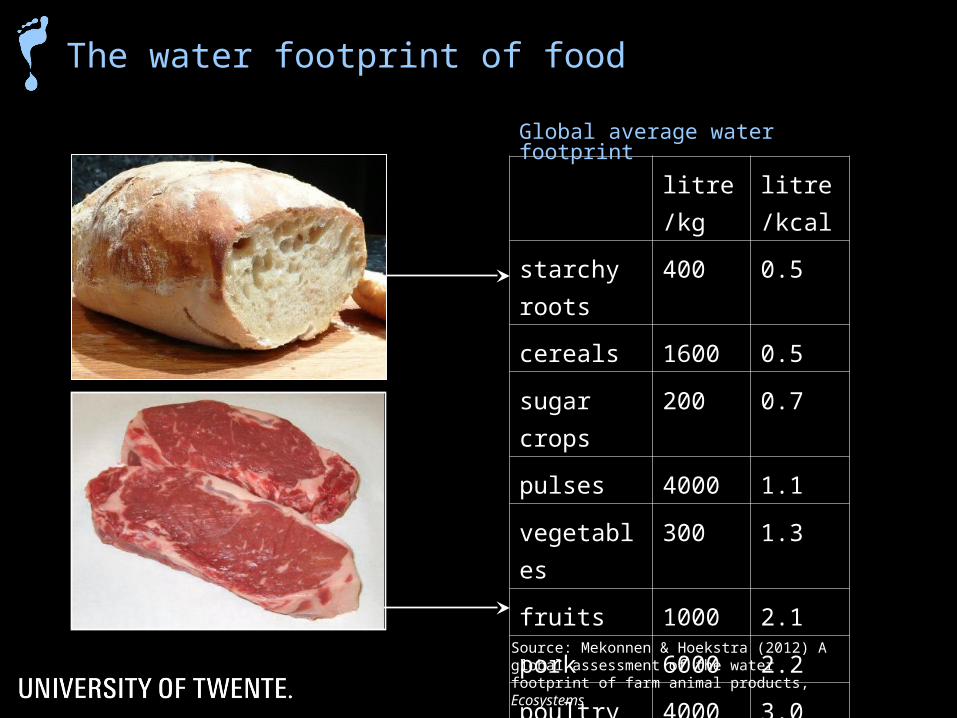
litre/kg litre/kcal
starchy roots 400 0.5
cereals 1600 0.5
sugar crops 200 0.7
pulses 4000 1.1
vegetables 300 1.3
fruits 1000 2.1
pork 6000 2.2
poultry 4000 3.0
beef 15000 10.2
Global average water footprint
The water footprint of food
Source: Mekonnen & Hoekstra (2012) A global assessment of the water footprint of farm animal products, Ecosystems
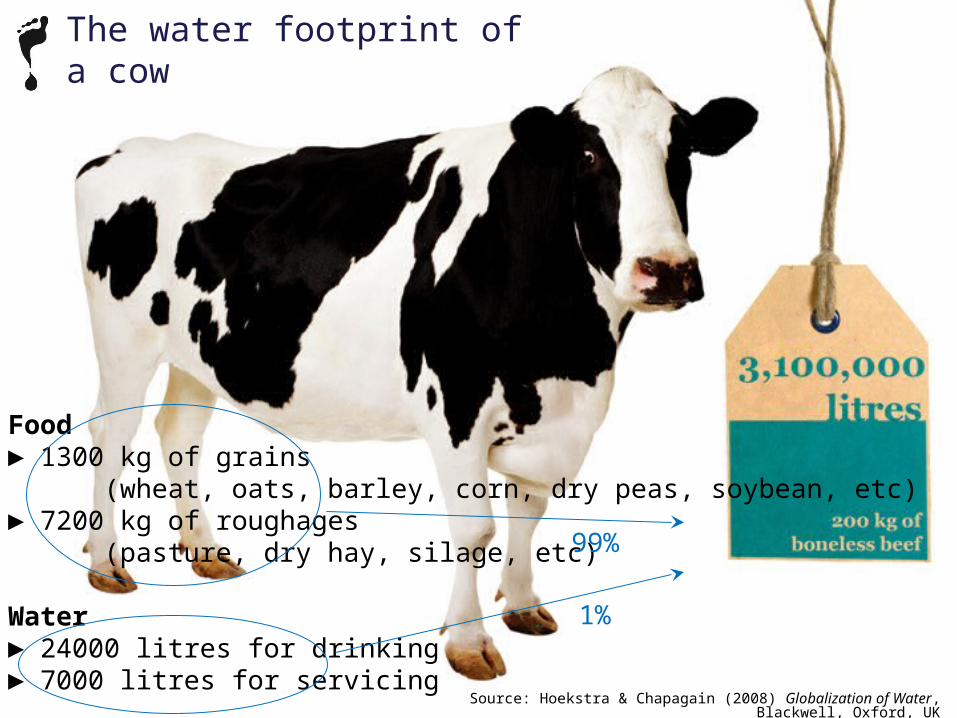
Food► 1300 kg of grains
(wheat, oats, barley, corn, dry peas, soybean, etc)► 7200 kg of roughages
(pasture, dry hay, silage, etc)
Water► 24000 litres for drinking► 7000 litres for servicing
99%
1%
The water footprint of a cow
Source: Hoekstra & Chapagain (2008) Globalization of Water, Blackwell, Oxford, UK

The water footprint of a hamburger
Source: Hoekstra & Chapagain (2008) Globalization of Water, Blackwell, Oxford, UK

Meat versus vegetarian diet
Meat diet kcal/day litre/kcal litre/day Vegetarian diet
kcal/day litre/kcal litre/day
Animal origin
950 2.5 2375 Animal origin
300 2.5 750
Vegetable origin
2450 0.5 1225 Vegetable origin
3100 0.5 1550
Total 3400 3600 Total 3400 2300
Industrialised countries:
Source: Hoekstra (2013) The Water Footprint of Modern Consumer Society, Routledge, London, UK.

Meat versus vegetarian diet
Meat diet kcal/day litre/kcal litre/day Vegetarian diet
kcal/day litre/kcal litre/day
Animal origin
950 2.5 2375 Animal origin 300 2.5 750
Vegetable origin
2450 0.5 1225 Vegetable origin
3100 0.5 1550
Total 3400 3600 Total 3400 2300
Industrialised countries:
Source: Hoekstra (2013) The Water Footprint of Modern Consumer Society, Routledge, London, UK.

Source: Mekonnen & Hoekstra (2011)The green, blue and grey water footprint of crops and derived
crop products, Hydrology and Earth System Sciences
► coherent energy-water strategies?
Car driving on bio-ethanol from sugar beet:20-300 litre/km
Water footprint of biofuels from different crops [litre/litre]

Water footprint of nations

The spatial distribution of the water footprint of humanity
Source: Hoekstra & Mekonnen (2012) The Water Footprint of Humanity, PNAS

► WTO trade rules?
National virtual water balances
Arrows show gross virtual water flows >15 Gm3/yr
Source: Hoekstra & Mekonnen (2012) The Water Footprint of Humanity, PNAS

Global average water footprint
► global water footprint reduction targets?
► a Kyoto protocol for water?
Water footprint of national consumption
Source: Hoekstra & Mekonnen (2012) The Water Footprint of Humanity, PNAS

Consumption
Export
Production
= +Internalwater
footprint
Water footpr. of national
consumption
External water
footprint
Virtual water budget=
=
+
++ +
= =
= +Virtualwaterexport
Water usefor export
Virtual water import for re-
export
Water footprint
within nation
Virtualwaterimport
Import
Focus of traditionalwater use statistics
(and within that focus a limitation to blue water withdrawals)
National water footprint accounting framework
Source: Hoekstra et al. (2011) The Water Footprint Assessment Manual, Earthscan, London, UK

Northwest Northeast
Huang-huai-hai North-central
North China
Yangtze Southeast
Southwest South-central
South China
14
10
Import =2
Import =1
Export =2
Import =3
Export =1 Import =8
Export =7
Export =9
Unit: Gm3/yr
52Gm3/yr
Sources: Ma et al. (2006), Hoekstra & Chapagain (2008)
► revisit large water transfer projects?
Virtual water transfers in China
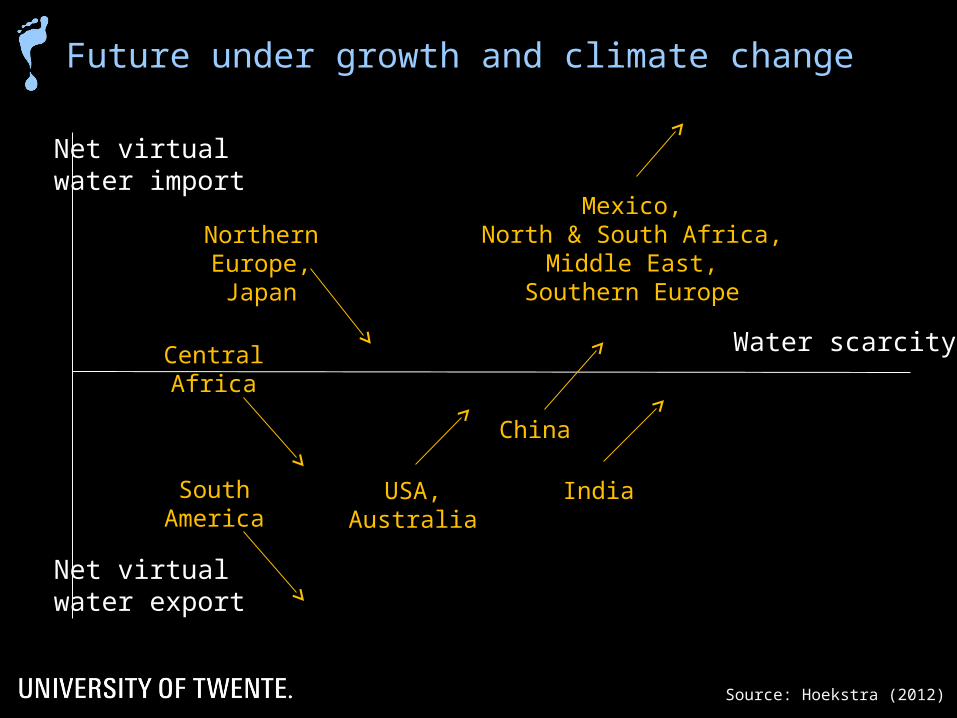
Future under growth and climate change
Water scarcity
Net virtualwater export
Net virtualwater import
China
NorthernEurope,Japan
IndiaSouthAmerica
Mexico,North & South Africa,
Middle East,Southern Europe
USA,Australia
Source: Hoekstra (2012)
CentralAfrica
The water footprintof business

The Coca Cola Company
New Delhi, 4 Oct 2006

Water footprint of a 0.5 litre PET-bottle cokeas produced in the Dongen factory, the Netherlands
0.44 litre water content27.6 litre for sugar5.3 litre for PET bottle and closure3.0 litre for other ingredients & overheads___________________36 litre total
Water footprint of a Coke

Water risks for business• Physical risk• Reputational risk• Regulatory risk• Financial risk
Water opportunity for business• frontrunner advantage• corporate image
Corporate social responsibility
Water footprint: why businesses are interested
• From focus on own operations to supply-chain thinking
• From focus on water withdrawals toconsidering consumptive water use
• From securing the ‘right to abstract’ toassessing environmental & social implicationsof the company’s direct & indirect water use
• From meeting ‘emission permits’ toassessing the company’s contribution to pollution
Water footprint: what’s new for business

What can we do?

► Towards full water recycling in industries: zero blue water footprint► Towards full recycling of materials and heat: zero grey water footprint
Water footprint reduction: what can we do?
► Make rainwater more productive: lower green water footprint► Towards supplementary or deficit irrigation & application of precision irrigation techniques: lower blue water footprint► Towards organic or precision farming: zero grey water footprint
Industry
Agriculture

Shared terminology & calculation standards
– Global Water Footprint Standard
Product transparency– water footprint reporting / disclosure
– labelling of products
– certification of businesses
Quantitative footprint reduction targets– benchmarking
Reducing humanity’s water footprint – Companies
The Water Footprint Assessment Manual Earthscan, London, UK, 2011
► product labeling?► certification of industries?► water disclosure?
► global water footprint reduction targets?
► WTO trade rules?
► an international water pricing protocol?
► coherent energy-water strategies?
International water governance

Mission: Promoting sustainable, equitable and efficient water use through development of shared standards on water footprint accounting and guidelines for the reduction and offsetting of impacts of water footprints.
Network: bringing together expertise from academia, businesses, civil society, governments and international organisations.
The Water Footprint Network

Overview of partners Water Footprint Network
Partners by category
XL company 30
Large company 10
Medium company 23
Small company 33
Government 10
International organisation 9
Academic Institute 29
Civil society / ngo 25
www.waterfootprint.org
www.waterfootprint.org

www.waterfootprint.org