the waterbase limited presentation june, 2017.… · companies outside india, and unauthorized use...
TRANSCRIPT
The Waterbase Limited
Corporate Presentation – June, 2017

Contents
Safe Harbour Statement:
Certain statements in this presentation concerning our future plans and strategies growth prospects, etc. are forward looking statements, which involve a number of risks and uncertainties that could cause actual results to differ materially from those indicated in such forward-looking statements. The risks and uncertainties relating to these statements include, but are not limited to, fluctuations in earnings, our ability to manage growth, competitive intensity in our industry of operations including those factors which may affect our cost advantage, wage increases, our ability to attract and retain highly skilled professionals, sufficient availability of raw materials, our ability to successfully complete and integrate potential acquisitions, liability for damages on our contracts to supply products, the success of the companies in which TWL has made strategic investments, withdrawal of governmental fiscal incentives, political instability, legal restrictions on raising capital or acquiring companies outside India, and unauthorized use of our intellectual property and general economic conditions affecting our industry. TWL may, from time to time, make additional written and oral forward-looking statements, including those in our reports to shareholders. The Company does not undertake to update any forward-looking statement that may be made from time to time by or on behalf of the company
2
Industry Overview
Financial Overview
33
FY17 – Performance Updates
37
Industry Trends
40
Scheme of Amalgamation - Transaction Highlights
Growth Strategy
Company Overview
23
19
11
3

Company Overview

TWL – At a Glance
4
Yrs. In
the Industry
Debt – Equity
As of
Mar 2017
Feed Capacity post
Amalgamation of PFL
Revenue
CAGR
FY12>17
Shrimp Exports in FY17
Estimated size of
Domestic Shrimp feed Industry
Employees
Revenues
in
FY17
#Dealers
Pan India Presence
Mkt. share
(Domestic)

Locations
Registered office and factory
• Ananthapuram Village,
T.P. Gudur Mandal,
Nellore – 524 344,
Andhra Pradesh.
Corporate Office
• No. 37, Thapar House,
Montieth Road, Egmore,
• Chennai – 600 008
Group Corporate Office
5
Corporate Office
Factory
Delhi
Kolkata
Nellore
• Delhi • Kolkata Chennai

• Several popular brands which are favoured by shrimp farmers
• Enjoy high recall and are seen to be synonymous with quality and value
• Over two decades of expertise in the business- strong connect with suppliers and farmers
• Backed by the KCT Group – has inculcated ethical business practices with long-term vision in mind
Key Strengths
Strong Brands
Rich Legacy
• Robust manufacturing processes and step by step quality control system
• Processing facilities are FDA and BAP approved, EU listed and HACCP certified
• Global best practices implemented
• Working with renowned research institutions in India
and abroad for the benefit of industry
• R&D initiatives have been meaningfully converted into new products
• Have driven improvements in feed manufacturing, farm practices, waste management, shrimp processing
Quality Control
R&D Focused
• TWL enjoys unparalleled technical expertise in the industry as the Pioneer
• Staffed by well-qualified personnel with rich industry experience
• Products, processes, practices are viewed as
gold standard by industry
Technical Expertise
• Comfortable debt levels with a debt equity ratio of 0.2 and Net Debt / EBITDA of ~ 0.6x
• Demonstrated financial discipline through good and bad years for industry
Financial Position `
6

Product Portfolio
7
Processed Shrimp
Shrimp Feed
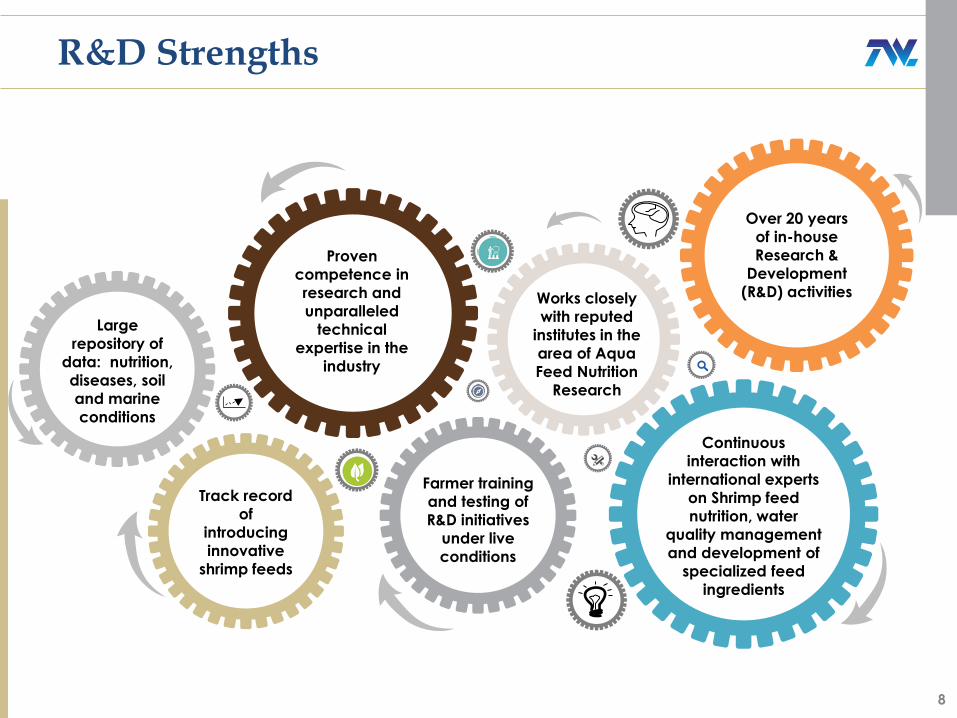
R&D Strengths
8
Track record
of
introducing
innovative
shrimp feeds
Proven
competence in
research and
unparalleled
technical
expertise in the
industry
Farmer training
and testing of
R&D initiatives
under live
conditions
Works closely
with reputed
institutes in the
area of Aqua
Feed Nutrition
Research
Continuous
interaction with
international experts on Shrimp feed
nutrition, water
quality management
and development of
specialized feed
ingredients
Over 20 years
of in-house
Research &
Development
(R&D) activities
Large
repository of
data: nutrition,
diseases, soil
and marine
conditions

Awards & Accolades
• Bagged “2016 India Shrimp Feed Industry
New Product Innovation Leadership Award” by Frost & Sullivan a leading global
strategy consulting company
• Frost & Sullivan’s, 2016 New Product
Innovation Leadership Awards identified
companies that demonstrated measured
excellence in new, innovative products or
product lines within their industry
• The award was judged on the basis of
several parameters, which involved in-
depth primary interviews with various
industry participants and secondary
research conducted by Frost & Sullivan
analysts
9
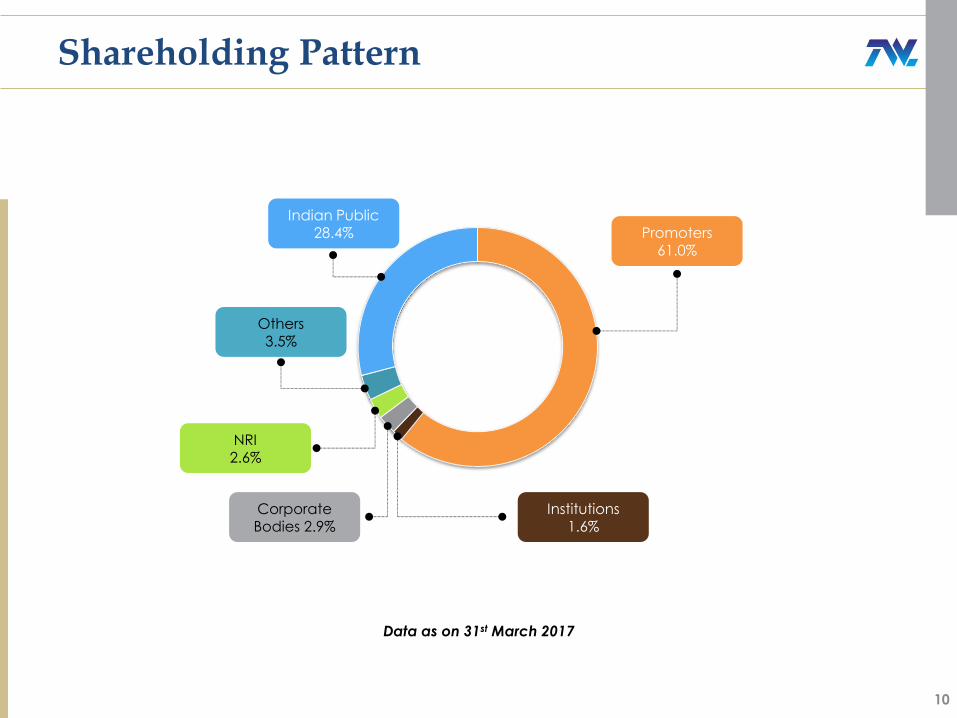
Shareholding Pattern
10
Data as on 31st March 2017
Institutions 1.6%
Corporate Bodies 2.9%
NRI 2.6%
Others
3.5%
Indian Public 28.4% Promoters
61.0%

Restructuring of Promoter Holdings
• Four entities forming part of the promoter group of TWL, transferred their holding amounting to 1.59% of the share capital inter-se to Karam Chand Thapar and Bros (Coal Sales) Limited
– The Punjab Business & Supply Company Private Limited,
– The Doaba Industrial & Trading Company Private Limited,
– Karam Chand Thapar and Bros (Jammu & Kashmir) Private Limited
– Indian City Properties Limited
• Thereafter, all the Shares held by Karam Chand Thapar and Bros (Coal Sales) Limited amounting to 56.83% of the share capital has been transferred to Nav Srijit Shakti
Telangana Private Limited which is controlled by the same set of shareholders as Karam Chand Thapar and Bros (Coal Sales) Limited and is the part of Promoter Group of the Company
• Overall shareholding of Promoters & Promoter Group prior to the above transactions and pursuant to these transactions shall remain unchanged; 61.01% of the share capital of TWL
• Transactions part of the ongoing restructuring and consolidation which envisages the creation of a Trust which will ultimately hold all the shares of TWL currently held by the Promoter and Promoter Group in TWL
11

Growth Strategy
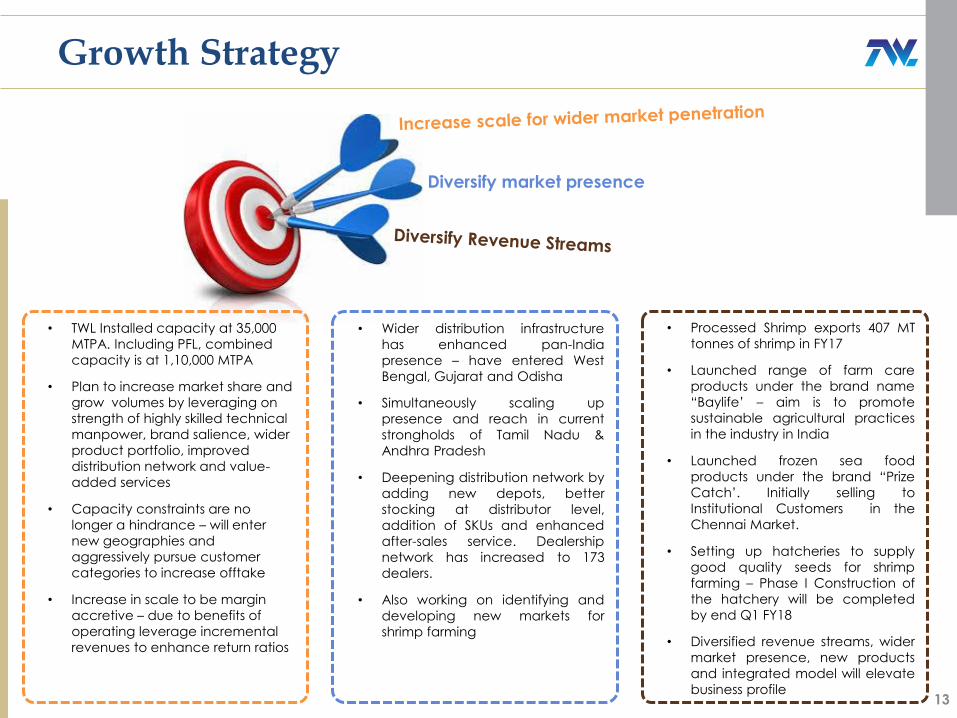
• TWL Installed capacity at 35,000
MTPA. Including PFL, combined
capacity is at 1,10,000 MTPA
• Plan to increase market share and
grow volumes by leveraging on
strength of highly skilled technical
manpower, brand salience, wider
product portfolio, improved
distribution network and value-
added services
• Capacity constraints are no
longer a hindrance – will enter
new geographies and
aggressively pursue customer
categories to increase offtake
• Increase in scale to be margin
accretive – due to benefits of
operating leverage incremental
revenues to enhance return ratios
Growth Strategy
13
• Wider distribution infrastructure
has enhanced pan-India
presence – have entered West
Bengal, Gujarat and Odisha
• Simultaneously scaling up
presence and reach in current
strongholds of Tamil Nadu &
Andhra Pradesh
• Deepening distribution network by
adding new depots, better
stocking at distributor level,
addition of SKUs and enhanced
after-sales service. Dealership
network has increased to 173
dealers.
• Also working on identifying and
developing new markets for
shrimp farming
Diversify market presence
• Processed Shrimp exports 407 MT
tonnes of shrimp in FY17
• Launched range of farm care
products under the brand name
“Baylife’ – aim is to promote
sustainable agricultural practices
in the industry in India
• Launched frozen sea food
products under the brand “Prize
Catch’. Initially selling to
Institutional Customers in the
Chennai Market.
• Setting up hatcheries to supply
good quality seeds for shrimp
farming – Phase I Construction of
the hatchery will be completed
by end Q1 FY18
• Diversified revenue streams, wider
market presence, new products
and integrated model will elevate
business profile

Vertical & Horizontal Integration
14
Hatchery Farming Processing Finished Product
(Shrimp)
KEY INPUTS
Shrimp Feed
Water (Power)
Labour
Farm Care Products
Exports
Domestic Market
New Growth Areas
Estimated Current Size of Industry FY 17
500 (No. of hatcheries
in India)
125,000 Ha under
Farming
400 Processing Plants for shrimp
4,00,000 MT
Estimated Industry Requirement / Potential for FY 18
40 Billion of Post Larvae (PL)
Requires 8,00,000 MT of Shrimp Feed
1,000,000 MT (Current Capacity)
4,40,000 MT
TWL Capacity Hatchery
/ 500 Mn PL 1,10,000 MT1 4,000 MT 407 MT
Segment
1. Capacity of TWL post amalgamation of Pinnae Feeds Ltd.

New Initiatives – Farm Care Products
Probiotics Vitamins & Minerals
Healthcare Disinfectants
15

Category Name Function
1 Probiotics VC-9 Farm Probiotic for
Vibrio control
2 Probiotics NutriPond Promotes growth of good bacteria
3 Probiotics NutriFeast Builds Immunity
4 Healthcare NutriGut Protects Gut
5 Ammonia Binder NutriSorb Absorbs
Ammonia
New Initiatives – Farm Care Products
16

• Phase I – Soft launch in Chennai in Dec 2016 with the brand ‘Prize Catch’ • Launched Processed Shrimps and Pasteurised Crab meat
• Phase II – Plan to scale up launch in other Southern markets
• Plan to add other products to widen product range
• Aiming for differentiated offering with a focus on quality and freshness – Initially will
focus on institutional (HORECA) sales
New Initiatives – Domestic Market Foray
17

Enhancing Brand Awareness
18
Shop Signage Instore

Marketing & Distribution Initiatives
19
Dealer Meets Farmer Meets

Scheme of Amalgamation - Transaction Highlights

Swap Ratio: 4:17; TWL to issue 4 fully paid up equity share for every 17 equity
shares held by shareholders in PFL
Appointed Date of Scheme: 1st August 2015
Completion Date (expected): Q2 FY18
Basis of Valuation: Net Assets Valuation (NAV) method and Discounted Cash
Flow (DCF) methods used to arrive at fair value of assets
Weightage of 1:4 for NAV: DCF - incorporates the value in the books as well as
the potential return that can be generated from these assets
Illiquidity discount applied to PFL and valuation of PFL takes into
consideration the various qualitative factors relevant to each company and
the business dynamics and growth potentials of the business
Transaction Details
Advisors
Shareholders – Significant Value Creation
Scheme Consultant: KPMG
Fairness Opinion: Saffron
Capital Advisors Pvt Ltd.-
Category I Merchant
Bankers
Valuation Report: SSPA &
Co., Chartered
Accountants
Benefits to Minority Shareholders
Tripling of capacity without cash outgo
/ additional investment
TWL was operating at full capacity –
PFL was setup to create capacity at
competitive cost – streamlining to offer
synergies for growth
Value accretive for all shareholders -
minority to witness limited dilution
relative to capacity added
Total No. of Shares
Equity
Capital
Pre -
Amalgamation
3.86 cr shares
Pre-Amalgamation Post-Amalgamation
Prom-
oter
64.3%
Non
Promo
-ter
35.7%
~3.9 Crore ~4.1 Crore
TWL
PFL 1.12 cr shares
Number of shares
of TWL to be issued
for shares of PFL
28.2
TWL’s equity
Capital post
amalgamation 4.14 cr shares
lakh shares of
Rs.10 each
Promote
r,
61.0%
Non
Promote
r
39.0%
21
The Scheme of Amalgamation of Pinnae Feeds Ltd. with the Company has
reached the final stage and at the hearing held on 15th March 2017 the National
Company Law Tribunal (NCLT) had posted the matter for orders. Subsequently
on 5th June 17 the NCLT has sought certain clarifications / documents and has
given 2 weeks time to furnish the same.
Current Status
Transaction Highlights

• Pinnae Feeds Ltd., belongs to the same promoter Group
• Incorporated in: July, 2012
• Objective: To meet capacity expansion plans for the Feed manufacturing business
• Expansion could not be undertaken within TWL due to restrictions placed by one of the lenders
Background - Pinnae Feeds Limited
22
Location :
• Manufacturing unit located at Nellore, Andhra Pradesh
• ~70 Kms away from TWL’s factory in Nellore
Producer of shrimp feeds :
• Expansion undertaken in 2 phases; Phase I completed in FY15 capacity of 40,000 MTPA and Phase II which was completed in FY16 comprised the balance capacity of 35,000 MTPA
• Commenced commercial operation in H2FY15
• Post completion of Phase II - Capacity of 75,000 MTPA is now fully operational
Financials :
• Revenues of Rs. 129 crore in FY17 from supply of feed to TWL
• Gross Block - Rs. 48.9 crore
• As of March 31, 2017 - Debt: Rs. 44.1 crore (including term loans as well as working capital)
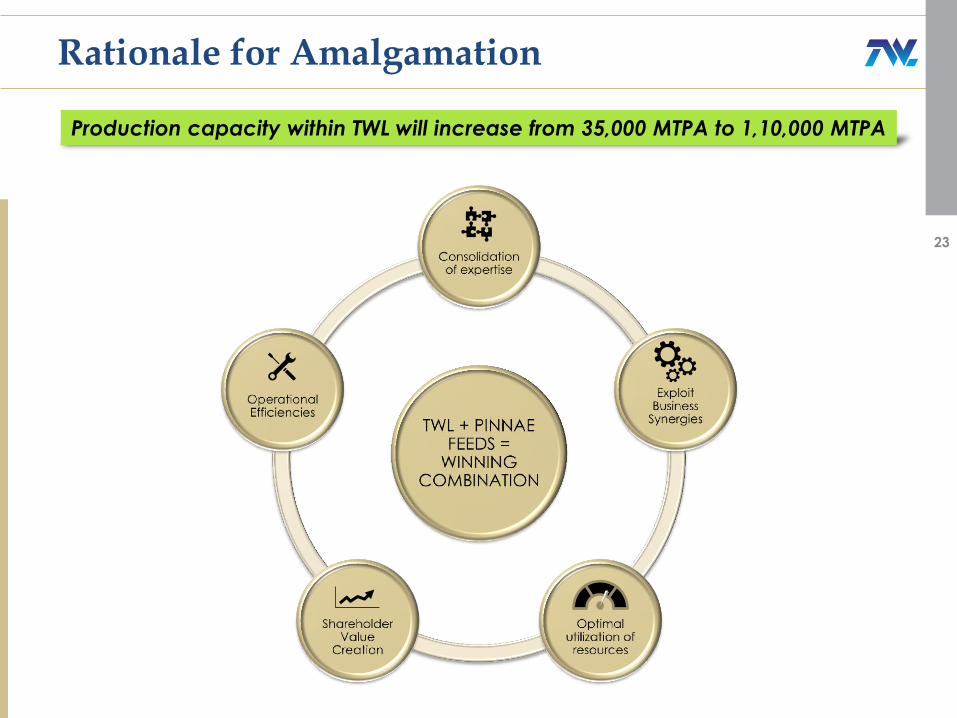
Rationale for Amalgamation
23
Production capacity within TWL will increase from 35,000 MTPA to 1,10,000 MTPA

Industry Overview

• Seafood production is expected to increase
from 130mn tonnes in 2,000 to ~170mn tonnes
in 2030
• Within this, the share of wild catch is expected
to remain stable and incremental volumes are
expected largely from aquaculture (farmed
production)
• Growth in aquaculture projected at 134% over
2000-2030 by the Food & Agriculture
Organisation (FAO) of the United Nations
Demand for seafood is rising globally
25
Shrimp is the largest single seafood commodity in value terms
Shrimp production is growing at over 5% annually and production volumes are estimated at
4.5 mn tonnes annually
Sought after for nutritional properties and high quality of proteins
Farmed shrimp contributes more than half of total annual production ~55% since the mid –
2000s
0
50
100
150
200
2000 2010e 2020e 2030e
Total seafood production
in million tonnes
Aquaculture Wild Catch
Source: http://ww.fao.org/docrep/009/A0699e/A0699E09.htm

Shrimp Aquaculture Production by World Region
26
Sources: FAO (2016) for 1995-2011; FAO (2016) and GOAL (2014) for 2012-2014; GOAL (2016) for 2014-2018.
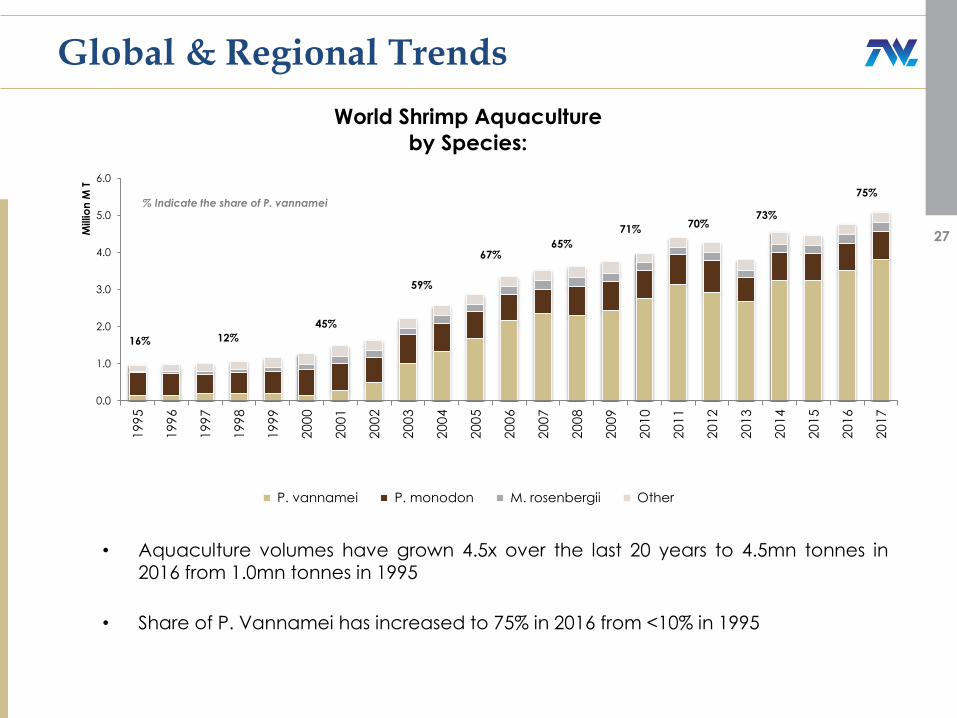
• Aquaculture volumes have grown 4.5x over the last 20 years to 4.5mn tonnes in 2016 from 1.0mn tonnes in 1995
• Share of P. Vannamei has increased to 75% in 2016 from <10% in 1995
Global & Regional Trends
0.0
1.0
2.0
3.0
4.0
5.0
6.0
199
5
199
6
199
7
199
8
199
9
200
0
200
1
200
2
200
3
200
4
200
5
200
6
200
7
200
8
200
9
201
0
201
1
201
2
201
3
201
4
201
5
201
6
201
7
Millio
n M
T
World Shrimp Aquaculture
by Species:
P. vannamei P. monodon M. rosenbergii Other
12%
45%
59%
67% 65%
71% 70%
73%
75%
16%
% Indicate the share of P. vannamei
27
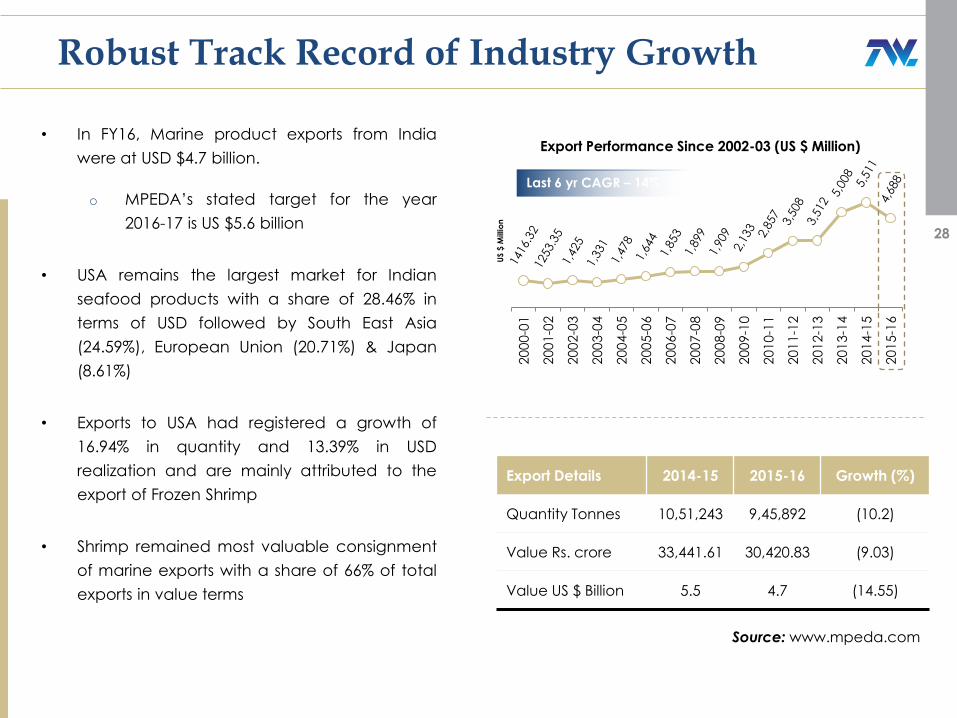
Robust Track Record of Industry Growth
• In FY16, Marine product exports from India
were at USD $4.7 billion.
o MPEDA’s stated target for the year
2016-17 is US $5.6 billion
• USA remains the largest market for Indian
seafood products with a share of 28.46% in
terms of USD followed by South East Asia
(24.59%), European Union (20.71%) & Japan
(8.61%)
• Exports to USA had registered a growth of
16.94% in quantity and 13.39% in USD
realization and are mainly attributed to the
export of Frozen Shrimp
• Shrimp remained most valuable consignment
of marine exports with a share of 66% of total
exports in value terms
28
200
0-0
1
200
1-0
2
200
2-0
3
200
3-0
4
200
4-0
5
200
5-0
6
200
6-0
7
20
07
-08
200
8-0
9
200
9-1
0
201
0-1
1
201
1-1
2
201
2-1
3
201
3-1
4
201
4-1
5
201
5-1
6
US $
Millio
n
Export Performance Since 2002-03 (US $ Million)
Last 6 yr CAGR – 14%
Export Details 2014-15 2015-16 Growth (%)
Quantity Tonnes 10,51,243 9,45,892 (10.2)
Value Rs. crore 33,441.61 30,420.83 (9.03)
Value US $ Billion 5.5 4.7 (14.55)
Source: www.mpeda.com

Driven by strong growth in Shrimp Exports
29
• Shrimp exports continue to report tremendous
growth with a CAGR of ~18% in volume terms and
27% in value terms in the last 3 years
• Frozen shrimp continued to be the largest item in
the export basket in terms of quantity and
registered growth of 4.6% y-on-y in FY2015-16 –
lone bright spot despite a fall in overall marine
exports
• The overall export of shrimp during 2015-16 stood
at 3,73,866 MT valued at Rs, 20,046 crore ($3.1
billion)
• The export of Vannamei stood at 2,56,699 MT
recording a growth of ~16% in volumes on a y-on-y
basis
• Due to the declining levels of wild shrimp and
preference for vannamei, as indicated in charged
mix in exports, the focus is increasing on farmed
products Frozen
Shrimps
66%
Frozen
Fish
11%
Frozen
Cephol
opods
10%
Frozen
Others
6%
Non-
frozen
7%
Value Contribution
Frozen
Shrimps
39%
Frozen
Fish
24%
Frozen
Cephol
opods
16%
Frozen
Others
12%
Non-
frozen
9%
Volume Contribution

Shrimp Exports
30
USA +19%
2015 2016
112,702 MT 134,144 MT
32% 36%
Japan +12%
2015 2016
30,434MT 34,204MT
9% 9%
South
East Asia
2015 2016
69,068MT 65,188MT
19% 17%
EU < >
2015 2016
81,952MT 81,849MT
23% 22%
Source: MPEDA

India has
abundant
coastline and
its climatic
conditions are
favorable for
shrimp farming
Abundant farm
labour at
reasonable
cost,
availability of
other inputs
such as land
and power and
sustained high
levels of
productivity
have enabled
India to be
competitive
The industry is
governed by
MPEDA and
CAA and the
regulatory
framework. This
is seen as a key
factor which
helped India to
avert disease
which
impacted
industry growth
in neighboring
South-east
Asian countries
The
introduction of
the L.
Vannamei
species altered
the dynamics
of shrimp
farming
through a
significant shift
in economic
viability of
farms
Erstwhile key
suppliers like
Thailand and
Vietnam were
affected by
breakout of
EMS, leading to
disruption in
global supply
thereby
providing a
window of
opportunity to
Indian farmers
& exporters
Global prices
for Vannamei
shrimp have
been at
sustained high
levels since
past few years
which has
helped the
industry/opport
unity to be
more lucrative
Factors behind Success of Shrimp Farming in India
31
Supply Disruptions In
Thailand & Vietnam
Attractive Prices
Changing of Species
Active Regulatory
Setup
Availability Of Resources
Favorable Topography

Diseases, weather patterns,
fluctuating prices add to
the unpredictability of the
industry
Inconsistent supply and rising
cost of major ingredients of
shrimp feed such as soya
and fish meal
Access to quality broodstock and seeds
which are key inputs to farming are
impediments to faster and sustainable
growth – the poor quality of inputs is
impacting yields and sustainability
Due to its nature it is difficult to regulate and ensure industry –wide implementation of standards. The unorganized structure also leads to
challenges in financing, insurance and supply of labor
Key Challenges
32
Risks
Raw Material Inflation
Quality of Inputs
Fragmented Industry

Growth Drivers
Aquaculture is more cost effective compared to
agriculture/animal husbandry
Income Growth
Massive shift in Freshwater
farming to Vannamei
Increasing consumption of fast food
products world over
Rapid switchover to Vannamei
in less converted states
Rise of protein consumption
in the Indian diet
Limited natural resources & growing population
Rise in per capita income
Increasing preference
for cosmopolitan
food
Adoption of new technology
Very high return, short crop
period leading to
rapid expansion
Increasing global
demand for
shrimps
33
Financial Overview

5.6 6
13.6 19.5
1.01 12.3
5.4% 3.8%
6.0% 7.0%
0.4%
3.3%
-5.0%
0.0%
5.0%
10.0%
15.0%
0
10
20
30
40
FY12 FY13 FY14 FY15 FY16 FY17
PAT Margins
10.5 11.6 23.3
32.0
7.6
24.9
10.1%
7.4%
10.1% 11.4%
2.5%
7.5%
-5.0%
0.0%
5.0%
10.0%
15.0%
0
10
20
30
40
FY12 FY13 FY14 FY15 FY16 FY17
EBITDA Margins
6.8 7.6
20.4 30.2
4.8
19.1
6.6% 4.8%
8.9% 10.8%
1.6%
5.8%
-5.0%
0.0%
5.0%
10.0%
15.0%
0
10
20
30
40
FY12 FY13 FY14 FY15 FY16 FY17
PBT Margins
Financial Performance
35
(in
C
r)
(in
C
r)
5 year CAGR : 26.3%
Revenues
FY 16 financials were impacted due to Flooding and OTS with one of company’s banks.
FY16 & FY17 numbers are based on Ind-AS. All other numbers are based on Ind - GAAP
103.5
157.0
228.2
277.6
299.8 331.9
FY12 FY13 FY14 FY15 FY16 FY17

10.4 10.0
15.7
19.7
1.0
11.1
FY12 FY13 FY14 FY15 FY16 FY17
Return on net worth (%)
Key Financials
21.1 23.4 22.5
25.7 25.6 28.8
FY12 FY13 FY14 FY15 FY16 FY17
Book value per share (Rs.)
36
12.3 12.3
23.8
29.6
5.3
16.8
FY12 FY13 FY14 FY15 FY16 FY17
Return on Capital Employed (%)
2.2 2.3
4.4
5.1
0.4
3.3
FY12 FY13 FY14 FY15 FY16 FY17
Earnings Per Share
(in
C
r)
(in
C
r)
FY 16 financials were impacted due to Flooding and OTS with one of company’s banks.
FY16 & FY17 numbers are based on Ind-AS. All other numbers are based on Ind - GAAP

Key Financials
37
54.2 60.3
86.7
99.2 98.9
111.2
FY12 FY13 FY14 FY15 FY16 FY16
Net Worth
0.3
0.5
0.1 0.1 0.1
0.2
FY12 FY13 FY14 FY15 FY16 FY17
Debt Equity Ratio
(in
C
r)

Q4 & FY17 Performance Update

Q4 & FY17 - Financial Performance
Particulars Q4
FY17
Q4
FY16
Growth
(%) FY17 FY16
Growth
(%)
Income from Operations 62.5 55.8 12.0% 331.9 299.8 10.7%
EBITDA 2.1 (1.5) 234.4% 24.9 7.60 228.7%
EBITDA Margin (%) 3.3% -2.7% +611 bps 7.5% 2.5% +500 bps
PAT 0.8 (1.9) 142.0% 12.3 1.0 1130.0%
PAT Margin (%) 1.2% -3.4% +467 bps 3.7% 0.3% +337 bps
INR Cr.
Revenue growth for FY17 on account of strong first half with healthy volume growth. Positive response in newer markets like Gujarat, West Bengal & Odisha with firm realisations
Operational profitability in FY16 impacted by one-time developments. FY17 has rebounded strongly and could have been even better but for certain one-time expenses as well as high costs of inputs at start of year.
PAT for FY17 has rebounded strongly and could have been even better but for some one-time expenses. Wider distribution network and new products
to drive growth going forward
Volumes for Farming season 2017 have started strongly surpassing the strong start of farming season 2016. Improved presence in new markets as well as existing strongholds supported by marketing efforts and new product lines should sustain the growth momentum
As per Ind –AS
39

Business Update
40
Feed Business
• Healthy volume growth in start of the season – demand could not be sustained in latter part of season due to widespread impact of disease
• Encouraging performance from new markets – expansion of dealer network continues
• Launched Baywhite Enriched in FY 2016 , helped in gaining share
• Obtained BAP certification for Feed Plant in FY 2016
Processing & Exports
• After the floods, Export operations were suspended in Nov 2015 and restarted in June 2016
• Facelift was given to the facility, Repairs and Maintenance were carried out during the shut down - Basic soft and hard infrastructure was put in place
• Exported 407 tonnes to US, EU & Vietnam in FY17
• Disease has impacted availability of farmed shrimp for processing and exports – farm gate prices continued to increase post contracting of supply orders
• Low Productivity and machine breakdowns forced TWL to outsource processing to expedite execution of pending orders
Other Revenue Streams
• TWL has forayed into sale of processed seafood in the domestic market in Dec 2016 – currently offers frozen shrimps and Pasteurized Crab Meat under the ‘Prize Catch’ brand to Institutional Customers in the Chennai market – to expand to other cities in South India shortly
• TWL has launched its range of farm care products under the ‘Bay Life’ brand
• Phase I of the Hatchery Construction will be completed by end of June 2017

Industry Trends & Outlook

Domestic Market Trends
• Strong start to Farming season 2017 – Weather conditions have been favorable and lot of new areas have been brought under shrimp farming.
• Feed Raw material prices have corrected significantly - Bumper soya crop of last year
and lower export have resulted in reduction in the prices. Fish meal prices too have softened in the past few months.
• Heightened competitive intensity sustains – Discounts and extensive credit being offered by new players who are attempting to challenge established names
• Farm gate prices on a slide - The farm gate prices, which were steady for the whole of last year, started sliding down from end of April 2017. it is to be seen whether prices will further slide in the coming months, as the harvest season begins.
42
Q1 and Q2 are seasonally strong quarters – the pre-season has started well and indications are that activity levels will rise significantly as farmers shake off the subdued previous season which was impacted by drought, disease and demonetization.
Outlook
43
For more information about us, please visit www.waterbaseindia.com OR contact:
G. Venkatram (CS & CO)
The Waterbase Limited
Phone: +91 44 30127009 Extn: 202
Email: [email protected]
Mayank Vaswani / Suraj Digawalekar
Citigate Dewe Rogerson (CDR India)
Phone : +91 22 6645 1230 / 1235
Email: [email protected]
Thank You