the welsh tax base - wcpp
TRANSCRIPT

The Welsh Tax Base
Risks and Opportunities after Fiscal Devolution
Guto Ifan and Dr Ed Gareth Poole
Wales Governance Centre at Cardiff University
July 2018

The Welsh Tax Base: Risks and Opportunities after Fiscal Devolution 2
Our Mission The Wales Centre for Public Policy was established in October 2017. Its mission to improve policy
making and public services by supporting ministers and public services to access rigorous
independent evidence about what works.
The Centre collaborates with leading researchers and other policy experts to synthesise and mobilise
existing evidence and identify gaps where there is a need to generate new knowledge.
The Centre is independent of government but works closely with policy makers and practitioners to
develop fresh thinking about how to address strategic challenges in health and social care, education,
housing, the economy and other devolved responsibilities. It:
• Supports Welsh Government Ministers to identify, access and use authoritative evidence and
independent expertise that can help inform and improve policy;
• Works with public services to access, generate, evaluate and apply evidence about what
works in addressing key economic and societal challenges; and
• Draws on its work with Ministers and public services, to advance understanding of how
evidence can inform and improve policy making and public services and contribute to theories
of policy making and implementation.
Through secondments, PhD placements and its Research Apprenticeship programme, the Centre also
helps to build capacity among researchers to engage in policy relevant research which has impact.
For further information please visit our website at www.wcpp.org.uk
Core Funders
Cardiff University was founded in 1883. Located in a thriving capital city,
Cardiff is an ambitious and innovative university, which is intent on building
strong international relationships while demonstrating its commitment to Wales.
Economic and Social Research Council (ESRC) is part of UK Research and
Innovation, a new organisation that brings together the UK’s seven research
councils, Innovate UK and Research England to maximise the contribution of
each council and create the best environment for research and innovation to
flourish.
Welsh Government is the devolved government of Wales, responsible for key
areas of public life, including health, education, local government, and the
environment.

The Welsh Tax Base: Risks and Opportunities after Fiscal Devolution 3
Contents Summary 4
Executive Summary 6
1. Introduction 16
2. Determining the Welsh Tax Base 19
2.1 Devolved Income Tax 19
2.2 Land Transaction Tax 29
2.3 Council Tax 34
2.4 Non-Domestic Rates 40
2.5 Landfill Disposals Tax 44
3. Risks and Opportunities 45
3.1 Employment and wage growth 45
3.2 Productivity trends and determinants 50
3.3 Population and demographics 53
3.4 Migration and commuting flows across the Welsh-English border 56
3.5 Property market trends 58
3.6 Brexit 61
4. Options and Implications for the Welsh Government’s Tax Strategy 64
4.1 Setting income tax rates in Wales 64
4.2 Reforming property tax 71
4.3 Commercial property taxation 75
4.4 New taxes 77
4.5 Wider Welsh Government policies 78
5. Conclusion 80
References 81
Appendix A: Devolved Taxes in the Welsh Government Fiscal Framework 85
Appendix B: Methodology for Microsimulation of Devolved Income Tax Revenue 88

The Welsh Tax Base: Risks and Opportunities after Fiscal Devolution 4
Summary
• Under the new Fiscal Framework, from April
2019, the Welsh Government and local
authorities will control nearly £5 billion of tax
revenues, equivalent to 30 per cent of their
combined current spending. Devolved Welsh
tax revenues will need to keep pace with
comparable revenues in the rest of the UK
(rUK) to avoid a shortfall in the Welsh
budget.
• The Welsh Government’s Land Transaction
Tax and Landfill Disposals Tax were
introduced in April 2018 (replacing Stamp
Duty Land Tax and Landfill Tax). Income
Tax will be partially devolved from April
2019, while Council Tax and Non-
Domestic (Business) Rates are already
devolved.
• This report explores the factors that will
influence growth or reduction in revenues
from these taxes, the risks and opportunities
to the Welsh tax base after fiscal devolution,
and some of the implications for other areas
of Welsh Government policy.
The Welsh Tax Base
• The largest source of revenue will be
Income Tax, receipts from which will depend
on the employment rate, wages, and
population levels. Crucially, it will be the
change in these relative to rUK that will
determine the impact on the Welsh
Government budget.
• Employment rate: The gap in the
employment rate between Wales and rUK is
driven by economic inactivity, particularly
among those aged 55-64. Closing this gap
could increase the Welsh Government
budget by around £100m a year.
• Wages: Differences in taxpayer income
between Wales and rUK are concentrated at
the upper end of the earnings distribution.
These earners also account for a large
proportion of income tax revenue.
• The differences in average earnings
between Wales and rUK do not appear to be
driven by the different sectoral compositions
of the respective economies. Closing of the
gap in earnings growth between Wales and
rUK will require narrowing the productivity
gap. Increasing the proportion of high-skilled
workers in Wales will be key to this.
• If private sector wages grow 0.5 percentage
points a year more rapidly in Wales than
rUK, the Welsh Government budget would
increase by £60m after five years; the
reverse (a 0.5 percentage points slower rate
of growth) would reduce the budget by £55m
after five years.
• Population: The Welsh population aged 16-
64 is projected to decrease over the next few
years. By 2022 this age group will be
growing 0.4 percentage points more slowly
than rUK. A slower population growth rate
means that per person revenues will need to
grow at a faster rate in Wales to avoid a
shortfall in the Welsh Government budget.
• Levels of migration between rUK and Wales
will become an important budgetary factor;
and, in particular, movements of high-skilled
and high-earning individuals.

The Welsh Tax Base: Risks and Opportunities after Fiscal Devolution 5
• Commuting patterns will also be important.
People resident in Wales who commute to
England for work earn 30 per cent more on
average, and would have accounted for
around 7.6 per cent of devolved income tax
revenue in 2014-15.
• Council Tax is a very stable revenue source
but is widely seen as being ripe for reform: it
is regressive, inefficient, and lacks
buoyancy. However any reform is likely to be
politically difficult.
• Revenues from Non-Domestic (Business)
Rates in Wales are disproportionately
dependent on high value transactions. There
are arguments for reforming NDR and scope
to learn from reforms to the English and
Scottish systems.
• Land Transaction Tax revenues are driven
by the number and value of property
transactions in Wales. The number of
transactions in Wales has broadly tracked
that in rUK. But, the relative rate of growth in
property values has diverged; largely driven
by property prices in London.
• If the rate of growth in prices and
transactions were 2.5 percentage points
higher in Wales, by 2021-22 the Welsh
Government budget would be more than £92
million bigger; the converse (a growth rate of
2.5 percentage points lower than rUK) would
result in £71 million less revenue.
Implications for Tax Policy
• Based on a basic modelling of the impact of
varying tax rates, the effect of changes to the
additional rate would appear small and likely
offset by any migratory response (or
absence thereof). By contrast, changes in
the basic rate would have a large impact on
the Welsh Government budget.
• Tax reform should be pursued in an
integrated way. For example, a more
progressive approach to Council Tax could
be linked to changes in Land Transaction
Tax or Income Tax rates.
Wider Policy Implications
• Policies relating to the economy, skills,
education and housing (among others) will
have a direct effect on the performance of
the Welsh tax base, presenting many cross-
departmental challenges for the Welsh
Government. For example, in higher
education, a policy that incentivised
graduates to stay in Wales could help
enhance the Welsh tax base.
• For income tax revenues to keep pace, the
rate of wage growth in Wales needs to be
higher than rUK. The productivity of the
Welsh economy will be key and evidence
points to the importance of focusing on skills.
• Alongside the effects on the Welsh tax base,
changing flows of migration and commuting
will have implications for a wide range of
policy areas; particularly transport and
housing.

The Welsh Tax Base: Risks and Opportunities after Fiscal Devolution 6
Executive Summary Following the devolution of Stamp Duty and Landfill Tax this year and the partial devolution
of Income Tax in April 2019, the Welsh Government and local authorities will control nearly
£5 billion of tax revenues, equivalent to 30 per cent of their combined current spending.
Figure E1: Tax revenues under Welsh Government control, 2018-19
By means of the Block Grant Adjustment (BGA) mechanism agreed in the new Fiscal
Framework, while the Welsh budget will be largely protected from UK-wide economic shocks,
devolved revenues will need to keep pace with comparable revenues in the rest of the UK to
avoid a shortfall in the Welsh budget.
This report analyses some of the risks and opportunities in the Welsh tax base that will be
critical in allowing Wales to take advantage of the new fiscal powers.
Determining the Welsh tax base
Devolved Income Tax
• From 2019-20, income tax rates paid on non-savings, non-dividend (‘NSND’) income
by Welsh taxpayers will fall by 10p in the pound and will be replaced by the Welsh
Rates of Income Tax.
• Keeping tax rates paid by Welsh taxpayers unchanged by setting a 10p rate in each
band is forecasted to raise £2,099 million for the Welsh Government in 2019-20.
42%
31%
21%
5%1%
£0
£1,000
£2,000
£3,000
£4,000
£5,000
£6,000
2018-19
millio
n
Source: OBR (2018) Devovled taxes forecast; Statswales and authors' calculations
Landfill Disposals Tax
Land Transaction Tax
Non Domestic Rates
Council Tax
Income Tax (from 2019-20)

The Welsh Tax Base: Risks and Opportunities after Fiscal Devolution 7
Figure E2: NS-ND income tax base by source for Wales and rUK, 2014-15
The Welsh tax base is different from the rest of the UK (rUK) in a number of ways:
• A much higher share of the Welsh income tax base derives from public sector
employment and pension incomes than the rUK.
• The private sector employment income tax base in Wales and the rUK also vary by
industry. Manufacturing industries account for the largest share in Wales (22 per
cent - compared with 13 per cent in the rUK); while a much greater share derives
from professional, scientific & technical activities, and financial & insurance activities
in the rUK. This could have (at least short-term) budgetary consequences for the
Welsh Government if certain industries grow more rapidly or more slowly than
others. However, Wales’ lower average taxpayer income is not explained by
differences in the high-level industrial composition of its private sector tax base,
which suggests that other factors, such as the skills composition of the workforce,
are more important in determining the relative performance of Welsh wages.
• Mean taxpayer (NSND) income in Wales in 2014-15 was £24,900, significantly below
that of the rUK (£29,900). Differences between Welsh and rUK taxpayer incomes are
particularly apparent at the upper end of the income distribution: income at the 99th
percentile was £94,600 in Wales but £153,400 in the rUK.
• Although less dependent than the rUK, the Welsh tax take will be heavily influenced by
the income of the highest earners. Assuming a 10p rate at all bands, the top one per
cent of taxpayers in Wales will contribute more to devolved revenues than the lowest-
earning 40 per cent of taxpayers, and the top 10 per cent more than the lowest-earning
70 per cent.
• Taxable NSND income in Wales has decreased by an average of three per cent per
year in real terms since the 2007-08 financial crisis to 2014-15, almost one percentage
point below the change in the rUK. Much of this performance can be explained by UK
government policy to sharply increase the personal allowance after 2010.
• Also influencing relative tax growth is a slower-growing population in Wales, particularly
the population aged 16-64, which means revenues per person will need to grow at a
27%
19%
51%
63%
7%
6%
13%
10%
0% 10% 20% 30% 40% 50% 60% 70% 80% 90% 100%
WALES
rUK
Source: HMRC (2017) and author's calculations
Public Sector Employment Private Sector Employment State Pensions
Private Pensions Other Income

The Welsh Tax Base: Risks and Opportunities after Fiscal Devolution 8
faster rate in Wales for total revenues to keep pace with the rUK. Consistent with an
ageing population, the share of NSND income deriving from pensions increased from
16 per cent in 2009-10 to 20 per cent in 2014-15.
• Divergence in employment rates, pay and productivity of the working population also
influence growth in the tax base. Higher levels of economic inactivity in Wales (rather
than higher levels of unemployment) have generated a persistent employment rate gap
of around 3.6 percentage points between Wales and rUK over the past decade. Our
analysis suggests that there could be a cohort of individuals (aged 55-64) that account
for this persistent gap between Wales and rUK.
Land Transaction Tax
In 2016-17, the Stamp Duty Land Tax (SDLT) raised £210 million from 59,000 property
transactions in Wales.
• Residential property transactions accounted for two-thirds of receipts. Although only 14
per cent of such transactions were above £250,000 in 2015-16, 72 per cent of
residential SDLT receipts derived from these transactions, while 36 per cent derived
from the three per cent of transactions over £400,000.
• The non-residential property transaction tax base in Wales is far more reliant on higher
value transactions. Two-thirds of non-residential SDLT revenue in 2015-16 was
generated by transactions over £2 million. The large revenues generated by high-
valued transactions means non-residential Land Transaction Tax (LTT) will be highly
volatile: just 10 fewer freehold transactions over £5 million in 2015-16 could have
reduced revenues by £7 million.
• Welsh SDLT revenues declined significantly after peaking in 2006-07, and in contrast
to the rUK have failed to recover to pre-crisis levels. Although growth in the number of
transactions in Wales has roughly kept pace with the rUK, house prices have grown by
an average of two percentage points a year more quickly in England than in Wales
since 2006.
Council tax
Council Tax raised £1.4 billion from 1.3 million properties in Wales in 2016-17, and receipts
generally grew more rapidly in Wales in preceding years in the absence of a freeze (as in
Scotland) or a tight cap on increases (as in England). The number of chargeable dwellings in
Wales increased by an average of 0.6 per cent per year between 2006-07 and 2017-18,
slightly slower than growth in England.
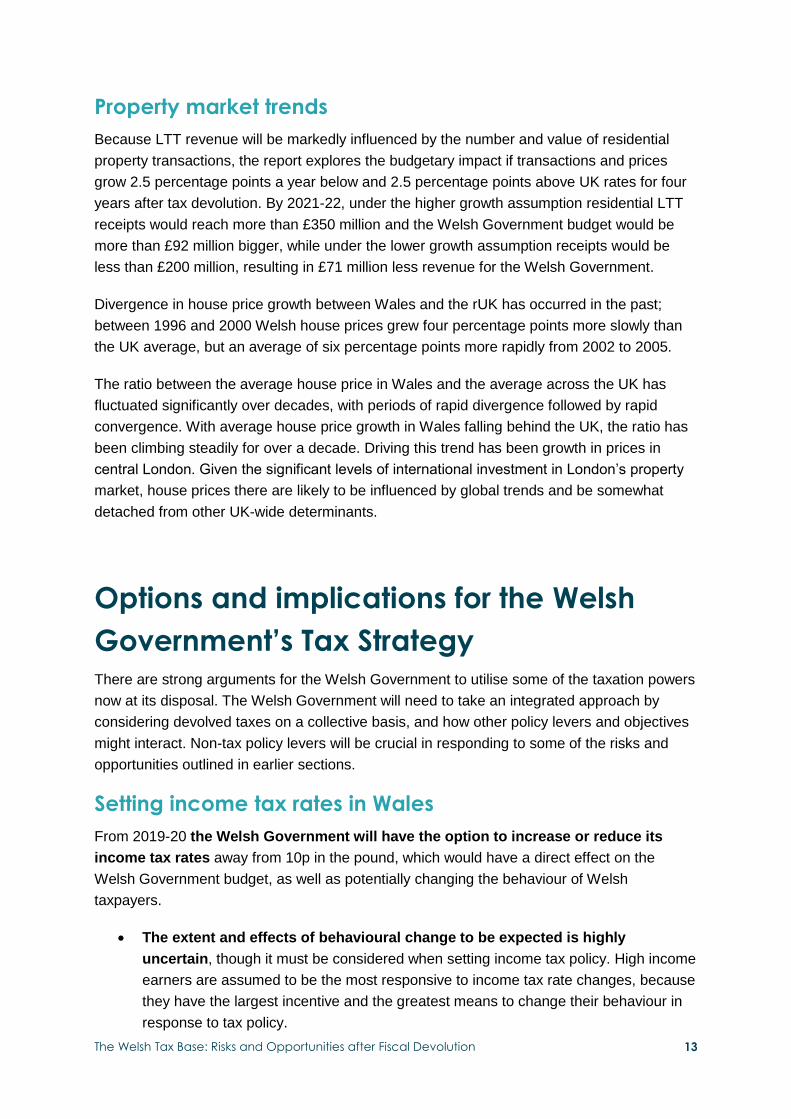
• Properties are heavily concentrated in the bottom bands; 57 per cent of chargeable
dwellings in Wales are in bands A, B and C, while only five per cent are charged in the
top three bands (G, H and I).
• There are large variations in the proportion of dwellings in each band across the 22
local authorities. The percentage of properties in the lowest band (A) is below 10 per
cent in 10 local authorities, but this proportion rises to more than 50 per cent in

The Welsh Tax Base: Risks and Opportunities after Fiscal Devolution 9
Blaenau Gwent and Merthyr Tydfil. More than half of all properties rated in the top two
bands (H and I) are located in just three local authorities: Monmouthshire, the Vale of
Glamorgan, and Cardiff.
• There has been some convergence in average property prices because the local
authorities with the lowest average house prices in 2003 (the year of the last
revaluation in Wales) have tended to be subject to the fastest increase in house prices
to 2016.
• Average increases in Band D Council Tax by local authority since 2003 are only very
weakly correlated with average increases in house prices and (weakly) negatively
correlated with changes in disposable household income by local authority. This is
evidence of how the Council Tax system lacks buoyancy and tends not to reflect
growth in the underlying tax base.
Non-domestic rates
Non-domestic (business) rates (NDR) were levied on 109,000 properties in Wales and
receipts (net of refunds) totalled £962 million in 2016-17. Revenues in Wales have grown
slightly more slowly than in England since 2010-11.
• Average annual growth in the total number of rateable properties in Wales has broadly
matched England since 2003-04. The retail sector recorded a slight fall in the number
of properties, though still accounts for one-third of the number of rateable properties.
There was a rapid increase in the number of office sector developments over recent
years. Average value per rateable property in the retail sector has increased
significantly since 2000-01, outpacing average value per rateable property in the
industrial sector. The retail sector’s share of overall rateable value in Wales has
therefore increased despite a smaller overall number of rateable properties.
• Average value per rateable property in Wales remains below that of England across all
sectors, with the office sector subject to the largest differential. Industrial and utilities
properties account for a much larger share of the NDR tax base in Wales. In contrast,
office properties are much more prominent in the English tax base (figure E3).
Figure E3: Rateable value by property type, 2015-16
Source: Valuation Agency Office (VAO) administrative data
0% 10% 20% 30% 40% 50% 60% 70% 80% 90% 100%
England
Wales
Offices Shops WarehousesOther Commercial Educational, training & cultural UtilitiesIndustrial Leisure Miscellaneous

The Welsh Tax Base: Risks and Opportunities after Fiscal Devolution 10
• Cardiff accounts for approximately 20 per cent of total rateable value in Wales, a share
which has been steadily increasing in recent years. Only 200 properties have a
rateable value over £1 million: If just 10 properties with a rateable value of £3 million
each were lost through relocation or closure, total revenue would fall by 1.5 per cent.
This is particularly true for certain industries – just 10 iron & steel works properties
account for nearly two per cent of total rateable value on the local list.
Risks and Opportunities
Employment and wage growth
The report uses data from the Survey of Personal Incomes (SPI) to run a microsimulation of
devolved tax revenues drawn from various assumptions of growth in the Welsh tax base,
particularly the employment rate and average wage growth.
• The central projection assumes that employment rates by age group stay unchanged
in both Wales and the rUK. The largest and most persistent gap in the employment
rate between Wales and the rUK is for those aged between 55 and 65; in contrast,
the gap for those aged 35 and 44 is negligible. A second projection models the effect
on devolved revenues if employment rates for each age group in Wales converge
with those in the rUK by 2029-30. The Welsh budget would be more than £100 million
better off each year under this scenario. This convergence could happen as age
cohorts with persistently lower employment rates in Wales reach retirement age.
• Our modelling suggests the Welsh Government is more exposed to earnings growth
divergence, and small but sustained differences in private sector employment income
in Wales and the rUK would have a material effect on the Welsh budget. The budget
would be £55 million smaller after five years should private sector wage growth be 0.5
percentage points a year lower than in the rUK, but the reverse scenario (a 0.5
percentage points increase) would boost the budget by £60m over the same period
(equivalent to a 2p rise in the higher rate of income tax), and by £140 after ten years
(equivalent to a 3p rise in the higher rate of income tax).
Productivity trends and determinants
Narrowing the gap in earnings growth between Wales and rUK will require a narrowing of the
productivity gap (see figure 3.6 below). But any sustained movements in relative productivity
will be in response to long-term trends, mirroring the economic effects of Welsh Government
policies, which operate over the longer term.
Much of the current gap between Gross Value Added (GVA) per head in Wales and the rUK
can be attributed to lower productivity: GVA per hour worked was 82.4 per cent of the UK
average in 2016. The distribution of human capital is an important determinant of regional
earnings differentials in the UK:

The Welsh Tax Base: Risks and Opportunities after Fiscal Devolution 11
• A smaller share of the Welsh population have a graduate-level education (NQF Level 4
and above), and a higher share are without A level (NQF Level 3) qualifications or
trade apprenticeships.
• The wage premium for workers with different levels of qualifications appear similar in
Wales and the rUK: hourly pay for graduates is approximately 27 per cent higher than
the respective average wage in Wales and the rUK.
• Because the incomes of higher earners constitute a large share of NSND income,
relative movements in the share of the population with high skill levels and the wage
premium those skills attract will be important determinants of the future Welsh income
tax base.
Wales’ current work force would appear to be more exposed to the effects of automation,
which could have a significant effect on the relative performance of the Welsh income tax
base.
Population and demographics
The ONS projects that the Welsh population will grow by approximately 0.4 per cent per year
from 2016, around 0.2 percentage points behind the rUK, although this is uneven across age
groups. The Welsh population aged between 16 and 64 is projected to shrink; and by 2022
the growth rate of 16-64 year olds in Wales is expected to be 0.4 percentage points lower
than rUK.
The fastest projected growth by far is for the population aged over 74 in both Wales and rUK,
while the Welsh population aged 45-54 is projected to fall much more sharply than in the rUK
(Figure E4). This sharper projected fall is a cause for concern: it is at this age that average
incomes are at their highest.
Figure E4: Projected trends in different age groups, Wales (2019 = 100)
While there is little difference in the average incomes of the youngest taxpayers, taxpayers
aged 35-54 earn 28 per cent more on average in the rUK than in Wales. Later in life, average
80
90
100
110
120
130
140
2019 2020 2021 2022 2023 2024 2025 2026 2027 2028 2029
Source: ONS (2017) 2016-based population projections
75+
35-44
65-74
16-24
55-64
25-34
45-54

The Welsh Tax Base: Risks and Opportunities after Fiscal Devolution 12
incomes again converge: average incomes for those aged over 65 are only 10 per cent
higher in the rUK. This convergence may suggest that the Welsh income tax base may be
relatively more resilient to an ageing population during the first decade of income tax
devolution.
Any changes in levels of international migration appear to affect Wales and rUK in similar
ways. The budgetary effect for Welsh Government is therefore minimal. However, our
modelling does not seek to account for the wider economic impacts of drops in inward
migration.
Migration and commuting flows across the Welsh-English
border
Nearly 48 per cent of the Welsh population live within 25 miles of the border with England and
4.9 million within a similar distance on the English side of the border. Changes to migration
and commuting flows could have an impact on the devolved Welsh tax base.
• From 2015 to 2016, around 53,170 people migrated out of Wales to England, while
56,950 migrated in the other direction, or around 1.8 per cent of the Welsh population.
• Migration in both directions peak at age 19, with a higher rate of students moving into
Wales compared with those leaving. As a result, Wales is a net loser of graduates
every year, with net migration out of Wales of nearly 5,300 for those aged between 21
and 29. Gross flows of migration fall significantly for older age groups.
• A change in gross and net flows of migrants between Wales and England would affect
the skills composition of the Welsh labour force. Compared with the other devolved
nations, Wales currently has a lower retention rate of graduates from Welsh
universities who stay and gain employment in Wales.
After income tax devolution, commuters who are resident in Wales but work in England will
pay Welsh income taxes.
• 90,000 Welsh residents commuted to a workplace outside of Wales in 2016, or 6.4 per
cent of all working residents. This flow is over twice as large as those who commute
into Wales from England.
• Welsh residents who work outside of Wales earn around 30 per cent more per hour
than individuals who both live and work in Wales. We estimate approximately 7.6 per
cent of devolved income tax revenues in 2014-15 would have been earned in
workplaces outside of Wales. Increased commuting from Wales over time could
therefore have a substantial positive impact on the Welsh income tax base, as well as
the property tax base in the four border counties should more working in England
choose to move to Wales.
The Welsh Tax Base: Risks and Opportunities after Fiscal Devolution 13
Property market trends
Because LTT revenue will be markedly influenced by the number and value of residential
property transactions, the report explores the budgetary impact if transactions and prices
grow 2.5 percentage points a year below and 2.5 percentage points above UK rates for four
years after tax devolution. By 2021-22, under the higher growth assumption residential LTT
receipts would reach more than £350 million and the Welsh Government budget would be
more than £92 million bigger, while under the lower growth assumption receipts would be
less than £200 million, resulting in £71 million less revenue for the Welsh Government.
Divergence in house price growth between Wales and the rUK has occurred in the past;
between 1996 and 2000 Welsh house prices grew four percentage points more slowly than
the UK average, but an average of six percentage points more rapidly from 2002 to 2005.
The ratio between the average house price in Wales and the average across the UK has
fluctuated significantly over decades, with periods of rapid divergence followed by rapid
convergence. With average house price growth in Wales falling behind the UK, the ratio has
been climbing steadily for over a decade. Driving this trend has been growth in prices in
central London. Given the significant levels of international investment in London’s property
market, house prices there are likely to be influenced by global trends and be somewhat
detached from other UK-wide determinants.
Options and implications for the Welsh
Government’s Tax Strategy There are strong arguments for the Welsh Government to utilise some of the taxation powers
now at its disposal. The Welsh Government will need to take an integrated approach by
considering devolved taxes on a collective basis, and how other policy levers and objectives
might interact. Non-tax policy levers will be crucial in responding to some of the risks and
opportunities outlined in earlier sections.
Setting income tax rates in Wales
From 2019-20 the Welsh Government will have the option to increase or reduce its
income tax rates away from 10p in the pound, which would have a direct effect on the
Welsh Government budget, as well as potentially changing the behaviour of Welsh
taxpayers.
• The extent and effects of behavioural change to be expected is highly
uncertain, though it must be considered when setting income tax policy. High income
earners are assumed to be the most responsive to income tax rate changes, because
they have the largest incentive and the greatest means to change their behaviour in
response to tax policy.

The Welsh Tax Base: Risks and Opportunities after Fiscal Devolution 14
• Since only a portion of income tax is devolved, the Welsh Government would be
relatively shielded from the behavioural response of Welsh taxpayers if it
decided to change income tax rates. For example, a 1p increase at the basic rate
would raise around £184m in revenue in the absence of a behavioural response;
these receipts would reduce only marginally to £180m even under an assumption of
large income elasticity.
• Taxpayers may also decide to migrate to and from Wales as a result of income
tax differentials. The UK government will not be able to respond in kind to a decision
to cut income tax by the Welsh Government and close the differential in income tax
rates. There is some evidence that differences in tax rates within a country can
encourage taxpayers to relocate or shift income between jurisdictions, though Wales’
particular circumstances make it hard to draw conclusions from other countries.
• It would take a substantial migration response from very high earners to have a
material budgetary effect if the additional rate was cut by 5p in Wales. If 1,100
taxpayers relocated the cost of the tax cut would reduce to zero, while a doubling of
Wales’ share of UK additional rate taxpayers (with over 5,000 migrating) would boost
the Welsh budget by £100 million.
Reforming property tax
Property in Wales provides a large and immobile tax base and has a large revenue-raising
potential. However, it is currently not taxed in a way that is reflective of the contours of the
underlying tax base.
• Given the length of time that has transpired since 2003, there is a strong case for a
revaluation, for council tax bills to reflect the significant house price changes which
have occurred over the intervening period. A revaluation would also be an opportunity
for at least some reform of the structure of Council Tax.
• Making property tax bills more proportional to property values would be a crucial
component of such a reform, for example through reforming Council Tax bands. At a
UK level, numerous studies have explored or recommended replacing Council Tax
with an annual flat-rate tax on the market value of a property. A 0.7 per cent flat
charge on the value of all properties in Wales would yield roughly the same amount of
revenue as the current Council Tax system. A majority of dwellings would see a
reduction in their tax bill each year, while the highest value properties would see large
increases in their annual tax bill.
• Fundamental reform of property taxation would of course be politically difficult. The
distributional effects between different people and places would need to be
considered carefully. Council tax is also currently a very stable revenue source for
local authority budgets, so reform would have to coincide with wider changes to local
authority grants and allow scope for local autonomy.
• The Welsh Government could take an integrated approach to tax reform. For
example, recurrent property taxes could be reformed to increase revenue, to allow for

The Welsh Tax Base: Risks and Opportunities after Fiscal Devolution 15
the gradual reduction in residential LTT revenue. There is also a strong economic
case for shifting the burden of taxation from labour income towards property –
increasing revenue through property tax reform by around £210 million (roughly a 14
per cent increase in Council Tax revenue) could allow for a 1p reduction in all income
tax rates.
Other policy implications
The NDR tax base is currently very different to that in England, with the office sector
perhaps offering the biggest opportunity to close the gap in terms of average value and total
rateable value.
• Several proposals are currently being considered or implemented by the Welsh
Government to improve the efficiency of the NDR system. Further reforms, such as
proposals made by the 2017 Barclay Review of NDR in Scotland could support
economic growth and reduce some barriers to investment.
• ‘Fiscal incentives’ for local authorities have been introduced elsewhere in the UK.
Increasing the share of revenues retained by local authorities may incentivise them to
grow their local tax bases, positively influencing the overall NDR tax base in Wales.
However, incentives introduced should be properly aligned with the economic
objectives of the Welsh Government.
The Wales Act 2014 also allows for the creation of new taxes in Wales, subject to the
approval of both Houses of Parliament and the National Assembly.
• The power to introduce new taxes provides a new policy lever to influence Wales’
economy, society and environment, though the revenue streams arising from most
proposed new taxes are likely to be modest.
• The idea of hypothecated tax rises is gaining traction at a UK level, as it may be
politically easier to raise additional revenue in this manner. Of the proposed new
taxes, the social care levy has the greatest revenue-raising potential, and there are a
number of compelling reasons why such a scheme should be contributory rather than
funded by a general tax rise.
The risks and opportunities discussed in this report present many cross-departmental
challenges for the Welsh Government. Apart from Welsh Government tax policy, policies
relating to the economy, skills, education and housing (among others) will have a direct
influence on the performance of the Welsh tax base. For example, higher education policy
levers (such as those relating to fees and grants) could be used to incentivise graduates to
stay in Wales, ensuring that they contribute to the Welsh tax base. The potential trade-offs
and tough policy choices should be analysed and discussed strategically.

The Welsh Tax Base: Risks and Opportunities after Fiscal Devolution 16
1. Introduction For the first 16 years of its existence, the Welsh Government was responsible for more than
half of public spending in Wales, but was almost entirely dependent on an annual block grant
from the UK Treasury to fund this spending. Changes in the Welsh block grant from year to
year (and hence the size of the overall Welsh budget) were linked to UK Government
spending decisions in England via the Barnett Formula, insulating the Welsh budget from any
volatility in the amount of tax revenues raised from individual taxpayers and businesses in
Wales.
Each year, approximately £22 billion in tax revenues are collected in Wales. Unusually
among the countries of the UK, the largest source of tax revenue in Wales is not Income Tax
but the Value Added Tax, which accounted for more than a quarter of total tax receipts in
2015-16. As can be seen in figure 1.1, total revenues per person are much lower in Wales,
with a relatively larger share of revenue raised from indirect taxation (VAT and excise duties
from goods and services rather than taxes levied on income or profits).
Figure 1.1: Main tax revenues per person in Wales and UK, 2015-16
For much of the first two decades of Welsh devolution, these divergences in tax performance
have been of interest but somewhat moot, because almost all taxes derived from Wales have
been collected and pooled at a UK level before being spent by central government or
distributed to devolved government via the Barnett Formula. The only exception to this was
22%
Income tax5%
Corporation tax18%
National
Insurance
contributions25%
Value added tax
11%
Local authority
revenue
19%
All other revenue
£0
£1,000
£2,000
£3,000
£4,000
£5,000
£6,000
£7,000
£8,000
£9,000
£10,000
Wales UK
Source: ONS (2017) Country and Regional Public Sector Finances
18%
9%
21%
18%
7%
27%

The Welsh Tax Base: Risks and Opportunities after Fiscal Devolution 17
the Council Tax which forms a part of local government budgets; however, receipts from this
tax constitute less than five per cent of all tax revenues raised in Wales.
Following two commissions on Welsh public finances (Holtham 2008-2010 and Silk 2010-
2012), the Wales Act 2014 provided the legislative framework for the devolution of taxation
and borrowing powers. In April 2015 powers over business rates / non-domestic rates were
fully devolved, and revenues from rates paid by Welsh businesses now accrue directly to the
Welsh Government. From April 2018, the Stamp Duty Land Tax and Landfill Tax were
‘switched off’ in Wales and replaced by two devolved taxes under Welsh Government
control, the Land Transaction Tax and the Landfill Disposals Tax. The Welsh Government
will also be able to introduce new devolved taxes, subject to approval by the National
Assembly and both houses of Parliament in Westminster. Perhaps most significantly, the
Wales Act 2017 also partially devolves more than £2 billion of Income Tax revenues to the
Welsh Government, from April 2019.
In a sharp departure from its past fiscal framework, the Welsh Government and local
authorities will soon therefore be in control of nearly £5 billion of tax revenues, equivalent to
30 per cent of their combined current spending. As can be seen in figure 1.2, devolved
revenues from Income Tax will be the largest source of tax revenue for the Welsh
Government, followed by both local government taxes.
Figure 1.2: Tax revenues under Welsh Government control, 2018-19
Wales’ new fiscal powers are designed to encourage public debate and interest in the tax
policy options available to the Welsh Government. However, equal consideration will need to
be given to the performance of the underlying tax base supporting devolved taxes. For the
first time, faster or slower growth in the Welsh tax base will have a significant and direct
impact on the Welsh budget. In particular, the relative performance of the Welsh tax base
42%
31%
21%
5%
1%
£0
£1,000
£2,000
£3,000
£4,000
£5,000
£6,000
2018-19
mill
ion
Source: OBR (2018) Devovled taxes forecast; Bangor University (2017); Statswales
and authors' calculations
Landfill Disposals Tax
Land Transaction Tax
Non Domestic Rates
Council Tax
Income Tax (from 2019-20)

The Welsh Tax Base: Risks and Opportunities after Fiscal Devolution 18
compared with elsewhere in the UK will become an issue of major importance to the long-
term sustainability of the public finances and funding of Wales’ public services.
As part of the recent Fiscal Framework Agreement1 between the two governments, a
downward adjustment will be made to the Welsh block grant to account for the revenue
forgone by HM Treasury after tax devolution.2 In the first year of devolution, this Block Grant
Adjustment (‘BGA’) will equal the revenue being devolved to the Welsh Government,
ensuring neither government is better or worse off immediately after devolution.3 Thereafter,
the BGA will change from year to year according to growth in comparable UK government
revenues in the rest of the UK.4 This means that devolved revenues will need to keep pace
with revenues in the rest of the UK to avoid a shortfall in the Welsh Government’s budget. If
revenues in Wales grow at a faster rate, the Welsh Government will be rewarded with extra
spending power. This mechanism protects the Welsh Government budget from economic
shocks and trends which affect the whole of the UK, while the Welsh Government will bear
the risks and rewards of differential growth in its tax base.
The purpose of this report is to outline and analyse some of the risks and opportunities facing
the Welsh Government as it takes on these new fiscal powers. The remainder of this report
proceeds as follows. Section 2 describes the composition and past trends in the tax bases
supporting the devolved taxes, highlighting particular strengths and weaknesses. Section 3
discusses the risks and opportunities to the Welsh tax base and projects the impact of tax
devolution on the Welsh Government budget under different scenarios. Section 4 presents
implications and poses questions for consideration in the Welsh Government’s tax strategy
and wider public policy, and summarises the contributions made at an expert roundtable
event on the Welsh tax base.
1 See http://gov.wales/funding/fiscal-reform/framework/?lang=en.
2 See Appendix A for further information on how the Block Grant Adjustments will be calculated and the implications for the risks borne by the Welsh Government.
3 For the BGAs relating to LTT and LDT, the BGA in 2018-19 reflects Welsh revenues in 2017-18, updated according to changes in revenues in the rest of the UK to 2018-19.
4 Specifically, this refers to revenues from England and Northern Ireland. Scottish revenues will not be included in the calculation since these revenues have already been devolved to the Scottish Government.

The Welsh Tax Base: Risks and Opportunities after Fiscal Devolution 19
2. Determining the Welsh Tax
Base The Welsh Government will soon be responsible for billions of pounds of tax revenue that will
form part of its budget to pay for devolved public services. As well as the tax policy choices
taken by the Welsh Government, trends in the underlying tax base will – to a certain degree
– determine the size of its budget. This section analyses the tax bases supporting each of
the major revenue streams which are currently or soon to be under the control of the Welsh
Government in coming years: Welsh Rates of Income Tax, Land Transaction Tax, Council
Tax, and Non-Domestic Rates.
2.1 Devolved Income Tax
From 2019-20, the income tax paid by Welsh taxpayers will be partially devolved to the
Welsh Government. Income tax rates paid by taxpayers resident in Wales will fall by 10p in
the pound (e.g. from 20p to 10p at the basic rate). With the approval of the National
Assembly, the Welsh Government will then introduce its own rates in each tax band, and
revenues from these rates will form a part of its budget.
The Office for Budget Responsibility (OBR) forecasts that setting a 10p rate in each band
(i.e. keeping tax rates paid by Welsh taxpayers unchanged) would raise around £2,099
million for the Welsh Government in 2019-20.
Characteristics of Wales’ NS-ND income tax base
The primary source of data on the income tax raised in Wales comes from the Survey of
Personal Incomes (SPI), which allows analysis of the composition, distribution and trends in
Welsh income tax. The latest available survey was for the financial year 2014-15, which
contained a sample of over 22,000 Welsh taxpayers (drawn from PAYE and self-assessment
data).
Since income tax paid on savings and dividend incomes (which accounts for less than seven
per cent of total taxpayer income in Wales) will not be devolved, the focus of this report is
Non-Savings Non-Dividend (‘NS-ND’) incomes. This earned income can be further
disaggregated into income from employment, pension income, and a small amount from
other income sources, such as property income. Figure 2.1 provides a breakdown of the NS-
ND income tax base in Wales compared with the rest of the UK.

The Welsh Tax Base: Risks and Opportunities after Fiscal Devolution 20
Figure 2.1: NS-ND income tax base by source for Wales and rUK, 2014-15
Welsh taxpayers earned an estimated £33.4 billion of NS-ND income in 2014-15, of which 78
per cent derived from employment income. Pension incomes accounted for a larger share of
the Welsh tax base (20 per cent) than the rest of the UK (‘rUK’) (15.3 per cent). The state
pension accounted for nearly a third of pension income in both Wales and the rUK.
The employment income tax base can also be further disaggregated into income from public
and private sector employment. An important difference in the Welsh tax base is that a much
higher share of the Welsh income tax base derives from public sector employment than in
the rUK.
These differences in the composition of the Welsh tax base compared with the rUK could
have budgetary consequences for the Welsh Government, particularly if UK-wide factors
result in certain sources of income (e.g. pension incomes) growing more rapidly or more
slowly than others. At least in the short term, this could potentially cause divergence in the
growth rate of total NS-ND income tax base in Wales compared with the rUK.
The composition of private sector taxpayer income by industry also varies considerably
between Wales and the rUK. As illustrated in figure 2.2, taxpayers employed in
manufacturing industries account for the largest share of private sector employment income
in Wales (22 per cent - compared with 13 per cent in the rUK), followed by wholesale and
retail trade (17 per cent) and construction (11 per cent). In the rUK, a much greater share of
private sector employment income derives from professional, scientific and technical
activities (15 per cent) and financial and insurance activities (13 per cent).
27%
19%
51%
63%
7%
6%
13%
10%
0% 10% 20% 30% 40% 50% 60% 70% 80% 90% 100%
WALES
rUK
Source: HMRC (2017) and author's calculations
Public Sector Employment Private Sector Employment State Pensions
Private Pensions Other Income

The Welsh Tax Base: Risks and Opportunities after Fiscal Devolution 21
Figure 2.2: Private sector employment income by industry classification (SIC
2007)
There are large differences in the average income of taxpayers working in different industries
in Wales. The average income of manufacturing industry taxpayers is 20 per cent higher than
the Wales average, and taxpayers in professional, scientific and technical employment also
earn 17 per cent more than the average taxpayer. Conversely, taxpayers working in
wholesale and retail trade and administrative and support services earn less than the
average Welsh taxpayer.
Mean taxpayer (NS-ND) income in Wales in 2014-15 was £24,900, significantly below that of
the rUK (£29,900). However, that Wales’ average taxpayer income is lower than in the rUK is
not explained by the different composition of the private sector tax base in Wales. To test for
industrial sector composition effects, we can adjust the share of taxpayers in each industry in
Wales to match the shares of taxpayers in each industry in the rUK (while keeping average
taxpayer incomes in each industry unchanged). This industry-adjusted overall average of
private sector taxpayer income is slightly lower than with Wales’ industry mix. This suggests
that other factors, such as the skills composition of the Welsh workforce, are more important
in determining the relative performance of Welsh wages than its industrial composition (at
least at a high level of industries).
However, if there were industry-specific shocks to certain industries in the UK (for example,
to the steel industry or financial and insurance activities), Wales’ sectoral mix may impact the
tax base differently than elsewhere. Such a shock could have a significant budgetary impact,
at least in the short run.
Manufacturing
22%
13%
Wholesale and
retail trade; repair
of motor vehicles
and motor cycles
17%
15%
5%
9% Information and
communication
Financial and …
7%
13%
Professional,
scientific and
technical acitivities
9%15%
0%
10%
20%
30%
40%
50%
60%
70%
80%
90%
100%
Wales rUK
Source: HMRC (2017) and authors' calculations

The Welsh Tax Base: Risks and Opportunities after Fiscal Devolution 22
The overall distribution of taxpayer incomes also varies between Wales and the rUK. As
shown in figure 2.3, although the difference in the median taxpayer income is relatively small
– £20,100 in Wales versus £21,100 in the rUK – it is at the upper end of the income
distribution that differences between Welsh and rUK taxpayer incomes become apparent.
Taxpayer income at the 90th percentile in Wales in 2014-15 was £41,200, compared with
£48,900 in the rUK. The “Welsh one per cent” also earn significantly less; taxpayer (NS-ND)
income at the 99th percentile in Wales was £94,600, while rUK earners would need to earn
£153,400 to be in the top one per cent of taxpayers.
Figure 2.3: Distribution of taxpayer NS-ND incomes in Wales and rUK, 2014-15
Figure 2.4: Devolved income tax liabilities (with 10p rate in each band) by
taxpayer decile (and top one per cent) in Wales and rUK, 2014-15
Source: HMRC (2017) and authors' calculations
£0
£20,000
£40,000
£60,000
£80,000
£100,000
£120,000
£140,000
£160,000
0 3 6 9
12
15
18
21
24
27
30
33
36
39
42
45
48
51
54
57
60
63
66
69
72
75
78
81
84
87
90
93
96
99
NS-N
D In
co
me
NSND Taxpayer percentile (1 – 99)
Wales rUK
10.1%
Wales
18.2%
rUKBottom decile
Second decile
Third decile
Fourth decile
Fifth decile
Sixth decile
Seventh decile
Eighth decile
Ninth decile
Top 90% - 99%
Top 1%
Source: HMRC (2017) and authors’ calculations

The Welsh Tax Base: Risks and Opportunities after Fiscal Devolution 23
This variation in taxpayer earnings at the upper range of incomes means that overall
incomes are much more evenly distributed in Wales than in the rUK. The ratio of the incomes
of the ninth decile of taxpayers to the first decile (90:10) is 3.6 in Wales, but 4.3 across the
rUK.
A relatively large proportion of the rUK tax base is derived from the incomes of high earners.
In 2014-15, the top one per cent of earners alone earned 12.3 per cent of total NS-ND
income (compared with 6.4 per cent in Wales), while the earnings of the top 10 per cent
accounted for 34.2 per cent (25.9 per cent in Wales). Although less dependent on those on
very high incomes than the rUK, the Welsh tax base will also be heavily influenced by the
income of the highest earners. After subtracting personal allowances and reliefs, and
assuming the Welsh Government sets a 10p rate in all bands, the top one per cent of
taxpayers in Wales will contribute more to devolved revenues than the lowest-earning 40 per
cent of taxpayers, and the top 10 per cent more than the lowest-earning 70 per cent, as
shown in figure 2.4 above.
To account for Wales’ lower income profile, the Fiscal Framework agreement will establish a
separate BGA for each separate tax band (NS-ND income earned at the basic rate, the
higher rate and the additional rate). An overwhelming proportion of Welsh incomes are
earned at the basic rate (as shown in figure 2.5), and separate BGAs will protect the Welsh
Government budget from factors which disproportionately affect taxable income earned at
the basic rate (such as increases in the personal allowance).5
Figure 2.5: Devolved income tax revenue by income tax band, 2014-15
While levels of taxpayer income inequality are very different in Wales, as a result of the
agreed adjustment mechanism most factors which influence income inequality across the UK
5 For further information see Appendix A.
86%
70%
12%
20%
11%
0%
10%
20%
30%
40%
50%
60%
70%
80%
90%
100%
Wales rUK
Source: HMRC (2017) and author's calcuations
Additional rate
Higher rate
Basic rate

The Welsh Tax Base: Risks and Opportunities after Fiscal Devolution 24
should affect the Welsh and rUK tax bases in a similar way.6 Differential movements in
income inequality that are specific to Wales (e.g. if inequality increases faster in Wales than
in the rUK) will however have an effect on the size of the Welsh budget.
Past trends in the NS-ND income tax base in Wales
Figure 2.6 shows the long-term trend in revenues from the Welsh Rates of Income Tax had a
10p rate been applied from 1999-00 to 2014-15. Annual real terms growth averaged nearly
four per cent between 1999-00 and 2007-08. Since the 2007-08 financial crisis however,
revenues have decreased by an average of three per cent a year in real terms. As explained
in the previous section however, the BGA mechanism would have protected the Welsh
budget from much of this drop in revenues because comparable revenues in the rUK also fell
during this period (as shown in figure 2.7).
Once income tax is partially devolved, it will be the relative growth in revenues which will
determine the budgetary impact for the Welsh Government. While pre-2007 annual growth in
Wales broadly corresponded with the rUK (with Welsh revenues growing annually 0.3
percentage points slower than the rUK), there has been a sharper fall in revenues after the
financial crisis (with Welsh revenues growing one percentage point more slowly each year).
Figure 2.6: 10p rate share of taxable NS-ND income in Wales, 1999-2000 to
2014-15 (2016-17 prices)
6 The contribution of each decile of taxpayers to taxable income earned at the basic rate is very similar in Wales compared
with the rUK. For example, the top 10% of taxpayers earned 25.9% of taxable NS-ND income earned at the basic rate in
Wales in 2014-15, compared with 23.7% in the rUK.
£0
£500
£1,000
£1,500
£2,000
£2,500
£3,000
Mill
ion
s
Source: Survey of Personal Incomes (HMRC) and authors' calculations

The Welsh Tax Base: Risks and Opportunities after Fiscal Devolution 25
Figure 2.7: Annual growth in a 10p rate share of taxable NS-ND income in
Wales (real terms)
Although the emergence of differentiated revenue growth is a cause for concern, much of the
relatively poorer performance of income tax receipts in Wales can be explained by UK
government tax policy after 2010. The share of total NS-ND income offset by allowances and
reliefs grew by 10 percentage points from 2010-11, primarily as a result of the sharp
increases in the personal allowance.7 Due to lower taxpayer incomes in Wales, these
personal allowance increases will have withdrawn a larger share of taxable incomes in Wales
out of the tax base than was the case in the rUK.
The BGA linked to the basic rate tax base in the rUK will be similarly affected by UK-wide
factors which affect taxable income at the basic rate (such as increases in the personal
allowance). From 2010-11 to 2014-15, taxable income earned at the basic rate in the rUK fell
by a similar percentage as in Wales. Had the Welsh Rates of Income Tax been in place over
this period, separate BGAs would have protected the Welsh Government budget from much
of the poorer performance of overall Welsh revenues.
7 This figure is calculated as the share of taxable NS-ND income as a share of total taxpayer NS-ND income. This figure
doesn’t account for the fact that some lower-earning taxpayers will have been pulled out of the income tax system
altogether, such that their incomes are no longer counted as ‘taxpayer income’.
-6.0%
-4.0%
-2.0%
0.0%
2.0%
4.0%
6.0%
8.0%
10.0%
12.0%
14.0%
Source: Survey of Personal Incomes (HMRC) and authors' calculations
Wales rUK

The Welsh Tax Base: Risks and Opportunities after Fiscal Devolution 26
Underlying trends in NS-ND income tax base
Apart from UK government policy, a number of underlying demographic and economic
factors would also have affected the recent performance of the Welsh income tax base.
A crucial factor in this analysis is that the population of Wales has been growing at a slower
rate than the rUK. Annual growth in the adult population in Wales since 2008 has averaged
0.4 per cent, fully half the rate of growth in the rUK (0.8 per cent) as a consequence of lower
life expectancies, lower birth rates and lower net international migration to Wales.
Furthermore, as can be seen in figure 2.8, there has been a similar divergence in the growth
of the population aged between 16 and 64, the bulk of the working-age population, a
population cohort which has actually reduced in size since 2011. In contrast to Scotland’s
fiscal framework arrangements, the Welsh Government will bear population-related risks, so
differential growth in population will affect Wales’ relative tax base growth. With the Welsh
population growing at a slower rate than the rUK, per person revenues will need to grow at a
faster rate in Wales for total revenues to keep pace with overall revenue growth in the rUK.
Figure 2.8: Population aged 16+ and 16-64, Wales and rUK (1999=100)
Although most taxpayers over the age of 65 continue to pay income tax on pension incomes,
an ageing population will likely have an impact on the relative performance of the tax base
because NS-ND incomes are generally lower for those aged over 65. Corresponding with the
increasing share of people over 65 in Wales, the share of NS-ND income deriving from
pension incomes has increased from 16 per cent in 2009-10 to 20 per cent in 2014-15.
Labour market trends in Wales and the rUK will also affect the future NS-ND income tax
base. Divergence in employment rates, pay and productivity growth could result in a slower-
or faster-growing tax base.
Although subject to considerable volatility, the employment rate in Wales has been steadily
increasing since 2009. However, the gap in employment rates between Wales and rUK has
90
95
100
105
110
115
120
1999 2000 2001 2002 2003 2004 2005 2006 2007 2008 2009 2010 2011 2012 2013 2014 2015 2016
Source: ONS (2017)
Wales 16 + Wales 16 - 64 rUK 16 + rUK 16 - 64

The Welsh Tax Base: Risks and Opportunities after Fiscal Devolution 27
remained at approximately 3.6 percentage points over the past decade. A sharp rise in the
employment rate in Wales in the early part of the last decade narrowed the gap with the rUK
from over six percentage points in the first quarter of 2002 to under three percentage points
in the second quarter of 2003. Since then however, there has been no significant trend in the
employment rate gap (represented by the grey bars in figure 2.9).
Figure 2.9: Quarterly employment rate (16+) in Wales and UK, 1999-2017
Figure 2.10: Quarterly unemployment rate (16 - 64) in Wales and UK, 1999-
2017
0
2
4
6
8
10
12
14
48
50
52
54
56
58
60
62
1999 2000 2001 2002 2003 2004 2005 2006 2007 2008 2009 2010 2011 2012 2013 2014 2015 2016 2017
%
%
Source: Statswales (2017)
Difference (UK - Wales, right axis) UK (left axis) Wales (left axis)
-2
-1.5
-1
-0.5
0
0.5
1
1.5
2
2.5
3
0
1
2
3
4
5
6
7
8
9
10
1999 2000 2001 2002 2003 2004 2005 2006 2007 2008 2009 2010 2011 2012 2013 2014 2015 2016 2017
%%
Source: Statswales (2017)
Difference (Wales - UK, right axis) UK (left axis) Wales (left axis)

The Welsh Tax Base: Risks and Opportunities after Fiscal Devolution 28
The unemployment rate in Wales has broadly followed UK trends for most of this period
(shown in figure 2.10). Unemployment was slightly higher in the aftermath of the financial
crisis but subsequently converged with the UK level, and was lower in Wales in each quarter
of 2016. The similarity in unemployment rates point to higher levels of economic inactivity in
Wales as the reason for this the persistent employment rate gap.
In addition to employment rates, patterns of pay growth will also be a key determinant of the
NS-ND income tax base. Here, productivity will be crucial (See also figure 3.7). Figures from
the Annual Survey of Hours and Earnings suggest that average annual pay of employees in
Wales increased by 0.5 percentage points faster in Wales than in the UK as a whole
between 2012 and 2017 (the time period for which we have comparable data).
Figure 2.11: Mean annual percentage increase in pay, Wales and UK (2012-
2017, nominal)
Figure 2.12: Total increase in pay by percentile from 2011 to 2016, Wales and
UK (nominal)
0.0%
0.5%
1.0%
1.5%
2.0%
2.5%
3.0%
3.5%
4.0%
2012 2013 2014 2015 2016 2017
Source: ONS (2017) Annual Survey of Hours and Earnings
Wales UK
Average Wales (2012-2017) Average UK (2012-2017)
0%
5%
10%
15%
20%
25%
30%
35%
10 20 30 40 50 60 70 80 90
Percentile of employees
Wales UK
Source: ONS (2017) Annual Survey of Hours and Earnings

The Welsh Tax Base: Risks and Opportunities after Fiscal Devolution 29
Although average annual pay rose more rapidly in Wales, investigating employee income
distributions indicates that the increase in median annual pay was broadly consistent in
Wales and the rUK between 2011 and 2016. As shown in figure 2.12, the largest increase
was seen in the annual pay for the lowest decile of income earners, which was also the level
of earnings with the largest differential between Wales and the UK. Because this level of
income was below the personal allowance threshold, this pay growth divergence will not
have influenced the relative performance of the NS-ND tax base. As illustrated in figure 2.4, it
is relative trends in the pay of higher-earning individuals which have the largest impact on the
relative performance of the Welsh tax base, simply because these taxpayers account for a
much larger proportion of earned income.
This section has analysed some of the main differences between the Welsh NS-ND income
tax base and that of the rUK, highlighting the factors which will affect the relative
performance of the Welsh tax base and monies available to the Welsh Government’s
resource budget after the devolution of income tax. The following section considers the most
important influences on the second-largest of Wales’ new devolved taxes, the Land
Transaction Tax.
2.2 Land Transaction Tax
From April 2018, the Stamp Duty Land Tax was replaced by the devolved Land Transaction
Tax (LTT) in Wales. LTT is payable when buildings or land are bought or leased, and the
Welsh Government is able to determine its own thresholds, bands and rates.
The tax policy options made available by the devolution of Land Transaction Tax has already
sparked debate, with the Welsh Government having announced new rates and thresholds as
part of its Draft Budget for 2018-19 in October 2017. Contributing to this discussion, this
section analyses some of the underlying characteristics and trends in the property
transaction tax base in Wales.
Characteristics of Wales’ property transaction tax base
In 2016-17, SDLT raised £210 million in Wales from 59,000 property transactions.
Residential property transactions accounted for two-thirds of receipts; the 6,000 non-
residential transactions accounted for the remainder.
Figure 2.13 presents the price distribution of residential property transactions in Wales in
2015-16. Nearly 42 per cent of transactions were valued below £125,000, the starting
threshold under the current SDLT system. Nearly 69 per cent of transactions would have
fallen below the proposed £180,000 starting threshold for the new LTT structure now

The Welsh Tax Base: Risks and Opportunities after Fiscal Devolution 30
implemented by the Welsh Government. Only 14 per cent of transactions were above
£250,000, and three per cent above £400,000.
However, in parallel with income tax, this relatively small number of higher valued
transactions accounted for a larger share of total transaction property values. For instance,
the 14 per cent of transactions over £250,000 accounted for nearly a third of the value of
transactions, while the top three per cent above £400,000 accounted for 11 per cent. Under
the previous SDLT system, these higher-valued transactions accounted for an even higher
share of total receipts; 72 per cent of receipts came from transactions over £250,000, while
36 per cent were derived from transactions over £400,000. The share of revenue deriving
from higher valued transactions is likely to increase with the new LTT structure, as a result of
the higher starting threshold for transactions and the higher rates that will be applied to
higher bands.
Figure 2.13: Price distribution of property transactions in Wales, number of
transactions (2015-16)
Figure 2.14: Price distribution of property transaction in Wales, total property
values (2015-16)
0
50,000,000
100,000,000
150,000,000
200,000,000
250,000,000
40,0
00
55,0
00
70,0
00
85,0
00
100
,000
115
,000
130
,000
145
,000
160
,000
175
,000
190
,000
205
,000
220
,000
235
,000
250
,000
265
,000
280
,000
295
,000
310
,000
325
,000
340
,000
355
,000
370
,000
385
,000
400,0
00
500
,000
650
,000
925
,000
Tota
l p
rop
ert
y v
alu
es
(£)
Transaction value (£)
Source: Bangor University (2017)
0
200
400
600
800
1,000
1,200
1,400
1,600
1,800
2,000
40,0
00
55,0
00
70,0
00
85,0
00
100
,000
115
,000
130
,000
145
,000
160
,000
175
,000
190
,000
205
,000
220
,000
235
,000
250
,000
265
,000
280,0
00
295
,000
310
,000
325
,000
340
,000
355
,000
370
,000
385
,000
400
,000
500
,000
650
,000
925
,000
Nu
mb
er
of tr
an
sac
tio
ns
Transaction value (£)
Source: Bangor University (2017)

The Welsh Tax Base: Risks and Opportunities after Fiscal Devolution 31
In its 2017 devolved tax forecast, the Office for Budget Responsibility observes that the large
share of houses below the starting threshold has implications for tax policy and likely future
growth in revenues. Firstly, many transactions are only taxable if they are subject to the
surcharge on second (and additional) properties, so this source of revenue is particularly
important in Wales. Second, as Wales’ price distribution is skewed towards lower-value
transactions, there is increased likelihood of ‘fiscal drag’ in Wales compared with the rUK.
This is the case of transactions that are currently not liable for tax becoming so over time,
with house price inflation and fixed thresholds, potentially leading to faster revenue growth in
Wales.
Figure 2.15: Price distribution of property transactions, Wales and England
(2016)
Figures from HM Land Registry Price Paid data (figure 2.15) illustrate the significant variation
in the house price distribution in Wales from that in England. A far smaller share of properties
in England are sold at lower prices, meaning England’s property transaction tax base is
much more dependent on higher-valued transactions. Although only a negligible portion of
SDLT in Wales is raised from transactions valued over £1 million, these transactions account
for over a third of revenues in the rUK. Transactions valued over £2 million are particularly
important and comprise a fifth of all SDLT revenues raised in the rUK.
A clear implication of Wales’ different price distribution is that changes to UK government
policy (which affect the block grant adjustment through changing comparable revenues in the
rUK) will have very different effects in Wales if they are also applied by the Welsh
Government to the LTT structure. Some UK-wide factors which effect property transactions
0.0%
0.5%
1.0%
1.5%
2.0%
2.5%
3.0%
3.5%
4.0%
% o
f tr
an
sac
tio
ns
ov
er
£4
0,0
00
Source: HM Land Registry Price Paid Data
Wales England

The Welsh Tax Base: Risks and Opportunities after Fiscal Devolution 32
at different points along the price distribution (e.g. international investment into higher-end
property) will also have a different effect on the Welsh tax base compared with the rUK.
The non-residential property transaction tax base in Wales is far more reliant on higher value
transactions. Figure 2.16 shows the distribution of (freehold and lease premium) transactions
and of total transaction value by property price in 2015-16. Although there were only 45
transactions over £5 million, these transactions accounted for 43 per cent of the total
transaction value in 2015-16. Non-residential lease transactions are similarly dependent on
high-value transactions: the 64 lease transactions worth over £2 million accounted for 36 per
cent of total transaction value.
Figure 2.16: Non-residential (freehold and lease premium) SDLT – share of
transactions and total transaction value by property price (2015-16)
Taking freehold and leasehold transactions together, two-thirds of non-residential SDLT
revenue in 2015-16 was generated by transactions over £2 million. The equivalent figure for
the rUK in 2015-16 was 69 per cent. The large share of revenue generated by such a small
number of high-valued transactions means devolved non-residential LTT will be highly volatile:
Just 10 fewer freehold transactions over £5 million in 2015-16 could have reduced revenues
by £7 million.
Past trends in Wales’ property transaction tax base
With such obvious differences in the characteristics of the property transaction tax base in
Wales, it is little surprise that trends in SDLT revenue have often followed a different path to
the rUK. After peaking in 2006-07, SDLT revenues declined significantly in subsequent
years. While revenues in the rUK have recovered (reaching 2007-08 levels again by 2014-
15), revenues in Wales have failed to recover.
0%
5%
10%
15%
20%
25%
30%
35%
40%
45%
-
25
,00
0
50
,00
0
75
,00
0
10
0,0
00
12
5,0
00
15
0,0
00
17
5,0
00
20
0,0
00
22
5,0
00
25
0,0
00
27
5,0
00
30
0,0
00
32
5,0
00
35
0,0
00
37
5,0
00
40
0,0
00
45
0,0
00
50
0,0
00
60
0,0
00
70
0,0
00
80
0,0
00
90
0,0
00
1,0
00
,00
0
1,5
00
,00
0
2,0
00
,00
0
5,0
00
,00
0
Price bin (£)
Share of transactions Share of total transaction value
Source: Bangor University (2017)

The Welsh Tax Base: Risks and Opportunities after Fiscal Devolution 33
Figure 2.18: Stamp Duty Land Tax receipts, Wales and England (2006-07=100)
Some of the poorer performance in revenues can be explained by UK Government policies
having a differential effect in Wales. Much of the reforms of the SDLT tax system - such as
moving away from the old “slab” system, increased taxes on higher value transactions -
which would have raised more revenues in the rUK compared with Wales.
Growth in the number of transactions in Wales has roughly kept pace with the rUK. But
because average property prices in Wales did not recover as quickly from the financial crisis,
SDLT revenue growth has not kept pace with the rUK. Figure 2.19 shows the deviation in
average house price growth in Wales from the English average from 1996 to 2017. After
much stronger growth in Wales in the first part of the last decade, average house prices
dropped more markedly in Wales than in England during the financial crisis. House prices
have grown by an average of two percentage points more slowly in Wales than in England
since 2006.
As will be explored in section 3, future trends in the number and value of property
transactions in Wales compared with the rUK will be crucial in determining the budgetary
effect of SDLT devolution.
0
20
40
60
80
100
120
140
2006/07 2007/08 2008/09 2009/10 2010/11 2011/12 2012/13 2013/14 2014/15 2015/16
Source: ONS (2017) Country and Regional Public Sector Finances
England
Wales

The Welsh Tax Base: Risks and Opportunities after Fiscal Devolution 34
Figure 2.19: Precentage point deviation of house price growth in Wales from
England average, 1996 – 2017
2.3 Council Tax
In contrast to the new Welsh taxes introduced in the previous sections, most aspects of the
council tax system have been administered by the Welsh Government since devolution in
1999. Introduced in 1993, the tax can be considered a hybrid tax; it is partly a tax on
(historic) property value and partly a charge for local services, with reliefs, exemptions and
rebates reflecting household characteristics. An integral part of local council budgets, it is
levied by local authorities based on property values subject to bands set at the 2003
revaluation. £1.4 billion was raised from over 1.3 million properties in Wales in 2016-17.
The Council Tax system in place lacks buoyancy; annual marginal changes in value have no
impact on council tax liability for individual households or total revenues. Assessed values of
properties do not change until a revaluation takes place; an undertaking which has not
occurred in Wales since 2003 and in England and Scotland since 1991. This means that
local authorities need to increase Council Tax levels on an annual basis simply to keep up
with inflation, let alone with the values of properties in their area.
As shown in figure 2.20, Council Tax revenue in Wales has grown more quickly in Wales
than in England over the last decade. From 2009-10 to 2016-17, average band D council tax
bills were increased at a faster rate in Wales, partly offsetting some of the cuts in grant
funding (Luchinskaya et al. 2017). The Welsh Government decided not to institute a council
tax freeze (as in Scotland) or a tight cap on increases (as in England).
-10%
-5%
0%
5%
10%
15%
Source: HM Land Registry Price Paid data and authors' calculations
Annual growth rate

The Welsh Tax Base: Risks and Opportunities after Fiscal Devolution 35
Figure 2.20: Trends in Council Tax revenue, Wales and England (1999=100)
Council Tax revenue is also influenced by the total number of chargeable dwellings.
Housebuilding and therefore growth in this number has been slower in Wales than in
England, with annual average increases of less than 0.6 per cent between 2006-07 and
2017-18 (compared with 0.75 per cent in England). Growth in chargeable dwellings slowed
after 2008 in both Wales and England, but picked up again in more recent years.
But average growth rates in dwellings across Wales over this period conceals significant
variation between the 22 local authorities. Unsurprisingly, the fastest growing local authorities
in population terms - Cardiff, Newport and Bridgend – have been subject to the most rapid
growth in chargeable dwellings. In contrast, Rhondda Cynon Taf, Blaenau Gwent and
Gwynedd recorded growth in chargeable dwellings of less than four per cent over the entire
period since 2005-06 (when the last Wales-wide revaluation took effect).
100
120
140
160
180
200
220
240
260
280
Source: ONS (2017) Country and Regional Public Sector Finances
Wales
England

The Welsh Tax Base: Risks and Opportunities after Fiscal Devolution 36
Figure 2.21: Growth in chargeable dwellings by Local Authority, 2005-06 to
2017-18
Figure 2.22 shows the distribution of chargeable dwellings by band in 2017-18 and the
percentage change from 2005-06. As is the case elsewhere in the UK, properties are heavily
concentrated in the bottom bands; 57 per cent of chargeable dwellings in Wales are in bands
A, B or C, while only five per cent are charged in the top three bands (G, H and I). The
number of chargeable dwellings in higher bands however has increased more rapidly than in
the lower bands since 2005-06.
0.0% 2.0% 4.0% 6.0% 8.0% 10.0% 12.0%
Newport
Pembrokeshire
Bridgend
Cardiff
Carmarthenshire
Merthyr Tydfil
Wrexham
Monmouthshire
Powys
Flintshire
Wales
Caerphilly
Ceredigion
Conwy
Swansea
Denbighshire
Vale of Glamorgan
Isle of Anglesey
Torfaen
Neath Port Talbot
Rhondda Cynon Taf
Blaenau Gwent
Gwynedd
Source: Statswales
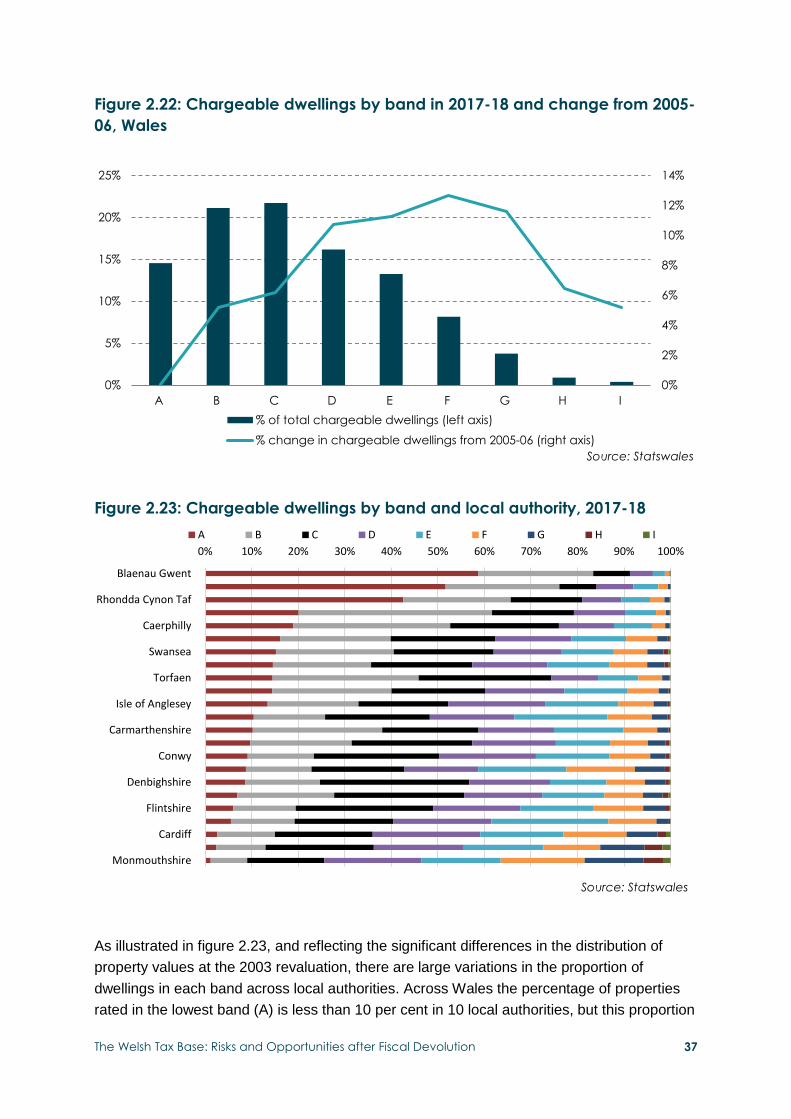
The Welsh Tax Base: Risks and Opportunities after Fiscal Devolution 37
Figure 2.22: Chargeable dwellings by band in 2017-18 and change from 2005-
06, Wales
Figure 2.23: Chargeable dwellings by band and local authority, 2017-18
As illustrated in figure 2.23, and reflecting the significant differences in the distribution of
property values at the 2003 revaluation, there are large variations in the proportion of
dwellings in each band across local authorities. Across Wales the percentage of properties
rated in the lowest band (A) is less than 10 per cent in 10 local authorities, but this proportion
0%
2%
4%
6%
8%
10%
12%
14%
0%
5%
10%
15%
20%
25%
A B C D E F G H I
Source: Statswales
% of total chargeable dwellings (left axis)
% change in chargeable dwellings from 2005-06 (right axis)
0% 10% 20% 30% 40% 50% 60% 70% 80% 90% 100%
Blaenau Gwent
Rhondda Cynon Taf
Caerphilly
Swansea
Torfaen
Isle of Anglesey
Carmarthenshire
Conwy
Denbighshire
Flintshire
Cardiff
Monmouthshire
Source: Statswales
A B C D E F G H I
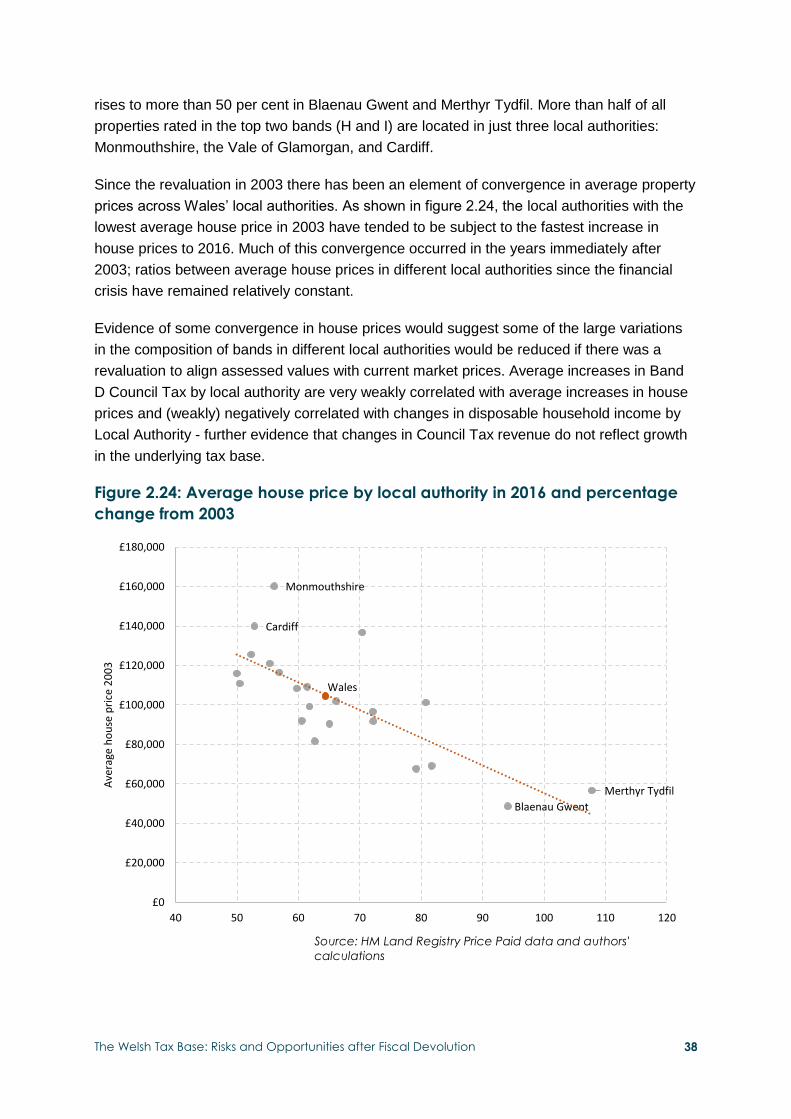
The Welsh Tax Base: Risks and Opportunities after Fiscal Devolution 38
rises to more than 50 per cent in Blaenau Gwent and Merthyr Tydfil. More than half of all
properties rated in the top two bands (H and I) are located in just three local authorities:
Monmouthshire, the Vale of Glamorgan, and Cardiff.
Since the revaluation in 2003 there has been an element of convergence in average property
prices across Wales’ local authorities. As shown in figure 2.24, the local authorities with the
lowest average house price in 2003 have tended to be subject to the fastest increase in
house prices to 2016. Much of this convergence occurred in the years immediately after
2003; ratios between average house prices in different local authorities since the financial
crisis have remained relatively constant.
Evidence of some convergence in house prices would suggest some of the large variations
in the composition of bands in different local authorities would be reduced if there was a
revaluation to align assessed values with current market prices. Average increases in Band
D Council Tax by local authority are very weakly correlated with average increases in house
prices and (weakly) negatively correlated with changes in disposable household income by
Local Authority - further evidence that changes in Council Tax revenue do not reflect growth
in the underlying tax base.
Figure 2.24: Average house price by local authority in 2016 and percentage
change from 2003
Monmouthshire
Cardiff
Wales
Merthyr Tydfil
Blaenau Gwent
£0
£20,000
£40,000
£60,000
£80,000
£100,000
£120,000
£140,000
£160,000
£180,000
40 50 60 70 80 90 100 110 120
Ave
rage
ho
use
pri
ce 2
00
3
% change from 2003 to 2016Source: HM Land Registry Price Paid data and authors'
calculations
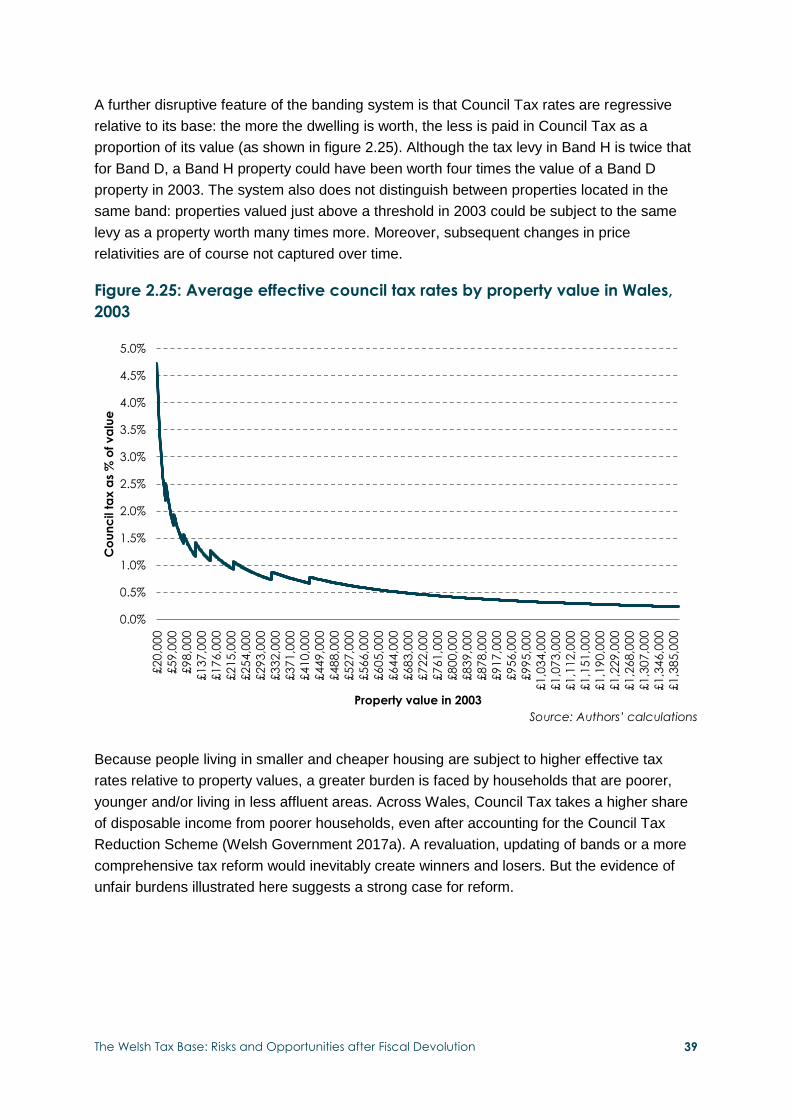
The Welsh Tax Base: Risks and Opportunities after Fiscal Devolution 39
A further disruptive feature of the banding system is that Council Tax rates are regressive
relative to its base: the more the dwelling is worth, the less is paid in Council Tax as a
proportion of its value (as shown in figure 2.25). Although the tax levy in Band H is twice that
for Band D, a Band H property could have been worth four times the value of a Band D
property in 2003. The system also does not distinguish between properties located in the
same band: properties valued just above a threshold in 2003 could be subject to the same
levy as a property worth many times more. Moreover, subsequent changes in price
relativities are of course not captured over time.
Figure 2.25: Average effective council tax rates by property value in Wales,
2003
Source: Authors’ calculations
Because people living in smaller and cheaper housing are subject to higher effective tax
rates relative to property values, a greater burden is faced by households that are poorer,
younger and/or living in less affluent areas. Across Wales, Council Tax takes a higher share
of disposable income from poorer households, even after accounting for the Council Tax
Reduction Scheme (Welsh Government 2017a). A revaluation, updating of bands or a more
comprehensive tax reform would inevitably create winners and losers. But the evidence of
unfair burdens illustrated here suggests a strong case for reform.
0.0%
0.5%
1.0%
1.5%
2.0%
2.5%
3.0%
3.5%
4.0%
4.5%
5.0%
£2
0,0
00
£5
9,0
00
£9
8,0
00
£1
37,0
00
£1
76,0
00
£2
15,0
00
£2
54,0
00
£2
93,0
00
£3
32,0
00
£3
71,0
00
£4
10,0
00
£4
49,0
00
£4
88,0
00
£5
27,0
00
£5
66,0
00
£6
05,0
00
£6
44,0
00
£6
83,0
00
£7
22,0
00
£7
61,0
00
£8
00,0
00
£8
39,0
00
£8
78,0
00
£9
17,0
00
£9
56,0
00
£9
95,0
00
£1
,03
4,0
00
£1
,07
3,0
00
£1
,11
2,0
00
£1
,15
1,0
00
£1
,19
0,0
00
£1
,22
9,0
00
£1
,26
8,0
00
£1
,30
7,0
00
£1
,34
6,0
00
£1
,38
5,0
00
Co
un
cil t
ax
as
% o
f va
lue
Property value in 2003

The Welsh Tax Base: Risks and Opportunities after Fiscal Devolution 40
2.4 Non-Domestic Rates Responsibility for the financial management of Non-Domestic Rates (‘NDR’) was fully
devolved to the Welsh Government in April 2015, and changes in the amount of NDR
collected in Wales now directly influence the size of the Welsh budget.
NDR is raised from businesses and other non-domestic properties, and the receipts are
pooled and distributed back to local authorities. The Valuation Office Agency (VOA)
assesses the rateable value of properties normally every five years, and the rates for each
property is calculated after a multiplier is applied to this rateable value. The multiplier is set
centrally by the Welsh Government each year and is usually increased up to the RPI
measure of inflation.
NDR was levied on 109,000 properties in Wales and receipts (net of refunds) totalled £962
million in 2016-17. Revenues in Wales have grown slightly more slowly than in England since
2010-11.
Figure 2.26: Trend in non-domestic rates revenue in Wales (1999-00 = 100)
NDR revenues can also vary with the underlying tax base if there is a change in the number
(or average value) of rateable properties from year to year. Average annual growth in total
number of rateable properties in Wales has increased broadly in parallel with England since
2003-04, with average annual growth increases of just under one per cent each year to
2015-16, recovering from a slight fall in previous years.
As illustrated in figure 2.27, the number of rateable properties added to the Welsh tax base
varied significantly by sector over this time period. In a similar pattern to England, the retail
sector – which accounts for one-third of the number of rateable properties in Wales -
recorded a slight fall in the number of properties. The number of industrial sector properties
100
110
120
130
140
150
160
170
180
190
200
Source: ONS (2017) Country and Regional Public Sector Finances
Wales

The Welsh Tax Base: Risks and Opportunities after Fiscal Devolution 41
increased steadily in more recent years but fell as a proportion of total properties, primarily
because of a rapid increase in the number of office sector developments.
Figure 2.27: Rateable properties by sector (2000-01 = 100)
Although the total number of retail sector properties fell during this period, the average value
per rateable property in the retail sector has increased significantly since 2000-01, outpacing
the average value per rateable property in the industrial sector. Therefore, retail’s share of
overall rateable value in Wales has increased despite a smaller overall number of rateable
properties. As shown in figure 2.28, average rateable value per square metre in Wales
remains below that of England across all sectors, with the office sector subject to the largest
differential.
Figure 2.28: Average rateable value per square metre by sector in Wales and
England
80
90
100
110
120
130
140
150
Source: Valuation Office Agency (VOA) administrative data
Retail sector Office sector Industrial sector Other sector
0
20
40
60
80
100
120
140
160
180
Retail
sector
Office
sector
Industrial
sector
Other
sector
Retail
sector
Office
sector
Industrial
sector
Other
sector
Wales England
Ra
tea
ble
va
lue
pe
r m
2 (
£/m
2)
Source: Valuation Agency Office (VAO) administrative data
2000-01
2015-16

The Welsh Tax Base: Risks and Opportunities after Fiscal Devolution 42
Figure 2.29: Rateable value by property type, 2015-16
These sectoral differences in the Welsh NDR tax base compared with England can be
identified via the shares of total rateable value derived from different types of properties on
the local list.8 Industrial and utilities properties account for a much larger share of the NDR
tax base in Wales. In contrast, office properties are much more prominent in the English tax
base. These differences in tax base composition increases the likelihood of different growth
rates between Wales and England if certain sectors experience asymmetric economic
shocks.
As with council tax, there is significant variation in trends in the NDR tax base across the 22
local authorities, with some seeing far more rapid growth in total rateable value than others in
recent years. Overall, Cardiff accounts for approximately 20 per cent of total rateable values
in Wales, a share which has been steadily increasing in recent years. This means tax base
trends in the capital will likely have a large impact on total NDR collections in the future.
8 Local authorities are responsible for collecting NDR from properties on the local list, which accounts for around
90% of total NDR raised in Wales. The smaller Central List (collected centrally by the Welsh Government) accounts for the rest.
0% 10% 20% 30% 40% 50% 60% 70% 80% 90% 100%
England
Wales
Source: Valuation Agency Office (VAO) administrative data
Offices Shops Warehouses
Other Commercial Educational, training & cultural Utilities
Industrial Leisure Miscellaneous

The Welsh Tax Base: Risks and Opportunities after Fiscal Devolution 43
Figure 2.30: Change in total rateable value and the number of rateable
properties by local authority (2000-01 to 2015-16)
Overall, only a relatively small number of properties in Wales have a high rateable value, with
only 200 properties valued over £1m. These properties are however very important to overall
revenues, and changes in the number and nature of these types of properties have a large
bearing on overall trends in the NDR tax base. As highlighted in a recent (2017) Bangor
University report, if just 10 properties with a rateable value of £3 million each were lost
through moving elsewhere or closure, total revenue would fall by 1.5 per cent. This is
particularly true for certain industries – just 10 iron & steel works properties account for
nearly two per cent of total rateable value on the local list.
-20% 0% 20% 40% 60% 80% 100% 120%
Pembrokeshire
Carmarthenshire
Ceredigion
Cardiff
Caerphilly
Merthyr Tydfil
Conwy
Swansea
Neath Port Talbot
WALES
Powys
Bridgend
Denbighshire
Flintshire
Rhondda Cynon Taf
Blaenau Gwent
Monmouthshire
Torfaen
Wrexham
Newport
Isle of Anglesey
The Vale of Glamorgan
Gwynedd
Source: Valuation Agency Office (VAO) administrative data
Total rateable value
Number of rateable
properties

The Welsh Tax Base: Risks and Opportunities after Fiscal Devolution 44
2.5 Landfill Disposals Tax
The Landfill Disposals Tax (LDT) was introduced in Wales from 1 April 2018, replacing the
UK Government’s Landfill Tax. The purpose of LDT is to reduce the amount of waste sent to
landfill. It is paid by around 20 landfill sites across Wales, and is forecast to raise around £28
million in 2018-19 (Bangor University 2017), making it by far the smallest of the tax revenues
under Welsh Government control. The Welsh Government announced that the lower rate
(charged on non-hazardous and low polluting waste) and standard rate will remain consistent
with those in the rUK for a period of two years.
Declining amounts of standard rate waste from Welsh Local Authorities (ibid) has led to
declining revenues from the tax in recent years. Revenues are forecast to decline by a fifth
by 2021-22, depending on future trends in standard waste. The OBR forecasts Landfill Tax in
the rUK will also decline over coming years. Given the relatively small amount of revenue
generated by the tax, it presents very little risk to the overall Welsh budget. The devolution of
the tax does however present another environmental policy lever for the Welsh Government,
and future trends in revenue will reflect its success in reducing waste to landfill in Wales.

The Welsh Tax Base: Risks and Opportunities after Fiscal Devolution 45
3. Risks and Opportunities
3.1 Employment and wage growth As outlined in section 2, differing labour market trends in Wales will influence the relative
performance of the NSND income tax base in Wales after partial tax devolution in April 2019.
This section explores the potential impact of devolved taxes on the Welsh budget if
employment and earnings grow relatively faster or more slowly than in the rUK.
To calculate a number of possible scenarios, this section uses data from the Survey of
Personal Incomes (SPI) to run a microsimulation of devolved tax revenues drawn from
various assumptions of growth in the Welsh tax base. We use the latest available data for
2014-15 as a base year to calculate NSND income from different sources of income for each
individual in the sample. We adjust this for reliefs and allowances before applying thresholds
for each income tax band to estimate taxable income at each band. Rolling this dataset
forward, each individual’s different sources of income are grown according to various
average earnings growth assumptions. Demographic and labour market participation
changes are captured by adjusting the weighting applied to each individual in the sample
from year to year, assuming different levels of population and employment rate growth for
each age category. Allowances and thresholds are updated according to previously-
announced UK government policy (or Conservative party manifesto commitments). On the
basis of these assumptions the microsimulation model projects devolved income tax
revenues from Welsh taxpayers through to 2029-30 along with comparable revenues in the
rUK (excluding Scotland) to calculate the Block Grant Adjustments (BGA). A full methodology
can be found in appendix B.
As explored in section 2.1, there has been a persistent gap of around three to four
percentage points between the age 16+ employment rate in Wales and rUK for many years.
Some of this gap can be explained by a higher percentage of the Welsh population aged
over 65 (20.4 per cent, compared with 17.8 per cent in rUK). Over the last 10 years, the
average gap in the employment rate for those aged between 16 and 64 has been 2.6
percentage points between Wales and the rUK, compared with 3.6 percentage points for all
those aged 16 and over.
There are also stark differences in the employment rate gap when disaggregated between
different age categories; this is shown in figure 3.1. The largest and most persistent gap in
the employment rate between Wales and the rUK is for those aged between 55 and 65; in
contrast, the gap for those aged 35 and 44 is negligible. One possible explanation for this is
a differential age effect in Wales; for example, if higher levels of ill health in Wales are
associated with individuals leaving the labour market at a younger age. However, another
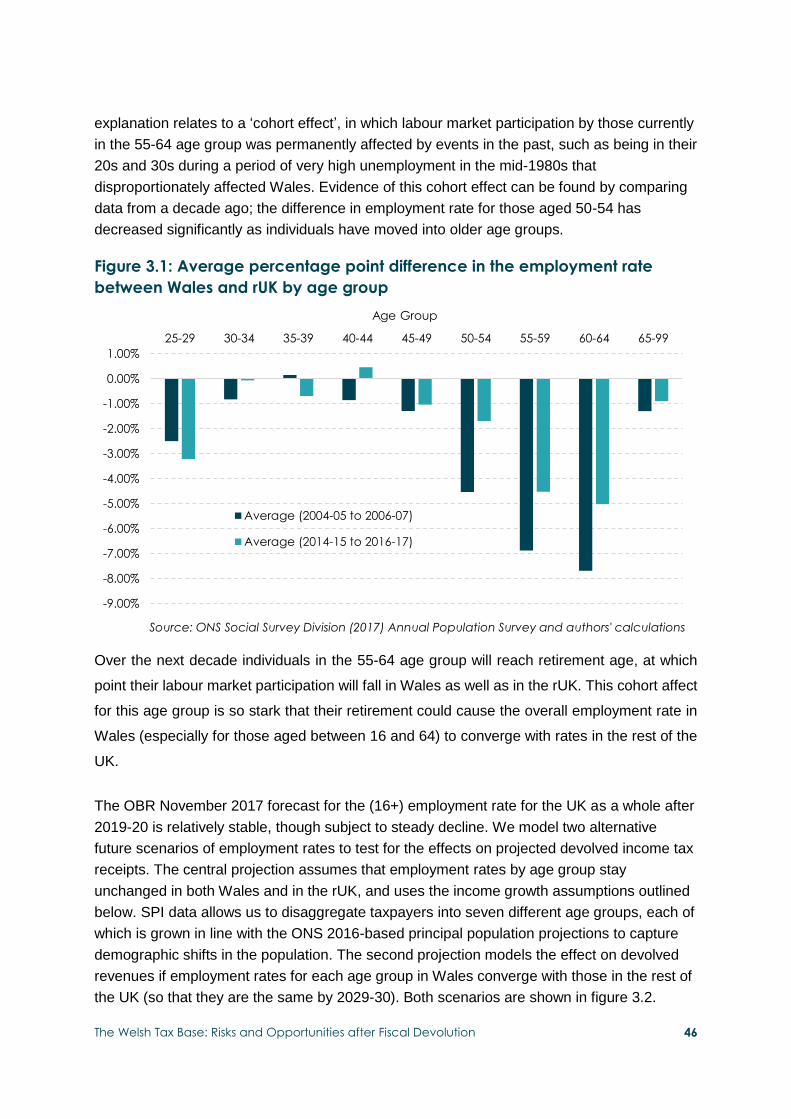
The Welsh Tax Base: Risks and Opportunities after Fiscal Devolution 46
explanation relates to a ‘cohort effect’, in which labour market participation by those currently
in the 55-64 age group was permanently affected by events in the past, such as being in their
20s and 30s during a period of very high unemployment in the mid-1980s that
disproportionately affected Wales. Evidence of this cohort effect can be found by comparing
data from a decade ago; the difference in employment rate for those aged 50-54 has
decreased significantly as individuals have moved into older age groups.
Figure 3.1: Average percentage point difference in the employment rate
between Wales and rUK by age group
Over the next decade individuals in the 55-64 age group will reach retirement age, at which
point their labour market participation will fall in Wales as well as in the rUK. This cohort affect
for this age group is so stark that their retirement could cause the overall employment rate in
Wales (especially for those aged between 16 and 64) to converge with rates in the rest of the
UK.
The OBR November 2017 forecast for the (16+) employment rate for the UK as a whole after
2019-20 is relatively stable, though subject to steady decline. We model two alternative
future scenarios of employment rates to test for the effects on projected devolved income tax
receipts. The central projection assumes that employment rates by age group stay
unchanged in both Wales and in the rUK, and uses the income growth assumptions outlined
below. SPI data allows us to disaggregate taxpayers into seven different age groups, each of
which is grown in line with the ONS 2016-based principal population projections to capture
demographic shifts in the population. The second projection models the effect on devolved
revenues if employment rates for each age group in Wales converge with those in the rest of
the UK (so that they are the same by 2029-30). Both scenarios are shown in figure 3.2.
-9.00%
-8.00%
-7.00%
-6.00%
-5.00%
-4.00%
-3.00%
-2.00%
-1.00%
0.00%
1.00%
25-29 30-34 35-39 40-44 45-49 50-54 55-59 60-64 65-99
Age Group
Average (2004-05 to 2006-07)
Average (2014-15 to 2016-17)
Source: ONS Social Survey Division (2017) Annual Population Survey and authors' calculations

The Welsh Tax Base: Risks and Opportunities after Fiscal Devolution 47
Assuming that average taxpayer employment income is not affected by a more rapid
increase in employment, annual growth in devolved revenues is 0.2 percentage points higher
than in the central projection. This performance would also mean growth in devolved
revenues would out-strip BGAs linked to comparable revenues in the rUK.
Figure 3.2: Projected devolved income tax revenues under two assumptions
on the employment rate in Wales
Figure 3.3 shows the projected annual budgetary impact for the Welsh Government under
both scenarios, and is calculated by subtracting the projected BGAs from projected devolved
revenues. Under the central projection, devolved revenues are projected to slightly outgrow
modelled BGAs because of a slightly stronger “fiscal drag” effect caused by taxpayer
incomes growing more rapidly than the upward adjustments to the higher and additional rate
thresholds. If employment rates converge in 2029-30, the Welsh Government budget would
be more than £100 million better off each year compared with a scenario of no income tax
devolution.
2,000
2,200
2,400
2,600
2,800
3,000
3,200
3,400
2019 2020 2021 2022 2023 2024 2025 2026 2027 2028 2029
£ m
illio
n
Employment rate convergence
Central projection
Source: Authors’calculations

The Welsh Tax Base: Risks and Opportunities after Fiscal Devolution 48
Figure 3.3: Projected effect on the Welsh Government budget under two
assumptions on the employment rate in Wales
As well as the employment rate, assumptions relating to relative growth in incomes also have
a substantial influence on projected devolved revenues in this model. For 2014-15 to 2017-
18, earnings from private and public sector employment are grown according to outturn data
for average pay of employees reported in the Annual Survey of Hours and Earnings (ASHE).
In subsequent years, the OBR forecasts that growth in average earnings (wages and salaries
divided by employees) will increase steadily in nominal terms over coming years, from 2.2
per cent in 2018-19, to 3.1 per cent in 2021-22 (though significantly below previous forecasts
because of their more pessimistic view on productivity growth).
Growth in pay for public sector employees has been lower than in the private sector in both
Wales and the rUK in recent years, influenced by a range of factors, including the pay cap
imposed by the Welsh and UK Governments and local authorities. With UK Government
fiscal consolidation still ongoing, our central projection assumes average public sector
earnings to 2021-22 grow in line with the average from 2011 to 2017 (from ASHE data),
which is a lower rate than the OBR forecast for total growth in average earnings. Modelled
growth in private sector employment income is based on the OBR forecast, adjusted for the
assumed lower growth in public sector income. Earnings in the public and private sectors are
assumed to grow at the same rate after 2021-22. State pension incomes are grown under
the OBR assumption of the UK government continuing its ‘triple lock’ policy, while private
pension incomes are grown in line with the long term average from the SPI data.
Under these assumptions of income growth in Wales, devolved revenues grow at an average
of 3.8 per cent a year (as in the central projection in figure 3.2). Although this is broadly in
line with comparable revenue growth in the rUK under the same assumptions, devolved
revenues grow slightly faster than the sum of the three BGAs because of the slightly stronger
“fiscal drag” effect explained previously.
-20
0
20
40
60
80
100
120
2019 2020 2021 2022 2023 2024 2025 2026 2027 2028 2029
£ m
illio
n
Employment rate convergence
Central projection
Source: Authors’calculations

The Welsh Tax Base: Risks and Opportunities after Fiscal Devolution 49
To explore the potential budgetary impact of faster or slower wage growth in Wales, we
model the effect of average Welsh private sector employment income growing 0.5
percentage points more rapidly and 0.5 percentage points more slowly than in the rUK, from
2018-19 onwards. This is close to the average differential of annual pay growth of employees
in Wales compared with rUK between 2011 and 2017 (see figure 2.11). Average annual pay
for private sector employees in Wales is currently around 78 per cent of the UK average, and
would increase to 83 per cent of the UK level by 2029-30 under the higher growth projection.
As illustrated in figure 3.4, the difference in devolved revenues under these two income
growth scenarios is significant, totalling £133 million by 2024-25 and £323 million in 2029-30.
Figure 3.4: Projected devolved income tax revenues under three assumptions
on private sector earnings growth in Wales
Figure 3.5: Projected effect on the Welsh Government budget under three
assumptions on private sector earnings growth in Wales
1,900
2,100
2,300
2,500
2,700
2,900
3,100
3,300
3,500
2019 2020 2021 2022 2023 2024 2025 2026 2027 2028 2029
£ m
illio
n
0.5% point faster growth
Same growth in earnings
0.5% point slower growth
-150
-100
-50
0
50
100
150
200
2019 2020 2021 2022 2023 2024 2025 2026 2027 2028 2029
£ m
illio
n
0.5% point faster growth
Same growth in earnings
0.5% point slower growth
Source: Authors’calculations
Source: Authors’calculations

The Welsh Tax Base: Risks and Opportunities after Fiscal Devolution 50
Figure 3.5 demonstrates the projected budgetary effect for the Welsh Government under
these three wage growth scenarios. Although the annual effects are relatively small,
sustained differences in average wage growth in Wales would have a material effect on the
Welsh Government budget in the medium- to long- term. For example, the Welsh budget
would be over £50 million smaller after five years of wage growth at the lower level. On the
other hand, extra revenues from sustained private sector earnings growth in Wales at the
higher level are the equivalent of increasing the higher rate of income tax in Wales by 2p by
2024-25 and 3p by 2029-20 (assuming no behavioural response). Assuming larger
differences in average private sector incomes growth over time increases the projected
budgetary impact of tax devolution. For example, if private sector earnings grow one
percentage more slowly in Wales each year, more than £20 million each year would be lost
from the Welsh budget.
Comparing budgetary projections under different assumptions of employment and income
growth, the Welsh Government would appear to be more exposed to earnings growth
divergence rather than employment growth divergence. For example, a small but sustained
divergence in income growth in Wales would generate more additional funding for the Welsh
Government than closing the employment rate gap entirely over the first decade of income
tax devolution.
These scenarios illustrate how relative trends in the Welsh economy over time will have a
direct effect on the Welsh budget after income tax devolution. The Welsh Government bears
the risk of slower growth but will be rewarded with extra funding to spend on devolved
services if employment and wages grow relatively strongly.
3.2 Productivity trends and determinants
The relative growth in the employment income of taxpayers in Wales will depend on a
number of factors, of which relative trends in productivity are among the most significant.
Much of the current gap between Gross Value Added (GVA) per head in Wales and the rUK
can be attributed to lower productivity: GVA per hour worked in Wales was £26.90 in 2015,
just 82.4 per cent of the UK average. This gap has widened slightly over the last decade,
though annual variability makes it difficult to identify clear trends.
This measure of productivity has a close link to levels of employee pay at a regional level in
the UK, as seen in figure 3.6 below. Sustained higher earnings growth that would increase
the funds available to the Welsh budget – i.e. by income tax receipts outpacing BGAs – will
require at least a narrowing of this productivity gap. Any sustained movements in relative

The Welsh Tax Base: Risks and Opportunities after Fiscal Devolution 51
productivity could only be secured in response to long-run trends, mirroring the economic
effects of Welsh Government policies which also mainly operate over the long term.
Figure 3.6: Pay and productivity by country and region, 2016 (UK = 100)
One important determinant of regional earnings differentials in the UK is the distribution of
human capital. Figure 3.7 compares the qualifications level of the aged 16-64 population in
Wales with that of the rUK. A smaller share of the Welsh population have a graduate-level
education (NQF Level 4 and above), and a higher share of the population are without NQF
Level 3 qualifications or trade apprenticeships. UK regions that have a far higher share of
graduates – London, Scotland, the South East and the South West of England – tend to be
among the best performing regions in terms of pay and productivity.
Figure 3.7: Qualifications levels in Wales and rUK, 2017
0% 10% 20% 30% 40% 50% 60% 70% 80% 90% 100%
Wales
rUK
Source: ONS (2017) Labour Force Survey Spring 2017
NQF Level 4 and above NQF Level 3 Trade apprenticeships NQF Level 2Below NQF Level 2 Other qualifications No qualifications
Yorkshire & the
Humber
East of England
London
South East
Wales
Scotland
R² = 0.9671
70
80
90
100
110
120
130
140
150
70 80 90 100 110 120 130 140
An
nu
al p
ay f
or
all
em
plo
ye
es
by r
eg
ion
(U
K =
10
0)
GVA per hour worked by region (UK = 100)
Source: ONS (2018); ONS (2017) ASHE

The Welsh Tax Base: Risks and Opportunities after Fiscal Devolution 52
There is also evidence of an increasing wage premium for skills in the UK over recent
decades that has been triggered by skills-based technological change. Increasing ‘job
polarization’ has been identified by a number of studies and has resulted in increased
disparities between the highest and lowest earners. Wage premiums relative to local
averages for workers with different qualification levels are generally similar between Wales
and the rUK. For example, the ONS’ Annual Population Survey found the hourly pay of
graduates to be approximately 27 per cent higher than the respective average wage in Wales
and in the rUK in 2017. This corresponds with Duranton and Monastiriotis (2002), who
identified a convergence in the relative returns to education and experience across all
regions of the UK during the 1980s and 1990s. However, an increasingly uneven regional
distribution of human capital and rising inequalities between skilled and unskilled workers
magnified overall regional variation in earnings.
Because the incomes of higher earners constitute a large share of NSND income, relative
movements in the share of Wales’ highly-skilled population (and the wage premium those
skills attract) will be an important factor in the relative performance of the Welsh income tax
base.
Significant technological changes are anticipated over at the first decades of income tax
devolution, which will affect employment, productivity and the income tax base in Wales.
There are many studies that have estimated the number and type of jobs that are likely to be
‘at risk’ of automation in the UK, although few have directly focused on Wales (Bell et al.
2017). Analysis of Labour Force Survey data shows Wales to have a higher share of jobs in
routine or semi-routine occupations that are already particularly at risk from automation.
Future waves of automation could affect a much broader range of occupations and industries
(Roberts et al. 2017). In an influential study, Frey and Osborne (2017) consider the
susceptibility of jobs in the US to computerisation over coming decades. Using this data,
Roberts et al. (2017) calculate that approximately 44 per cent of jobs in the UK could feasibly
be automated, a figure which aligns with a Bank of England estimate (Haldane 2015). The
proportion of jobs at high risk of automation in Wales is slightly higher at 46 per cent (Roberts
et al. 2017).
Beyond focusing on ‘at risk’ jobs, Bakhshi et al. (2017) identify a number of technological,
globalising and demographic changes which will affect the demand for different occupations.
They estimate that approximately one fifth of the UK workforce are currently in occupations
that are likely to contract, and that one in 10 work in occupations which are likely to grow.
These risks and opportunities are not evenly distributed across the UK (Centre for Cities
2018). Applying the probabilities estimated by Bakhshi et al. (2017) of increasing or
decreasing demand for occupations to LFS data, Wales has a slightly higher share of jobs in
occupations which are expected to contract in the future (23 per cent) than does the rUK (21
per cent). Occupations for which Bakhshi et al. (2017) anticipate future growth constitute a
similar share of all current jobs in Wales and in the rUK. However, a larger share of the jobs

The Welsh Tax Base: Risks and Opportunities after Fiscal Devolution 53
likely to experience an increase in demand are currently in publicly-funded occupations in
Wales, and a lower share are in higher-skilled private sector occupations.
Although the ultimate effect of future technological change on the labour market is highly
uncertain, automation clearly presents a risk to the relative performance of the Welsh income
tax base. Wales’ current workforce would appear to be more exposed to the risks of
automation. Technological change is likely to increase income inequality, because some
highly skilled labour in roles which complement machines will be well remunerated, leading
to some higher incomes. Because any such process would result in the UK income tax base
becoming even more reliant on high earners, the relative performance of the Welsh tax base
could fall behind if relatively fewer of these ‘winners’ from automation pay income tax in
Wales.
3.3 Population and demographics
The Office for National Statistics’ 2016-based principal population projections anticipate that
the Welsh population will grow by approximately 0.4 per cent per year from 2016, and that
these increases will lose pace in subsequent years. This rate is around 0.2 percentage points
behind the projected population growth in the rUK. Given population cohort patterns, the
Welsh population aged between 16 and 64 is projected to decrease in absolute terms from
2018 and by 2022, the gap in the annual population growth rate of those aged 16-64 in
Wales and the rUK is expected to reach 0.4 percentage points.
As shown in figure 3.8, relative trends in population growth effect not only the growth in
Wales’ tax base but also changes in the age profile of the total population.
Figure 3.8: Population by single year of age, Wales and rUK, 2016
0.0%
0.2%
0.4%
0.6%
0.8%
1.0%
1.2%
1.4%
1.6%
0
3
6
9
12
1
5
1
8
2
1
2
4
2
7
3
0
3
3
3
6
3
9
4
2
45
4
8
5
1
5
4
5
7
6
0
6
3
6
6
6
9
7
2
7
5
7
8
8
1
8
4
8
7
9
0
9
3
9
6
9
9
1
02
105
- 1
09
% o
f to
tal p
op
ula
tio
n
Age
Wales
rUK
Source: ONS

The Welsh Tax Base: Risks and Opportunities after Fiscal Devolution 54
Figure 3.9 shows the projected growth of each of the seven age groups of taxpayers from the
SPI data for the first decade of income tax devolution. Trends for each group and differences
between Wales and the rUK can largely be explained by Wales’ different age structure. While
the fastest projected growth by far is for the population aged over 75 in both Wales and the
rUK, Wales’ population aged between 45 and 54 is projected to fall much more sharply than
in the rUK.
Figure 3.9: Projected trends in different age groups, Wales (2019 = 100)
Figure 3.10: Average taxpayer NSND income by age group, 2014-15
In addition to differences in employment rates, average taxpayer NSND incomes vary
significantly between age groups in the SPI sample. The sharper projected fall in the
population aged 45-54 is a cause for future concern for the Welsh tax base, because it is at
80
90
100
110
120
130
140
2019 2020 2021 2022 2023 2024 2025 2026 2027 2028 2029
Source: ONS (2017) 2016-based population projections
75+
35-44
65-74
16-24
55-64
25-34
45-54
£-
£5,000
£10,000
£15,000
£20,000
£25,000
£30,000
£35,000
£40,000
16 - 24 25 - 34 35 - 44 45 -54 55 - 64 65 - 74 75 +
Age Group
Wales rUK
Source: Survey of Personal
Incomes, 2014-15

The Welsh Tax Base: Risks and Opportunities after Fiscal Devolution 55
this age that average incomes are at their highest: taxpayer incomes fall significantly for
older age groups.
A further pattern of interest to the tax base relates to differences in average taxpayer income
between the age groups living in Wales and the rUK. While there is little difference in the
average incomes of the youngest taxpayers, taxpayers aged between 35 and 54 earn 28 per
cent more on average in the rUK than in Wales. Later in life, average incomes of taxpayers
again converge: average incomes for those aged over 65 are only 10 per cent higher in rUK
than in Wales. That taxpayer incomes for older age groups therefore appear subject to a
more significant drop in the rUK than in Wales may suggest that the Welsh income tax base
may be more resilient to an ageing population. ONS projections suggest that the share of the
population aged over 65 will increase by over three percentage points in Wales and the rUK
during the first decade of income tax devolution.
A final major influence on future population trends will be levels of international migration to
and from the UK; Brexit and UK government policy therefore introduce significant uncertainty
into the modelling. In the ONS principal projection, net international migration is assumed to
fall to around 165,000 a year from 2023 onwards, and from 12,700 to just 4,500 a year in
Wales. The ONS also publish projections that assume higher and lower levels of net
migration, where levels are assumed to be initially 40,000 higher or lower and subsequently
80,000 higher or lower at a UK level. In relative terms, levels of net migration to Wales are
assumed to change more dramatically for any given change in net migration to the UK as a
whole. The long-term level of net migration to Wales rises to 9,000 in the high migration
variant projection, and falls to zero in the low migration variant projection.
We use these varying assumptions of international migration to Wales and the rUK to re-run
the simulation of devolved revenues after 2019, keeping employment levels and average
taxpayer income unchanged. Because these changes in international migration assumptions
have a similar effect in both Wales and the rUK, the budgetary effect for the Welsh
Government does not change greatly (although this modelling holds many factors constant
and doesn’t seek to account for the wider economic impacts of changes to international in-
migration and the consequent impact on revenues). However, if we assume a higher level of
net migration in Wales but use the principal ONS projection for the rUK, the Welsh
Government budget would increase by over £10 million per year after 2023-24. Although
related to a number of factors that are held constant here, the model suggests that the Welsh
tax base would fare relatively better with higher levels of net migration, at least from a
demographic perspective.

The Welsh Tax Base: Risks and Opportunities after Fiscal Devolution 56
3.4 Migration and commuting flows across
the Welsh-English border
Migration and cross-border commuting flows will become an object of interest for tax policy
after fiscal devolution. Nearly 48 per cent of the Welsh population live within 25 miles of the
border with England, and 90 per cent live within 50 miles of the border. In England, an even
greater number of people live close to the Welsh border – almost 4.9 million live within 25
miles and 13.7 million within 50 miles,9 a number that is almost four and a half times the
Welsh population. As a result, any changes to migration and commuting flows could have an
impact on the devolved Welsh tax base as income tax is paid in the county of residence.
In the year 2015-16, around 53,170 people migrated out of Wales to England, while 56,950
migrated in the other direction. This represents approximately 1.8 per cent of the Welsh
population. Although this total net migration figure is relatively small, there are marked
differences in net migration by age, as illustrated by figure 3.11. Migration in both directions
peaks at age 19, with a higher rate of students moving into Wales compared with those
leaving. However, for those aged between 21 and 29, there was a large net migration out of
Wales of nearly 5,300. Overall gross rates of migration fall significantly for older age groups.
Figure 3.11: Migration levels between Wales and the rUK, by single year of age
Along with differences by age, net migration between Wales and England also differs in
terms of education levels. Wales is a net loser of graduates every year (Clarke 2017), though
this is primarily a result of being a net importer of students. Detailed analysis by Bristow et al.
9 Independent Commission on Funding & Finance for Wales (2010)
0
1,000
2,000
3,000
4,000
5,000
6,000
7,000
0 3 6 9
12
15
18
21
24
27
30
33
36
39
42
45
48
51
54
57
60
63
66
69
72
75
78
81
84
87
90
93
96
99
102
Single year of age
Out of Wales
In to Wales
Source: ONS (2017)
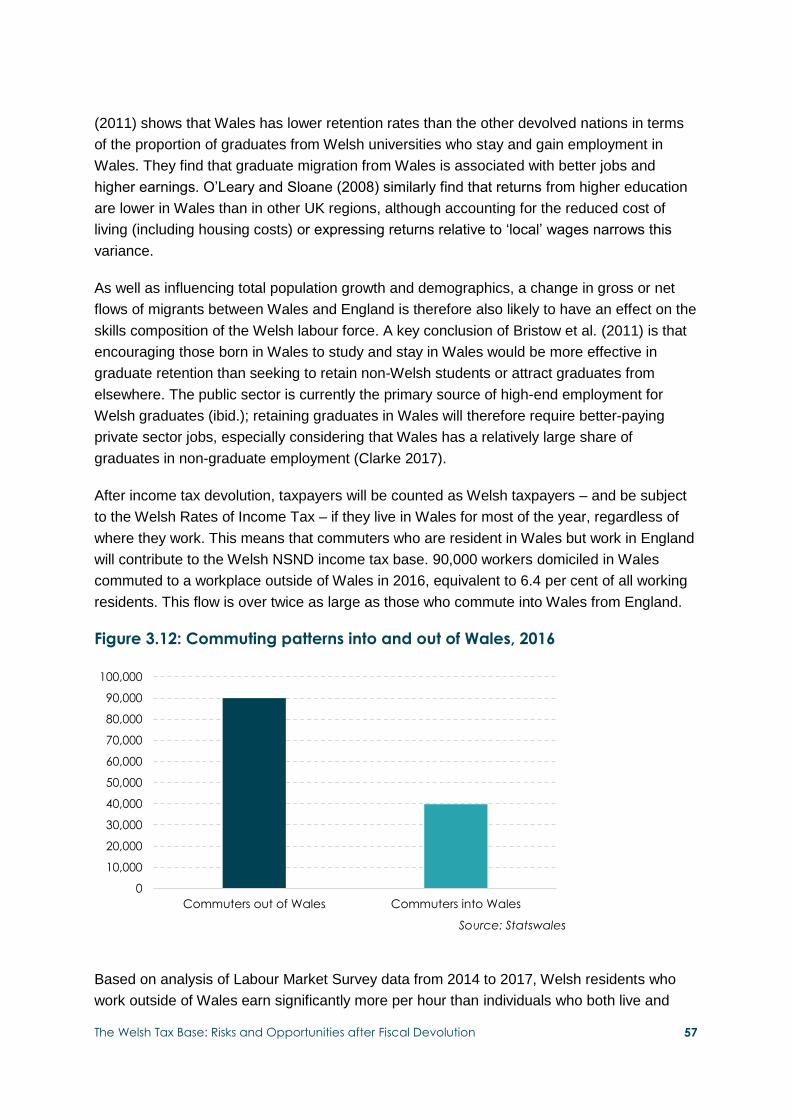
The Welsh Tax Base: Risks and Opportunities after Fiscal Devolution 57
(2011) shows that Wales has lower retention rates than the other devolved nations in terms
of the proportion of graduates from Welsh universities who stay and gain employment in
Wales. They find that graduate migration from Wales is associated with better jobs and
higher earnings. O’Leary and Sloane (2008) similarly find that returns from higher education
are lower in Wales than in other UK regions, although accounting for the reduced cost of
living (including housing costs) or expressing returns relative to ‘local’ wages narrows this
variance.
As well as influencing total population growth and demographics, a change in gross or net
flows of migrants between Wales and England is therefore also likely to have an effect on the
skills composition of the Welsh labour force. A key conclusion of Bristow et al. (2011) is that
encouraging those born in Wales to study and stay in Wales would be more effective in
graduate retention than seeking to retain non-Welsh students or attract graduates from
elsewhere. The public sector is currently the primary source of high-end employment for
Welsh graduates (ibid.); retaining graduates in Wales will therefore require better-paying
private sector jobs, especially considering that Wales has a relatively large share of
graduates in non-graduate employment (Clarke 2017).
After income tax devolution, taxpayers will be counted as Welsh taxpayers – and be subject
to the Welsh Rates of Income Tax – if they live in Wales for most of the year, regardless of
where they work. This means that commuters who are resident in Wales but work in England
will contribute to the Welsh NSND income tax base. 90,000 workers domiciled in Wales
commuted to a workplace outside of Wales in 2016, equivalent to 6.4 per cent of all working
residents. This flow is over twice as large as those who commute into Wales from England.
Figure 3.12: Commuting patterns into and out of Wales, 2016
Based on analysis of Labour Market Survey data from 2014 to 2017, Welsh residents who
work outside of Wales earn significantly more per hour than individuals who both live and
0
10,000
20,000
30,000
40,000
50,000
60,000
70,000
80,000
90,000
100,000
Commuters out of Wales Commuters into Wales
Source: Statswales

The Welsh Tax Base: Risks and Opportunities after Fiscal Devolution 58
work in Wales (around 30 per cent more, though with a large confidence interval around this
figure). Making several assumptions to adjust for datasets that do not exactly align, we
estimate that approximately 7.6 per cent of devolved income tax revenues in 2014-15 would
have been earned in workplaces outside of Wales. Increased commuting from Wales over
time could therefore have a substantial impact on the Welsh budget.
According to 2011 census data, over half of commuters to England from Wales were in the
four local authorities which share a border with England: Flintshire, Wrexham,
Monmouthshire and Powys. An increase in commuters would likely have an impact on the
property tax base in these areas. In 2016, around 16.2 per cent of Welsh residential property
transactions took place in these local authorities, and a 10 per cent increase in the number of
transactions and the average house price in these four local authorities would increase the
total value of property transactions in Wales by around 3.8 per cent. The following section
considers the potential budgetary impact on the Welsh Government of a faster or slower
growing housing market.
3.5 Property market trends
Revenue from residential LTT will be very markedly influenced by the number and value of
residential property transactions in Wales each year. After LTT devolution in April 2018, the
Office for Budget Responsibility forecasts that property transactions across the UK will grow
by around one per cent, and that house prices will grow by four per cent.
Using forecasts produced by the Welsh Government and Bangor University (2017), we can
explore the budgetary effects of transaction and price growth in Wales that diverges from
these UK trends. In figure 3.15, we show the impact of transactions and prices growing 2.5
percentage points per year below and 2.5 percentage points above the UK rates for four
years after tax devolution. Such divergence in growth would have a large impact on LTT
revenues. By 2021-22, under the higher growth assumption residential LTT receipts would
reach more than £350 million and the Welsh Government budget would be more than £92
million bigger, while under the lower growth assumption receipts would be less than £200
million, resulting in £71 million less revenue for the Welsh Government.
Figure 3.16 illustrates this projected budgetary impact for the Welsh Government by
subtracting Block Grant Adjustments – which are linked to growth in Stamp Duty Land Tax
revenues in the rUK - from devolved LTT revenues.Over a relatively short period of time,
differential trends in the housing market of Wales relative to the rUK would result in a
substantial budgetary impact. Were transactions and prices to grow faster in Wales over four

The Welsh Tax Base: Risks and Opportunities after Fiscal Devolution 59
years, the Welsh budget would be around £100 million better off each year by 2021-22.
Conversely, a less buoyant housing market would result in a smaller Welsh budget over time.
Figure 3.15: Projected Residential LTT revenue from 2018-19 under varying
assumptions of transactions and price growth
Figure 3.16: Projected effect on the Welsh budget of a 2.5 percentage point
deviation in transaction and price growth
As was illustrated in figure 2.19, similar periods of house price growth divergence between
Wales and the rUK have been observed in the past. For example, between 1996 to 2000
Welsh house price growth averaged four percentage points below the UK average, but
averaged six percentage points above the UK average from 2002 to 2005.
Figure 3.17 shows the average house price in Wales and in the UK from 1973 onwards and
the ratio between the two averages on the right axis. This ratio has fluctuated significantly
0
50
100
150
200
250
300
350
400
2018-19 2019-20 2020-21 2021-22
£ m
illio
ns
Source: Bangor University (2017)
Faster growth
Matching growth
Slower growth
6 9 8 1022
45
68
102
-9-22
-42
-61-80
-60
-40
-20
0
20
40
60
80
100
120
2018-19 2019-20 2020-21 2021-22
£ m
illio
ns
Matching
growth
Faster growth
Slower growth
Source: Authors’calculations

The Welsh Tax Base: Risks and Opportunities after Fiscal Devolution 60
over the decades, with periods of rapid divergence followed by rapid convergence. With
average house price growth in Wales falling behind the UK, the ratio has been climbing
steadily for over a decade.
Figure 3.17: The ratio between the average mix-adjusted house price in the UK
and Wales, 1973-2017 (nominal prices)
The propensity for regional house prices in the UK to diverge dramatically before narrowing
again has sometimes been termed the ‘ripple effect’ (Meen 1999). House prices rise first in
the south-east of England during an upswing, growth that more gradually spreads out to the
rest of the country over time. Meen identifies a number of national factors which have
differential effects on housing markets across the UK region; in particular, that the housing
market in the ‘South’ is more responsive to changes in interest rates due to greater debt
gearing capacity of households there.
Figure 3.18 shows the ratio between various regional averages and the UK average. While
periods of regional house price divergence in the past appeared to be led by all south-
eastern regions, the recent trend over the last decade appears to have been driven mainly by
central London. Given the significant levels of international investment in London’s property
market, house prices there are likely to be influenced by global trends and be somewhat
detached from other national determinants.
1
1.05
1.1
1.15
1.2
1.25
1.3
1.35
1.4
1.45
1.5
£0
£50,000
£100,000
£150,000
£200,000
£250,000
1973 1976 1979 1982 1985 1988 1991 1994 1997 2000 2003 2006 2009 2012 2015
Source: Nationwide
UK (left axis)
Wales (left axis)
Ratio UK/Wales (right axis)
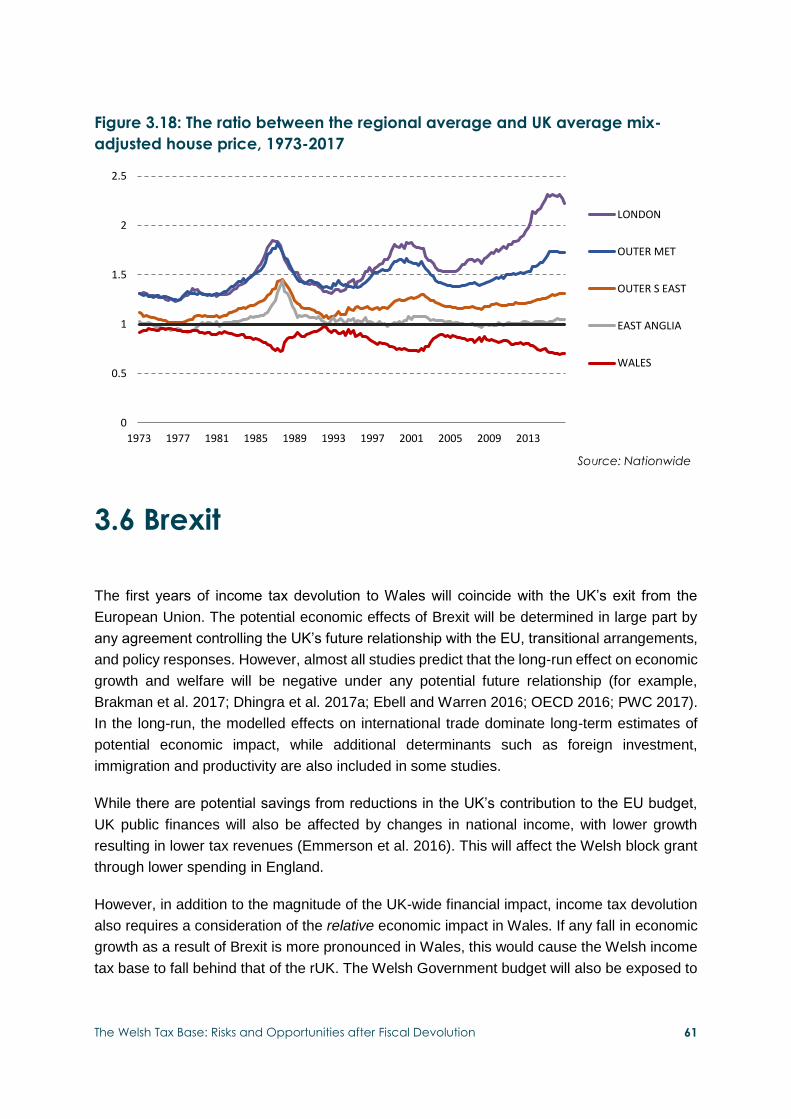
The Welsh Tax Base: Risks and Opportunities after Fiscal Devolution 61
Figure 3.18: The ratio between the regional average and UK average mix-
adjusted house price, 1973-2017
3.6 Brexit
The first years of income tax devolution to Wales will coincide with the UK’s exit from the
European Union. The potential economic effects of Brexit will be determined in large part by
any agreement controlling the UK’s future relationship with the EU, transitional arrangements,
and policy responses. However, almost all studies predict that the long-run effect on economic
growth and welfare will be negative under any potential future relationship (for example,
Brakman et al. 2017; Dhingra et al. 2017a; Ebell and Warren 2016; OECD 2016; PWC 2017).
In the long-run, the modelled effects on international trade dominate long-term estimates of
potential economic impact, while additional determinants such as foreign investment,
immigration and productivity are also included in some studies.
While there are potential savings from reductions in the UK’s contribution to the EU budget,
UK public finances will also be affected by changes in national income, with lower growth
resulting in lower tax revenues (Emmerson et al. 2016). This will affect the Welsh block grant
through lower spending in England.
However, in addition to the magnitude of the UK-wide financial impact, income tax devolution
also requires a consideration of the relative economic impact in Wales. If any fall in economic
growth as a result of Brexit is more pronounced in Wales, this would cause the Welsh income
tax base to fall behind that of the rUK. The Welsh Government budget will also be exposed to
0
0.5
1
1.5
2
2.5
1973 1977 1981 1985 1989 1993 1997 2001 2005 2009 2013
Source: Nationwide
LONDON
OUTER MET
OUTER S EAST
EAST ANGLIA
WALES

The Welsh Tax Base: Risks and Opportunities after Fiscal Devolution 62
changes in the non-domestic rates tax base. Furthermore, variances in net migration from the
European Union may impact demographic pressures to a different extent in Wales.
Despite the wealth of literature analysing the economic impact of Brexit, there are only a few
studies which specifically look at potential regional or local impacts, and these tend to provide
conflicting predictions. Los et al. (2017) use data from the World Input-Output Database to
estimate the share of local GDP which is driven by consumption and investment demand in
the rest of the EU. They find that London and the South East of England are less dependent
on the EU, while the two NUTS2 regions in Wales are broadly in line with the UK average.
Demos (2017) argues that the North East and Wales will experience the greatest loss of goods
exports to the EU, on top of Wales’ greater reliance on EU regional funding.
Conversely, using a long-run static trade model and assumptions on increased trading costs
from a ‘soft’ or ‘hard’ Brexit, Dhingra et al. (2017b) find that London and the South East are
predicted to experience a larger negative impact from Brexit, particularly under a hard Brexit.
This result derives from higher employment shares in Business Activities or Financial
Intermediation in these regions, and that the increase in non-tariff barriers for trade in these
sectors are assumed to be very high. Winters (2016) likewise argues that since trade barriers
will be higher for services, export demand will fall less in regions such as Wales which have
higher income shares generated by manufacturing. Furthermore, London and the South East
may be most negatively affected if trade diverts away from the EU, because EU trade is most
concentrated in the south and east coasts of the UK. However, these regions have proven
more resilient to shocks in the past – for example, although London and the South East of
England were most affected by the financial crisis, output in these regions recovered more
rapidly (Bell and Eiser 2016).
The UK government’s assessment of the economic impact of Brexit, published by the House
of Commons Exiting the European Union Committee, included provisional analyses of the
regional economic impact of Brexit that accounted for regional exposure to trade barriers and
dependence on exports. The predicted negative economic effects for Wales were similar to
the UK average, though slightly worse under the assumptions of a ‘no deal’ scenario (with
trade along WTO rules).
Because these assessments of Wales’ relative economic performance after Brexit are
uncertain, the implications for the resilience of the Welsh tax base is unknown. A key
determinant will be differences in the industry-mix of the Welsh income tax base, outlined in
figures 2.1 and 2.2, and how these various sectors are likely to fare after Brexit. Differences in
the sector composition of the NDR tax base (see figure 2.28) will also be important if the
composition of trade across industries change in response to the exit agreement. The
dependence of Welsh NDR receipts on a relatively small number of large properties implies
this tax base could also be affected if a few large firms decide to relocate out of Wales as a
result of Brexit.

The Welsh Tax Base: Risks and Opportunities after Fiscal Devolution 63
Finally, any change in the level of EU migration after Brexit will also influence demographic
trends. Population projections published by the ONS (2017) include a number of variants
based on different levels of EU migration after 2019. These projections show that if EU
migration falls after Brexit, then Wales’ working age population will continue to shrink at a faster
rate. The working age population would be 0.5 per cent smaller by 2025 assuming 50 per cent
less EU migration, and one per cent smaller assuming an end to EU migration. However, a cut
in EU migration would have a slightly higher proportionate effect on the size of the UK’s working
age population.

The Welsh Tax Base: Risks and Opportunities after Fiscal Devolution 64
4. Options and Implications for
the Welsh Government’s Tax
Strategy This section outlines some of the implications for Welsh Government policy, summarising
and building on contributions made at an expert roundtable event on the Welsh tax base. It is
intended to highlight options and opportunities for the Welsh Government, and to identify
areas for further research and discussion.
Options for Welsh Government tax policy are constrained from above by the reserved
powers of the UK Government, and from below by the interdependence with local
government budgets and responsibilities. The political risks of creating winners and losers
that inevitably result from tax reforms also present another barrier. However, there are strong
arguments for the Welsh Government to utilise some of the powers at its disposal.
To fully realise these opportunities, the Welsh Government will need to take an integrated
approach by considering devolved taxes on a collective basis, and in particular how other
policy levers and objectives might interact. Individuals and households will pay both Council
Tax and Income Tax, and businesses will be affected by both non-residential LTT rates and
business rates. Non-tax policy levers will also be crucial in responding to some of the risks
and opportunities outlined in earlier sections.
4.1 Setting income tax rates in Wales From April 2019, UK Government income tax rates for Welsh taxpayers will be decreased by
10p in the pound, allowing the Welsh Government to set its own income tax rates in each
band. Varying tax rates away from 10p in each band will have a direct effect on the Welsh
Government budget, as well as potentially changing the behaviour of Welsh taxpayers.
As can be seen from figure 4.1, by far the largest revenue effect would result from a change
in the basic rate in Wales; a 1p change in 2019-20 would increase or decrease the Welsh
budget by approximately £184 million. Varying the higher and additional rates would result in
a smaller increase or decrease in tax receipts and affect fewer taxpayers.
The Welsh Government tax rates will apply to taxable income determined by UK Government
thresholds and reliefs. This restriction limits some of the scope for innovative income tax
policy, such as the significant restructuring of Scottish tax bands that came into force in April
2018.

The Welsh Tax Base: Risks and Opportunities after Fiscal Devolution 65
Figure 4.1: Revenue effect of changing each rate by 1p in the pound, with no
behavioural response
Behavioural response to a tax rate change
Were the Welsh Government to change income tax rates in Wales, there would likely be some
behavioural response from Welsh taxpayers. Possible behavioural responses include greater
use of tax planning, tax avoidance or evasion, individuals seeking different jobs or changing
the number of hours worked, and/or migration into and out of Wales. The extent and effects of
behavioural change to be expected is highly uncertain, though it must be considered when
setting income tax policy.
High-income earners are assumed to be the most responsive to income tax rate changes,
because these taxpayers have the largest incentive and the greatest means to change their
behaviour in response to tax policy. Although the Welsh tax base is less dependent on the
incomes of high-earners compared with the rUK, such earners will account for a large share
of the Welsh Government’s income tax revenue (see section 2.1).
Although HM Treasury varied income tax rates on incomes over £150,000 in 2010 and 2012
(firstly from 40p to 50p, then to 45p), estimates of the revenue effects of these changes are
still highly uncertain, because of the significant forestalling of incomes in response to the
changes being pre-announced (Browne and Phillips 2017). Forthcoming changes in Scottish
income tax rates may provide further evidence of taxpayer behavioural response in a devolved
setting, though detailed income tax data for 2018-19 will not be available until 2020.
-250
-200
-150
-100
-50
0
50
100
150
200
250
Basic rate Higher rate Additional rate
£ m
illio
n
+1p
-1p
Source: Authors’calculations

The Welsh Tax Base: Risks and Opportunities after Fiscal Devolution 66
In the academic literature, the extent of behavioural change in response to tax changes are
often captured by estimated Taxable Income Elasticities (TIEs). TIEs are an estimate of the
percentage change in total taxable incomes in response to a one per cent change in the net-
of-tax rate (the share of income retained after tax). Available evidence suggests a very broad
range of TIEs, which vary by income levels, time, type of policy change and country (see table
4.2 of Scottish Fiscal Commission 2018).
As an initial exploration of the Welsh Government’s income tax policy options, table 4.1
presents the revenue effect of changing each Welsh Government tax rate away from 10p in
the pound in 2019-20, using the micro-simulation model outlined in previous sections. Our
central estimate for the behavioural response of taxpayers uses a different assumed TIE for
taxpayers at each marginal rate; namely 0.1 for basic rate taxpayers, 0.2 for higher rate
taxpayers, and 0.5 for additional rate taxpayers. These closely match the assumed TIEs used
by the Scottish Fiscal Commission (2018) in their most recent income tax forecasts for
Scotland. An alternative estimate assuming a larger behavioural response uses TIEs towards
the upper end of estimates from available studies. These TIEs capture behavioural change in
response to changes in the Marginal Effective Tax Rate faced by the taxpayer (i.e. how much
of a £1 rise in gross earnings is lost in tax).
The estimates presented in table 4.1 demonstrate that the Welsh Government would be
relatively shielded from the behavioural response of Welsh taxpayers if it decided to change
income tax rates. Note that the ‘mechanical’ effects of a tax rate change (with no behavioural
change) are relatively close to the revenue effects that assume a behavioural response. For
instance, a 1p increase at the basic rate would raise around £184m in revenue in the absence
of a behavioural response; these receipts would reduce only marginally to £180m even under
an assumption of large income elasticities.

The Welsh Tax Base: Risks and Opportunities after Fiscal Devolution 67
Table 4.1: Revenue effect of devolved income tax policy options in 2019-20
Welsh Government tax policy -
change from 10p
Basic rate Higher rate Additional rate
Mechanical effect (£m) on Welsh
Government budget
With behavioural response (£m) -
without migration response
Difference in tax
liability for
average basic rate earner (£)
Migration required
for revenue effect to
be reversed
Mechanical effect (£m) on Welsh
Government budget
With behavioural response (£m) -
without migration response
Difference in tax
liability for
average higher
rate earner (£)
Migration required
for revenue effect to
be reversed
Mechanical effect (£m) on Welsh
Government budget
With behavioural response (£m) -
without migration response
Difference in tax
liability for
average additional
rate earner (£)
Migration required
for revenue effect to
be reversed
Central (TIE=0.1)
High (TIE=0.2)
Central (TIE=0.2)
High (TIE=0.4)
Central (TIE=0.5)
High (TIE=0.75)
+5p 919 904 888 550 548,226 138 133 127 966 21,661 28 24 21 6089 845
+4p 735 724 712 440 470,428 111 106 102 773 17,869 22 20 17 4871 701
+3p 551 544 536 330 380,661 83 80 77 579 13,833 17 15 13 3653 547
+2p 368 363 358 220 275,174 55 54 52 386 9,529 11 10 9 2436 379
+1p 184 182 180 110 150,509 28 27 26 193 4,928 6 5 5 1218 198
No change 0 0 0 0 0 0 0 0 0 0 0 0 0 0 0
-1p -184 -182 -180 -110 183,146 -28 -27 -26 -236 4,929 -6 -5 -5 -2082 167
-2p -368 -364 -361 -221 412,079 -55 -54 -53 -472 10,290 -11 -10 -10 -4164 355
-3p -551 -547 -540 -331 707,715 -83 -81 -79 -708 16,144 -17 -16 -15 -6245 570
-4p -735 -730 -723 -442 1,101,896 -111 -109 -107 -944 22,560 -22 -21 -21 -8327 818
-5p -919 -914 -906 -552 1,654,837 -138 -137 -134 -1180 29,624 -28 -27 -26 -10409 1,106
Note: average earnings for taxpayers in Wales used for tax increase calculations; average earnings for taxpayers in rUK used for tax decrease
calculations.

The Welsh Tax Base: Risks and Opportunities after Fiscal Devolution 68
While the Welsh Government would bear all the mechanical effect of a tax rate change, it
would be largely insulated from much of the behavioural response, since only a portion of
income tax is devolved. Any changes in earned income because of a Welsh Government tax
rate change would have a greater effect on UK government reserved revenue from income tax
and national insurance contributions. For example, lowering the additional rate in Wales by 5p
in the pound would cost the Welsh Government approximately £28m (assuming no behavioural
response). But any positive effect on the taxable earned income of high earners would primarily
go to the UK government through higher income tax and NICs. Even assuming a high TIE, the
estimated cost for the Welsh Government would still be around £26m.
However, as well as responding to changes in their marginal effective tax rates, taxpayers may
also respond to changes in their average effective tax rate (the proportion of a taxpayer’s total
income which is paid in tax). This type of behavioural response includes leaving or entering
employment, and importantly in Wales’ case, migration to another tax jurisdiction. Table 4.1
also presents the change in tax liability for an average taxpayer at each marginal rate resulting
from a Welsh Government tax change. The subsequent column shows how many taxpayers
would need to migrate from Wales to the rUK (or vice versa) for the revenue effect of a given
tax rate change to reverse.10 For example, a 5p increase in the higher rate of income tax would
cost the average higher rate taxpayer in Wales £966, and it would take over 21,000 higher rate
taxpayers in Wales to leave Wales to offset the additional £133m raised by the tax change.
Any change in the additional rate in Wales would have the largest effect on a taxpayer’s
average effective tax rate and hence present the largest incentive for migration for high income
earners. The required level of migration to offset the revenue effect of an additional tax rate
change is relatively small.
In contrast to Scotland’s devolved tax system, a distinctive feature of the Welsh model is that
the UK government will not be able to respond in kind to a decision to cut income tax by the
Welsh Government. Because any UK government tax cut will also apply in Wales (to the
reserved portion of income tax), any differential between income tax rates in Wales and the
rUK cannot close unless the Welsh Government so chooses.
There is some evidence that differences in tax rates within a country can encourage taxpayers
to relocate or shift their income between jurisdictions (Feld and Reulier 2008; Milligan and
Smart 2015). It has also been argued that higher tax rates discourage in-migration of higher-
earning individuals from other countries more than they encourage out-migration of current
residents (Kleven et al. 2013). The forces of agglomeration may also limit the migration
response of individuals in certain professions or industries (Driessen and Sheffrin 2017).
10 It should be noted that the average tax rate faced by higher and additional rate taxpayers are also influenced by changes in the basic rate. Therefore the migration effect to a basic rate cut could include taxpayers who are on higher marginal rates.
The Welsh Tax Base: Risks and Opportunities after Fiscal Devolution 69
However, migration responses are likely to be very context-specific, and Wales’ particular
circumstances make it hard to draw conclusions from other countries and tax jurisdictions. An
obvious factor will be the already large migration flows across the Welsh-English border
outlined in the previous section. It is possible that the decisions of those already planning on
moving may be influenced by income tax differentials. With several large English cities within
commutable distances of the Welsh border, individuals who do not have to change jobs after
moving may have a greater incentive to migrate to Wales to take advantage of lower tax rates.
There are also a significant number of second homes in Wales and England which are owned
by residents of the other country. Changing their primary residence to these addresses may
allow some taxpayers to take advantage of lower income tax rates, without incurring the costs
of relocation. These decisions would also be influenced by the second-home council tax
premiums charged by some local authorities in Wales.
Converting income between dividend income (still taxed at the UK government rates) and
earned income will also be an additional behavioural response available to some taxpayers.
Taxpayers with total incomes over the additional rate threshold in Wales received around £220
million of dividend income in 2014-15. Tax-motivated incorporations have been increasing in
recent years, and any income tax rate change in Wales may affect the relative trends in
incorporations.
Modelled effect of an additional rate cut in Wales
The estimates presented in table 4.1 suggest that any migration response from Additional
Rate taxpayers will have a high likelihood of materially affecting the revenue effects of Welsh
Government tax rate changes. Since the UK government could not respond to a Welsh
Government tax cut, it is worthwhile to consider the incentive the Welsh Government will
have to abolish the additional rate in Wales, by implementing a 5p cut. While it is impossible
to accurately predict the resulting migratory response, we can crudely calculate the revenue
effect of a given hypothetical migratory response.
There are an estimated 355,000 additional rate taxpayers in the UK.11 Only around 5,000
(1.4 per cent) of these taxpayers currently live in Wales. A third live in London, while another
third live in the South East of England and the East of England. Around 54,000 are resident
in the three regions of England which have borders with Wales, and around 78 per cent of
the population of these regions live within 50 miles of the Welsh border.
11 A further 9,000 additional taxpayers have addresses that are either unknown or abroad in the data.

The Welsh Tax Base: Risks and Opportunities after Fiscal Devolution 70
The average NS-ND income of taxpayers earning over £150,000 was approximately
£359,000 in 2017-18. The average additional rate taxpayer would therefore save over
£10,000 per year through migrating in response to a Welsh Government tax cut. Using the
model outlined in Section 3 and assuming an offsetting positive behavioural response, our
modelling suggests that reducing the additional rate in Wales would incur a budget cost to
the Welsh Government of approximately £27m in 2019-20. The cost of maintaining this tax
cut would grow slowly over time as taxable income over the fixed additional rate threshold of
£150,000 grows.
Table 4.2 presents projections of different levels of migration of additional rate taxpayers,
and the estimated effect these would have on the Welsh Government budget. If around 334
taxpayers (0.1 per cent of rUK taxpayers with incomes over £150k) migrate to Wales, the
cost of the tax cut would fall to £18 million. If 1,100 average additional rate taxpayers
migrated, the cost of the tax cut would reduce to zero, while a stronger migratory response
would provide a boost for the Welsh Government budget. A substantial effect on the Welsh
Government budget however would require a very strong migratory response. For example,
if 5,000 additional rate taxpayers migrated, then the Welsh Government budget would
increase by over £100 million (equivalent to the impact of closing the gap in the employment
rate). This would amount to a doubling of the share of UK additional rate taxpayers living in
Wales.
Table 4.2: Modelling a 5p cut in the additional rate in Wales: revenue effects
of varying migratory responses from additional rate (AR) taxpayers from rUK
Share of rUK AR taxpayers migrating to
Wales
Number of AR taxpayers migrating to Wales
Number of AR taxpayers in Wales
Welsh share of all UK AR taxpayers
Budget effect of migratory response
Budget change after tax cut
0.0% 0 5000 1.4% £0m £-27m 0.1% 334 5334 1.5% £8m £-18m 0.5% 1669 6669 1.9% £42m £16m 1.0% 3337 8337 2.3% £85m £58m 1.5% 5006 10006 2.8% £127m £100m 2.0% 6674 11674 3.3% £170m £143m 2.5% 8343 13343 3.8% £212m £185m 3.0% 10011 15011 4.2% £254m £228m
Note: rUK Additional Rate taxpayers refers to non-Welsh, non-Scottish taxpayers with NS-ND incomes above the additional rate threshold.

The Welsh Tax Base: Risks and Opportunities after Fiscal Devolution 71
4.2 Reforming property tax
Property in Wales provides a large and immobile tax base and has a large revenue-raising
potential. As outlined in section 2, it is currently not taxed in a way that is reflective of the
contours of the underlying tax base. From its introduction in 1993, the Council Tax system has
come under frequent criticism, from its overall design to the use of historic property valuations.
The taxation of property transactions in the form of SDLT has also been subject to wide
criticism.
Council tax reform, and in particular making the system more progressive has been actively
considered by Welsh Government policy-makers (Welsh Government 2017a; 2017b). A more
progressive system would introduce higher rates of council tax for higher value properties or
higher income households. This section considers potential reforms in the context of the issues
raised in this report. While not presenting recommendations, this section looks at some of the
reforms that have been proposed elsewhere, and considers some of the potential effects and
issues which may arise in Wales.
Given the length of time that has transpired since 2003, there is a strong case for a revaluation,
for council tax bills to reflect the significant house price changes which have occurred over the
intervening period. A revaluation would also be an opportunity for at least some reform of the
structure of Council Tax, as the Welsh Government achieved in 2005 with the introduction of
an additional band (Band I). There is somewhat of a consensus in the literature around the
direction which property tax reforms could take.
Making property tax bills more proportional to property values would be a crucial component
of such a reform. The Independent Commission on Local Government Finance Wales (2016)
found that banding reforms would be justified, at least on grounds of fairness, and changing
the tax relativities charged between the nine council tax bands is an option being considered
by the Welsh Government (2017a). Following the recommendations of the Commission on
Local Tax Reform (2015) in Scotland, the Scottish Government increased the tax ratios applied
to upper bands (E-H) relative to Band D, with bills for Band H properties increasing by 22.5
per cent in 2016 (Campbell 2016). This fell short of making the tax relativities proportional to
property values in each band. In Wales, in order to proportionally reflect the differences in mid-
point house price in each band, the ratio applied to Band A properties would need to be
reduced by over two-thirds, while bills for properties in Band H would need to increase by 75
per cent. Increasing the number of bands would also begin to address the problem of the wide
range of property values found within the same bands, especially for higher valued properties.
More fundamental reforms could also be considered. At a UK level, numerous studies have
explored or recommended replacing Council Tax with an annual flat-rate tax on the market

The Welsh Tax Base: Risks and Opportunities after Fiscal Devolution 72
value of a property (Corlett and Gardiner 2018; Leishman et al. 2014; Lawton and Reed 2013;
OECD 2011; Muellbauer 2005) or its annual rental value (Mirrlees 2011). This approach would
be somewhat similar to the domestic rates system in place in Northern Ireland, where regional
and district rates are multiplied by rateable capital values to calculate tax bills (with a maximum
capital valuation of £400,000).12 The exact design of the tax could vary from this simple
calculation. For example, there could be a flat payment charged regardless of property value
(Holtham 2014); a tax-free allowance for a portion of capital value (Corlett and Gardiner 2018);
or progressively higher rates could be charged for higher valued properties (Leishman et al.
2014).
Based on the number of chargeable dwellings and the average value of a house in Wales, a
0.7 per cent flat charge on the value of all properties would yield roughly the same amount of
revenue as the current Council Tax system. This is broadly in line with other estimates of
revenue-neutral reform for Wales (Corlett and Gardiner 2018; Independent Commission on
Funding & Finance for Wales 2010), though this would be higher than the estimated rate
required for revenue-neutral reform at a UK-wide level. The tax rate and structure could be
altered to raise additional revenue if done as part of a broader tax reform (see below).
Figure 4.3 shows a comparison between the average annual tax bills generated under the
current Council Tax system compared with this flat rate tax of 0.7 per cent, by property value.
Based on the distribution of house price sales in 2015-16, approximately 60 per cent of
dwellings would see a reduction of more than £200 in their tax bill each year (not taking account
discounts available under the current system). Conversely, the highest value properties would
see large increases in their annual tax bill.
12 See: https://www.nidirect.gov.uk/articles/how-rate-bills-are-calculated

The Welsh Tax Base: Risks and Opportunities after Fiscal Devolution 73
Figure 4.3: Council tax versus a ‘flat tax’ on property values
Source: Authors’calculations
Any reform should introduce a mechanism to avoid the need for, or reduce the impact of, costly
and large-impact revaluations in the future. For example, the assessed value of houses could
rise each year with a local index of house prices, perhaps smoothed to reflect longer-term
trends (Holtham 2014).
There are strong arguments for creating a stronger link between house prices and taxation in
this manner. The UK property tax system currently treats housing more favourably than other
(potentially more productive) investments. Such a link may also dampen volatility in house
prices, and may be particularly attractive in instances where local or national public investment
in Wales has boosted property values. For example, at a local level, Wang et al. (2015) find a
positive correlation between public transport (namely Cardiff Bus routes) and private land
value, particularly for more expensive properties.
Fundamental reform of property taxation would of course be politically difficult, which is the
principal reason why reforms have not taken place across the UK. A revaluation and reform
would inevitably create losers as well as winners. Furthermore, since Council Tax is a
fundamental part of the overall system of financing local government, reforming it will inevitably
affect many political interests. The distributional effects between different people and places
will therefore need to be considered carefully.
Although a more progressive property tax system would likely be more progressive in terms of
household incomes, it would not only be higher income individuals that may lose out (Mirrlees
2011). Recognising this, reducing tax bills on properties in lower bands would reduce demand
£0
£1,000
£2,000
£3,000
£4,000
£5,000
£6,000
£7,000
£8,000
£40,000 £140,000 £240,000 £340,000 £440,000 £540,000 £640,000 £740,000 £840,000 £940,000
An
nu
al ta
x b
ill
Current property value
Council tax
Revenue neutral reform

The Welsh Tax Base: Risks and Opportunities after Fiscal Devolution 74
for the Council Tax Reduction Scheme, which could be used to compensate low-income
households hit with higher property tax bills. Allowing deferral of payment, or payment in the
form of equity shares in a property, would also further protect ‘cash-poor, asset-rich’ older
households.
The effects of reforms will also vary greatly between local authorities. The largest tax increases
would likely be concentrated in local authorities with the highest valued properties, namely
Cardiff, the Value of Glamorgan and Monmouthshire. The Independent Commission on Local
Government Finance Wales (2016) argued banding reform should take place at a sub-national
level, to avoid a major redistribution of bills from one part of the country to another. Corlett and
Gardiner (2018) model the possibility of introducing a regionally-specific allowance per
property, potentially converging over time.
Council Tax is currently a very stable revenue source for local authority budgets. Creating a
stronger link between tax and house prices may increase the volatility of the tax revenue.
Proposing a reformed property tax at a UK level, Muellbauer (2005) argues that around “75
per cent of the revenue should go to central government, given the potential instability of such
revenue”. While such a revenue sharing system may not be possible in Wales, any reform of
Council Tax will need to be introduced alongside broader reforms of local authority grants, and
would need to consider the limited ability of the Welsh Government to smooth current revenue
volatility.
The scope for local autonomy under any property tax reform should also be considered. In its
update on local government finance reforms, the Welsh Government (2017b) stated that local
authorities must remain accountable to their local electorates for the choices they make. In
Northern Ireland, local autonomy is achieved through a combination of regional rates (set by
the Northern Ireland Assembly) and district rates (set by local councils). Under the Republic of
Ireland’s Local Property Tax, local authorities can vary the tax rates applied to capital values
by up to 15 per cent in either direction.
An integrated approach
Since they discourage mutually beneficial transactions, there remains an economic case for
reducing transactional taxes on property. Recurring property taxes could be reformed to
increase revenue, to allow for the gradual reduction in residential Land Transaction Tax
revenue. One approach would be to further raise the starting threshold of the LTT, without
increasing rates for higher valued properties. Since LTT rates have largely been capitalized
into property values, lowering LTT rates would limit some of the impact on house prices caused
by a more progressive recurrent property tax system.

The Welsh Tax Base: Risks and Opportunities after Fiscal Devolution 75
The Welsh Government is also considering the case for “shifting the balance of taxation from
income toward property” (2017a). There is a strong economic case for the taxation of land and
property because such taxes are hard to avoid and its supply is far less responsive to taxes
than the supply of labour. The OECD described recurrent taxes on property “the least harmful
tax” (2011). Meanwhile, in a study of 21 OECD countries from 1971 to 2004, Arnold (2008)
found property taxes the most growth-friendly, while income taxes were generally associated
with lower economic growth.
At a Welsh level, increasing revenue through property tax reform by around £218m (roughly a
14 per cent increase on current Council Tax revenue) could allow for a 1p reduction in all
income tax rates. This may allow the Welsh Government to boost jobs and growth in Wales,
through the behavioural effects described earlier in this report. Importantly, increases in
property taxes on high value properties could also be introduced in tandem with reductions in
the additional rate of income tax to make such reforms fairer and more politically palatable.
Finally, there are two cross-border issues which would also need to be considered in the
balance between taxing property and income. First, the higher taxation of second homes and
lower income tax rates may encourage more individuals to declare their Welsh address as
their primary residency, thus becoming eligible to pay Welsh income tax rates. And second,
the composition of migration flows over the Welsh border may be influenced by a different level
of taxation of income and property. Graduates and younger people may find it more attractive
to stay, return or move to Wales if income taxes are lower, while they are less likely to live in
or own expensive properties which would be subject to the much higher tax bills.
4.3 Commercial property taxation
The frequent revaluation exercises conducted on the NDR tax base means commercial
property taxes have avoided some of the worse faults of the Council Tax system. In this regard,
the revenue raised is more reflective of changes in the property market. From an economic
perspective however, a weakness of the NDR system is that it is a tax on an input to the
productive process of businesses (i.e. business property) and therefore distorts decisions
made by firms. Economic activity is artificially skewed away from property-intensive production
by such taxes, which can discourage investment (Mirrlees 2011). A land value tax (LVT) would
potentially be more economically efficient, and could be introduced gradually as a component
in the business rates system (Muellbauer 2005). As with Council Tax reform, the effects of
shifting towards a system of land value taxation would vary between different properties and
sectors, and across local authorities. Owners of highly-developed properties would gain
relative to owners of undeveloped land, while businesses located in deprived areas with low

The Welsh Tax Base: Risks and Opportunities after Fiscal Devolution 76
land prices would benefit. The Welsh Government (2017a) has already outlined its intention of
exploring the feasibility of a land value tax as a replacement for NDR revenue in Wales, albeit
recognising the significant administrative barriers.
Short of such a fundamental reform, there are a number of proposals currently being
considered or implemented by the Welsh Government to improve the efficiency of the NDR
system (ibid. p.15), such as reforming support for small businesses. The 2017 Barclay Review
of NDR in Scotland also recommended a number of measures to support economic growth,
which could help grow the tax base over time. For example, it recommended a 12 month delay
before rates are increased when an existing property is expanded or improved and before
rates apply to a new-build property, proposals which could reduce some of the current
disincentives and barriers to investment.
As outlined in section 2.4, the composition of the NDR tax base in Wales is currently very
different to that in England. In terms of average value of properties and total rateable value,
the greatest gap between Wales and England is in the office sector, which perhaps presents
an opportunity to grow its contribution to the tax base in Wales. While there is a growing
number of rateable properties in the office sector, increasing the average rateable value of
properties could be a focus, for example through incentivising improvements to current
properties or improving infrastructure and services provision to encourage new property
developments.
As with domestic property taxation, the NDR tax base should also be considered in conjunction
with the structure of commercial LTT. For example, since the NDR tax base is heavily reliant
on high-valued properties, LTT rates charged on higher-valued commercial transactions could
have an effect on the NDR tax base over time.
Elsewhere in the UK, the business rates system has been subject to significant and ongoing
reforms. Most significant are the attempts in England and Scotland to create a ‘fiscal incentive’
for local authorities to promote local economic development. The Business Rates Retention
Scheme (BRRS) in England allowed councils to retain up to 50 per cent of the real-terms
growth in local business rates, or bear up to 50 per cent of any real-terms decreases (Amin-
Smith et al. 2018), and these shares are set to increase in future years. In Scotland, local
authorities are rewarded for achieving revenue growth above set targets, but are protected
against performing poorly (Kapitsinis and Luchinskaya 2018). In Wales however, all revenue
is pooled and redistributed to local authorities. There is a strong redistributive mechanism in
the current NDR system (ibid.) and trends in the tax base growth vary greatly between local
authorities (see figure 2.29). As suggested by the Travers Review (2016), increasing the share
of revenues retained by local authorities may incentivise them to grow their local NDR tax
bases, which could positively influence the overall NDR tax base in Wales. This would correct
for the anomaly in the current system that local authorities get council tax revenues from the
development of residential properties but see no direct budgetary effect from business property

The Welsh Tax Base: Risks and Opportunities after Fiscal Devolution 77
development. As Kapitsinis and Luchinskaya (2018) explore, a share-gain NDR incentivisation
scheme could be an attractive option at a regional level e.g. for city regions, to reward
economic growth resulting from collaboration.
However, because changes in business rates revenue across England have been found to be
uncorrelated with population or economic growth (Amin-Smith et al 2018), increased local
retention may not necessarily lead to higher economic growth. The BRRS in England also
strips out the effects of revaluations, which means the incentive provided to local authorities is
to increase the quantity of business floor space, rather than increasing underlying property
values (Amin-Smith and Phillips 2017). As outlined in section 2.4, it is in the average value of
properties that the Welsh tax base trails behind the English tax base. Economically weaker
local authorities would find an incentive to allow development of lower value activities, instead
of attracting higher value and more productive businesses (Bessis 2017). Any reforms in this
area should therefore ensure that incentives are properly aligned with the economic objectives
of the Welsh Government.
4.4 New taxes
As well as the devolved and local taxes under its control, the Wales Act 2014 also allows for
the creation of new taxes in Wales, subject to the approval of both Houses of Parliament and
the National Assembly. Any proposals made will be assessed against a range of criteria, from
alignment with devolved responsibilities to the effect on UK macro-economic or fiscal policy
(HM Government 2014). The Welsh Government’s (2017) Welsh Tax Policy Report set out a
shortlist of four potential new taxes it would explore. In February, it was announced that a
vacant land tax would be proposed to the UK government to test the process of introducing a
new tax.13
Although there would be significant legislative and administrative hurdles, the ability to
introduce new taxes provides a new policy lever to influence Wales’ economy, society and
environment (Bevan Foundation 2016). In the context of the overall Welsh tax base and the
Welsh budget however, the revenue streams arising from most new taxes are likely to be
modest. Some suggested taxes would be well-placed to be hypothecated to specific spending
priorities (instead of funding general spending), while others would be good candidates to be
controlled by local authorities (e.g. a local tourism tax).
13 http://gov.wales/funding/fiscal-reform/welsh-taxes/developing-new-taxes/?lang=en

The Welsh Tax Base: Risks and Opportunities after Fiscal Devolution 78
Although often criticised by economists, the idea of hypothecated tax rises is gaining traction
at a UK level (Giles 2018). The symbolism of linking a new tax to a specific public service
means it may be politically easier to raise additional revenue in this manner. For example, a
1p increase in all income tax rates in Wales would fund roughly a three per cent increase in
core NHS spending in 2019-20. Hypothecation for health spending would be less problematic
from a budget management perspective because such spending already accounts for nearly
half of the Welsh Government’s resource budget. Low levels of public understanding of
devolved and non-devolved services may make it more important for the Welsh Government
to explain how a tax increase would pay for improvements in devolved services.
One of the four ideas for new taxes set out by the Welsh Government was a social care levy,
which perhaps has the greatest revenue-raising potential, and Holtham (2017) proposes a new
contributory scheme of compulsory insurance to cover the cost of the increased demand for
social care. In the context of the demographic risks discussed in this report, there are a number
of compelling reasons why such a scheme should be contributory rather than funded by a
general tax rise. In particular, the current fiscal framework in Wales would not compensate the
Welsh block grant for any increased levels of spending need if improved social care
arrangements in Wales incentivised more elderly people to move from the rUK (ibid.). As
individuals can move across the Welsh-English border many times during their lifetime, the
scheme could also be optional for those resident in the rUK that plan to return or retire to
Wales, allowing them to make contributions when their income is at its highest (see figure
3.11).
4.5 Wider Welsh Government policies
The risks and opportunities discussed in this report present many cross-departmental
challenges for the Welsh Government. Apart from Welsh Government tax policy, policies
relating to the economy, skills, education and housing (among others) will have a direct
influence on the performance of the Welsh tax base. The potential for trade-offs and tough
policy choices should be analysed and discussed strategically.
Due to the progressive nature of income tax and the high personal allowance, it is the relative
trends in the incomes of higher-earning taxpayers in Wales which will have the greatest long-
term effect on the Welsh income tax base. For example, while a taxpayer in the 90th percentile
in Wales earns 3.6 times more than a taxpayer in the 10th percentile, they will pay over 21
times as much income tax to the Welsh Government. This means that the quality and pay
levels of jobs, rather than simply the number of jobs, will become more important in expanding
the devolved income tax base, and economic policies designed to accelerate tax revenue

The Welsh Tax Base: Risks and Opportunities after Fiscal Devolution 79
growth would focus on the creation and retention of higher-paid jobs. This points to the many
interactions between tax policy and wider policy areas.
The relationships between the Welsh tax base, cross-border migration and commuter flows
also pose questions for wider Welsh Government policies. For example, higher education
policy levers (such as those relating to fees and grants) could be used to incentivise graduates
to stay in Wales, ensuring that they contribute to the Welsh tax base. Any tax strategy or policy
designed to attract and retain higher-earners from the rUK would also depend on the
availability of appropriate housing developments, but any such developments would need to
be sensitive to the geography of an area, consider the impact on traffic, local public services,
transport systems and the Welsh language, and be proportionate to the local need for housing.
The ability of Welsh taxpayers to commute to high-paying jobs in English cities and still
contribute to the Welsh tax base will also depend on transport infrastructure. The effects on
the Welsh tax base of changing flows in migration and commuting should therefore be set
against the potential for increased spending commitments and other environmental, social and
cultural costs.
Tax policy will also affect wider Welsh Government policy objectives, by influencing the
behaviour of individuals and firms. In this regard, policymakers and the wider political
community should consider the extent to which tax policy should itself be used to achieve wider
policy goals, or whether tax policy should be primarily designed to maximise revenue over the
medium to long-term, to provide more resources for the Welsh budget to tackle priorities
through the expenditure side. For example, creating too many tax incentives in the design of
a tax may increase the overall complexity of the system and work against maximising potential
revenue yields.

The Welsh Tax Base: Risks and Opportunities after Fiscal Devolution 80
5. Conclusion Ongoing changes to Wales’ fiscal framework represent a significant step-change for devolution
in Wales. With over a fifth of the Welsh budget coming from own-sourced revenues, political
parties will be able to present competing policy packages on Welsh taxes and public services
at Assembly elections. Furthermore, the performance of the Welsh economy will become an
important determinant of how much the Welsh Government has to spend on public services.
This report has outlined the significant differences which currently exist between the Welsh tax
base and that of the rest of the UK. With fewer high-earning individuals residing in Wales, less
income tax is raised per person on average, and a much smaller share of income tax is raised
at the higher and additional rates. Similarly, lower average values of domestic and non-
domestic properties result in significant differences in both the residential and commercial
property tax bases of Wales and the rest of the UK. While these differences have been of
interest in the past, they now hold crucial relevance in debates around developing tax policies
fit for the Welsh tax base.
The performance of the Welsh tax base from its current position will also have a bearing on
the sustainability of the Welsh Government budget. As explored in Section 3 of this report,
future trends in Wales’ economy and demography could result in a shortfall or an increase in
funds available to spend on devolved services.
The risks and opportunities highlighted in this report are designed to focus attention on the
ways in which the Welsh Government can successfully manage the increased risk inherent to
fiscal devolution. While recognising the potential legislative, administrative and political
barriers, the Welsh Government now has the opportunity to chart its own course on tax policy
in Wales, and policy makers will need to consider how best to raise revenue from the Welsh
tax base to pay for devolved public services.

The Welsh Tax Base: Risks and Opportunities after Fiscal Devolution 81
References Amin-Smith, N., Phillips, D. & Simpson, P. (2018). Spending needs, tax revenue capacity
and the business rates retention scheme. London: Institute for Fiscal Studies.
Amin-Smith, N. & Phillips, D. (2017). The Business Rates Revaluation, Appeals and
Local Revenue Retention. IFS Briefing Note BN193. London: Institute for Fiscal Studies.
Arnold, J. (2008). Do tax structures affect aggregate economic growth? Empirical
evidence from a panel of OECD countries. OECD Economics Department Working Paper
643.
Bakhshi, H., Downing, J. M., Osborne, M. A. & Schneider, P. (2017). The Future of Skills:
Employment in 2030. London: Nesta.
Bangor University (2017). Independent Scrutiny and Assurance of Devolved Tax
Forecasts for Wales, Final Report, October 2017.
Barclay Review (2017). Report of the Barclay Review of Non-Domestic Rates. 22 August
2017.
Bell, D. & Eiser, D. (2016). Migration and fiscal policy as factors explaining the labour-
market resilience of UK regions to the Great Recession. Cambridge Journal of Regions,
Economy and Society, 9, 197-215.
Bell, M., Bristow, D. & Martin, S. (2017). The Future of Work in Wales. Public Policy
Institute for Wales. November 2017.
Bessis, H. (2017). Business rates: maximising the growth incentive across the
country. Centre for Cities.
Bevan Foundation (2016). Tax for Good: New taxes for a better Wales. Retrieved
from: https://41ydvd1cuyvlonsm03mpf21pub-wpengine.netdna-ssl.com/wp-
content/uploads/2016/06/Tax-for-Good-Devolved-taxes-for-a-better-Wales.pdf
Brakman, S., Garretsen, H. & Kohl, T. (2017). Consequences of Brexit and
Options for a Global Britain, CESifo Working Paper No. 6648.
Browne, J. & Phillips, D. (2017). Estimating the responsiveness of top incomes to
tax: a summary of three new papers. IFS Briefing Note.
Bristow, G., Pill, M., Davies, Rh. & Drinkwater, S. (2011). Welsh Graduate Mobility,
SKOPE/WISERD research report. Cardiff: Cardiff University.

The Welsh Tax Base: Risks and Opportunities after Fiscal Devolution 82
Campbell, A. (2016). Scottish Government proposals for Council Tax reform.
SPICe Financial Scrutiny Unit Briefing. March 2016.
Centre for Cities (2018). Cities Outlook 2018. London: Centre for Cities.
Clarke, S. (2017). Get a Move On? The decline in regional job-to-job moves and
its impact on productivity and pay. Resolution Foundation Briefing, August 2017.
Commission on Local Tax Reform (2015). Just Change: A New Approach to Local
Taxation. Final Report. December 2015.
Corlett A. and Gardiner L. (2018). Home affairs: options for reforming property
taxation. London: Resolution Foundation.
Demos (2017). Making the most of Brexit. March 2017.
Dhingra, S., Huang, H., Ottaviano, G., Pessoa, J.P., Sampson, T., & Van Reenen, J.
(2017a) The costs and benefits of leaving the EU: trade effects. CEP Discussion
Paper No. 1478.
Dhingra, S., Machin, S & Overman, H. (2017b). Local Economic Effects of Brexit. National
Institute Economic Review. No. 242 November 2017.
Driessen, G. A. & Sheffrin, S. M. (2016). Agglomeration, Tax Differentials, and the
Mobility of Professional Athletes. Public Finance Review, 45(2), 283-302.
Ebell, M. & Warren, J. (2016). The long-term economic impact of leaving the EU.
National Institue Economic Review, No. 236, 121-138.
Emmerson, C., Johnson, P., Mitchell, I., & Phillips, D. (2016). Brexit and the UK’s
public finances. IFS Report R116, London: Institute for Fiscal Studies.
Feld, L. P. and Reulier, E. (2008). Strategic Tax Competition in Switzerland:
Evidence from a Panel of the Swiss Cantons. German Economic Review, 10(1),
91-114.
Frey, C. B. and Osborne, M. A. (2017). The future of employment: How
susceptible are jobs to computerisation? Technological Forecasting and Social
Change, 114(C), 254-280.
Giles, C. (2018). Should there be a ring-fenced tax to fund the NHS? Financial
Times, January 10, 2018.
Haldane, A. (2015). ‘Labour’s Share’, Speech by Andrew Haldane, chief economist,
Bank of England, Trades Union Congress, London 12 November 2015. Retrieved
from: https://www.bankofengland.co.uk/speech/2015/labours-share

The Welsh Tax Base: Risks and Opportunities after Fiscal Devolution 83
Holtham, G. (2017). The promise of social care. Hodge Economic Research
Project. Retrieved from: http://welsheconomicchallenge.com/wp-
content/uploads/WNIfund-Proposal-Social-care.pdf
Holtham, G. (2014). Taxation in Wales, IWA Senedd Paper. Cardiff: Institute for
Welsh Affairs.
Independent Commission on Funding and Finance for Wales (2010). Fairness and
accountability: a new funding settlement for Wales. Final Report.
Independent Commission on Local Government Finance Wales (2016). Ambition for
change: Aiming higher. CIPFA.
Kapitsinis, N. and Luchinskaya, D. (2018). Business rates in Wales, local retention
and regional growth deals. Policy Report, Wales Public Services 2025.
Kleven, H. J., Landais, C. and Saez, E. (2013). Taxation and International
Migration of Superstars: Evidence from the European Football Market. American
Economic Review, 103(5), 1892-1924.
Lawton, K. and Reed, H. (2013). Property and wealth taxes in the UK: The context
for reform. Institute for Public Policy Research, March 2013.
Leishman, C., Bramley, G., Stephens, M., Watkins, D., & Young, G. (2014). After the
Council Tax: Impacts of Property Tax Reform on People, Places and House
Prices. Joseph Rowntree Foundation, March 2014.
Los, D., Mccann, P., Springford, J, & Thissen, M. (2017). The mismatch between
local voting and the local economic consequences of Brexit. Regional Studies,
51(5), 786-799.
Meen, G. (1999). Regional House Prices and the Ripple Effect: A New
Interpretation. Housing Studies, 14(6), 733-753.
Milligan K. and Smart, M. (2015). Provincial Taxation of High Incomes: the effects
on progressivity and tax revenue. Institute for Research on Public Policy.
November 2015.
Mirrlees et al. (2011). Tax by design. London: Institute for Fiscal Studies.
Muellbauer, J. (2005). Property Taxation and the Economy, in D Maxwell and A.
Vigor (eds.) Land Value Tax: Worth the transition? Institute for Public Policy
Research.
OECD (2016). The economic consequences of Brexit: a taxing decision. OECD
Economic Policy Papers, No.16.
OECD (2011). Economic Surveys: United Kingdom. March 2011.

The Welsh Tax Base: Risks and Opportunities after Fiscal Devolution 84
O’leary, N. & Sloane, P. (2008). Rates of Return to Degrees across British
Regions. Regional Studies, 42(2), 199-213.
Poole, E. G., Ifan, G., & Phillips, D. (2017). Fair Funding for Taxing Times?
Assessing the Fiscal Framework Agreement. Wales Governance Centre, Cardiff
University. Retrieved from: http://sites.cardiff.ac.uk/wgc/files/2016/11/Fair-
Funding-for-Taxing-Times-Assessing-the-Fiscal-Framework-Agreement.pdf
PWC (2017). The impact of Brexit on (Global) Trade.
Roberts, C., Lawrence, M. & King, L. (2017). Managing Automation: Employment,
inequality and ethics in the digital age. IPPR Commission on Economic Justice.
Scottish Fiscal Commission (2018). How we forecast behavioural responses to
income tax policy. March 2018. Retrieved from:
http://www.fiscalcommission.scot/media/1223/how-we-forecast-behavioural-
responses-to-income-tax-policy-march-2018.pdf
Wang, Y., Potoglou, D., Orford, S., & Gong, Y. (2015). Bus stop, property price and
land value tax: a multilevel hedonic analysis with quantile calibration. Land Use
Policy, 42, 381-391.
Welsh Government (2017a). Welsh Tax Policy Report. October 2017, WG33114.
Welsh Government (2017b). Reforming Local Government Finance in Wales: An Update.
October 2017, WG33275.
Winters, L.A. (2016). Brexit and the regions: a lighter shade of dark. UK in a Changing
Union Blog. Retrieved from: http://ukandeu.ac.uk/brexit-and-the-regions-a-lighter-shade-
of-dark/

The Welsh Tax Base: Risks and Opportunities after Fiscal Devolution 85
Appendix A: Devolved Taxes in
the Welsh Government Fiscal
Framework This appendix summarises how Wales’ newly devolved taxes will interact with the Welsh
Government’s block grant, and how they will influence the size of the Welsh budget. This
discussion provides the context for some of the risks and opportunities discussed in the main
report.
After tax devolution, Welsh Government budgets will continue to be funded by block grants
from HM Treasury, linked to spending decisions made on comparable services in England.
However, as taxes are devolved and become an increasing part of Welsh budgets, a
downward adjustment is made to the block grant to compensate HM Treasury for the tax
revenue they will no longer receive. This essentially ensures neither government is initially
better or worse off at the point of tax devolution. Future changes to this block grant
adjustment (BGA) will be determined by changes in equivalent UK government taxes in
England and Northern Ireland (E&NI).
For Stamp Duty and Landfill Tax, the baseline BGA was set to equal the revenues collected
in Wales during the year immediately prior to tax devolution (i.e. 2017-18). This amount was
updated according to what happened to comparable revenues in E&NI in the year to 2018-19
(the exact mechanism of doing so is outlined below). When income tax is partially devolved
from April 2019, the baseline adjustment will match actual receipts collected in that first year
(2019-20), assuming the Welsh Government sets a 10p tax rate in all tax bands (the share of
income tax being devolved to Wales).
Both governments agreed that the method used to link changes in the BGA to changes in
revenues in E&NI from equivalent UK government taxes will be the Comparable model.
Under this method, the change in the BGA is determined by a tax-capacity adjusted
population share of the change in equivalent UK government revenues in E&NI.
Changes in the BGA for each tax will therefore be determined by the following equation:
Cash change in equivalent UK
government tax in E&NI
x Comparability
factor x Population ratio
This method of updating the BGA can be best illustrated by a hypothetical example. Suppose
that SDLT revenue in E&NI were to grow by £1 billion. This cash change in the equivalent
UK government tax would be multiplied by a ‘comparability factor’, reflecting the level of
The Welsh Tax Base: Risks and Opportunities after Fiscal Devolution 86
SDLT revenues per person in Wales as a proportion of SDLT revenues per person in the rest
of the UK at the point of devolution, or in other words, initial Welsh ‘tax capacity’ for SDLT.
This comparability factor is set at approximately 25 per cent, reflecting the much lower levels
of SDLT raised per person in Wales. The resulting ‘tax capacity’ adjusted figure (£250m)
would be multiplied by Wales’ population measure as a percentage of E&NI’s (5.4 per cent)
to arrive at a roughly £13 million increase in the BGA. If Welsh LTT revenues grew by more
than £13 million the Welsh Government’s budget would increase by more than it would have
in the absence of tax devolution, but if Welsh revenues grew by less than £13 million, the
Welsh Government’s budget would be reduced.
As this example illustrates, in linking BGA to equivalent revenues in E&NI the new Fiscal
Framework means the relative performance of Welsh revenues will become very
important to the Welsh Government budget. As first described by the Holtham Commission,
this link to revenues in the rest of the UK has several benefits:
1. It provides further incentives for the Welsh Government to grow the Welsh economy
and reap the rewards of faster revenue growth or avoid shortfalls caused by slower
growth.
2. It effectively pools UK-wide economic risks, such as a recession that affects revenues
across the UK. Although own-sourced tax revenues in Wales could fall during a
recession, the reduction in revenues in the rest of the UK would also reduce the size
of the adjustment to the Welsh block, thereby mitigating losses to the total Welsh
budget.
The inclusion of the ‘comparability factor’ in the BGA formula means there will continue to be
some element of pooling and sharing between Wales and the rUK of the taxes being
devolved. Although the Barnett formula will continue to allocate a population-based share of
extra spending funded by equivalent revenues in England onto the Welsh budget, the
corresponding growth in the BGA will be a tax-capacity adjusted portion of this. However, the
comparability factors will not be adjusted if relative tax capacities change. As a result, there
is no pooling and sharing of the risks associated with changes in relative tax capacity
between England and Wales.
The significant differences in the Welsh income tax base compared with the rest of the UK
(as outlined in section 2.1 of this report) is further recognised in the agreement by the
creation of separate BGAs for each band of income tax (i.e. the basic, higher and
additional rates). As shown in figure 2.5 of the main report, a much higher share of Welsh
taxable income is earned at the basic rate in Wales compared with the rest of the UK. This
means that UK-wide factors which disproportionately impact taxable income at the basic rate
band (e.g. rapid increases in the personal allowances) have much more of an impact on total
tax revenue in Wales compared with the rest of the UK. Conversely, the much greater share
of taxable income earned at the additional rate in the rest of the UK means that UK-wide

The Welsh Tax Base: Risks and Opportunities after Fiscal Devolution 87
factors which influence very high incomes will have much greater impact on total revenues in
the rest of the UK than is true for Wales.
Creating separate BGAs for each income tax band means that the BGA is likely to match the
trends in devolved Welsh revenues more closely than it would have using a single BGA for
income tax as a whole.
The implementation of the Comparable Model of BGA will mean that the Welsh
Government will bear population-related revenue risk. The Welsh budget will now lose
out from slower population growth on the revenue side, even if revenues per person in Wales
grow as quickly as in E&NI.
To illustrate this effect, suppose that tax revenues in E&NI grow, but only as a result of
population growth (revenue per person stays constant). Similarly for Wales, assume that
revenue per person are constant, but that so too is population. In Wales’ case, overall tax
revenues are also constant. Because the Comparable Model increases Wales’ BGA by a
population share of the tax revenue increase in E&NI, this would lead to a reduction in the
Welsh budget simply as a result of population growth in E&NI.
For further discussion of Wales’ fiscal framework, see Poole et al. (2017).

The Welsh Tax Base: Risks and Opportunities after Fiscal Devolution 88
Appendix B: Methodology for
Microsimulation of Devolved
Income Tax Revenue To explore the potential risks and opportunities for the Welsh budget from income tax
devolution, we build a microsimulation model of devolved income tax revenues in Wales.
This appendix summaries the methodology behind the model. The model draws on the
methodology used by the Scottish Government to forecast devolved taxes in their 2017-18
Draft Budget.14
The input to the model is HMRC’s Survey of Personal Incomes (SPI) 2014-15. The SPI
contains a detailed sample of over 22,000 Welsh anonymised tax records (drawn from PAYE
and self-assessment returns), weighted to be representative of all Welsh income taxpayers.
A summary of the sample for Wales and the rUK is provided in table B.1. For each record,
there is detailed information on sources and level of income, age group, region of residency
and other relevant variables.
To protect the anonymity of individuals with very large total incomes, some records are
combined with cases with similar characteristics into ’composite records’, and an average of
each variable is taken. As individuals for different regions are combined together in this
process, SPI documentation outlines the share of the composite record belonging to each
region. We manually apply these regional shares to estimate Wales’ share of each
composite record.
Table B.1: Summary of SPI sample of Welsh and rUK taxpayers
Sample size Total taxpayers
Wales rUK Wales rUK
Basic rate 17,301 328,506 1,200,000 22,325,000
Higher rate 4,374 145,251 127,000 3,839,000
Additional rate 357 27,749 4,000 305,000
Total 22,032 501,506 1,331,000 26,469,000
The modelling applied to the SPI data can be summarised in the following steps:
14 Their methodology can be found here: http://www.gov.scot/Resource/0051/00511834.pdf

The Welsh Tax Base: Risks and Opportunities after Fiscal Devolution 89
1. The Non-Savings, Non-Dividend (NSND) income of each individual in the sample is
calculated, by adding PAYE earnings, Self-Employment earnings, pension income, and
income from property and other sources of income. Public sector employment income is
identified by using the industry variable (namely: O Public administration and defence;
compulsory social security; P Education; and Q Human health and social work
activities). Pension income is disaggregated between state pension income and other
private pension income.
2. We adjust NSND income by taking into account workplace pension contributions and
investment reliefs (such as gift aid).
3. Personal allowances are subtracted, to estimate the taxable NSND income of each
individual.
4. Tax thresholds are applied to calculate taxable NSND income at the basic, higher and
additional rate bands. Welsh taxpayers are identified and their taxable NSND income
multiplied by assumed Welsh Government tax rates forms the basis of the estimate of
devolved income taxes. Comparable revenues from rUK taxpayers (excluding Scottish
taxpayers) are used in the calculation of block grant adjustments.
5. Using 2014-15 as the base year, the dataset is rolled forward to subsequent years, with
steps 1-4 repeated for each year. In general, outturn data is used for growth
assumptions from 2014-15 to 2017-18, and forecasts/projections are used for growth
assumptions in subsequent years. Assumptions are made relating to:
a. Demographic and labour market changes: Taxpayers are split into seven
different age groups – under 25, 25-34, 35-44, 45-54, 55-64 and 65-74. Each age
group is grown according to the ONS 2016-based principal population projections.
These annual growth rates are amended to account for changes in the employment
rate in each age group (taken from Annual Population Survey data). Assumed
employment rates for each age group are held constant after 2018-19 (except for
when modelling employment rate convergence, shown in figure 3.2 in the main
report).
b. Income growth: Growth rate assumptions are made separately for 5 different
income sources, summarised in table B.2. State pension incomes are grown
according to the latest (March 2018) OBR outturn and forecast, made assuming the
continuation of the ‘triple-lock’ guarantee. Due to the difficulty of accounting for the
path in private pension incomes, we follow the Scottish Government methodology
by growing all other pension incomes by their long-run average growth rate
implied by SPI data. Outturn data from the Annual Survey of Hours and Earnings
(on a calendar year basis) is used for the growth rates in public sector and private
sector employment income from 2015-16 to 2017-18. Under the assumption of
continuing fiscal consolidation in coming years, we grow public sector employment
income to 2021-22 by the average growth from 2011 to 2017. Accounting for the
share of employment in each sector, we grow private sector employment income in
order for total employment income to match the OBR’s forecast for average
earnings growth for these years. Both are grown by the OBR’s forecast for average
earnings beyond 2022-23. All other income is grown in line with private sector
employment. These assumptions on income growth are amended when modelling
the different scenarios in section 3.1 of the main report.

The Welsh Tax Base: Risks and Opportunities after Fiscal Devolution 90
Table B.2: Summary of growth rates assumed for each income source in Wales
Year Pensions Employment income All
other
income
State pension All other pensions Public sector Private sector
Outturn 2015-16 2.9% 3.1% 1.8% 2.6% 2.6%
2016-17 2.5% 3.1% 3.8% 3.4% 3.4%
2017-18 3.0% 3.1% 0.0% 2.7% 2.7%
Forecast 2018-19 2.6% 3.1% 1.5% 2.5% 2.5%
2019-20 2.5% 3.1% 1.5% 2.9% 2.9%
2020-21 2.5% 3.1% 1.5% 3.3% 3.3%
2021-22 3.0% 3.1% 1.5% 3.9% 3.9%
2022-23
and beyond
3.1% 3.1% 3.1% 3.1% 3.1%
c. Tax policy: Tax allowances and thresholds are updated for each year according to
previously announced UK government policy (or Conservative party manifesto
commitments). The Personal Allowance threshold is grown to reach £12,500 by
2021-22, and grows by the OBR’s long-term CPI inflation forecast thereafter. The
personal allowance taper threshold is held constant at £100,000. The Higher Rate
threshold is grown in line with CPI inflation. The Additional Rate threshold is held
constant at £150,000. Reliefs are grown at the same rate as total growth in incomes
each year. Welsh Government tax rates are assumed to be 10p in each band
(apart from when modelling different tax rates in section 4.1 of the main report).
6. To reach the projected effect on the Welsh Government budget, projected Block Grant
Adjustment are subtracted from projected devolved income tax revenue for each year.
Block Grant Adjustments are set as equal to devolved income tax revenue in 2019-20,
and are then projected forward using the Comparable model (see Appendix A) and
projected growth rates in comparable rUK revenues in each tax band.

This report is licensed under the terms of the Open Government License
Author Details
Guto Ifan and Dr Ed Gareth Poole are part of the Wales Governance Centre, a
research centre that forms part of Cardiff University’s School of Law and Politics. The
Centre undertakes innovative research into all aspects of the law, politics, government
and political economy of Wales, as well the wider UK and European contexts of territorial
governance
Our thanks goes to those who participated in the round table event held in Cardiff on
January 30th 2018 for their expert contributions, namely: Hugo Bessis, Centre for Cities;
Professor David Blackaby, Swansea University; Dr Rhys ap Gwilym, Bangor University;
Professor Gerald Holtham, Cardiff Metropolitan University; Dr Nikos Kapitsinis and Dr
Daria Luchinskaya, Wales Public Services 2025, Cardiff Business School; Professor
David Miles, Imperial College London; alongside, Julian Revell, Head of Fiscal Analysis;
Jonathan Price, Chief Economist; Georgina Haarhoff, Deputy Director Tax Strategy,
Policy and Engagement and Andy Fraser, Head of Tax Strategy of Welsh Government.
Thanks also to Anna Murray, Fraser of Allander Institute for advice on modelling Welsh
income taxes and David Phillips, Institute for Fiscal Studies for his constructive feedback.
For further information please contact:
Mair Bell
Wales Centre for Public Policy
+44 (0) 29 2087 5345