the west african cashew sector in 2018 - nitidæ...the west african cashew sector in 2018 general...
TRANSCRIPT
THE WEST AFRICAN
CASHEW SECTOR IN 2018
General trends and country profiles
Pierre RICAU [email protected]
Analysis of cashew production, processing and trade in West Africa This document was realized by Nitidæ in June 2019
www.nitidae.org – www.nkalo.org
Introduction: the world cashew sector in 2018-2019
The supply
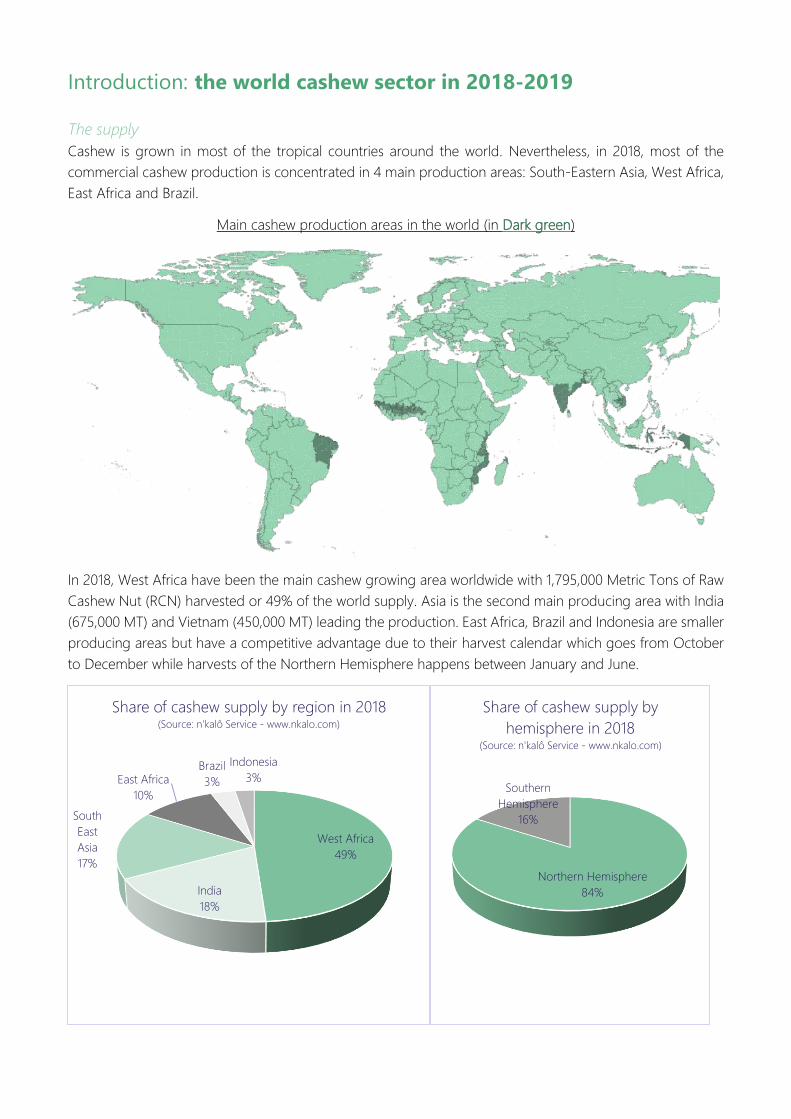
Cashew is grown in most of the tropical countries around the world. Nevertheless, in 2018, most of the
commercial cashew production is concentrated in 4 main production areas: South-Eastern Asia, West Africa,
East Africa and Brazil.
Main cashew production areas in the world (in Dark green)
In 2018, West Africa have been the main cashew growing area worldwide with 1,795,000 Metric Tons of Raw
Cashew Nut (RCN) harvested or 49% of the world supply. Asia is the second main producing area with India
(675,000 MT) and Vietnam (450,000 MT) leading the production. East Africa, Brazil and Indonesia are smaller
producing areas but have a competitive advantage due to their harvest calendar which goes from October
to December while harvests of the Northern Hemisphere happens between January and June.
West Africa
49%
India
18%
South
East
Asia
17%
East Africa
10%
Brazil
3%
Indonesia
3%
Share of cashew supply by region in 2018(Source: n'kalô Service - www.nkalo.com)
Northern Hemisphere
84%
Southern
Hemisphere
16%
Share of cashew supply by
hemisphere in 2018(Source: n'kalô Service - www.nkalo.com)
Estimating cashew production worldwide is not an easy exercise as most of the cashew producing countries
have not reliable agricultural statistics. For instance, Indian production was estimated by India state and the
International Nut and Cried Fruit Council (INC) in 2018 to be around 800,000 Metric Tons of RCN while
industry players estimate real supply between 650,000 and 700,000 MT.
In Mozambique, INCAJU, the state regulation agency, estimates the production to be around 130,000 MT
but exports of Raw Cashew nut (RCN) and cashew kernels converted in RCN (x5) only cumulate 70,000 MT
in 2017/2018. At contrary, others countries like Vietnam or Côte d’Ivoire tend to underestimate their
production/supply figures. Doing so they hope to support cashew prices. Many superficial market studies
also refer to FAOSTAT which data is old or wrong for many countries, particularly Vietnam and Nigeria.
Hopefully the main cashew processing and consuming countries have reliable trade statistics. This is why, all
the supply figures presented below have been estimated on the basis of a deep analysis of cashew trade
statistics and thanks to several contacts with major cashew industry stakeholders. We can consider that the
error margin in those figures does not exceed 10% (only India production cannot be accurately estimated as
the importance of local consumption does not allow to have reliable trade figures).
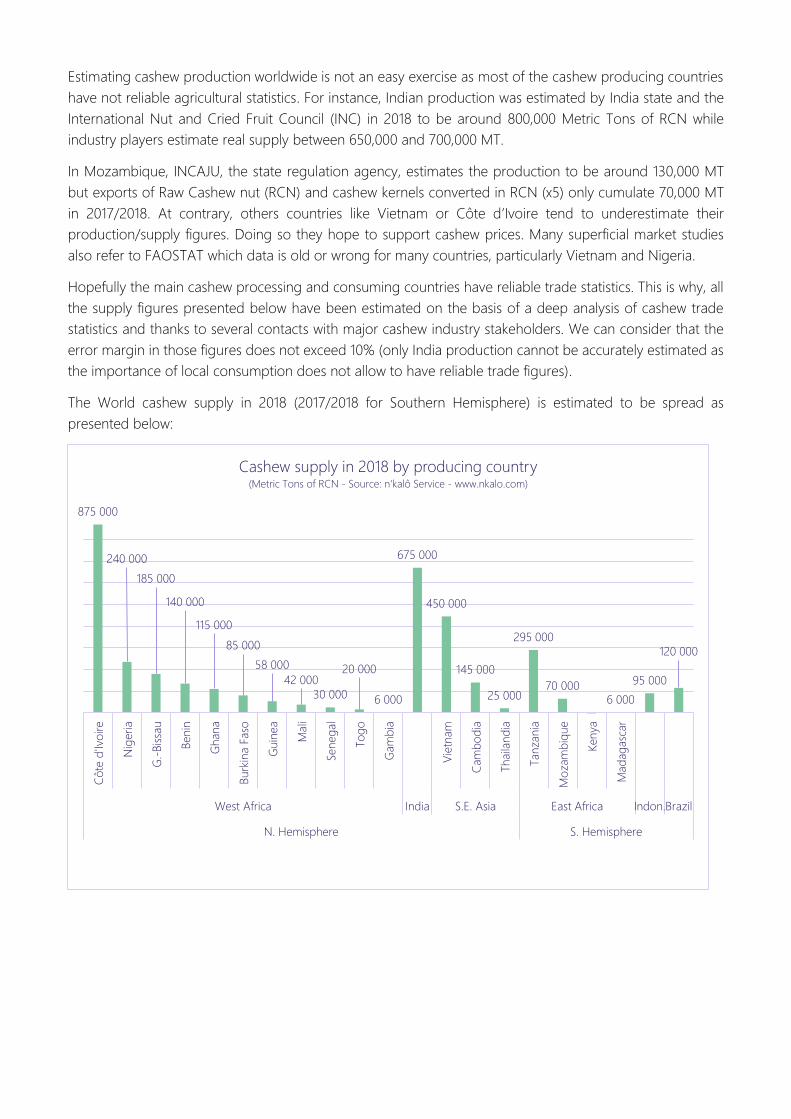
The World cashew supply in 2018 (2017/2018 for Southern Hemisphere) is estimated to be spread as
presented below:
875 000
240 000
185 000
140 000
115 000
85 000
58 000
42 000
30 000
20 000
6 000
675 000
450 000
145 000
25 000
295 000
70 0006 000
95 000
120 000
Cô
te d
'Ivo
ire
Nig
eria
G.-
Bis
sau
Benin
Ghana
Burk
ina F
aso
Guin
ea
Mali
Seneg
al
To
go
Gam
bia
Vie
tnam
Cam
bo
dia
Thaila
nd
ia
Tanza
nia
Mo
zam
biq
ue
Kenya
Mad
ag
asc
ar
West Africa India S.E. Asia East Africa Indon.Brazil
N. Hemisphere S. Hemisphere
Cashew supply in 2018 by producing country(Metric Tons of RCN - Source: n'kalô Service - www.nkalo.com)

The processing (shelling and peeling)
Based on those supply/production estimations and on the same trade statistics analysis, cashew processing
in 2018 have been estimated below. Due to the big difference between the quantities processed by the four
main cashew processing countries and the others we decided to use two different graphs with different scales.
1 650 000
1 525 000
130 00070 000
Vietnam India Brazil Côte d'Ivoire
Quantity of cashew processed in the 4 main cashew processing countries
worldwide in 2018 (Metric Tons of RCN - Source: n'kalô Service - www.nkalo.com)
40 000
30 000
13 00011 000 10 000 9 000
7 500 7 000
3 000 2 000 1 500 1 000 1 000 500 500 500 250
Quantity of cashew processed in the other cashew processing countries in
2018 (Metric Tons of RCN - Source: n'kalô Service - www.nkalo.com)
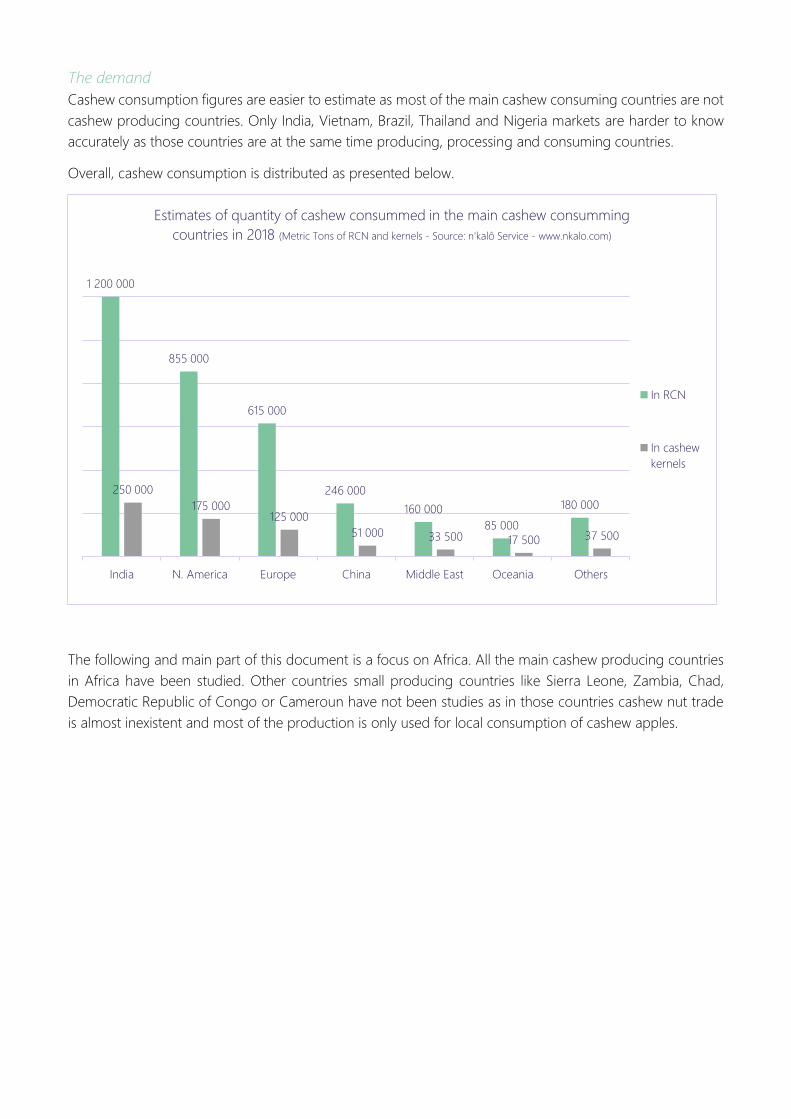
The demand
Cashew consumption figures are easier to estimate as most of the main cashew consuming countries are not
cashew producing countries. Only India, Vietnam, Brazil, Thailand and Nigeria markets are harder to know
accurately as those countries are at the same time producing, processing and consuming countries.
Overall, cashew consumption is distributed as presented below.
The following and main part of this document is a focus on Africa. All the main cashew producing countries
in Africa have been studied. Other countries small producing countries like Sierra Leone, Zambia, Chad,
Democratic Republic of Congo or Cameroun have not been studies as in those countries cashew nut trade
is almost inexistent and most of the production is only used for local consumption of cashew apples.
1 200 000
855 000
615 000
246 000
160 000
85 000
180 000
250 000
175 000125 000
51 000 33 500 17 500 37 500
India N. America Europe China Middle East Oceania Others
Estimates of quantity of cashew consummed in the main cashew consumming
countries in 2018 (Metric Tons of RCN and kernels - Source: n'kalô Service - www.nkalo.com)
In RCN
In cashew
kernels
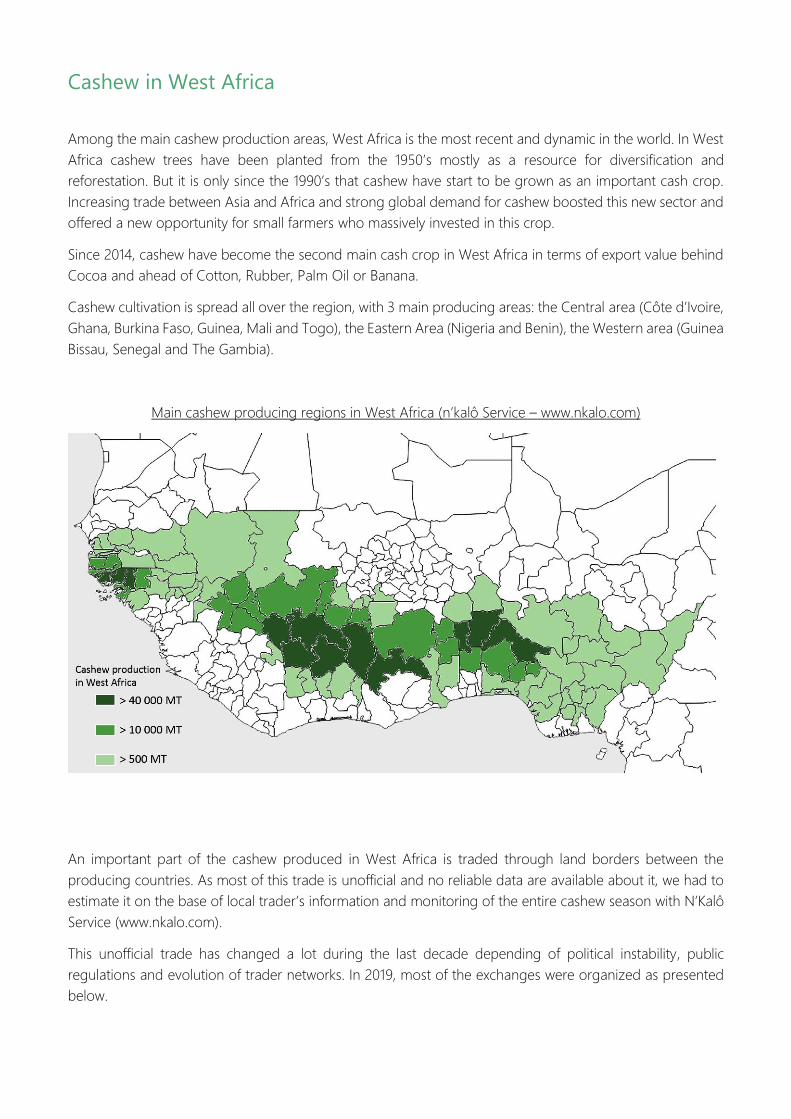
Cashew in West Africa
Among the main cashew production areas, West Africa is the most recent and dynamic in the world. In West
Africa cashew trees have been planted from the 1950’s mostly as a resource for diversification and
reforestation. But it is only since the 1990’s that cashew have start to be grown as an important cash crop.
Increasing trade between Asia and Africa and strong global demand for cashew boosted this new sector and
offered a new opportunity for small farmers who massively invested in this crop.
Since 2014, cashew have become the second main cash crop in West Africa in terms of export value behind
Cocoa and ahead of Cotton, Rubber, Palm Oil or Banana.
Cashew cultivation is spread all over the region, with 3 main producing areas: the Central area (Côte d’Ivoire,
Ghana, Burkina Faso, Guinea, Mali and Togo), the Eastern Area (Nigeria and Benin), the Western area (Guinea
Bissau, Senegal and The Gambia).
Main cashew producing regions in West Africa (n’kalô Service – www.nkalo.com)
An important part of the cashew produced in West Africa is traded through land borders between the
producing countries. As most of this trade is unofficial and no reliable data are available about it, we had to
estimate it on the base of local trader’s information and monitoring of the entire cashew season with N’Kalô
Service (www.nkalo.com).
This unofficial trade has changed a lot during the last decade depending of political instability, public
regulations and evolution of trader networks. In 2019, most of the exchanges were organized as presented
below.

Estimate of main flows (>10,000 MT) of unofficial cross border cashew trade in West Africa in 2018 (in Metric Tons – Source: N’kalô Service – www.nkalo.com)
Based on a model Nitidæ has developed since 7 years from the cashew trade statistics and surveys with
cashew farmers, we have tried to forecast the future cashew production of West Africa. As history and
dynamics are different among countries, we distinguish the forecasts for the 3 main production areas.
Projection of production for Central West Africa
1 837 000
71 000
526 000
1 207 000
0
200 000
400 000
600 000
800 000
1 000 000
1 200 000
1 400 000
1 600 000
1 800 000
2 000 000
1996
1997
1998
1999
2000
2001
2002
2003
2004
2005
2006
2007
2008
2009
2010
2011
2012
2013
2014
2015
2016
2017
2018
2019
2020
2021
2022
2023
2024
2025
Production estimated and forecasted for Central West Africa(In Metric Tons of RCN ; CI, Ghana, Burkina, Guinea, Mali and Togo ; Source: Nitidae)

Projection of production for Western West Africa
Projection of production for Eastern West Africa
57 000
170 000
369 000
547 000
0
100 000
200 000
300 000
400 000
500 000
600 000
1996
1997
1998
1999
2000
2001
2002
2003
2004
2005
2006
2007
2008
2009
2010
2011
2012
2013
2014
2015
2016
2017
2018
2019
2020
2021
2022
2023
2024
2025
Production estimated and forecasted for Central West Africa(In Metric Tons of RCN ; Nigeria and Benin; Source: Nitidae)
88 000
176 000
243 000
271 000
0
50 000
100 000
150 000
200 000
250 000
300 000
1996
1997
1998
1999
2000
2001
2002
2003
2004
2005
2006
2007
2008
2009
2010
2011
2012
2013
2014
2015
2016
2017
2018
2019
2020
2021
2022
2023
2024
2025
Production estimated and forecasted for Western West Africa(In Metric Tons of RCN ; Guinea-Bissau, Sénégal & The Gambia; Source: Nitidae)
Central West Africa: country profiles
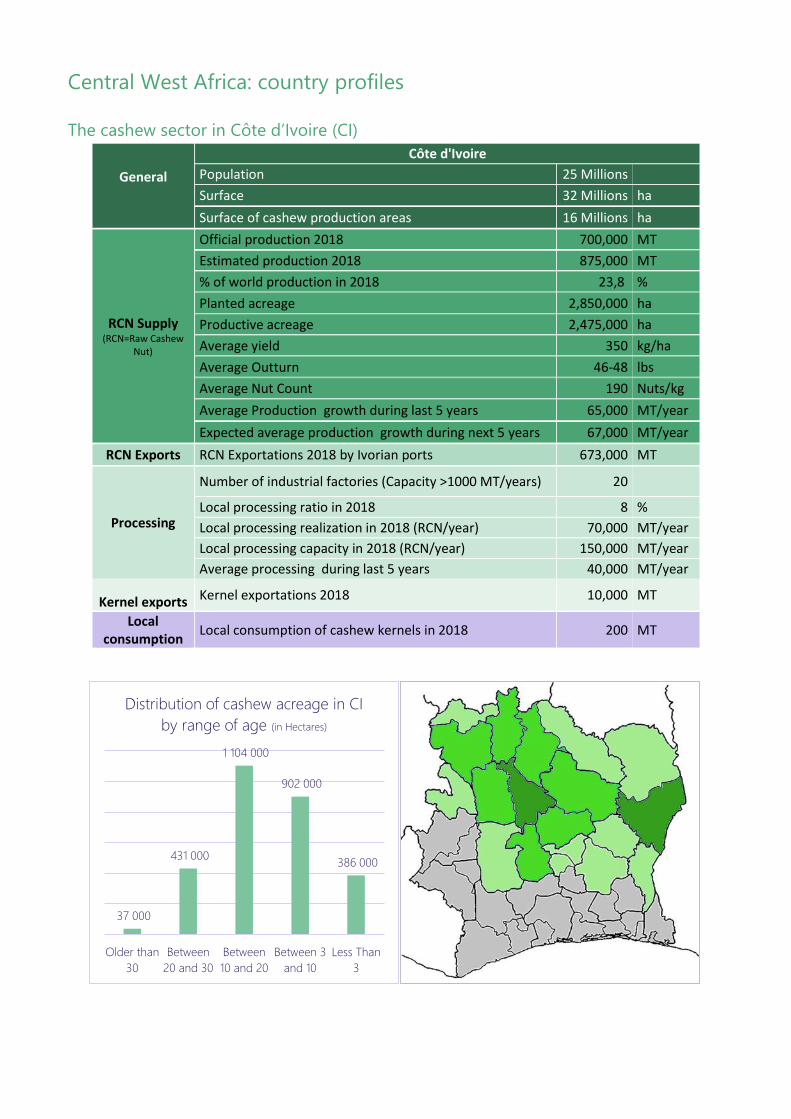
The cashew sector in Côte d’Ivoire (CI)
General
Côte d'Ivoire
Population 25 Millions
Surface 32 Millions ha
Surface of cashew production areas 16 Millions ha
RCN Supply (RCN=Raw Cashew
Nut)
Official production 2018 700,000 MT
Estimated production 2018 875,000 MT
% of world production in 2018 23,8 %
Planted acreage 2,850,000 ha
Productive acreage 2,475,000 ha
Average yield 350 kg/ha
Average Outturn 46-48 lbs
Average Nut Count 190 Nuts/kg
Average Production growth during last 5 years 65,000 MT/year
Expected average production growth during next 5 years 67,000 MT/year
RCN Exports RCN Exportations 2018 by Ivorian ports 673,000 MT
Processing
Number of industrial factories (Capacity >1000 MT/years) 20
Local processing ratio in 2018 8 %
Local processing realization in 2018 (RCN/year) 70,000 MT/year
Local processing capacity in 2018 (RCN/year) 150,000 MT/year
Average processing during last 5 years 40,000 MT/year
Kernel exports Kernel exportations 2018 10,000 MT
Local consumption
Local consumption of cashew kernels in 2018 200 MT
37 000
431 000
1 104 000
902 000
386 000
Older than
30
Between
20 and 30
Between
10 and 20
Between 3
and 10
Less Than
3
Distribution of cashew acreage in CI
by range of age (in Hectares)

60 000 173 000
351 000
722 000
875 000
1 345 000
0
200 000
400 000
600 000
800 000
1 000 000
1 200 000
1 400 000
1 600 000
2000
2001
2002
2003
2004
2005
2006
2007
2008
2009
2010
2011
2012
2013
2014
2015
2016
2017
2018
2019
*
2020*
2021*
2022*
2023*
2024*
2025*
Cashew production in Côte d'Ivoire: past & forecasts (in Metric Tons - Source: nitidae forecast model 2019)
Vietnam
430 000 India
220 000
Ghana
140 000
United Arab Emirates
10 000
Brazil
6 500 Indonesia
5 500 Others
1 000
Raw Cashew Nut exports from Côte d'Ivoire by destination (2018)(MT of RCN ; n'kalô Service - www.nkalo.com)
Vietnam
4550
USA
2250
EU28
1600
Inde
550
Switzerland
200 Canada
125
Others
725
Cashew kernel exports from Côte d'Ivoire by destination (2018)(MT of RCN ; n'kalô Service - www.nkalo.com)
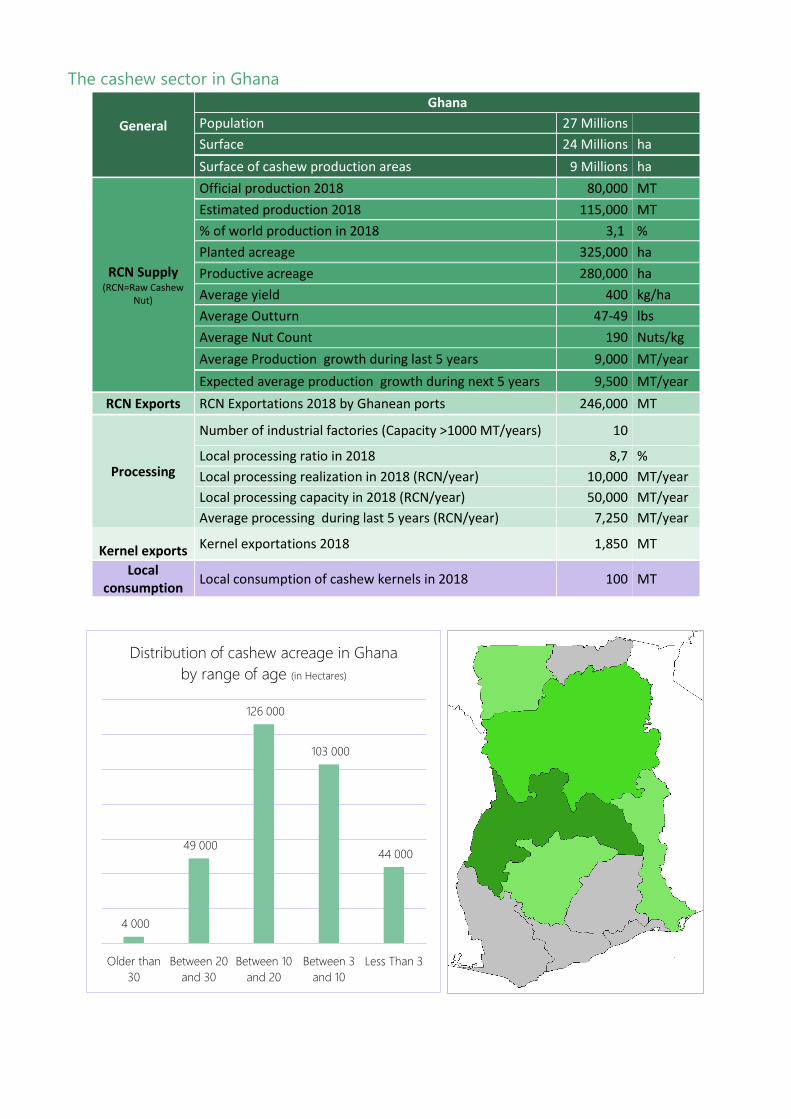
The cashew sector in Ghana
General
Ghana
Population 27 Millions
Surface 24 Millions ha
Surface of cashew production areas 9 Millions ha
RCN Supply (RCN=Raw Cashew
Nut)
Official production 2018 80,000 MT
Estimated production 2018 115,000 MT
% of world production in 2018 3,1 %
Planted acreage 325,000 ha
Productive acreage 280,000 ha
Average yield 400 kg/ha
Average Outturn 47-49 lbs
Average Nut Count 190 Nuts/kg
Average Production growth during last 5 years 9,000 MT/year
Expected average production growth during next 5 years 9,500 MT/year
RCN Exports RCN Exportations 2018 by Ghanean ports 246,000 MT
Processing
Number of industrial factories (Capacity >1000 MT/years) 10
Local processing ratio in 2018 8,7 %
Local processing realization in 2018 (RCN/year) 10,000 MT/year
Local processing capacity in 2018 (RCN/year) 50,000 MT/year
Average processing during last 5 years (RCN/year) 7,250 MT/year
Kernel exports Kernel exportations 2018 1,850 MT
Local consumption
Local consumption of cashew kernels in 2018 100 MT
4 000
49 000
126 000
103 000
44 000
Older than
30
Between 20
and 30
Between 10
and 20
Between 3
and 10
Less Than 3
Distribution of cashew acreage in Ghana
by range of age (in Hectares)

4 000 10 000
32 000
81 000
115 000
177 000
0
20 000
40 000
60 000
80 000
100 000
120 000
140 000
160 000
180 000
200 000
2000
2001
2002
2003
2004
2005
2006
2007
2008
2009
2010
2011
2012
2013
2014
2015
2016
2017
2018
2019
*
2020*
2021*
2022*
2023*
2024*
2025*
Cashew production in Ghana: past & forecasts (in Metric Tons - Source: nitidae forecast model 2019)
Côte
d'Ivoire
140 000
Mali
36 000
Burkina
Faso
5 000
Raw Cashew Nut imports to Ghana
by origin (2018) (MT of RCN ; n'kalô Service - www.nkalo.com)
Vietnam
147000
India
98500
Raw Cashew Nut exports from
Ghana by destination (2018)(MT of RCN ; n'kalô Service - www.nkalo.com)
European Union
816
USA
507
Brazil
241
Canada
235
Others
51
Cashew kernel exports from Ghana by destination (2018)(MT of RCN ; n'kalô Service - www.nkalo.com)
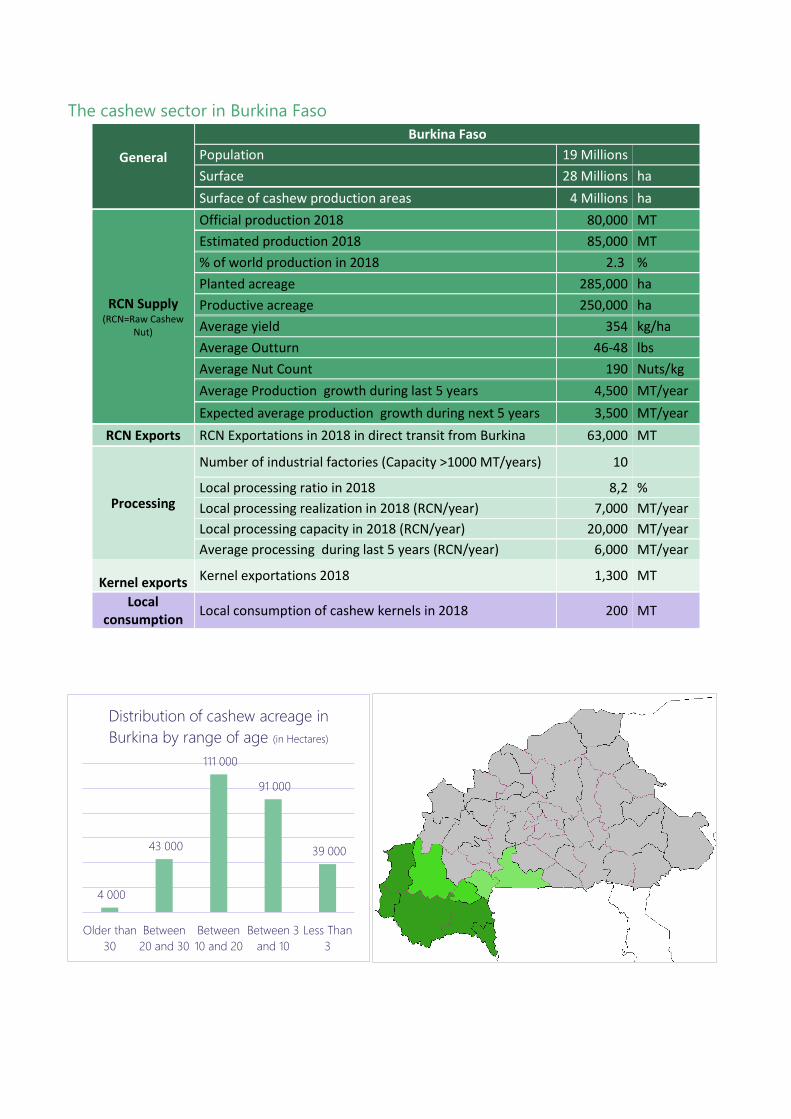
The cashew sector in Burkina Faso
General
Burkina Faso
Population 19 Millions
Surface 28 Millions ha
Surface of cashew production areas 4 Millions ha
RCN Supply (RCN=Raw Cashew
Nut)
Official production 2018 80,000 MT
Estimated production 2018 85,000 MT
% of world production in 2018 2.3 %
Planted acreage 285,000 ha
Productive acreage 250,000 ha
Average yield 354 kg/ha
Average Outturn 46-48 lbs
Average Nut Count 190 Nuts/kg
Average Production growth during last 5 years 4,500 MT/year
Expected average production growth during next 5 years 3,500 MT/year
RCN Exports RCN Exportations in 2018 in direct transit from Burkina 63,000 MT
Processing
Number of industrial factories (Capacity >1000 MT/years) 10
Local processing ratio in 2018 8,2 %
Local processing realization in 2018 (RCN/year) 7,000 MT/year
Local processing capacity in 2018 (RCN/year) 20,000 MT/year
Average processing during last 5 years (RCN/year) 6,000 MT/year
Kernel exports Kernel exportations 2018 1,300 MT
Local consumption
Local consumption of cashew kernels in 2018 200 MT
4 000
43 000
111 000
91 000
39 000
Older than
30
Between
20 and 30
Between
10 and 20
Between 3
and 10
Less Than
3
Distribution of cashew acreage in
Burkina by range of age (in Hectares)
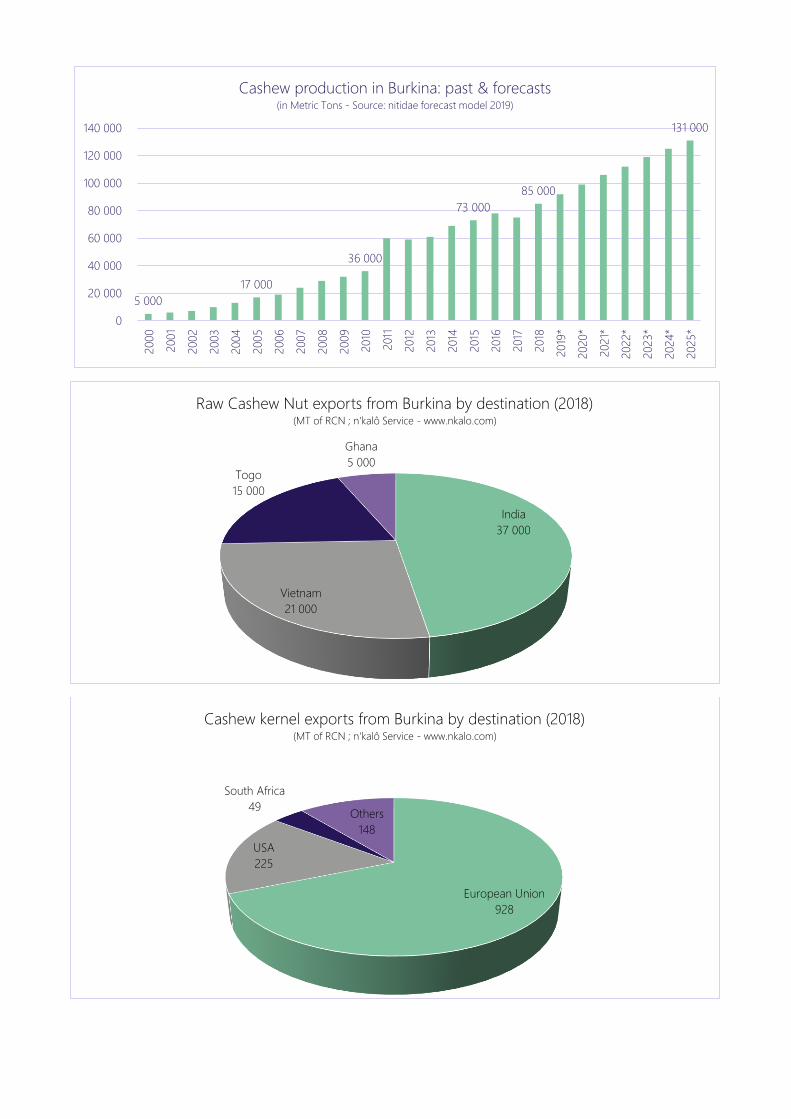
5 000
17 000
36 000
73 000
85 000
131 000
0
20 000
40 000
60 000
80 000
100 000
120 000
140 000
2000
2001
2002
2003
2004
2005
2006
2007
2008
2009
2010
2011
2012
2013
2014
2015
2016
2017
2018
2019
*
2020*
2021*
2022*
2023*
2024*
2025*
Cashew production in Burkina: past & forecasts (in Metric Tons - Source: nitidae forecast model 2019)
India
37 000
Vietnam
21 000
Togo
15 000
Ghana
5 000
Raw Cashew Nut exports from Burkina by destination (2018)(MT of RCN ; n'kalô Service - www.nkalo.com)
European Union
928
USA
225
South Africa
49Others
148
Cashew kernel exports from Burkina by destination (2018)(MT of RCN ; n'kalô Service - www.nkalo.com)
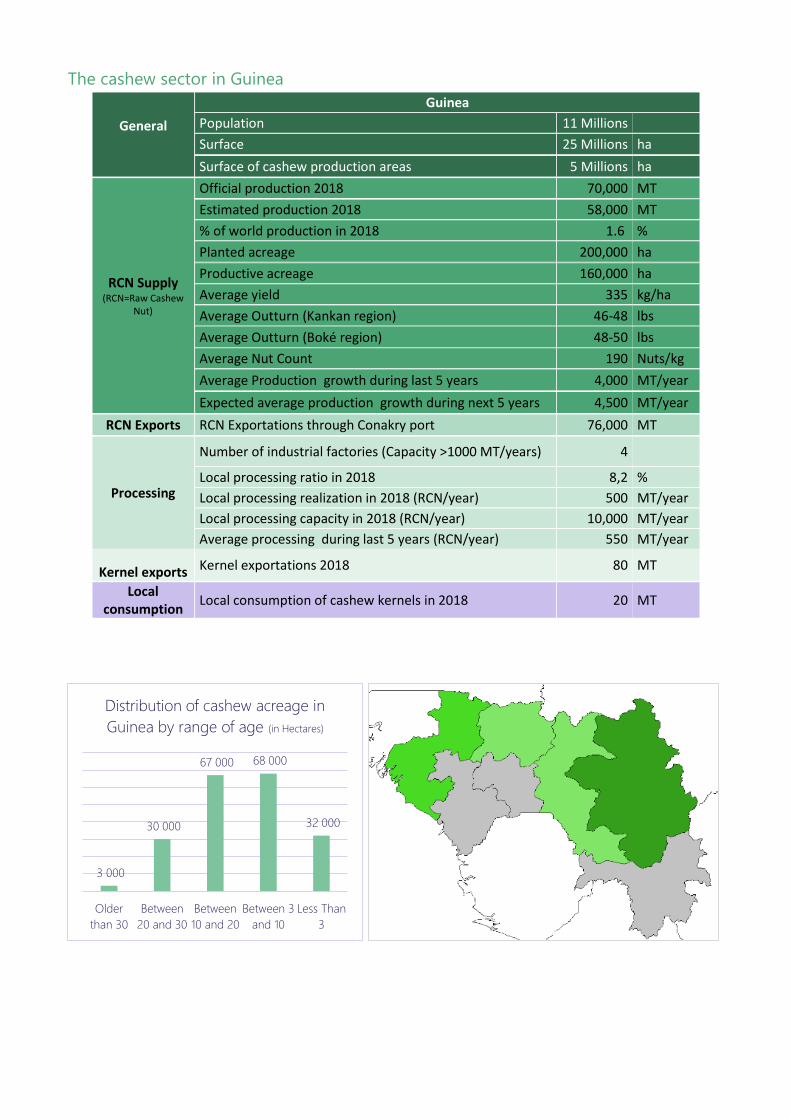
The cashew sector in Guinea
General
Guinea
Population 11 Millions
Surface 25 Millions ha
Surface of cashew production areas 5 Millions ha
RCN Supply (RCN=Raw Cashew
Nut)
Official production 2018 70,000 MT
Estimated production 2018 58,000 MT
% of world production in 2018 1.6 %
Planted acreage 200,000 ha
Productive acreage 160,000 ha
Average yield 335 kg/ha
Average Outturn (Kankan region) 46-48 lbs
Average Outturn (Boké region) 48-50 lbs
Average Nut Count 190 Nuts/kg
Average Production growth during last 5 years 4,000 MT/year
Expected average production growth during next 5 years 4,500 MT/year
RCN Exports RCN Exportations through Conakry port 76,000 MT
Processing
Number of industrial factories (Capacity >1000 MT/years) 4
Local processing ratio in 2018 8,2 %
Local processing realization in 2018 (RCN/year) 500 MT/year
Local processing capacity in 2018 (RCN/year) 10,000 MT/year
Average processing during last 5 years (RCN/year) 550 MT/year
Kernel exports Kernel exportations 2018 80 MT
Local consumption
Local consumption of cashew kernels in 2018 20 MT
3 000
30 000
67 000 68 000
32 000
Older
than 30
Between
20 and 30
Between
10 and 20
Between 3
and 10
Less Than
3
Distribution of cashew acreage in
Guinea by range of age (in Hectares)
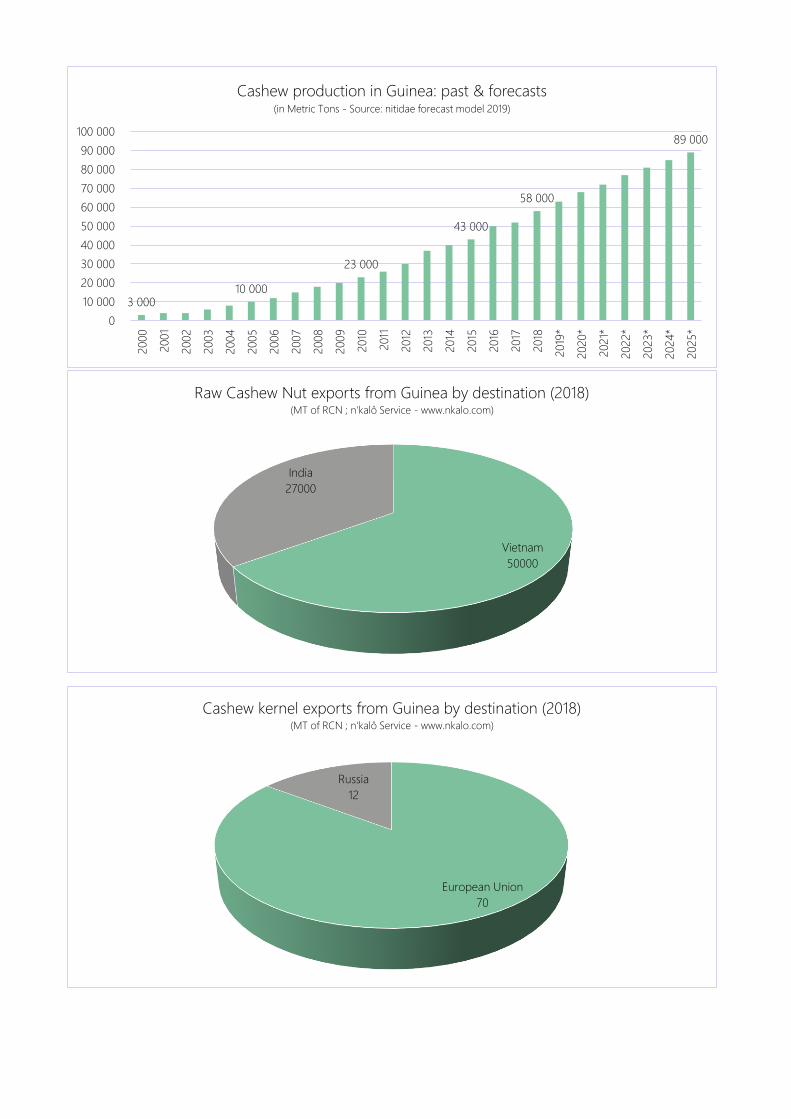
3 000 10 000
23 000
43 000
58 000
89 000
0
10 000
20 000
30 000
40 000
50 000
60 000
70 000
80 000
90 000
100 0002000
2001
2002
2003
2004
2005
2006
2007
2008
2009
2010
2011
2012
2013
2014
2015
2016
2017
2018
2019
*
2020*
2021*
2022*
2023*
2024*
2025*
Cashew production in Guinea: past & forecasts(in Metric Tons - Source: nitidae forecast model 2019)
Vietnam
50000
India
27000
Raw Cashew Nut exports from Guinea by destination (2018)(MT of RCN ; n'kalô Service - www.nkalo.com)
European Union
70
Russia
12
Cashew kernel exports from Guinea by destination (2018)(MT of RCN ; n'kalô Service - www.nkalo.com)
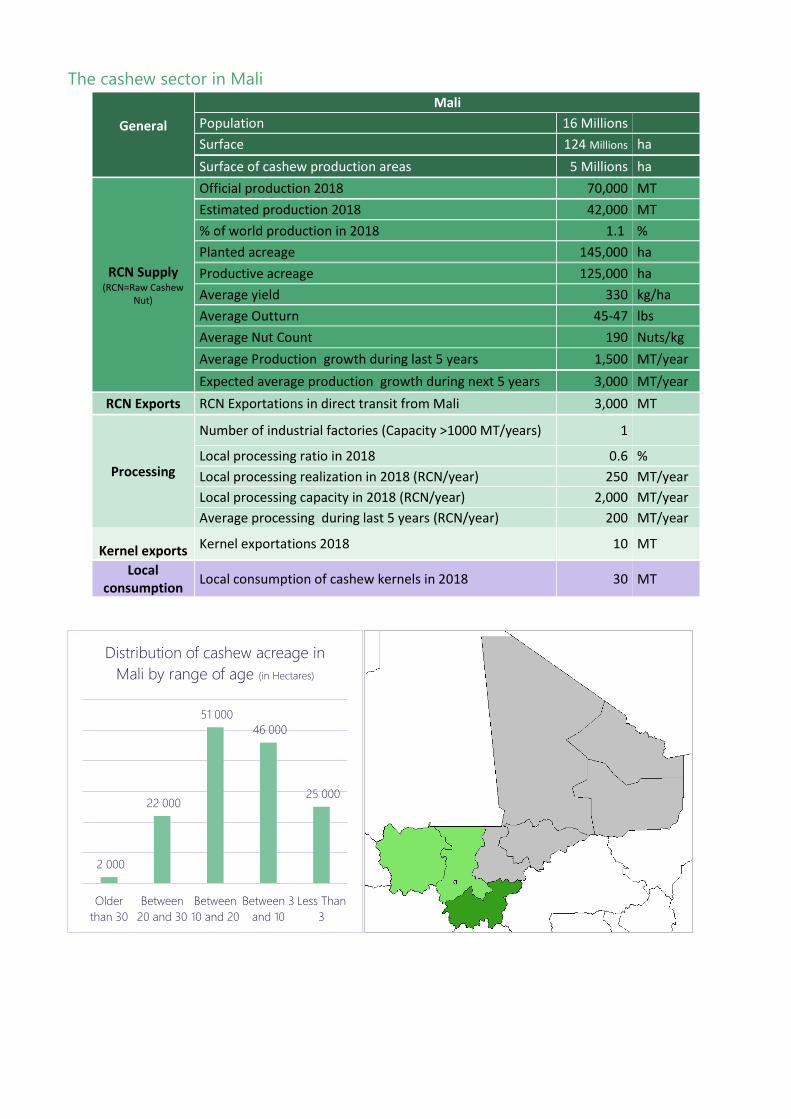
The cashew sector in Mali
General
Mali
Population 16 Millions
Surface 124 Millions ha
Surface of cashew production areas 5 Millions ha
RCN Supply (RCN=Raw Cashew
Nut)
Official production 2018 70,000 MT
Estimated production 2018 42,000 MT
% of world production in 2018 1.1 %
Planted acreage 145,000 ha
Productive acreage 125,000 ha
Average yield 330 kg/ha
Average Outturn 45-47 lbs
Average Nut Count 190 Nuts/kg
Average Production growth during last 5 years 1,500 MT/year
Expected average production growth during next 5 years 3,000 MT/year
RCN Exports RCN Exportations in direct transit from Mali 3,000 MT
Processing
Number of industrial factories (Capacity >1000 MT/years) 1
Local processing ratio in 2018 0.6 %
Local processing realization in 2018 (RCN/year) 250 MT/year
Local processing capacity in 2018 (RCN/year) 2,000 MT/year
Average processing during last 5 years (RCN/year) 200 MT/year
Kernel exports Kernel exportations 2018 10 MT
Local consumption
Local consumption of cashew kernels in 2018 30 MT
2 000
22 000
51 000
46 000
25 000
Older
than 30
Between
20 and 30
Between
10 and 20
Between 3
and 10
Less Than
3
Distribution of cashew acreage in
Mali by range of age (in Hectares)

2 000
8 000
20 000
40 000 42 000
65 000
0
10 000
20 000
30 000
40 000
50 000
60 000
70 0002000
2001
2002
2003
2004
2005
2006
2007
2008
2009
2010
2011
2012
2013
2014
2015
2016
2017
2018
2019
*
2020*
2021*
2022*
2023*
2024*
2025*
Cashew production in Mali: past & forecasts (in Metric Tons - Source: nitidae forecast model 2019)
Ghana (trhought
Burkina)
36000
The Gambia
3000
India
2000
China
1000
Raw Cashew Nut exports from Mali by destination (2018)(MT of RCN ; n'kalô Service - www.nkalo.com)

The cashew sector in Togo
General
Togo
Population 7 Millions
Surface 6 Millions ha
Surface of cashew production areas 2 Millions ha
RCN Supply (RCN=Raw Cashew
Nut)
Official production 2018 15,000 MT
Estimated production 2018 20,000 MT
% of world production in 2018 0.5 %
Planted acreage 65,000 ha
Productive acreage 50,000 ha
Average yield 350 kg/ha
Average Outturn 47-49 lbs
Average Nut Count 190 Nuts/kg
Average Production growth during last 5 years 2,500 MT/year
Expected average production growth during next 5 years 1,500 MT/year
RCN Exports RCN Exportations via Lomé port 34,000 MT
Processing
Number of industrial factories (Capacity >1000 MT/years) 3
Local processing ratio in 2018 10 %
Local processing realization in 2018 (RCN/year) 2,000 MT/year
Local processing capacity in 2018 (RCN/year) 6,000 MT/year
Average processing during last 5 years (RCN/year) 2,000 MT/year
Kernel exports Kernel exportations 2018 408 MT
Local consumption
Local consumption of cashew kernels in 2018 50 MT
1 000
10 000
20 000 21 000
14 000
Older than
30
Between 20
and 30
Between 10
and 20
Between 3
and 10
Less Than 3
Distribution of cashew acreage in Togo
by range of age (in Hectares)

1 000 1 500 2 200
10 000
20 000
31 000
0
5 000
10 000
15 000
20 000
25 000
30 000
35 0002000
2001
2002
2003
2004
2005
2006
2007
2008
2009
2010
2011
2012
2013
2014
2015
2016
2017
2018
2019
*
2020*
2021*
2022*
2023*
2024*
2025*
Cashew production in Togo: past & forecasts (in Metric Tons - Source: nitidae forecast model 2019)
India
24 500
Vietnam
7 500
China
2 000
Raw Cashew Nut exports from Togo by destination (2018)(MT of RCN ; n'kalô Service - www.nkalo.com)
European Union
267
USA
134
Others
7
Cashew kernel exports from Togo by destination (2018)(MT of RCN ; n'kalô Service - www.nkalo.com)

Eastern West Africa: Country profiles
The cashew sector in Nigeria
General
Nigeria
Population 190 Millions
Surface 92 Millions ha
Surface of cashew production areas 14 Millions ha
RCN Supply (RCN=Raw Cashew
Nut)
Official production 2018 250,000 MT
Estimated production 2018 240,000 MT
% of world production in 2018 6.5 %
Planted acreage 755,000 ha
Productive acreage 660,000 ha
Average yield 363 kg/ha
Average Outturn 46-49 lbs
Average Nut Count 180 Nuts/kg
Average Production growth during last 5 years 22,000 MT/year
Expected average production growth during next 5 years 15,000 MT/year
RCN Exports RCN Exportations via Nigerian ports in 2018 213,000 MT
Processing
Number of industrial factories (Capacity >1000 MT/years) 10
Local processing ratio in 2018 3 %
Local processing realization in 2018 (RCN/year) 7,500 MT/year
Local processing capacity in 2018 (RCN/year) 50,000 MT/year
Average processing during last 5 years (RCN/year) 7,000 MT/year
Kernel exports Kernel exportations 2018 770 MT
Local consumption
Local consumption of cashew kernels in 2018 750 MT
44 000
111 000
269 000
237 000
96 000
Older
than 30
Between
20 and 30
Between
10 and 20
Between 3
and 10
Less Than
3
Distribution of cashew acreage in
Nigeria by range of age (in Hectares)
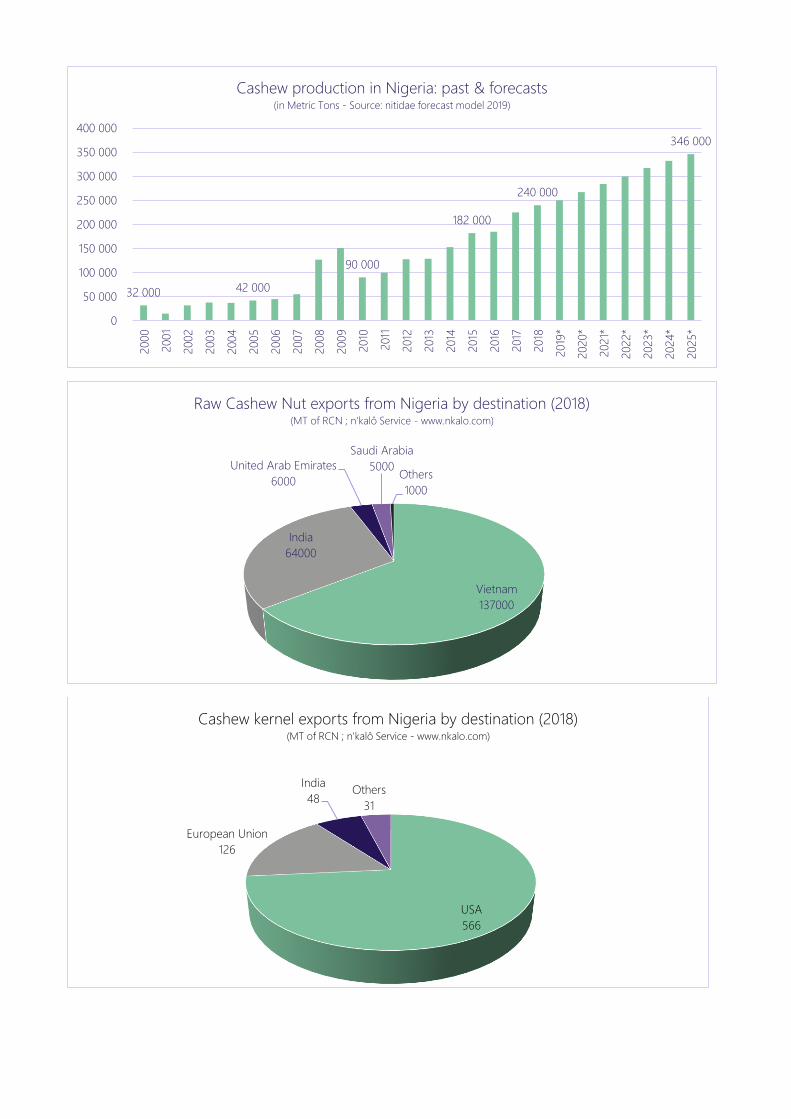
32 000 42 000
90 000
182 000
240 000
346 000
0
50 000
100 000
150 000
200 000
250 000
300 000
350 000
400 000
2000
2001
2002
2003
2004
2005
2006
2007
2008
2009
2010
2011
2012
2013
2014
2015
2016
2017
2018
2019
*
2020*
2021*
2022*
2023*
2024*
2025*
Cashew production in Nigeria: past & forecasts (in Metric Tons - Source: nitidae forecast model 2019)
Vietnam
137000
India
64000
United Arab Emirates
6000
Saudi Arabia
5000Others
1000
Raw Cashew Nut exports from Nigeria by destination (2018)(MT of RCN ; n'kalô Service - www.nkalo.com)
USA
566
European Union
126
India
48Others
31
Cashew kernel exports from Nigeria by destination (2018)(MT of RCN ; n'kalô Service - www.nkalo.com)

The cashew sector in Benin
General
Benin
Population 10 Millions
Surface 11 Millions ha
Surface of cashew production areas 5 Millions ha
RCN Supply (RCN=Raw Cashew
Nut)
Official production 2018 140,000 MT
Estimated production 2018 140,000 MT
% of world production in 2018 3.8 %
Planted acreage 425,000 ha
Productive acreage 370,000 ha
Average yield 377 kg/ha
Average Outturn 47-49 lbs
Average Nut Count 170 Nuts/kg
Average Production growth during last 5 years 12,500 MT/year
Expected average production growth during next 5 years 9,000 MT/year
RCN Exports RCN Exportations via Cotonou port in 2018 177,000 MT
Processing
Number of industrial factories (Capacity >1000 MT/years) 7
Local processing ratio in 2018 9,3 %
Local processing realization in 2018 (RCN/year) 13,000 MT/year
Local processing capacity in 2018 (RCN/year) 40,000 MT/year
Average processing during last 5 years (RCN/year) 7,500 MT/year
Kernel exports Kernel exportations 2018 2,200 MT
Local consumption
Local consumption of cashew kernels in 2018 100 MT
25 000
62 000
151 000
133 000
54 000
Older than
30
Between 20
and 30
Between 10
and 20
Between 3
and 10
Less Than 3
Distribution of cashew acreage in
Nigeria by range of age (in Hectares)

31 000
61 000 77 000
101 000
140 000
202 000
0
50 000
100 000
150 000
200 000
250 000
2000
2001
2002
2003
2004
2005
2006
2007
2008
2009
2010
2011
2012
2013
2014
2015
2016
2017
2018
2019
*
2020*
2021*
2022*
2023*
2024*
2025*
Cashew production in Benin: past & forecasts (in Metric Tons - Source: nitidae forecast model 2019)
India
140000
Vietnam
35000
China
2000
Raw Cashew Nut exports from Bénin by destination (2018)(MT of RCN ; n'kalô Service - www.nkalo.com)
USA
1 688
European Union
274
Canada
88
Switzerland
86
Others
64
Cashew kernel exports from Benin by destination (2018)(MT of RCN ; n'kalô Service - www.nkalo.com)
Western West Africa: Country profiles
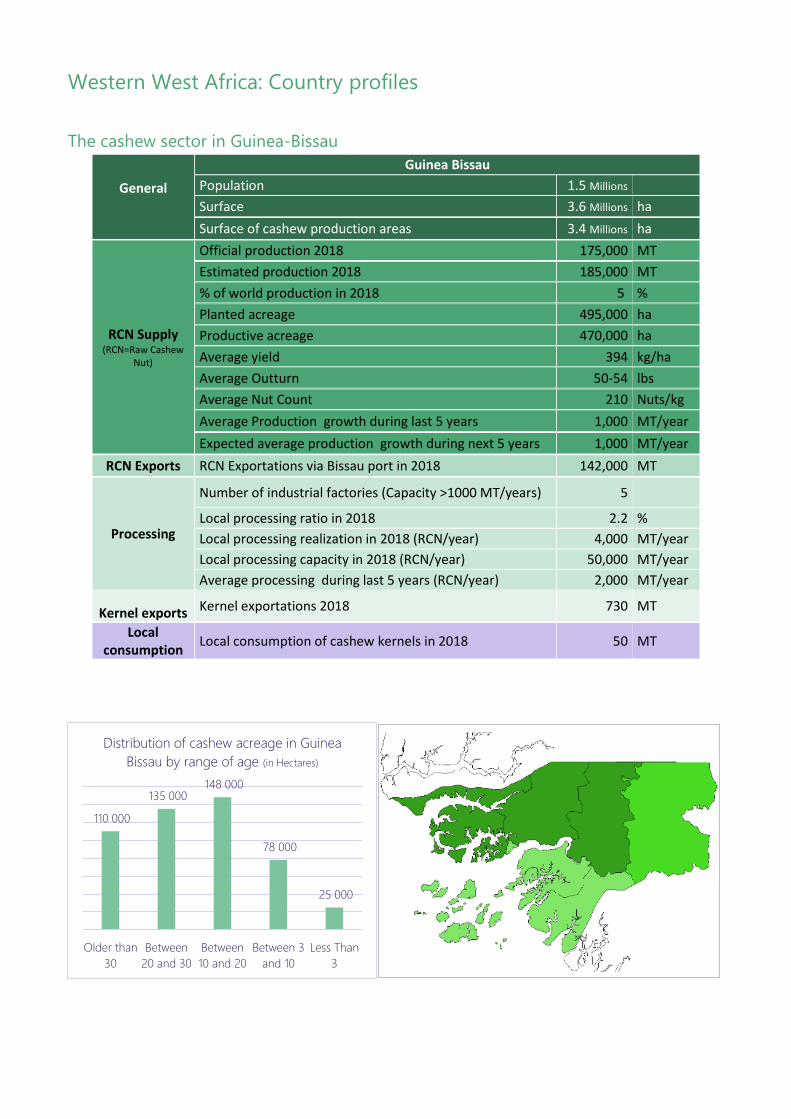
The cashew sector in Guinea-Bissau
General
Guinea Bissau
Population 1.5 Millions
Surface 3.6 Millions ha
Surface of cashew production areas 3.4 Millions ha
RCN Supply (RCN=Raw Cashew
Nut)
Official production 2018 175,000 MT
Estimated production 2018 185,000 MT
% of world production in 2018 5 %
Planted acreage 495,000 ha
Productive acreage 470,000 ha
Average yield 394 kg/ha
Average Outturn 50-54 lbs
Average Nut Count 210 Nuts/kg
Average Production growth during last 5 years 1,000 MT/year
Expected average production growth during next 5 years 1,000 MT/year
RCN Exports RCN Exportations via Bissau port in 2018 142,000 MT
Processing
Number of industrial factories (Capacity >1000 MT/years) 5
Local processing ratio in 2018 2.2 %
Local processing realization in 2018 (RCN/year) 4,000 MT/year
Local processing capacity in 2018 (RCN/year) 50,000 MT/year
Average processing during last 5 years (RCN/year) 2,000 MT/year
Kernel exports Kernel exportations 2018 730 MT
Local consumption
Local consumption of cashew kernels in 2018 50 MT
110 000
135 000 148 000
78 000
25 000
Older than
30
Between
20 and 30
Between
10 and 20
Between 3
and 10
Less Than
3
Distribution of cashew acreage in Guinea
Bissau by range of age (in Hectares)
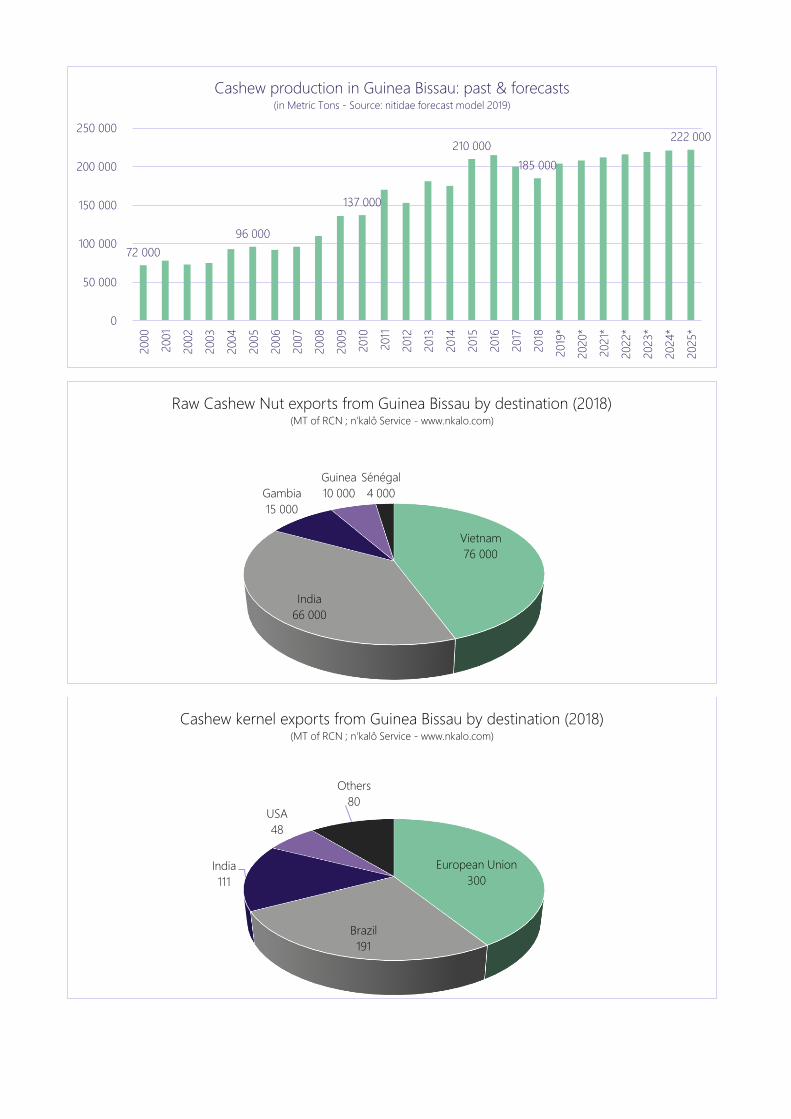
72 000
96 000
137 000
210 000
185 000
222 000
0
50 000
100 000
150 000
200 000
250 000
2000
2001
2002
2003
2004
2005
2006
2007
2008
2009
2010
2011
2012
2013
2014
2015
2016
2017
2018
2019
*
2020*
2021*
2022*
2023*
2024*
2025*
Cashew production in Guinea Bissau: past & forecasts (in Metric Tons - Source: nitidae forecast model 2019)
Vietnam
76 000
India
66 000
Gambia
15 000
Guinea
10 000
Sénégal
4 000
Raw Cashew Nut exports from Guinea Bissau by destination (2018)(MT of RCN ; n'kalô Service - www.nkalo.com)
European Union
300
Brazil
191
India
111
USA
48
Others
80
Cashew kernel exports from Guinea Bissau by destination (2018)(MT of RCN ; n'kalô Service - www.nkalo.com)

The cashew sector in Senegal
General
Senegal
Population 15 Millions
Surface 20 Millions ha
Surface of cashew production areas 2.5 Millions ha
RCN Supply (RCN=Raw Cashew
Nut)
Official production 2018 30,000 MT
Estimated production 2018 30,000 MT
% of world production in 2018 0.8 %
Planted acreage 91,000 ha
Productive acreage 86,000 ha
Average yield 349 kg/ha
Average Outturn 50-52 lbs
Average Nut Count 200 Nuts/kg
Average Production growth during last 5 years 1,000 MT/year
Expected average production growth during next 5 years 500 MT/year
RCN Exports RCN Exportations via Dakar port in 2018 29,000 MT
Processing
Number of industrial factories (Capacity >1000 MT/years) 1
Local processing ratio in 2018 1.7 %
Local processing realization in 2018 (RCN/year) 500 MT/year
Local processing capacity in 2018 (RCN/year) 5,000 MT/year
Average processing during last 5 years (RCN/year) 300 MT/year
Kernel exports Kernel exportations 2018 18 MT
Local consumption
Local consumption of cashew kernels in 2018 100 MT
20 000
25 000 27 000
14 000
5 000
Older
than 30
Between
20 and 30
Between
10 and 20
Between 3
and 10
Less Than
3
Distribution of cashew acreage in
Senegal by range of age (in Hectares)

7 000
16 000
28 000 27 000 30 000
41 000
0
5 000
10 000
15 000
20 000
25 000
30 000
35 000
40 000
45 0002000
2001
2002
2003
2004
2005
2006
2007
2008
2009
2010
2011
2012
2013
2014
2015
2016
2017
2018
2019
*
2020*
2021*
2022*
2023*
2024*
2025*
Cashew production in Senegal: past & forecasts (in Metric Tons - Source: nitidae forecast model 2019)
Vietnam
17 000India
14 000
Gambia
3 000
Raw Cashew Nut exports from Senegal by destination (2018)(MT of RCN ; n'kalô Service - www.nkalo.com)

The cashew sector in The Gambia
General
The Gambia
Population 2 Millions
Surface 1.1 Millions ha
Surface of cashew production areas 0.8 Millions ha
RCN Supply (RCN=Raw Cashew
Nut)
Official production 2018 15,000 MT
Estimated production 2018 6,000 MT
% of world production in 2018 0.2 %
Planted acreage 18,000 ha
Productive acreage 17,000 ha
Average yield 353 kg/ha
Average Outturn 50-52 lbs
Average Nut Count 200 Nuts/kg
Average Production growth during last 5 years 100 MT/year
Expected average production growth during next 5 years 100 MT/year
RCN Exports RCN Exportations via Banjul port in 2018 20,000 MT
Processing
Number of industrial factories (Capacity >1000 MT/years) 1
Local processing ratio in 2018 8.3 %
Local processing realization in 2018 (RCN/year) 500 MT/year
Local processing capacity in 2018 (RCN/year) 2,500 MT/year
Average processing during last 5 years (RCN/year) 400 MT/year
Kernel exports Kernel exportations 2018 0 MT
Local consumption
Local consumption of cashew kernels in 2018 115 MT
4 000
5 000 5 000
3 000
1 000
Older than 30 Between 20 and 30 Between 10 and 20 Between 3 and 10 Less Than 3
Distribution of cashew acreage in Gambia by range of age (in Hectares)
SOURCES :
- UNCOMTRADE: https://comtrade.un.org ,
- Trademap: www.trademap.org
- Eurostat: https://ec.europa.eu/eurostat
- USDA: https://apps.fas.usda.gov/gats
- Indian Customs: http://www.dgciskol.gov.in
- Vietnam Custom: www.customs.gov.vn
- Côte d’Ivoire customs: http://www.douanes.ci
- N’Kalô Service Network and data base: www.nkalo.com
- Nitidae’s cashew crop model: www.nitidae.org
For questions & comments or to subscribe to our weekly market reports on cashew, please write
to Pierre RICAU: [email protected] or [email protected]
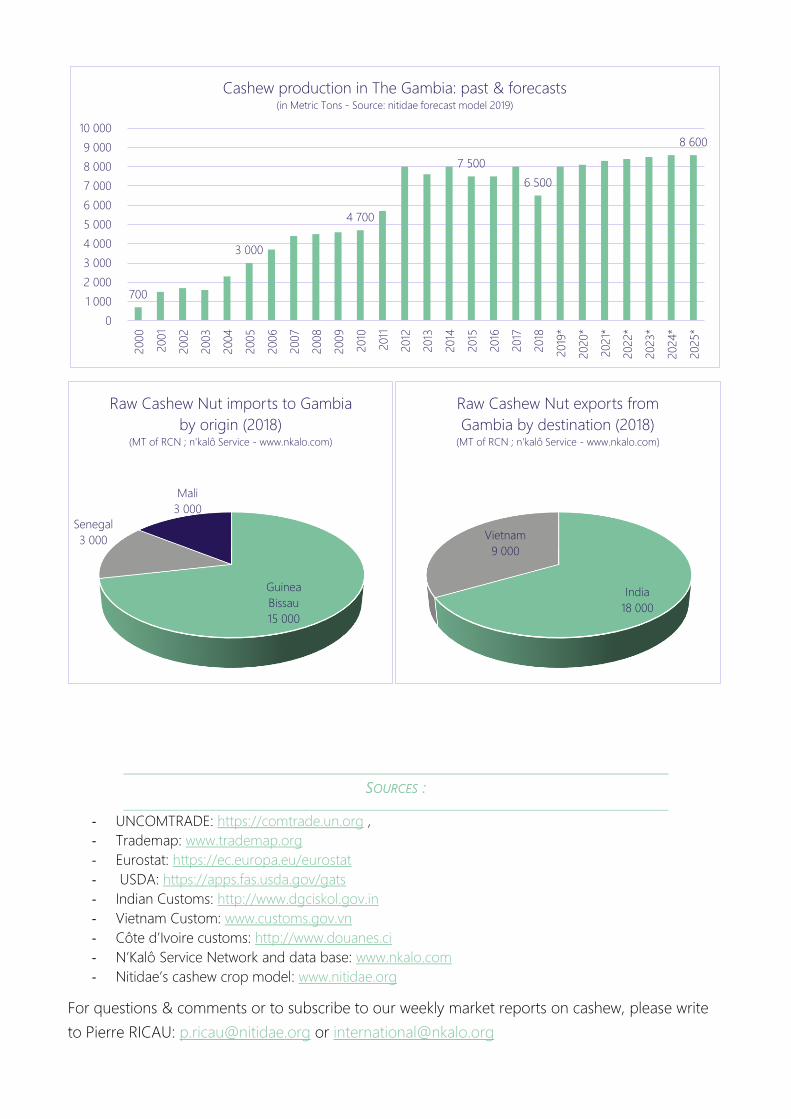
700
3 000
4 700
7 500
6 500
8 600
0
1 000
2 000
3 000
4 000
5 000
6 000
7 000
8 000
9 000
10 0002000
2001
2002
2003
2004
2005
2006
2007
2008
2009
2010
2011
2012
2013
2014
2015
2016
2017
2018
2019
*
2020*
2021*
2022*
2023*
2024*
2025*
Cashew production in The Gambia: past & forecasts (in Metric Tons - Source: nitidae forecast model 2019)
Guinea
Bissau
15 000
Senegal
3 000
Mali
3 000
Raw Cashew Nut imports to Gambia
by origin (2018)(MT of RCN ; n'kalô Service - www.nkalo.com)
India
18 000
Vietnam
9 000
Raw Cashew Nut exports from
Gambia by destination (2018)(MT of RCN ; n'kalô Service - www.nkalo.com)