the wharf (holdings) limited 2015 final results 9 march 2016 2015 final results... · the wharf...
TRANSCRIPT
The Wharf (Holdings) Limited
2015 Final Results
9 March 2016
2015
1
Resilient IP Core
The Wharf (Holdings) Limited
2015 Final Results
9 March 2016
2015
2
Backdrop
• Core Profit Steady Growth was Sustained in 2015
• IP Resilience Continued and is Expected to Spill Over into 2016
• Headwinds – Global Economic Slowdown, Currency Instability & Uncertainty, HK Retail, China Office
2015
3
Resilient Foundation to Move Ahead
• Navigating Through Tough Times; Stability in Challenging Times
• Resilient Core Operations
• China IP Starting to Bear Fruit; New Malls Outperform
2015
4

Steady Growth in IP Assets
• Total Assets were Stable at $444B
• IP Portfolio Increased by 3% to $310B
• DP Decreased to $38B (excl. JVs & Associates)
2015
70%
15%
15%
Total Assets
$444 billion Others
IP
DP (Incl. JVs & Associates)
5

IP – Strong Execution Amid Tough Market
2.3 2.9 3.7 4.6 4.9 5.7 5.9 6.5 7.6 8.3
2006
2007
2008
2009
2010
2011
2012
2013
2014
2015
IP Core Profit (HKD Billion) $8.3B (+9%)
• IP / Core Profit: 76% (2014: 73%)
• Core Expertise of a Unique Portfolio
• Proven Retail Management Drove Rental Growth
• Office Added Impetus
2015
69%
7% 11%
13%
Core Profit
$11 billion Others
HKIP
China IP DP
6
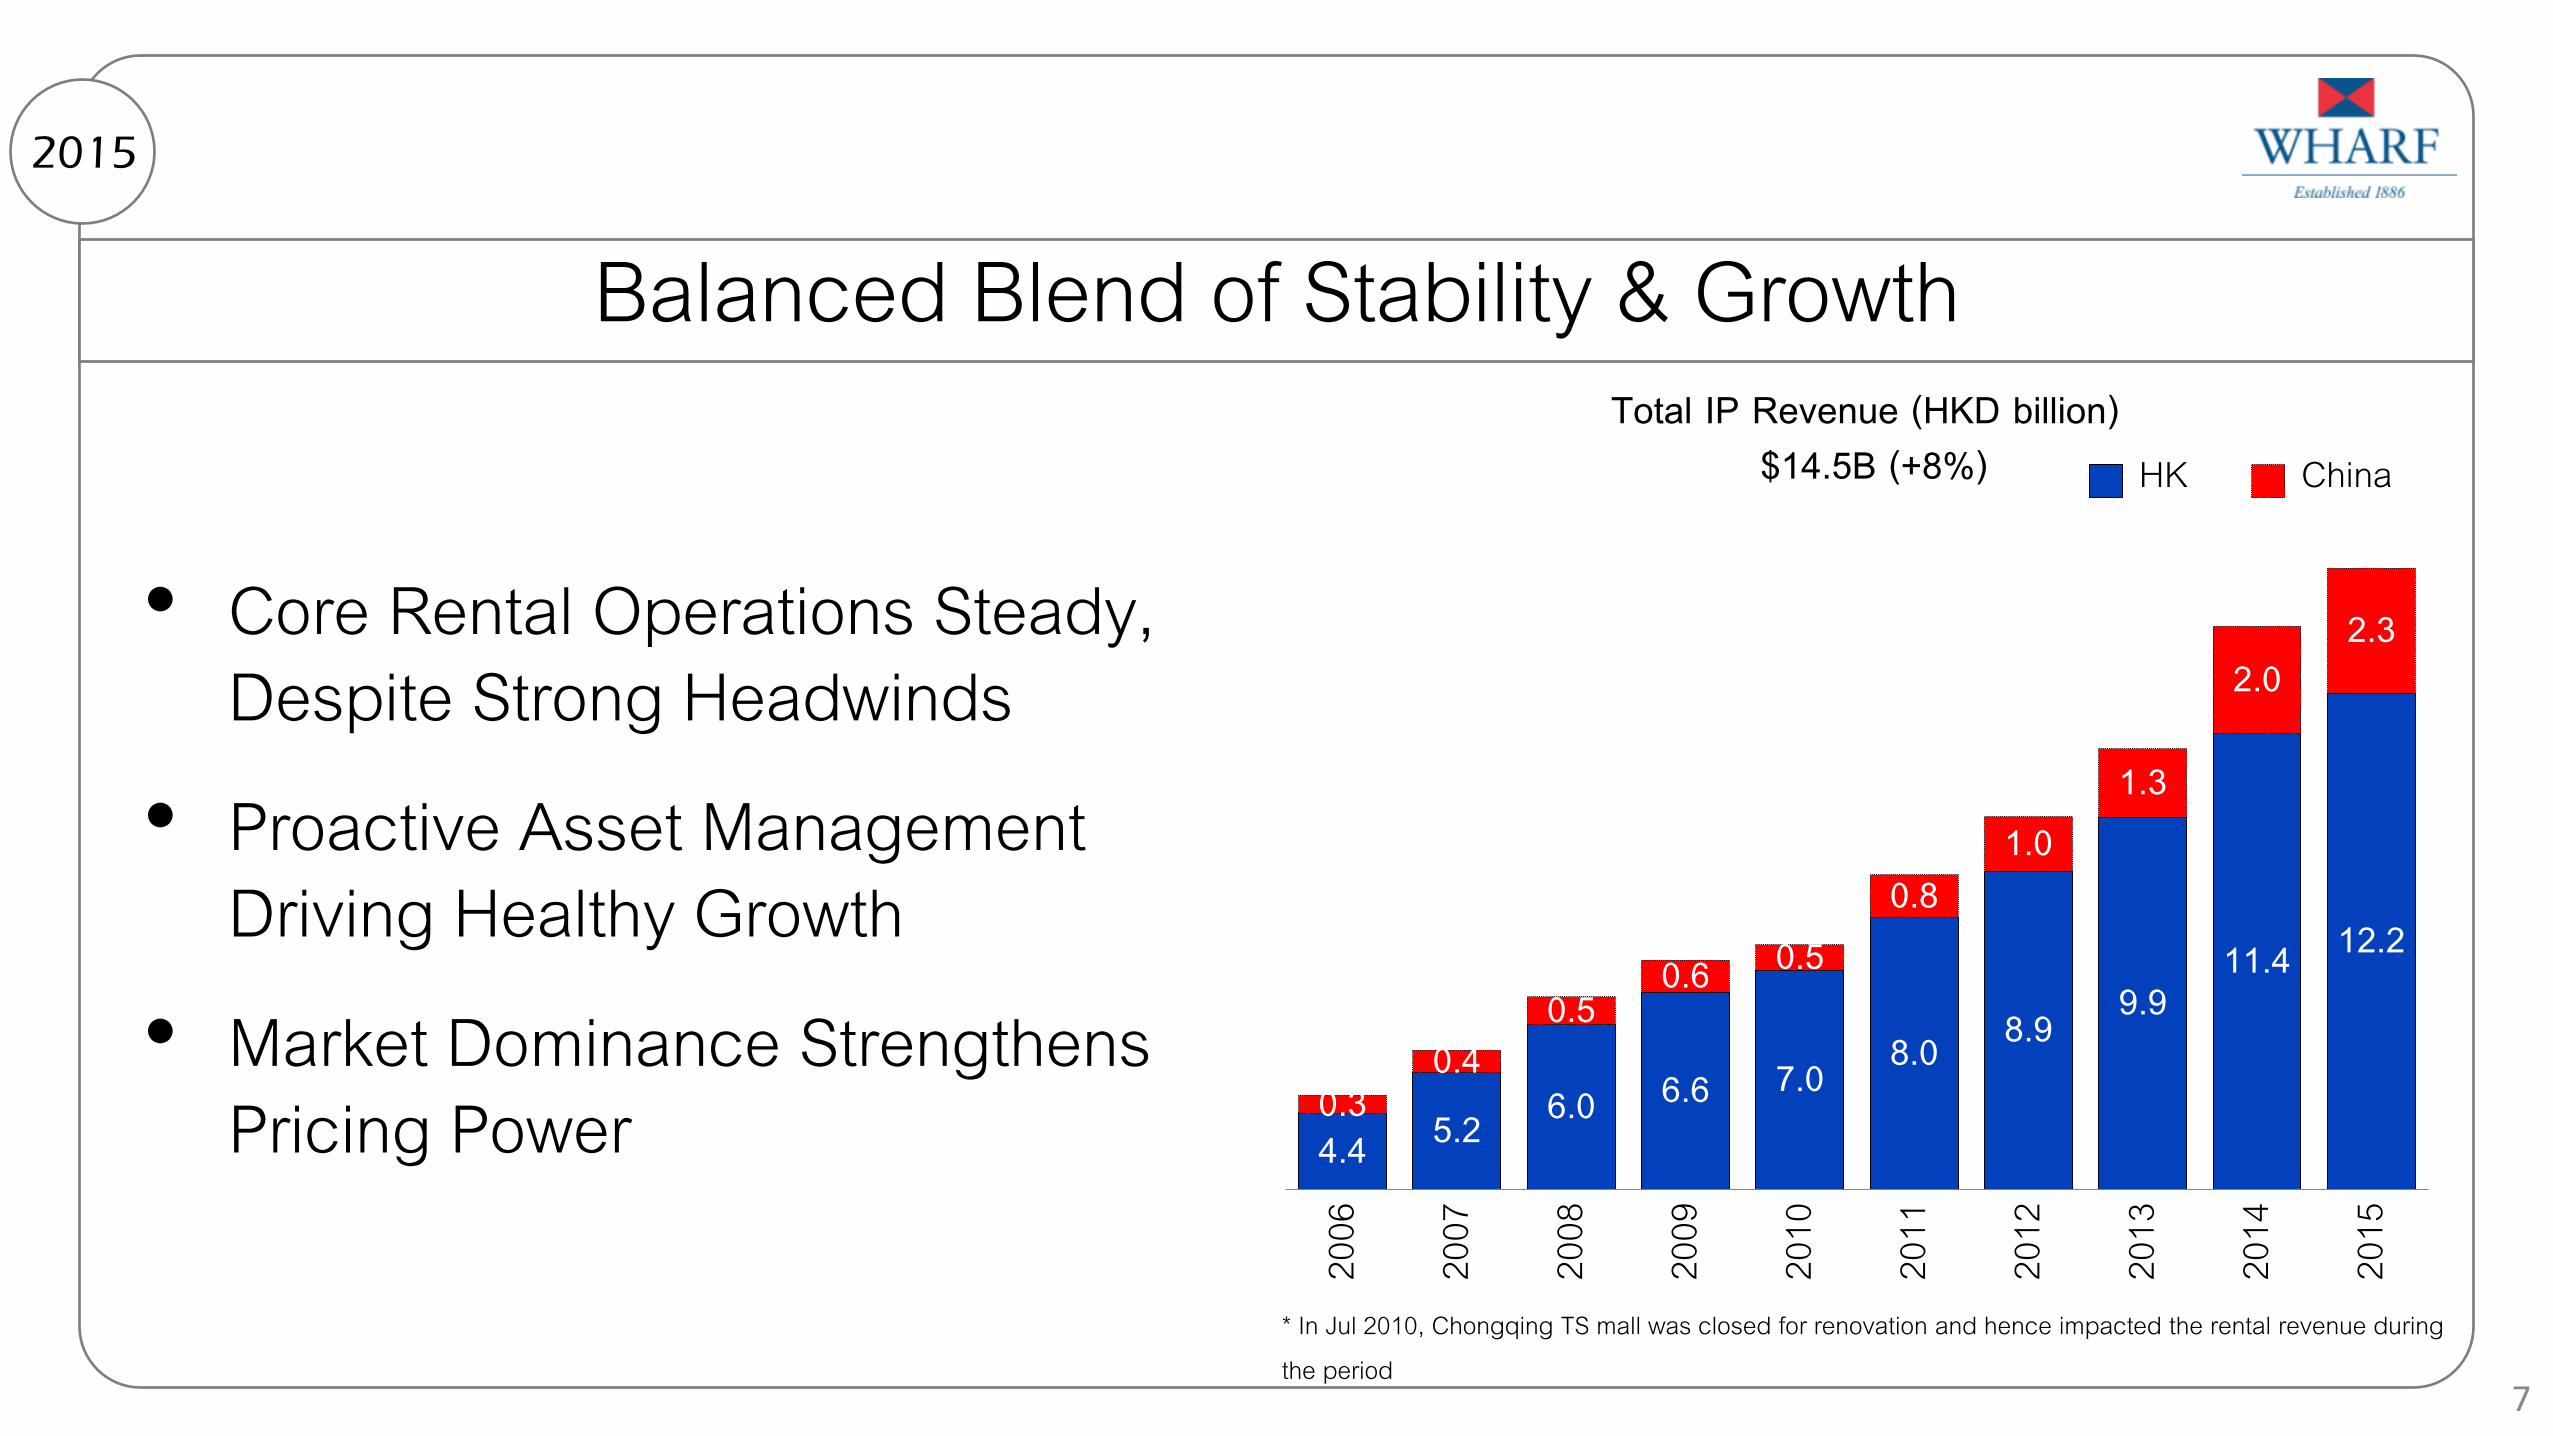
Balanced Blend of Stability & Growth
• Core Rental Operations Steady, Despite Strong Headwinds
• Proactive Asset Management Driving Healthy Growth
• Market Dominance Strengthens Pricing Power
2015
* In Jul 2010, Chongqing TS mall was closed for renovation and hence impacted the rental revenue during the period
4.4 5.2 6.0 6.6 7.0 8.0 8.9 9.9 11.4 12.2
0.3 0.4
0.5 0.6 0.5
0.8 1.0
1.3
2.0 2.3
2006
2007
2008
2009
2010
2011
2012
2013
2014
2015
Total IP Revenue (HKD billion) HK China$14.5B (+8%)
7
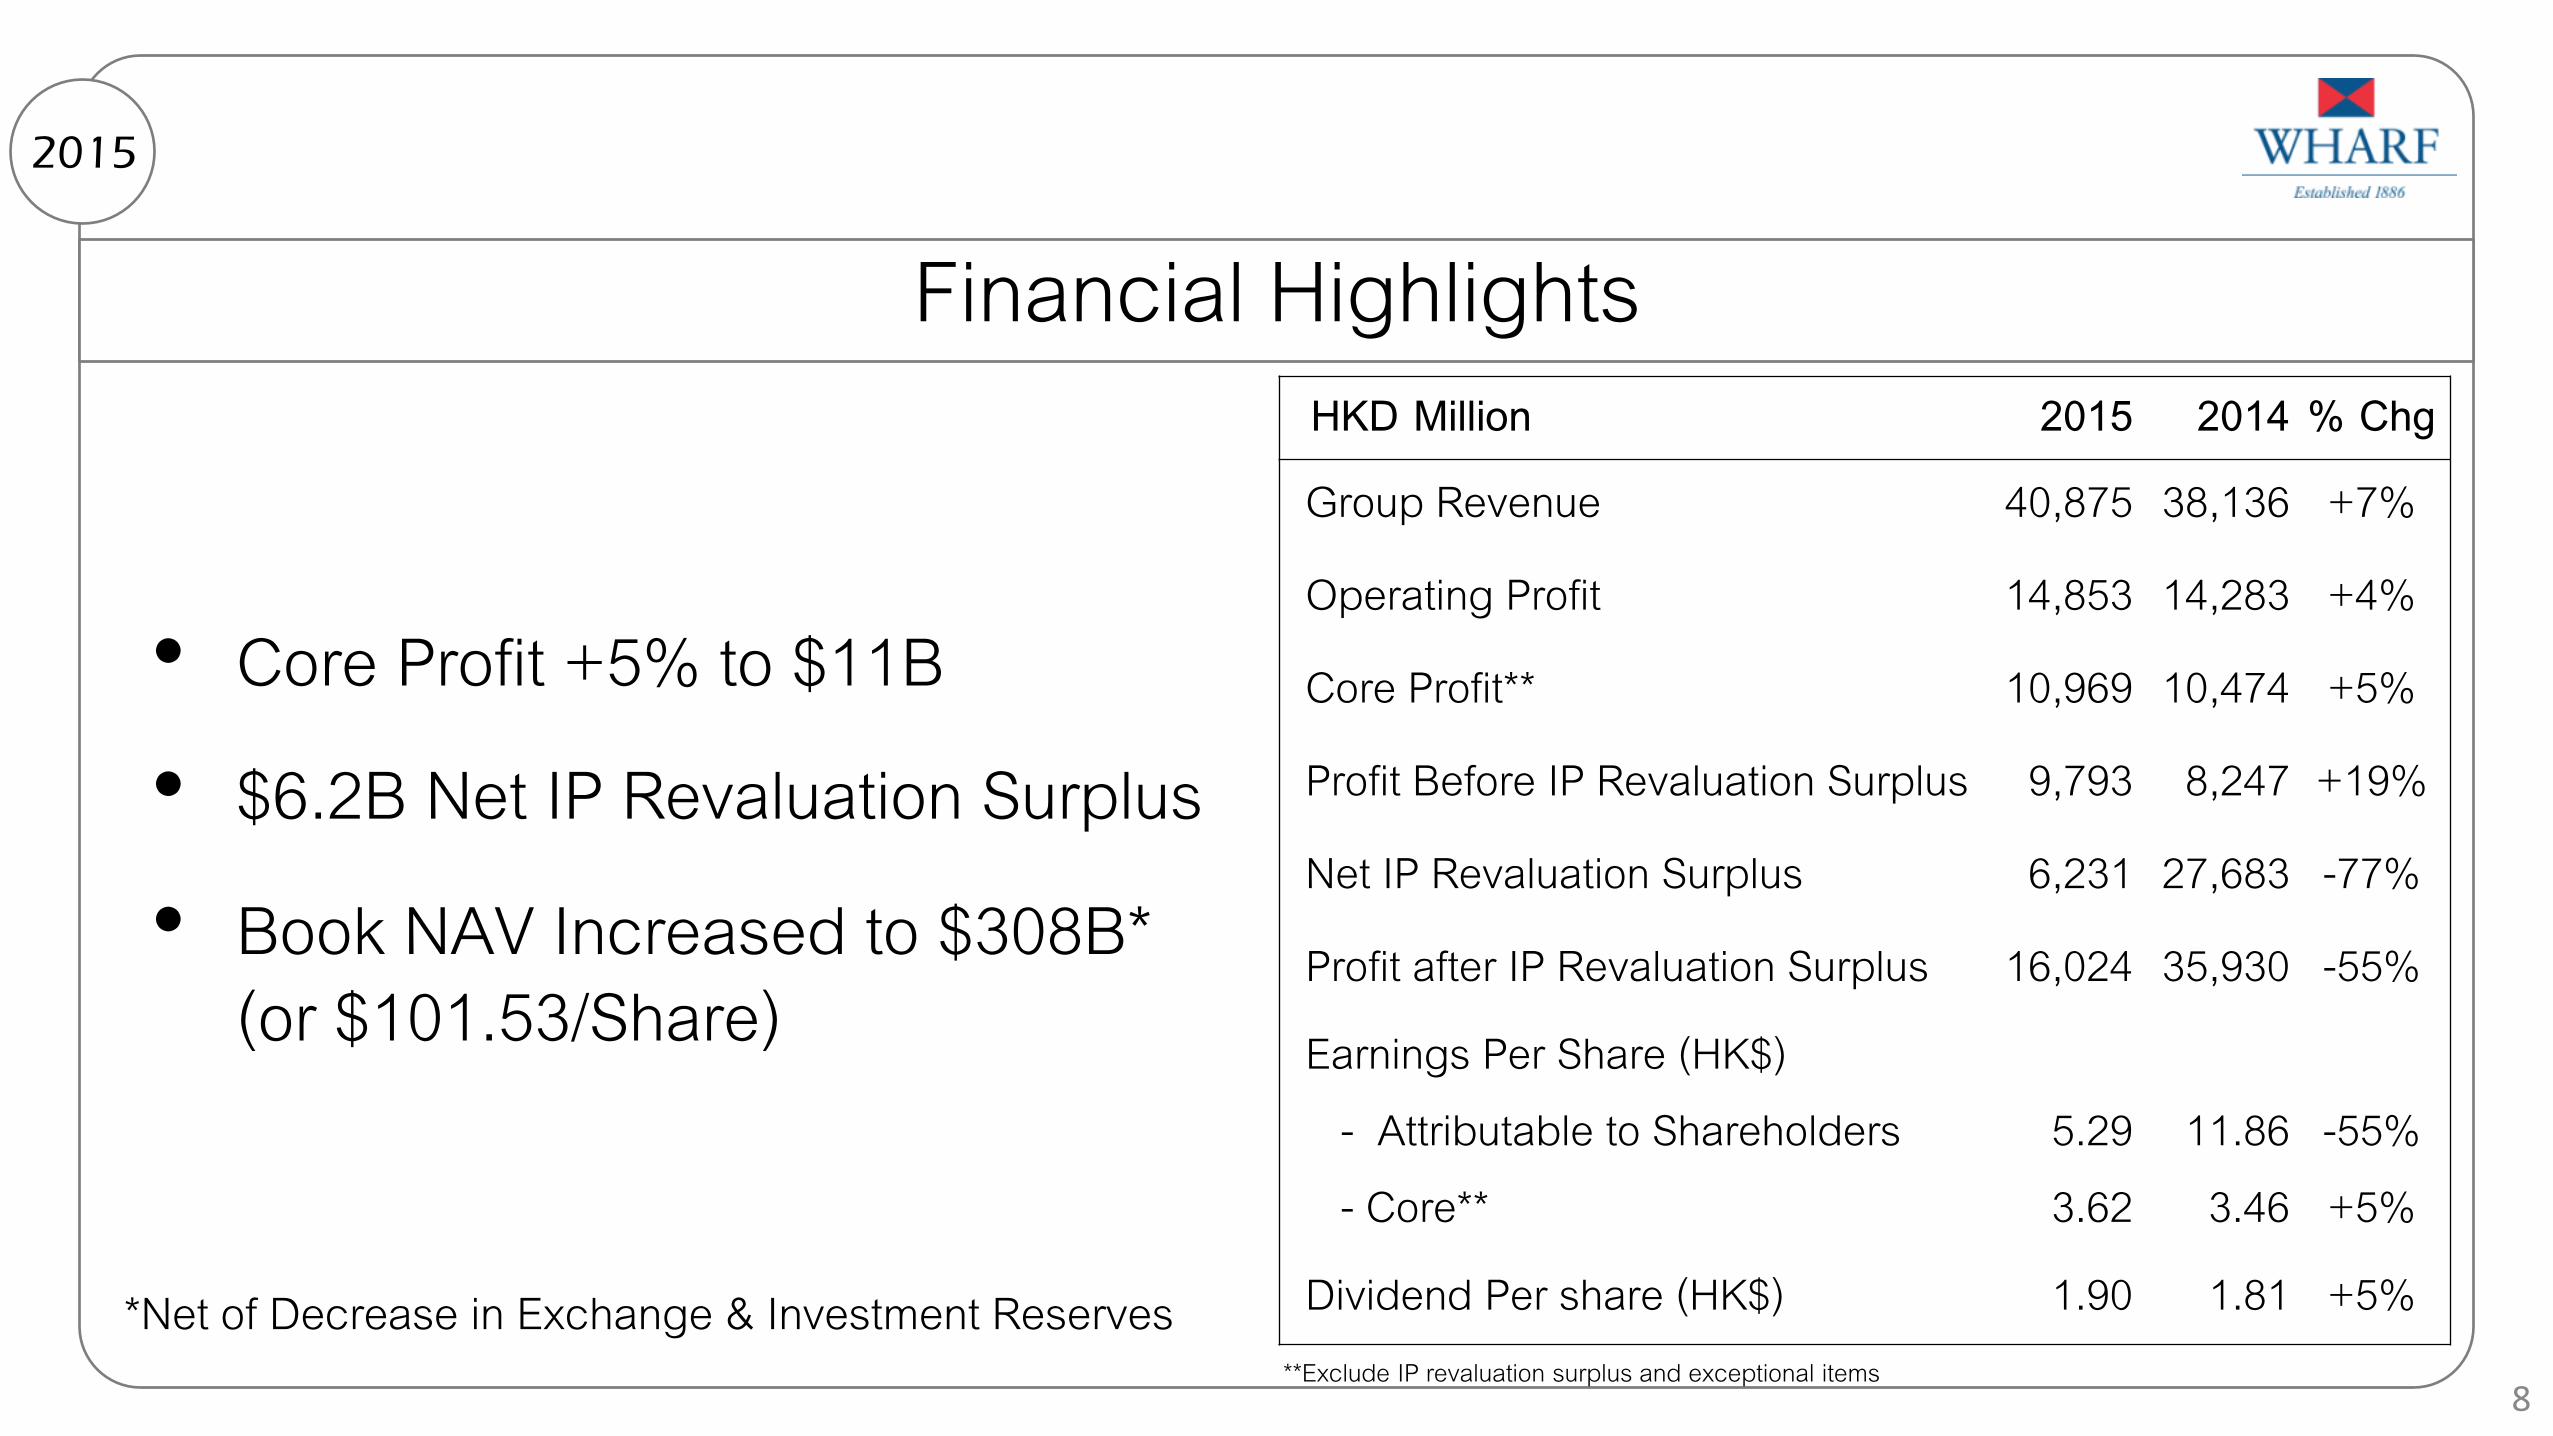
Financial Highlights 2015
**Exclude IP revaluation surplus and exceptional items
• Core Profit +5% to $11B
• $6.2B Net IP Revaluation Surplus
• Book NAV Increased to $308B* (or $101.53/Share)
HKD Million 2015 2014 % Chg Group Revenue 40,875 38,136 +7%
Operating Profit 14,853 14,283 +4%
Core Profit** 10,969 10,474 +5%
Profit Before IP Revaluation Surplus 9,793 8,247 +19%
Net IP Revaluation Surplus 6,231 27,683 -77%
Profit after IP Revaluation Surplus 16,024 35,930 -55% Earnings Per Share (HK$) - Attributable to Shareholders - Core**
5.29 3.62
11.86
3.46
-55% +5%
Dividend Per share (HK$) 1.90 1.81 +5%
8
*Net of Decrease in Exchange & Investment Reserves
Agenda
Hong Kong IP A
China IP & DP B
Others C
Next D
9

HK Retail – Prolonged Structural Weakness • Huge Market Challenges (Strong
HK Dollar); Lack of Feel-Good Factor
• Retail Sales Declined by 3.7% in 2015 Followed a Flat 2014
• Accelerated Pace of Deterioration in HK Retail Market
• Lackluster Retail Sales May Limit Retail Rental Growth Potential
A Hong Kong
10
129.3 134.6 131.6
123.6 115.0 114.0
114.5 116.3 110.7
127.1 127.4 118.9
2013 2014 2015
HK Retail Sales (HKD billion) Title
4Q
3Q
2Q
1Q
494.5 493.2 475.1 (-3.7%)

Retail Sales in a Tough Market A Hong Kong
11
33.8 35.0 30.7
2013 2014 2015
HC Retail Sales (HKD billion) Title
-12.1%
9.4 10.5
9.1
2013 2014 2015
TS Retail Sales (HKD billion) Title
-12.8%
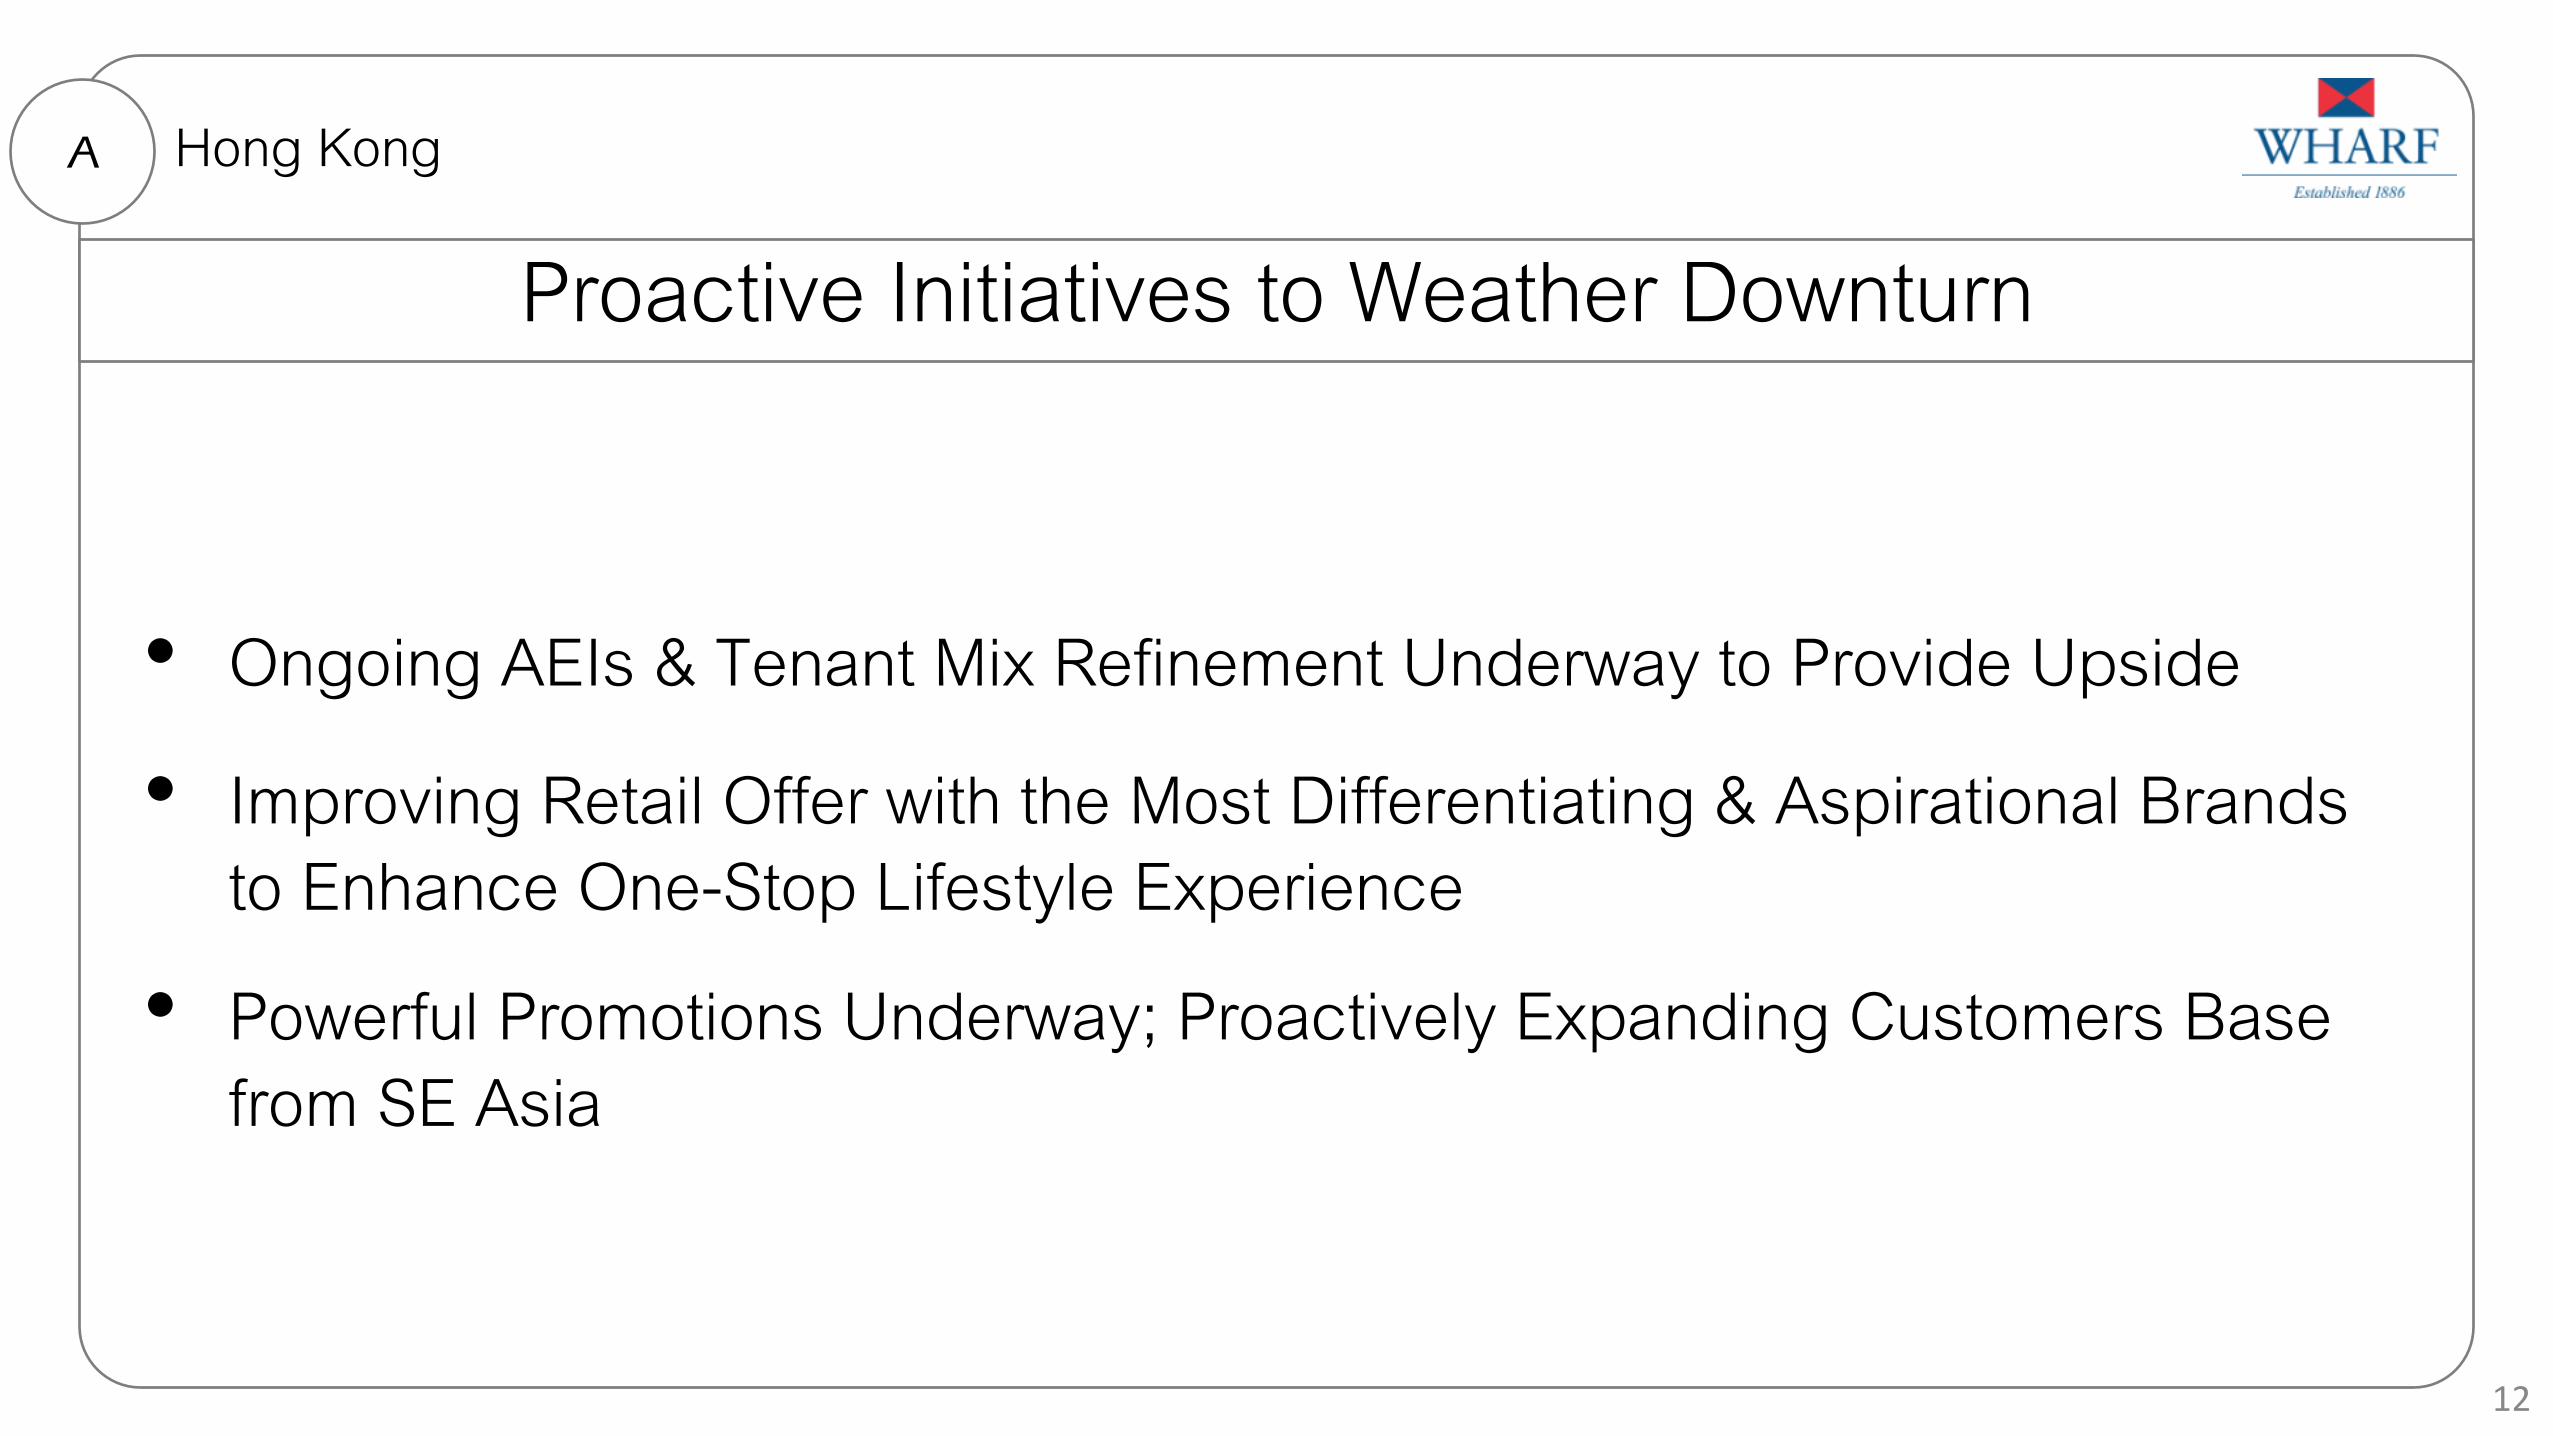
Proactive Initiatives to Weather Downturn
• Ongoing AEIs & Tenant Mix Refinement Underway to Provide Upside
• Improving Retail Offer with the Most Differentiating & Aspirational Brands to Enhance One-Stop Lifestyle Experience
• Powerful Promotions Underway; Proactively Expanding Customers Base from SE Asia
A Hong Kong
12
2016 Retail Outlook
• Retail Weakness Likely a Multi-Year Story; Heading to a Tough 2016
• HK is a Dynamic Place for International Young Brands & Start-Ups
• Continue to Provide Productive Environment for Our Tenants to Trade, to Have Effective Market Presence & to Meet Shoppers
A Hong Kong
13

Proven Retail Management Driving Performance
• Stable Performance in a Tough Market
• Prime & Quality Malls Driving Strong Retailers’ Demand
• Best-Positioned Destination Retail; Steady Occupancy Cost
• Outstanding Tenant Mix; Creation of New Dining Experiences
A
6%
23%
69%
2%
Retail Revenue By Segment $8.7B (+6%)
PH
Others
TS
HC
Hong Kong
Retail Revenue Growth HC $5,949M +5% TS $2,017M +7% PH $529M +3%
14
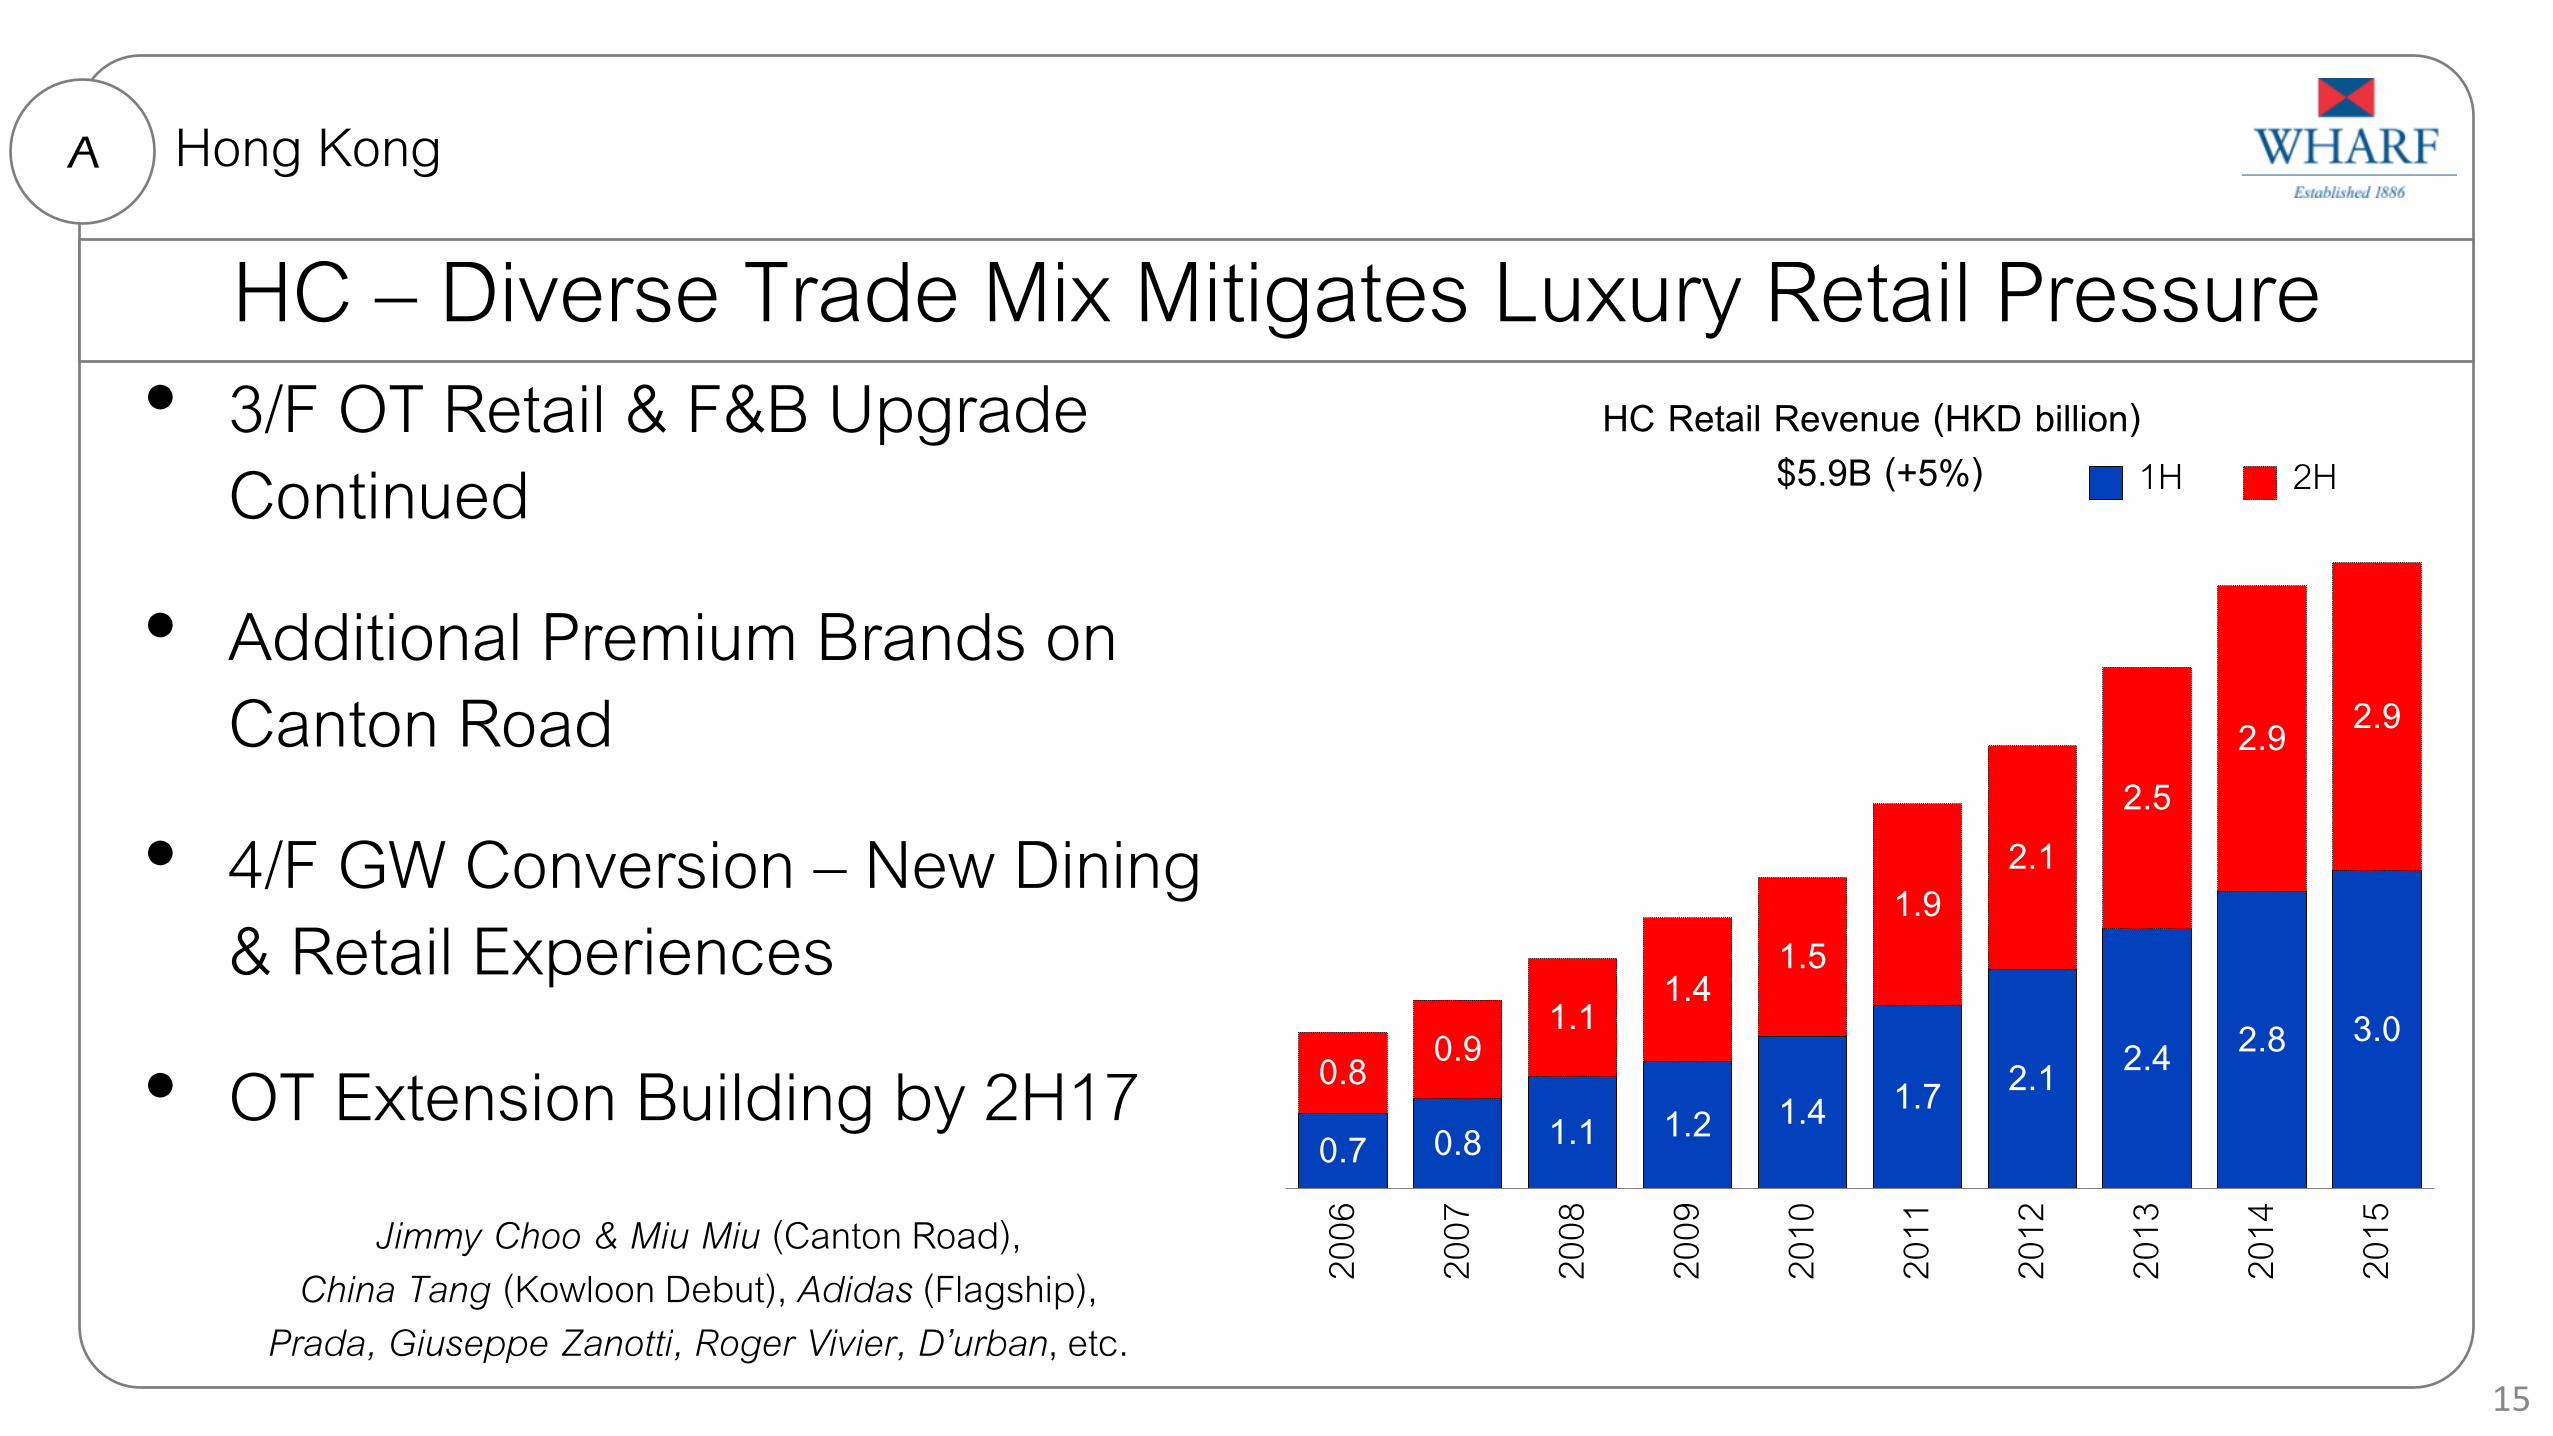
HC – Diverse Trade Mix Mitigates Luxury Retail Pressure • 3/F OT Retail & F&B Upgrade
Continued
• Additional Premium Brands on Canton Road
• 4/F GW Conversion – New Dining & Retail Experiences
• OT Extension Building by 2H17
Jimmy Choo & Miu Miu (Canton Road), China Tang (Kowloon Debut), Adidas (Flagship),
Prada, Giuseppe Zanotti, Roger Vivier, D’urban, etc.
A
0.7 0.8 1.1 1.2 1.4 1.7 2.1 2.4 2.8 3.0 0.8 0.9
1.1 1.4 1.5
1.9 2.1
2.5 2.9 2.9
2006
2007
2008
2009
2010
2011
2012
2013
2014
2015
HC Retail Revenue (HKD billion) 1H 2H$5.9B (+5%)
Hong Kong
15
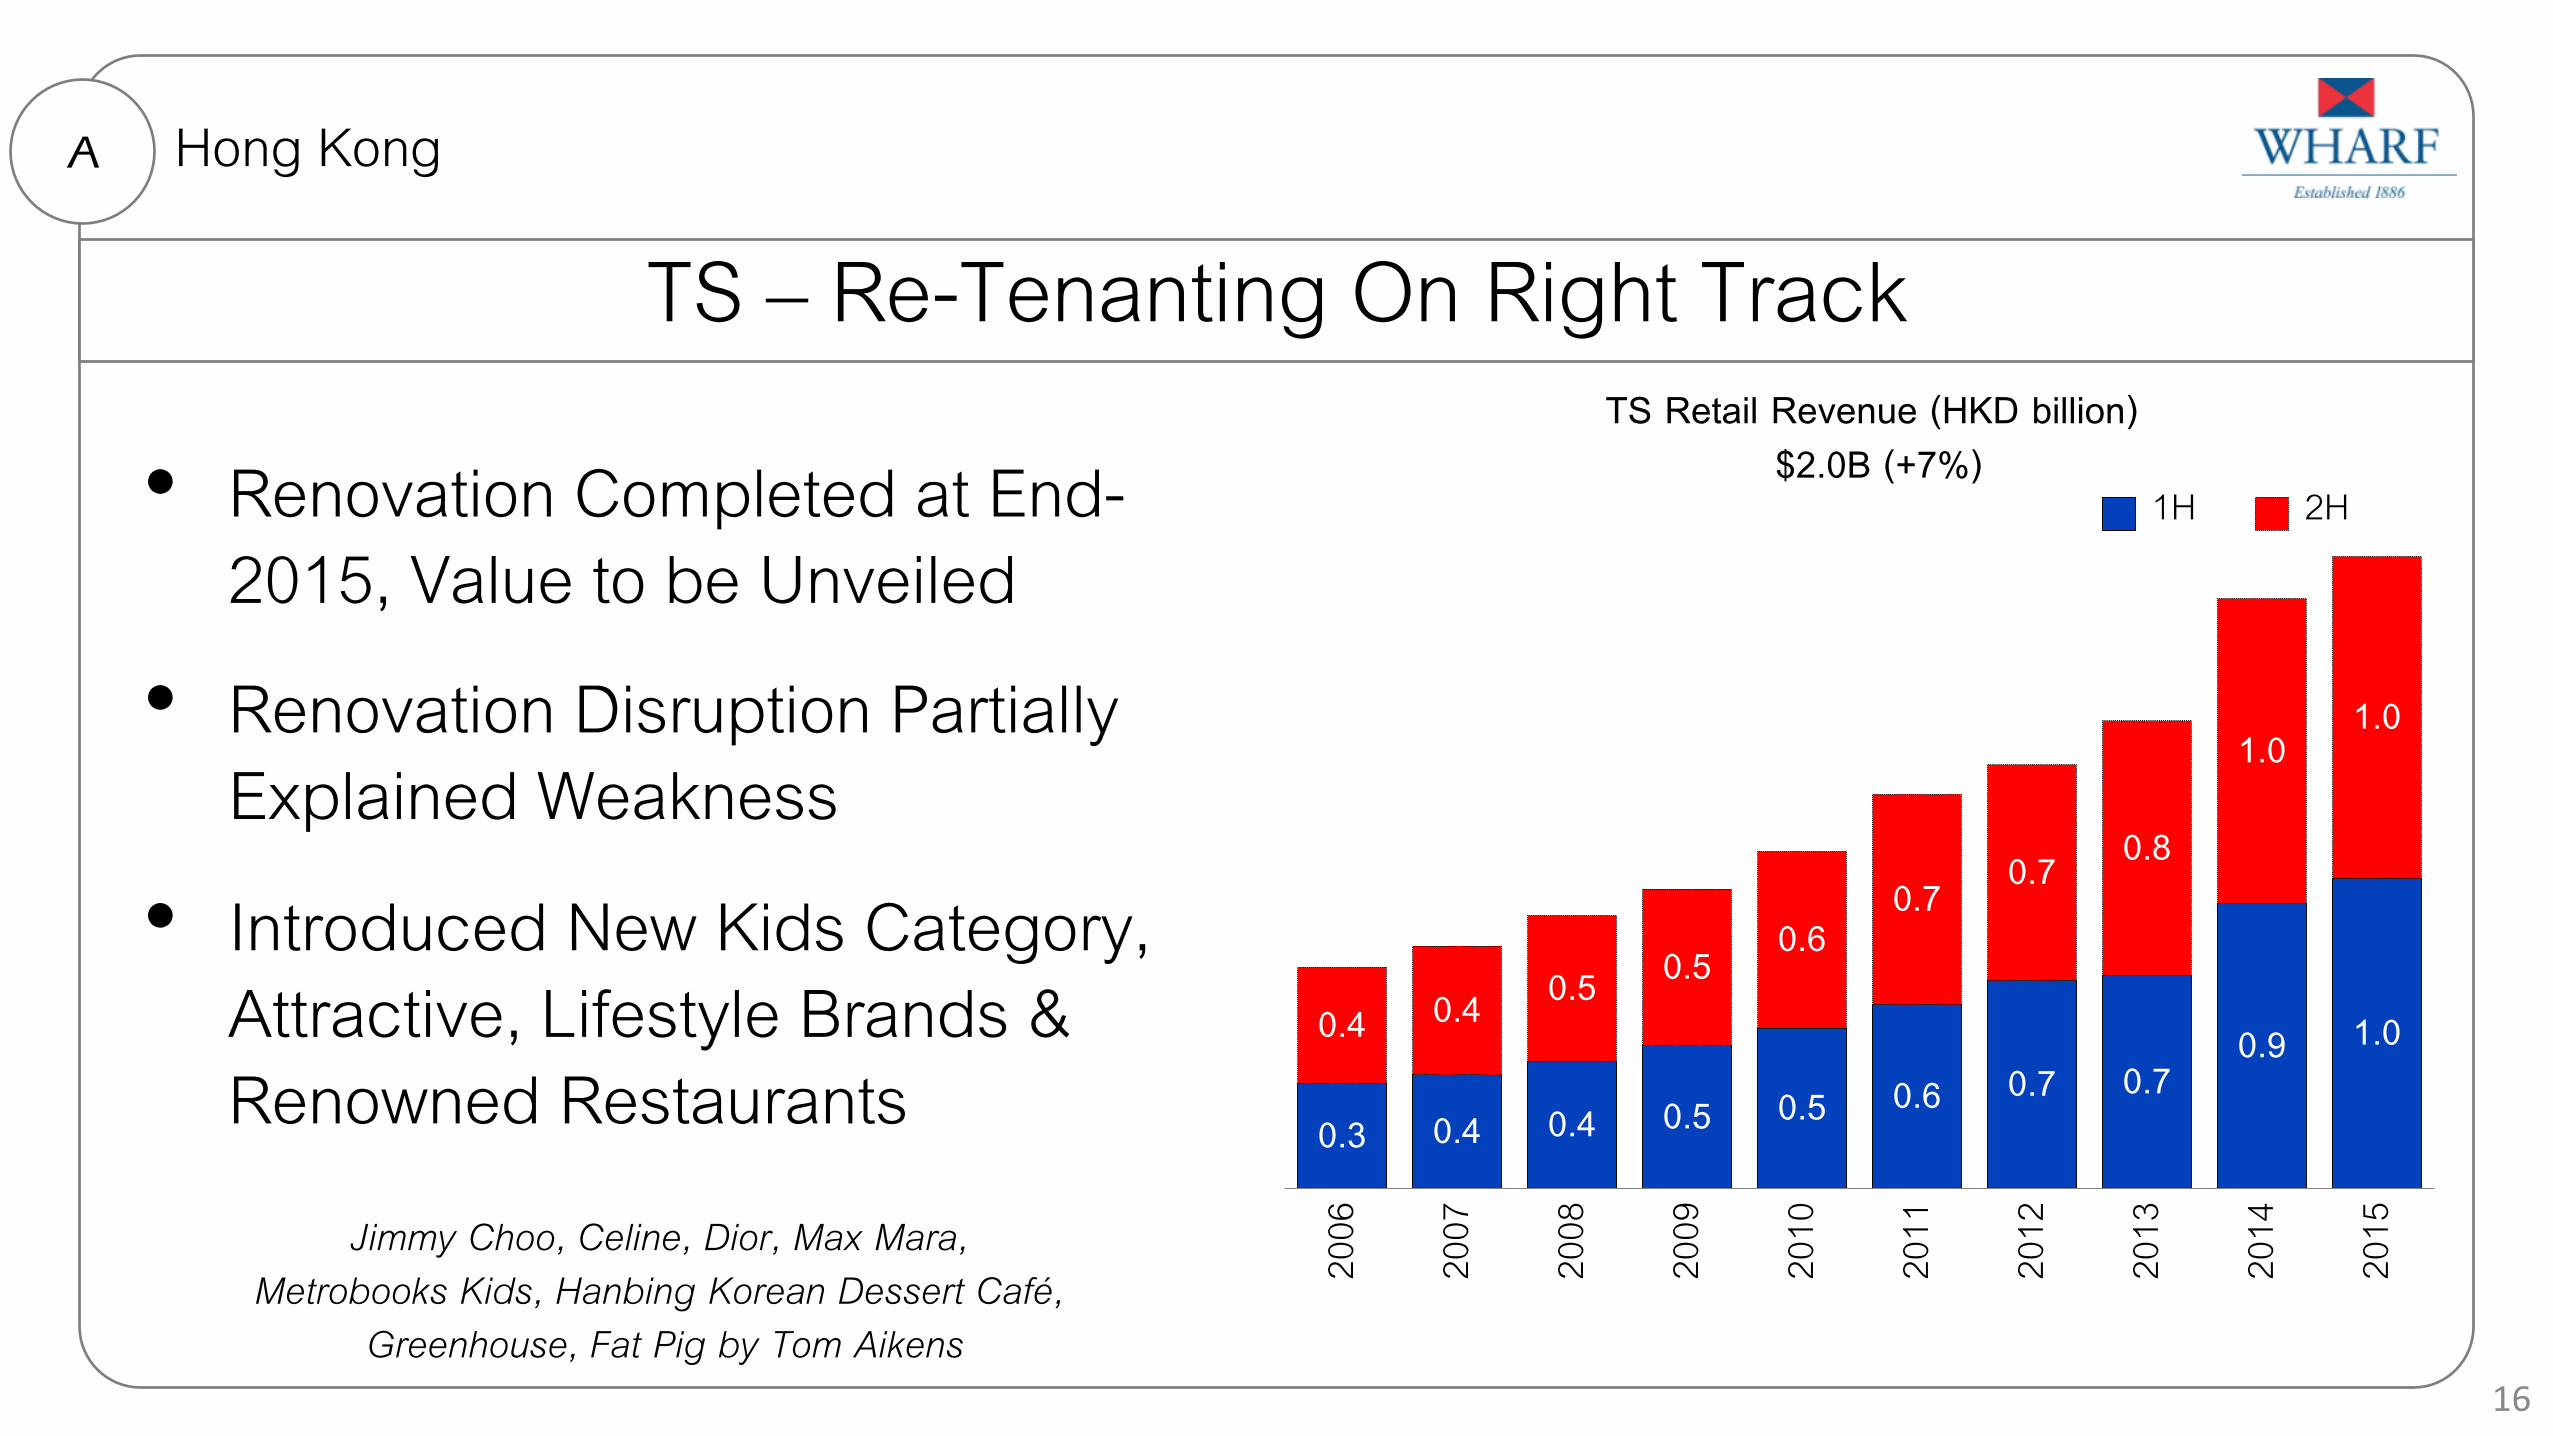
TS – Re-Tenanting On Right Track
• Renovation Completed at End-2015, Value to be Unveiled
• Renovation Disruption Partially Explained Weakness
• Introduced New Kids Category, Attractive, Lifestyle Brands & Renowned Restaurants
A
0.3 0.4 0.4 0.5 0.5 0.6 0.7 0.7 0.9 1.0 0.4 0.4 0.5 0.5 0.6
0.7 0.7 0.8
1.0 1.0
2006
2007
2008
2009
2010
2011
2012
2013
2014
2015
TS Retail Revenue (HKD billion)
1H 2H$2.0B (+7%)
Hong Kong
16
Jimmy Choo, Celine, Dior, Max Mara, Metrobooks Kids, Hanbing Korean Dessert Café,
Greenhouse, Fat Pig by Tom Aikens
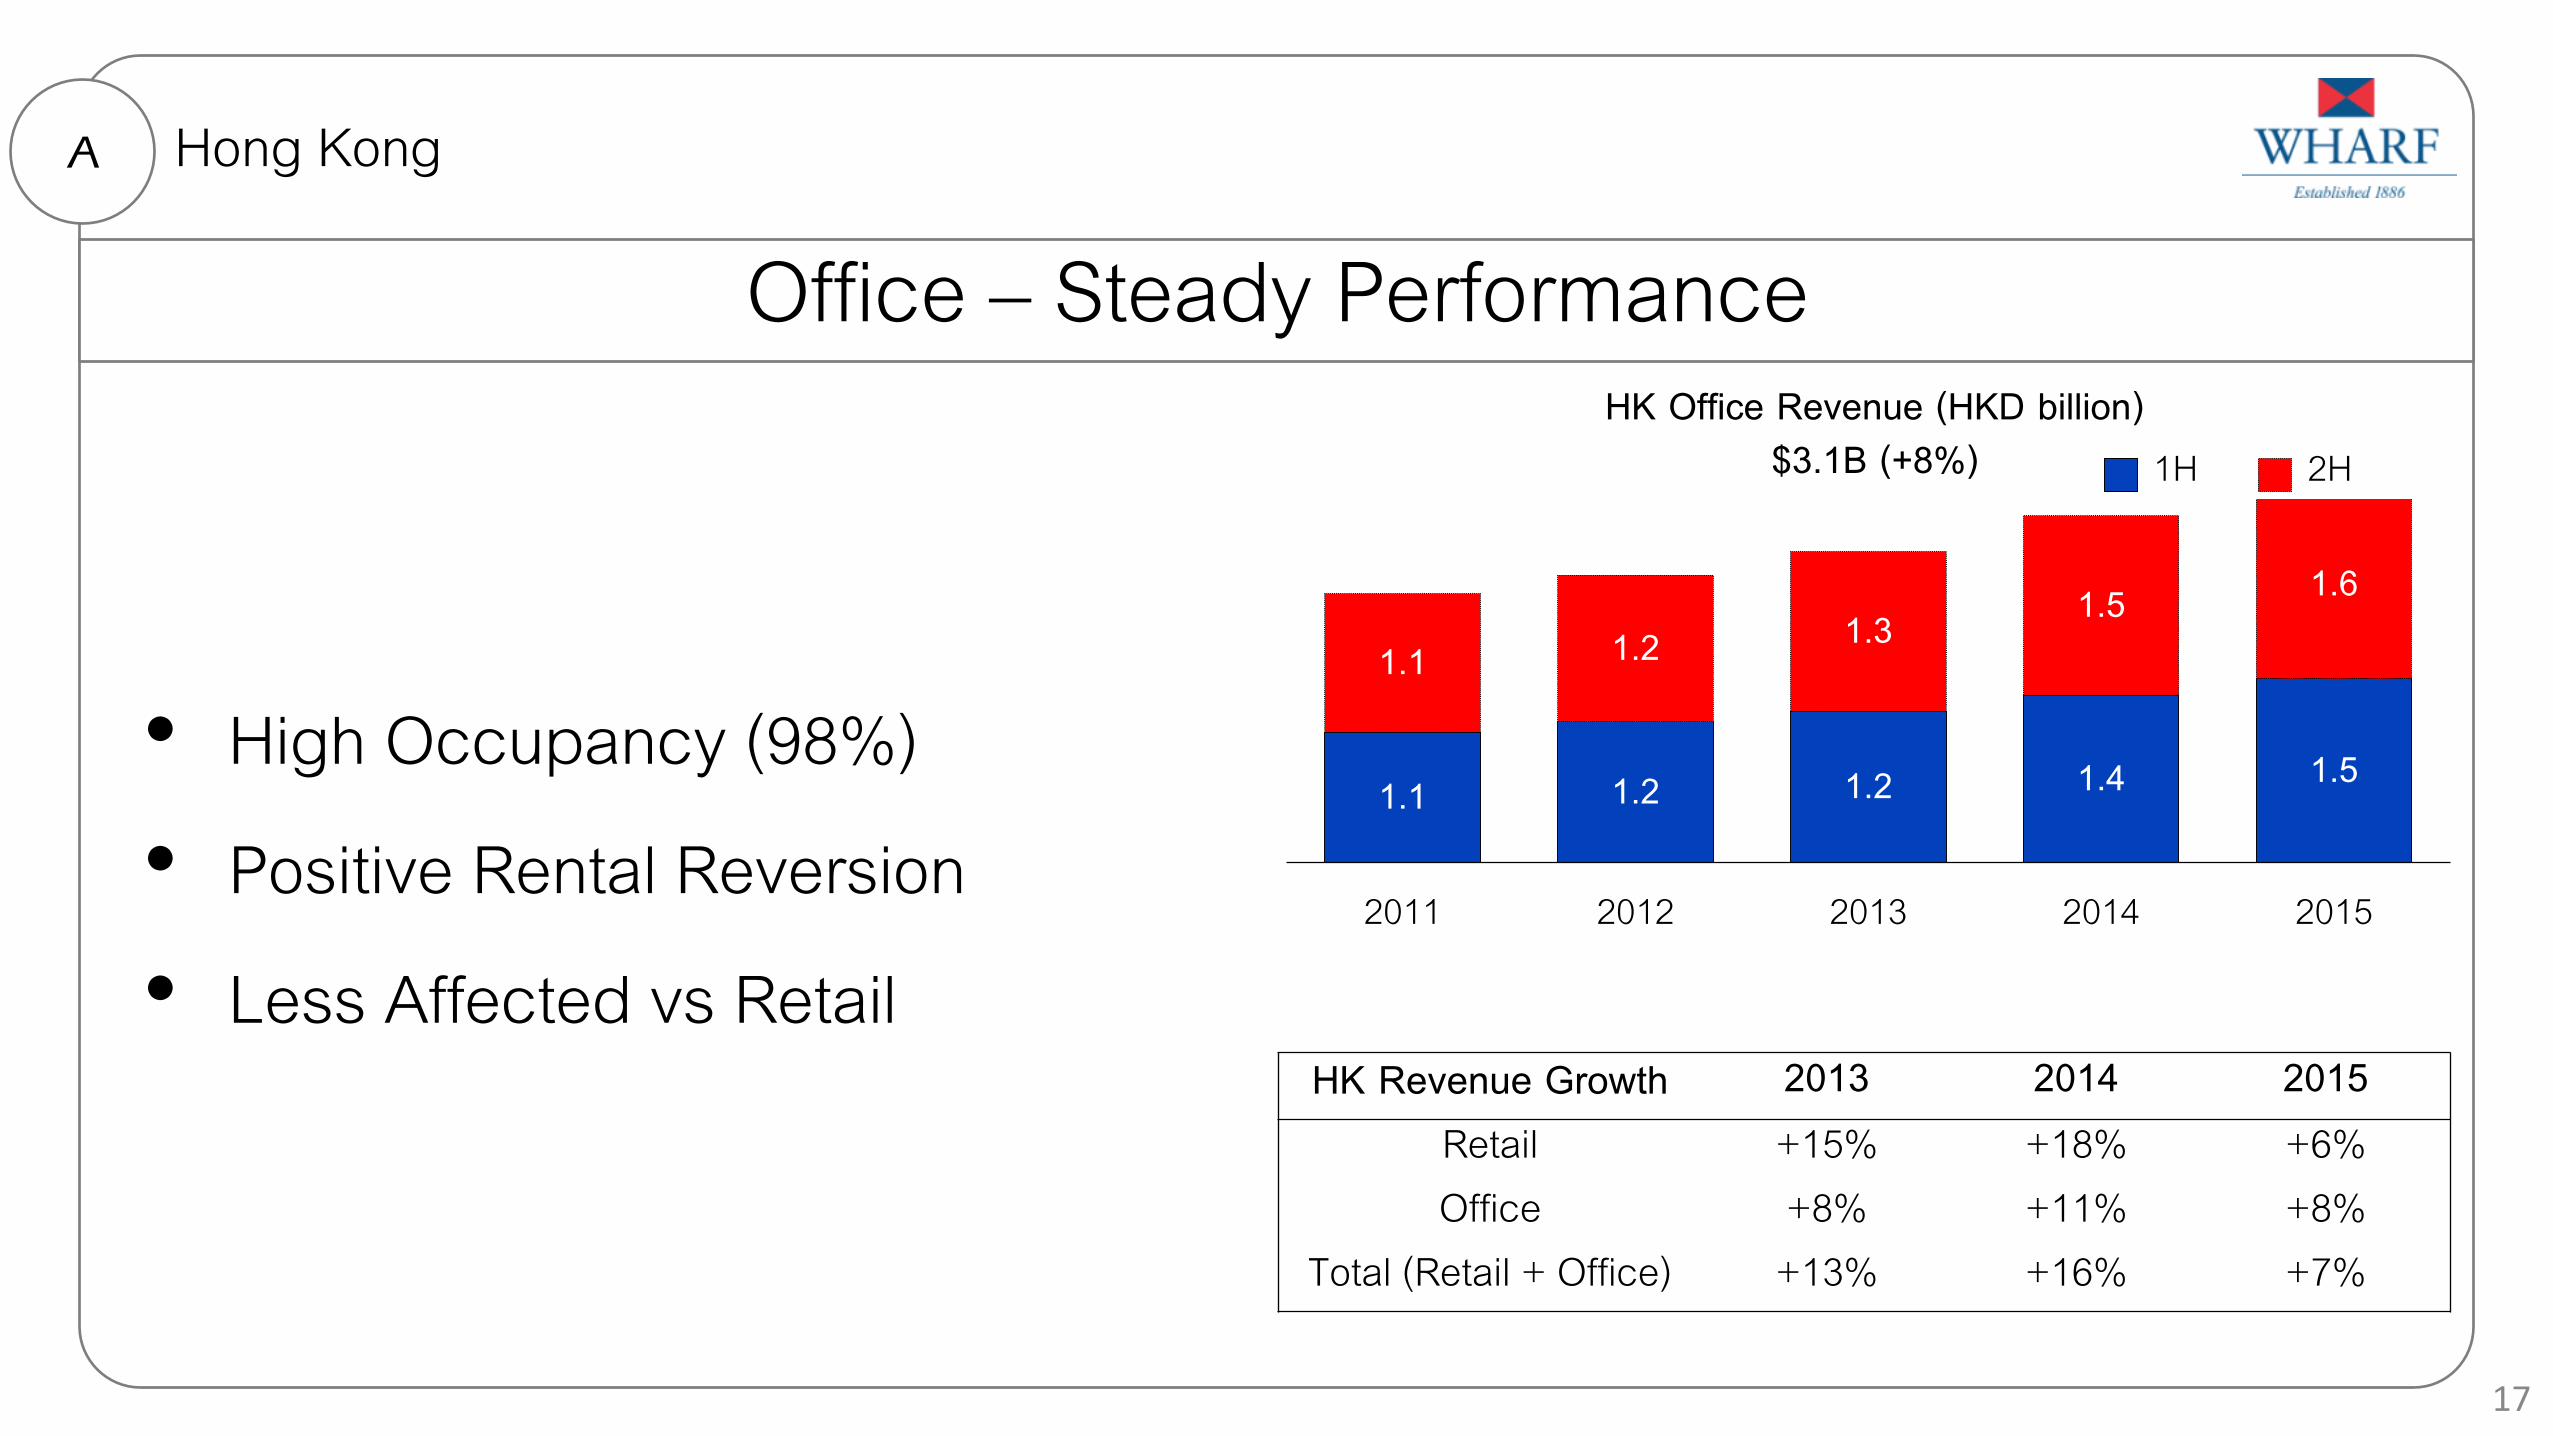
Office – Steady Performance
• High Occupancy (98%)
• Positive Rental Reversion
• Less Affected vs Retail
A
1.1 1.2 1.2 1.4 1.5
1.1 1.2 1.3 1.5 1.6
2011 2012 2013 2014 2015
HK Office Revenue (HKD billion) 1H 2H$3.1B (+8%)
Hong Kong
17
HK Revenue Growth 2013 2014 2015 Retail +15% +18% +6% Office +8% +11% +8%
Total (Retail + Office) +13% +16% +7%

Agenda
Hong Kong IP A
China IP & DP B
Others C
Next D
18

China IP – Continuing to Add Growth Impetus
• Starting to Bear Fruit
• China Retail – Another Pillar and a New Growth Engine
• China Retail Performance Offsets Sector Headwinds in HK
B China
0.2 0.2 0.3 0.3 0.2 0.3 0.5 0.5 0.8
1.1
0.1 0.2 0.2 0.3 0.3
0.5 0.5
0.8
1.2
1.2
2006
2007
2008
2009
2010
2011
2012
2013
2014
2015
China IP Revenue (HKD billion) 1H 2H$2.3B (+16%)
19
* In Jul 2010, Chongqing TS mall was closed for renovation and hence impacted the rental revenue during the period
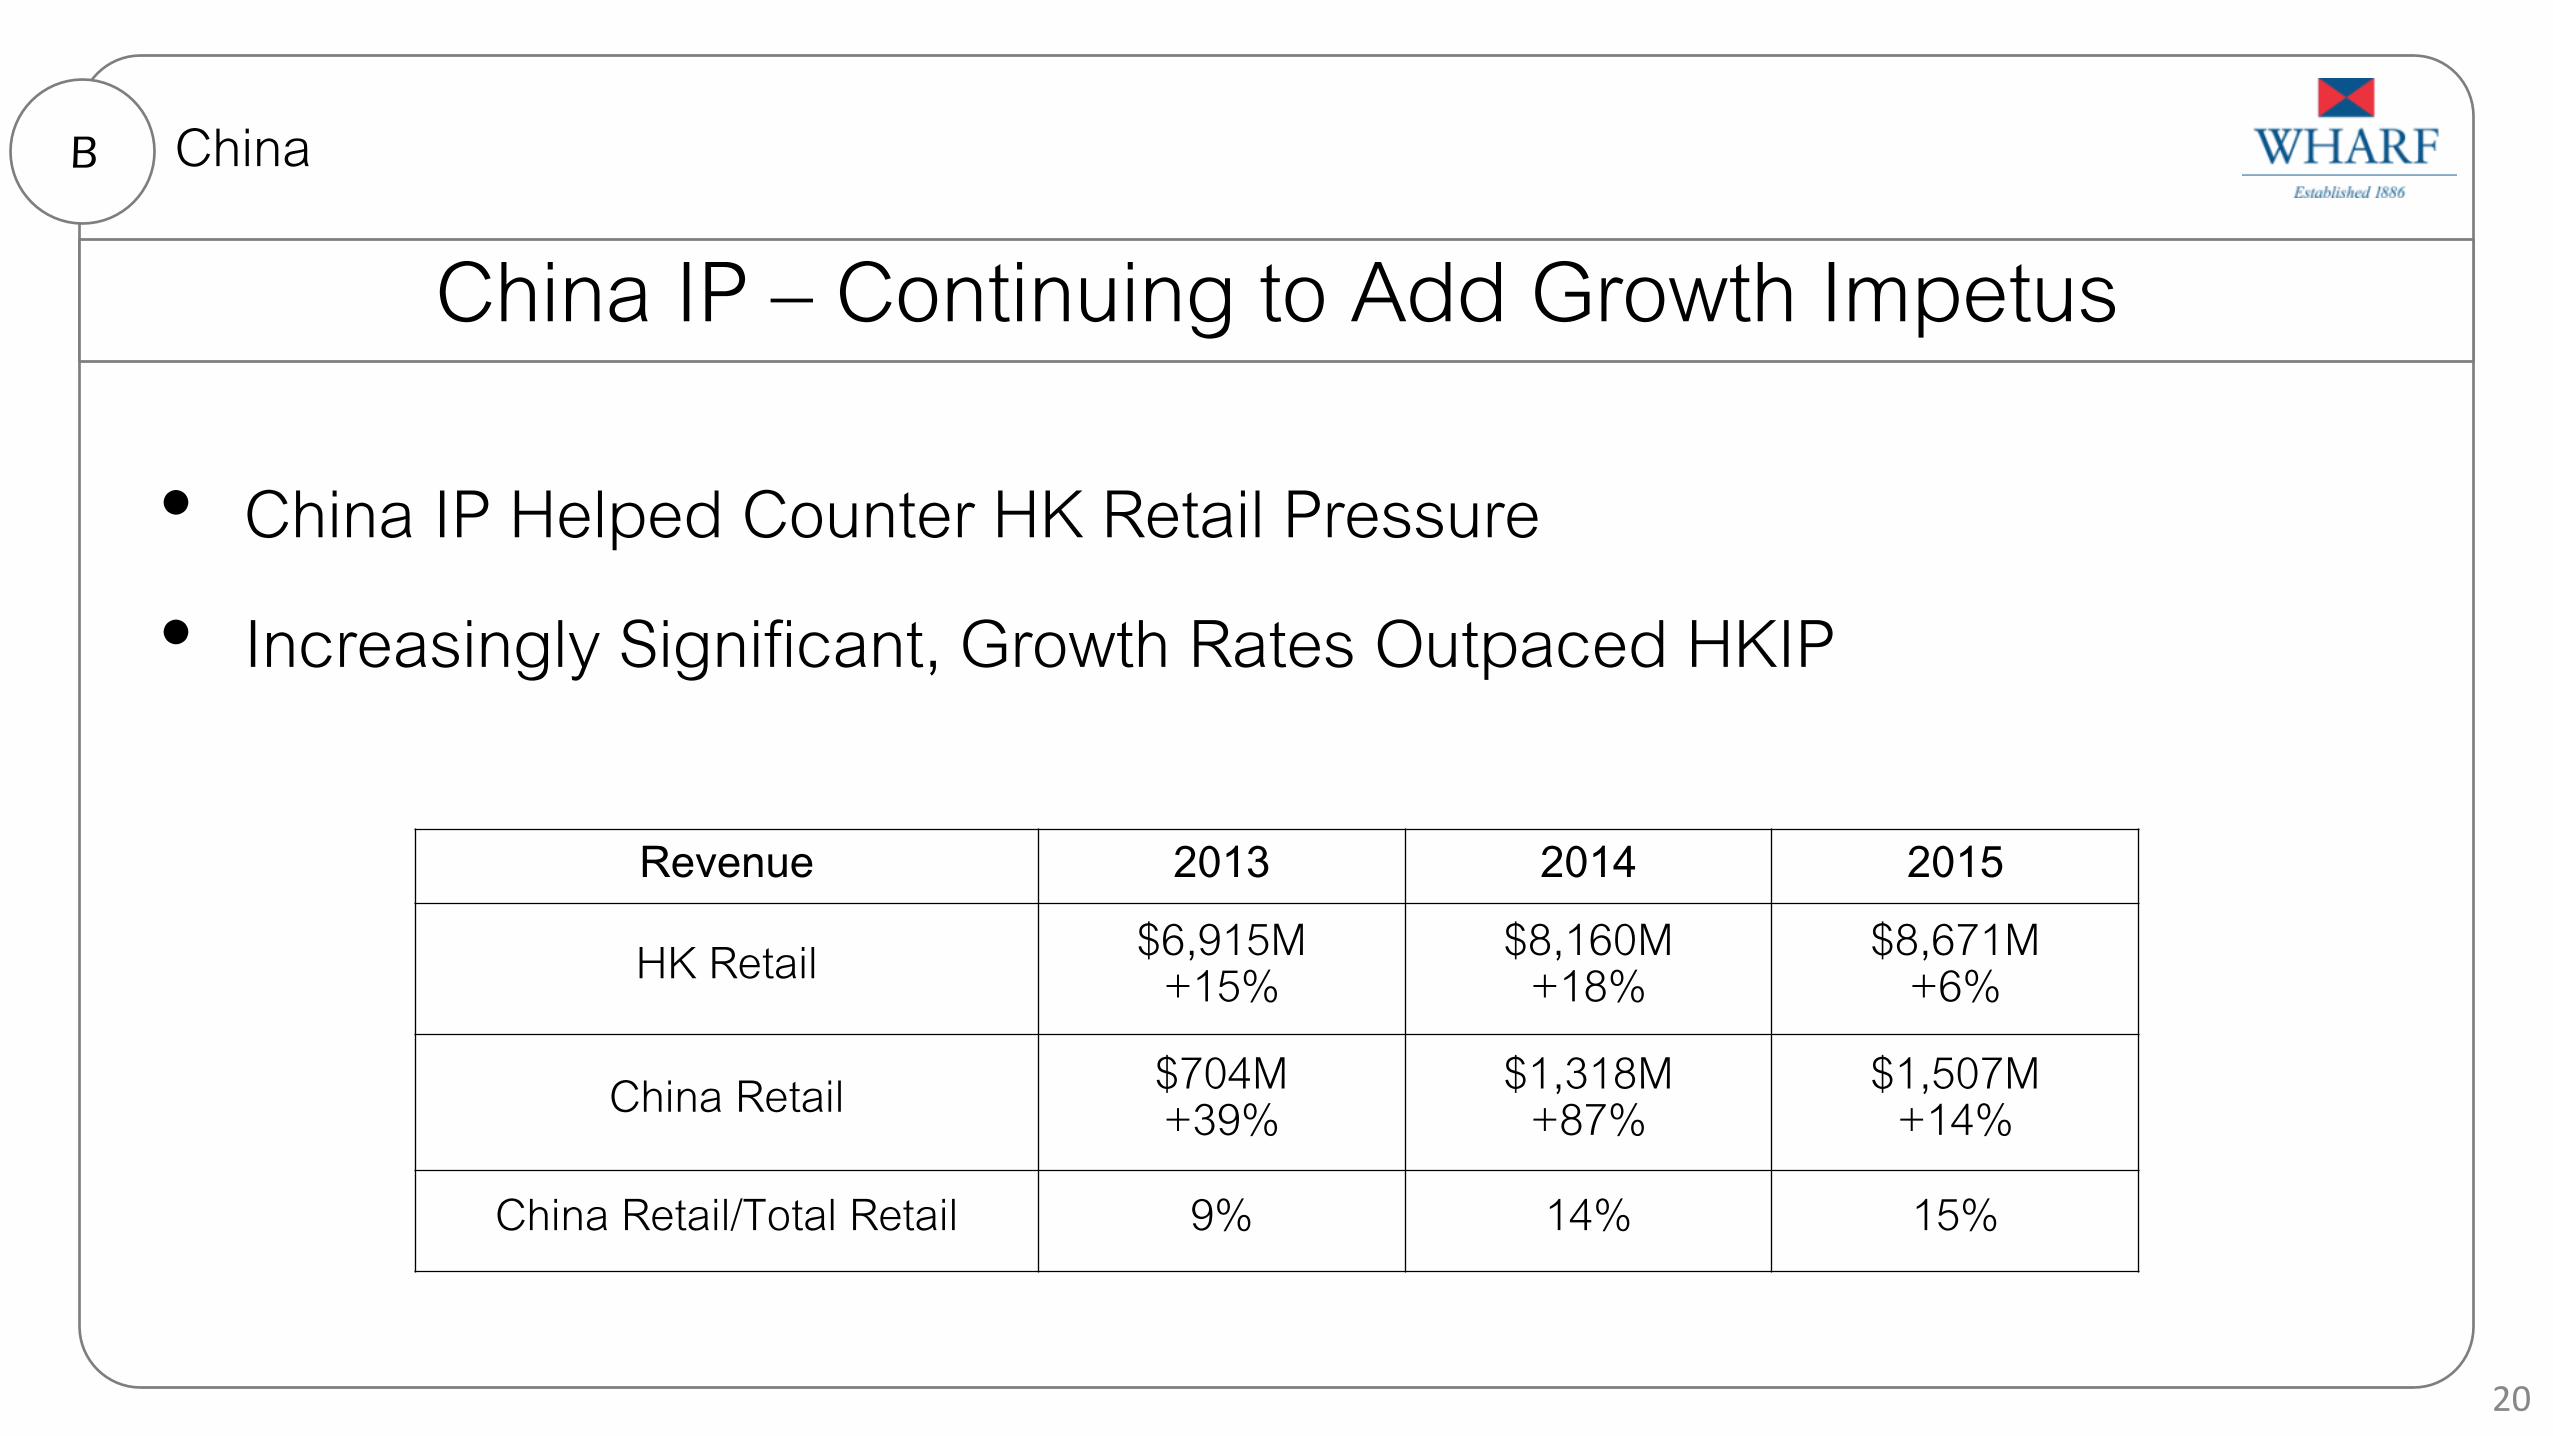
China IP – Continuing to Add Growth Impetus
B China
20
Revenue 2013 2014 2015
HK Retail $6,915M +15%
$8,160M +18%
$8,671M +6%
China Retail $704M +39%
$1,318M +87%
$1,507M +14%
China Retail/Total Retail 9% 14% 15%
• China IP Helped Counter HK Retail Pressure
• Increasingly Significant, Growth Rates Outpaced HKIP
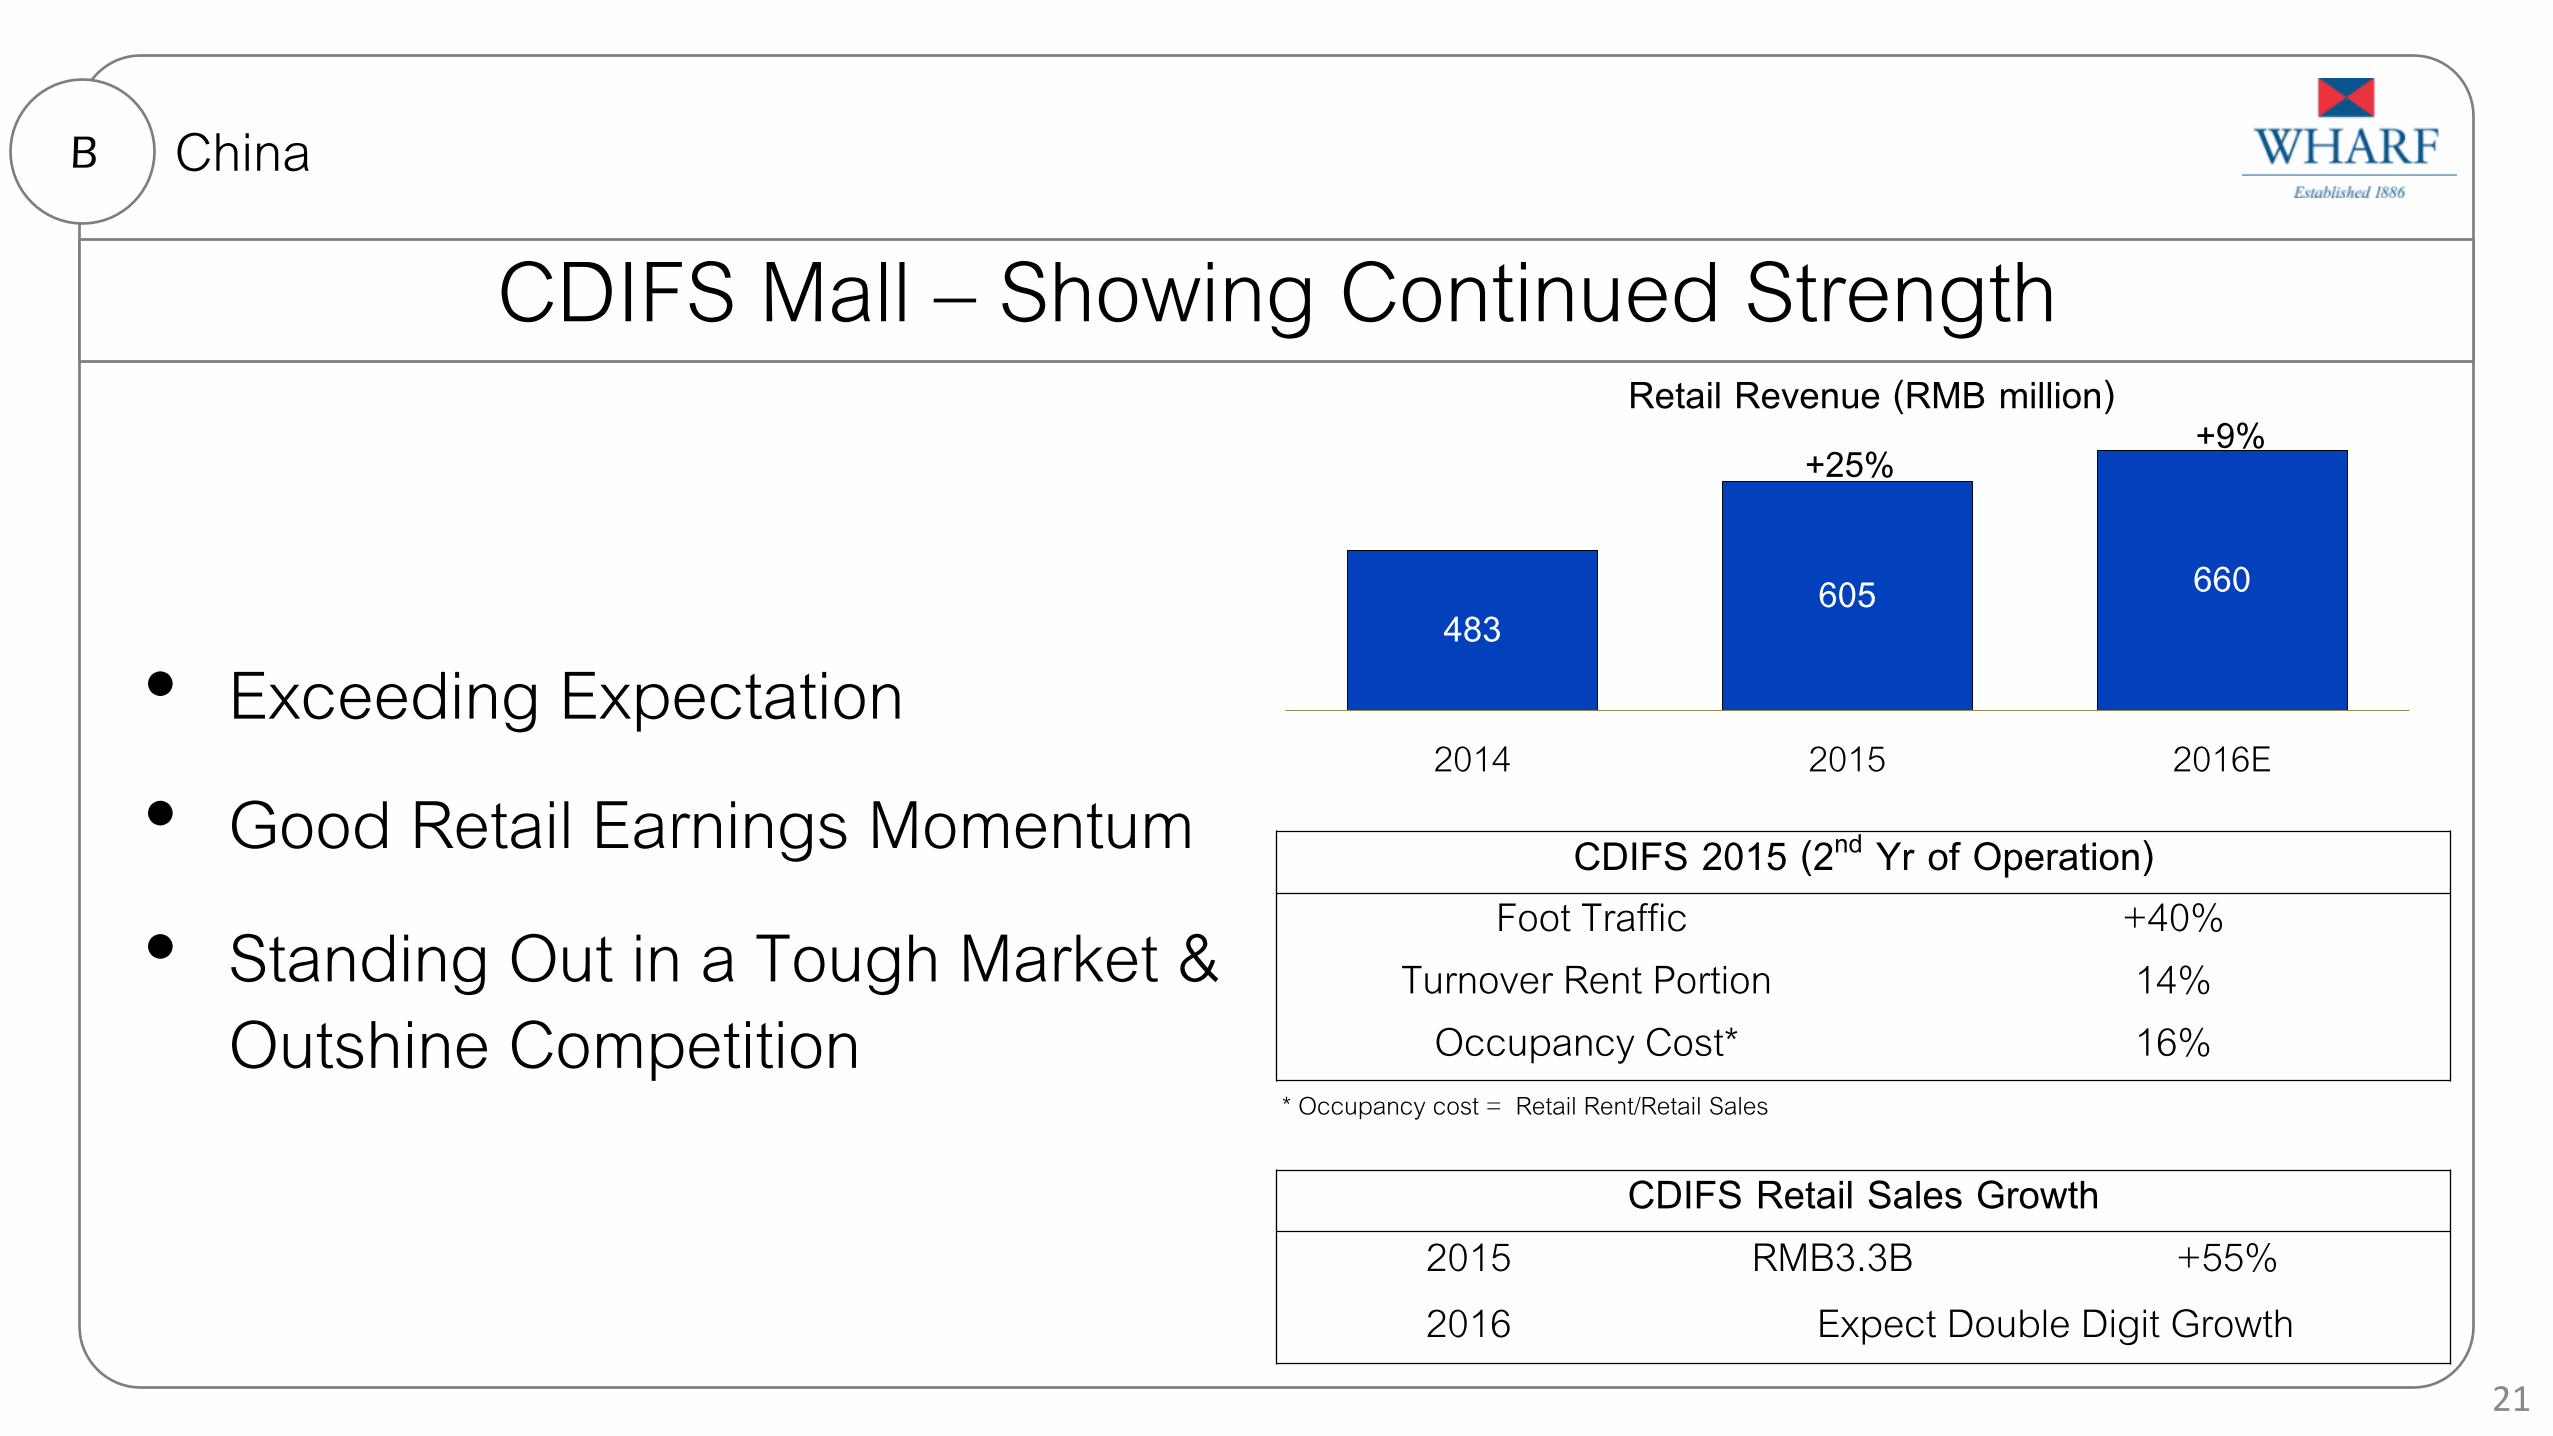
CDIFS Mall – Showing Continued Strength
• Exceeding Expectation
• Good Retail Earnings Momentum
• Standing Out in a Tough Market & Outshine Competition
B China
483 605 660
2014 2015 2016E
Retail Revenue (RMB million)
21
CDIFS 2015 (2nd Yr of Operation) Foot Traffic +40%
Turnover Rent Portion 14% Occupancy Cost* 16%
CDIFS Retail Sales Growth 2015 RMB3.3B +55% 2016 Expect Double Digit Growth
* Occupancy cost = Retail Rent/Retail Sales
+25% +9%

CDIFS Office – Leasing On Track
• Leasing Status In Line with Expectation
• Over 90,000 s.m Leased, Including ~50,000 s.m in 2015
• Rental Rates Achieved among the Highest in the City
• Expected Commitment to Reach Over 50% by End-2016
B China
22
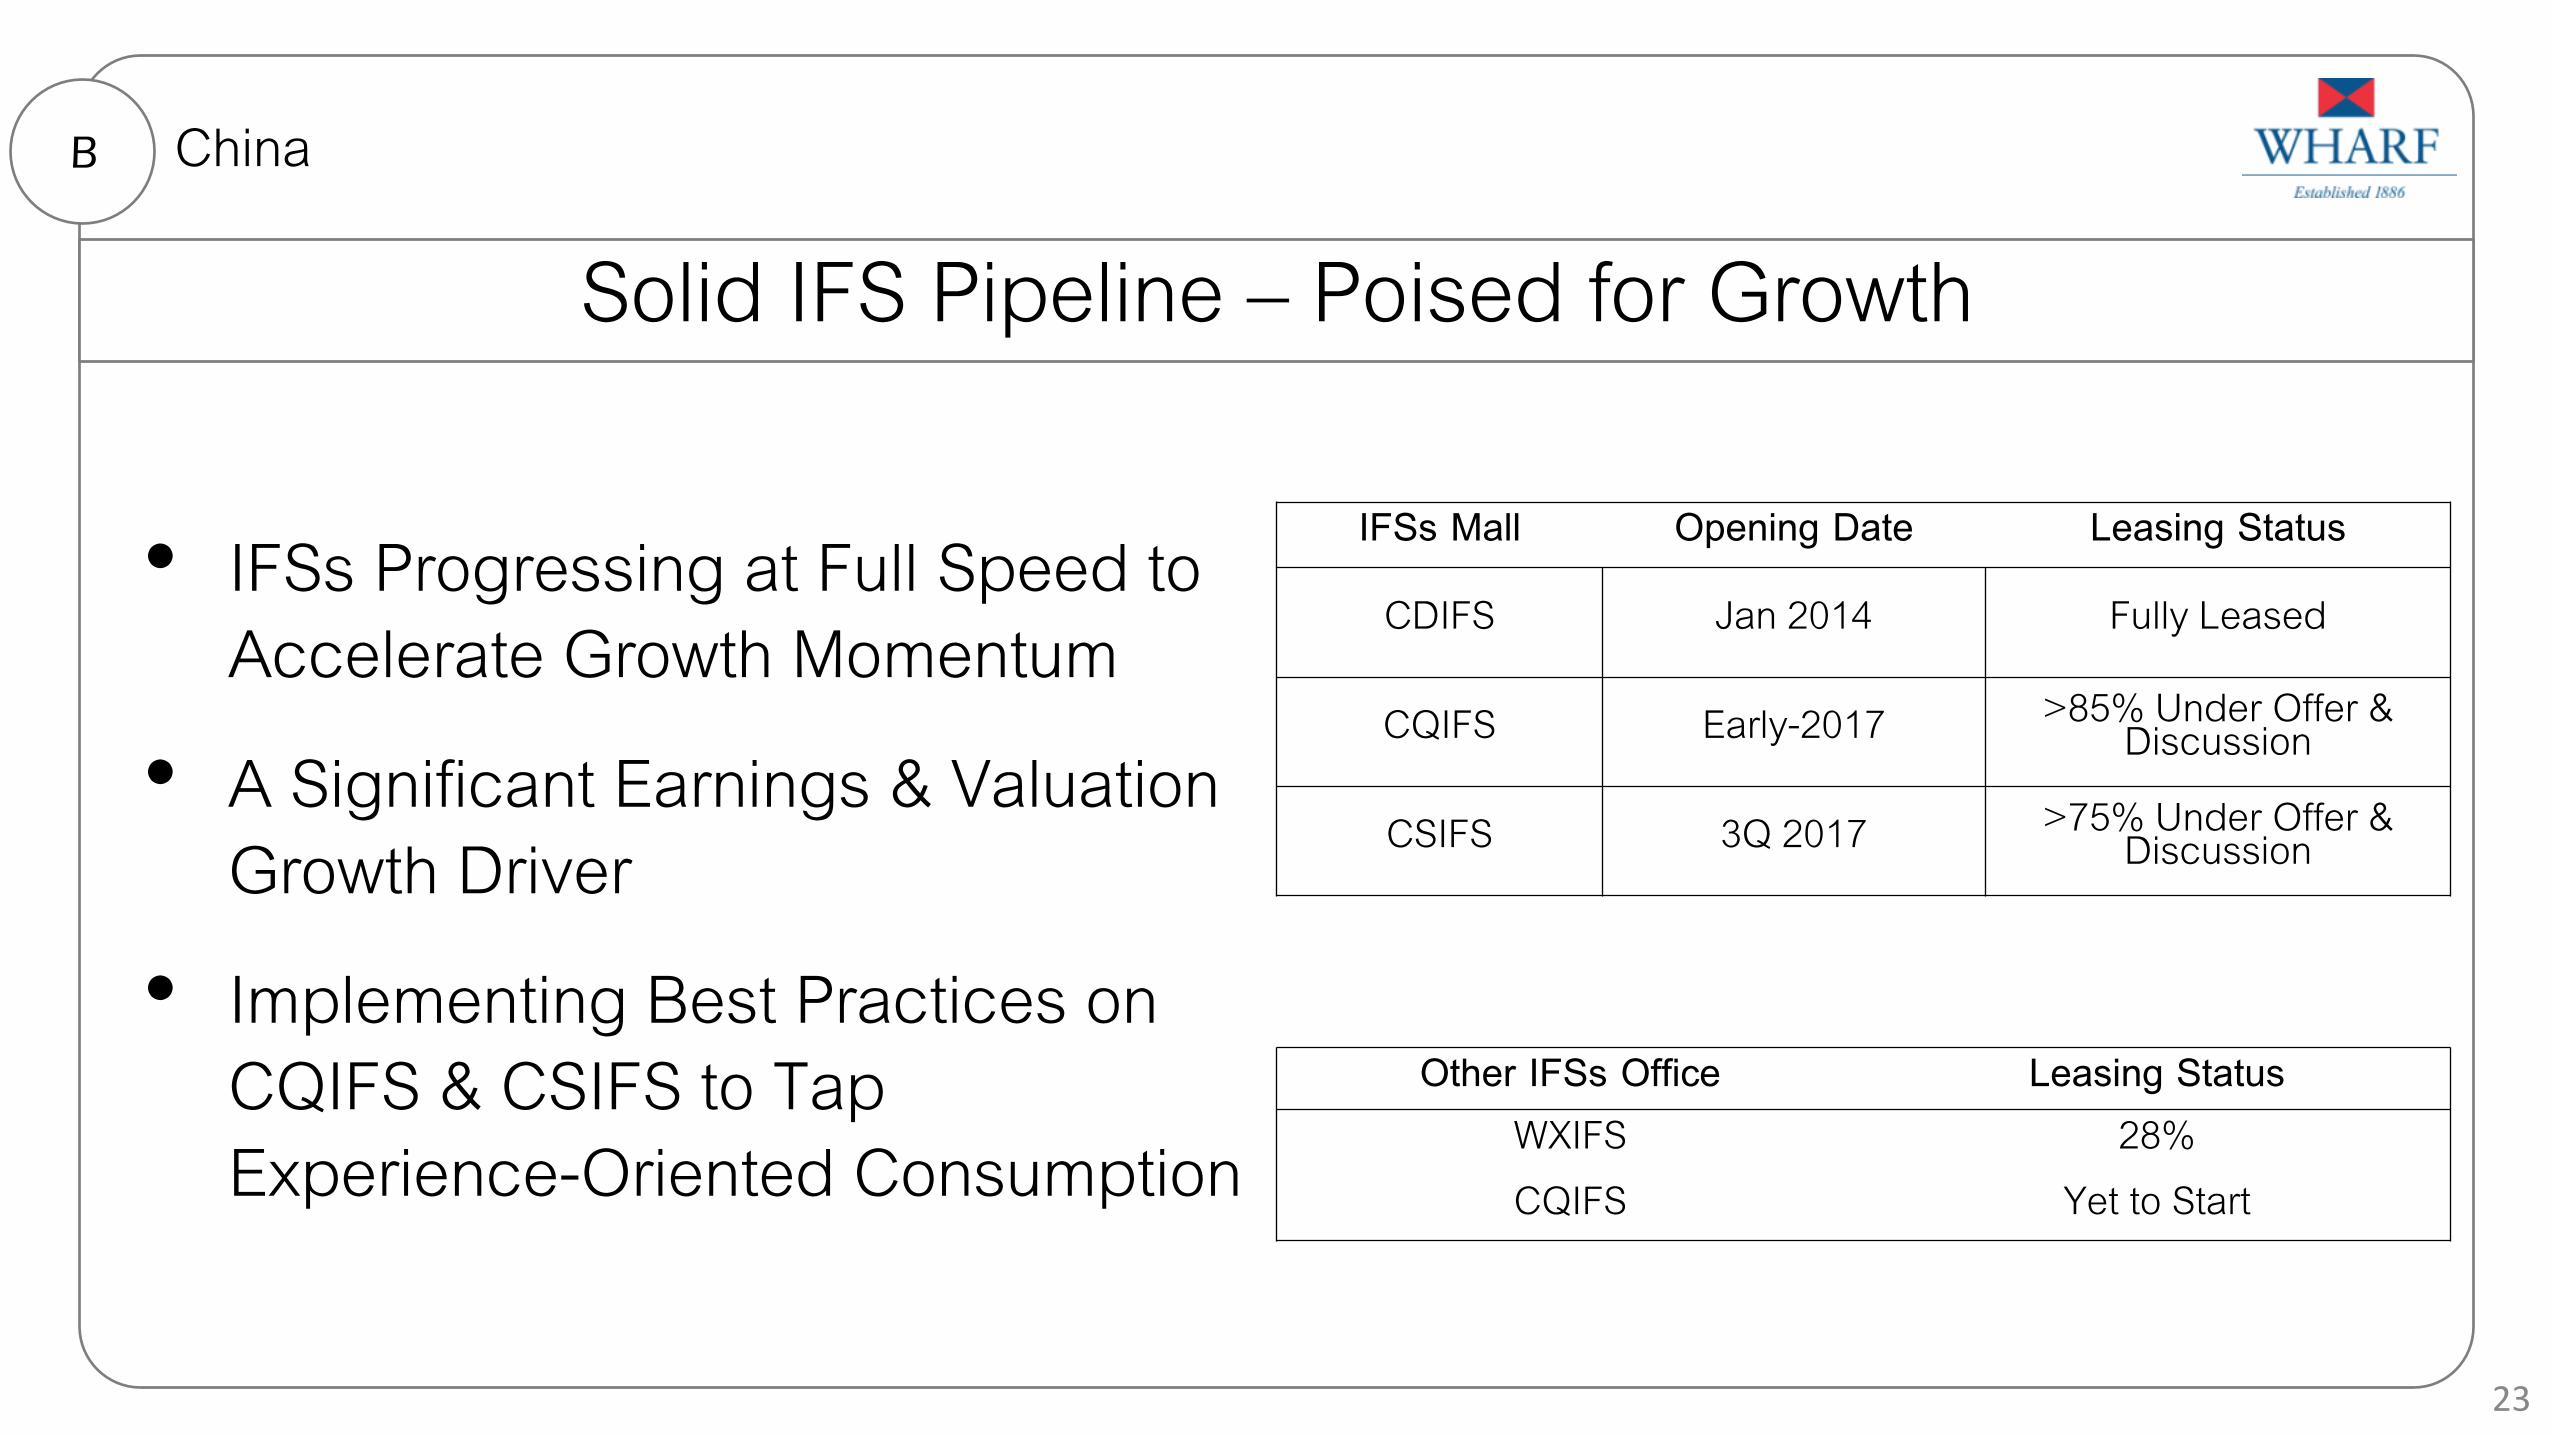
Solid IFS Pipeline – Poised for Growth
• IFSs Progressing at Full Speed to Accelerate Growth Momentum
• A Significant Earnings & Valuation Growth Driver
• Implementing Best Practices on CQIFS & CSIFS to Tap Experience-Oriented Consumption
B China
Other IFSs Office Leasing Status WXIFS 28% CQIFS Yet to Start
23
IFSs Mall Opening Date Leasing Status
CDIFS Jan 2014 Fully Leased
CQIFS Early-2017 >85% Under Offer & Discussion
CSIFS 3Q 2017 >75% Under Offer & Discussion
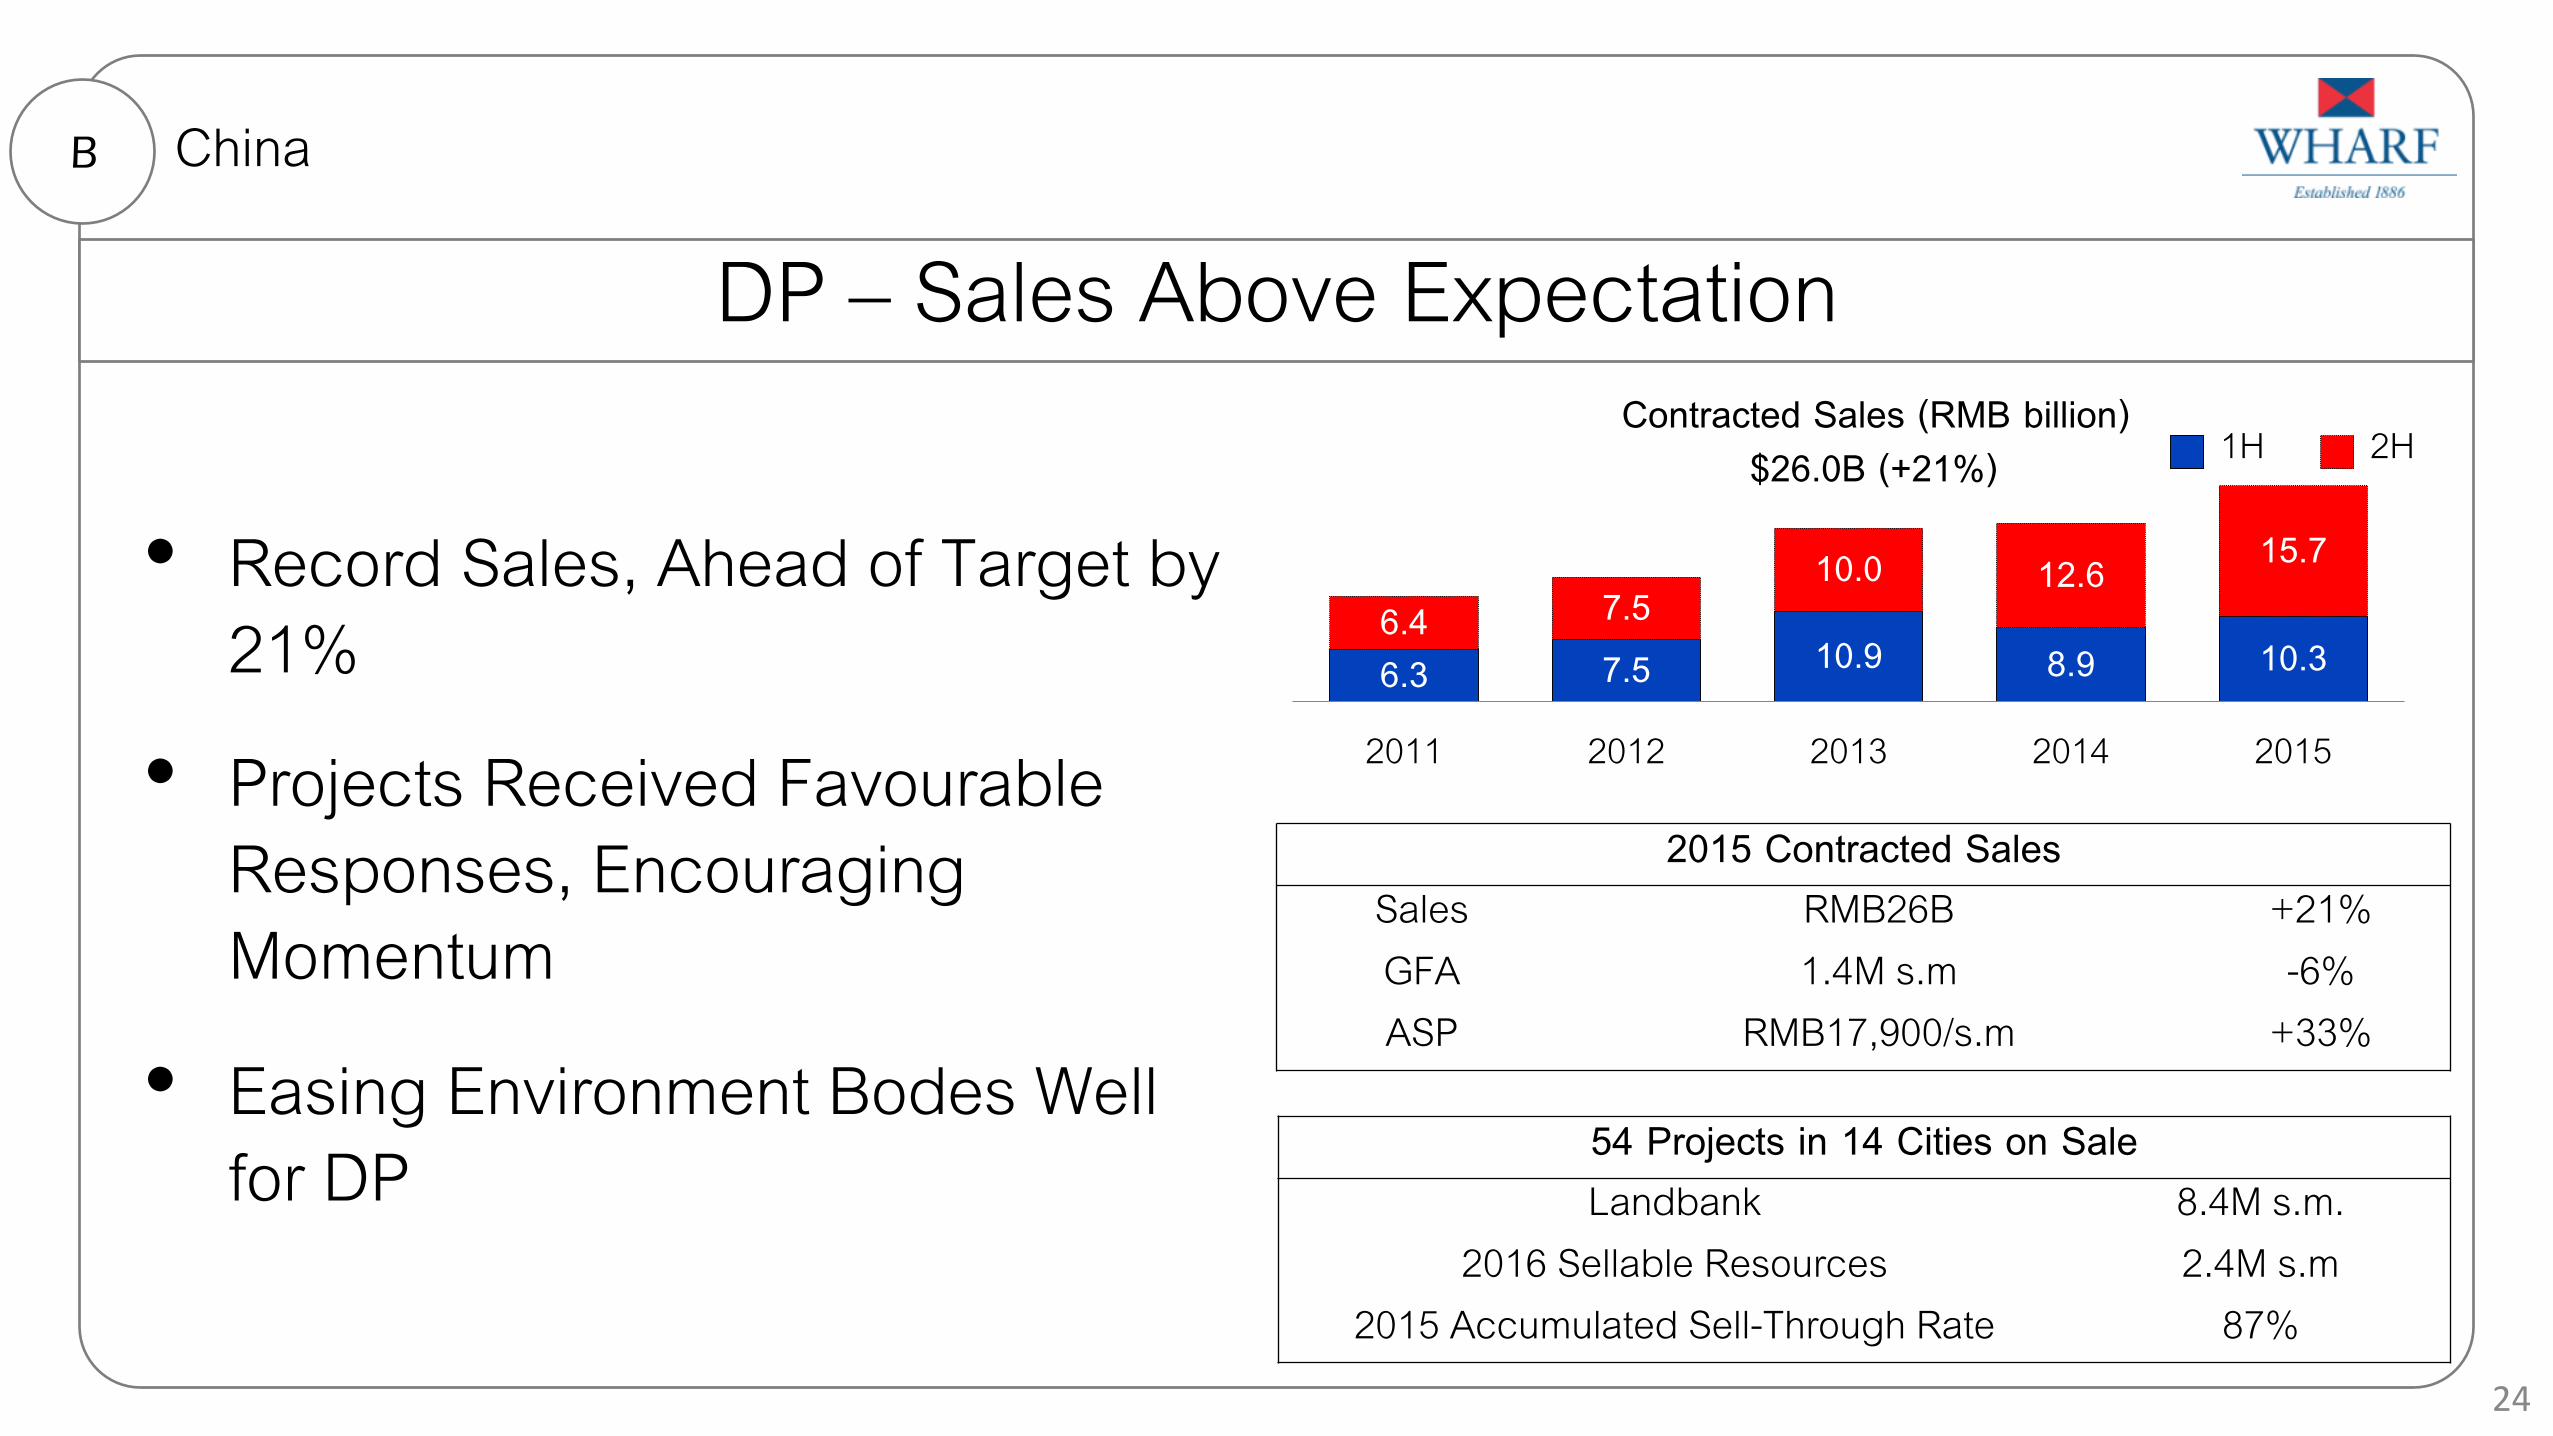
DP – Sales Above Expectation
• Record Sales, Ahead of Target by 21%
• Projects Received Favourable Responses, Encouraging Momentum
• Easing Environment Bodes Well for DP
B China
6.3 7.5 10.9 8.9 10.3 6.4 7.5
10.0 12.6 15.7
2011 2012 2013 2014 2015
Contracted Sales (RMB billion) 1H 2H
2015 Contracted Sales Sales RMB26B +21% GFA 1.4M s.m -6% ASP RMB17,900/s.m +33%
$26.0B (+21%)
24
54 Projects in 14 Cities on Sale Landbank 8.4M s.m.
2016 Sellable Resources 2.4M s.m 2015 Accumulated Sell-Through Rate 87%

DP – Improving Revenue Booking
• Contribution to Core Profit Increased to 11%^, excl. Greentown China
• Solid Execution
• Development Margins Remain Steady
B China
2015 Operating Matrix* Revenue $27,404M +18%
Operating Profit $4,200M +51% Operating Margin 15.3% +3.4ppts Completed GFA 1.7M s.m -8% Recognized GFA 1.6M s.m -5%
* Incl. JVs & Associates
25
2016 Target Completion 2.0M s.m 2016 Sales Target RMB24B
Net Order Book at End-2015 RMB25B GFA 1.4M s.m
^2014: 8%
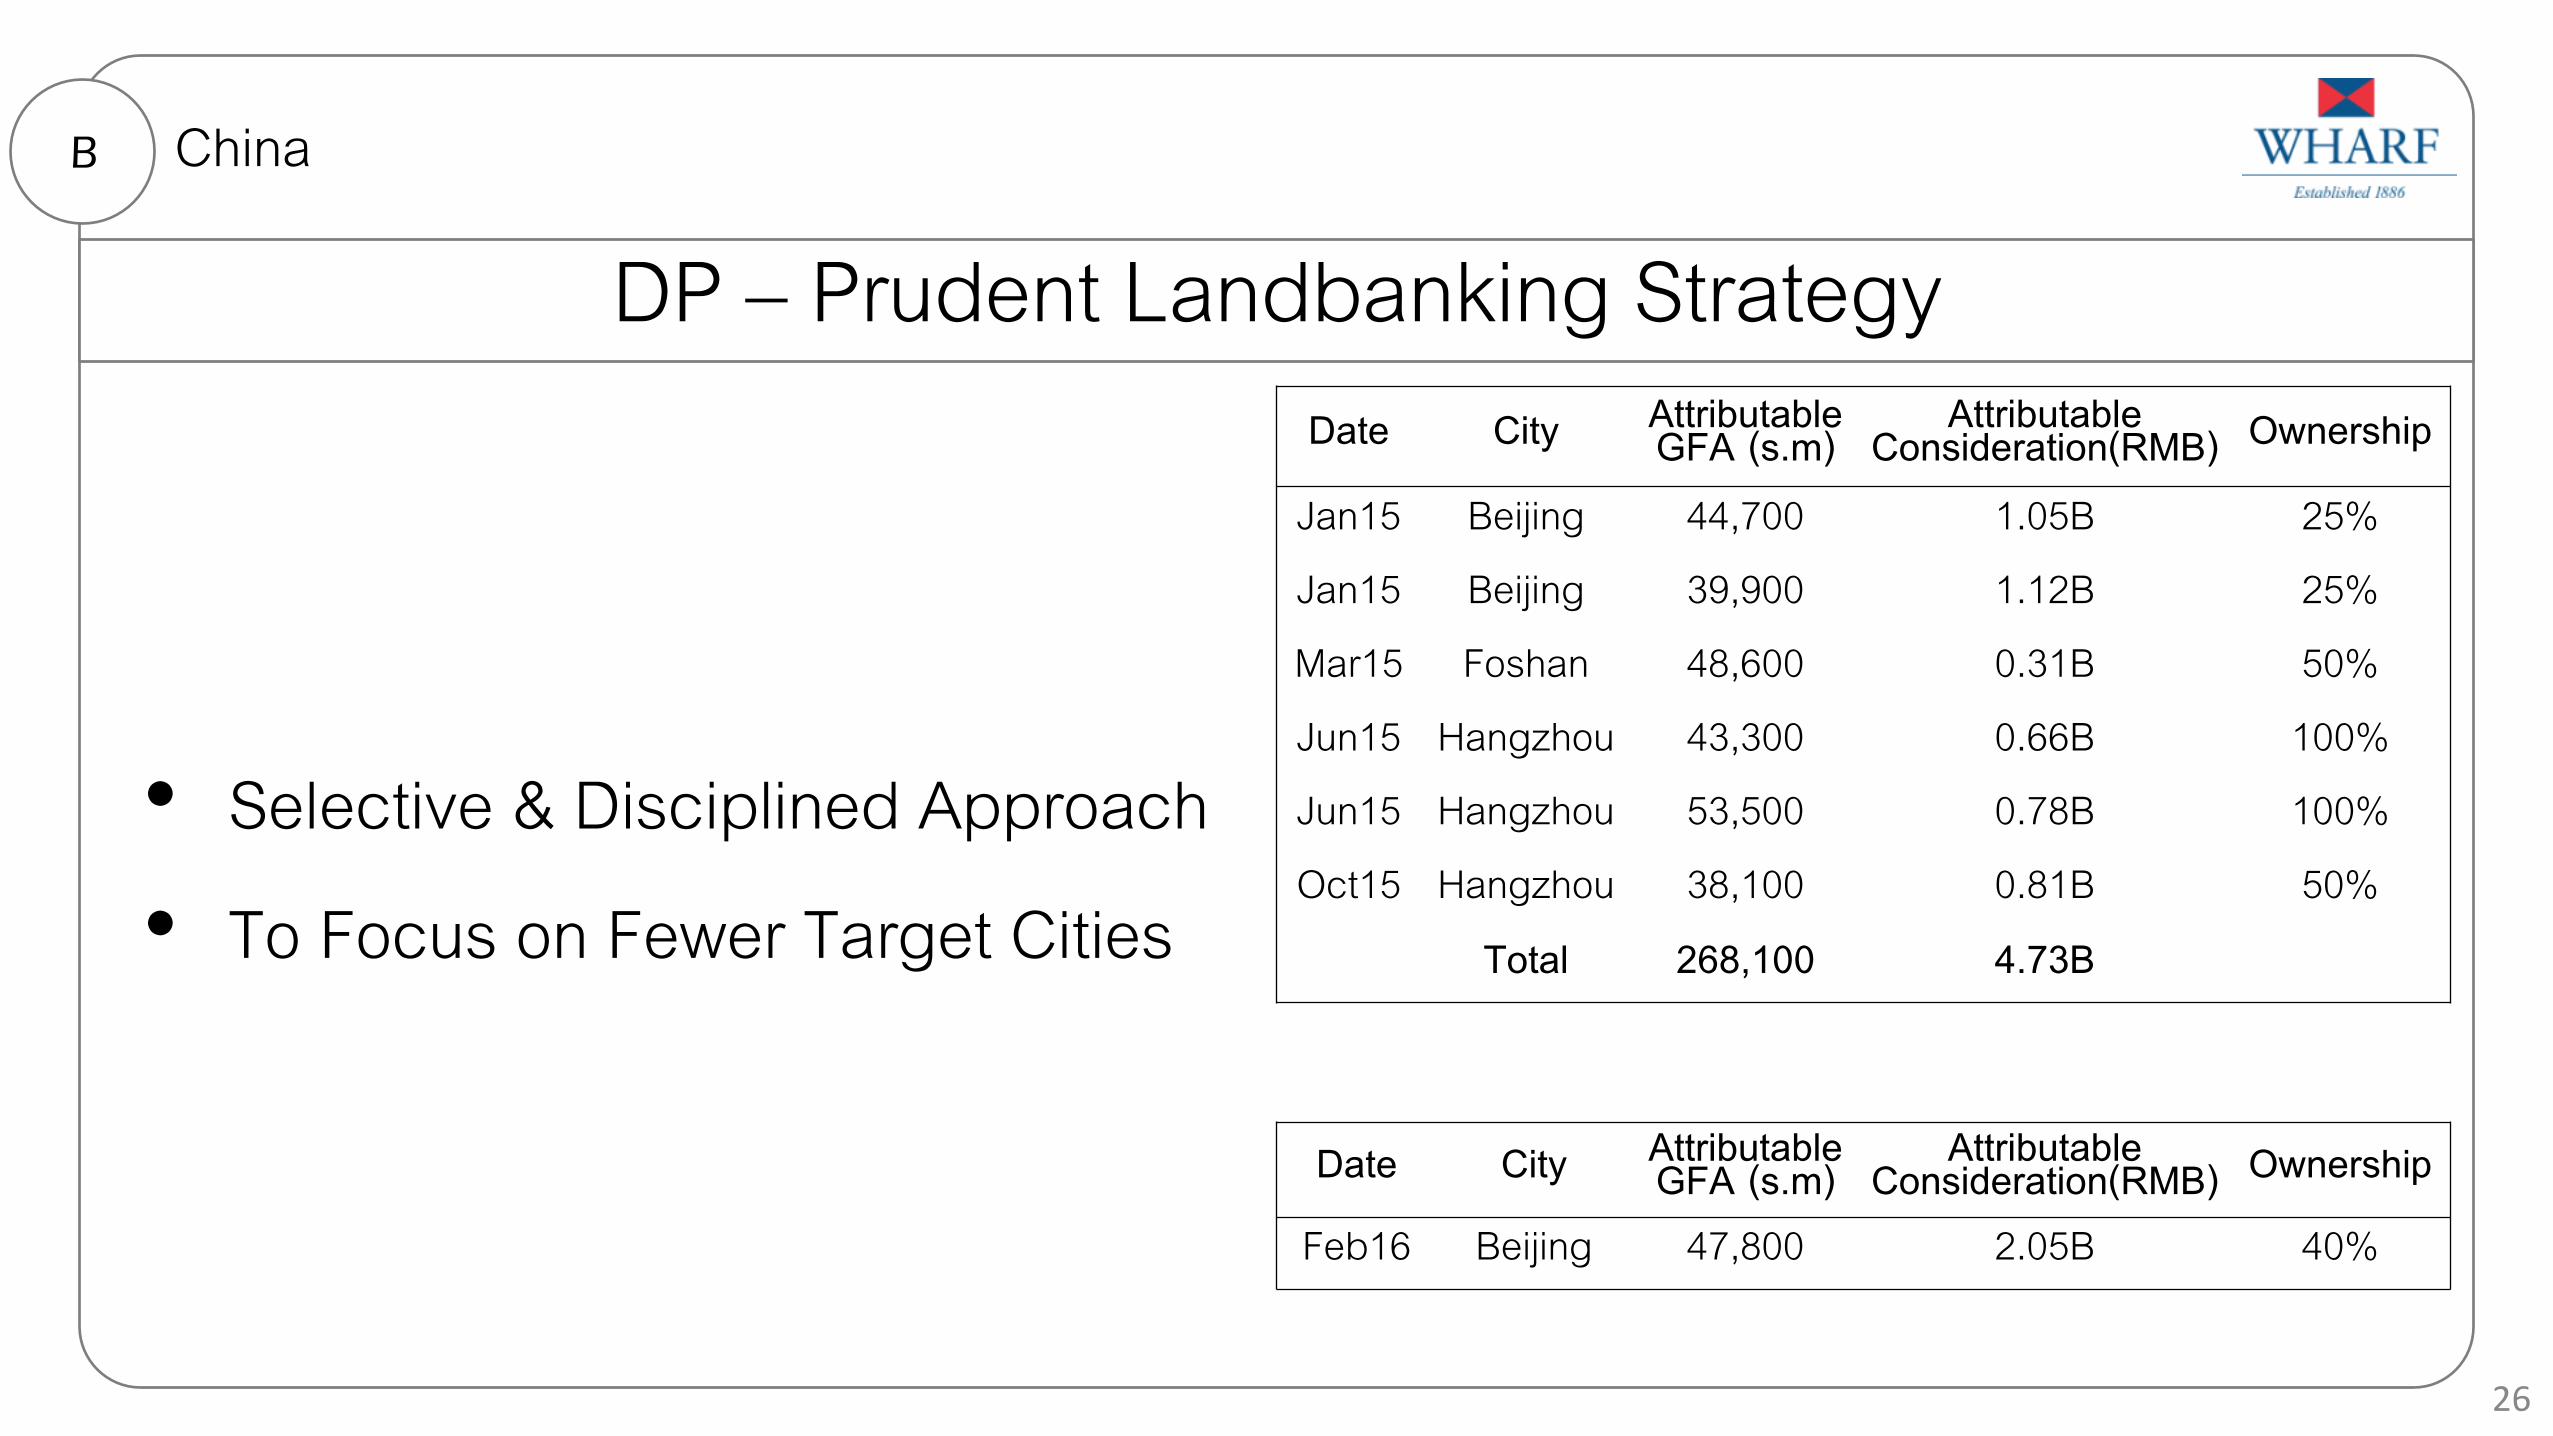
DP – Prudent Landbanking Strategy
• Selective & Disciplined Approach
• To Focus on Fewer Target Cities
B China
Date City Attributable GFA (s.m)
Attributable Consideration(RMB) Ownership
Jan15 Beijing 44,700 1.05B 25% Jan15 Beijing 39,900 1.12B 25% Mar15 Foshan 48,600 0.31B 50% Jun15 Hangzhou 43,300 0.66B 100% Jun15 Hangzhou 53,500 0.78B 100% Oct15 Hangzhou 38,100 0.81B 50%
Total 268,100 4.73B
Date City Attributable GFA (s.m)
Attributable Consideration(RMB) Ownership
Feb16 Beijing 47,800 2.05B 40%
26

Agenda
Hong Kong IP A
China IP & DP B
Others C
Next D
27
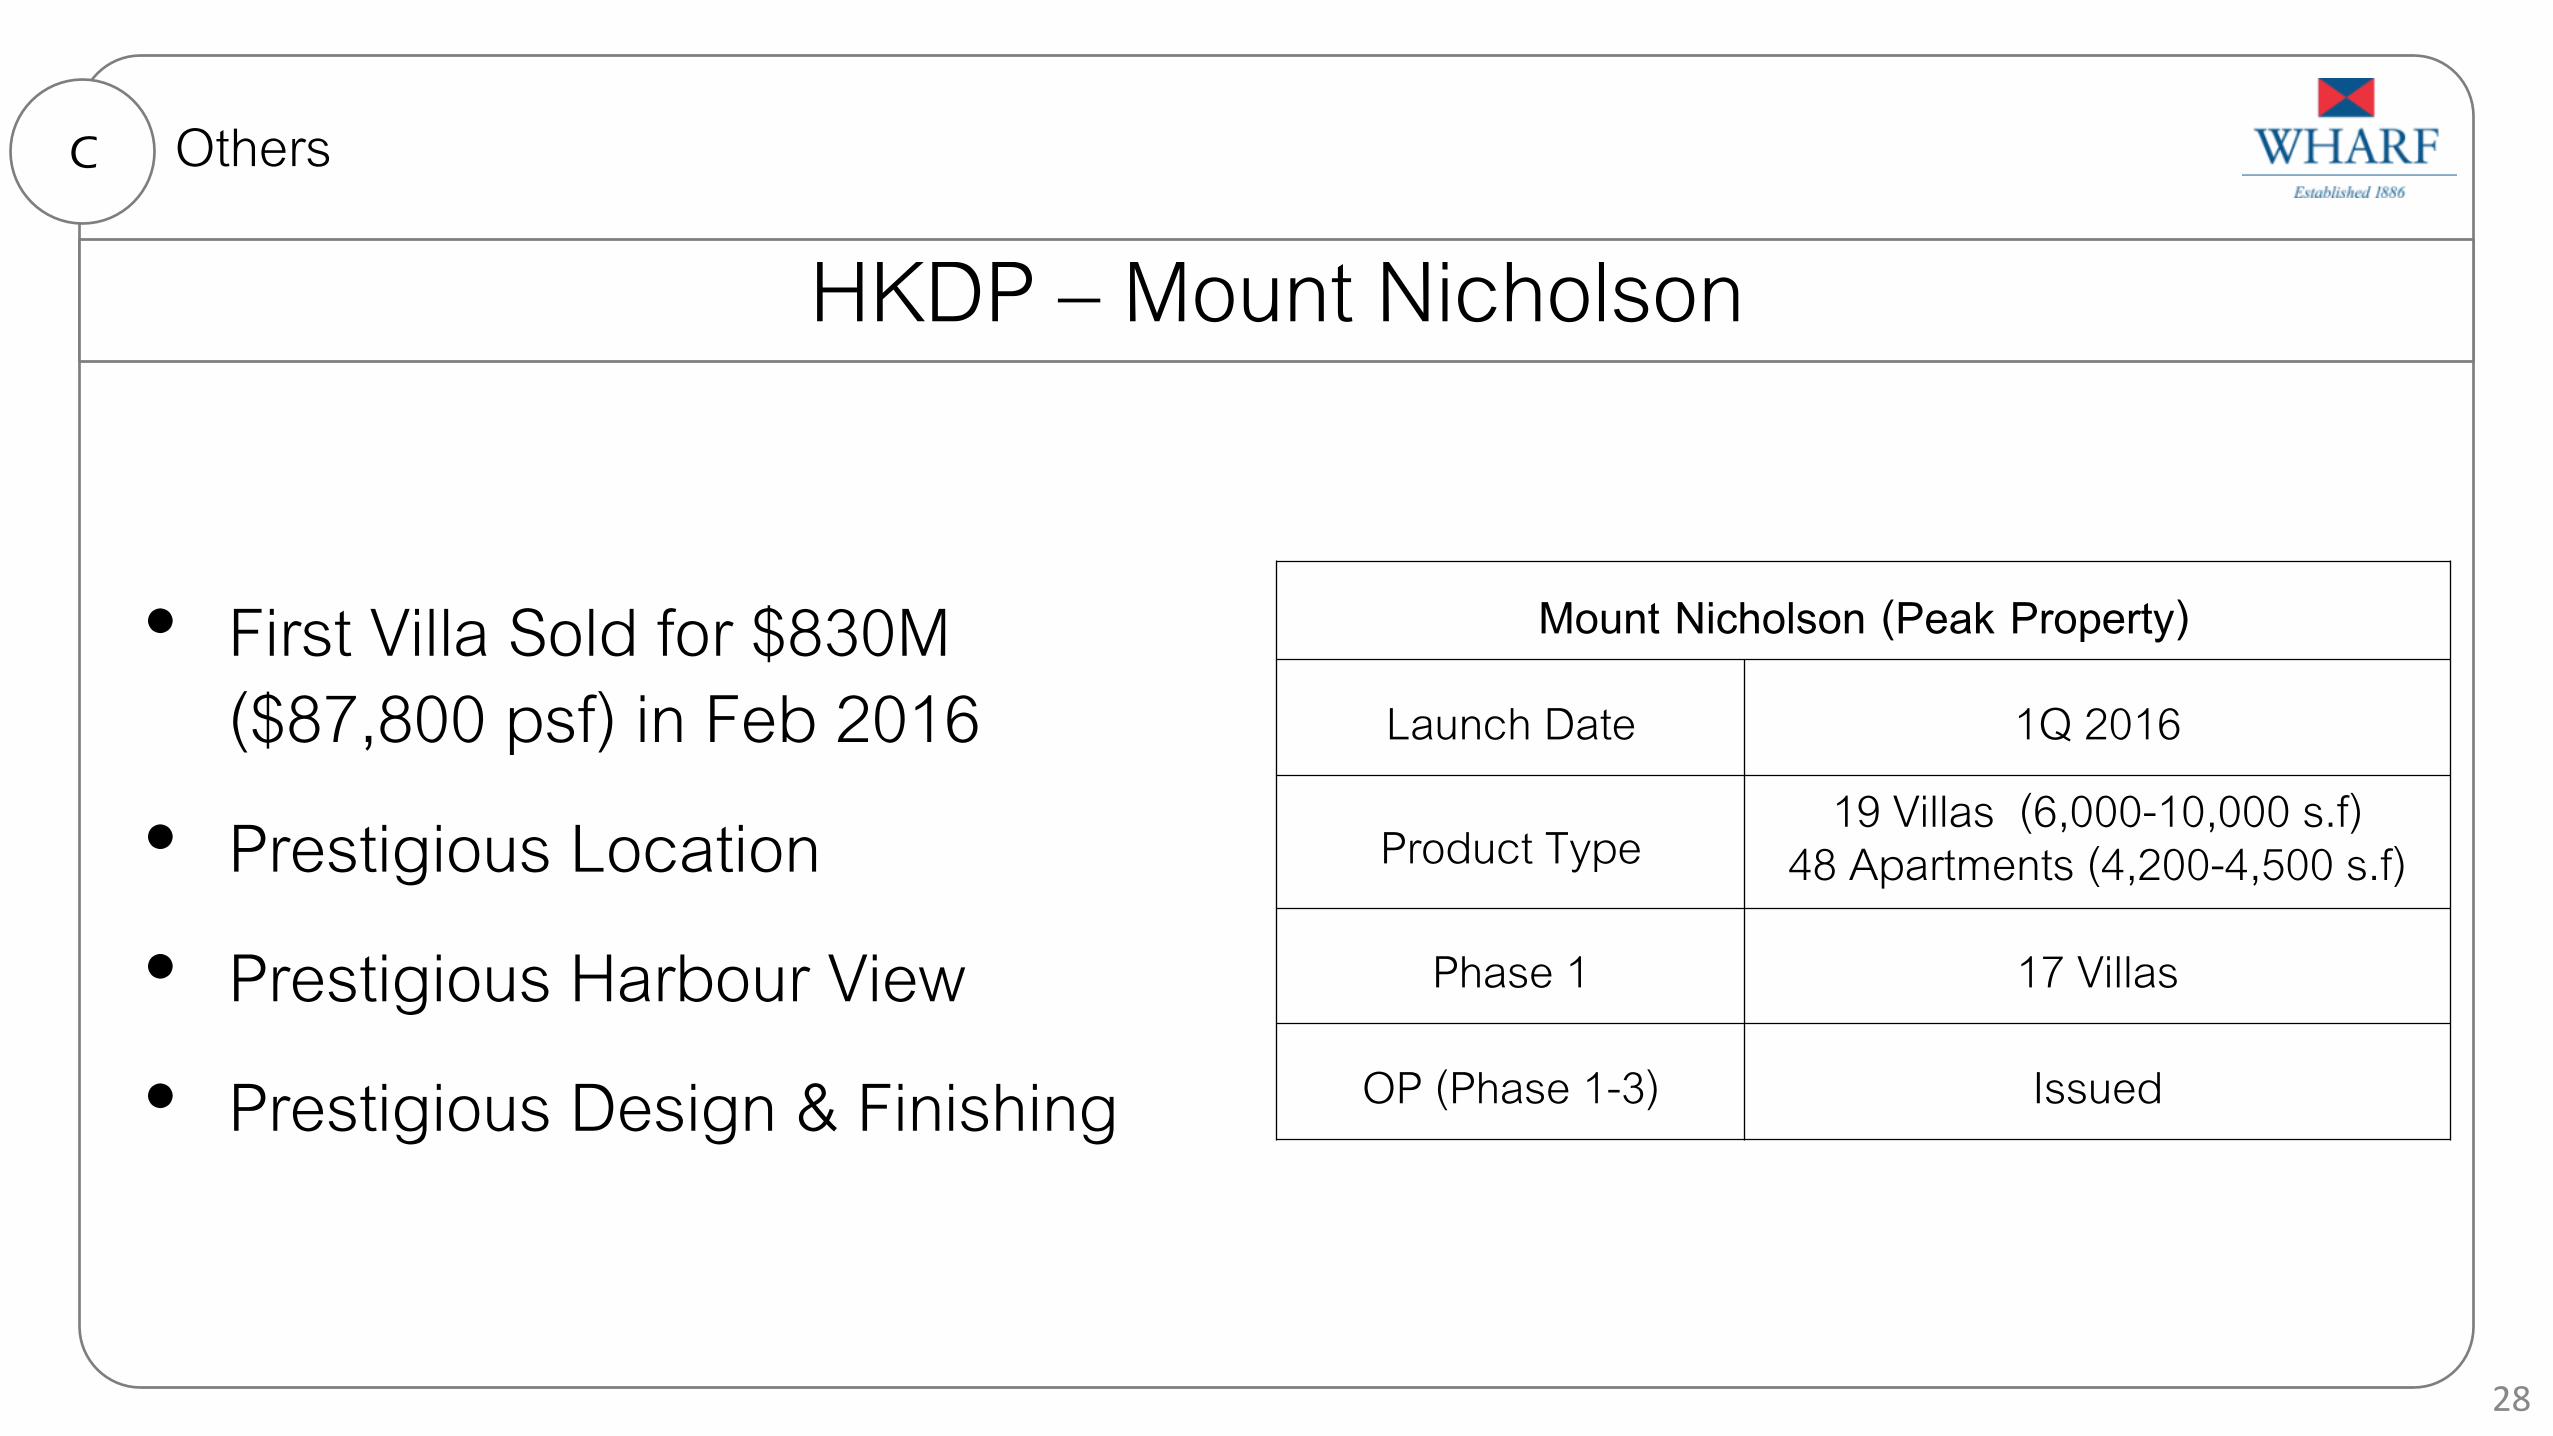
HKDP – Mount Nicholson
• First Villa Sold for $830M ($87,800 psf) in Feb 2016
• Prestigious Location
• Prestigious Harbour View
• Prestigious Design & Finishing
C Others
Mount Nicholson (Peak Property)
Launch Date 1Q 2016
Product Type 19 Villas (6,000-10,000 s.f) 48 Apartments (4,200-4,500 s.f)
Phase 1 17 Villas
OP (Phase 1-3) Issued
28
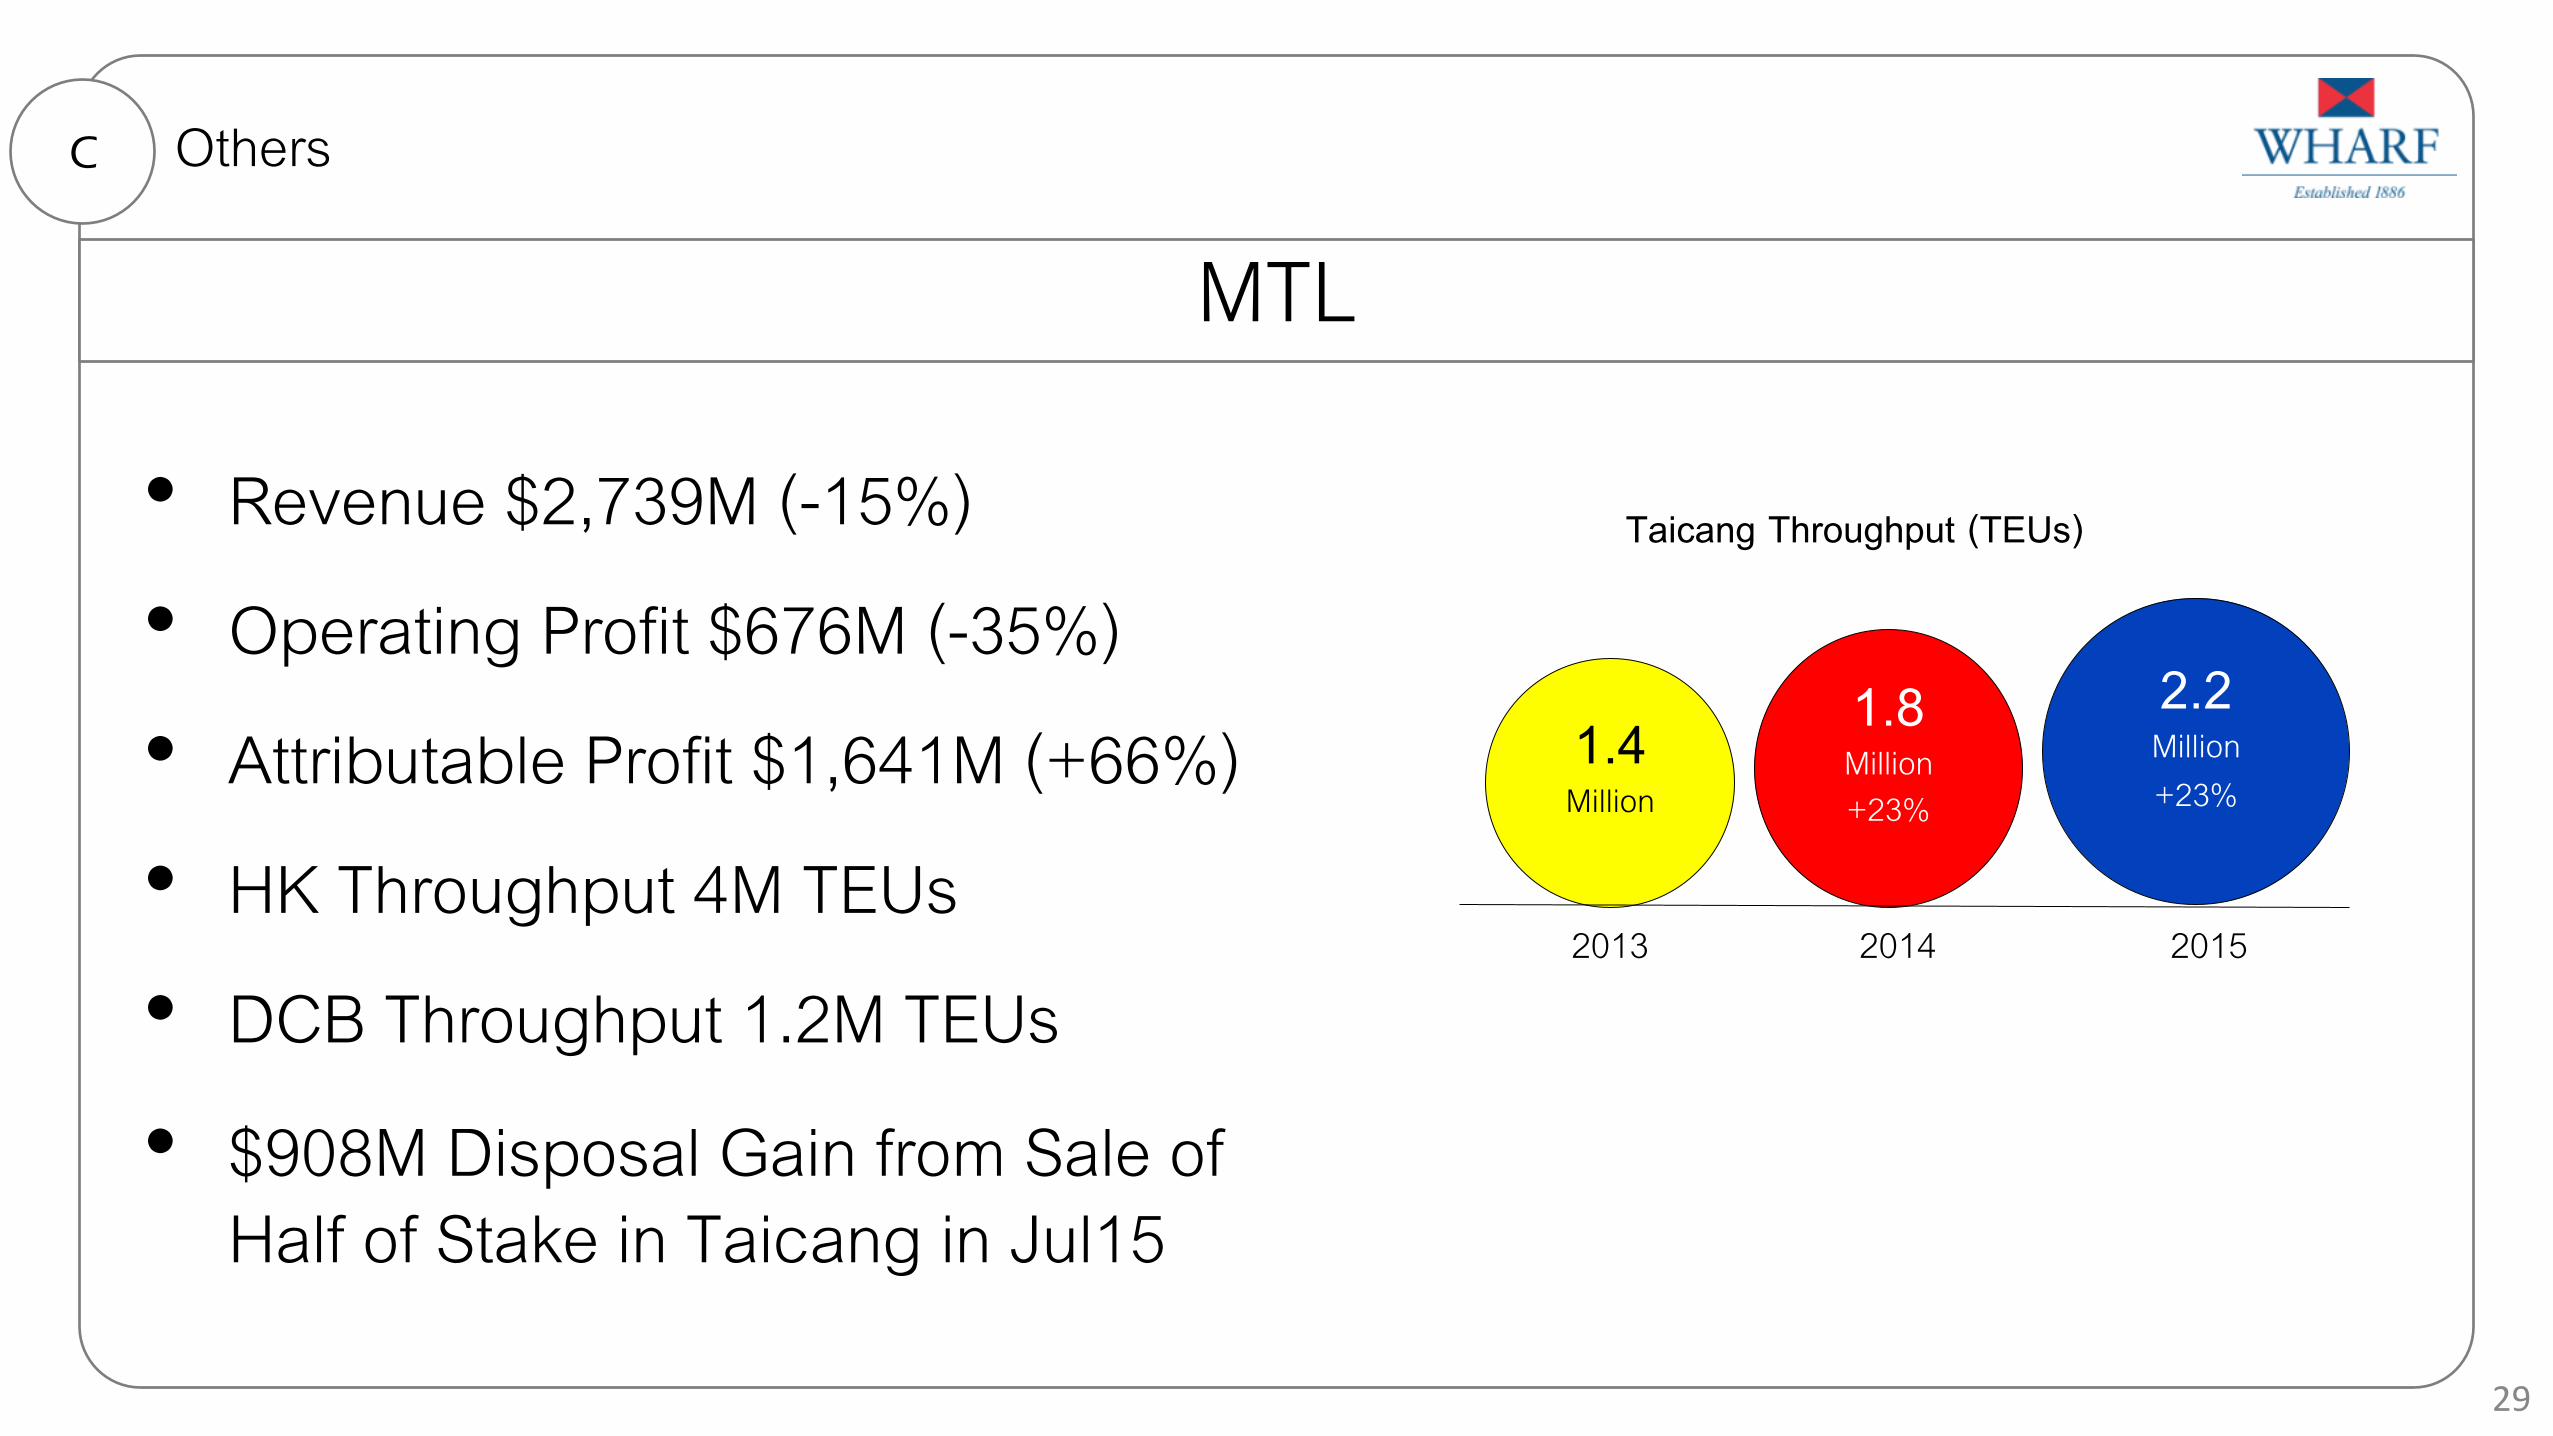
MTL
• Revenue $2,739M (-15%)
• Operating Profit $676M (-35%)
• Attributable Profit $1,641M (+66%)
• HK Throughput 4M TEUs
• DCB Throughput 1.2M TEUs
• $908M Disposal Gain from Sale of Half of Stake in Taicang in Jul15
C Others
2015 2014
Taicang Throughput (TEUs)
2.2 Million +23%
1.4 Million
29
1.8 Million +23%
2013

Marco Polo Hotel
• Revenue $1,549M (-$51M)
• Operating Profit $278M (-$109M)
• Hospitality Industry Under Pressure
• Niccolo in CDIFS Commands One of the Highest Room Yields in Chengdu in Less than One Year from Opening
C Others
30

CME*
Wharf T&T • Achieved Record Results
• Revenue $1,991M (+$41M)
• Operating Profit $362M (+$10M)
• Free Cash Flow Improved to $450M
C Others
31
i-Cable • Revenue $1,510M (-$156M)
• Operating Loss $246M
• Early Signs of Subscription Revenue Stabilization
* Strategic Review to Evaluate Different Options to Enhance These Businesses

Prudent Financial Management C
21.1%
25.6%
18.8% 15.8%
19.2% 20.6% 21.7% 20.4%
18.9%
14.9%
2006 2007 2008 2009 2010 2011 2012 2013 2014 2015
Net Debt to Total Equity
Net Debt / (Cash)
(HKD B) Wharf
(excl. subs) MTL HCDL i-CABLE Group Total
Net Debt to Total Equity
31 Dec 2015 39.9 8.8 (1.7) 0.2 47.2 14.9% 31 Dec 2014 49.0 11.0 (0.7) 0.0 59.3 18.9%
• Disciplined Capital Allocation
• Net Debt to Total Equity Fell Below 15% (2014: 19%)
• Group Net Debt $47B, Decreased by $12B
Others
32

Prudent Financial Management C
• Floating Rate Debt: 83% of Total Debt
RMB Devaluation Impact: • Net Loss $158M
• Shareholders’ Equity: Net Exchange Deficit $6.5B
2.3% 2.8%
3.2% 3.2% 2.8%
2011 2012 2013 2014 2015
Average Interest Cost
8.5
13.1 11.9 15.3 14.1
7.8
Jan16-Dec16 Jan17-Dec17 Jan18-Dec18 Jan19-Dec19 Jan20-Dec20 Jan21 & After
Debt Maturity (HKD billion)
Others
33
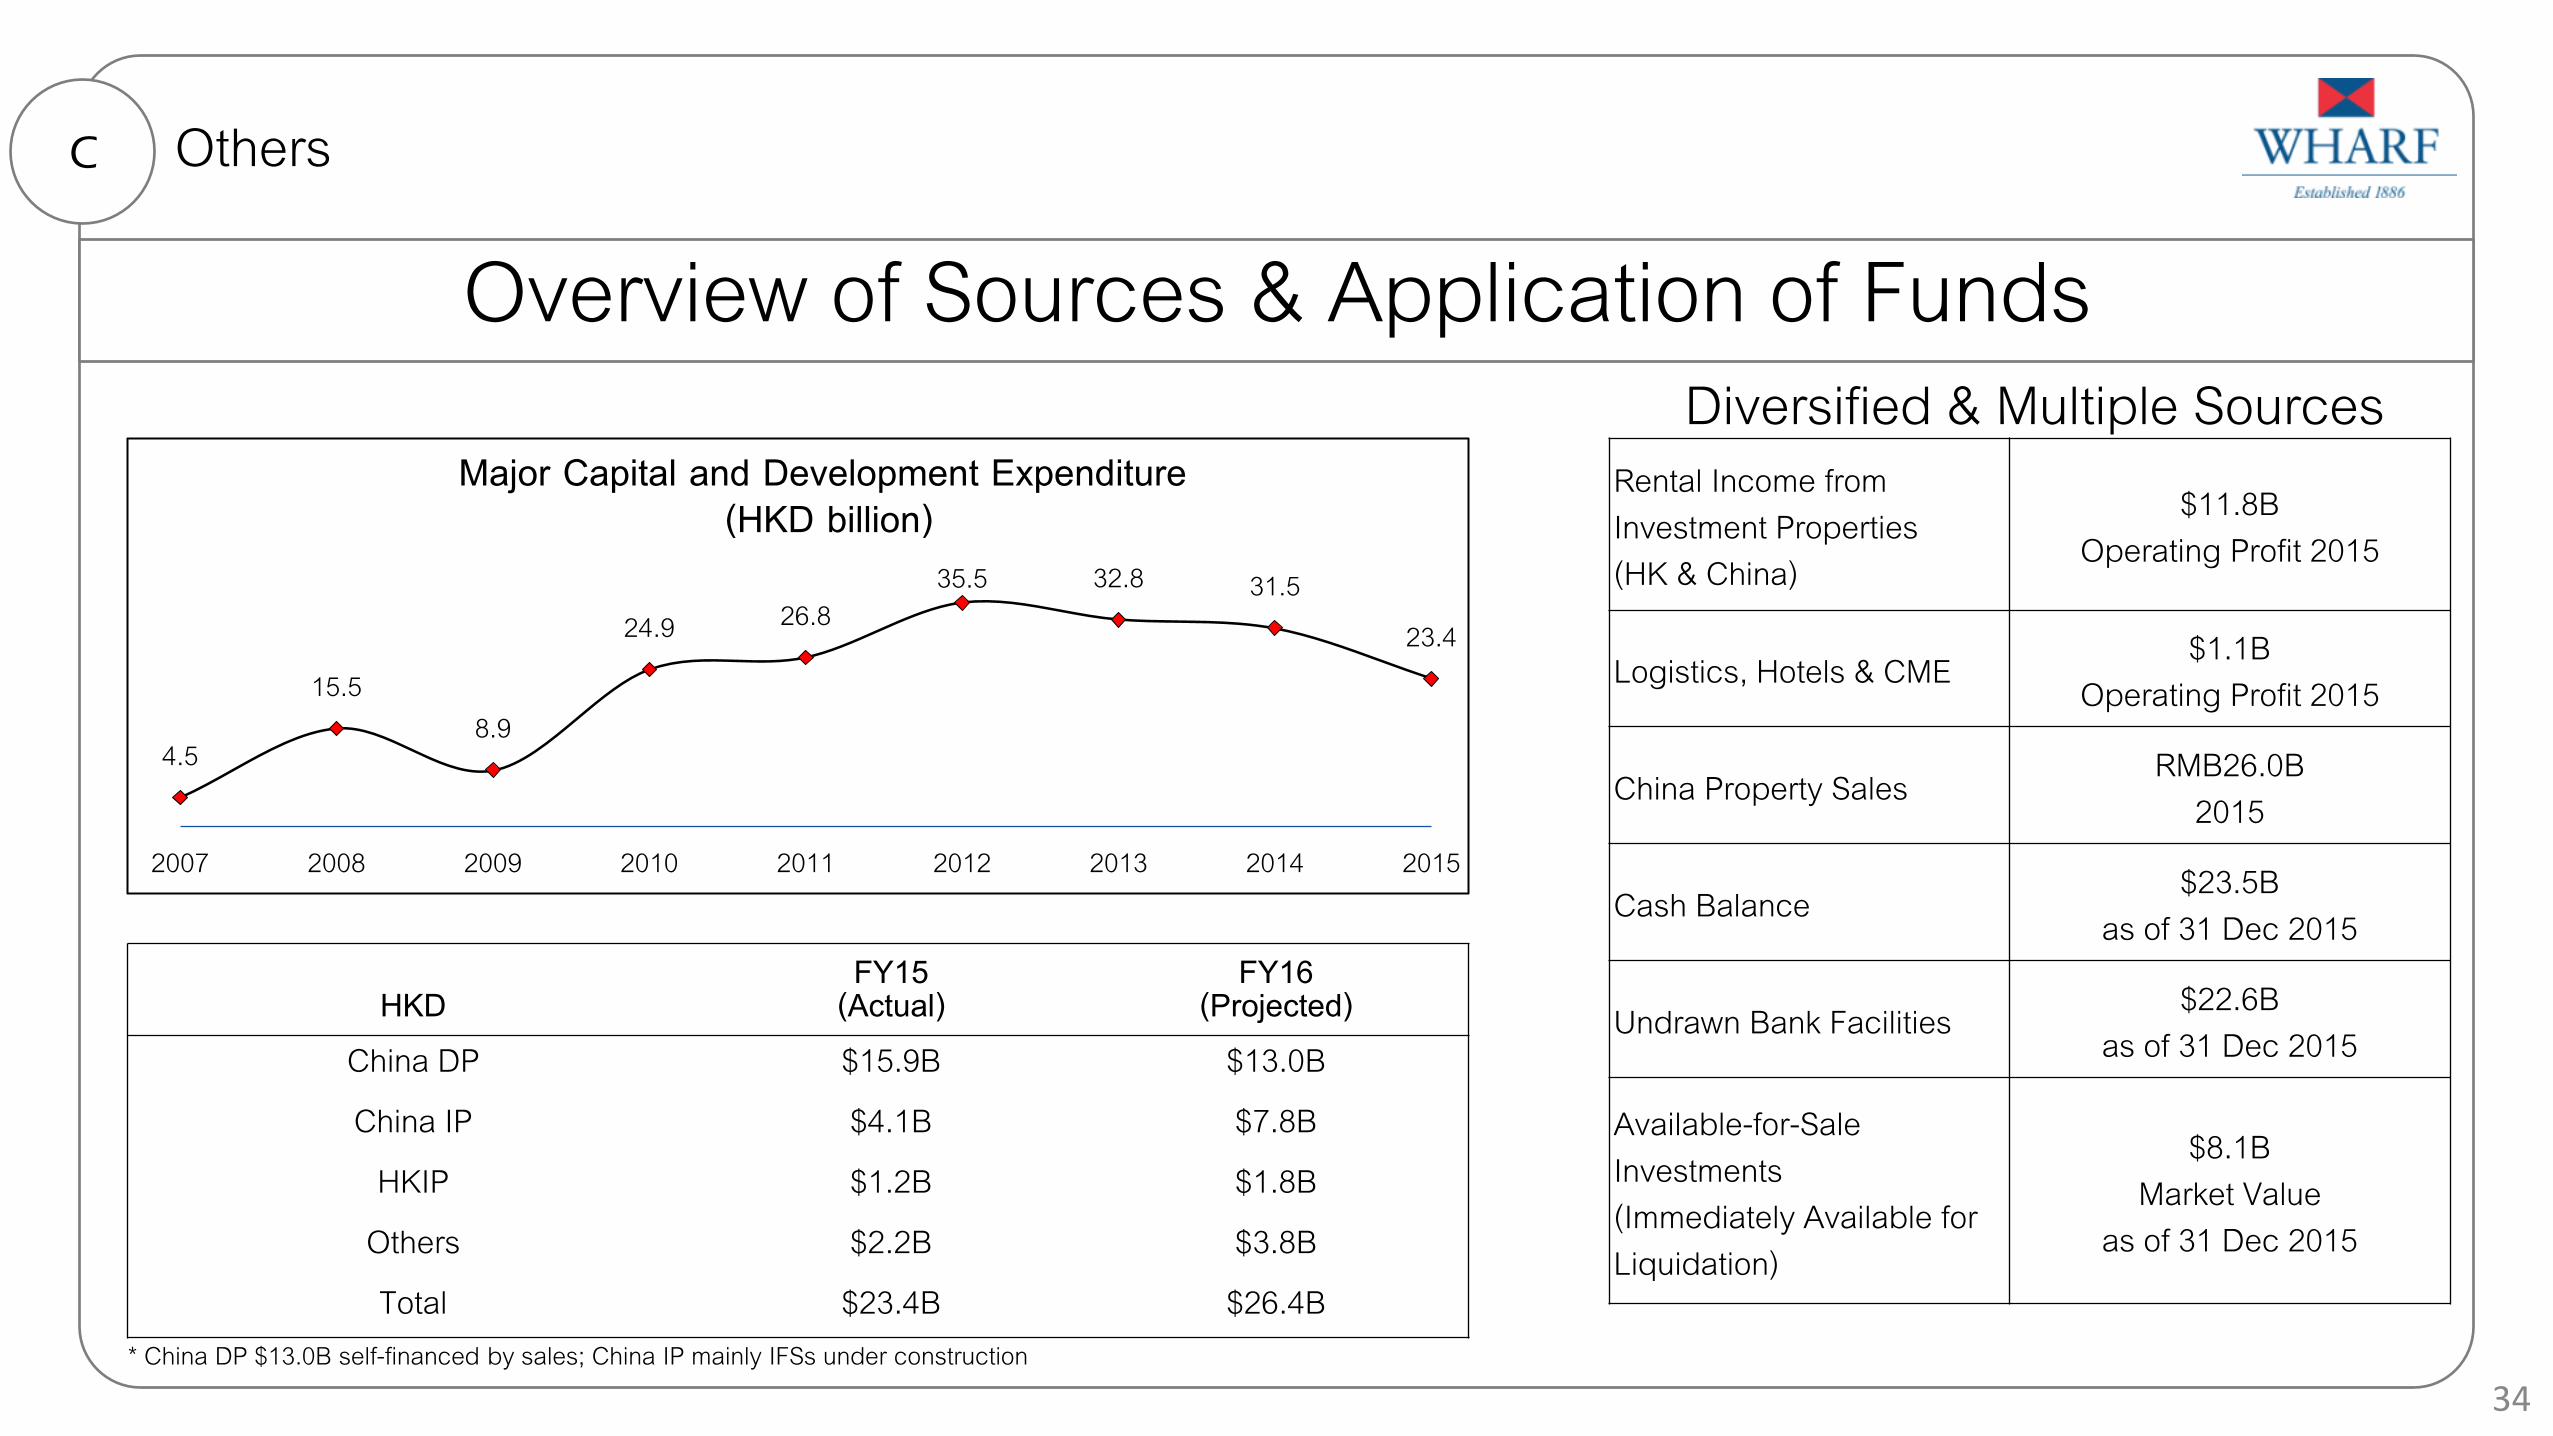
Overview of Sources & Application of Funds C
Diversified & Multiple Sources
* China DP $13.0B self-financed by sales; China IP mainly IFSs under construction
HKD FY15
(Actual) FY16
(Projected) China DP $15.9B $13.0B China IP $4.1B $7.8B
HKIP $1.2B $1.8B Others $2.2B $3.8B Total $23.4B $26.4B
4.5
15.5 8.9
24.9 26.8 35.5 32.8 31.5
23.4
2007 2008 2009 2010 2011 2012 2013 2014 2015
Major Capital and Development Expenditure (HKD billion)
Rental Income from Investment Properties (HK & China)
$11.8B Operating Profit 2015
Logistics, Hotels & CME $1.1B Operating Profit 2015
China Property Sales RMB26.0B 2015
Cash Balance $23.5B as of 31 Dec 2015
Undrawn Bank Facilities $22.6B as of 31 Dec 2015
Available-for-Sale Investments (Immediately Available for Liquidation)
$8.1B Market Value
as of 31 Dec 2015
Others
34

Agenda
Hong Kong IP A
China IP & DP B
Others C
Next D
35
Next Highlights D Next
OT 4-Storey Extension CSIFS CQIFS
36

CSR
37
2015
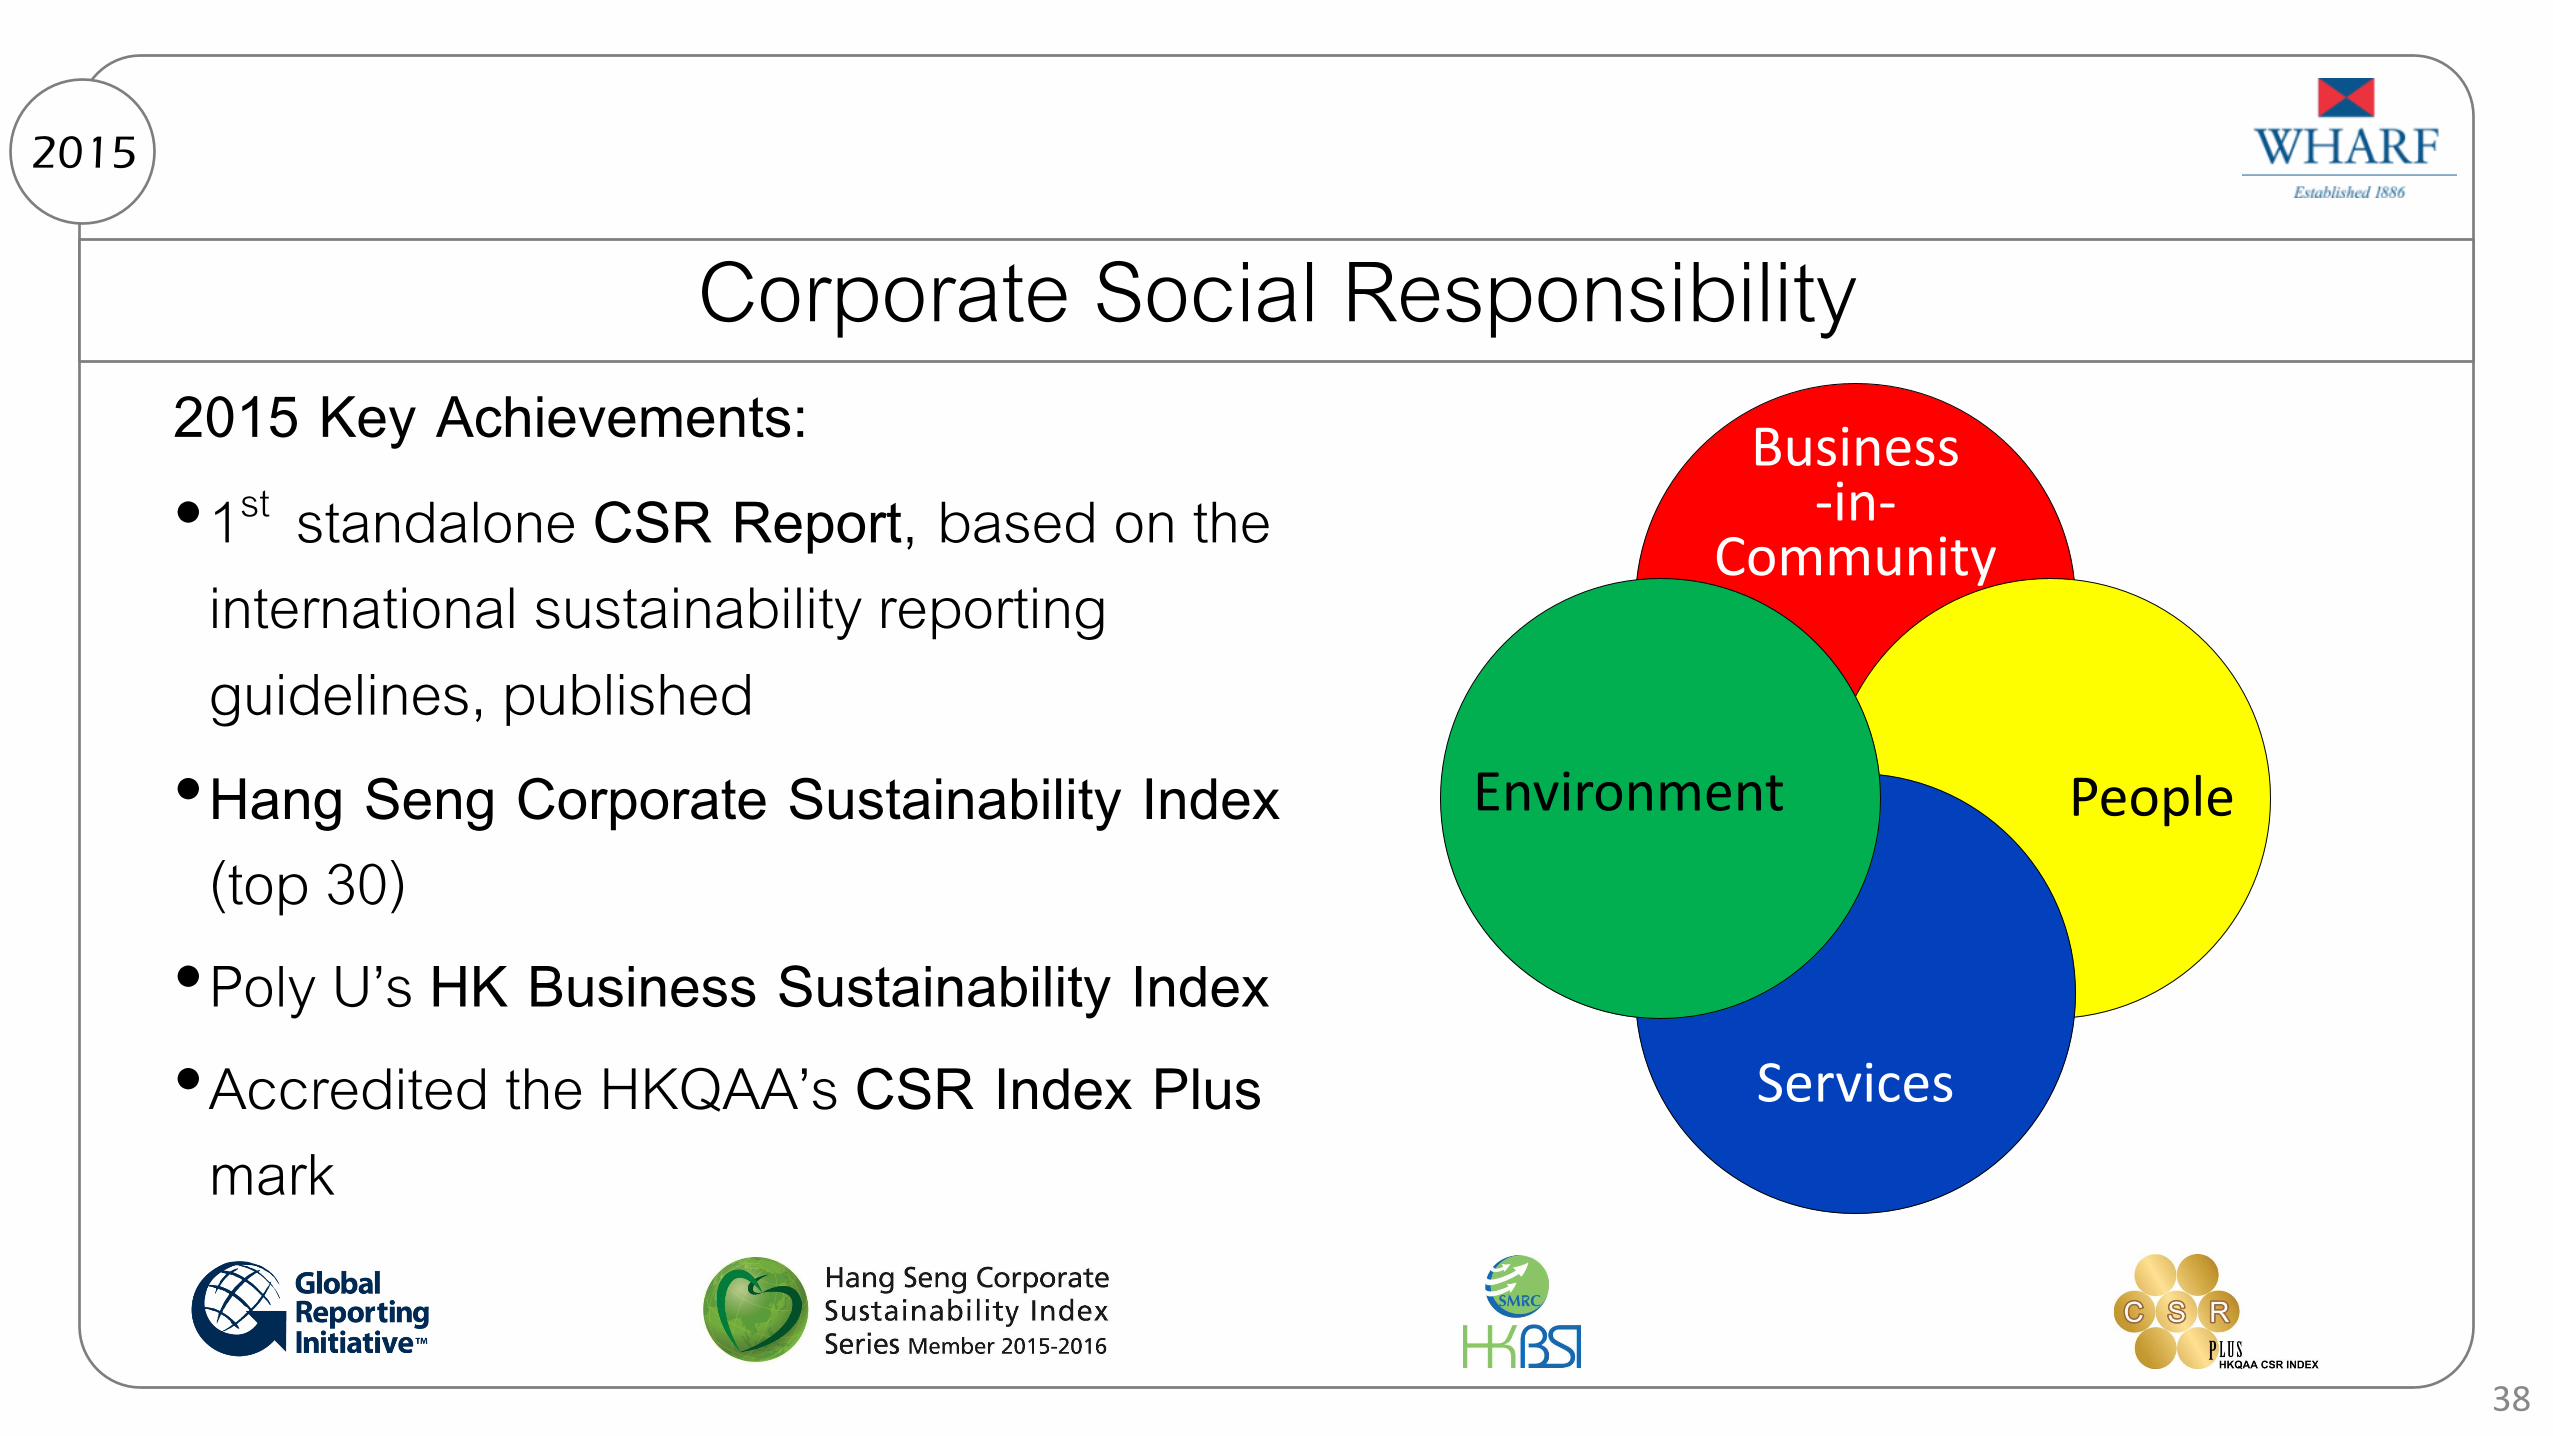
Corporate Social Responsibility
38
2015 Key Achievements: •1st standalone CSR Report, based on the
international sustainability reporting guidelines, published
•Hang Seng Corporate Sustainability Index (top 30)
•Poly U’s HK Business Sustainability Index •Accredited the HKQAA’s CSR Index Plus
mark
Business -in-
Community
People
Services
Environment
2015
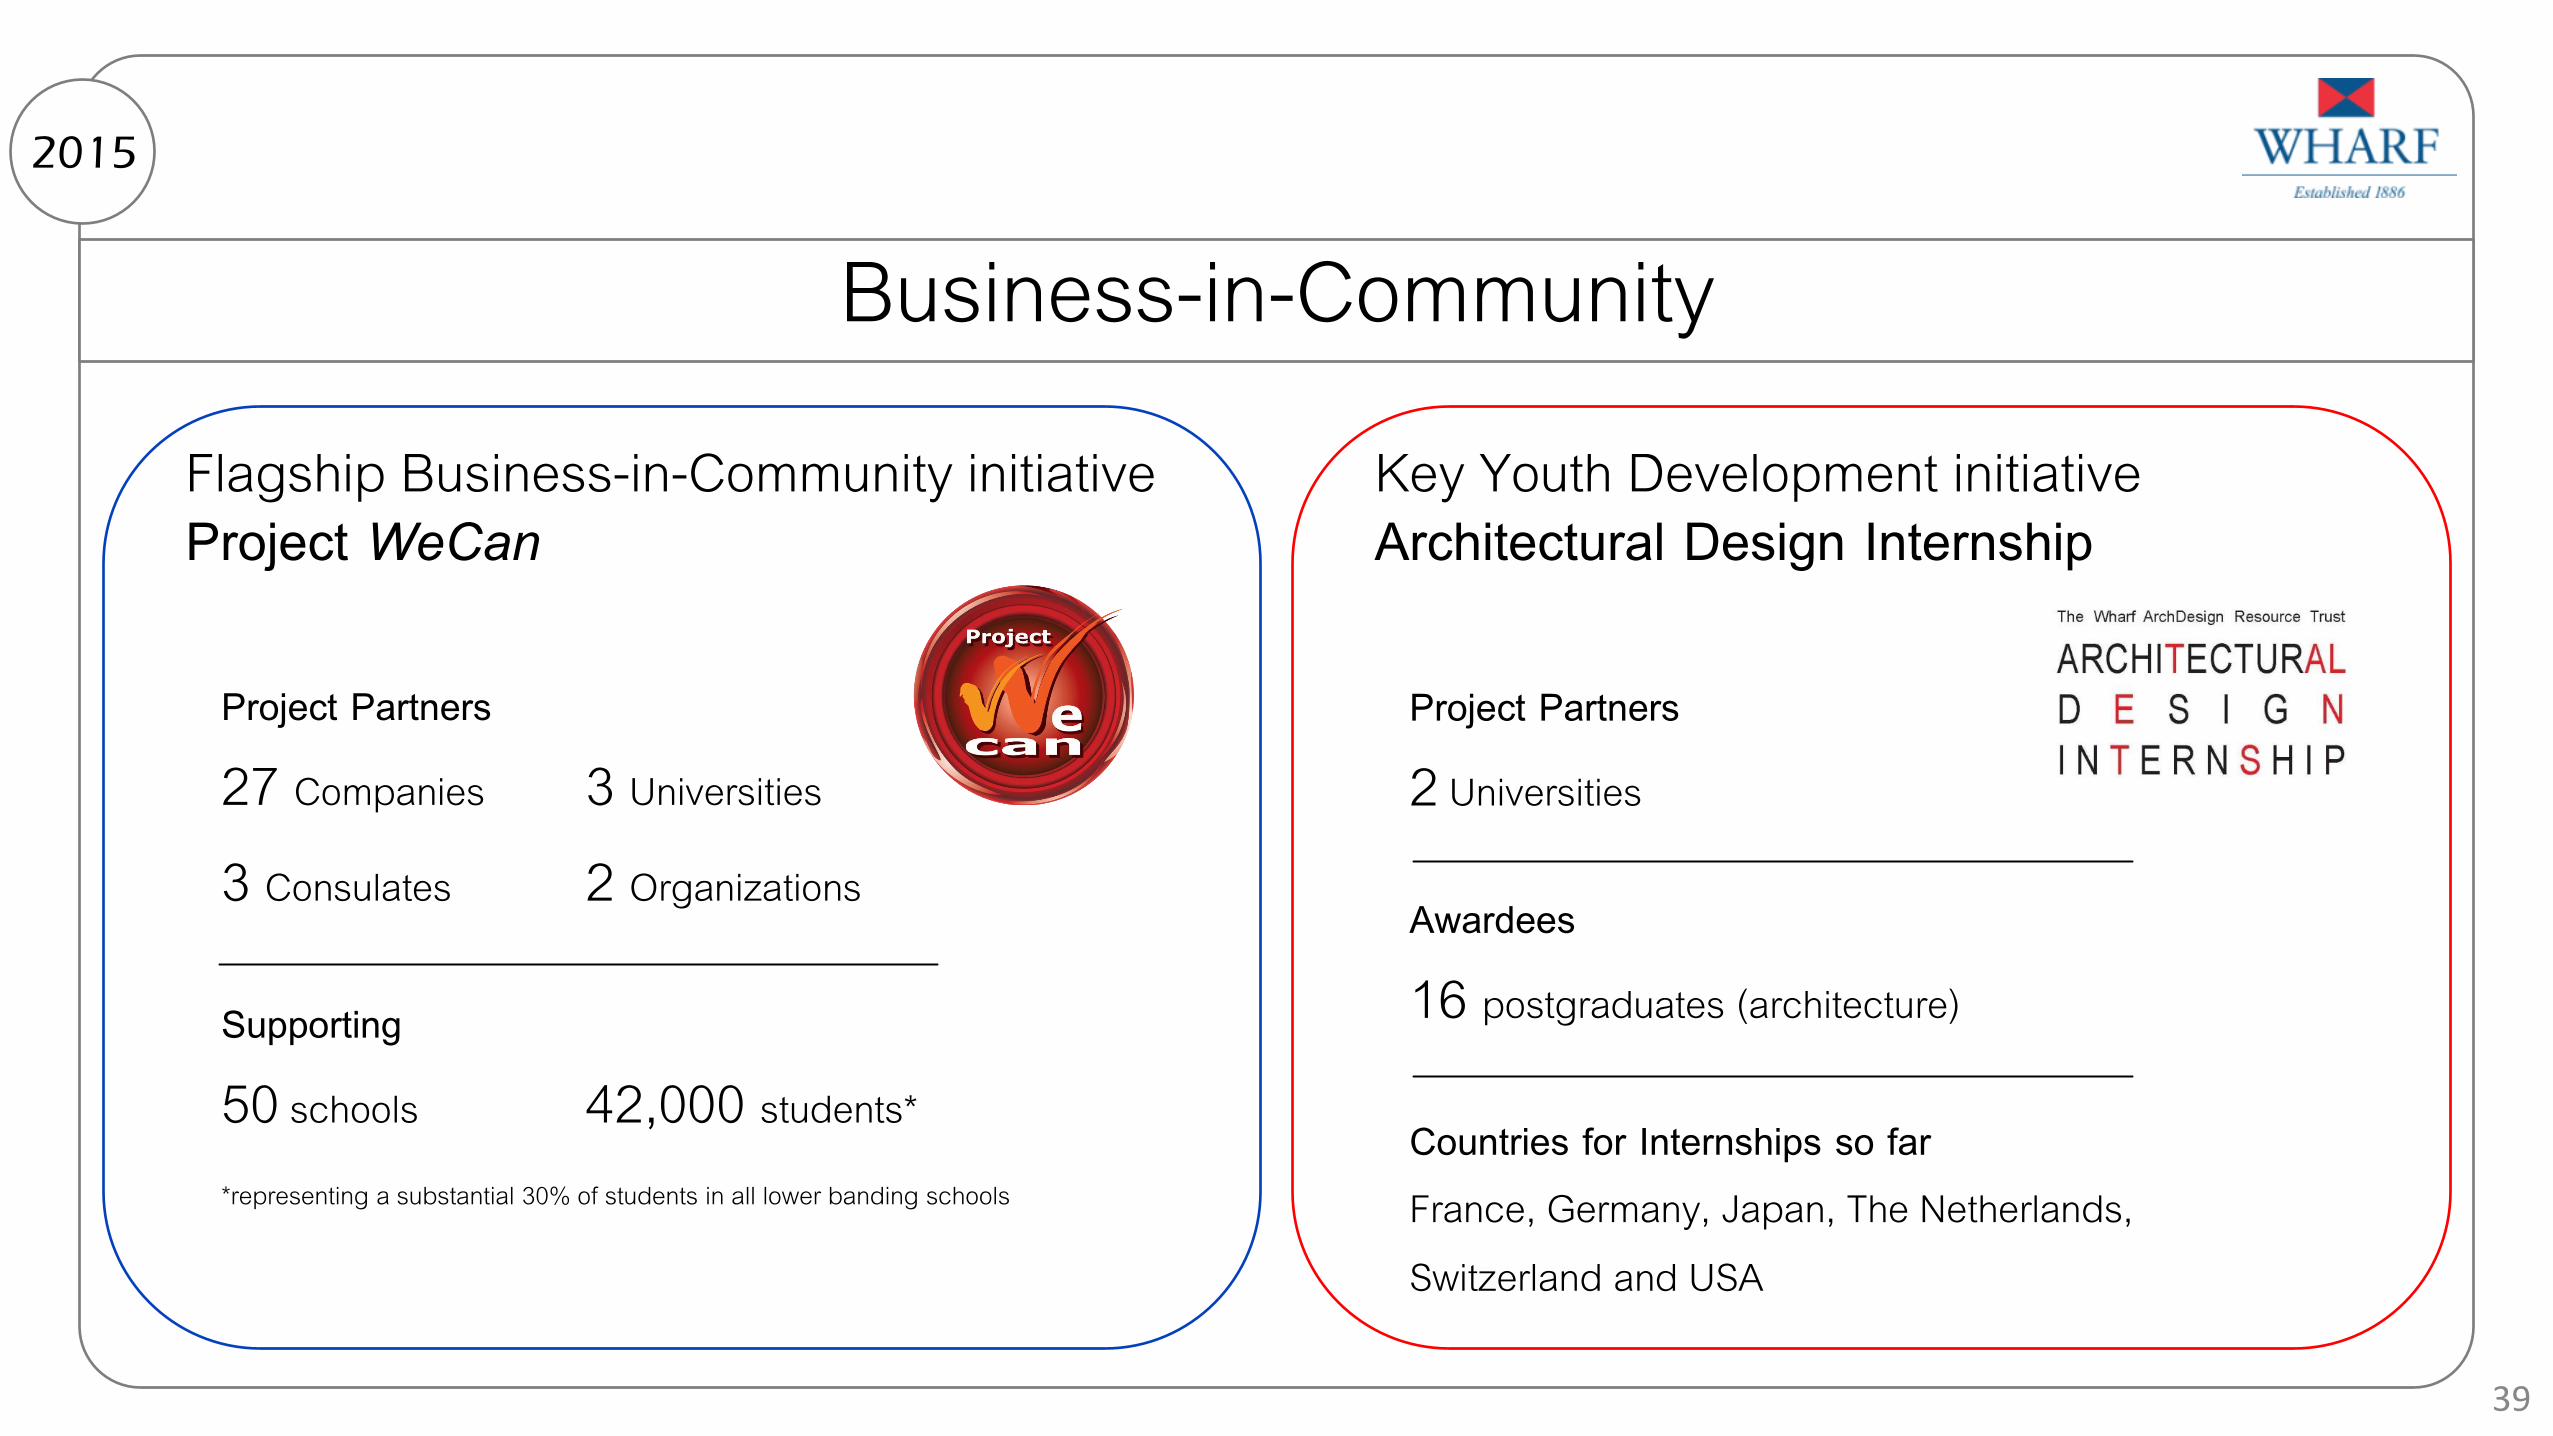
Business-in-Community
39
Flagship Business-in-Community initiative Project WeCan
Key Youth Development initiative Architectural Design Internship
Project Partners
27 Companies 3 Universities
3 Consulates 2 Organizations
Supporting
50 schools 42,000 students*
*representing a substantial 30% of students in all lower banding schools
Project Partners
2 Universities
Awardees
16 postgraduates (architecture)
Countries for Internships so far France, Germany, Japan, The Netherlands, Switzerland and USA
Appendix
40
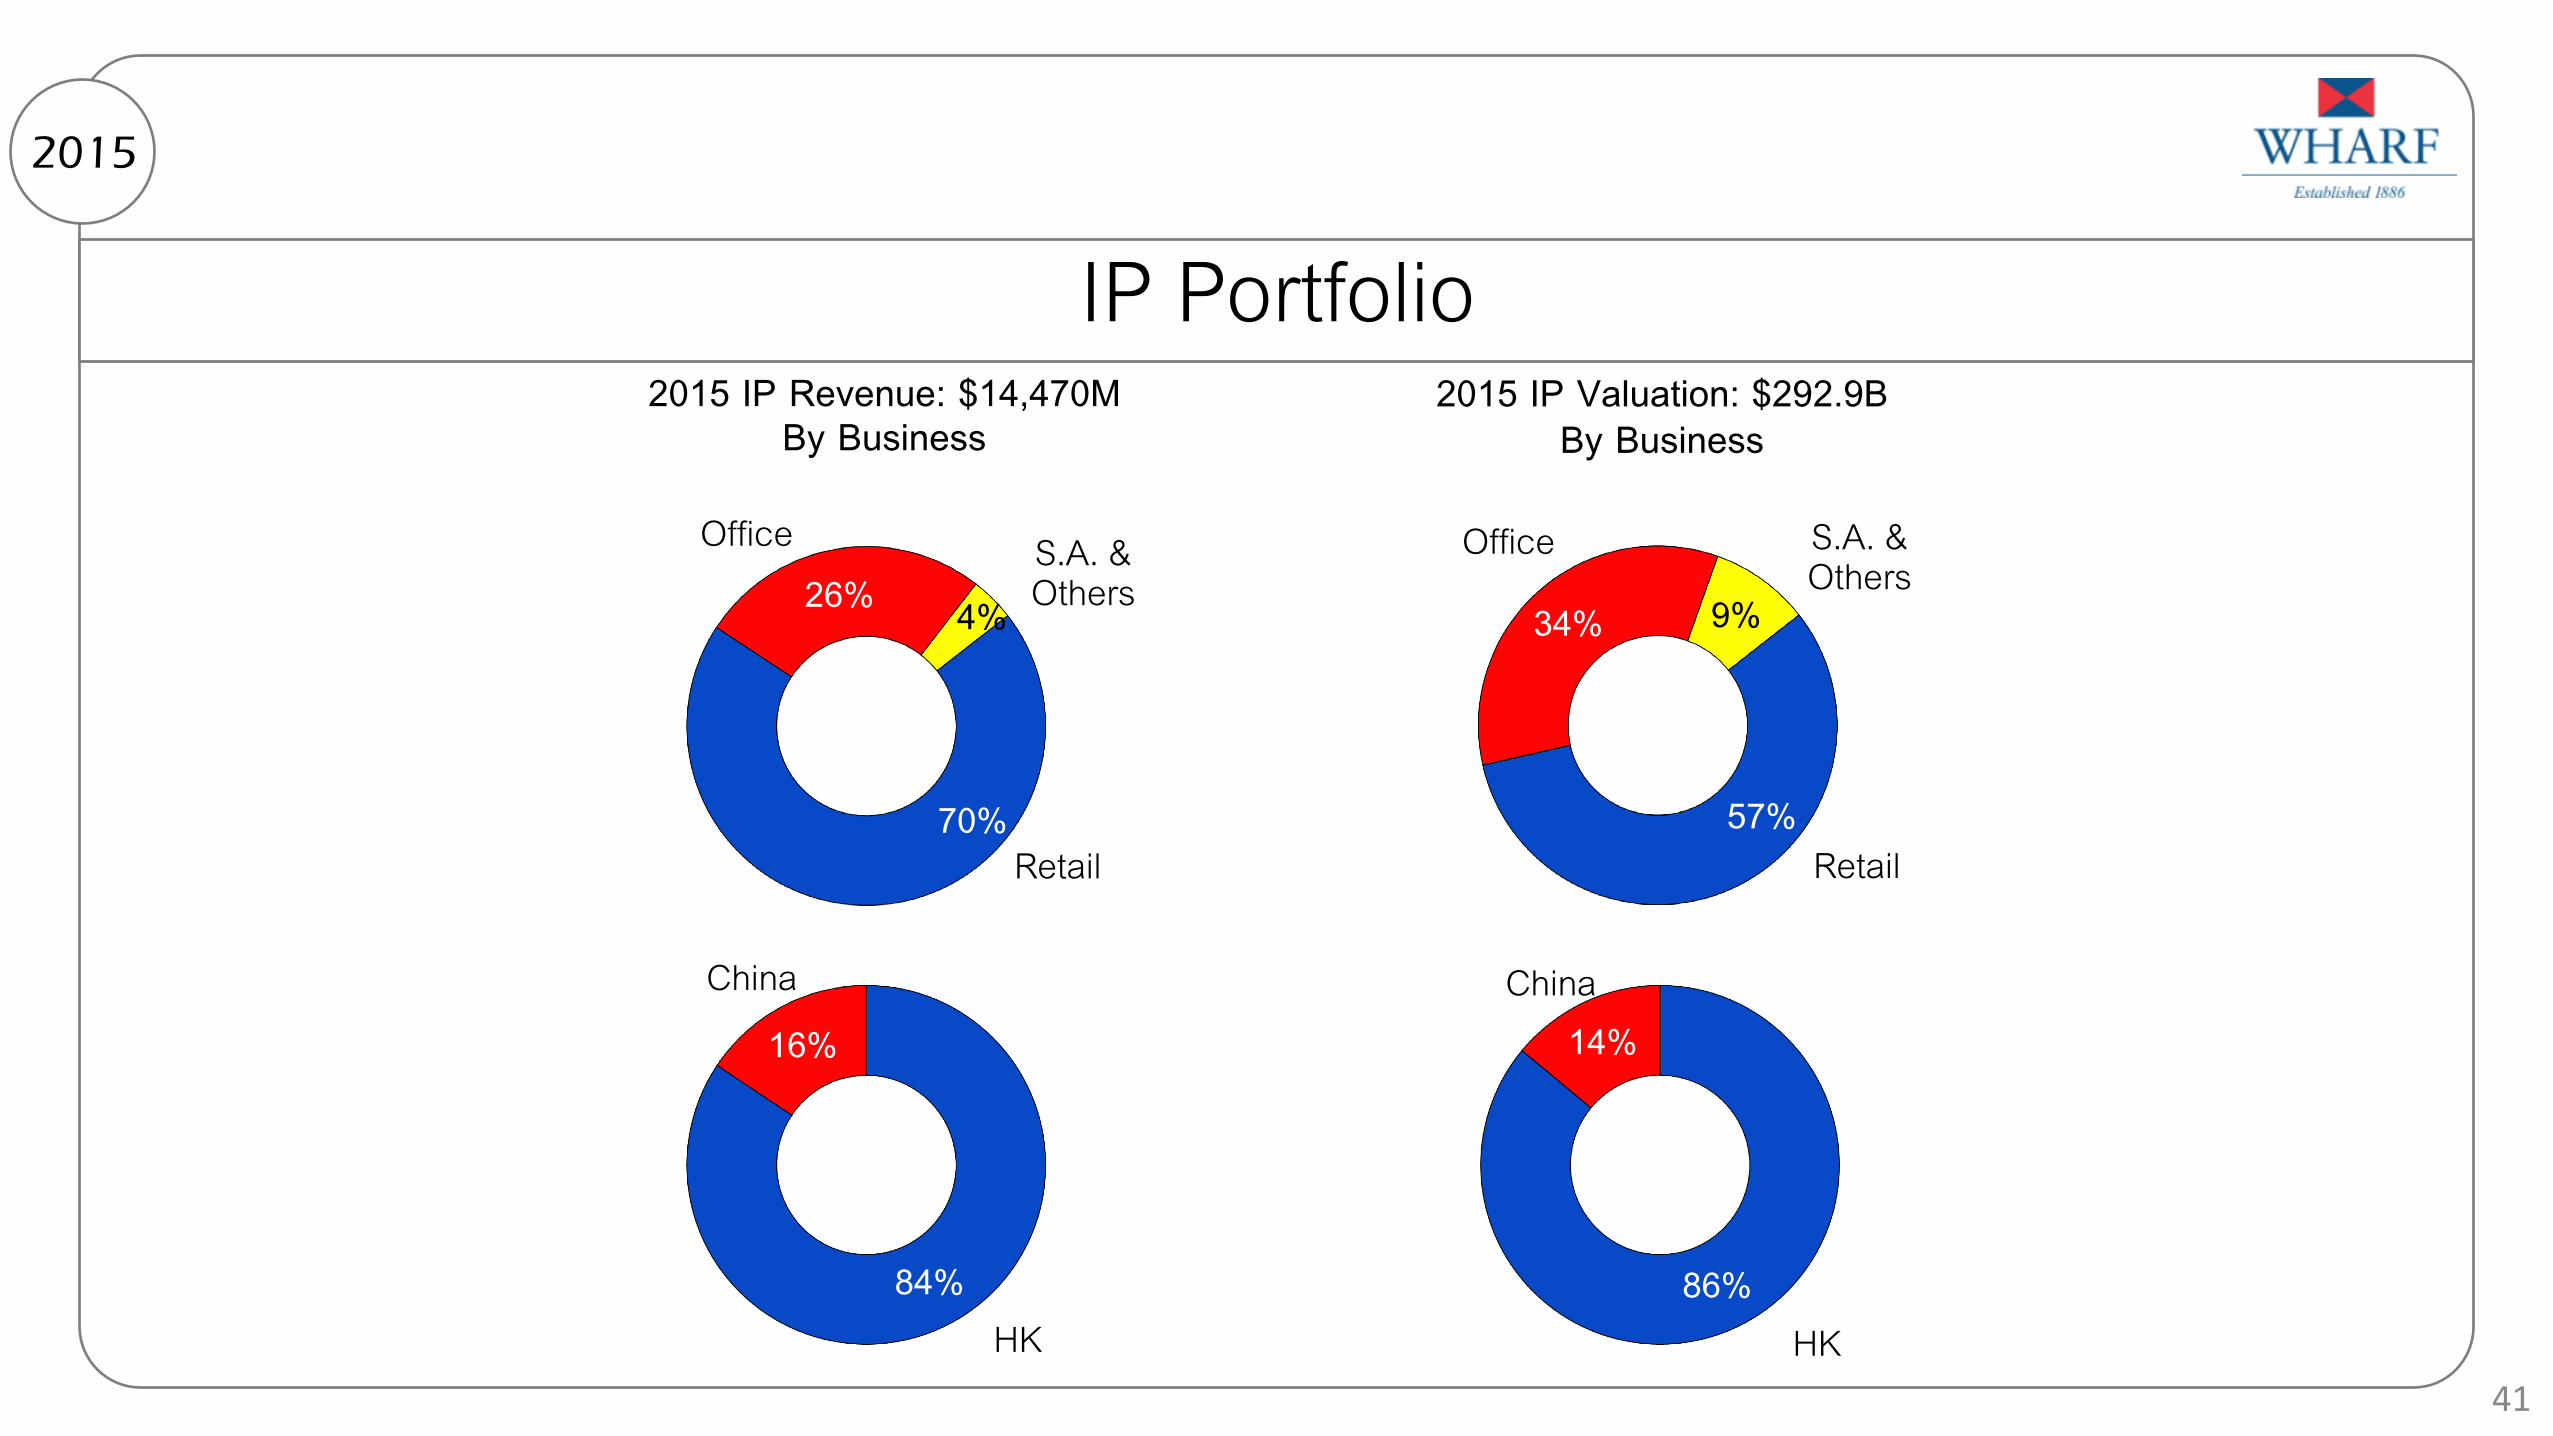
IP Portfolio 2015
70%
26% 4%
Office S.A. & Others
Retail 57%
34% 9%
Office S.A. & Others
Retail
84%
16% China
HK 86%
14% China
HK
2015 IP Revenue: $14,470M By Business
2015 IP Valuation: $292.9B By Business
41
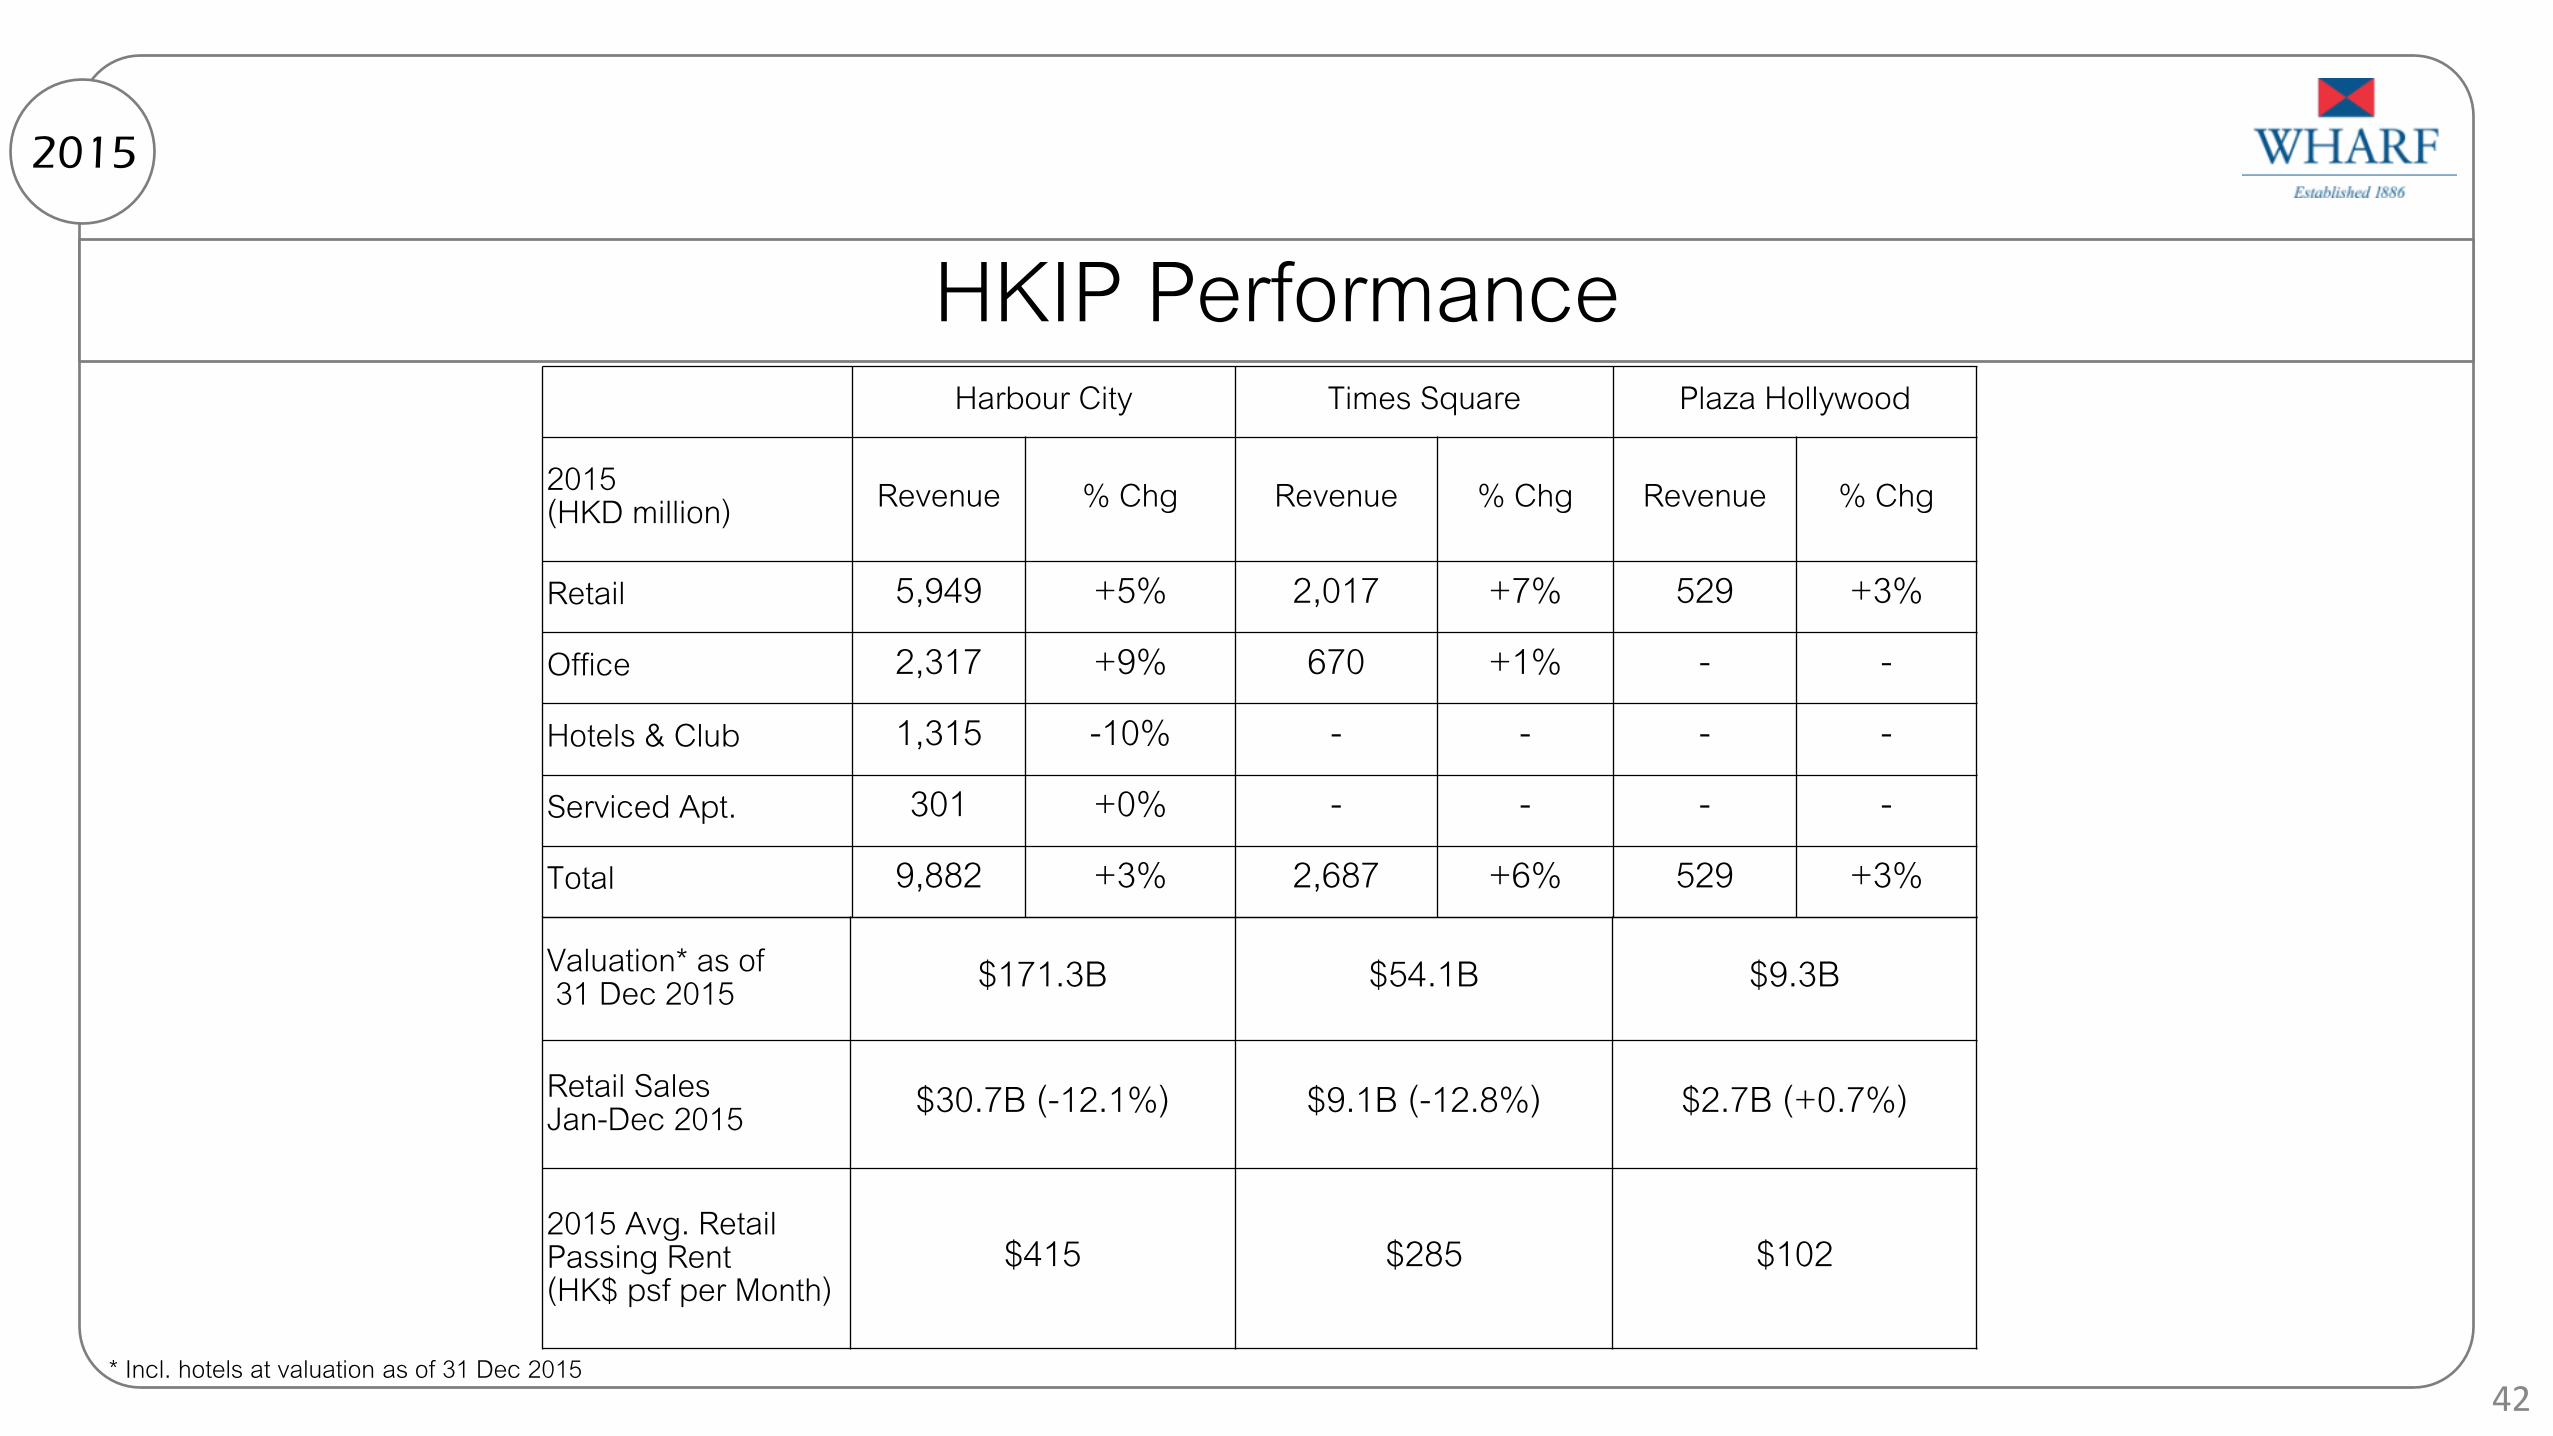
HKIP Performance 2015
Harbour City Times Square Plaza Hollywood
2015 (HKD million) Revenue % Chg Revenue % Chg Revenue % Chg
Retail 5,949 +5% 2,017 +7% 529 +3% Office 2,317 +9% 670 +1% - - Hotels & Club 1,315 -10% - - - - Serviced Apt. 301 +0% - - - - Total 9,882 +3% 2,687 +6% 529 +3%
Valuation* as of 31 Dec 2015 $171.3B $54.1B $9.3B
Retail Sales Jan-Dec 2015 $30.7B (-12.1%) $9.1B (-12.8%) $2.7B (+0.7%)
2015 Avg. Retail Passing Rent (HK$ psf per Month)
$415 $285 $102
* Incl. hotels at valuation as of 31 Dec 2015 42

Retail Performance 2015
80.0 114.0
138.0 163.5 167.6
2011 2012 2013 2014 2015
Retail Valuation (HKD billion)
4.8 5.5
6.4
7.8 8.4
2011 2012 2013 2014 2015
Retail Operating Profit (HKD billion)
43

Commercial Properties Pipeline 2015
14.0 14.2 14.2 14.2 14.5
5.7 5.7 5.7 5.7 5.7
3.9 6.6 7.4 8.2 8.2 2.0 2.0
6.9 6.9 2.2 2.2
2.7 2.7 0.8 0.8 4.0
8.7
11.0
2013 2014 2015 2016 2017
Commercial Properties Completion Schedule (Million s.f)
Changsha IFS
Suzhou IFS
Changsha Outlets
Wuxi IFS
Chongqing IFS*
Chengdu IFS
Other China Commercial Prop.
HK Commercial Prop.
53.8M s.f
Total development area, incl. basement area & carpark *Gross Basis
44

China Commercial Properties Pipeline 2015
645,000 s.m.*
Retail, Grade A offices & hotel
Retail 102,000 s.m.
300m tower
Jiangbei new CBD
50:50 JV with COLI
2016
368,000 s.m.
Grade A offices, apartments & hotel
No Retail
450m tower
Suzhou new CBD
80:20 JV with Genway
2017
250,000 s.m.
Grade A offices & hotel
No Retail
339m tower
Taihu Plaza CBD
wholly-owned
2016
1,026,000 s.m.
Retail, Grade A offices & hotel
Retail 230,000 s.m.
452m tower
Prime city center
wholly-owned
2017
Wuxi IFS Chongqing IFS Suzhou IFS
* Gross area
Changsha IFS
45

Chengdu City Profile
• Financial Center & Trading Hub in SW China
• Thriving City for Business Start-Ups
2015
46
4%
44%
53%
Tertiary Primary
Secondary
2015 Tertiary Industry +9.0% 53% of CD GDP (National: 50.5%)
Chengdu
Population 14 million
2015 GDP +7.9% (National Avg.: +6.9%)
2015 Retail Sales +10.7%
2015 Disposable Income per Capita
RMB33,476 +8.0%
No. of Fortune 500 Companies in 2015 299
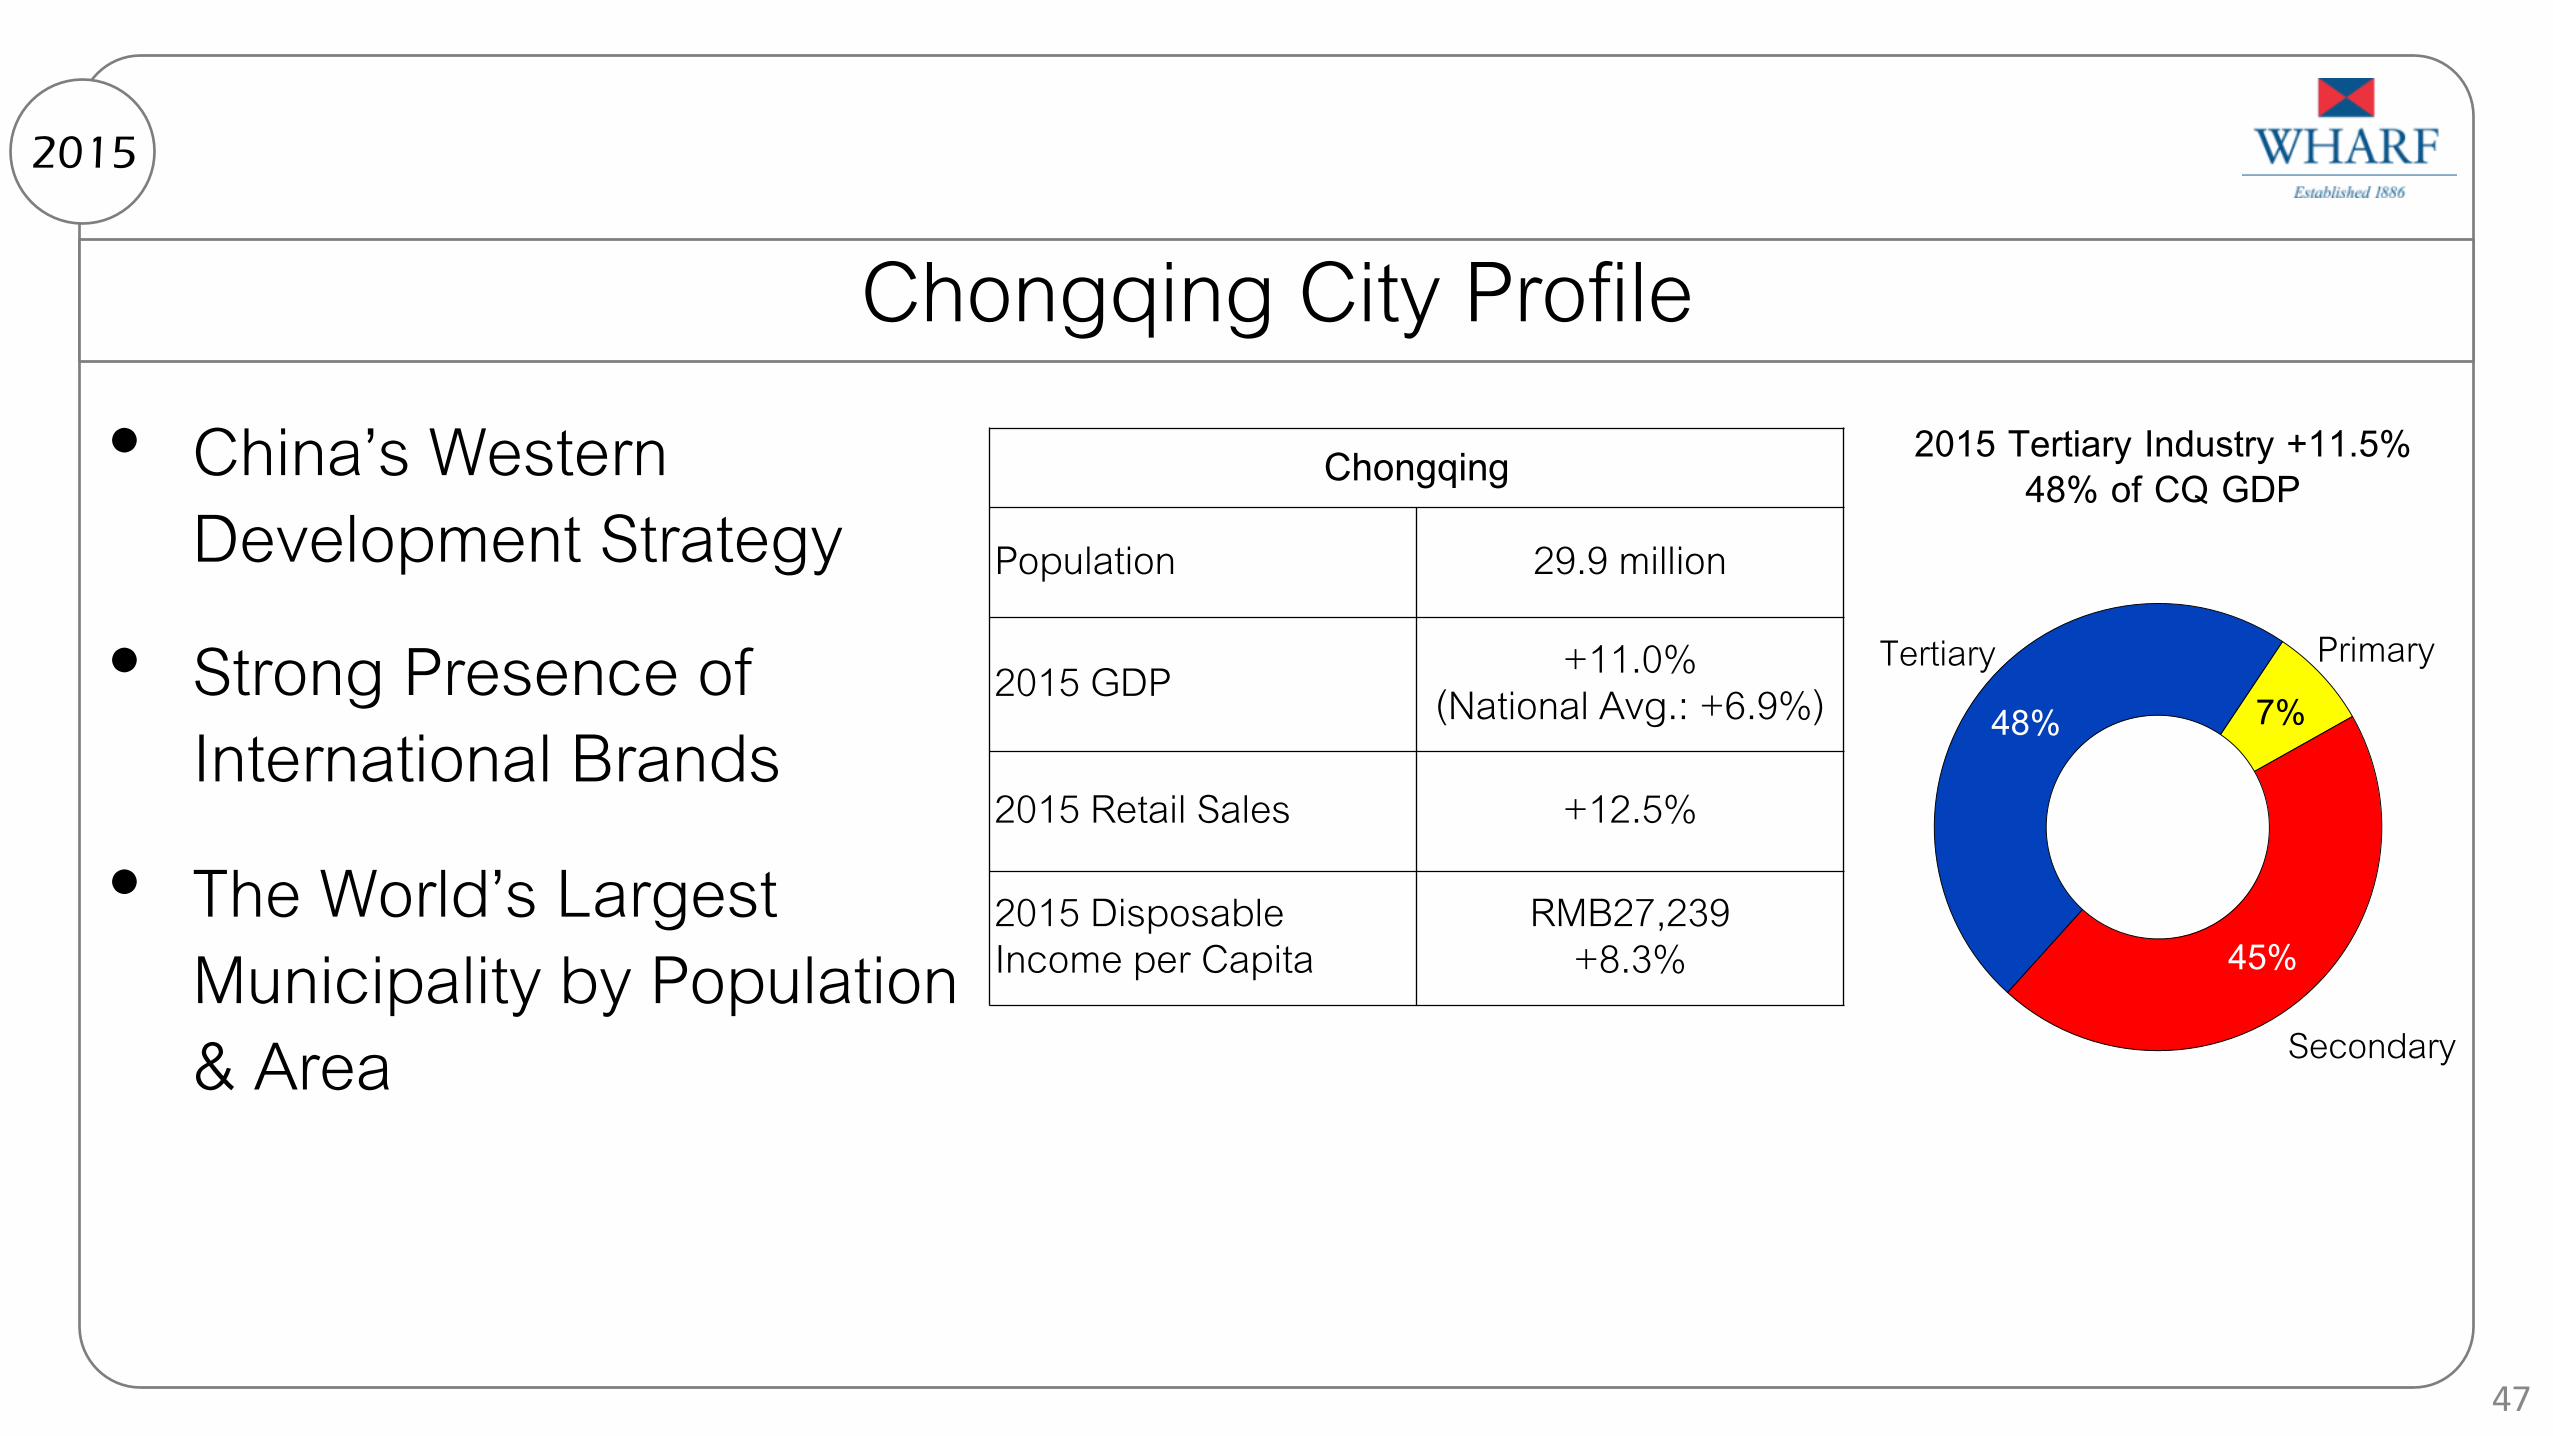
Chongqing City Profile • China’s Western
Development Strategy
• Strong Presence of International Brands
• The World’s Largest Municipality by Population & Area
2015
47
7%
45%
48% Tertiary Primary
Secondary
2015 Tertiary Industry +11.5% 48% of CQ GDP Chongqing
Population 29.9 million
2015 GDP +11.0% (National Avg.: +6.9%)
2015 Retail Sales +12.5%
2015 Disposable Income per Capita
RMB27,239 +8.3%

Changsha City Profile • Hub City in Central China
• Beneficiary of China’s “Rise of Central China” Campaign
• Important Entertainment Center in China – Presence of Hunan Satellite TV
2015
48
4%
53%
43% Tertiary Primary
Secondary
2015 Tertiary Industry +12.1% 43% of CS GDP Changsha
Population 7.3 million
2015 GDP +9.9% (National Avg.: +6.9%)
2015 Retail Sales +12.1%
2015 Disposable Income per Capita
RMB39,961 +8.5%
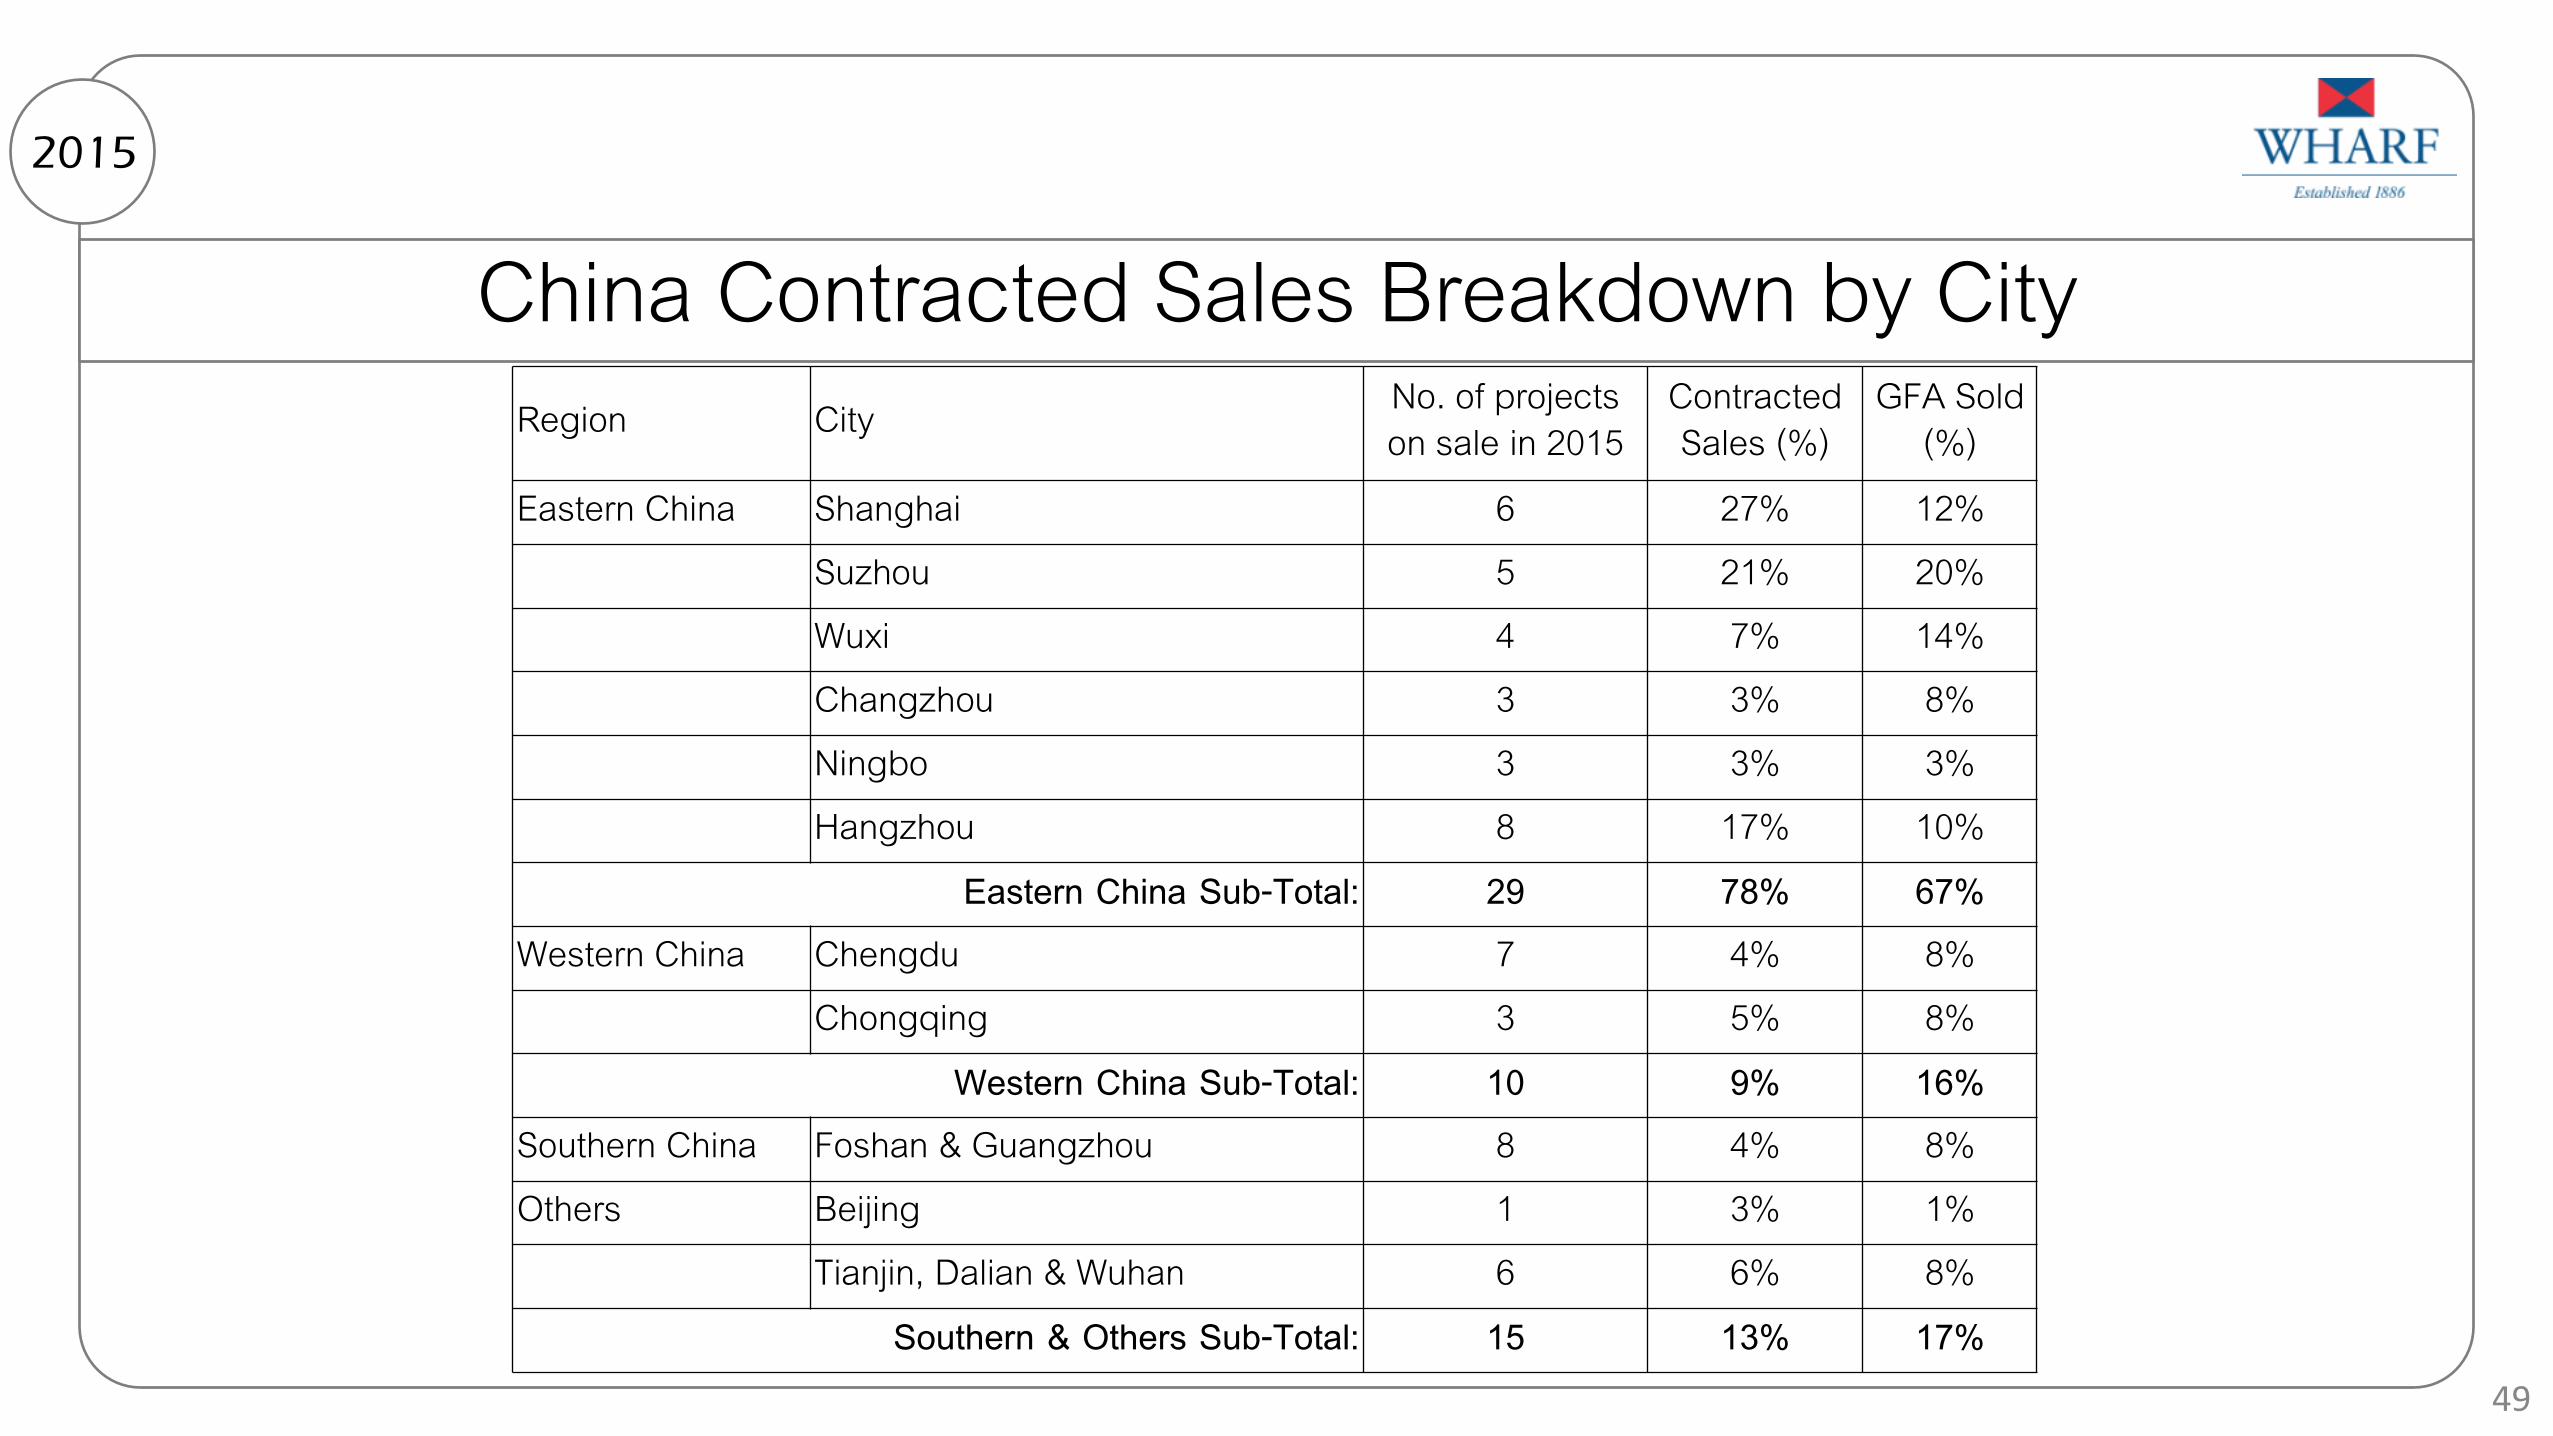
China Contracted Sales Breakdown by City 2015
49
Region City No. of projects on sale in 2015
Contracted Sales (%)
GFA Sold (%)
Eastern China Shanghai 6 27% 12% Suzhou 5 21% 20% Wuxi 4 7% 14% Changzhou 3 3% 8% Ningbo 3 3% 3% Hangzhou 8 17% 10%
Eastern China Sub-Total: 29 78% 67% Western China Chengdu 7 4% 8%
Chongqing 3 5% 8% Western China Sub-Total: 10 9% 16%
Southern China Foshan & Guangzhou 8 4% 8% Others Beijing 1 3% 1%
Tianjin, Dalian & Wuhan 6 6% 8% Southern & Others Sub-Total: 15 13% 17%
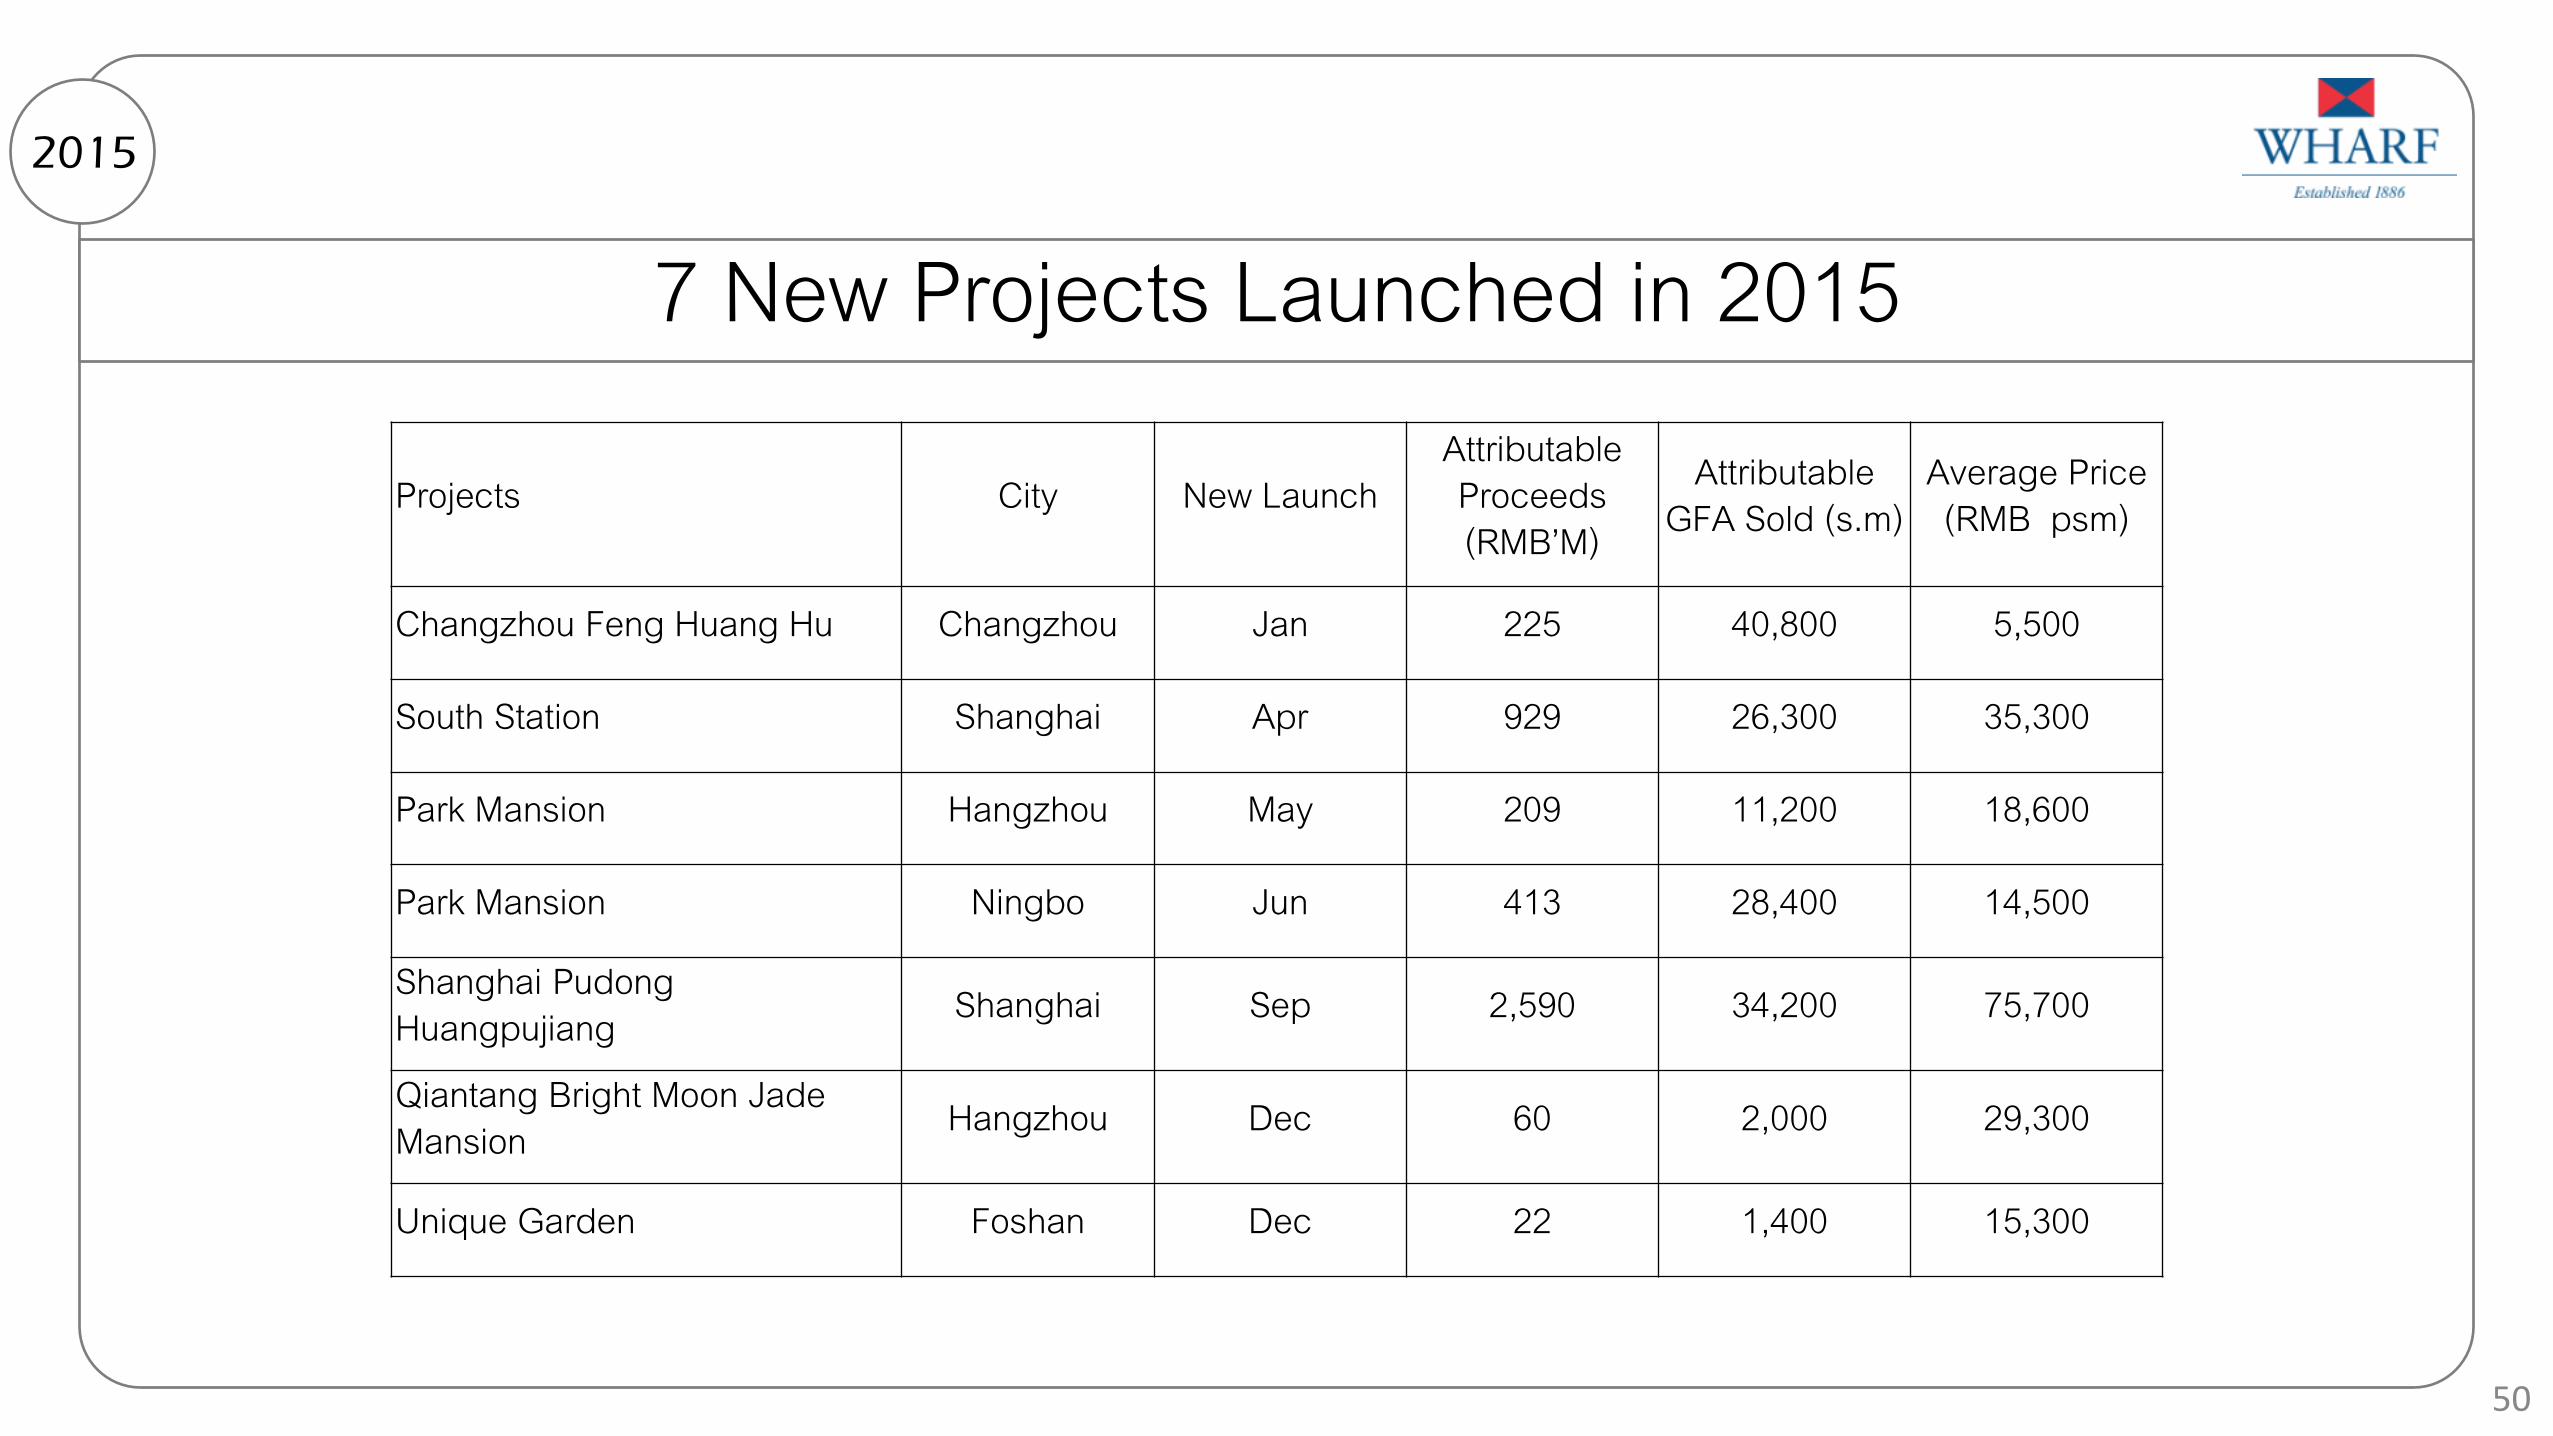
7 New Projects Launched in 2015 2015
50
Projects City New Launch Attributable Proceeds (RMB’M)
Attributable GFA Sold (s.m)
Average Price (RMB psm)
Changzhou Feng Huang Hu Changzhou Jan 225 40,800 5,500
South Station Shanghai Apr 929 26,300 35,300
Park Mansion Hangzhou May 209 11,200 18,600
Park Mansion Ningbo Jun 413 28,400 14,500
Shanghai Pudong Huangpujiang Shanghai Sep 2,590 34,200 75,700
Qiantang Bright Moon Jade Mansion Hangzhou Dec 60 2,000 29,300
Unique Garden Foshan Dec 22 1,400 15,300
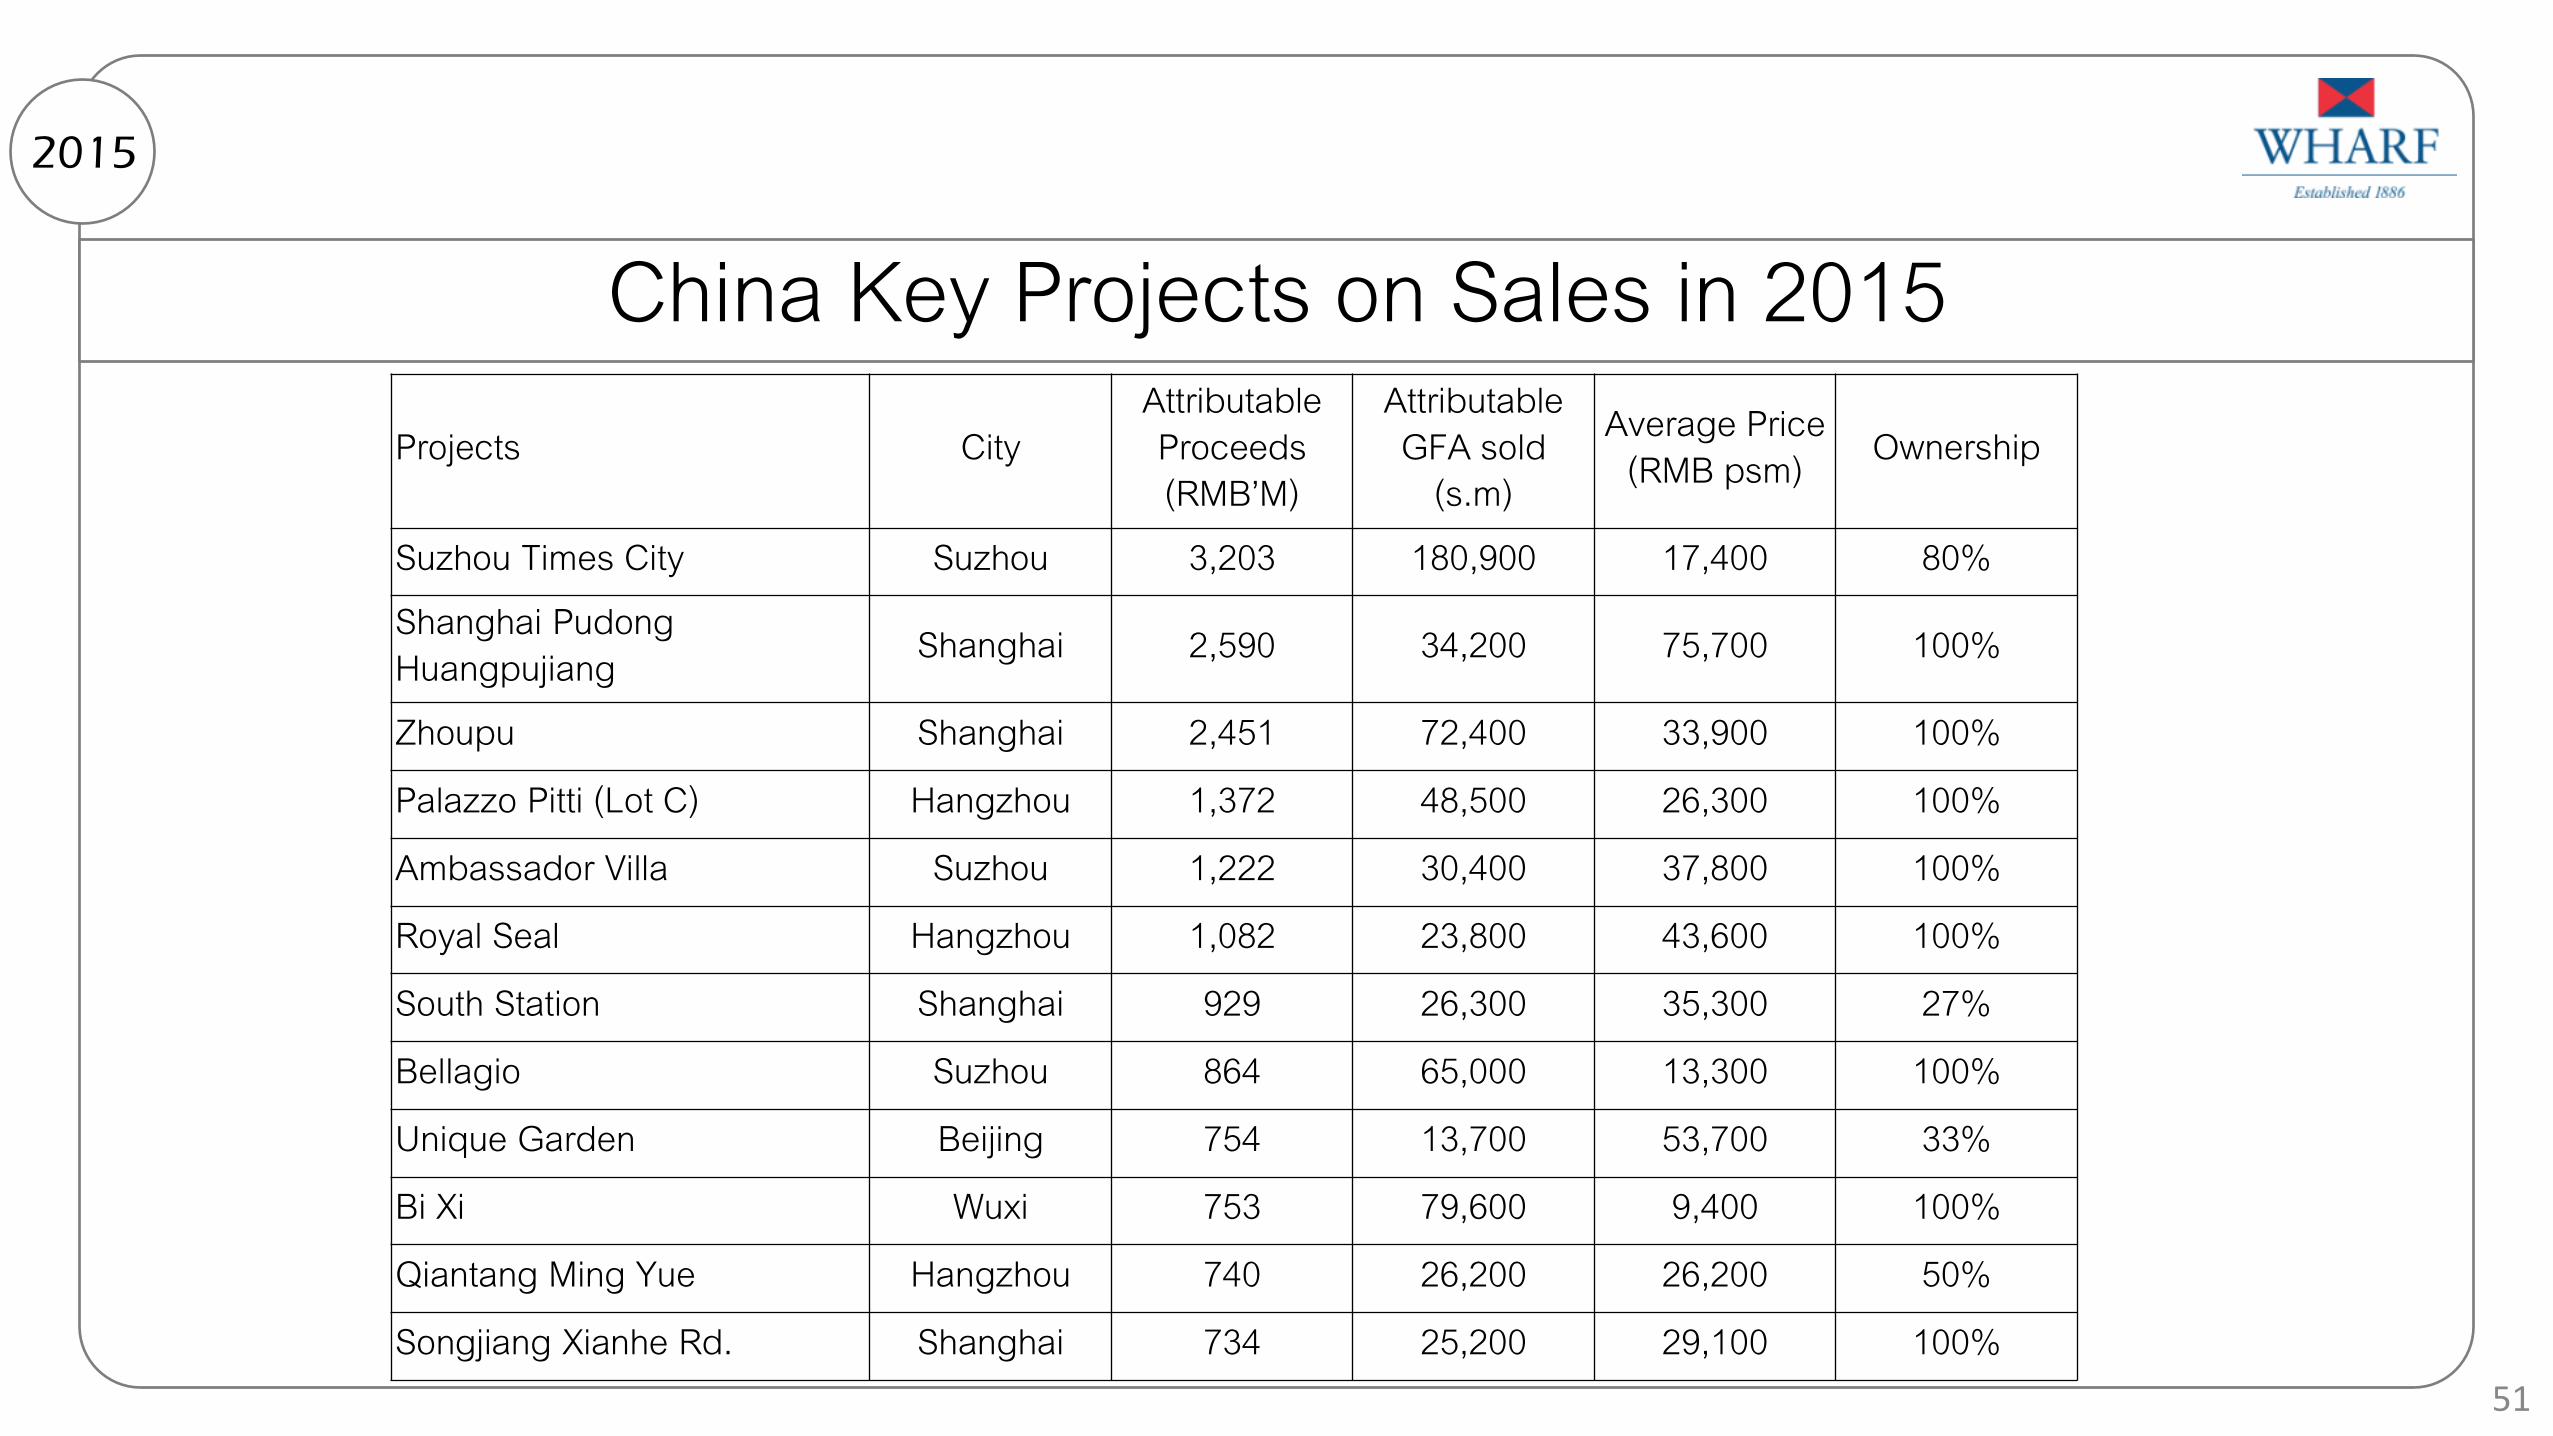
China Key Projects on Sales in 2015 2015
51
Projects City Attributable Proceeds (RMB’M)
Attributable GFA sold
(s.m) Average Price
(RMB psm) Ownership
Suzhou Times City Suzhou 3,203 180,900 17,400 80% Shanghai Pudong Huangpujiang Shanghai 2,590 34,200 75,700 100%
Zhoupu Shanghai 2,451 72,400 33,900 100% Palazzo Pitti (Lot C) Hangzhou 1,372 48,500 26,300 100% Ambassador Villa Suzhou 1,222 30,400 37,800 100% Royal Seal Hangzhou 1,082 23,800 43,600 100% South Station Shanghai 929 26,300 35,300 27% Bellagio Suzhou 864 65,000 13,300 100% Unique Garden Beijing 754 13,700 53,700 33% Bi Xi Wuxi 753 79,600 9,400 100% Qiantang Ming Yue Hangzhou 740 26,200 26,200 50% Songjiang Xianhe Rd. Shanghai 734 25,200 29,100 100%
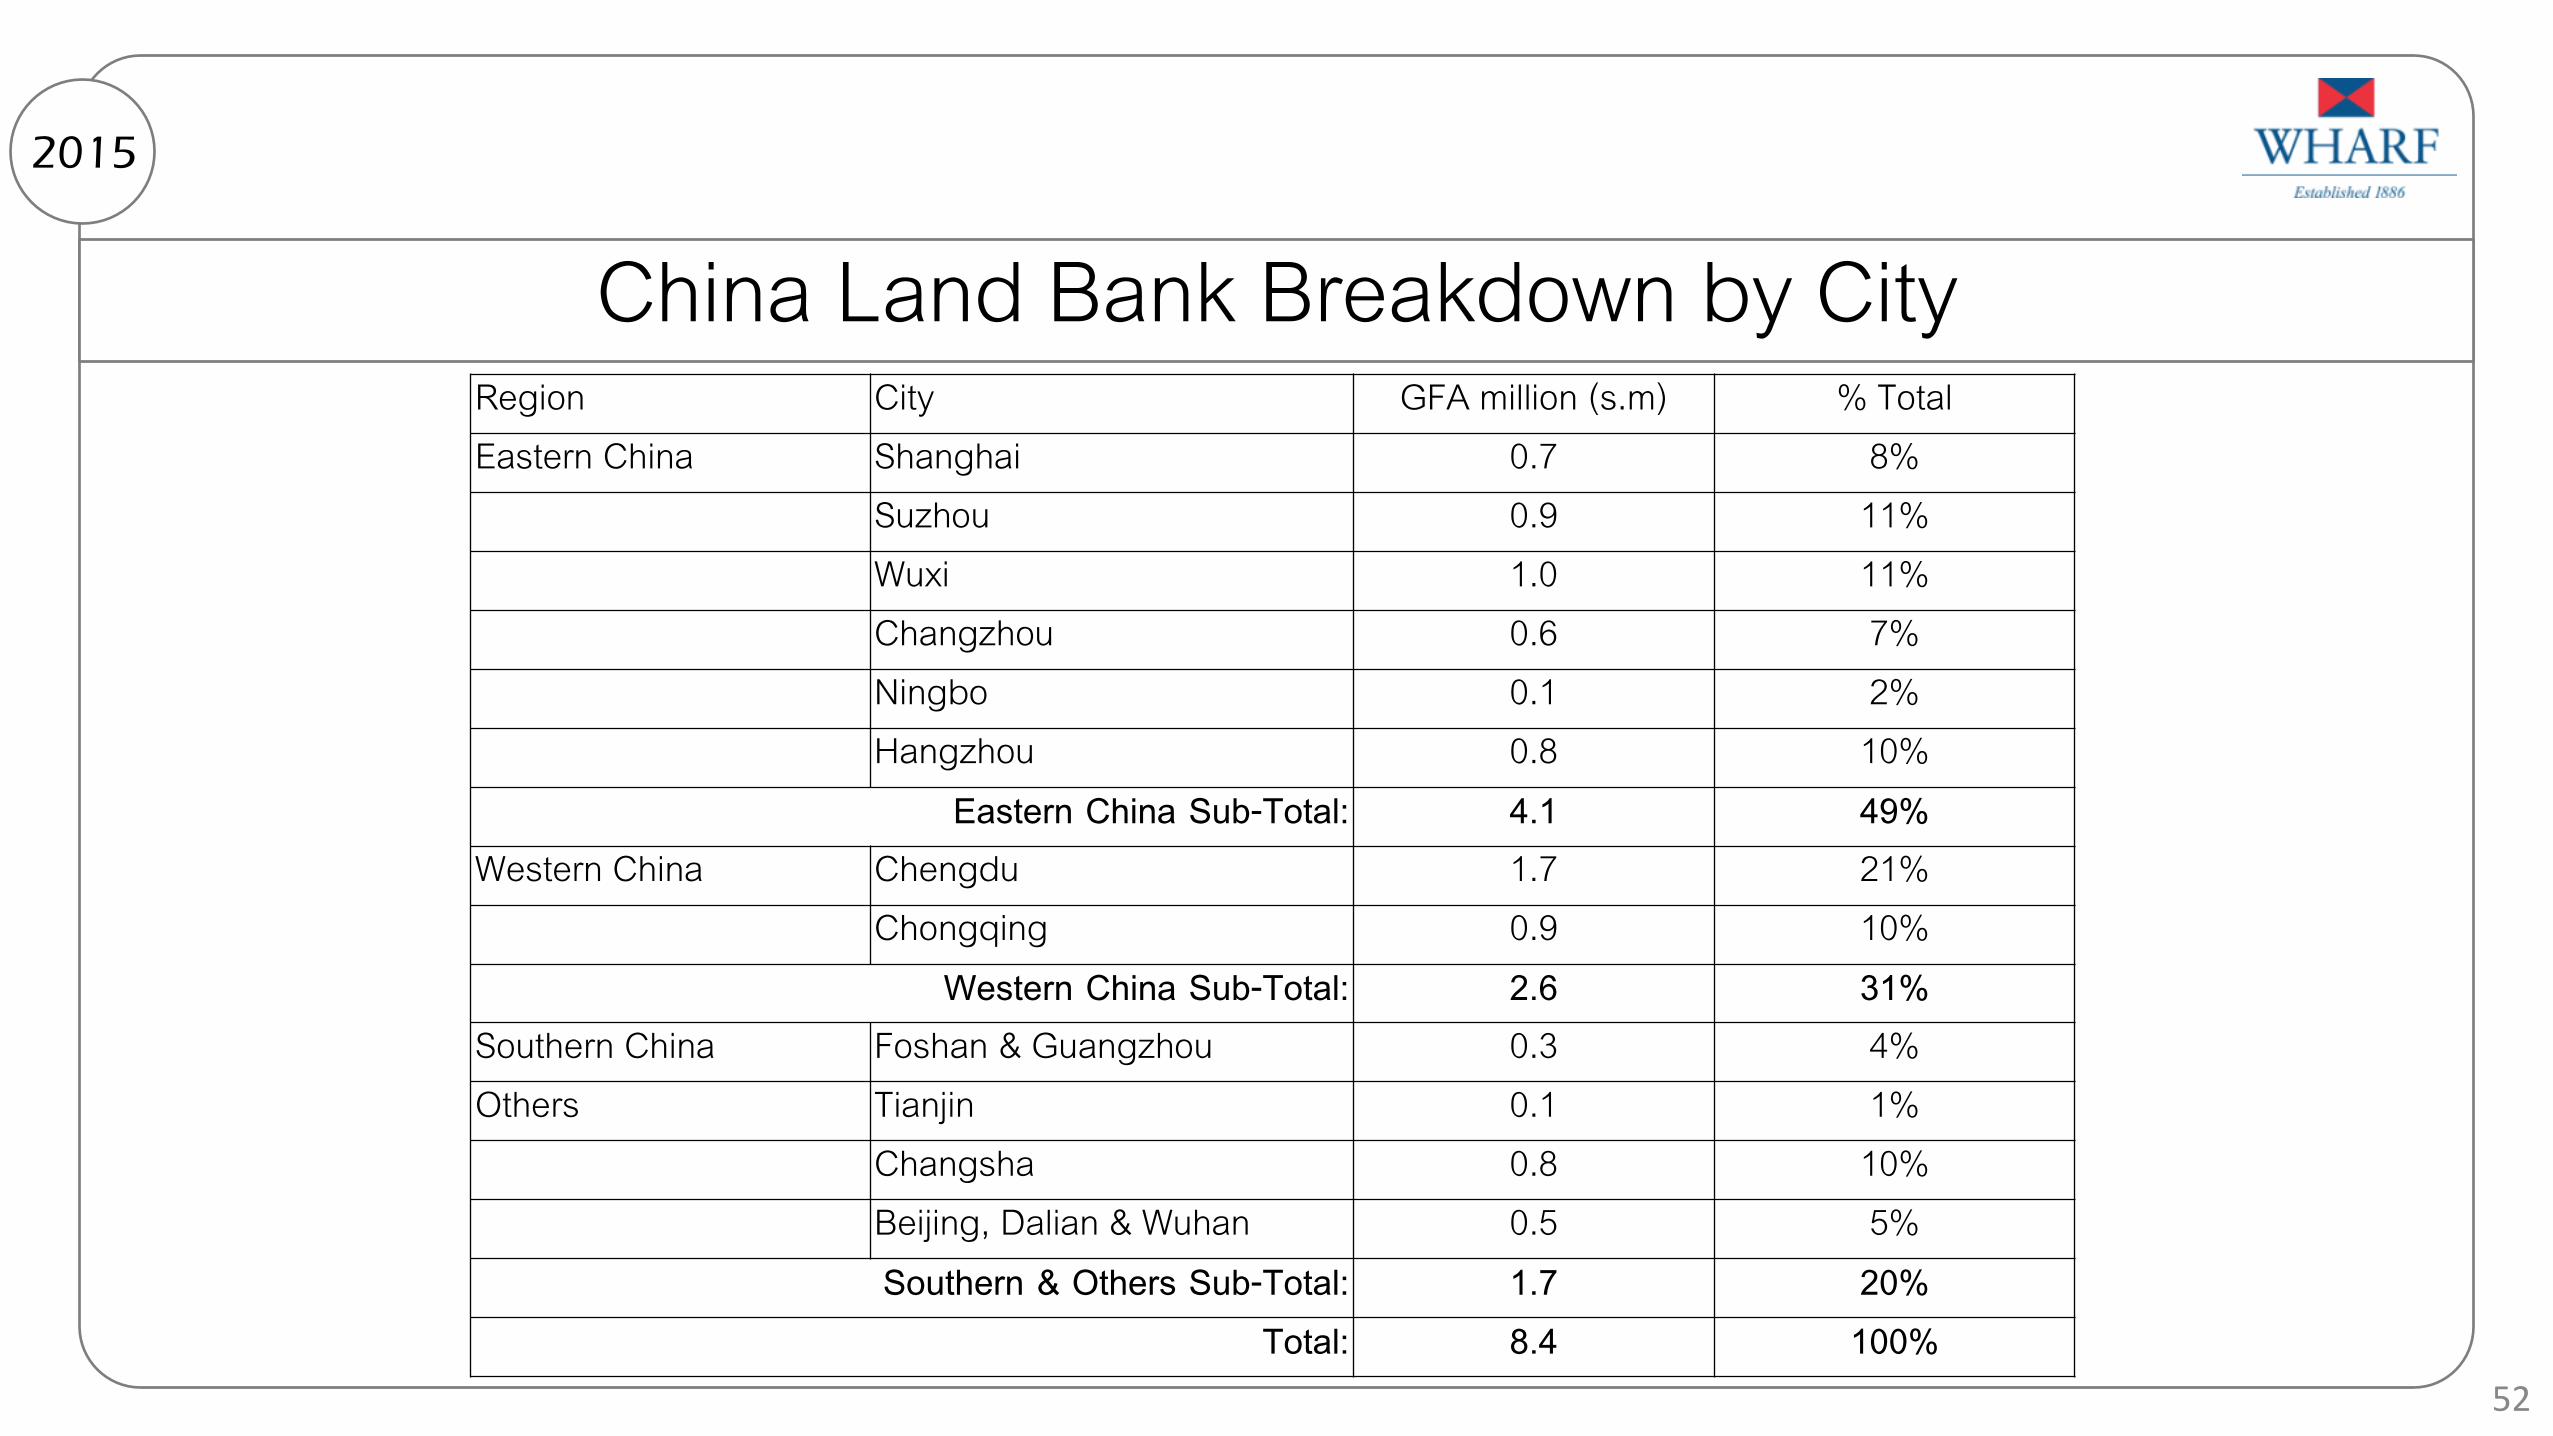
China Land Bank Breakdown by City 2015
52
Region City GFA million (s.m) % Total Eastern China Shanghai 0.7 8%
Suzhou 0.9 11% Wuxi 1.0 11% Changzhou 0.6 7% Ningbo 0.1 2% Hangzhou 0.8 10%
Eastern China Sub-Total: 4.1 49% Western China Chengdu 1.7 21%
Chongqing 0.9 10% Western China Sub-Total: 2.6 31%
Southern China Foshan & Guangzhou 0.3 4% Others Tianjin 0.1 1%
Changsha 0.8 10% Beijing, Dalian & Wuhan 0.5 5% Southern & Others Sub-Total: 1.7 20%
Total: 8.4 100%
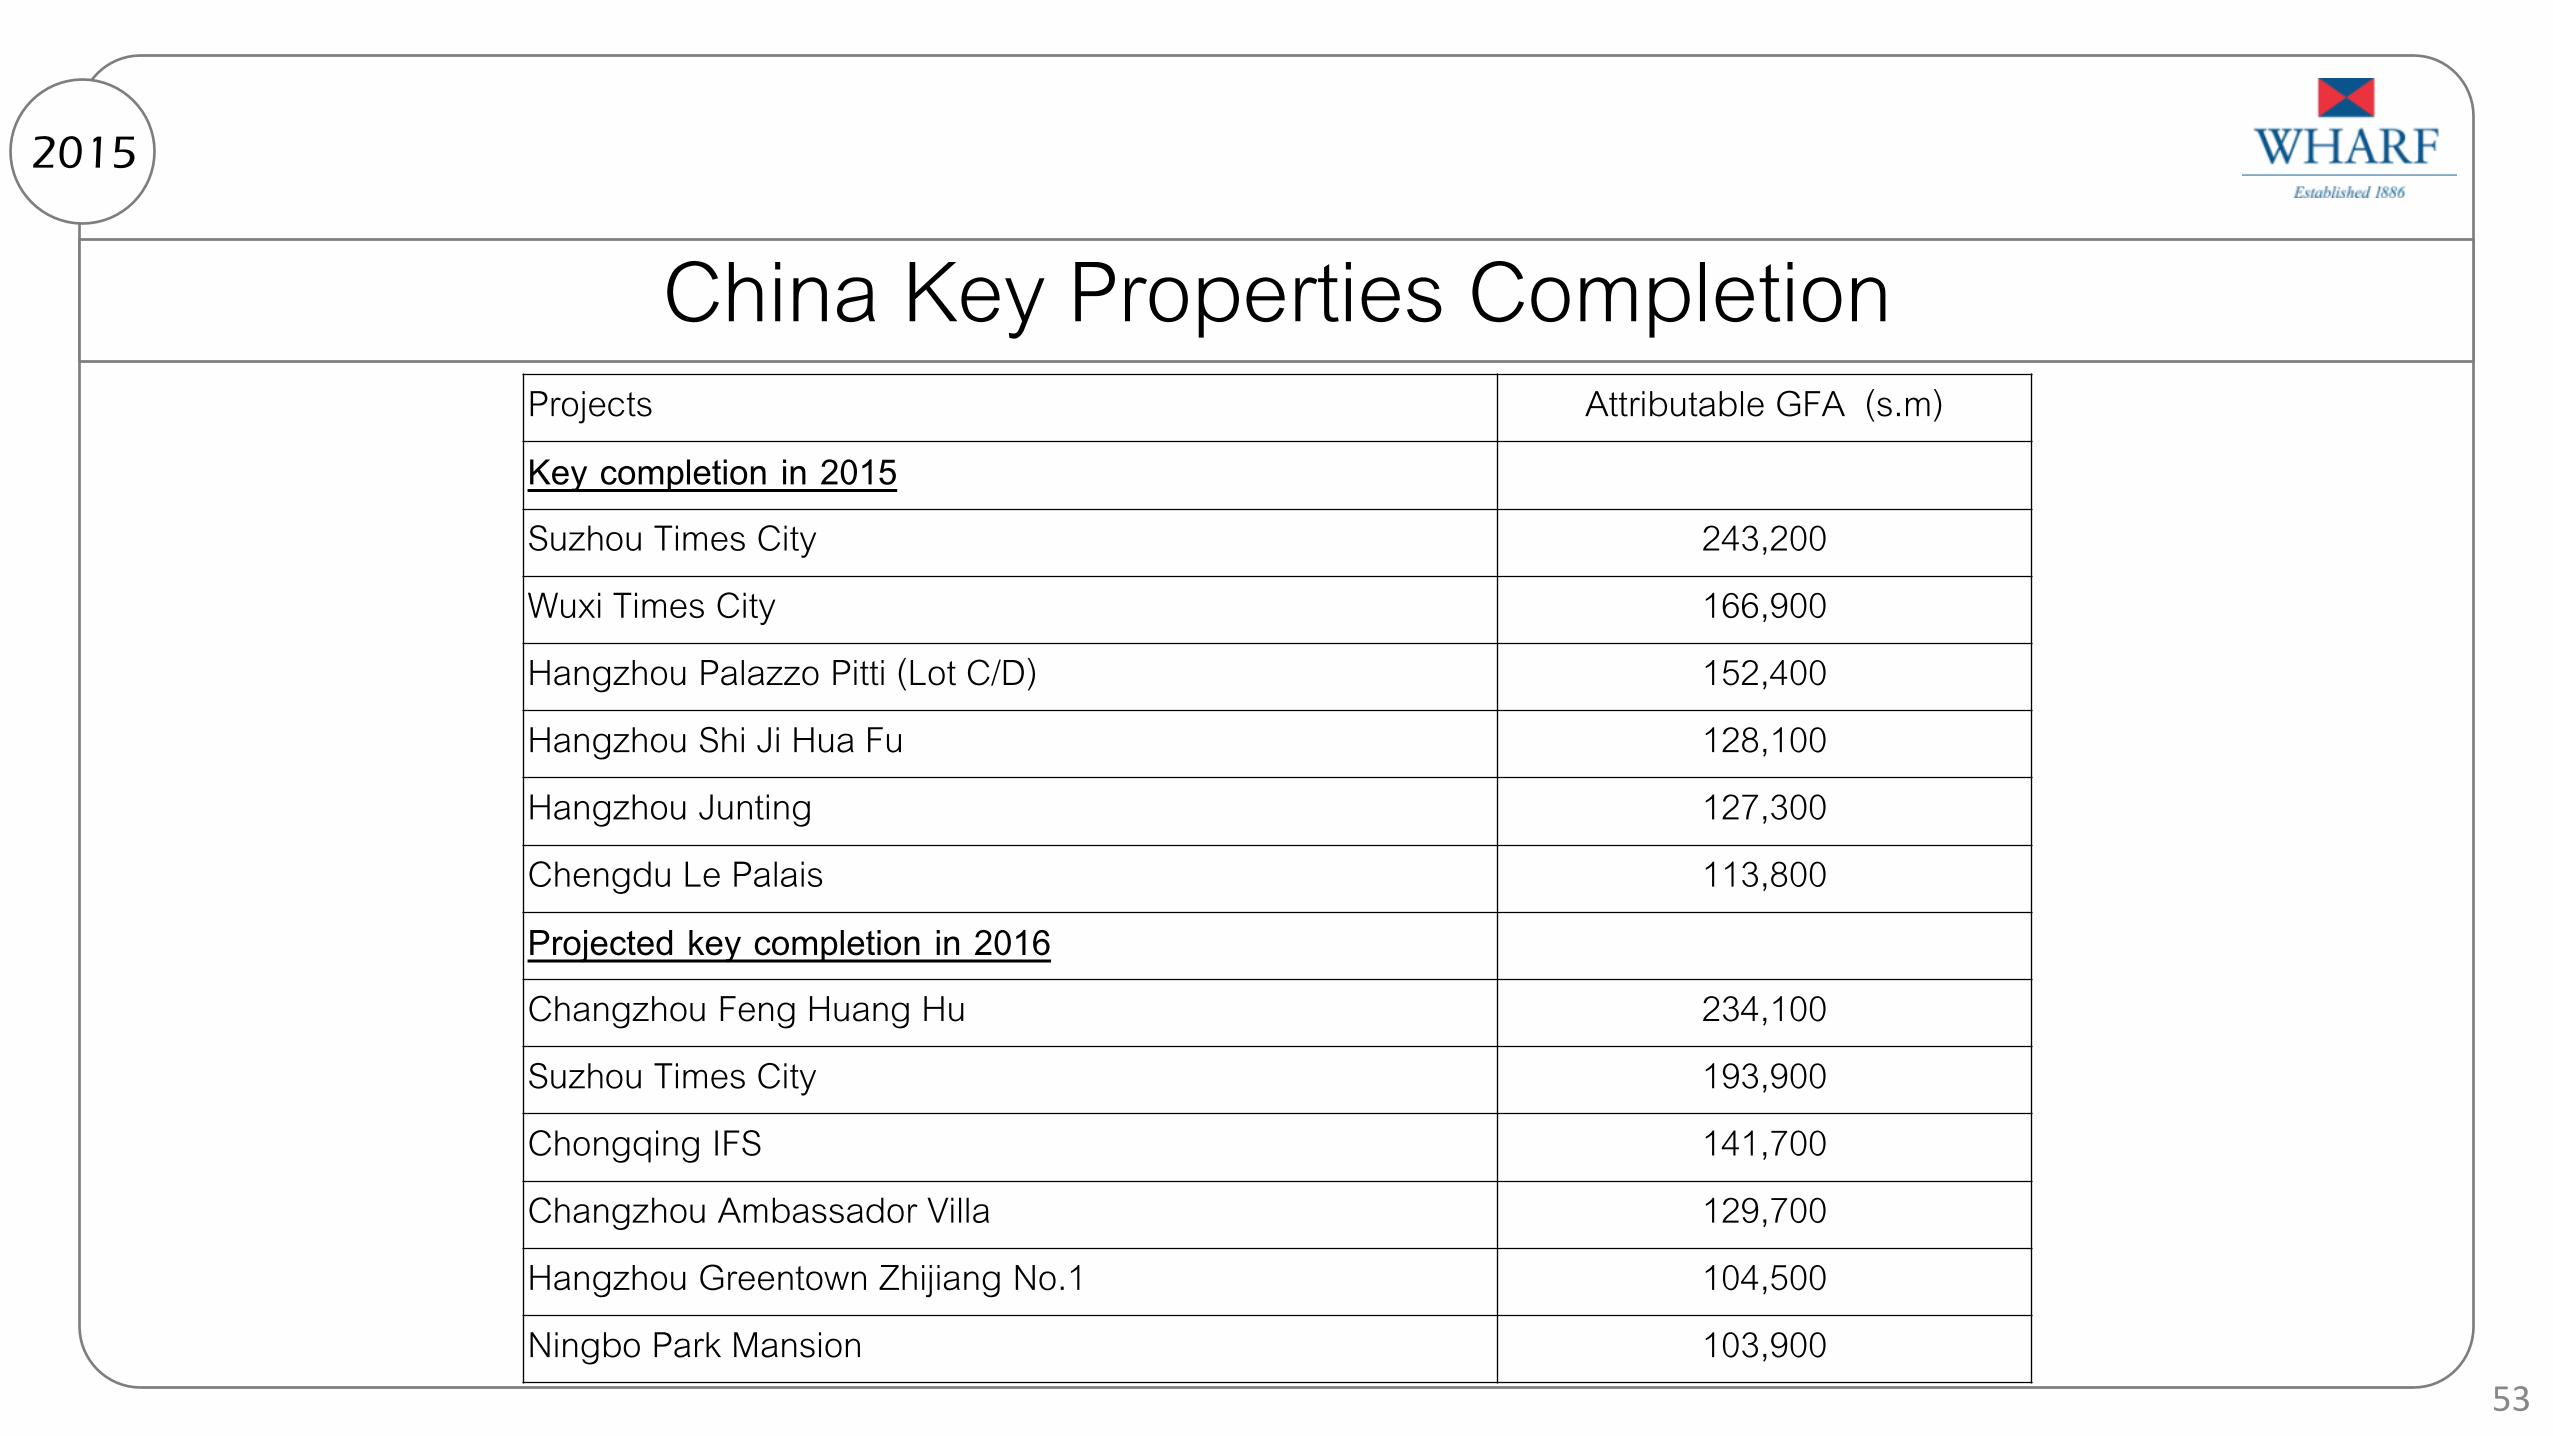
China Key Properties Completion 2015
53
Projects Attributable GFA (s.m) Key completion in 2015 Suzhou Times City 243,200 Wuxi Times City 166,900 Hangzhou Palazzo Pitti (Lot C/D) 152,400 Hangzhou Shi Ji Hua Fu 128,100 Hangzhou Junting 127,300 Chengdu Le Palais 113,800 Projected key completion in 2016 Changzhou Feng Huang Hu 234,100 Suzhou Times City 193,900 Chongqing IFS 141,700 Changzhou Ambassador Villa 129,700 Hangzhou Greentown Zhijiang No.1 104,500 Ningbo Park Mansion 103,900
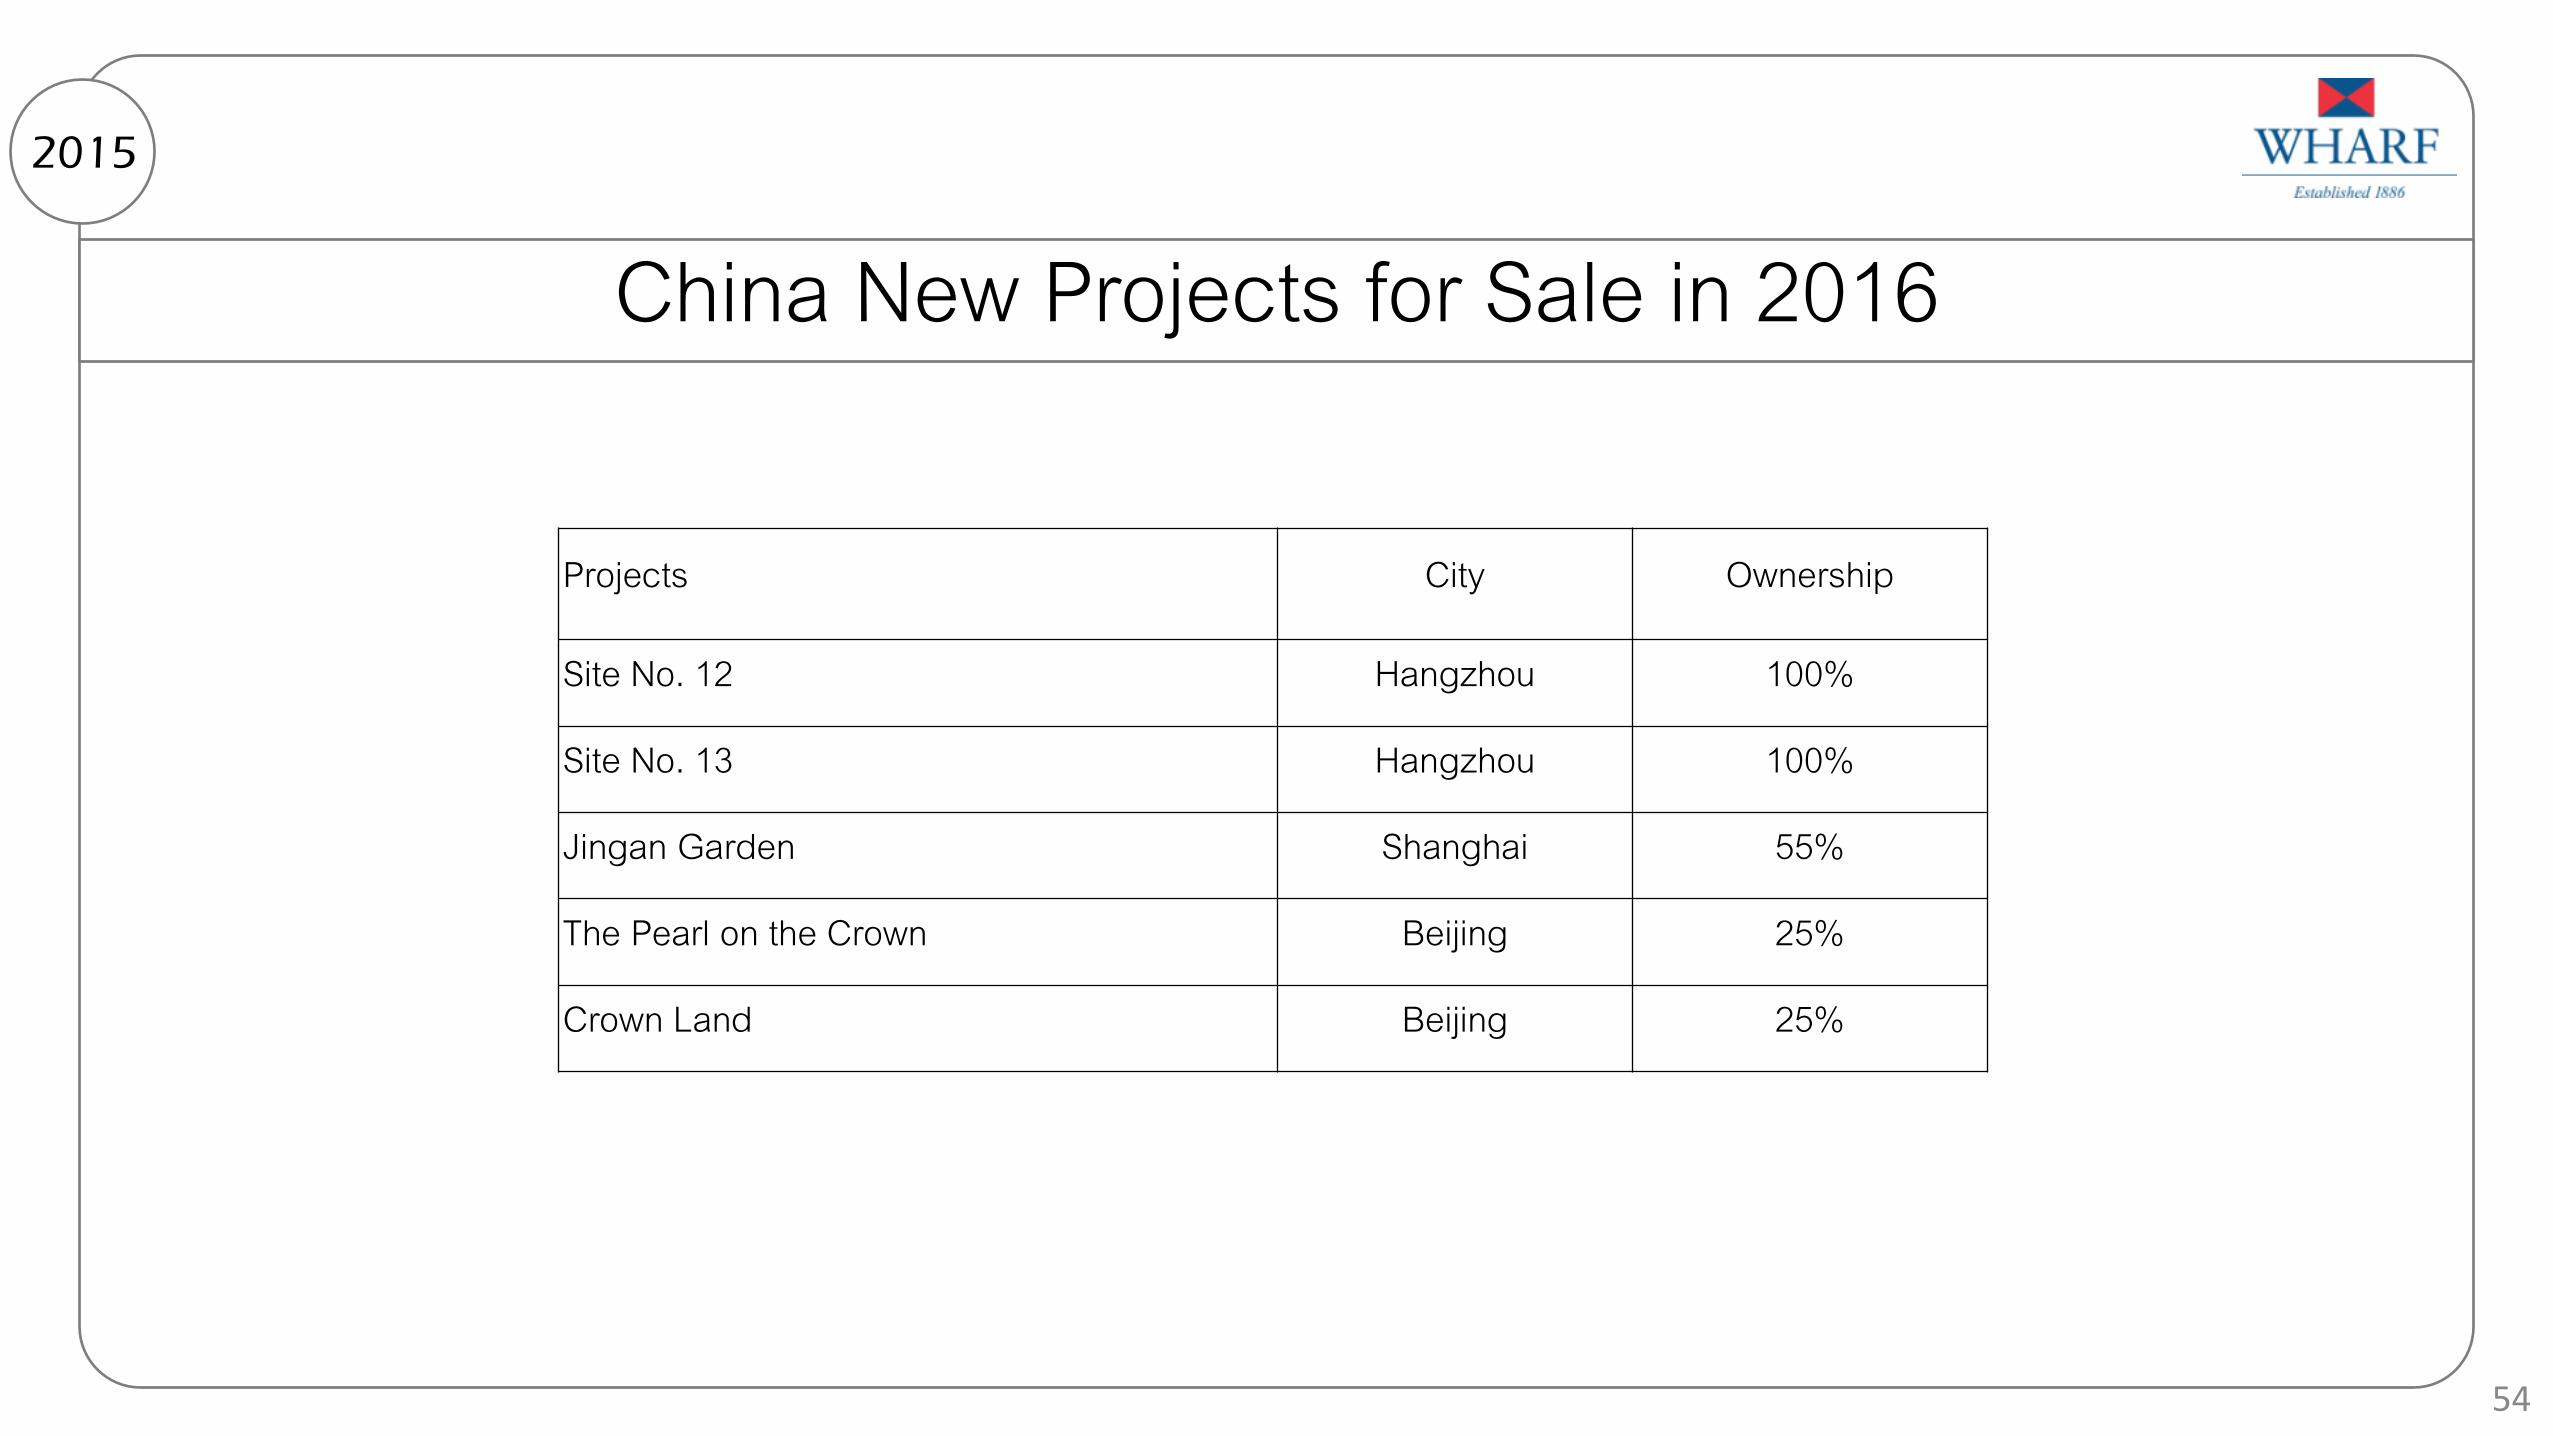
China New Projects for Sale in 2016 2015
54
Projects City Ownership
Site No. 12 Hangzhou 100%
Site No. 13 Hangzhou 100%
Jingan Garden Shanghai 55%
The Pearl on the Crown Beijing 25%
Crown Land Beijing 25%
Thank You
2015
55
Resilient IP Core
2015
56
End of Presentation
The Wharf (Holdings) Limited [HKEx Stock Code: 0004.HK]
Disclaimer
1) All information and data are provided for information purposes only. All opinions included
herein constitute Wharf’s judgment as of the date hereof and are subject to change without
notice. The Group, its subsidiaries and affiliates hereby disclaim (i) all express, implied,
and statutory warranties of any kind to user and/or any third party including warranties as
to accuracy, timeliness, completeness, or fitness for any particular purpose; and (ii) any
liability whatsoever for any loss howsoever arising from or in reliance upon the whole or
any part of the information and data contained herein.
2) The full-year statutory financial information of preceding financial years quoted in this
presentation are derived from statutory annual financial statements for that relevant
financial years, each of which had been delivered to Registrar of Companies in accordance
with the prevailing Companies Ordinance and were reported on by the auditors with
relevant auditors’ reports without qualification or modification.