the what makes schools work project marisa cannata, ellen goldring, xiu cravens, roberto penaloza,...
TRANSCRIPT
The What Makes Schools Work Project
Marisa Cannata, Ellen Goldring, Xiu Cravens, Roberto Penaloza, Vanderbilt University
Mark Berends, University of Notre DameMarc Stein, Johns Hopkins University
These papers are supported by the National Center on School Choice, which is funded by a grant from the U.S.
Department of Education's Institute of Education Sciences (IES) (R305A040043). All opinions expressed
in this paper represent those of the authors and not necessarily the institutions with which they are affiliated or the U.S. Department of Education. All errors in this paper are solely the responsibility of the authors. For more information, please visit the Center website at
www.vanderbilt.edu/schoolchoice/.
June 2010

Conceptual Model
2

Examples of Research Questions• How do leadership practices vary among school
types?• How much do organizational settings and
teaching structures moderate the effects of school type on teacher professional community?
• Does the promotion of in-school organizational conditions and improved teacher press for learning in charter schools relate to student achievement?
• How do instructional practices differ between charter and traditional public school teachers?
• Who teaches in charter schools and why?3

School Sampling Frame for 2007-08 Schools tested by Northwest Evaluation
Association (NWEA) Fall-Spring student achievement data
320 schools of choice 221 charter public schools 67 magnet public schools 32 private
5,864 traditional public schools 337 after applying matching criteria
4
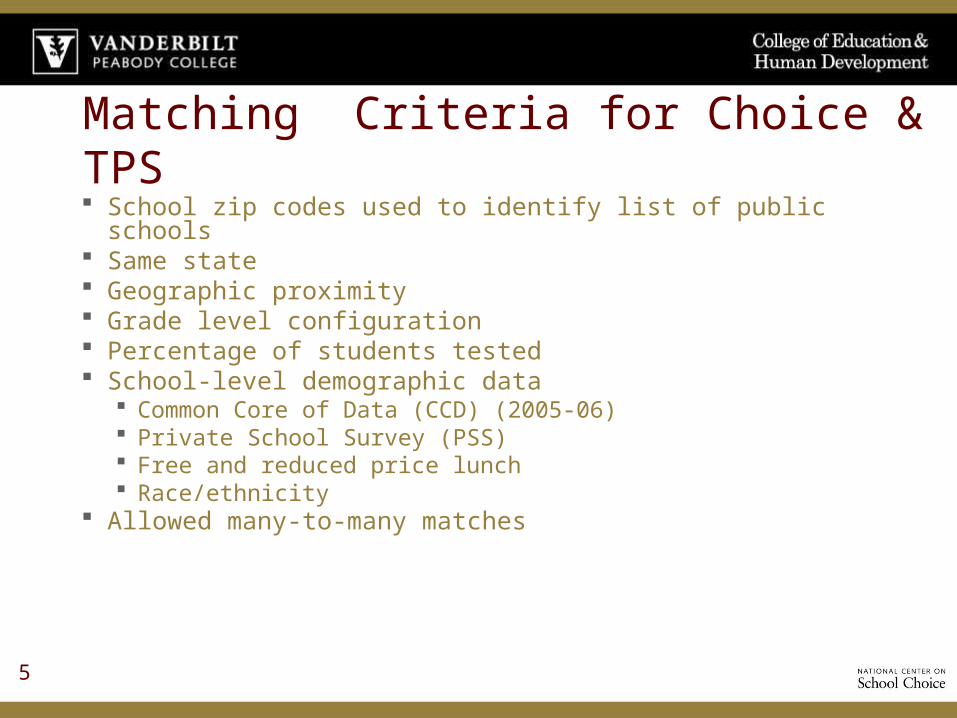
Matching Criteria for Choice & TPS School zip codes used to identify list of public schools Same state Geographic proximity Grade level configuration Percentage of students tested School-level demographic data
Common Core of Data (CCD) (2005-06) Private School Survey (PSS) Free and reduced price lunch Race/ethnicity
Allowed many-to-many matches
5

School Participation & Response Rates
284 schools agreed to participate Participation rate: 51% Charter, 49% Magnet, 53%
Private, 34% TPS
Survey response rate for principals was 78%
for teachers was 74%
6
Charter
Magnet
Private TPS Total
Participating schools 116 33 17 118 284
Participating schools with principal response
106 22 17 103 248
Number of teachers 2108 987 208 2872 6175

Methodological Concerns
• What do we mean by a high quality match?– Difficulties in matching process
• Need for replacement schools• Always of lower match quality
– Explored match quality through final sample and two subsamples
• Matched pairs within 20 miles• CS matched to TPS within 20 miles with closest propensity
score
• Diversity within the charter sector– Affiliations with management organizations
7

Match QualityWMSW Sample
Distance within 20 miles
Charter
TPS Charter
All TPS TPS w/min prop. score
diff.
Elementary grades .72 .61* .66 .66 .83
Middle grades .65 .31* .64 .27* .13*
High school grades .30 .15* .34 .12* .13*
White 49.4 64.5* 50.6 61.4* 61.9
Black 34.6 17.5* 31.2 18.2* 17.2*
Hispanic 12.2 12.7 13.3 15.5 16.5
Asian/Pacific Islander
2.9 3.3 3.6 3.5 3.2
Am. Indian/Alaskan 1.0 2.0 1.3 1.7 1.3
FRL .52 36.4* .48 .48 .39
School size 391.6 560.5* 372.5 498.6* 323.9
Students per grade 51.6 124.3* 50.3 111.8* 53.6
N 116 118 59 59 23

Charter AffiliationWMSW Distance within
20 miles
N % N %
No affiliation 59 50.8 43 72.9
Best Academy 35 30.2 11 18.6
Special Needs Academy
9 7.8 0 0
Other affiliations 13 11.2 5 8.5
9

Who Teaches in Charter Schools and Why?
• Teachers are most important resource for schools
• School choice theory predicts charter schools will use their flexibility to recruit different types of teachers
Research Questions:• How do teacher qualifications and characteristics
differ between charter and TPS?• How do teacher preferences for where to work
vary by school type?10

College Selectivity by Charter Affiliation
WMSW sample
Distance within 20 miles
Min propensity score diff
TPS 3.14 3.18 3.14
All charters 3.00* 3.07* 3.07
No affiliation 3.26* 3.21 3.21
Best Academy 2.84* 2.81* 2.81
Special Needs Academy
2.17* n/a n/a
Other affiliations 3.06 3.09 3.09
11
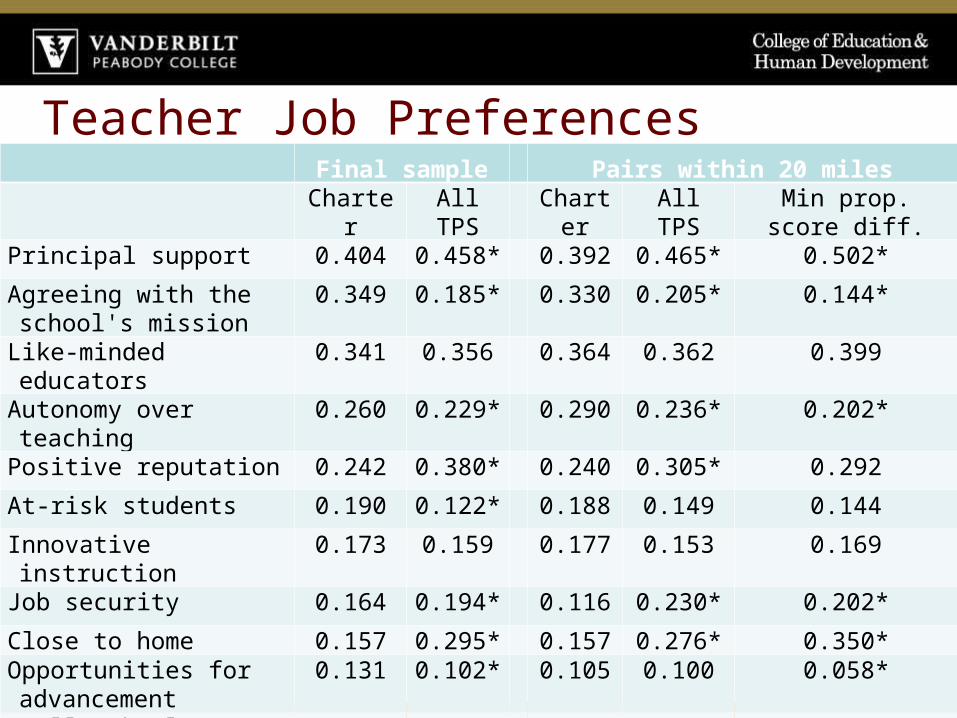
Teacher Job PreferencesFinal sample Pairs within 20 miles
CharterAll
TPSChart
er All TPSMin prop. score
diff.Principal support 0.404 0.458* 0.392 0.465* 0.502*Agreeing with the school's mission
0.349 0.185* 0.330 0.205* 0.144*
Like-minded educators 0.341 0.356 0.364 0.362 0.399Autonomy over teaching
0.260 0.229* 0.290 0.236* 0.202*
Positive reputation 0.242 0.380* 0.240 0.305* 0.292At-risk students 0.190 0.122* 0.188 0.149 0.144Innovative instruction 0.173 0.159 0.177 0.153 0.169Job security 0.164 0.194* 0.116 0.230* 0.202*Close to home 0.157 0.295* 0.157 0.276* 0.350*Opportunities for advancement
0.131 0.102* 0.105 0.100 0.058*
Small school 0.114 0.088* 0.127 0.092* 0.152N 1214 1872 645 791 243

Preference for Job Security
WMSW sample
Distance within 20
miles
Min. propensity score difference
TPS 19.4% 23.0% 20.2%
All charters 16.4* 11.6* 11.6*
No affiliation 9.7* 9.2* 9.2*
Best Academy 24.3* 19.4 19.4
Special Needs Academy
34.3* n/a n/a
Other affiliations 12.0* 6.5* 6.5*
13
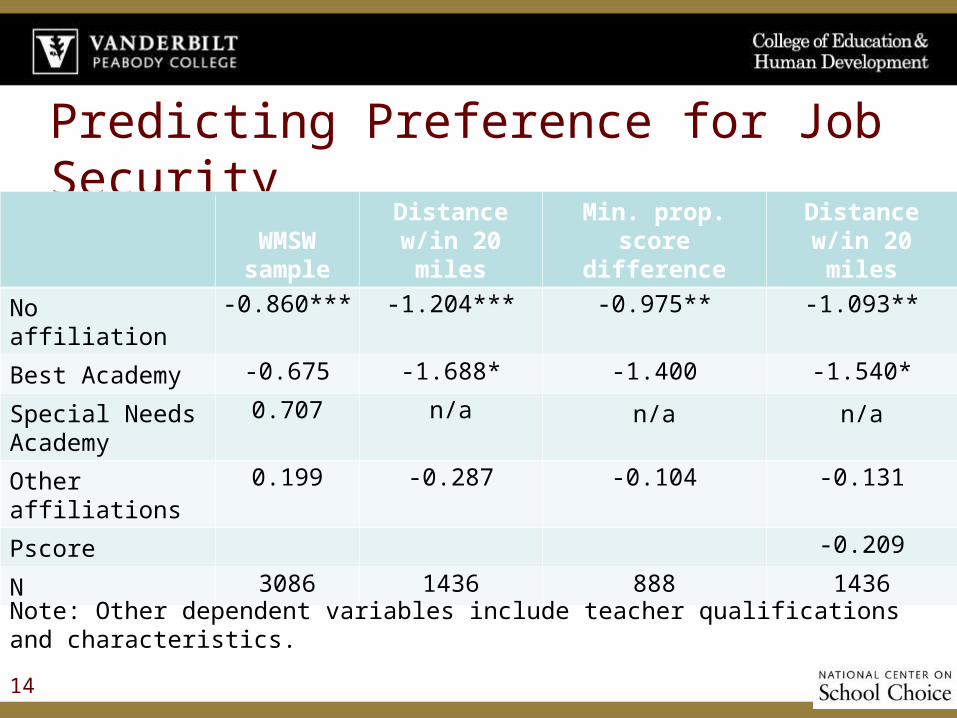
Predicting Preference for Job Security
WMSW sample
Distance w/in 20 miles
Min. prop. score
difference
Distance w/in 20 miles
No affiliation -0.860*** -1.204*** -0.975** -1.093**
Best Academy -0.675 -1.688* -1.400 -1.540*
Special Needs Academy
0.707 n/a n/a n/a
Other affiliations
0.199 -0.287 -0.104 -0.131
Pscore -0.209
N 3086 1436 888 1436
Note: Other dependent variables include teacher qualifications and characteristics.
14

ConclusionsMatch quality does not matter Match quality matters
Affiliation does not matter
•CS teachers are less experienced, less certified, fewer advanced degrees
•CS teachers have a greater preference for agreeing with the school’s mission and less preference for working close to home
As sample is restricted:•TPS have fewer black teachers (and fewer than CS)
•TPS preference for school with positive reputation goes down (and more similar to CS)
Affiliation matters
•Non-affiliated CS teachers have a greater preference for autonomy and less preference for principal support or job security
•Other affiliated CS teachers have less preference for principal support
•College selectivity, midcareer, gender, percent Hispanic teachers
•Preferences for at-risk students, innovative instruction, small school, like-minded educators, opportunities to advance
www.vanderbilt.edu/schoolchoice
National Center on School Choice
16