the widening academic achievement gap between the rich and the poor… · 2018-09-21 · gap...
TRANSCRIPT

the widening academic achievement gap between the rich and the poor:
new evidence and possible explanations
sean f. reardonstanford university
november, 2012

social reproduction
on average, students from families of higher socioeconomic status perform better on academic tests, attain higher levels of schooling, and (as a consequence) attain higher socioeconomic status themselves as adults
however, the extent of social reproduction – the strength of the correlation between parental socioeconomic status and children’s outcomes – is mutable; it may vary across time and place, as a result of social policy, norms, values, and economic conditions.

key questions
how large is the socioeconomic achievement gap in the US?
specifically, how large is the income achievement gap?
how does it compare to other countries?
how has this gap changed over the last 50 years?
what accounts for the evident changes?
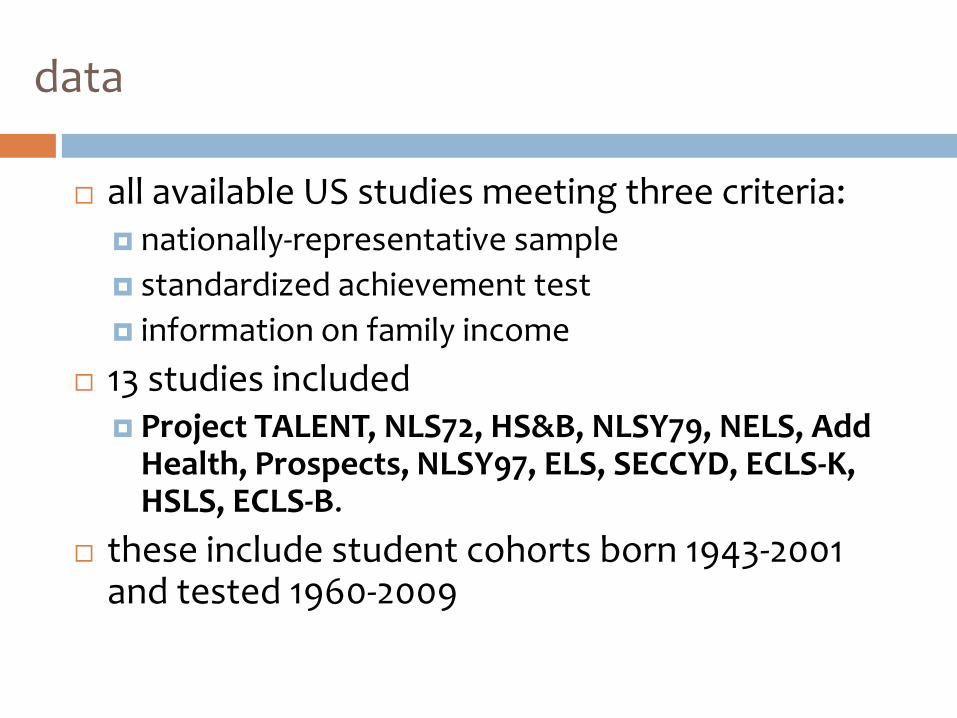
data
all available US studies meeting three criteria: nationally-representative sample
standardized achievement test
information on family income
13 studies included Project TALENT, NLS72, HS&B, NLSY79, NELS, Add
Health, Prospects, NLSY97, ELS, SECCYD, ECLS-K, HSLS, ECLS-B.
these include student cohorts born 1943-2001 and tested 1960-2009

measuring achievement gaps
Measuring gap between high- and low-income students is complicated… …because income is continuous, not a binary variable …because income distribution changes over time …because income is reported in categories …because income is reported with error
Comparing gaps across studies is complicated… …because test content differs …because test scales differ …because test reliabilities differ …because samples differ (in age/grade,
representativeness)
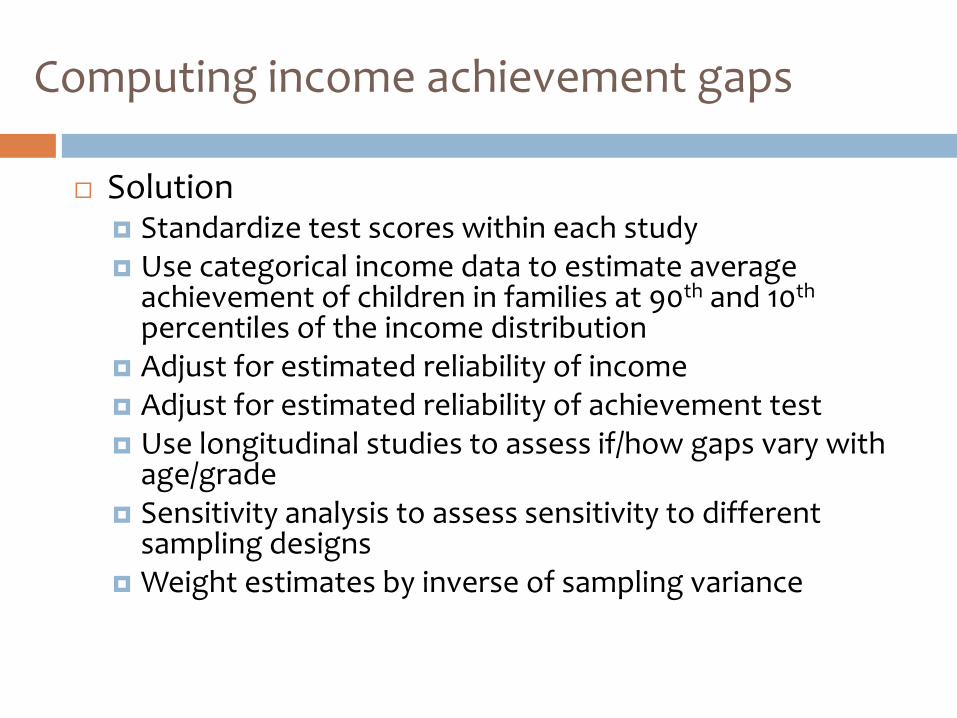
Computing income achievement gaps
Solution Standardize test scores within each study Use categorical income data to estimate average
achievement of children in families at 90th and 10th
percentiles of the income distribution Adjust for estimated reliability of income Adjust for estimated reliability of achievement test Use longitudinal studies to assess if/how gaps vary with
age/grade Sensitivity analysis to assess sensitivity to different
sampling designs Weight estimates by inverse of sampling variance

computing income achievement gaps
-0.38
0.37
90/1
0 G
ap
-1.0
-0.5
0.0
0.5
1.0
Avera
ge
Sta
nda
rdiz
ed T
est
Score
$0K$1
K$3
K$5
K
$7.5
K
$10K
$15K
$20K
$25K
$35K
$50K
$75K
$100
K
$200
K0 .1 .2 .3 .4 .5 .6 .7 .8 .9 1
Income (Dollars and Percentiles)
95% CI Within Income Category
Fitted Cubic Curve
Association Between Reading Score and Family Income Percentile,Grade 8 Students, 1988 (NELS data)

computing income achievement gaps
-0.59
0.59
90/1
0 G
ap
-1.0
-0.5
0.0
0.5
1.0
Avera
ge
Sta
nda
rdiz
ed T
est
Score
$5K
$10K
$15K
$20K
$25K
$30K
$35K
$40K
$50K
$75K
$100
K
$200
K0 .1 .2 .3 .4 .5 .6 .7 .8 .9 1
Income (Dollars and Percentiles)
95% CI Within Income Category
Fitted Cubic Curve
Association Between Reading Score and Family Income Percentile,Grade 8 Students, 2006 (ECLSK data)

Adjusting gaps for reliability

findings
How has the achievement gap changed in the last 50 years?
…between high-income (90th percentile) and low-income (10th percentile) children?
…between high-income (90th percentile) and middle-income (50th percentile) children?
…between middle-income (50th percentile) and low-income (10th percentile) children?

1112 910
12
12
10
1110
812
9
710811
1
3
7
10
9
7
103
K K
0.00
0.25
0.50
0.75
1.00
1.25
1.50
1.75
Ave
rage
Diffe
ren
ce
in S
tand
ard
ize
d T
est
Sco
res
Betw
een
90th
& 1
0th
Incom
e P
erc
en
tile
Fam
ilies
1940 1950 1960 1970 1980 1990 2000
Cohort Birth Year
TALENT
NLS
HS&B
NLSY79
NELS
Add Health
Prospects
NLSY97
ELS
SECCYD
ECLS-K
HLS
ECLS-B
95% CI
Quartic Fitted Trend
Study
Trend in 90/10 Income Gap in Reading, 1940-2001 Cohorts

1112 910
12
12
10
11
10
8
1
3
7
10
9710 3
K
9
K
0.00
0.25
0.50
0.75
1.00
1.25
1.50
1.75
Ave
rage
Diffe
ren
ce
in S
tand
ard
ize
d T
est
Sco
res
Betw
een
90th
& 1
0th
Incom
e P
erc
en
tile
Fam
ilies
1940 1950 1960 1970 1980 1990 2000
Cohort Birth Year
TALENT
NLS
HS&B
NLSY79
NELS
Add Health
Prospects
NLSY97
ELS
SECCYD
ECLS-K
HLS
ECLS-B
95% CI
Quartic Fitted Trend
Study
Trend in 90/10 Income Gap in Math, 1940-2001 Cohorts

1112
9
10
12 1210
11
10
8
129
7108
11
1
3
710
9
710
3
K
K
0.00
0.25
0.50
0.75
1.00
1.25
Avera
ge D
iffe
ren
ce in S
tan
da
rdiz
ed T
est
Score
sB
etw
ee
n 9
0th
& 5
0th
In
com
e P
erc
en
tile
Fam
ilies
1940 1950 1960 1970 1980 1990 2000
Cohort Birth Year
TALENT
NLS
HS&B
NLSY79
NELS
Add Health
Prospects
NLSY97
ELS
SECCYD
ECLS-K
HLS
ECLS-B
95% CI
Fitted Trend1943-2001
Study
Trend in 90/50 Income Gap in Reading, 1940-2001 Cohorts

1112
9
10
12
12
10
11
10
8 1
3
7
10 97
10
3
K
9
K
0.00
0.25
0.50
0.75
1.00
1.25
Avera
ge D
iffe
ren
ce in S
tan
da
rdiz
ed T
est
Score
sB
etw
ee
n 9
0th
& 5
0th
In
com
e P
erc
en
tile
Fam
ilies
1940 1950 1960 1970 1980 1990 2000
Cohort Birth Year
TALENT
NLS
HS&B
NLSY79
NELS
Add Health
Prospects
NLSY97
ELS
SECCYD
ECLS-K
HLS
ECLS-B
95% CI
Fitted Trend1943-2001
Study
Trend in 90/50 Income Gap in Math, 1940-2001 Cohorts

1112
910
12
12
10
11
10
8
12
9 710 8
11
1
3
7
10
97
10
3
K
K
0.00
0.25
0.50
0.75
1.00
1.25
Avera
ge D
iffe
ren
ce in S
tan
da
rdiz
ed T
est
Score
sB
etw
ee
n 5
0th
& 1
0th
In
com
e P
erc
en
tile
Fam
ilies
1940 1950 1960 1970 1980 1990 2000
Cohort Birth Year
TALENT
NLS
HS&B
NLSY79
NELS
Add Health
Prospects
NLSY97
ELS
SECCYD
ECLS-K
HLS
ECLS-B
95% CI
Fitted Trend1943-2001
Study
Trend in 50/10 Income Gap in Reading, 1940-2001 Cohorts

1112
9
10
12
12
10
11
10
8
1
3
7
10
9
7
10
3
K
9
K
0.00
0.25
0.50
0.75
1.00
1.25
Avera
ge D
iffe
ren
ce in S
tan
da
rdiz
ed T
est
Score
sB
etw
ee
n 5
0th
& 1
0th
In
com
e P
erc
en
tile
Fam
ilies
1940 1950 1960 1970 1980 1990 2000
Cohort Birth Year
TALENT
NLS
HS&B
NLSY79
NELS
Add Health
Prospects
NLSY97
ELS
SECCYD
ECLS-K
HLS
ECLS-B
95% CI
Fitted Trend1943-2001
Study
Trend in 50/10 Income Gap in Math, 1940-2001 Cohorts

0.00
0.25
0.50
0.75
1.00
1.25
1.50
Ave
rage
Diffe
ren
ce
in S
tan
da
rdiz
ed
Te
st
Score
s
(90
/50 o
r 50
/10
In
co
me G
ap
)
1940 1950 1960 1970 1980 1990 2000
Cohort Birth Year
90/50 Income Gap
50/10 Income Gap
Source: Reardon (2011)
Reading, 1943-2001 Birth Cohorts
Income Achievement Gaps (90/50 and 50/10 Gaps)

0.00
0.25
0.50
0.75
1.00
1.25
1.50
Ave
rage
Diffe
ren
ce
in S
tand
ard
ize
d T
est
Sco
res
(90
/50 o
r 5
0/1
0 I
ncom
e G
ap)
1940 1950 1960 1970 1980 1990 2000
Cohort Birth Year
90/50 Income Gap
50/10 Income Gap
Source: Reardon (2011)
Math, 1943-2001 Birth Cohorts
Income Achievement Gaps (90/50 and 50/10 Gaps)

how large are these gaps?
one standard deviation is the difference between the 31st and 69th percentile
if the gap is one standard deviation, this implies that the average student in a family at the 10th percentile of the income distribution has test scores lower than 84% of students in families at the 90th percentile of the income distribution
one standard deviation is the amount a typical student learns in a year in K-1
3 years in elementary-middle school
6 years in middle-high school

findings
How does the achievement gap change as children progress through school?

development of income achievement gap, by age and subject, all longitudinal studies
0.00
0.25
0.50
0.75
1.00
1.25
1.50
Avera
ge
Diffe
ren
ce
in
Sta
nda
rdiz
ed T
est S
core
sB
etw
ee
n 9
0th
& 1
0th
In
co
me
Perc
en
tile
Fa
mili
es
6 8 10 12 14 16 18
Age
ECLS-K Reading
ECLS-K Math
Prospects G1 Reading
Prospects G1 Math
Prospects G3 Reading
Prospects G3 Math
Prospects G7 Reading
Prospects G7 Math
SECCYD Reading
SECCYD Math
NELS Reading
NELS Math
HS&B Reading
HS&B Math
ELS Math
Study
Income Achievement Gaps, by Age and Subject

Fall KFall G1
Fall G3 Fall G5
Fall G8
Spring K Spring G1
Age 4Fall K
0.00
0.25
0.50
0.75
1.00
1.25
1.50
Ave
rage
Diffe
ren
ce
in S
tan
da
rdiz
ed
Te
st
Score
s
(90
/10 I
ncom
e G
ap)
4 6 8 10 12 14
Age
ECLS-K (1992-93 birth cohort)
ECLS-B (2001 birth cohort)
Study
Source: Reardon (2011)
Reading, Ages 4-15
Development of Income Achievement Gap (90/10 Gap)

0.00
0.25
0.50
0.75
1.00
1.25
1.50
Ave
rage
Diffe
ren
ce
in S
tan
da
rdiz
ed
Te
st
Score
s
(90
/50 o
r 50
/10
In
co
me G
ap
)
4 6 8 10 12 14
Age
90/50 Income Gap
50/10 Income Gap
Source: Reardon (2011)
Reading, Ages 4-15
Income Achievement Gaps (90/50 and 50/10 Gaps)

Fall K
Fall G1 Fall G3 Fall G5 Fall G8
Spring K
Spring G1
Age 4 Fall K
0.00
0.25
0.50
0.75
1.00
1.25
1.50
Ave
rage
Diffe
ren
ce
in S
tand
ard
ize
d T
est
Sco
res
(90
/10 I
nco
me G
ap
)
4 6 8 10 12 14
Age
ECLS-K (1992-93 birth cohort)
ECLS-B (2001 birth cohort)
Study
Source: Reardon (2011)
Math, Ages 4-15
Development of Income Achievement Gap (90/10 Gap)

0.00
0.25
0.50
0.75
1.00
1.25
1.50
Ave
rage
Diffe
ren
ce
in S
tand
ard
ize
d T
est
Sco
res
(90
/50 o
r 5
0/1
0 I
ncom
e G
ap)
4 6 8 10 12 14
Age
90/50 Income Gap
50/10 Income Gap
Source: Reardon (2011)
Math, Ages 4-15
Income Achievement Gaps (90/50 and 50/10 Gaps)

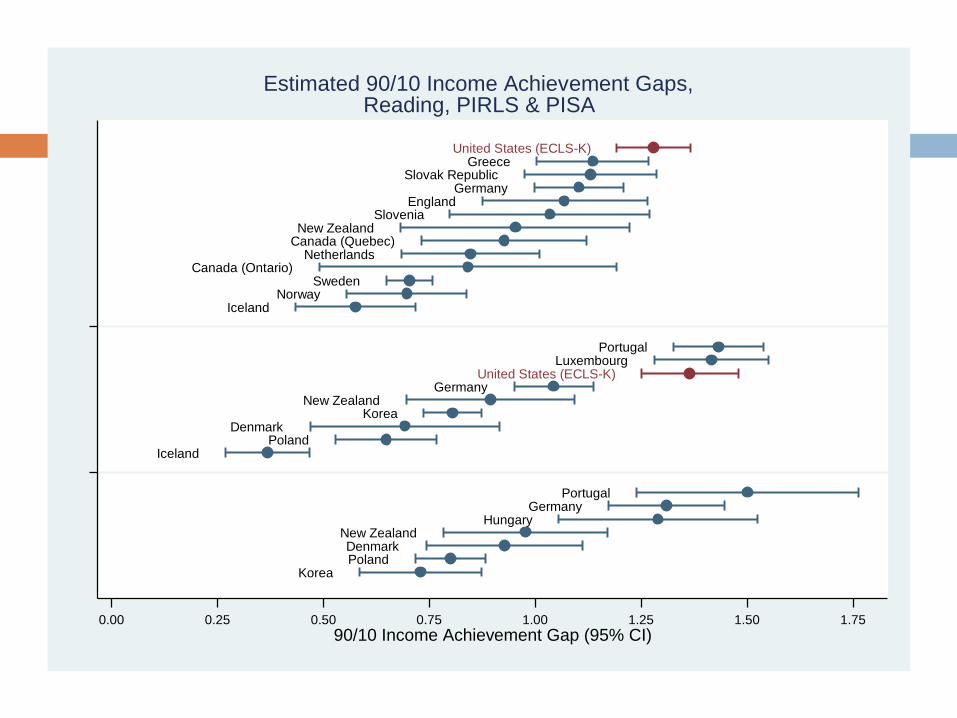
findings
How does the achievement gap in the US compare to the gap in other countries?
IcelandNorway
SwedenCanada (Ontario)
NetherlandsCanada (Quebec)New Zealand
SloveniaEngland
GermanySlovak Republic
GreeceUnited States (ECLS-K)
IcelandPoland
DenmarkKorea
New ZealandGermany
LuxembourgPortugal
United States (ECLS-K)
KoreaPolandDenmark
New ZealandHungary
GermanyPortugal
PIS
A 2
009
PIS
A 2
006
PIR
LS
(2001)
0.00 0.25 0.50 0.75 1.00 1.25 1.50 1.75
90/10 Income Achievement Gap (95% CI)
Estimated 90/10 Income Achievement Gaps,Reading, PIRLS & PISA
Canada (Ontario)
Canada (Quebec)
Germany
Denmark
England
Greece
Hungary
Iceland
Korea
Luxembourg
Netherlands
Norway
New Zealand
Poland
Portugal
Slovak Republic
Slovenia
Sweden
United States
0.50
0.75
1.00
1.25
1.50
90
/10 I
ncom
e A
chie
vem
en
t G
ap
(sd's
)
-1.0 0.0 1.0 2.0 3.0
Poverty/Inequality Index
Fitted Line (Precision-weighted)
Fitted Line w/o US (Precision-weighted)
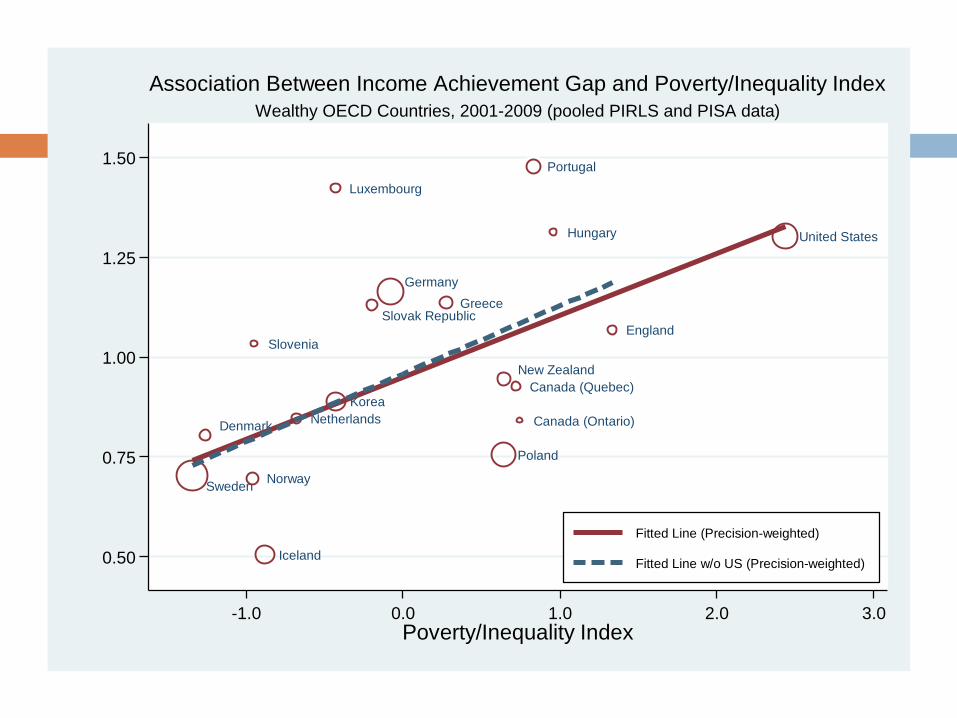
Wealthy OECD Countries, 2001-2009 (pooled PIRLS and PISA data)
Association Between Income Achievement Gap and Poverty/Inequality Index
why has the income achievement gap grown?
rising income inequality? changes in family investment patterns rising returns to income? rising investment in children’s cognitive development
(among high-income families)? changing parenting practices?
Increasing correlation between income and other family resources?
increasing socioeconomic segregation? changing social policies (changing social safety net
for the poor)?

income and educational outcomes

income inequality and educational inequality

30%
35%
40%
45%
50%
Sha
re o
f A
ll In
co
me
1910 1920 1930 1940 1950 1960 1970 1980 1990 2000 2010
YearSource: Piketty & Saez (2012): http://www.econ.berkeley.edu/~saez/TabFig2010.xls
(Includes Capital Gains), 1918-2010
Share of Total Income Accruing to 10% Highest Income Families,

1.0
2.0
3.0
4.0
5.0
6.0
7.0
8.0
9.0
10.0
11.0
90/1
0 I
ncom
e R
atio
1970 1980 1990 2000 2010
YearSource: Author's calculations from CPS data 1968-2011
Among Families of School-Age Children
Income Inequality (90/10 Income Ratio), 1967-2010

1.5
2.0
2.5
3.0
3.5
4.0
4.5
Incom
e R
atio
1970 1980 1990 2000 2010
Year
50/10 Ratio
90/50 Ratio
Source: Author's calculations from CPS data 1968-2011
Among Families of School-Age Children
Income Inequality (50/10 and 90/50 Income Ratio), 1967-2010

0.00
0.20
0.40
0.60
0.80
Cha
ng
e in S
tand
ard
ize
d T
est
Score
Per
Dou
blin
g o
f Im
com
e
1940 1950 1960 1970 1980 1990 2000
Cohort Birth Year
TALENT
NLS
HS&B
NLSY79
NELS
Add Health
Prospects
NLSY97
ELS
SECCYD
ECLS-K
HLS
ECLS-B
Fitted Trend1943-2001
Study
Trend in Association Between Income and Reading Achievement,Families Below Median Income, 1940-2001 Cohorts

0.00
0.20
0.40
0.60
0.80
Cha
ng
e in S
tand
ard
ize
d T
est
Score
Per
Dou
blin
g o
f Im
com
e
1940 1950 1960 1970 1980 1990 2000
Cohort Birth Year
TALENT
NLS
HS&B
NLSY79
NELS
Add Health
Prospects
NLSY97
ELS
SECCYD
ECLS-K
HLS
ECLS-B
Fitted Trend1943-2001
Study
Trend in Association Between Income and Math Achievement,Families Below Median Income, 1940-2001 Cohorts

0.00
0.20
0.40
0.60
0.80
Cha
ng
e in S
tand
ard
ize
d T
est
Score
Per
Dou
blin
g o
f Im
com
e
1940 1950 1960 1970 1980 1990 2000
Cohort Birth Year
TALENT
NLS
HS&B
NLSY79
NELS
Add Health
Prospects
NLSY97
ELS
SECCYD
ECLS-K
HLS
ECLS-B
Fitted Trend1943-2001
Study
Trend in Association Between Income and Reading Achievement,Families Above Median Income, 1940-2001 Cohorts

0.00
0.20
0.40
0.60
0.80
Cha
ng
e in S
tand
ard
ize
d T
est
Score
Per
Dou
blin
g o
f Im
com
e
1940 1950 1960 1970 1980 1990 2000
Cohort Birth Year
TALENT
NLS
HS&B
NLSY79
NELS
Add Health
Prospects
NLSY97
ELS
SECCYD
ECLS-K
HLS
ECLS-B
Fitted Trend1943-2001
Study
Trend in Association Between Income and Math Achievement,Families Above Median Income, 1940-2001 Cohorts

why has the income achievement gap grown?
rising income inequality?
changes in family investment patterns rising investment in children’s cognitive development
(among high-income families)?
changing parenting practices?
Increasing correlation between income and other family resources?
increasing socioeconomic segregation?
changing social policies (changing social safety net for the poor)?

8351,264 1,173 1,315
3,536
5,650
6,975
8,872
0
2,500
5,000
7,500
10,000
Exp
end
itu
res (
in 2
00
8 d
olla
rs)
1972-73 1983-84 1994-95 2005-06
Top Income Quintile
Bottom Income Quintile
Source: Duncan & Murnane (2011)
Family Enrichment Expenditures on Children, 1972-2006

why has the income achievement gap grown?
rising income inequality?
changes in family investment patterns rising investment in children’s cognitive development
(among high-income families)?
changing parenting practices?
Increasing correlation between income and other family resources?
increasing socioeconomic segregation?
changing social policies (changing social safety net for the poor)?

changing view of parental role
parental views of their role as parents has changed over twentieth century (wrigley, 1989; schaub, 2010)
increasing focus on importance of parenting for cognitive development
some evidence of social class differences in parenting practices (lareau, 2003)
middle/upper-class: concerted cultivation working-class: accomplishment of natural growth
education policy may play a role, by focusing and legitimating test scores as primary goal of schooling and evidence of success (schaub, 2010)

changing views of parenting, 1900-1985 (wrigley, 1989)
0%
20%
40%
60%
Pro
po
rtio
n o
f M
aga
zin
e A
rtic
les
1900s 1910s 1920s 1930s 1940s 1950s 1960s 1970s 1980s
Source: Wrigley, Julia. (1989). Do Young Children Need Intellectual Stimulation? Experts' Advice to Parents, 1900-1985.History of Education Quarterly 29/1:41-75 (Table 1).
Topics of Expert Advice on Parenting, 1900-1985
Nutrition Intellectual Stimulation
Medical Social/Emotional Development
Fresh Air

why has the income achievement gap grown?
rising income inequality?
changes in family investment patterns rising investment in children’s cognitive development
(among high-income families)?
changing parenting practices?
Increasing correlation between income and other family resources?
increasing socioeconomic segregation?
changing social policies (changing social safety net for the poor)?

relationship between income and other family resources
polarization of families (mclanahan 2004)
increasing returns to college education and cognitive skill (murnane, willett, & levy, 1995)
income more strongly associated with parental education and cognitive skill
increased assortative mating (schwartz & mare, 2005)
high-income families not only have more income, but increasingly also have more of other resources that matter (dual parents, high educational attainment & cognitive skill, smaller families, fewer very young mothers)

adjusted trends in income-achievement and education-achievement associations, reading, 1940-2001
0.00
0.20
0.40
0.60
0.80
1.00
Re
gre
ssio
n-A
dju
ste
d 9
0/1
0 A
chie
vem
en
t G
ap
1940 1950 1960 1970 1980 1990 2000Cohort Birth Year
TALENT
NLS
HS&B
NLSY79
NELS
Add Health
Prospects
NLSY97
ELS
SECCYD
ECLS-K
ECLS-B
IncomeCoefficient
ParentalEducationCoefficient
Study
Trends in Adjusted Associations Between Readingand Both Income and Parental Education, 1943-2001 Cohorts

adjusted trends in income-achievement and education-achievement associations, math, 1940-2001
0.00
0.20
0.40
0.60
0.80
1.00
Re
gre
ssio
n-A
dju
ste
d 9
0/1
0 A
chie
vem
en
t G
ap
1940 1950 1960 1970 1980 1990 2000Cohort Birth Year
TALENT
NLS
HS&B
NLSY79
NELS
Add Health
Prospects
NLSY97
ELS
SECCYD
ECLS-K
ECLS-B
IncomeCoefficient
ParentalEducationCoefficient
Study
Trends in Adjusted Associations Between Mathand Both Income and Parental Education, 1943-2001 Cohorts

why has the income achievement gap grown?
rising income inequality?
changes in family investment patterns rising investment in children’s cognitive development
(among high-income families)?
changing parenting practices?
Increasing correlation between income and other family resources?
increasing socioeconomic segregation?
changing social policies (changing social safety net for the poor)?

0
20
40
60
80
100
Pro
port
ion
of F
am
ilies
1970 1980 1990 2000 2008
Metropolitan Areas with Population > 500,000, 1970-2008
Proportion of Families Living in High-, Middle-, and Low-Income Neighborhoods
Affluent (>150% of Metro Median)
High Income (125-150% of Metro Median)
High Middle Income (100-125% of Metro Median)
Low Middle Income (80-100% of Metro Median)
Low Income (67-80% of Metro Median)
Poor (<67% of Metro Median)
Neighborhood Type (Based on Median Family Income Level)

summary of trends
income achievement gaps have grown sharply in recent decades (since 1970s birth cohorts, maybe before)
income gaps have grown most rapidly in the top half of the income distribution
income gaps now larger than black-white gap
gaps present when students start school (at least in recent cohorts; no data on earlier cohorts)

inequality and education
differences in inequality, coupled with a stable association between income and educational achievement, seems insufficient to explain the patterns of association between inequality and income achievement gaps
rather, the association between income and achievement has changed as well
but why?

a provisional hypothesis

implications
the link between family income and children’s achievement, coupled with the increasing importance of cognitive skills in determining earnings, produces a feedback cycle that leads to low socioeconomic mobility and growing inequality.
this feedback cycle may operate partly through schooling, though schools (in a narrow, functional sense) do not appear to be a primary cause of this trend
nor is it clear that schools (alone) can reverse this trend, though they may be a helpful mechanism.

policy implications
reduce economic inequality greater investment in early childhood prevent development of gaps (easier than remedying later) most cost-effective developmental age for investment means-targeted programs likely most cost-effective (though
maybe less politically feasible?)
support for low-income families repair/strengthen social safety net programs to develop parenting skills (e.g., Nurse-Family
Partnership)
increase education policy focus on students from low-income families and communities develop and test strategies for improving instruction/learning
for low-income students
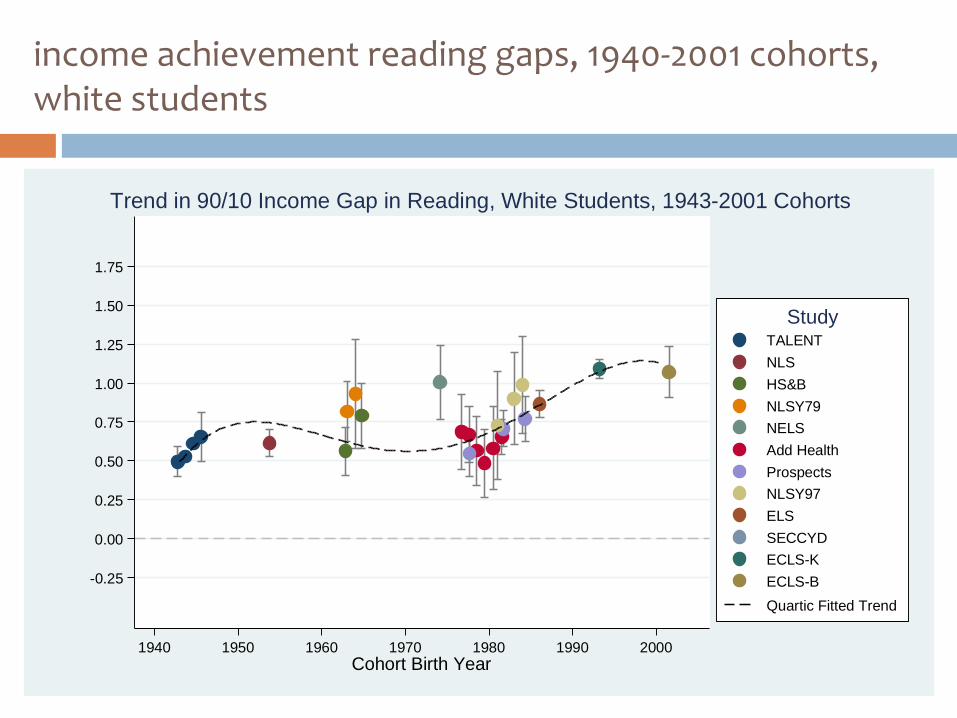
income achievement reading gaps, 1940-2001 cohorts, white students
-0.25
0.00
0.25
0.50
0.75
1.00
1.25
1.50
1.75
Avera
ge
Diffe
ren
ce
in
Sta
nda
rdiz
ed T
est S
core
sB
etw
ee
n 9
0th
& 1
0th
In
co
me
Perc
en
tile
Fa
mili
es
1940 1950 1960 1970 1980 1990 2000
Cohort Birth Year
TALENT
NLS
HS&B
NLSY79
NELS
Add Health
Prospects
NLSY97
ELS
SECCYD
ECLS-K
ECLS-B
Quartic Fitted Trend
Study
Trend in 90/10 Income Gap in Reading, White Students, 1943-2001 Cohorts

income achievement reading gaps, 1940-2001 cohorts, black students
-0.25
0.00
0.25
0.50
0.75
1.00
1.25
1.50
1.75
Avera
ge
Diffe
ren
ce
in
Sta
nda
rdiz
ed T
est S
core
sB
etw
ee
n 9
0th
& 1
0th
In
co
me
Perc
en
tile
Fa
mili
es
1940 1950 1960 1970 1980 1990 2000
Cohort Birth Year
TALENT
NLS
HS&B
NLSY79
NELS
Add Health
Prospects
NLSY97
ELS
SECCYD
ECLS-K
ECLS-B
Quartic Fitted Trend
Study
Trend in 90/10 Income Gap in Reading, Black Students, 1943-2001 Cohorts

income achievement reading gaps, 1940-2001 cohorts, hispanic students
-0.25
0.00
0.25
0.50
0.75
1.00
1.25
1.50
1.75
Avera
ge
Diffe
ren
ce
in
Sta
nda
rdiz
ed T
est S
core
sB
etw
ee
n 9
0th
& 1
0th
In
co
me
Perc
en
tile
Fa
mili
es
1940 1950 1960 1970 1980 1990 2000
Cohort Birth Year
TALENT
NLS
HS&B
NLSY79
NELS
Add Health
Prospects
NLSY97
ELS
SECCYD
ECLS-K
ECLS-B
Quartic Fitted Trend
Study
Trend in 90/10 Income Gap in Reading, Hispanic Students, 1943-2001 Cohorts

income achievement reading gaps, 1940-2001 cohorts, male students
-0.25
0.00
0.25
0.50
0.75
1.00
1.25
1.50
1.75
Avera
ge
Diffe
ren
ce
in
Sta
nda
rdiz
ed T
est S
core
sB
etw
ee
n 9
0th
& 1
0th
In
co
me
Perc
en
tile
Fa
mili
es
1940 1950 1960 1970 1980 1990 2000
Cohort Birth Year
TALENT
NLS
HS&B
NLSY79
NELS
Add Health
Prospects
NLSY97
ELS
SECCYD
ECLS-K
ECLS-B
Quartic Fitted Trend
Study
Trend in 90/10 Income Gap in Reading, Male Students, 1943-2001 Cohorts

income achievement reading gaps, 1940-2001 cohorts, female students
-0.25
0.00
0.25
0.50
0.75
1.00
1.25
1.50
1.75
Avera
ge
Diffe
ren
ce
in
Sta
nda
rdiz
ed T
est S
core
sB
etw
ee
n 9
0th
& 1
0th
In
co
me
Perc
en
tile
Fa
mili
es
1940 1950 1960 1970 1980 1990 2000
Cohort Birth Year
TALENT
NLS
HS&B
NLSY79
NELS
Add Health
Prospects
NLSY97
ELS
SECCYD
ECLS-K
ECLS-B
Quartic Fitted Trend
Study
Trend in 90/10 Income Gap in Reading, Female Students, 1943-2001 Cohorts