the willingness to pay for access to piped water: a ... · ask a sample of unconnected ... (2002)...
TRANSCRIPT

Lett Spat Resour Sci (2012) 5:151–166DOI 10.1007/s12076-012-0079-y
O R I G I NA L PA P E R
The willingness to pay for access to piped water:a hedonic analysis of house prices in SouthwestSri Lanka
Caroline van den Berg · Céline Nauges
Received: 3 January 2011 / Accepted: 2 February 2012 / Published online: 23 February 2012© The Author(s) 2012. This article is published with open access at Springerlink.com
Abstract We apply a hedonic house price analysis to value connection to the pipedwater network in Southwest Sri Lanka based on a household survey that was con-ducted in 2003-04. We find that the willingness-to-pay for a piped water connectionis on average about 5 percent of monthly household expenditure, which is at the lowerend of the range from estimates obtained in case studies in other developing coun-tries. In addition, the willingness-to-pay for piped water decreases as a proportion ofincome when income goes up. An important policy conclusion is that connection tothe piped water system should be considered in relation to the availability and qual-ity of alternative water sources. If alternative sources with good water quality areavailable, the need for a piped water connection is less urgent.
Keywords Household behavior · Piped water services · Hedonic pricing method ·Development planning and policy · Sri Lanka
JEL Classification D12 · H4 · O2 · Q25 · Q52
1 Introduction
The World Health Organization and UNICEF’s Joint Monitoring Programme (2010)estimated that in 2008 about 884 million people in urban areas in developing coun-tries lacked access to safe water. Yet, these numbers do not capture the often low
The opinions reflected in this paper are the opinions of the authors and not opinions of the WorldBank, the University of Queensland.
C. van den Berg (�)Middle East and North Africa’s Sustainable Development Department, Word Bank,1818 H Street NW, Washington DC, USAe-mail: [email protected]
C. NaugesSchool of Economics, University of Queensland, Brisbane Qld, 4072, Australia

152 C. van den Berg, C. Nauges
quality of the services that are provided. The need for reform of water and sanitationservice delivery is therefore urgent, especially in urban areas. Many countries are em-barking on organizational reforms that are needed to improve water provision, whichinclude changes in the way utilities are managed, higher charges for water and sew-erage services,1 and regulation of the sector. Insight into households’ preferences foraccess to safe, accessible water is needed for the development of the reforms underconsideration.
Households’ decisions to connect to a piped (safe) water network are based onthe comparison of associated costs and expected benefits. The connection costs areusually not too difficult to quantify. Yet, estimating benefits is often complicated, asit requires insight into the households’ expected changes in welfare from getting aprivate connection to the network.2
Households without a connection to the piped network face several costs. First,they face hauling costs to collect water from non-piped sources (private or publicwells, public taps, water vended from trucks, etc.). Second, in some cases they haveto pay high prices per unit of non-piped water purchased. Finally, non-piped watermay be of lower quality than water provided through the piped water system. Hence,connecting a household to the piped water network is likely to make access to safewater easier, unit prices lower, and the incidence of water-related diseases smaller.
The value of a connection to the piped network can be estimated using either statedpreference or revealed preference methods. A typical stated preference approach is toask a sample of unconnected households about their maximum willingness to pay fora water connection. This approach has been widely used, for example, by Whittingtonet al. (2002) for Nepal and Pattanayak et al. (2004) for Sri Lanka.
The most common revealed preference approach is the “hedonic property valua-tion method”. This approach infers the value of water connections from differences inproperty values according to connection status. It has been used in developing coun-tries, among others, by North and Griffin (1993) for the Philippines. They find a will-ingness to pay of 2.4 percent of monthly household income (which corresponds to 47percent of monthly rent) or less, with the share falling as income rises. Comparableestimates have been found by Whittington et al. (1990) for rural Kenya and Yusuf andKoundouri (2005) for Indonesia. De Oca et al. (2003) find that households are willingto pay 5.8 percent of their monthly household income for well-maintained servicesand up to 8.3 percent for improved services in Mexico City. Harapap and Hartono(2007) estimate that the availability of piped or pumped water in Indonesia increaseshouse rental prices in urban areas by 9.1 percent. Somewhat lower results have beenobtained by Suparman et al. (2009) who estimate the value of piped water at approx-imately 8 percent of mean household monthly income in rural and urban areas inIndonesia. Nauges et al. (2009) find that tap water connection adds 10–52 percent tothe sales value of a house in El Salvador, depending on the non-tap source. For poor
1Piped water supply is almost universally subsidized although the levels of subsidies tend to decrease whencountries get richer and the cost of piped water as a percentage of household income decreases.2Piped water is, technically speaking, a private good. Yet, because of its public health benefits, thereis widespread consensus that piped water should be provided on a large scale. As such piped water has apublic good character. Hence, the price that consumers pay for piped water supply tends to be only loosely,if at all, related to its scarcity and value.

The willingness to pay for access to piped water: a hedonic analysis 153
neighborhoods in Guatemala they obtain a lower range of 14–19 percent. Anselinet al. (2008) find a hedonic price of INR 170 in Bangalore (2001) and INR 119 inBhopal (2003), but without reference to household incomes.
The present paper reports hedonic price analysis results based on a householdsurvey in Southwest Sri Lanka in 2003-04. This survey was undertaken to supportthe Government of Sri Lanka in its decision to engage private operators in managingand expanding water and sewerage services in two services areas (Greater Negomboand the Kalutara-Galle coastal strip). The basic objective of the survey was to geta better understanding of the demand for piped water services, and hence consumerpreferences, which would be used to shape the envisaged private sector participation.Particularly, estimates of the willingness to pay for connection to the piped networkwould be used to calculate connection fees and monthly service charges, which wouldnot discourage households to connect; for further details see Van den Berg et al.(2006). The results obtained in this paper complement Pattanayak et al. (2006) whoestimate the willingness to pay for piped water by means of contingent valuation forthe same sample of households.
The organization of this paper is as follows. In Sect. 2, we discuss the hedonicprice method and in Sect. 3 the sampling design and the model specification. InSect. 4 we present the estimation results and in Sect. 5 the main conclusions.
2 The hedonic house price method
Hedonic house price equations relate an estimate of a property’s market value to var-ious characteristics of the property, i.e. structural characteristics (square feet of livingspace, dwelling age, number of stories, number of rooms, etc.) and neighborhoodamenities (distance to school, work, access to public services, environmental ameni-ties, etc.). The hedonic pricing method is used to measure the willingness to pay foran amenity, in this case access to a piped water connection. For that purpose, oneideally would like to compare households with identical preferences in situations thatdiffer only in whether the household has access to a piped water connection or not.Preferences are, however, often very heterogeneous, Rosen shows that this compli-cation can be overcome by concentrating on the marginal willingness to pay for theamenity in question. Rosen also assumes perfect competition and perfect observabil-ity of characteristics. These assumptions are not necessarily applicable in the housingmarket where perfect competition is often affected by many different types of regu-lation. In addition, not all housing characteristics are always observable. Bajari andBenkard (2005) show that Rosen’s approach can be generalized to allow for imper-fect competition and unobserved characteristics, which is likely to increase the valueof the hedonic pricing method.3
Following Rosen (1974), the general specification of our hedonic house priceequation is:
V = f (S,N,W)
3The approach proposed by Bajari and Benkard (2005) and its use of non-parametric methods (in thefirst-stage estimation) is outside the scope of this study.

154 C. van den Berg, C. Nauges
where V is the estimated market value of the property (sales price), S denotes a setof structural characteristics, N a set of neighborhood amenities, and W representsthe types of water services available (piped network, other non-piped water sources).The first order derivative of the hedonic price function with respect to one such char-acteristic yields an indirect estimate of the willingness-to-pay for this particular char-acteristic.
Theory has provided little guidance regarding the functional form of the relation-ship between property value and the set of explanatory variables. Various specifi-cations have been used including linear, semi-ln and ln-ln, as well as search-basedspecifications using Box-Cox transformations (Box and Cox 1964). More recently,semi-parametric or fully non-parametric specifications have been applied (see Eke-land et al. 2004). Furthermore, structural equation models (SEM) have been intro-duced into the hedonic price literature by Suparman et al. (2009). Applications ofthe hedonic approach to value house characteristics can be found in Freeman (1993),Daniere (1994), Anselin et al. (2008), and Suparman et al. (2009).
Hedonic price models are usually based on actual sales or rents. In developingcountries, however, actual sales may be affected by high transaction costs, while dataon transactions may be incomplete. Moreover, housing markets are often not per-fectly competitive, sales transactions are often infrequent, and regulatory control canresult in artificially low rent values (Nauges and van den Berg 2009).4 Therefore,owner stated values, obtained from household surveys, are often used instead. Theliterature shows that the discrepancy between actual and estimated value is relativelymodest—from −2 percent (Kain and Quigley 1972) up to 6 percent (Goodman andIttner 1992).
Access to piped water services may result in reciprocal positive spillover amonghouses. For instance, the value of a connected house may go up because it can offerpiped water service to its unconnected neighbors. In a similar vein, the values ofunconnected houses in the vicinity of a connected house may go up. There is noinformation in the dataset to account for this feature, which means that the value ofboth connected and unconnected houses may be undervalued. However, connectedand non-connected houses tend to be grouped in clusters. Therefore, we expect thisfeature to play a minor role.
3 Sample design and model specification
3.1 The sample
The three survey districts were Greater Negombo, Kalutara and Galle from which weselected a sample of households by way of a two-stage stratified-random procedure.The sample size of 1,813 households was determined on the basis of precision inestimates. In Stage 1, we selected within each district geographical strata (so-called
4Housing markets in developed countries are also affected by external influences, such as for instance taxconcessions (e.g., mortgage interest deductions).

The willingness to pay for access to piped water: a hedonic analysis 155
Grahma Niladhari (GN) divisions) ensuring sufficient geographical coverage and spa-tial variation. For each GN we determined the number of interviewees as a fixed pro-portion of its population. In Stage 2 we randomly selected the households in eachGN stratum. For details we refer to Pattanayak et al. (2004). The random selection ofthese households ensures that our sample is representative and allows us to generalizeits findings.
Most households in the area under investigation own their houses—with only6 percent renting their premises. The profile of the latter in terms of water sourcesand income is not very different from the average homeowner, except with regard tothe use of private wells and vendors—with renters less likely to use private wells,and more likely to rely on vendors. There are statistically significant differences inimputed rent between renters and homeowners—with renters indicating substantiallylower rents than homeowners, which may be due to artificially low rents as a con-sequence of rent control, which was prevalent in Sri Lanka until the 1980s.5 Wetherefore excluded renters (114) and those homeowners who did not provide housingvalue data (147). The ultimate sample size is thus 1,552.
3.2 Model specification
The dependent variable is the answer by the interviewee, i.e. the head of household,to the question of what the market value of her or his house would be, if it were soldat the day of the interview. Explanatory variables are:
Structural characteristics including the number of rooms, the number of sealedtoilets, the materials used for walls and roof, and possession of an overhead storagetank. The last three characteristics are dummy variables, i.e. 1 for red bricks or ce-ment; 1 for roof is tiles; and 1 for possession of a storage tank. Presence of toilets isa categorical variable: 0 for no toilets, 1 for one toilet and 2 for two or more toilets.We expect all structural characteristics coded 1 or higher to have positive impacts onproperty value.
Neighborhood characteristics. We use average monthly per capita household in-come and average number of years of education of the head of households in the mu-nicipality6 in which the property is located as proxies for the standard of living. Weexpect positive signs: the higher the standard of living, the higher the house value.The proportion of Samurdhi (the government’s welfare program) recipients is ex-pected to be negatively correlated with house values. Other neighborhood amenitiesincluded in the analysis are the distances from home to schools (primary and sec-ondary school, college), to a dispensary, to a hospital and to roads. However, manyof these amenities do not differ significantly between connected and non-connectedhouseholds. Hence, we focus on the distance to the nearest paved road as the main
5Rent control is guided by the Rent Act of 1972 and the various amendments, including that of 2002.Residential premises occupied by the owner or constructed after January 1, 1980 are not subject to theRent Act. As only 6 percent of the respondents was renting, and only a proportion of that 6 percent livesin houses that were constructed before 1980, it is likely that the effects of rent control are very limited.6The area is divided into three districts. These three districts are made up of 17 municipalities, which areused to calculate the average income in the municipality, the average presence of Samurdhi recipients, andthe average level of education of the head of household.

156 C. van den Berg, C. Nauges
amenity. This characteristic is expected to have a negative sign: the farther away fromthe road, the lower the house appraisal value. We also include district dummies.
Access to water source. We consider access to and use of water from the pipednetwork (i.e., a private connection) versus access to and use of alternative sources(i.e. private wells, public tap, public well, surface water and vendors). In each casewe use a dummy variable that equals 1 if the household is collecting water from thissource and 0 otherwise. Note that most households either use water from the pipedwater system or from private wells. Many households also use other non-piped watersources, but often as supplement, not as a main source. Households were not onlyquestioned about the water sources they had access to, but also the walking time tothe source. However, in most cases, households did not know how much time it tookto go to the sources that they only incidentally used. Therefore, this variable was notconsidered as an explanatory variable.
Obviously, there are many more variables that could be included in the hedonicpricing model. However, availability of data is a major constraint in this part of SriLanka and hence it was not possible to include more data than the ones describedabove.
3.3 Adjusted model specification
In a second model, we will augment the above model with a set of household socioe-conomic characteristics that proxies knowledge and perceptions. Recent literatureshows that knowledge and perceptions have an important effect on economic behav-ior. This is especially important in decisions on housing values where decisions (apartfrom a rational part) also has a more emotional character. We assume that the impactof knowledge and perceptions will be captured by the following three variables: percapita household income, being a Samurdhi (welfare) recipient, and average yearsof education of the head of the household. We expect property valuation to vary bythese variables, since they are proxies for the impact of knowledge and perceptions.This expectation is supported by Keskin (2008) and Suparman et al. (2009) whofind significant relationships between household socioeconomic status and imputedrent. We expect per capita household income to impact house appraisal value posi-tively, because households with higher incomes are more likely to appreciate houseand neighborhood amenities than low income households, e.g. because of experienceor access to information. Education of the head of household, measured in numberof years of formal schooling, is included because we expect individuals with moreformal schooling to be more knowledgeable and hence have a higher ability to accu-rately evaluate structural and neighborhood characteristics and the benefits of a pipedwater connection. The sign of the impact of education is uncertain. The probability ofa household depending on Samurdhi payments is likely to have a negative impact onhouse prices. We expect this second model to result in lower levels of willingness topay for piped water services as the availability of safe water sources (other than pipedwater services) in this part of Sri Lanka is relatively easy, and hence may adverselyaffect people’s willingness to pay for piped water services.

The willingness to pay for access to piped water: a hedonic analysis 157
Table 1 Descriptive statistics for connected and unconnected households
Non-connectedhouseholds(mean)
Connectedhouseholds(mean)
Mean com-parison test(p-value)
Average house value (in LKR) (ln) 13.01 13.31 0.000
Structural characteristics
Average number of rooms 1.23 1.28 0.033
Average number of sealed toilets 1.17 1.25 0.001
Red bricks/cement used for walls(proportion)
0.94 0.98 0.000
Tiles used for roof (proportion) 0.82 0.74 0.000
Storage tank (proportion) 0.46 0.41 0.027
Neighborhood characteristics
Average household income inmunicipality (in LKR) (ln)
9.7 9.78 0.000
Samurdhi recipients in municipality(proportion)
0.18 0.20 0.000
Household located in Negombo(proportion)
0.74 0.26 0.000
Household located in Kalutara(proportion)
0.72 0.28 0.003
Household located in Galle (proportion) 0.55 0.45 0.000
Average distance to pre-school (km) (ln) 0.57 0.08 0.019
Average distance to hospital (km) (ln) −0.04 −0.60 0.000
Average distance to road (km) (ln) 1.34 1.02 0.000
Average distance to beach (km) (ln) 1.39 0.77 0.000
Socio-economic characteristics
Average household monthly income (inLKR) (ln)
9.42 9.58 0.000
Average household per capita monthlyincome (in LKR) (ln)
7.93 8.04 0.004
Proportion of Samurdhi recipients 0.21 0.15 0.004
Average number of years of educationby head of household (ln)
1.93 2.12 0.002
Water sources
Piped water (proportion) 0.00 1.00 0.000
Other water sources as main source(proportion)
1.00 0.00 0.000
4 Empirical results
4.1 Descriptive statistics
Descriptive statistics by connected and unconnected households are presented in Ta-ble 1. Simple tests of means between both types of households are included (last

158 C. van den Berg, C. Nauges
column). We only discuss significant differences. Note that 39 percent of the house-holds are connected.
Average monthly income (including total monthly income of all wage earners inthe household, plus any other income, plus any money remitted to the householdby a family member working outside the country) for connected households is about30 percent higher than the average of unconnected households. The mean comparisontests also suggest that connected households tend to live in houses with more roomsand sealed toilets than unconnected households. Unconnected households are morelikely to have tiles as roof material than connected households, while the oppositeholds for red bricks/cement for walls. Furthermore, a larger proportion of uncon-nected households have a storage tank.
As far as neighborhood characteristics are concerned, there are significant differ-ences in terms of distance to pre-school, hospital, beach, and distance to a paved roadbetween connected and unconnected households. Particularly, unconnected house-holds tend to be located further away from these amenities. Average municipalityincome is higher for connected than for unconnected households. Non-connectedhouseholds are concentrated in the Negombo district and connected households inthe Galle district. The Kalutara district is mixed.
As far as socio-economic characteristics are concerned connected households havehigher total and per capita income, and their household heads have more years ofeducation than unconnected households. In addition, 21 percent of the non-connectedhouseholds are Samurdhi recipients, but only 15 percent of the connected households.
Unconnected households mainly collect water from four sources: public taps, pub-lic wells, neighbors (private tap or private well), and private wells. Nauges and vanden Berg (2009) show that the lowest time cost (to collect water) is borne by house-holds having private wells, followed by households relying on water provided byneighbors. It takes on average about 5 minutes to go to community sources (pub-lic tap or well), and waiting time can be up to 24 minutes. Water from non-pipedsources, except vendors, is free. However households who collect water from wellsneed equipment, which can be a bucket and a rope (for the vast majority of house-holds), a hand pump, or more costly and technically more advanced equipment, suchas an electric pump. Overall, unconnected households are satisfied with the quality(i.e., taste, color, smell, and safety) and service of non-piped water. More precisely,90 percent of households collecting water from public taps, neighbors, and privatewells, believe that water from these sources is safe. This percentage is slightly lowerfor households relying on public wells: 60 percent of these households think thatthere is “no risk” or “little risk” in drinking water from the public well.
Connected households were also questioned about their judgment of the pipedwater service. The majority believes that water supplied through the network is safe.However, there were frequent complaints about piped water being available for lessthan 24 hours a day. Indeed, in the rainy (dry) season, only 31 percent (22 percent) ofconnected households have 24 hour service; and 36 percent (42 percent) have accessfor 12 hours or less a day.
To sum up, satisfaction with access to and quality of water is very high in this partof Sri Lanka, whether a household has access to a piped water connection, a privatewell, or depends on a neighbor for water supply. This means that the willingness

The willingness to pay for access to piped water: a hedonic analysis 159
to pay for connection to the piped system is likely to be rather low, since obtainingaccess to a piped water connection is not seen as a big improvement in terms ofwater safety and quality. We therefore expect the willingness to pay for a piped waterconnection in our study area to be at the lower end of the range of studies such asSuparman et al. (2009) and Nauges et al. (2009).
4.2 The hedonic price model
Functional form search led to the selection of a log-linear model with the dependentvariable and the independent variables (except the dummies) in logarithms. In orderto avoid biases due to very small or very large values, we cut the distribution ofhouse values below the 1 percentile and above the 99 percentile,7 which reduced thesample to 1,552 observations. In this reduced sample, 607 households (39 percent ofthe sample) have a connection to the piped network, 829 households rely on privatewell water as their main source, 89 households used water provided by neighbors and27 households depended on community sources including public wells, public taps,and surface water. A significant number of households use more than one source ofwater; yet, these supplementary sources have not been considered separately.
The Ordinary Least Squares (OLS) estimates results are presented in Table 2. Be-fore going into detail, we observe that some variables (material used for floor, dis-tance to certain types of amenities) turned out to be highly insignificant. Therefore,they were removed from the model, which reduced multi-collinearity. The overall fitof the final model, as measured by the adjusted R-square, is 0.41.
Most of the remaining variables are significant at conventional levels and havethe expected signs. Structural characteristics are highly significant. Particularly, thenumber of rooms, the presence of toilets, a roof made of tiles, walls made of bricksor cement, and access to an overhead storage tank have positive effects on houseappraisal value, as hypothesized.
The neighborhood’s average household income has the expected positive sign:the higher the average household income, the higher the house appraisal value. Theproportion of government welfare (Samurdhi) recipients in the municipalities on theother hand has a negative impact. The average number of years of education of thehead of household had the expected positive sign, but was insignificant. Furthermore,distance to the road indicates that the further a house is located away from the road,the lower its appraisal value. The regional dummies are also significant. Properties inKalutara and Galle tend to have lower house values than those in Negombo, whichis closer to the capital and tends to have more economic activity than the two otherregions. Connection to the piped water network has a significant, positive coefficient.
4.3 The adjusted hedonic price model
The OLS estimates results for the adjusted hedonic pricing model are presented inTable 3. The overall fit of the reduced model, as measured by the adjusted R-square,is 0.45, compared to 0.41 for the conventional model.
7The coefficient measuring the impact of a connection was not affected by deletion of the tails. The overallfit of the model improved, however.

160 C. van den Berg, C. Nauges
Table 2 OLS estimation results of the conventional hedonic house price model
Dependent variable (ln of house appraisal value) Coefficient Std. err. p value
Constant 7.575∗∗∗ 1.013 0.000
Structural characteristics
Number of rooms (ln) 0.640∗∗∗ 0.052 0.000
Number of toiletsa (0/1/2) 0.467∗∗∗ 0.052 0.000
Wall is made of red bricks or cement (otherwise reference ) 0.929∗∗∗ 0.113 0.000
Roof is made of tiles (otherwise reference case) 0.143∗∗ 0.054 0.008
Overhead storage tank (not available reference case) 0.323∗∗∗ 0.048 0.000
Neighborhood characteristics
Mean household income by municipality (ln) 0.355∗∗∗ 0.112 0.002
Percentage of Samurdhi recipients by municipality −1.856∗∗∗ 0.414 0.000
Distance to road in km (ln) −0.071∗∗∗ 0.022 0.001
Negombo district (reference case)
Kalutara district (0/1) −0.208∗∗∗ 0.056 0.000
Galle district (0/1) −0.110∗ 0.051 0.032
Water source
Household has access to non-piped sources only (reference)
Household has access to private piped water connection (0/1) 0.195∗∗∗ 0.048 0.000
Number of observations 1,523b
Adjusted R-squared 0.41
∗∗∗, ∗∗, ∗ Indicate significance at the 1, 5, and 10% level, respectivelyaPresence of toilet: 0 = no toilet, 1 = one toilet only, 2 = two or more toilets
bThe sample on which the model is estimated is smaller than the sample of 1,552 households discussed inSect. 4, because of non-response in some of the explaining variables, which reduces the total number ofincluded observations to 1,523
Most of the remaining variables are significant at conventional levels and havethe expected signs. Structural characteristics are highly significant, and so are theneighborhoods characteristics. Introducing socio-economic characteristics as a proxyfor impact of perceptions and knowledge shows that the connection to the piped waternetwork has a significant, positive coefficient, but that it is lower than in the traditionalhedonic pricing model (Table 2).8 This tendency of hedonic pricing models to providean upper bound of willingness to pay has been noted by different authors (Vaughanand Ardila 1993; Carson et al. 1996).
In the next subsection we use this piece of information to derive the marginalwillingness to pay for a private piped water connection.
8Note however that the estimated coefficients of a piped water connection in the conventional and adjustedmodels are not statistically different, in the sense that the corresponding 95% confidence intervals overlap.

The willingness to pay for access to piped water: a hedonic analysis 161
Table 3 OLS estimation results of the adjusted hedonic house price model
Dependent variable (ln of house appraisal value) Coefficient Std. err. p value
Constant 5.818∗∗∗ 1.096 0.000
Structural characteristics
Number of rooms (ln) 0.556∗∗∗ 0.052 0.000
Number of toiletsa (0/1/2) 0.334∗∗∗ 0.052 0.000
Wall is made of red bricks or cement (otherwise reference ) 0.847∗∗∗ 0.111 0.000
Roof is made of tiles (otherwise reference case) 0.138∗∗ 0.053 0.009
Overhead storage tank (not available reference case) 0.219∗∗∗ 0.048 0.000
Household socio-economic characteristics
Monthly household income (ln) 0.267∗∗∗ 0.033 0.000
Household is Samurdhi recipient −0.271∗∗∗ 0.060 0.000
Education of head of household in number of years (ln) 0.031∗ 0.018 0.086
Neighborhood characteristics
Mean household income by municipality (ln) 0.310∗∗∗ 0.109 0.005
Percentage of Samurdhi recipient by municipality −1.553∗∗∗ 0.406 0.000
Distance to road in km (ln) −0.071∗∗∗ 0.021 0.000
Negombo district (reference case)
Kalutara district (0/1) −0.175∗∗∗ 0.055 0.001
Galle district (0/1) −0.094∗ 0.050 0.062
Water source
Household has access to non-piped sources only (reference)
Household has access to private piped water connection (0/1) 0.152∗∗∗ 0.047 0.001
Number of observations 1,491b
Adjusted R-squared 0.45
∗∗∗, ∗∗, ∗ Indicate significance at the 1, 5, and 10% level, respectivelyaPresence of toilet: 0 = no toilet, 1 = one toilet only, 2 = two or more toilets
bThe sample on which the model is estimated is smaller than the sample of 1,552 households discussed inSect. 4, because of non-response in some of the explaining variables, which reduces the total number ofincluded observations to 1,491
4.4 The marginal willingness-to-pay for a private connection
We now turn to the derivation of the marginal willingness-to-pay for connection tothe public water system. Coefficient β̂ in Tables 2 and 3 denote the difference in lnvalue between connected and unconnected houses and the absolute increase in housevalue from the connection to the piped network is V NC(eβ̂ − 1) or in percentages:
V NC(eβ̂ − 1) × 100
V NC= (eβ̂ − 1) × 100.

162 C. van den Berg, C. Nauges
Table 4 Predicted increase in house value after connection according to the basic hedonic pricing model(overall, monthly equivalent, % of monthly household income)
Predicted increase in house value (LKR) Monthly equivalent ofincrease in house value(LKR)
As % of monthlyhousehold income(non-connected)
Mean[95% confidenceinterval]
Median[95% confidenceinterval]
Mean[95%confidenceinterval]
Median[95%confidenceinterval]
Mean[95%confidenceinterval]
Median[95%confidenceinterval]
97,149[47,839;151,437]
100,430[49,454;156,550]
810[399;1,262]
837[412;1,305]
6.6%[3.2%;10.2%]
7.0%[3.4%;10.9%]
In the conventional hedonic pricing model, β̂ = 0.195 (0.152 in the adjusted model),which translates into a relative increase in house value (after connection) of about 22(in the adjusted model reduced to 16) percent. However, β̂ is estimated with error.The 95% confidence interval for β̂ is [0.061 and 0.247], which corresponds to a 95%interval of [6% and 25%] in percentages when the basic hedonic pricing model isused.
4.5 The average monthly income equivalent
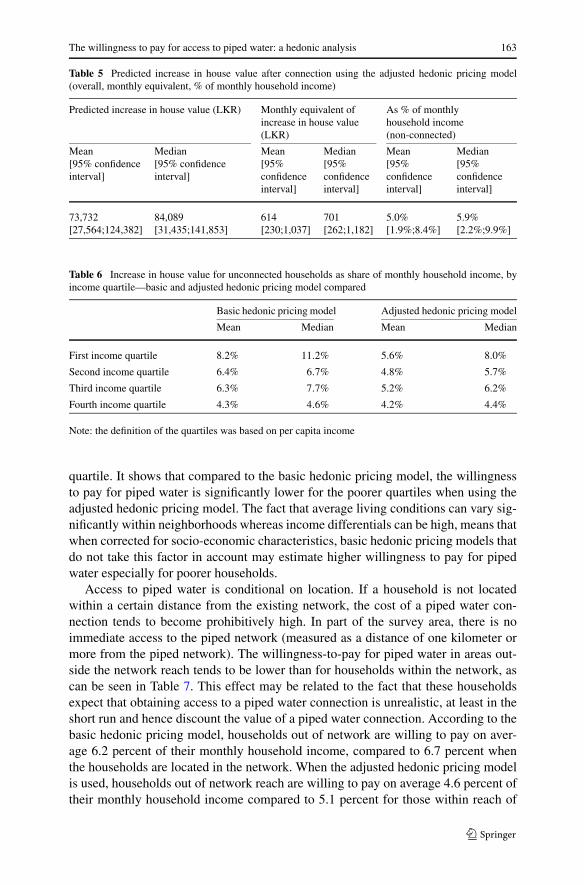
We define the average monthly equivalent of the increase in house value due to con-nection as 1/12 of the discounted annualized increase. We use a discount rate of10 percent, which is the rate charged by a self-help group or microfinance institution.In Table 4 we report in the first column the predicted increase in house value afterconnection to the piped network (based on the estimated parameter (β̂ = 0.195) ofthe connection dummy variable), and the monthly equivalent, in absolute terms andas a percentage of monthly household income. We find that non-piped householdson average would be willing to pay each month about LKR 810 (median LKR 837),which is about 6.6 percent of their monthly household income, to get a connection tothe piped network.9 When using the adjusted model that takes a better account of theperceptions and knowledge, the results are significantly lower and non-piped house-holds are on average willing to pay only LKR 614 (median LKR 701) which is about5 percent of their monthly household income as shown in Table 5. These numbersare in the range of North and Griffin (1993) for the Philippines, De Oca et al. (2003)for Mexico, Nauges et al. (2009) for Central America, and Suparman et al. (2009) forIndonesia.
In Table 6 we show the monthly equivalents for different income groups. The firstquartile is the 25 percent of households with the lowest per capita income, and so on.Table 6 shows that the expected willingness-to-pay for access to a private connec-tion decreases as a proportion of income when income goes up, although there is akink whereby the expected willingness-to-pay decreases from the first to the secondquartile, but it increases in the third quartile, after which it decreases in the fourth
9The total increase in house value due to the water connection is on average LKR 97,149, which translatesinto a monthly value of LKR97, 194 × 1/12 × 10 percent = LKR 810; and an annual value of LKR 9,715.
The willingness to pay for access to piped water: a hedonic analysis 163
Table 5 Predicted increase in house value after connection using the adjusted hedonic pricing model(overall, monthly equivalent, % of monthly household income)
Predicted increase in house value (LKR) Monthly equivalent ofincrease in house value(LKR)
As % of monthlyhousehold income(non-connected)
Mean[95% confidenceinterval]
Median[95% confidenceinterval]
Mean[95%confidenceinterval]
Median[95%confidenceinterval]
Mean[95%confidenceinterval]
Median[95%confidenceinterval]
73,732[27,564;124,382]
84,089[31,435;141,853]
614[230;1,037]
701[262;1,182]
5.0%[1.9%;8.4%]
5.9%[2.2%;9.9%]
Table 6 Increase in house value for unconnected households as share of monthly household income, byincome quartile—basic and adjusted hedonic pricing model compared
Basic hedonic pricing model Adjusted hedonic pricing model
Mean Median Mean Median
First income quartile 8.2% 11.2% 5.6% 8.0%
Second income quartile 6.4% 6.7% 4.8% 5.7%
Third income quartile 6.3% 7.7% 5.2% 6.2%
Fourth income quartile 4.3% 4.6% 4.2% 4.4%
Note: the definition of the quartiles was based on per capita income
quartile. It shows that compared to the basic hedonic pricing model, the willingnessto pay for piped water is significantly lower for the poorer quartiles when using theadjusted hedonic pricing model. The fact that average living conditions can vary sig-nificantly within neighborhoods whereas income differentials can be high, means thatwhen corrected for socio-economic characteristics, basic hedonic pricing models thatdo not take this factor in account may estimate higher willingness to pay for pipedwater especially for poorer households.
Access to piped water is conditional on location. If a household is not locatedwithin a certain distance from the existing network, the cost of a piped water con-nection tends to become prohibitively high. In part of the survey area, there is noimmediate access to the piped network (measured as a distance of one kilometer ormore from the piped network). The willingness-to-pay for piped water in areas out-side the network reach tends to be lower than for households within the network, ascan be seen in Table 7. This effect may be related to the fact that these householdsexpect that obtaining access to a piped water connection is unrealistic, at least in theshort run and hence discount the value of a piped water connection. According to thebasic hedonic pricing model, households out of network are willing to pay on aver-age 6.2 percent of their monthly household income, compared to 6.7 percent whenthe households are located in the network. When the adjusted hedonic pricing modelis used, households out of network reach are willing to pay on average 4.6 percent oftheir monthly household income compared to 5.1 percent for those within reach of

164 C. van den Berg, C. Nauges
Table 7 Increase in house value for unconnected households as a share of monthly household income, bylocation within and outside piped network—basic and adjusted hedonic pricing model compared
Basic hedonic pricing model Adjusted hedonic pricing model
Mean Median Mean Median
Inside piped network 6.7% 7.0% 5.1% 5.9%
Outside piped network 6.2% 7.0% 4.6% 5.0%
the piped network. The fact that their willingness to pay is not zero shows that evenhouseholds located outside of the piped network value connection.
5 Conclusions and directions for future research
The main empirical finding of this paper is that the willingness-to-pay for a pipedwater connection is on average about 5–7 percent of monthly household expenditure.This estimate is at the lower end of the range found in the literature. One likely ex-planation for this downward deviation is the availability of alternative water sourcesof good quality, which are good substitutes for piped water (Nauges et al. 2009).Many households in Southwest Sri Lanka have access to private wells that providehigh quality water. The result obtained in this paper is in line with the outcomeof a contingent valuation analysis for the same sample. The basic hedonic pricingmodel results in a relatively high willingness to pay for piped water services. Thistendency of hedonic pricing models to provide an upper bound of willingness topay has been noted earlier by many different authors (Vaughan and Ardila 1993;Carson et al. 1996).
Following the methodology of Hutton et al. (2007), average household investmentcost in this part of Sri Lanka in 2003-04 was about LKR 44,000. To obtain the totalcost of piped water service, the cost of annual operation and maintenance also needsto be taken into account and added to these investment costs. The (one time) connec-tion fee (to be paid by the consumer) in 2003-04 was about LKR 9,000, while an av-erage household would spend about LKR 1,200 per year on its water bills. Assuminga 10 percent discount rate and a 20 year lifetime of the connection, this would meanan average cost of about LKR 58,400. With an average increase in the house appraisalvalue after the installation of a piped water connection of about LKR 97,000, a pipedwater connection is a cost effective investment for many households in Southwest SriLanka. Yet, for the poorest 25 percent of the population, the house appraisal value—using the basic hedonic pricing model that results in a upper bound of willingness topay—increases only by about LKR 42,000 to 60,000 (depending on the model used),such that the installation of a piped water connection may not be sufficient to coverthe cost of a piped water supply investment, and hence subsidies may be required tomake this an attractive investment option.10
10A household in the lowest quartile sees its average house appraisal value increase only by LKR 60,000when the basic hedonic model is used, and it drops to less than LKR 42,000 when the adjusted hedonicmodel is applied.

The willingness to pay for access to piped water: a hedonic analysis 165
Subsidies in the water sector are common around the world. However, they areoften based on connection to the piped network, as in Southwest Sri Lanka, whichbenefits richer consumers more than poorer consumers (Komives et al. 2005), as thepoor tend to be disproportionally less likely to be connected to the piped network.With the information on the profile of the poor and their willingness to pay derivedfrom an analysis such as the present, authorities will be able to design a subsidysystem that is better targeted to the poor.
Households out of reach of the network have lower willingness to pay for pipedwater services than those within reach. Nevertheless, bringing households into thepiped network’s reach provides benefits to households, whether or not they connect.This suggests that investing in basic infrastructure will generate benefits, as it willincrease the overall value of the neighborhoods in which the investments are made.The results presented above show that installing a piped water system in the studyarea would be viable, because the benefits outweigh the cost of the service.
In view of the many unobserved characteristics that we found, which may explainthe tendency of hedonic pricing models to provide an upper bound of willingnessto pay, a direction for future research is using the approach proposed by Bajari andBenkard (2005) in the housing market in both developing and developed countries.
Open Access This article is distributed under the terms of the Creative Commons Attribution Licensewhich permits any use, distribution, and reproduction in any medium, provided the original author(s) andthe source are credited.
References
Anselin, L., Lozana-Garcia, N., Deichmann, U., Lall, S.: Value of access to water: a spatial hedonic ap-proach applied to Indian cities. World Bank Policy Research Working Paper No. 4533, Washington,DC (2008)
Bajari, P., Benkard, C.L.: Demand estimation with heterogeneous consumers and unobserved product char-acteristics: a hedonic approach. J. Polit. Econ. 113(6), 1239–1276 (2005)
Box, G.E.P., Cox, D.R.: An analysis of transformations. J. R. Stat. Soc. B 26, 211–246 (1964)Carson, R.T., Flores, N.E., Martin, K.M., Wright, J.L.: Contingent valuation and revealed preference
methodolines: comparing the estimates for quasi-public good. Land Econ. 72(1), 80–99 (1996)De Oca, G.S.M., Bateman, I.J., Tinch, R., Moffatt, P.G.: Assessing the willingness to pay for maintained
and improved water supplies in Mexico City. CSERGE Working Paper ECM 03-11 (2003)Daniere, A.: Estimating willingness to pay for housing attributes: an application to Cairo and Manila. Reg.
Sci. Urban Econ. 24, 577–599 (1994)Ekeland, I., Heckman, J.J., Nesheim, L.: Identification and estimation of hedonic models. J. Polit. Econ.
112(1), 60–109 (2004)Freeman, A.M.: Hedonic prices, property values and measuring environmental benefits: a survey of the
issues. Scand. J. Econ. 81(2), 154–173 (1993)Goodman, J.L., Ittner, J.B.: The accuracy of home owners’ estimates of house value. J. Hous. Econ. 2,
339–357 (1992)Harapap, B.N., Hartono, D.: Analysis of willingness to pay and determinant of drinking water and sanita-
tion availability in Indonesia using hedonic price model approach and lnistic model. Working Paperin Economics and Development Studies, Department of Economics, Padjadjaran University (2007)
Hutton, G., Haller, L., Bartram, J.: Global cost-benefit analysis of water supply and sanitation interven-tions. J. Water Health 5(4), 481–501 (2007)
Kain, J.F., Quigley, J.M.: Housing market discrimination, home-ownership, and savings behavior. Am.Econ. Rev. 62(3), 263–277 (1972)
Keskin, B.: Hedonic analysis of price in the Istanbul housing market. Int. J. Strateg. Prop. Manag. 12,125–138 (2008)

166 C. van den Berg, C. Nauges
Komives, K., Foster, V., Halpern, J., Wodon, Q., Abdullah, R.: Water, electricity and the poor: who benefitsfrom utility subsidies? The World Bank, Washington, DC (2005)
Nauges, C., van den Berg, C.: Demand for piped and non-piped water supply services: evidence fromSouthwest Sri Lanka. Environ. Resour. Econ. 42, 535–549 (2009)
Nauges, C., Strand, J., Walker, I.: The value of water connections in Central American cities: a revealedpreference study. Environ. Dev. Econ. 14(3), 349–370 (2009)
North, J.H., Griffin, C.C.: Water source as a housing characteristic: hedonic property valuation and will-ingness to pay for water. Water Resour. Res. 29(7), 1923–1929 (1993)
Pattanayak, S.K., Yang, J.-C., Agarwal, C., Gunatilake, H.M., Bandara, H., Ranasinghe, T.: Water, sanita-tion and poverty in Southwest Sri Lanka. RTI Project number 8812.000 (2004)
Pattanayak, S.K., van den Berg, C., Yang, J.-C., Van Houtven, G.: The use of willingness to pay exper-iments: estimating demand for piped water connections in Sri Lanka. World Bank Policy ResearchWorking Paper No. 3818, Washington, DC (2006)
Rosen, S.: Hedonic prices and implicit markets: product differentiation in perfect competition. J. Polit.Econ. 82, 34–55 (1974)
Suparman, Y., Folmer, H., Oud, H., Resosudamo, B.P.: Eliciting the willingness to pay for piped water fromself-reported rent appraisals in Indonesia: a SEM autoregressive panel approach. Mimeo (2009)
Van den Berg, C., Pattanayak, S., Yang, J.-C., Gunatilake, H.: Getting the assumptions right: private sectorparticipation transaction design and the poor in Southwest Sri Lanka. World Bank Water Supply andSanitation Sector Board Discussion Paper Series, Paper No. 7 (2006)
Vaughan, W.J., Ardila, S.: Economic analysis of the environmental aspects of investment projects. WorkingPaper ENP100, Inter-American Development Bank, Washington, DC (1993)
Whittington, D., Mu, X., Roche, R.: Calculating the value of time spent collecting water: some estimatesfrom Ukunda, Kenya. World Dev. 18, 269–280 (1990)
Whittington, D., Pattanayak, S.K., Yang, J.C., Bal Kumar, K.C.: Household demand for improved pipedwater services: evidence from Kathmandu, Nepal. Water Policy 4, 531–556 (2002)
WHO-UNICEF Joint Monitoring Programme for Water Supply and Sanitation: Progress on Sanitation andDrinking Water: Update, Geneva (2010)
Yusuf, A.A., Koundouri, P.: Willingness to pay for water and location bias in hedonic price analysis:evidence from the Indonesian housing market. Environ. Dev. Econ. 10(6), 821–836 (2005)