the windsat spaceborne polarimetric microwave radiometer
TRANSCRIPT
IEEE TRANSACTIONS ON GEOSCIENCE AND REMOTE SENSING, VOL. 42, NO. 11, NOVEMBER 2004 2347
The WindSat Spaceborne Polarimetric MicrowaveRadiometer: Sensor Description
and Early Orbit PerformancePeter W. Gaiser, Senior Member, IEEE, Karen M. St. Germain, Senior Member, IEEE, Elizabeth M. Twarog,
Gene A. Poe, Member, IEEE, William Purdy, Donald Richardson, Walter Grossman, Member, IEEE,W. Linwood Jones, Fellow, IEEE, David Spencer, Gerald Golba, Member, IEEE, Jeffrey Cleveland, Larry Choy,
Richard M. Bevilacqua, and Paul S. Chang, Senior Member, IEEE
Abstract—The global ocean surface wind vector is a key pa-rameter for short-term weather forecasting, the issuing of timelyweather warnings, and the gathering of general climatologicaldata. In addition, it affects a broad range of naval missions, in-cluding strategic ship movement and positioning, aircraft carrieroperations, aircraft deployment, effective weapons use, underwayreplenishment, and littoral operations. WindSat is a satellite-basedmultifrequency polarimetric microwave radiometer developedby the Naval Research Laboratory for the U.S. Navy and theNational Polar-orbiting Operational Environmental SatelliteSystem Integrated Program Office. It is designed to demonstratethe capability of polarimetric microwave radiometry to measurethe ocean surface wind vector from space. The sensor providesrisk reduction for the development of the Conical MicrowaveImager Sounder, which is planned to provide wind vector dataoperationally starting in 2010. WindSat is the primary payload onthe Department of Defense Coriolis satellite, which was launchedon January 6, 2003. It is in an 840-km circular sun-synchronousorbit. The WindSat payload is performing well and is currentlyundergoing rigorous calibration and validation to verify missionsuccess.
Index Terms—Ocean surface winds, remote sensing, WindSat.
I. INTRODUCTION
THE GLOBAL ocean surface wind vector (wind speed anddirection) field provides essential environmental infor-
mation. It is critical data for short-term weather forecasts andwarnings, nowcasting, climatology, and oceanography studies.Ocean surface wind field measurements support basic researchin air–sea interaction, tropical cyclogenesis, ocean circulation,
Manuscript received February 12, 2004; revised June 16, 2004. The WindSatprogram is supported by the U.S. Navy (N61) and the NPOESS Integrated Pro-gram Office.
P. W. Gaiser, K. M. St. Germain, E. M. Twarog, W. Purdy, D. Spencer, G.Golba, J. Cleveland, L. Choy, and R. M. Bevilacqua are with the Naval ResearchLaboratory, Washington, DC 20375 USA (e-mail: [email protected]).
G. A. Poe is with the Naval Research Laboratory, Monterey, CA 93943 USA.D. Richardson is with Computational Physics, Inc., Springfield, VA 22151
USA.W. Grossman is with Applied Systems Engineering, Inc., Gambrills, MD
21054 USA.W. L. Jones is with Microwave Remote Sensing Consultants, Cocoa Beach,
FL 32931 USA.P. S. Chang is with the National Oceanic and Atmospheric Administration,
National Environmental Satellite, Data, and Information Service, Office of Re-search and Applications, Camp Springs, MD 20746 USA.
Digital Object Identifier 10.1109/TGRS.2004.836867
and atmospheric convection. In addition, the wind vector af-fects a broad range of naval operations including strategic shipmovement and positioning, aircraft carrier operations, aircraftdeployment, underway replenishment, and littoral operations.Historically, spaceborne scatterometers such as the NationalAeronautics and Space Administration (NASA) NSCAT andSeaWinds instruments have provided global ocean surfacewind vector information. However, there have never been asufficient number of these sensors simultaneously operational,in the proper orbits, to satisfy revisit and coverage requirementsnecessary for full utilization in operational meteorologicalapplications.
Passive spaceborne microwave radiometry has a strong her-itage based largely on the Special Sensor Microwave/Imager(SSM/I) series of instruments, operated by the Defense Mete-orological Satellite Program (DMSP). Over the past 15 years,seven SSM/Is have successfully provided reliable passive mi-crowave data for retrieving environmental parameters such aswind speed, sea ice concentration and age, and integrated atmo-spheric water vapor [1]–[3]. One parameter that has not beenprovided by microwave radiometers is the wind direction. How-ever, analysis of SSM/I data has revealed a wind direction de-pendence in the vertical and horizontal polarizations, which hasbeen confirmed by modeling and aircraft measurements [4], [5].But, the vertical and horizontal channels do not contain enoughinformation to unambiguously retrieve the wind direction, be-cause the wind direction dependencies, for both vertical andhorizontal polarizations, are even functions about relative winddirections of 0 and 180 .
Recent research in polarimetric radiometry modeling andmeasurements has demonstrated that usable wind directioninformation can be obtained by combining the vertical andhorizontal polarizations with the cross correlation of those twopolarizations [4]–[11]. The cross-correlation terms representthe third and fourth parameters of the modified Stokes vector,defined [12] as
(1)
In this definition, , , , , , and representbrightness temperatures (radiances) at vertical, horizontal,
0196-2892/04$20.00 © 2004 IEEE
2348 IEEE TRANSACTIONS ON GEOSCIENCE AND REMOTE SENSING, VOL. 42, NO. 11, NOVEMBER 2004
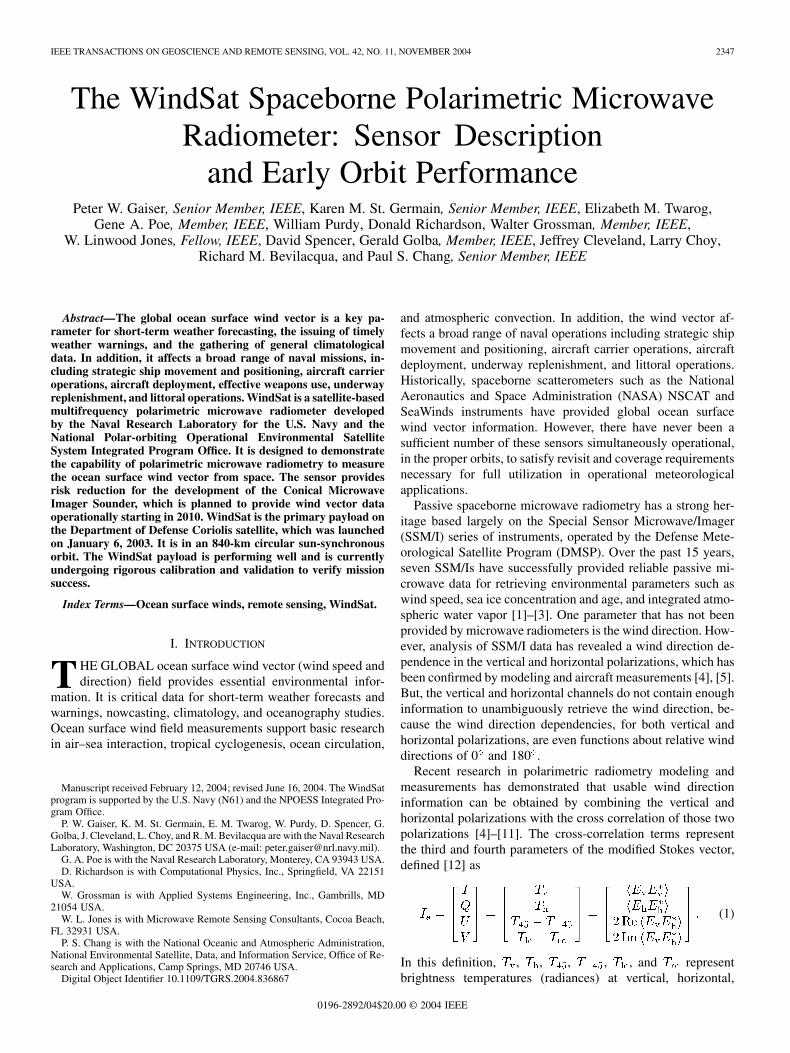
Fig. 1. WindSat payload in the thermal/vacuum chamber. The cold skyreflector has been removed in this picture.
45 , 45 , left-hand circular, and right-hand circular po-larizations, respectively. The Stokes vector provides a fullcharacterization of the electromagnetic signature of the oceansurface and the independent information needed to, at least inprinciple, uniquely determine the wind direction.
These advances come at a critical time for the developmentof future environmental remote sensing systems. Through itsIntegrated Operational Requirements Document (IORD) 1, ofMarch 14, 1996, the National Polar-orbiting Operational Envi-ronmental Satellite System (NPOESS) program is required toprovide, over a period of at least ten years, for remotely sensing,storing, and disseminating real-time global and regional envi-ronmental data in support of Department of Defense (DoD) andDepartment of Commerce (DoC) operational requirements. Animportant element of that capability is the accurate measure-ment of the ocean surface wind vector. Based on the aforemen-tioned results and studies, NPOESS has opted to fulfill the windvector measurement requirement using polarimetric microwaveradiometry. That is, the NPOESS Conical Microwave Imagerand Sounder (CMIS), which is the NPOESS replacement for theDMSP SSM/I program, will incorporate polarimetric capability.This would allow the global ocean wind vector, along with themany other environmental parameters now obtained by SSM/I,to be obtained with a single instrument.
WindSat is the first spaceborne polarimetric microwave ra-diometer. Its objective is to measure the partially polarized emis-sion from the ocean surface and, therefore, test and fully eval-uate the viability of using passive polarimetric radiometry toretrieve the ocean surface wind vector. The WindSat payload,shown in Fig. 1, was designed, built, and tested at the Naval Re-
search Laboratory (NRL) in Washington, DC, under sponsor-ship from the United States Navy and NPOESS. The WindSatradiometer operates in discrete bands at 6.8, 10.7, 18.7, 23.8,and 37.0 GHz. The 10.7-, 18.7-, and 37.0-GHz channels arefully polarimetric, while the 6.8- and 23.8-GHz channels aredual polarized only (vertical and horizontal). The WindSat in-strument was successfully launched on board the DoD Cori-olis satellite mission on January 6, 2003, into an 840-km sun-synchronous orbit with the local time of the ascending node(LTAN) at 17:59. The instrument is currently operating nomi-nally. WindSat calibration and the development of wind vectorretrievals are ongoing work at the time of writing. This paper de-scribes the WindSat mission and sensor design, describing theunique aspects of the development of a spaceborne polarimetricmicrowave radiometer. The paper then presents the early orbitradiometer performance.
II. REQUIREMENTS
A. Performance Requirements
The requirements for wind vector are typically broken downinto requirements for Sea Surface Wind Speed (SSWS) and SeaSurface Wind Direction (SSWD). The WindSat top-level per-formance goals are summarized in Table I and compared withNPOESS IORD and the CMIS.
In addition to the required ocean surface wind speed and di-rection, the WindSat system will provide a host of secondaryocean-scene environmental data products. These products are:column integrated cloud liquid water (CLW), column integratedprecipitable water (PW), and sea surface temperature (SST).The WindSat data also have potential applications for land andice data products.
The WindSat spatial resolution requirement represents acompromise between meeting the NPOESS CMIS/IORDrequirement, staying within the allowable launch vehicle enve-lope, and minimizing risk and cost associated with postlaunchreflector antenna deployment. WindSat does not have opera-tional requirements driving the swath width or global coverage.Rather, the WindSat mission is designed so that a portion ofthe swath is sampled in both the forward and aft viewing direc-tions. This two-look capability provides an evaluation of thewind direction retrieval accuracy under single- and two-lookoperations. In this manner, an assessment will be made of thenecessity of such a configuration for an operational system.
B. Sensor Requirements
The WindSat design team performed a radiometric sensitivityanalysis to derive all key WindSat system requirements to meetthe wind speed and direction performance goals. In support ofthis effort, NRL developed a two-scale model of the ocean sur-face emission and scattering [11], [13] and validated it usingdata collected from an aircraft platform. The model was also val-idated with SSM/I data and surface-based measurements. Fol-lowing the model development, software was developed at NRLto simulate the effects of WindSat system errors on the data.The simulator accounts for system errors introduced by onboardalignment and pointing errors, calibration load uncertainties, ra-diometer nonlinearity, channel-to-channel imbalances, physicaltemperature uncertainty, and environmental and random noise.
GAISER et al.: WINDSAT SPACEBORNE POLARIMETRIC MICROWAVE RADIOMETER 2349
TABLE IWINDSAT PERFORMANCE REQUIREMENTS
TABLE IIPERFORMANCE REQUIREMENTS FOR WINDSAT. THE ABSOLUTE ACCURACY REQUIREMENTS ARE 0.75 K FOR THE VERTICAL AND HORIZONTAL POLARIZATIONS
AND 0.25 K FOR THE THIRD AND FOURTH STOKES PARAMETERS. THE NEDT REQUIREMENTS ASSUME SCENE BRIGHTNESS TEMPERATURE OF 250 K
TABLE IIIWINDSAT SCAN AND SAMPLING REQUIREMENTS
TABLE IVWINDSAT ANTENNA PERFORMANCE REQUIREMENTS. THE POLARIZATION PURITY REFERS TO RESIDUAL COUPLING AFTER
CORRECTION FOR ANTENNA CROSS POLARIZATION
Using the simulator, the design team generated a large data-base of “observations” that could be run through data correctionand wind retrieval algorithms, resulting in a comparison of orig-inal versus retrieved geophysical parameters. Using an iterativeprocess, the design team partitioned the allowable errors and de-termined what knowledge of these errors was necessary for ef-fective correction to be possible. The sensitivity analysis derived
the required noise-equivalent differential temperature (NEDT)based on the effective field of view (EFOV) after averaging mul-tiple pixels together. This was converted to single-pixel or in-stantaneous field of view (IFOV) based on design integrationtimes and a scene temperature of 250 K. The top-level require-ments for radiometers, sampling, and antenna are shown in Ta-bles II–IV, respectively.
2350 IEEE TRANSACTIONS ON GEOSCIENCE AND REMOTE SENSING, VOL. 42, NO. 11, NOVEMBER 2004
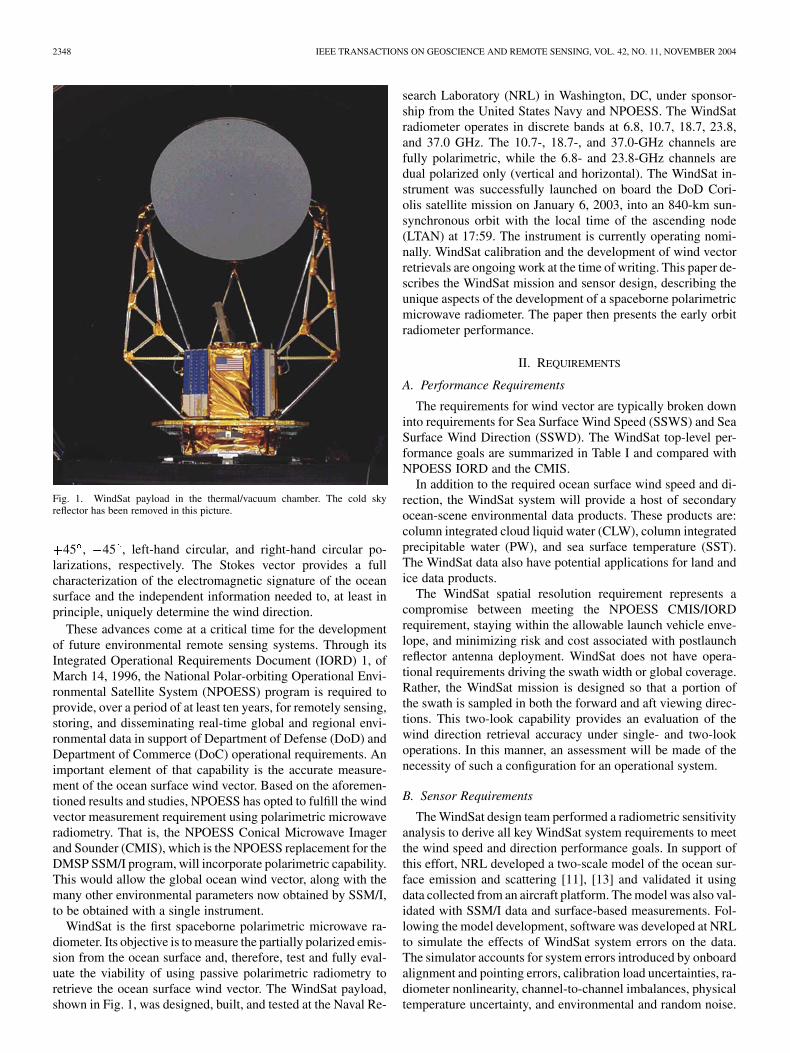
Fig. 2. Drawing of the WindSat payload with major components labeled.
III. INSTRUMENT DESCRIPTION
WindSat is the world’s first spaceborne microwave po-larimeter (high-precision passive microwave imager) thatmeasures the partially polarized energy emitted, scattered,and reflected from the earth’s atmosphere and surfaces. Theinstrument operates with 22 discrete channels covering fivewidely spaced frequency bands. For the polarimetric bands(10.7, 18.7, and 37.0 GHz), three dual-polarization feed hornsare used: V/H, linear, and left/right circular. Thethird and fourth Stokes parameters are formed by taking thebrightness temperature difference between the andpolarizations, and the left-hand and right-hand circular polar-izations, respectively, as described in (1).
WindSat comprises four major subsystems: antenna/cal-ibration subsystem (spinning and nonspinning), receiversubsystem (spinning), data handling subsystem (spinning andnonspinning), and structural/thermal subsystem (spinning andnonspinning). Fig. 2 depicts a conceptual drawing of WindSatwith the major elements indicated. The subsystems are de-scribed here.
A. Antenna/Calibration Subsystem
The antenna/calibration subsystem consists of the mainreflector, 11 feed horns, a warm calibration load, and a coldsky calibration reflector. The main reflector is a 1.8-m diameteroffset parabolic reflector fabricated of graphite epoxy withvapor deposited aluminum (VDA) coating. The reflector, alongwith the majority of the sensor hardware, rotates at a nominalrate of 31.6 r/min. A composite truss with a very low coefficientof thermal expansion (CTE) supports the main reflector. The11 dual-polarized corrugated feedhorns provide the initial fre-quency channelization of the system and polarization splittingvia orthomode transducers (OMT). The circularly polarizedfeeds use polarizers based on the design of Simmons [14].However, the WindSat polarizers achieve the necessary phaseshift with tuning screws rather than dielectric vanes.
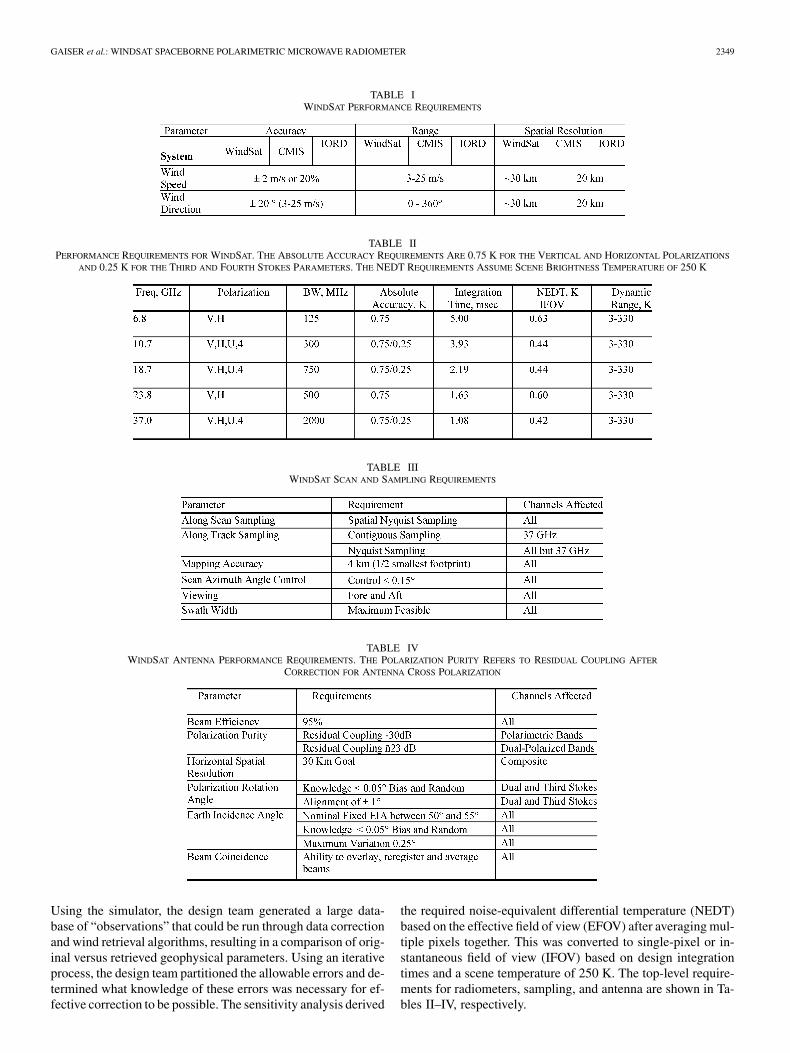
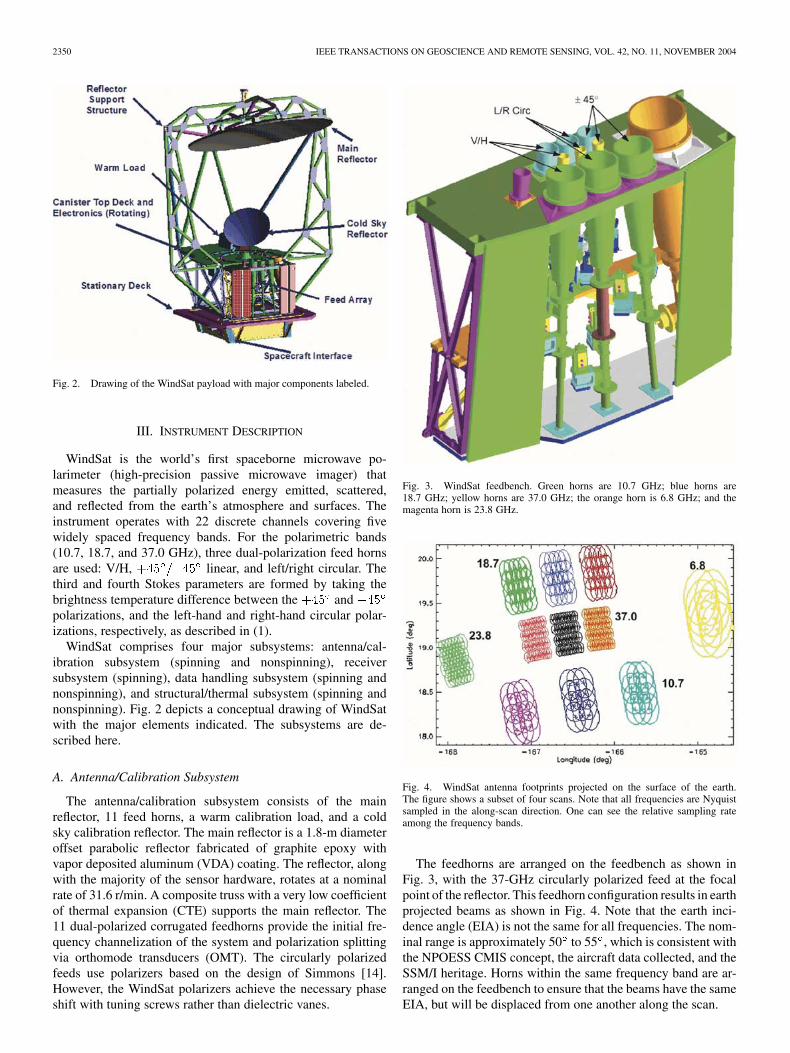
Fig. 3. WindSat feedbench. Green horns are 10.7 GHz; blue horns are18.7 GHz; yellow horns are 37.0 GHz; the orange horn is 6.8 GHz; and themagenta horn is 23.8 GHz.
Fig. 4. WindSat antenna footprints projected on the surface of the earth.The figure shows a subset of four scans. Note that all frequencies are Nyquistsampled in the along-scan direction. One can see the relative sampling rateamong the frequency bands.
The feedhorns are arranged on the feedbench as shown inFig. 3, with the 37-GHz circularly polarized feed at the focalpoint of the reflector. This feedhorn configuration results in earthprojected beams as shown in Fig. 4. Note that the earth inci-dence angle (EIA) is not the same for all frequencies. The nom-inal range is approximately 50 to 55 , which is consistent withthe NPOESS CMIS concept, the aircraft data collected, and theSSM/I heritage. Horns within the same frequency band are ar-ranged on the feedbench to ensure that the beams have the sameEIA, but will be displaced from one another along the scan.
GAISER et al.: WINDSAT SPACEBORNE POLARIMETRIC MICROWAVE RADIOMETER 2351
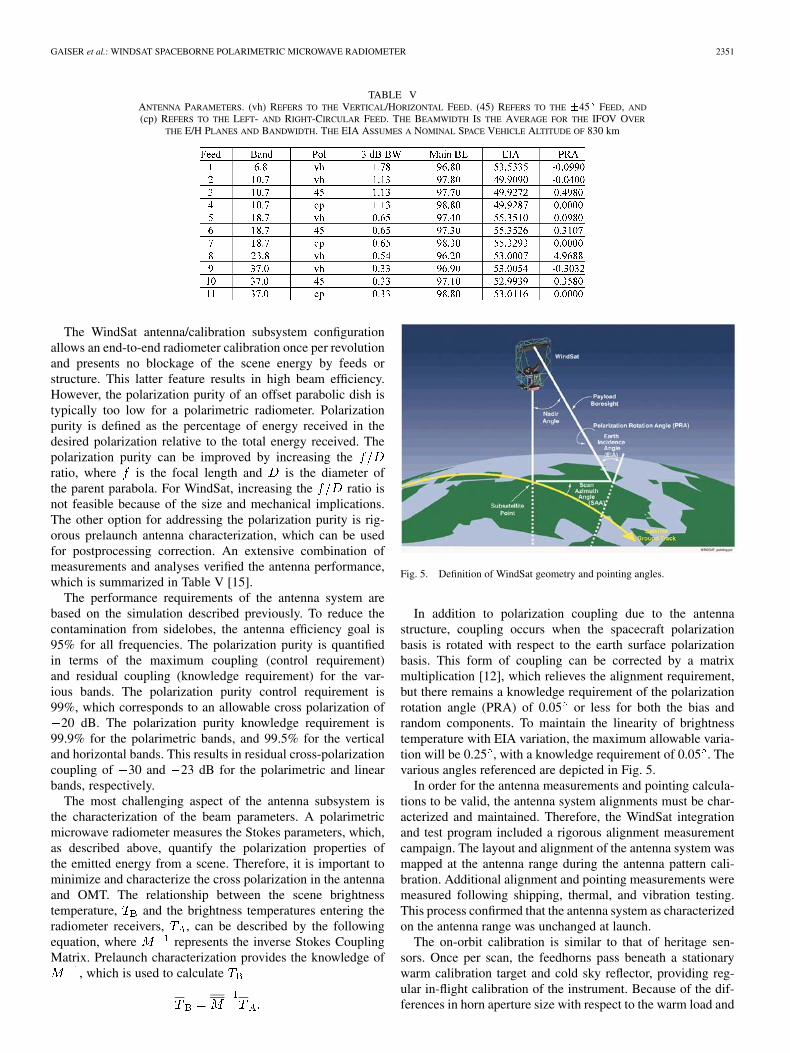
TABLE VANTENNA PARAMETERS. (vh) REFERS TO THE VERTICAL/HORIZONTAL FEED. (45) REFERS TO THE �45 FEED, AND
(cp) REFERS TO THE LEFT- AND RIGHT-CIRCULAR FEED. THE BEAMWIDTH IS THE AVERAGE FOR THE IFOV OVER
THE E/H PLANES AND BANDWIDTH. THE EIA ASSUMES A NOMINAL SPACE VEHICLE ALTITUDE OF 830 km
The WindSat antenna/calibration subsystem configurationallows an end-to-end radiometer calibration once per revolutionand presents no blockage of the scene energy by feeds orstructure. This latter feature results in high beam efficiency.However, the polarization purity of an offset parabolic dish istypically too low for a polarimetric radiometer. Polarizationpurity is defined as the percentage of energy received in thedesired polarization relative to the total energy received. Thepolarization purity can be improved by increasing theratio, where is the focal length and is the diameter ofthe parent parabola. For WindSat, increasing the ratio isnot feasible because of the size and mechanical implications.The other option for addressing the polarization purity is rig-orous prelaunch antenna characterization, which can be usedfor postprocessing correction. An extensive combination ofmeasurements and analyses verified the antenna performance,which is summarized in Table V [15].
The performance requirements of the antenna system arebased on the simulation described previously. To reduce thecontamination from sidelobes, the antenna efficiency goal is95% for all frequencies. The polarization purity is quantifiedin terms of the maximum coupling (control requirement)and residual coupling (knowledge requirement) for the var-ious bands. The polarization purity control requirement is99%, which corresponds to an allowable cross polarization of
20 dB. The polarization purity knowledge requirement is99.9% for the polarimetric bands, and 99.5% for the verticaland horizontal bands. This results in residual cross-polarizationcoupling of 30 and 23 dB for the polarimetric and linearbands, respectively.
The most challenging aspect of the antenna subsystem isthe characterization of the beam parameters. A polarimetricmicrowave radiometer measures the Stokes parameters, which,as described above, quantify the polarization properties ofthe emitted energy from a scene. Therefore, it is important tominimize and characterize the cross polarization in the antennaand OMT. The relationship between the scene brightnesstemperature, and the brightness temperatures entering theradiometer receivers, , can be described by the followingequation, where represents the inverse Stokes CouplingMatrix. Prelaunch characterization provides the knowledge of
, which is used to calculate
Fig. 5. Definition of WindSat geometry and pointing angles.
In addition to polarization coupling due to the antennastructure, coupling occurs when the spacecraft polarizationbasis is rotated with respect to the earth surface polarizationbasis. This form of coupling can be corrected by a matrixmultiplication [12], which relieves the alignment requirement,but there remains a knowledge requirement of the polarizationrotation angle (PRA) of 0.05 or less for both the bias andrandom components. To maintain the linearity of brightnesstemperature with EIA variation, the maximum allowable varia-tion will be 0.25 , with a knowledge requirement of 0.05 . Thevarious angles referenced are depicted in Fig. 5.
In order for the antenna measurements and pointing calcula-tions to be valid, the antenna system alignments must be char-acterized and maintained. Therefore, the WindSat integrationand test program included a rigorous alignment measurementcampaign. The layout and alignment of the antenna system wasmapped at the antenna range during the antenna pattern cali-bration. Additional alignment and pointing measurements weremeasured following shipping, thermal, and vibration testing.This process confirmed that the antenna system as characterizedon the antenna range was unchanged at launch.
The on-orbit calibration is similar to that of heritage sen-sors. Once per scan, the feedhorns pass beneath a stationarywarm calibration target and cold sky reflector, providing reg-ular in-flight calibration of the instrument. Because of the dif-ferences in horn aperture size with respect to the warm load and

2352 IEEE TRANSACTIONS ON GEOSCIENCE AND REMOTE SENSING, VOL. 42, NO. 11, NOVEMBER 2004
Fig. 6. WindSat receiver architecture for a polarization pair.
the cold sky reflector, the number of samples of each calibra-tion target is different for each frequency, with the minimumnumber occurring for the 6.8-GHz channel (six samples of thewarm load and two samples of the cold load). All calibrationdata are downlinked directly, with no onboard processing.
The warm load is a well-matched broadband microwave loadcomposed of tapered pyramids coated with a 2.29-mm layerof Eccosorb CR-117 Epoxy (a microwave absorbing material).The calibration target has a teardrop shape to optimize thenumber of samples while minimizing scan occlusion and hasa 7.62-cm shroud to ensure excellent coupling and minimizethermal gradients across the load. The warm load is passivelyheated through exposure to the radiator panels on the top deckof the WindSat canister. Six platinum resistance thermometers(PRT) mounted in the aluminum base of the warm load measurethe warm load temperature.
The cold sky reflector (CSR), like the main reflector, is fab-ricated of graphite epoxy coated with at least 3.27 m of VDAand a protective layer of silicon oxide. The surface tolerance is127 m. The CSR is sized so that when a feed horn passes underit, no part of the feed pattern sees the main reflector. In addition,the CSR was designed to receive less than 0.15 K of radiationfrom the earth.
B. Receiver Subsystem
The receiver subsystem accepts the energy from the 11 feedhorns and provides amplification and filtering, producing 22discrete digital signals channels to the data handling system.Fig. 6 depicts the receiver architecture. All of the channels areimplemented as direct detection receivers. The nonlinearityof the receiver is driven by the detector diode and is lessthan 0.1%. The receiver dynamic range accommodates inputantenna temperature ranging from 3–330 K as well as internalgain changes due to temperature and aging. The receiver sub-system is subdivided into three units; the front-end receiver
(FER),which performs matching and low-noise amplification;the receiver electronics unit (REU) providing additional gainand filtering; and the detector electronics unit (DEU), whichperforms integration, detection, A/D conversion, gain and offsetadjustment. Each channel is integrated and sampled to achievespatial Nyquist sampling along scan. The 37-GHz channels,which have the smallest 3-dB beamwidth, are integrated for1.08 ms, while the 6.8-GHz channels, which have the largest3-dB beamwidth, are integrated for 5.0 ms. The integrationtimes can be reprogrammed on orbit.
As stated earlier, taking the difference between polarizationpairs ( 45 and LC/RC) produces the third and fourth Stokesparameters. In the process, common mode calibration errorsare minimized because the absolute brightness differences aresmall. However, receiver nonlinearity does not cancel and canresult in a significant calibration error. The nonlinearity of a ra-diometer receiver results from amplifier saturation and detectornonsquare-law response, of which the latter is dominant. Re-gardless of the cause, both types of distortion have an effect onthe radiometric performance. Amplifiers were selected to formpairs with nearly identical measured performance and attenua-tors were used to optimize the final receiver gains. Followingthe suggestion of Hoer et al. [16], we optimized the linearityof the diode detectors by adjusting the load resistance, again inpairs so that performance could be matched. The linearity ofthe receivers was tested using the two-tone method [17] overthe thermal operating range. Nonlinearity was measured to beless than 0.1% and typically 0.06%. As an additional test, thereceivers were tested in the thermal vacuum chamber using pre-cision cold and variable targets in addition to the WindSat flightwarm load. The U.K. Meteorological Office Remote Sensing In-strumentation (U.K. Met Office RSI) group developed the coldand variable calibration target system. The radiometer tempera-ture was cycled over its operating range and performance testedat 0 C, 20 C, and 40 C. At each system temperature plateauthe variable target temperature was stepped from 85 K to 325 K
GAISER et al.: WINDSAT SPACEBORNE POLARIMETRIC MICROWAVE RADIOMETER 2353
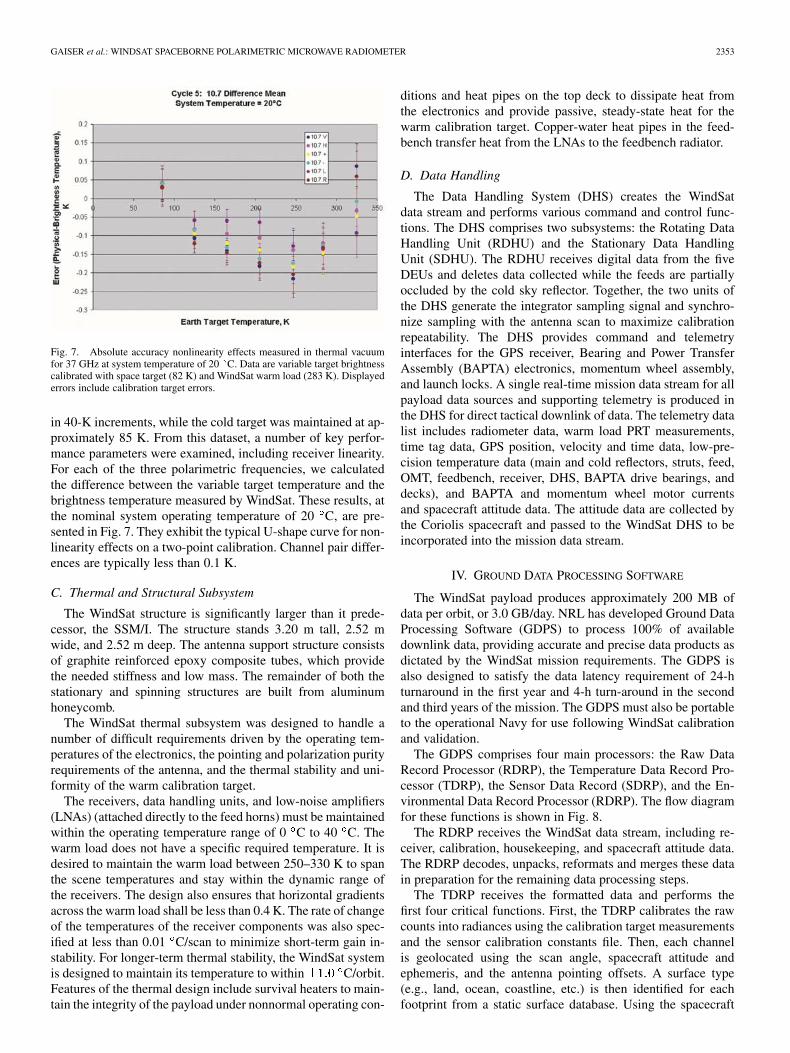
Fig. 7. Absolute accuracy nonlinearity effects measured in thermal vacuumfor 37 GHz at system temperature of 20 C. Data are variable target brightnesscalibrated with space target (82 K) and WindSat warm load (283 K). Displayederrors include calibration target errors.
in 40-K increments, while the cold target was maintained at ap-proximately 85 K. From this dataset, a number of key perfor-mance parameters were examined, including receiver linearity.For each of the three polarimetric frequencies, we calculatedthe difference between the variable target temperature and thebrightness temperature measured by WindSat. These results, atthe nominal system operating temperature of 20 C, are pre-sented in Fig. 7. They exhibit the typical U-shape curve for non-linearity effects on a two-point calibration. Channel pair differ-ences are typically less than 0.1 K.
C. Thermal and Structural Subsystem
The WindSat structure is significantly larger than it prede-cessor, the SSM/I. The structure stands 3.20 m tall, 2.52 mwide, and 2.52 m deep. The antenna support structure consistsof graphite reinforced epoxy composite tubes, which providethe needed stiffness and low mass. The remainder of both thestationary and spinning structures are built from aluminumhoneycomb.
The WindSat thermal subsystem was designed to handle anumber of difficult requirements driven by the operating tem-peratures of the electronics, the pointing and polarization purityrequirements of the antenna, and the thermal stability and uni-formity of the warm calibration target.
The receivers, data handling units, and low-noise amplifiers(LNAs) (attached directly to the feed horns) must be maintainedwithin the operating temperature range of 0 C to 40 C. Thewarm load does not have a specific required temperature. It isdesired to maintain the warm load between 250–330 K to spanthe scene temperatures and stay within the dynamic range ofthe receivers. The design also ensures that horizontal gradientsacross the warm load shall be less than 0.4 K. The rate of changeof the temperatures of the receiver components was also spec-ified at less than 0.01 C/scan to minimize short-term gain in-stability. For longer-term thermal stability, the WindSat systemis designed to maintain its temperature to within C/orbit.Features of the thermal design include survival heaters to main-tain the integrity of the payload under nonnormal operating con-
ditions and heat pipes on the top deck to dissipate heat fromthe electronics and provide passive, steady-state heat for thewarm calibration target. Copper-water heat pipes in the feed-bench transfer heat from the LNAs to the feedbench radiator.
D. Data Handling
The Data Handling System (DHS) creates the WindSatdata stream and performs various command and control func-tions. The DHS comprises two subsystems: the Rotating DataHandling Unit (RDHU) and the Stationary Data HandlingUnit (SDHU). The RDHU receives digital data from the fiveDEUs and deletes data collected while the feeds are partiallyoccluded by the cold sky reflector. Together, the two units ofthe DHS generate the integrator sampling signal and synchro-nize sampling with the antenna scan to maximize calibrationrepeatability. The DHS provides command and telemetryinterfaces for the GPS receiver, Bearing and Power TransferAssembly (BAPTA) electronics, momentum wheel assembly,and launch locks. A single real-time mission data stream for allpayload data sources and supporting telemetry is produced inthe DHS for direct tactical downlink of data. The telemetry datalist includes radiometer data, warm load PRT measurements,time tag data, GPS position, velocity and time data, low-pre-cision temperature data (main and cold reflectors, struts, feed,OMT, feedbench, receiver, DHS, BAPTA drive bearings, anddecks), and BAPTA and momentum wheel motor currentsand spacecraft attitude data. The attitude data are collected bythe Coriolis spacecraft and passed to the WindSat DHS to beincorporated into the mission data stream.
IV. GROUND DATA PROCESSING SOFTWARE
The WindSat payload produces approximately 200 MB ofdata per orbit, or 3.0 GB/day. NRL has developed Ground DataProcessing Software (GDPS) to process 100% of availabledownlink data, providing accurate and precise data products asdictated by the WindSat mission requirements. The GDPS isalso designed to satisfy the data latency requirement of 24-hturnaround in the first year and 4-h turn-around in the secondand third years of the mission. The GDPS must also be portableto the operational Navy for use following WindSat calibrationand validation.
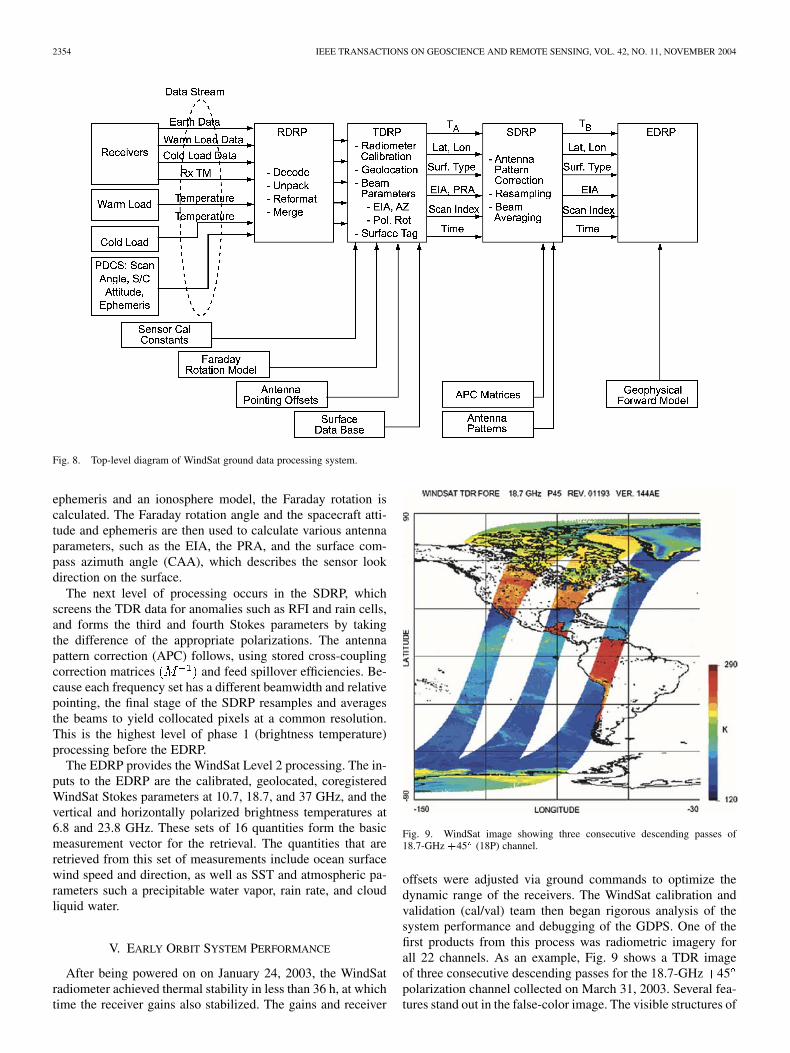
The GDPS comprises four main processors: the Raw DataRecord Processor (RDRP), the Temperature Data Record Pro-cessor (TDRP), the Sensor Data Record (SDRP), and the En-vironmental Data Record Processor (RDRP). The flow diagramfor these functions is shown in Fig. 8.
The RDRP receives the WindSat data stream, including re-ceiver, calibration, housekeeping, and spacecraft attitude data.The RDRP decodes, unpacks, reformats and merges these datain preparation for the remaining data processing steps.
The TDRP receives the formatted data and performs thefirst four critical functions. First, the TDRP calibrates the rawcounts into radiances using the calibration target measurementsand the sensor calibration constants file. Then, each channelis geolocated using the scan angle, spacecraft attitude andephemeris, and the antenna pointing offsets. A surface type(e.g., land, ocean, coastline, etc.) is then identified for eachfootprint from a static surface database. Using the spacecraft
2354 IEEE TRANSACTIONS ON GEOSCIENCE AND REMOTE SENSING, VOL. 42, NO. 11, NOVEMBER 2004
Fig. 8. Top-level diagram of WindSat ground data processing system.
ephemeris and an ionosphere model, the Faraday rotation iscalculated. The Faraday rotation angle and the spacecraft atti-tude and ephemeris are then used to calculate various antennaparameters, such as the EIA, the PRA, and the surface com-pass azimuth angle (CAA), which describes the sensor lookdirection on the surface.
The next level of processing occurs in the SDRP, whichscreens the TDR data for anomalies such as RFI and rain cells,and forms the third and fourth Stokes parameters by takingthe difference of the appropriate polarizations. The antennapattern correction (APC) follows, using stored cross-couplingcorrection matrices and feed spillover efficiencies. Be-cause each frequency set has a different beamwidth and relativepointing, the final stage of the SDRP resamples and averagesthe beams to yield collocated pixels at a common resolution.This is the highest level of phase 1 (brightness temperature)processing before the EDRP.
The EDRP provides the WindSat Level 2 processing. The in-puts to the EDRP are the calibrated, geolocated, coregisteredWindSat Stokes parameters at 10.7, 18.7, and 37 GHz, and thevertical and horizontally polarized brightness temperatures at6.8 and 23.8 GHz. These sets of 16 quantities form the basicmeasurement vector for the retrieval. The quantities that areretrieved from this set of measurements include ocean surfacewind speed and direction, as well as SST and atmospheric pa-rameters such a precipitable water vapor, rain rate, and cloudliquid water.
V. EARLY ORBIT SYSTEM PERFORMANCE
After being powered on on January 24, 2003, the WindSatradiometer achieved thermal stability in less than 36 h, at whichtime the receiver gains also stabilized. The gains and receiver
Fig. 9. WindSat image showing three consecutive descending passes of18.7-GHz +45 (18P) channel.
offsets were adjusted via ground commands to optimize thedynamic range of the receivers. The WindSat calibration andvalidation (cal/val) team then began rigorous analysis of thesystem performance and debugging of the GDPS. One of thefirst products from this process was radiometric imagery forall 22 channels. As an example, Fig. 9 shows a TDR imageof three consecutive descending passes for the 18.7-GHz 45polarization channel collected on March 31, 2003. Several fea-tures stand out in the false-color image. The visible structures of
GAISER et al.: WINDSAT SPACEBORNE POLARIMETRIC MICROWAVE RADIOMETER 2355
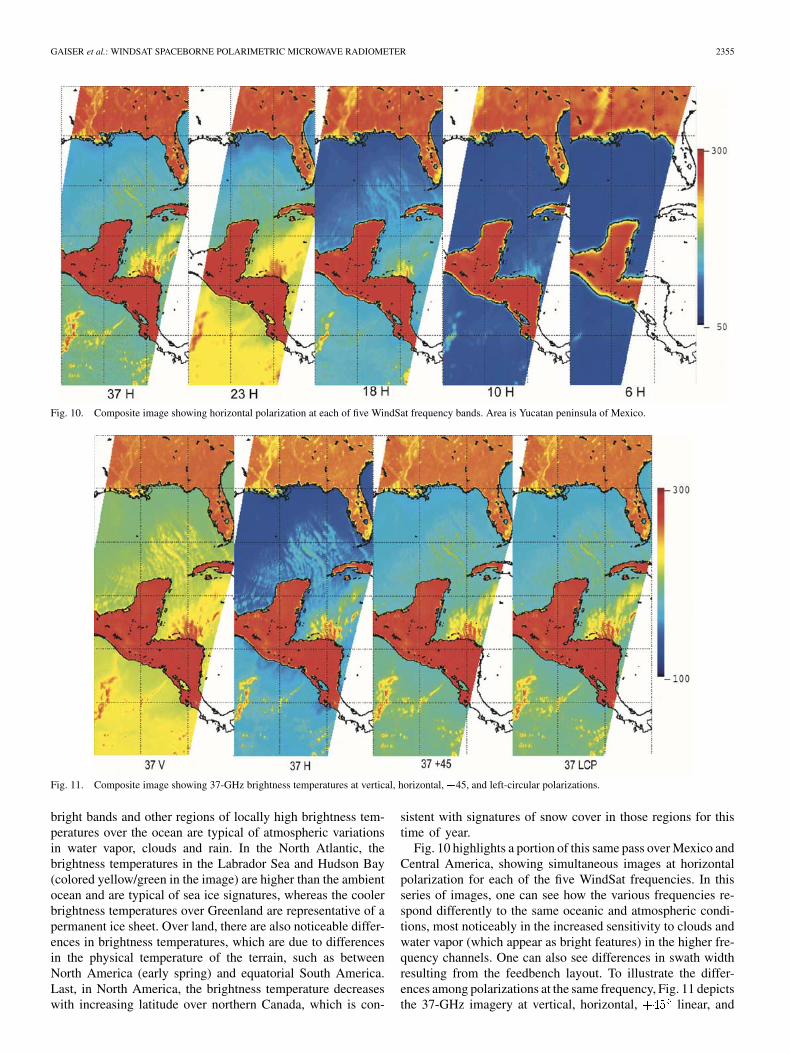
Fig. 10. Composite image showing horizontal polarization at each of five WindSat frequency bands. Area is Yucatan peninsula of Mexico.
Fig. 11. Composite image showing 37-GHz brightness temperatures at vertical, horizontal, +45, and left-circular polarizations.
bright bands and other regions of locally high brightness tem-peratures over the ocean are typical of atmospheric variationsin water vapor, clouds and rain. In the North Atlantic, thebrightness temperatures in the Labrador Sea and Hudson Bay(colored yellow/green in the image) are higher than the ambientocean and are typical of sea ice signatures, whereas the coolerbrightness temperatures over Greenland are representative of apermanent ice sheet. Over land, there are also noticeable differ-ences in brightness temperatures, which are due to differencesin the physical temperature of the terrain, such as betweenNorth America (early spring) and equatorial South America.Last, in North America, the brightness temperature decreaseswith increasing latitude over northern Canada, which is con-
sistent with signatures of snow cover in those regions for thistime of year.
Fig. 10 highlights a portion of this same pass over Mexico andCentral America, showing simultaneous images at horizontalpolarization for each of the five WindSat frequencies. In thisseries of images, one can see how the various frequencies re-spond differently to the same oceanic and atmospheric condi-tions, most noticeably in the increased sensitivity to clouds andwater vapor (which appear as bright features) in the higher fre-quency channels. One can also see differences in swath widthresulting from the feedbench layout. To illustrate the differ-ences among polarizations at the same frequency, Fig. 11 depictsthe 37-GHz imagery at vertical, horizontal, linear, and
2356 IEEE TRANSACTIONS ON GEOSCIENCE AND REMOTE SENSING, VOL. 42, NO. 11, NOVEMBER 2004
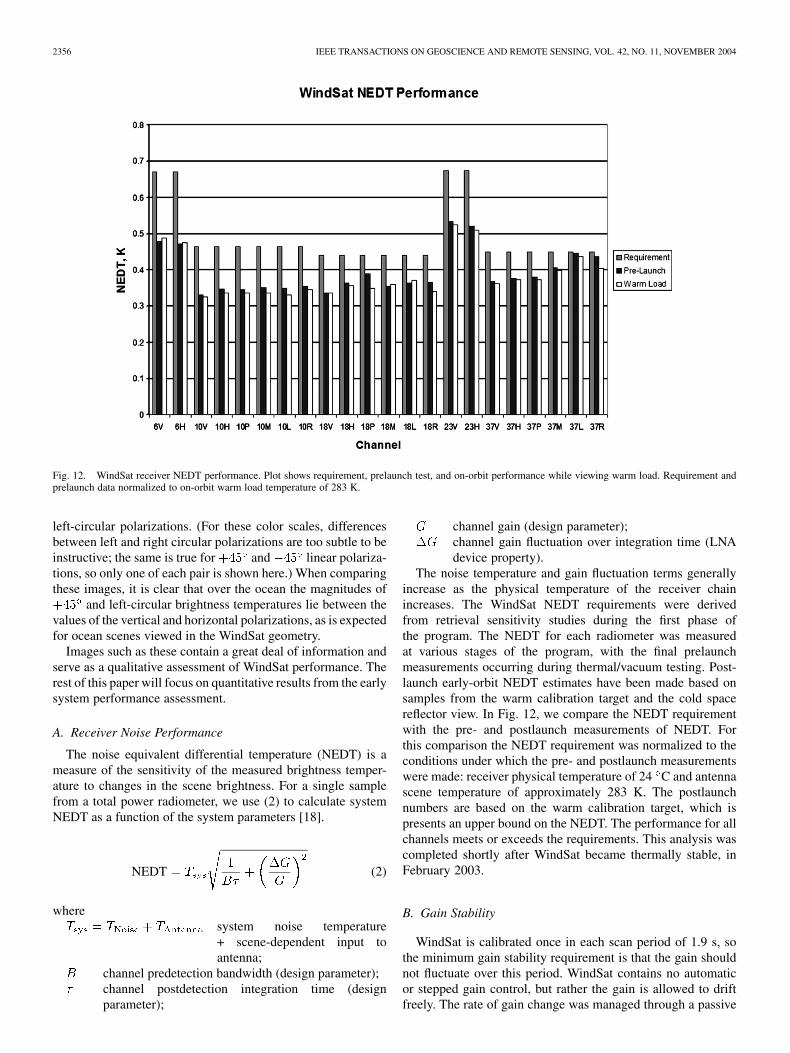
Fig. 12. WindSat receiver NEDT performance. Plot shows requirement, prelaunch test, and on-orbit performance while viewing warm load. Requirement andprelaunch data normalized to on-orbit warm load temperature of 283 K.
left-circular polarizations. (For these color scales, differencesbetween left and right circular polarizations are too subtle to beinstructive; the same is true for and linear polariza-tions, so only one of each pair is shown here.) When comparingthese images, it is clear that over the ocean the magnitudes of
and left-circular brightness temperatures lie between thevalues of the vertical and horizontal polarizations, as is expectedfor ocean scenes viewed in the WindSat geometry.
Images such as these contain a great deal of information andserve as a qualitative assessment of WindSat performance. Therest of this paper will focus on quantitative results from the earlysystem performance assessment.
A. Receiver Noise Performance
The noise equivalent differential temperature (NEDT) is ameasure of the sensitivity of the measured brightness temper-ature to changes in the scene brightness. For a single samplefrom a total power radiometer, we use (2) to calculate systemNEDT as a function of the system parameters [18].
NEDT (2)
wheresystem noise temperature+ scene-dependent input toantenna;
channel predetection bandwidth (design parameter);channel postdetection integration time (designparameter);
channel gain (design parameter);channel gain fluctuation over integration time (LNAdevice property).
The noise temperature and gain fluctuation terms generallyincrease as the physical temperature of the receiver chainincreases. The WindSat NEDT requirements were derivedfrom retrieval sensitivity studies during the first phase ofthe program. The NEDT for each radiometer was measuredat various stages of the program, with the final prelaunchmeasurements occurring during thermal/vacuum testing. Post-launch early-orbit NEDT estimates have been made based onsamples from the warm calibration target and the cold spacereflector view. In Fig. 12, we compare the NEDT requirementwith the pre- and postlaunch measurements of NEDT. Forthis comparison the NEDT requirement was normalized to theconditions under which the pre- and postlaunch measurementswere made: receiver physical temperature of 24 C and antennascene temperature of approximately 283 K. The postlaunchnumbers are based on the warm calibration target, which ispresents an upper bound on the NEDT. The performance for allchannels meets or exceeds the requirements. This analysis wascompleted shortly after WindSat became thermally stable, inFebruary 2003.
B. Gain Stability
WindSat is calibrated once in each scan period of 1.9 s, sothe minimum gain stability requirement is that the gain shouldnot fluctuate over this period. WindSat contains no automaticor stepped gain control, but rather the gain is allowed to driftfreely. The rate of gain change was managed through a passive
GAISER et al.: WINDSAT SPACEBORNE POLARIMETRIC MICROWAVE RADIOMETER 2357
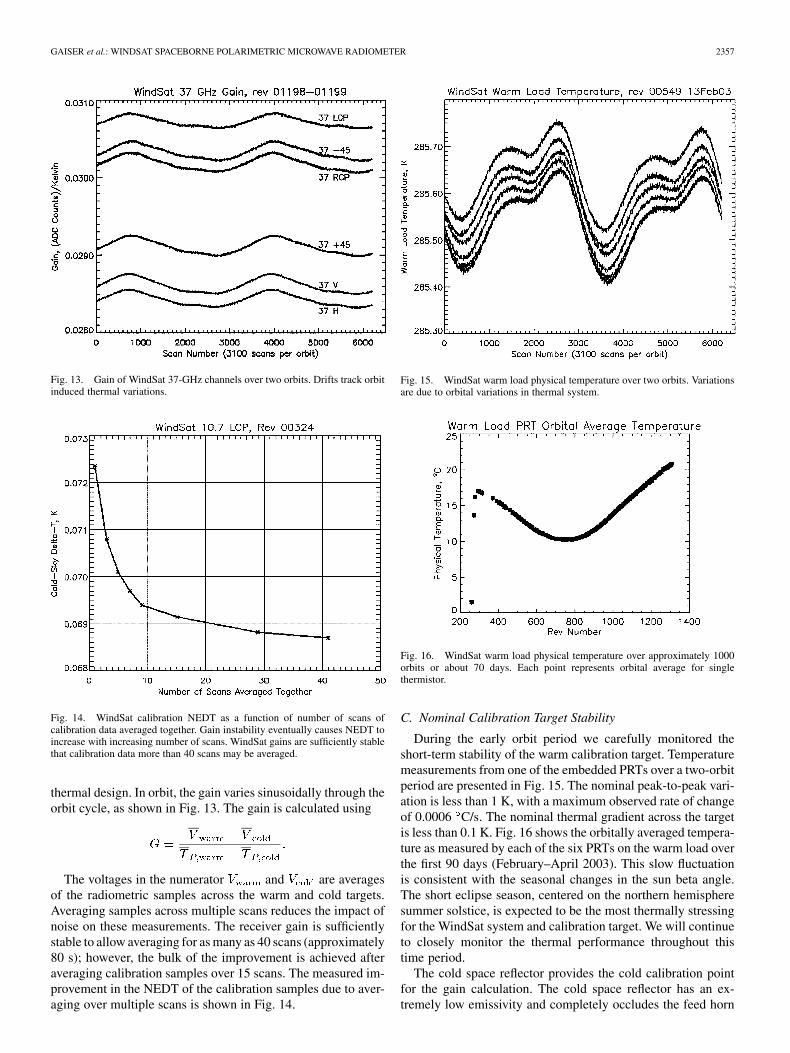
Fig. 13. Gain of WindSat 37-GHz channels over two orbits. Drifts track orbitinduced thermal variations.
Fig. 14. WindSat calibration NEDT as a function of number of scans ofcalibration data averaged together. Gain instability eventually causes NEDT toincrease with increasing number of scans. WindSat gains are sufficiently stablethat calibration data more than 40 scans may be averaged.
thermal design. In orbit, the gain varies sinusoidally through theorbit cycle, as shown in Fig. 13. The gain is calculated using
The voltages in the numerator and are averagesof the radiometric samples across the warm and cold targets.Averaging samples across multiple scans reduces the impact ofnoise on these measurements. The receiver gain is sufficientlystable to allow averaging for as many as 40 scans (approximately80 s); however, the bulk of the improvement is achieved afteraveraging calibration samples over 15 scans. The measured im-provement in the NEDT of the calibration samples due to aver-aging over multiple scans is shown in Fig. 14.
Fig. 15. WindSat warm load physical temperature over two orbits. Variationsare due to orbital variations in thermal system.
Fig. 16. WindSat warm load physical temperature over approximately 1000orbits or about 70 days. Each point represents orbital average for singlethermistor.
C. Nominal Calibration Target Stability
During the early orbit period we carefully monitored theshort-term stability of the warm calibration target. Temperaturemeasurements from one of the embedded PRTs over a two-orbitperiod are presented in Fig. 15. The nominal peak-to-peak vari-ation is less than 1 K, with a maximum observed rate of changeof 0.0006 C/s. The nominal thermal gradient across the targetis less than 0.1 K. Fig. 16 shows the orbitally averaged tempera-ture as measured by each of the six PRTs on the warm load overthe first 90 days (February–April 2003). This slow fluctuationis consistent with the seasonal changes in the sun beta angle.The short eclipse season, centered on the northern hemispheresummer solstice, is expected to be the most thermally stressingfor the WindSat system and calibration target. We will continueto closely monitor the thermal performance throughout thistime period.
The cold space reflector provides the cold calibration pointfor the gain calculation. The cold space reflector has an ex-tremely low emissivity and completely occludes the feed horn

2358 IEEE TRANSACTIONS ON GEOSCIENCE AND REMOTE SENSING, VOL. 42, NO. 11, NOVEMBER 2004
view of the main reflector when the feeds pass underneath it.There is no instrument or spacecraft structure near the beam,which provides a stable cold point for each of the channels.There are no detectable changes in the cold space reflector per-formance with temperature. Additional analysis and on-orbitperformance evaluation is currently underway.
D. Spin Rate Stability
WindSat spins at a rate of 31.595 r/min, or once every 1.8990 s.The variation since the instrument stabilized is 0.005 r/min or0.0003 s per revolution. This translates to an antenna boresightvariation of 0.057 , or less than a 1-km pixel position errorwhen projected to the earth’s surface.
VI. SWATH DEFINITION
The WindSat feedhorn layout was described in Section III.The position and pointing of each horn relative to the mainreflector determines its unique, unobstructed swath. The inter-section of the 11 individual swaths is identified as the WindSatcommon fore and aft swaths. The WindSat swath requirementwas simply to maximize swath width while maintaining atwo-look (fore/aft) capability. The swath was analyzed for eachchannel using orbitally averaged data, and regions showingevidence of partial occlusion by the calibration loads were iden-tified. While some frequency bands have a swath width greaterthan 1200 km in the forward look direction, the common swathwidth is approximately 950 km (68 of scan angle); the aftcommon swath is 350 km (23 of scan angle). The aft commonswath does not contain 6.8-GHz data, for which the aft swathdoes not intersect the other channels due to the position of thatfeed on the edge of the feedhorn layout. More rigorous analysisof the along-swath stability and any swath edge bias is currentlyunderway. As the analysis of the channel performance acrossswath progresses, these nominal common swaths may changeslightly.
VII. GEOLOCATION
The wind direction will be derived from very small differ-ences in polarization pairs. Therefore, pointing errors have alarge impact on the validity of the derived wind vectors, pri-marily because of the impact of earth incidence angle variationson the brightness temperature and polarization rotation anglevariations on the cross-polarization coupling. Accordingly,Coriolis/Windsat was designed to provide knowledge errors of
bias and random components in each EIA andPRA. These requirements equate to 1 km of geolocation erroron the earth-projected beams. One should note that the geolo-cation requirement is 4 km, but that the pointing requirementsresult in better than required geolocation.
A geolocation analysis performed during the early orbitperiod compared WindSat imagery for each channel with highaccuracy coastline maps. The land–water transition producesa sharp change in the WindSat data, because water is radio-metrically colder than land. The rate of brightness temperaturechange was calculated along a track crossing an ocean–landboundary. The position of maximum rate of change was iden-tified as the WindSat-derived coastline, which could then becompared with a global coastline database. Fig. 17 shows an
Fig. 17. WindSat geolocation analysis results. Upper shows WindSatbrightness temperatures over Spain. Lower image highlights WindSat detectedcoastline by plotting points of maximum brightness rate of change.
example of this analysis. Errors on the order of 10 km wereidentified and traced to two timing issues. The dominant errorwas driven an inaccurate time assignment error on the GPSdata. The assignment was in error by 1 s, which appeared as apositional offset in the WindSat data. The impact of this errorwas compounded by the fact that the attitude data used by theground processing software to make attitude corrections to thebrightness temperatures were not coincident with the WindSatmeasurements. A second type of error appeared as an accumu-lating 5 s per sample radiometer time assignment error alongthe scan. This error was reset to zero at the time synch for eachscan. This error was traced to a miscalculation in the numberof clock cycles required to acquire and store each sample.
Corrections for each of these timing errors bring the geolo-cation error down to less than 5 km. At the time of this writing,further in-depth analysis is ongoing to identify and correct theresidual geolocation and pointing errors.
VIII. CAL/VAL PURPOSE AND IMPORTANCE
Prior to public release of data products, the WindSat systemmust go through the calibration and validation process, whichhas two primary purposes. The first is to verify the WindSat ra-diometer absolute accuracy as driven by the calibration targetaccuracy and knowledge, the receiver performance, the antennacharacterization and antenna pattern correction (APC), and the

GAISER et al.: WINDSAT SPACEBORNE POLARIMETRIC MICROWAVE RADIOMETER 2359
geolocation and pointing processing. The second purpose is tovalidate the sea surface wind speed and direction environmentaldata products. A key part of this process is to identify and quan-tify error sources and, if necessary, generate new sensor cali-bration coefficients, algorithms, and environmental data record(EDR) retrievals to bring the data products into specification.
The WindSat system presents several unique calibration andvalidation challenges. The wind direction signal, which is a si-nusoidal signal as a function of wind direction (relative to thelook direction of the sensor) is two orders of magnitude smallerthan the vertical and horizontal polarizations typically measuredby passive microwave imagers. As such, the design sensitivityanalysis resulted in sensor noise and absolute accuracy require-ments approximately 50% tighter than the current SSM/I oper-ational performance. Antenna and receiver polarization purityand horn/antenna/payload alignments are significant elementsof the accuracy error budget.
The results of the first SSM/I (F-8) cal/val clearly demon-strate the importance of a comprehensive cal/val program [1],[2]. Through the efforts of an NRL-led team composed of gov-ernment and university microwave remote sensing experts ledby NRL, the SSM/I validation team demonstrated that many ofthe retrieval algorithms that failed to meet specification couldbe brought into compliance with postlaunch tuning and qualityflags. The WindSat cal/val plan is largely modeled on the suc-cessful SSM/I cal/val plan and lessons learned from the process.
Finally, WindSat is tasked with demonstrating the capabilityof polarimetric microwave radiometry to measure the ocean sur-face wind direction from space. Therefore, it is critical that allsensor errors be understood and separated from phenomenologyof the wind direction signal.
IX. CONCLUSION
The WindSat polarimetric microwave radiometer waslaunched on the Coriolis mission on January 6, 2003. The ob-jective of the WindSat program is to demonstrate the viabilityof polarimetric microwave radiometry to measure the oceansurface wind vector. The system was designed, built, integrated,and tested in response to the requirements of the U.S. Navy andthe NPOESS Integrated Program Office.
Following launch, the WindSat team has been analyzing theWindSat data and conducting the calibration/validation. To datethe instrument has been performing extremely well. Gain sta-bility and NEDT levels are much better than required speci-fications. Geolocation errors are well within the smallest an-tenna beam size, while pointing performance continues to beanalyzed.
The ultimate objective of the WindSat mission is to demon-strate the capability of polarimetric radiometry to retrieve theocean surface wind vector. The early performance of WindSatgives us confidence that the Stokes parameter data will be ofenough quality to facilitate this demonstration. The work of re-trieving the wind vector is ongoing.
ACKNOWLEDGMENT
The authors wish to acknowledge the talents and efforts of theNaval Research Laboratory Naval Center for Space Technology,whose engineers built, tested, and operate WindSat.
REFERENCES
[1] J. P. Hollinger, Ed., “DMSP Special Sensor Microwave Imager Calibra-tion/Validation,” Nav. Res. Lab., Washington, DC, NRL Final Rep., vol.I, June 1989.
[2] J. P. Hollinger, J. L. Peirce, and G. A. Poe, “SSM/I instrument evalua-tion,” IEEE Trans. Geosci. Remote Sensing, vol. 28, pp. 781–790, Sept.1990.
[3] M. A. Goodberlet, C. T. Swift, and J. C. Wilkerson, “Ocean surface windspeed measurements of the Special Sensor Microwave/Imager (SSM/I),”IEEE Trans. Geosci. Remote Sensing, vol. 28, pp. 823–828, Sept. 1990.
[4] F. J. Wentz, “Measurement of oceanic wind vector using satellite mi-crowave radiometers,” IEEE Trans. Geosci. Remote Sensing, vol. 30, pp.960–972, Sept. 1992.
[5] P. S. Chang and L. Li, “Ocean surface wind speed and direction re-trievals from the SSM/I,” IEEE Trans. Geosci. Remote Sensing, vol. 36,pp. 1866–1871, Nov. 1998.
[6] S. H. Yueh, W. J. Wilson, F. K. Li, W. B. Ricketts, and S. V. Nghiem, “Po-larimetric brightness temperatures of sea surfaces measured with aircraftK- and Ka-band radiometers,” IEEE Trans. Geosci. Remote Sensing, vol.33, pp. 1177–1187, Sept. 1997.
[7] S. H. Yueh, W. J. Wilson, S. J. DiNardo, and F. K. Li, “Polarimetricmicrowave brightness signatures of ocean wind direction,” IEEE Trans.Geosci. Remote Sensing, vol. 37, pp. 949–959, Mar. 1999.
[8] P. S. Chang, P. W. Gaiser, L. Li, and K. M. St. Germain, “Multi-fre-quency polarimetric microwave ocean wind direction retrievals,” inProc. IGARSS, Singapore, 1997.
[9] J. R. Piepmeier and A. J. Gasiewski, “High-resolution passive polari-metric microwave mapping of the ocean surface wind vector fields,”IEEE Trans. Geosci. Remote Sensing, vol. 39, pp. 606–622, Mar. 2001.
[10] G. A. Wick, J. J. Bates, and C. C. Gottschall, “Observational evidence ofa wind direction signal in SSM/I passive microwave data,” IEEE Trans.Geosci. Remote Sensing, vol. 38, pp. 823–837, Mar. 2000.
[11] K. M. St. Germain, G. A. Poe, and P. W. Gaiser, “Polarimetric emissionmodel of the sea at microwave frequencies and comparison with mea-surements,” Progr. Electromagn. Res., vol. 37, pp. 2–32, 2002.
[12] L. Tsang, J. A. Kong, and R. T. Shin, Theory of Microwave RemoteSensing. New York: Wiley, 1985.
[13] P. W. Gaiser, G. A. Poe, and K. M. St. Germain, “Critical design issuesfor space borne polarimetric radiometry,” in Proc. IGARSS, Seattle, WA,1998.
[14] A. J. Simmons, “Phase shift by periodic loading of waveguide and itsapplication to broad-band circular polarization,” IRE Trans. MicrowaveTheory Tech., vol. 3, no. 6, pp. 18–21, 1955.
[15] W. L. Lippincott, T. A. Gutwein, H. E. Bartlett, M. Smythers, P. W.Gaiser, and W. J. Purdy, “Antenna design, modeling and testing on theWindSat wind direction measurement system,” Nav. Res. Lab., Wash-ington, DC, NRL Tech. Memo. Rep., Mar. 2002.
[16] C. A. Hoer, K. C. Roe, and C. M. Allred, “Measuring and minimizingdiode detector nonlinearity,” IEEE Trans. Instrum. Meas., vol. IM-25,pp. 324–329, Dec. 1976.
[17] V. S. Reinhardt, Y. C. Shih, P. A. Toth, S. C. Reynolds, and A. L. Berman,“Methods for measuring the power linearity of microwave detectors forradiometric applications,” IEEE Trans. Microwave Theory Tech., vol. 43,pp. 715–720, Apr. 1995.
[18] F. T. Ulaby, R. K. Moore, and A. K. Fung, Microwave RemoteSensing. Reading, MA: Addison-Wesley, 1981, vol. I.
Peter W. Gaiser (S’91–M’93–SM’04) received the B.S. degrees in electricalengineering from Virginia Polytechnic Institute and State University, Blacks-burg, in 1987, and the Ph.D. degree from the University of Massachusetts,Amherst, in 1993, where he studied microwave remote sensing, with emphasison synthetic aperture interferometric radiometry.
He has been with the Naval Research Laboratory (NRL), Washington, DC,since 1993, and currently heads the Microwave Remote Sensing Section, Re-mote Sensing Division at NRL. While at NRL, he has been involved in po-larimetric radiometry research. His research interests also include instrumentdesign, data collection, and model development specifically for the purpose ofocean wind vector measurements from space. He is the Principal Investigatorfor the WindSat spaceborne polarimetric microwave radiometer demonstrationproject.

2360 IEEE TRANSACTIONS ON GEOSCIENCE AND REMOTE SENSING, VOL. 42, NO. 11, NOVEMBER 2004
Karen M. St. Germain (S’88–M’91–SM’03) received the B.S. degree in elec-trical engineering from Union College, Schenectady, NY, in 1987, and the Ph.D.degree from the University of Massachusetts, Amherst, in 1993.
From 1987 to 1993, she was a Research Assistant in the Microwave RemoteSensing Laboratory, University of Massachusetts, where her doctoral researchfocused on passive microwave remote sensing of oceans and ice. In 1993, shejoined the Faculty of the Department of Electrical Engineering, University ofNebraska, Lincoln. While at the University of Nebraska, she taught courses inelectromagnetics, signal processing, and radar system design, and expanded herresearch interests to include passive and active remote sensing of vegetation andsoil moisture. In 1996, she left the University of Nebraska to take a position atthe Naval Research Laboratory, Washington DC, where she is currently involvedin remote sensing system development, spaceborne demonstration of remotesensing concepts, instrument calibration, radiative transfer theory, and algorithmdevelopment.
Dr. St. Germain has been a member of the IEEE Geoscience and RemoteSensing Society (GRSS) since 1988. She served as an Associate Editor of theIEEE GRSS Newsletter from 1994 to 1996 and was elected to the GRSS AdComin 1997. She served as the Membership Chairman from 1997 to 1998 and hasserved as the Vice President for Meetings and Symposia from 1998 to 2003. Sheis currently Vice President of Operations and Finance. She was Co-Chairmanof the Technical Program for IGARSS 2000 and is a member of Eta Kappa Nuand Tau Beta Pi. She currently serves on the U.S. National Research Council’sCommittee on Radio Frequencies (CORF).
Elizabeth M. Twarog received the B.S. degree from the University of Massa-chusetts, Amherst, in 1992, and the M.S. and Ph.D. degrees from NortheasternUniversity, Boston, MA, in 1995 and 1998, respectively, both in electrical engi-neering.
From 1993 to 1998, she was a Graduate Assistant in the Radar Systems Lab-oratory, Northeastern University, in the field of polarimetric low-grazing angleradar sea scatter and airborne radar imaging of the coastal ocean. Since joiningthe Passive Microwave Section of the Naval Research Laboratory, Washington,DC, in 1999, she has been involved with microwave spaceborne polarimetricradiometry as a member of the WindSat technical and science teams.
Gene A. Poe (M’91) received the B.A. and M.S. degrees in electrical engi-neering from the University of California, Berkeley, in 1964 and 1965, respec-tively.
He has worked in wide-ranging companies responsible for the developmentof space-based passive microwave radiometer instruments (Aerojet Corpo-ration: 1965–1972 and 1989–1993; Hughes Aircraft Company: 1976–1982).From 1986 to 1989 and from 1993 to the present, he has been with the MarineMeteorology Division, Naval Research Laboratory, Monterey, CA, workingon microwave radiometric modeling and analysis of SSM/I data and the directassimilation of microwave radiances for numerical weather prediction. He iscurrently Technical Leader for the joint Air Force/Navy DMSP calibration/val-idation effort of the Special Sensor Microwave Imager/Sounder.
Mr. Poe is a member of the American Mathematical Society.
William Purdy received the B.S. degree in mechanical engineering from theUniversity of Maryland, College Park.
He has specialized in spacecraft systems engineering and spacecraft mecha-nisms over an 18-year career, including working at the Naval Research Labo-ratory from 1986 to 1999. He is currently the proprietor of Purdy Engineeringfrom 1999 to the present. He has performed as a Systems Engineer on WindSatpayload with responsibilities for alignments, antenna systems engineering, andmechanical systems engineering.
Donald Richardson received the B.S. and M.S. degrees from the University ofKentucky, Lexington, in 1978 and 1980, respectively.
He is currentaly a Software Developer and Scientist who has worked on sev-eral projects for NASA and the Naval Research Laboratory (NRL). For NASA,he has worked on data analysis and software development for the Upper Atmos-phere Reseach Satellites’ Halogen Occulation Experiment, the Cosmic Back-ground Explorer, the Total Ozone Mapping Spectrometer, and Solar BackscatterUltraviolet Spectrometer. In the late 1990s, he was the Vice President of Fly-tecomm of Florida, a small startup company developing software products totrack in-flight aircraft based on a FAA data feed. For the past four years, he hasbeen the Lead Programmer for NRL’s WindSat and is responsible for the designand implementation of the processing code.
Walter Grossman (M’78), photograph and biography not available at the timeof publication.
W. Linwood Jones (SM’75–F’99) received the Ph.D. degree in electrical en-gineering from the Virginia Polytechnic Institute and State University, Blacks-burg, in 1971.
He is a Professor with the School of Electrical Engineering and Computer Sci-ence, University of Central Florida, Orlando. At UCF, he teaches undergraduateand graduate courses in communications, satellite remote sensing, and radar sys-tems. He is also the Director of the Central Florida Remote Sensing Laboratory,where he performs research in satellite microwave remote sensing technologydevelopment. He is currently a member of the science teams for the Jet Propul-sion Laboratory’s SeaWinds Scatterometer Program and the NASA GoddardSpace Flight Center’s Tropical Rainfall Measuring Mission.
David Spencer received the B.S. and M.S. degrees from the University of Col-orado, Boulder, all in aerospace engineering.
He is currently with the Naval Research Laboratory, Washington, DC. He hasan extensive space hardware background where he has worked in the positionsof Designer, Test Lead, P/L Integrator, Launch Site Coordinator, Vehicle Inte-gration Manager, and Program Manager. He has worked both operational andR&D missions. Most recently, he was the WindSat Payload Program Manager,as well as the Civilian Deputy for the Navy METOC space program element. Heis currently the Deputy Chief Engineer of the NPOESS environmental satelliteprogram.
Gerald Golba (M’03) received the B.S. degree from The Ohio State University,Columbus, in 1985.
He is currently an electrical engineer working in the Space Electronics De-velopment Branch, Naval Center for Space Technology, Naval Research Lab-oratory, Washington, DC. He has spent his entire career in the development ofspace system electronics including bus and payload components. He was theElectrical Systems Lead for the WindSat Payload.
Jeffrey Cleveland is a Computer Engineer with the Spacecraft EngineeringDepartment, Naval Center for Space Technology, Naval Research Laboratory(NRL), Washington, DC. He has been with NRL for more than 15 years andhas been involved with more than ten spacecrafts and space experiments, twoof which are currently on-orbit and generating data. His experience has largelybeen with scientific spacecraft and experiments like the High Temperature Su-perconductor Space Experiment, the Microelectronics and Photonics Test Bed,and most recently, the WindSat payload. He is an expert in real-time softwaresystems and has led the development of these systems for a number of hisprojects. He is also well qualified in the area of electronic system integrationand testing. In addition to his work at NRL, he serves as an Adjunct Professorat the Northern Virginia Community College, Annandale.

GAISER et al.: WINDSAT SPACEBORNE POLARIMETRIC MICROWAVE RADIOMETER 2361
Larry Choy received the B.A. degree from the University of California,Berkeley, and the Ph.D. degree from the University of New Hampshire,Durham, both in physics.
Since 1974, he has been with the Naval Research Laboratory, Washington,DC, doing applied physics research and program management on numeroussatellite missions, both in the unclassified and classified domains. He is a cur-rently a member of the Windsat ground-processing algorithm group. He joinedthe Windsat project about three years ago after completing a 7.5-year specialassignment with the National Reconnaissance Office.
Richard M. Bevilacqua, photograph and biography not available at the time ofpublication.
Paul S. Chang (S’93–M’95–SM’03) received theB.S. degree in electrical engineering from UnionCollege, Schenectady, NY, in 1988, and the Ph.D.degree in electrical engineering from the Universityof Massachusetts, Amherst, in 1994.
Since 1994, he has been with the Office of Re-search and Applications, National EnvironmentalSatellite, Data and Information Service, NationalOceanic and Atmospheric Administration, CampSprings, MD. His primary interests have been activeand passive microwave remote sensing of the ocean
surface, with emphasis on the retrieval of the ocean surface wind vector. Heis currently involved in the calibration and validation activities of WindSat(polarimetric radiometer) on Coriolis and SeaWinds (ku-band scatterometer)on ADEOS-II. He is also leading an effort to demonstrate and quantify theimpacts of satellite remotely sensed ocean vector wind data on operationalmarine short-term forecasting and warnings.