the wonderful world of mapping - weebly · the wonderful world of mapping ... throughout the...
TRANSCRIPT

The Wonderful World of Mapping
Created by Ashleigh Shinnie, Joseph Harris, Matthew Parkinson & Natalie Cahill
This unit plan was created based on the SOSE essential learnings PS7.5- Distribution maps, climate zone maps and weather maps have specific features to convey information, including latitude, longitude, eight compass points, scale and distance, a legend and shading and/or symbols.

Unit Plan- The Wonderful World of Mapping
KLA Year Level Duration
SOSE 7 6 Weeks
Goal Statement
Throughout the duration of this unit students will be exploring the geography strand of place and space to
enhance their ability to interpret a variety of maps for three key purposes. These purposes include
investigating where places are in relation to each other, giving directions and finding your way as well as
interpreting data to solve problems. Students will use map skills to read and interpret a range of maps
including distribution, climate zone and weather at a global, national and local level. In addition to different
types of maps, there will be a key focus on specific features that help convey information. During this unit
students will organise this information in the form of a learning journal which will include a glossary of key
terms. This will assist them in identifying what they have learnt and what is still left to discover as well as reflect
on key learning at the end of the unit.
Studies of Society and Environment Content/Concept and Skills Statement Activities in this unit aim to develop students’ ability to comprehend and interpret information in relation to
mapping. Knowledge of the world in relation to population statistics, climate, geography, weather and many
other social aspects in our world make maps an integral tool in being able to make informed decisions about
the world around us. Reading maps and understanding the content being conveyed is a critical tool in receiving
information and using it to form opinions efficiently.
The content will be scaffolded to allow students to gradually develop their understanding of what maps are and
what maps can be used for. By structuring content in this way students will be able to build upon their previous
knowledge and eventually be able to interpret information from maps independently. The investigation will
follow the social investigation guidelines to ensure the structuring of content throughout the unit is effectively
presented.
Statement of Intention
By the end of this unit it is intended that students will be able to demonstrate their ability to:
Read and interpret the data being presented on climate zone, weather and distribution maps
Identify and distinguish the differences between climate zone, weather and distribution maps
Investigate where places are in relation to each other using maps
Find their way and give directions using the 8 compass points
Understand that lines of latitude and longitude are used to determine co-ordinates on world maps
Design and create maps with specific features
Use a scale to calculate the distance between two places
Read and interpret data on maps through the specific features of shading and symbols

Key Questions 1. What are maps?
2. How do we understand maps?
3. What information do different maps tell us?
4. What do the different elements on the map mean?
5. How can we distinguish between the different types of maps?
6. What features of maps help us to identify and describe where places are in relation to each other?
7. What features of maps help us give directions and find our way?
8. What features of maps help us interpret data in order to solve problems?
Identify Curriculum
Ways of Working Knowledge and Understanding
Identify issues and use common and own focus
questions
Plan investigations using inquiry models
Draw conclusions and make decisions based on
information and evidence by identifying patterns
and connections
PS 7.5 -Distribution maps, climate zone maps and
weather maps have specific features to convey
information, including latitude, longitude, eight
compass points, scale and distance, a legend and
shading and/or symbols.
General Capabilities Cross Curriculum priorities
ICT
For example ICT will be embedded into this unit
through the use of synoptic maps
Numeracy
For example students will use numeracy to locate
points of latitude and longitude on a world map
Aboriginal and Torres Strait Islander
histories and cultures
For example Indigenous cultures will be embedded
into this unit through the use of distribution maps to
highlight where the different Indigenous language
families reside within Australia.

Develop assessment Make judgments
Assessment Type What will be assessed Stage of S.I.S Purpose of assessment Assessable elements
Diagnostic Students ability to:
Reflect on their prior knowledge
Explore To identify what students already know about maps and the specific features used to convey information in order to expand their current knowledge.
Students will be assessed based on the features of the maps that they are already able to identify
Formative
Students ability to:
Distinguish between the three
different types of maps
Describe what information the
map is conveying and what
features assist them in
interpreting the data on the map
Analysing
Information
For the teacher to observe the
student’s current understanding and
provide feedback or follow up lessons
to assist individual students.
Student’s ability to identify
climate zone, weather and
distribution maps and their
purposes.
Summative Student’s ability to:
Identify and describe distribution,
climate zone and weather maps
Read and interpret the data on
the maps to solve problems
Locate specific features on a
map explain their role
Create a distribution map based
on the data provided
Conclude and
Review
To ensure students have reached a
new understanding of the three types
of maps that have been investigated
during the unit as well as the specific
features that may be used to help
convey information.
This assessment will take place in the form of an end of unit test. The students will be assessed on their ability to answer the questions provided.
Unit Overview
Lesson
Number
Stage of Social
Investigation
Strategy
Lesson Description Resources Assessment
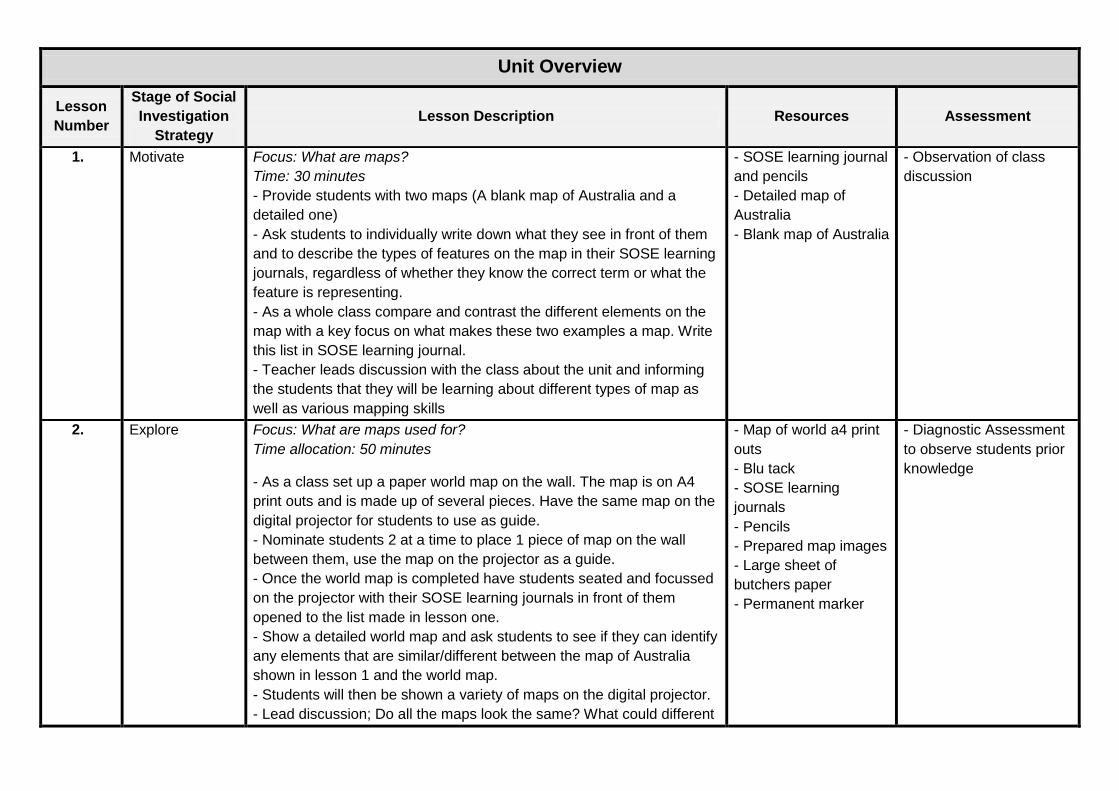
1. Motivate
Focus: What are maps?
Time: 30 minutes
- Provide students with two maps (A blank map of Australia and a
detailed one)
- Ask students to individually write down what they see in front of them
and to describe the types of features on the map in their SOSE learning
journals, regardless of whether they know the correct term or what the
feature is representing.
- As a whole class compare and contrast the different elements on the
map with a key focus on what makes these two examples a map. Write
this list in SOSE learning journal.
- Teacher leads discussion with the class about the unit and informing
the students that they will be learning about different types of map as
well as various mapping skills
- SOSE learning journal
and pencils
- Detailed map of
Australia
- Blank map of Australia
- Observation of class
discussion
2. Explore
Focus: What are maps used for?
Time allocation: 50 minutes
- As a class set up a paper world map on the wall. The map is on A4
print outs and is made up of several pieces. Have the same map on the
digital projector for students to use as guide.
- Nominate students 2 at a time to place 1 piece of map on the wall
between them, use the map on the projector as a guide.
- Once the world map is completed have students seated and focussed
on the projector with their SOSE learning journals in front of them
opened to the list made in lesson one.
- Show a detailed world map and ask students to see if they can identify
any elements that are similar/different between the map of Australia
shown in lesson 1 and the world map.
- Students will then be shown a variety of maps on the digital projector.
- Lead discussion; Do all the maps look the same? What could different
- Map of world a4 print
outs
- Blu tack
- SOSE learning
journals
- Pencils
- Prepared map images
- Large sheet of
butchers paper
- Permanent marker
- Diagnostic Assessment
to observe students prior
knowledge

maps be used for?
- Create a list of answers to reflect upon in future lessons.
3. Frame,
Negotiate and
Identify
Focus: Where to from here?
Time: 30 minutes
- Recap on the maps seen in previous lessons and talk about the list
made about map features and also about what different maps may be
used for.
- As a class form a list of questions to help with the investigation.
- Help the class form a well thought out list of questions which they will
be aiming to answer as the unit proceeds.
- Display a poster of questions on the wall next to the giant map.
- Explain to class how the unit will be explored and how they will go
about answering the class questions.
- SOSE learning
journals
- Butchers paper
- Pen
- Observation of students
contribution to forming
key questions
4. Gathering
Information
Focus: Maps in general
Time: 50 minutes
- Explain to the class that there will be 3 types of maps which the unit
will focus on, distribution, weather and climate zone maps.
- Show an example of a distribution map, lead the class through its
features and ask them what they can see. Ask students to identify
which kind of map it is, based on the evidence discussed. Once the
answer has been reached add it to the word wall. Re-visit it’s features
and add them to their SOSE learning journal under distribution map.
Draw student attention to any key or legend.
- Show students a climate zone map and discuss its features. Students
will notice similarities between distribution map and climate zone map.
- Ask students to discuss what they think the difference is between
them.
- Add information to word wall under climate zone map.
- Show students a weather map and discuss the features which appear.
This map looks quite different to the others so allow students to discuss
what they see with a partner.
- Add information to word wall under weather map.
- Word Wall
- Examples of
distribution, climate
zone and weather
maps
- Observation of small
group discussions
- Collect and make
anecdotal records based
on the learning journals

- Lastly show students a world map which includes lines of longitude
and latitude. Students will have made note of these lines in previous
lessons but have not been taught what they are. Explain what each of
the lines is and add it to the word wall. Explain that next lesson they will
learn more about these lines of longitude and latitude.
5. Gathering
Information
Focus: Longitude and Latitude
Links to other curriculum areas: Mathematics
Time: 45 minutes
- Introduce the terms longitude and latitude to the word wall and using a
globe locate the equator and prime meridian on a world map. Explain
that the equator is a line of latitude and the prime meridian is a line of
longitude.
- Display these two lines on the giant class map.
- Ask students to consider the identifiable differences between longitude
and latitude. Prompt them to look at the shape of the lines and the
direction that they are travelling. Teacher should lead the students to
understand that the lines are forming a grid over the map which work as
co-ordinates to locate a specific country.
- In small groups students explore a variety of world maps and compare
the way the lines of the equator and prime meridian have been labelled.
Students will form a list of countries and oceans that 0° latitude and 0°
longitude pass through.
- Word Wall
- SOSE learning
journals
- Globe
- World Maps
- Observe group work
and input into class
discussions
- Collect and mark the
lists that each group
create
- Feedback to students
on their results
6. Gathering
Information-
Focus: Distribution Maps
Time: 60 minutes
- Begin by showing images of distribution maps that were covered in
lesson 2 and reflect on the ideas and words the students had formed to
describe these maps that were formed in lesson 4
- Ask students to brainstorm in pairs what information the legend on
each map is conveying and add the term ‘legend’ to the word wall
- Try and link the images into three distribution map types: Dot
Distribution Maps, Thematic Distribution Maps( shading) and Statistical
Distribution Map
- Show how distribution maps can show segregation, clustering and
- Word Wall
- Different distribution
maps
- SOSE learning journal
- Whiteboard and
markers
- Masking tape
- Coloured pens
- Collection of SOSE
learning journals for
teacher to check
- Feedback to individual
students
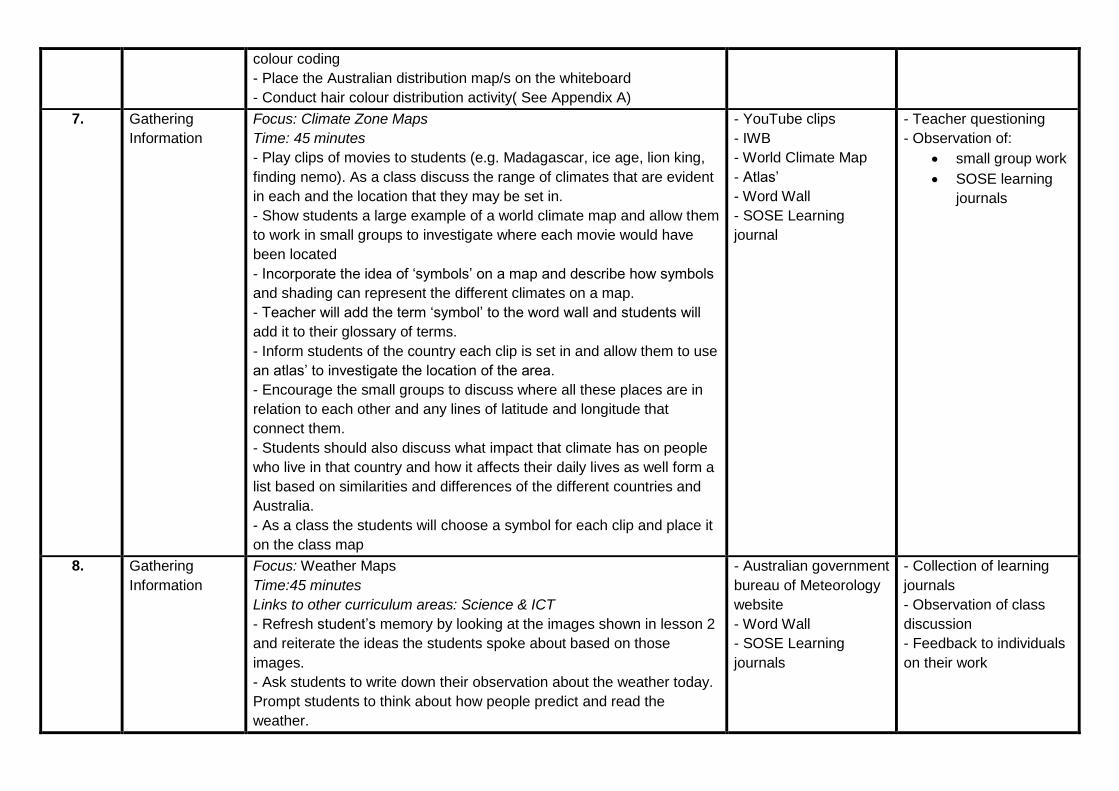
colour coding
- Place the Australian distribution map/s on the whiteboard
- Conduct hair colour distribution activity( See Appendix A)
7. Gathering
Information
Focus: Climate Zone Maps
Time: 45 minutes
- Play clips of movies to students (e.g. Madagascar, ice age, lion king,
finding nemo). As a class discuss the range of climates that are evident
in each and the location that they may be set in.
- Show students a large example of a world climate map and allow them
to work in small groups to investigate where each movie would have
been located
- Incorporate the idea of ‘symbols’ on a map and describe how symbols
and shading can represent the different climates on a map.
- Teacher will add the term ‘symbol’ to the word wall and students will
add it to their glossary of terms.
- Inform students of the country each clip is set in and allow them to use
an atlas’ to investigate the location of the area.
- Encourage the small groups to discuss where all these places are in
relation to each other and any lines of latitude and longitude that
connect them.
- Students should also discuss what impact that climate has on people
who live in that country and how it affects their daily lives as well form a
list based on similarities and differences of the different countries and
Australia.
- As a class the students will choose a symbol for each clip and place it
on the class map
- YouTube clips
- IWB
- World Climate Map
- Atlas’
- Word Wall
- SOSE Learning
journal
- Teacher questioning
- Observation of:
small group work
SOSE learning
journals
8. Gathering
Information
Focus: Weather Maps
Time:45 minutes
Links to other curriculum areas: Science & ICT
- Refresh student’s memory by looking at the images shown in lesson 2
and reiterate the ideas the students spoke about based on those
images.
- Ask students to write down their observation about the weather today.
Prompt students to think about how people predict and read the
weather.
- Australian government
bureau of Meteorology
website
- Word Wall
- SOSE Learning
journals
- Collection of learning
journals
- Observation of class
discussion
- Feedback to individuals
on their work

- As a class investigate the Australian government bureau of
Meteorology and explore the different national weather maps using the
8 compass points to view different areas. Ensure to view the synoptic
weather map and allow the children to discuss what they are seeing.
- Investigate the weather maps that show wind direction and speed.
Explain to students the link between wind direction and the 8 compass
points (e.g. a south-easterly wind)
- Add the terms low, high and tropical cyclone winds the word wall.
- Based on the data from the weather maps they have just seen, ask
students to individually write a weather forecast for the local news in
their learning journals with a focus on using the 8 compass points
9. Analysing
Information
Focus: Question and Answer
Time: 45 minutes
- Refresh students memory in relation to questions formed in lesson 3.
- Have students try to answer each question in their learning journals
based on the knowledge they have gained so far.
- Stimulate a class discussion relating to the answers students have
come up with in their learning journals.
- Create a new poster with the answers written on them to be displayed
in the classroom beside the questions already created.
- Learning Journals and
pencil
- Poster paper
- Marker pen
Formative Assessment:
- Collection of learning
journals
- Observation of
participation in class
discussion
10. Analysing
Information
Focus: Interpreting Data
Time: 30 minutes
- Have students split up into four rotation groups.
- Each rotation will have a folder in which students will have to sort and
identify different types of maps.
- The information students will collect from each station should include
what the map is specifically used for and the different features found on
it.
- This information should be written onto the work sheets provided (See
Appendix B).
- As class share and discuss each groups responses
- Rotation Activity
Folders
- Activity Work Sheet
- Collection of work
sheets
- Observation of
involvement within small
groups
- Formative Assessment
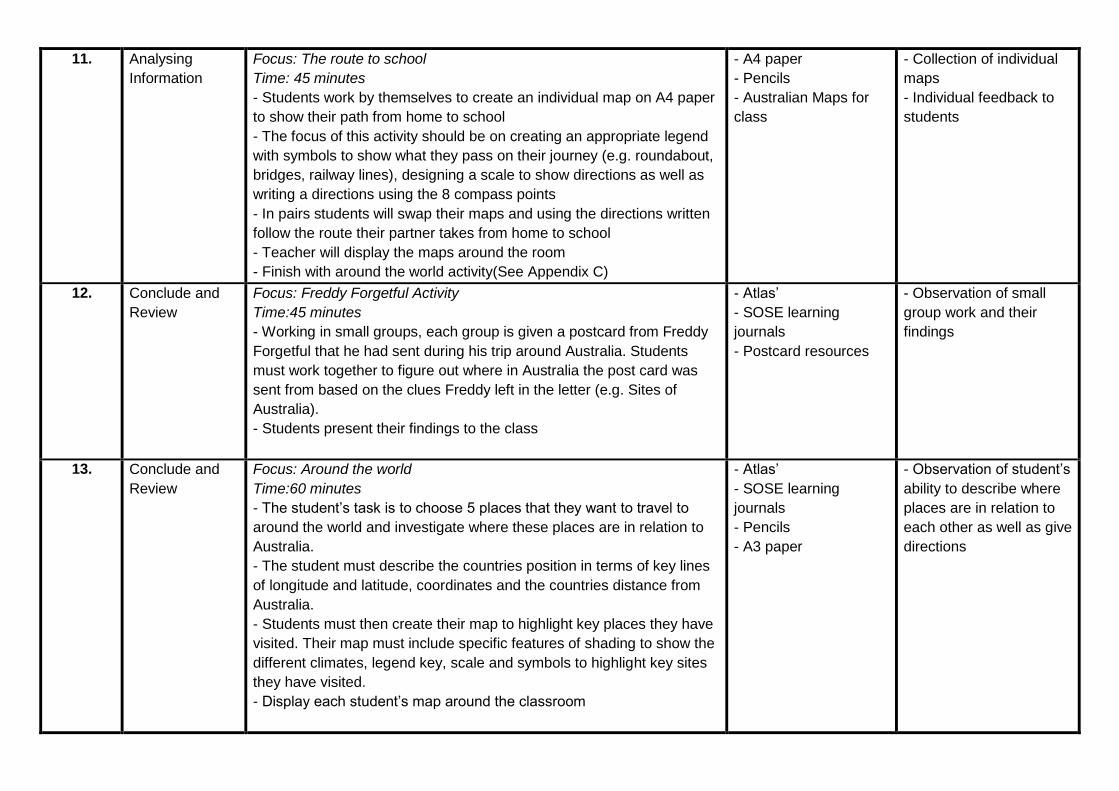
11. Analysing
Information
Focus: The route to school
Time: 45 minutes
- Students work by themselves to create an individual map on A4 paper
to show their path from home to school
- The focus of this activity should be on creating an appropriate legend
with symbols to show what they pass on their journey (e.g. roundabout,
bridges, railway lines), designing a scale to show directions as well as
writing a directions using the 8 compass points
- In pairs students will swap their maps and using the directions written
follow the route their partner takes from home to school
- Teacher will display the maps around the room
- Finish with around the world activity(See Appendix C)
- A4 paper
- Pencils
- Australian Maps for
class
- Collection of individual
maps
- Individual feedback to
students
12. Conclude and
Review
Focus: Freddy Forgetful Activity
Time:45 minutes
- Working in small groups, each group is given a postcard from Freddy
Forgetful that he had sent during his trip around Australia. Students
must work together to figure out where in Australia the post card was
sent from based on the clues Freddy left in the letter (e.g. Sites of
Australia).
- Students present their findings to the class
- Atlas’
- SOSE learning
journals
- Postcard resources
- Observation of small
group work and their
findings
13. Conclude and
Review
Focus: Around the world
Time:60 minutes
- The student’s task is to choose 5 places that they want to travel to
around the world and investigate where these places are in relation to
Australia.
- The student must describe the countries position in terms of key lines
of longitude and latitude, coordinates and the countries distance from
Australia.
- Students must then create their map to highlight key places they have
visited. Their map must include specific features of shading to show the
different climates, legend key, scale and symbols to highlight key sites
they have visited.
- Display each student’s map around the classroom
- Atlas’
- SOSE learning
journals
- Pencils
- A3 paper
- Observation of student’s
ability to describe where
places are in relation to
each other as well as give
directions

14. Conclude and
Review
Focus: Summative Assessment Task
Time: 45 minutes
- Students are to sit a test based on the information that they have
investigated during this unit
- See Appendix D
- Refer to assessment rubric
- Test booklet
- Assessment Rubric
- Pencils
Summative Assessment
(See attached Rubric)
15. Take Action
Focus: Information Session
Time: 30 minutes
- Students will invite their prep buddies to the classroom in which they
will give an information session to their individual prep buddy about out
giant world map that has been created in class.
- Information students should discuss with their prep buddies includes
information such as distinguishing the different countries on the map,
explaining what the different maps are showing ie. Whether it is a
distribution, climate or weather map.
- SOSE Learning
journals
- Observation of
participation with prep
buddies
16. Reflect On
Focus: What did we learn?
Time: 30 minutes
- The teacher and students reflect on their glossary of key terms that
they have produced over the unit. As a class they discuss the types of
maps they learnt about and other maps that they would like to
investigate in the future.
- Students reflect on their knew knowledge by writing a final journal
entry on what they now know about maps, how this information is
relevant to them and what impact it has on people’s everyday lives.
Their final journal entry should include illustrations of weather, climate
zone and distribution maps.
- Word Wall
- SOSE learning
journals
- Collection of SOSE
learning journals
- Feedback to individual
work
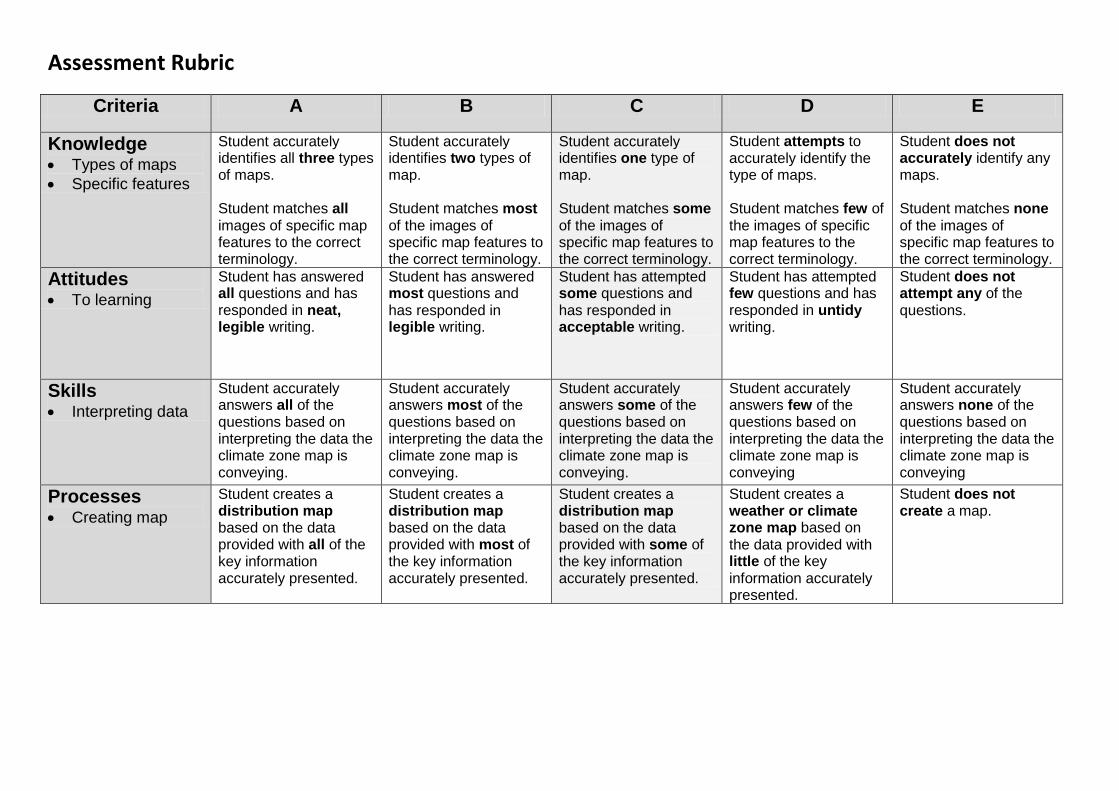
Assessment Rubric
Criteria A B C D E
Knowledge Types of maps
Specific features
Student accurately identifies all three types of maps. Student matches all images of specific map features to the correct terminology.
Student accurately identifies two types of map. Student matches most of the images of specific map features to the correct terminology.
Student accurately identifies one type of map. Student matches some of the images of specific map features to the correct terminology.
Student attempts to accurately identify the type of maps. Student matches few of the images of specific map features to the correct terminology.
Student does not accurately identify any maps. Student matches none of the images of specific map features to the correct terminology.
Attitudes To learning
Student has answered all questions and has responded in neat, legible writing.
Student has answered most questions and has responded in legible writing.
Student has attempted some questions and has responded in acceptable writing.
Student has attempted few questions and has responded in untidy writing.
Student does not attempt any of the questions.
Skills Interpreting data
Student accurately answers all of the questions based on interpreting the data the climate zone map is conveying.
Student accurately answers most of the questions based on interpreting the data the climate zone map is conveying.
Student accurately answers some of the questions based on interpreting the data the climate zone map is conveying.
Student accurately answers few of the questions based on interpreting the data the climate zone map is conveying
Student accurately answers none of the questions based on interpreting the data the climate zone map is conveying
Processes Creating map
Student creates a distribution map based on the data provided with all of the key information accurately presented.
Student creates a distribution map based on the data provided with most of the key information accurately presented.
Student creates a distribution map based on the data provided with some of the key information accurately presented.
Student creates a weather or climate zone map based on the data provided with little of the key information accurately presented.
Student does not create a map.

References
Australian Curriculum, Assessment and Reporting Authority (ACARA). (Jan. 2011). Shape of the Australian
Curriculum: Geography. Retrieved 15 March 2013 from:
http://www.acara.edu.au/verve/_resources/Shape_of_the_Australian_Curriculum_Geography.pdf
Australian Government. (2013). Bureau of Meteorology. Retrieved 17 March 2013 from:
http://www.bom.gov.au/australia/
Queensland Studies Authority (2007). Studies of society and environment: Essential learnings by the end of
year 7. Retrieved 15 March 2013 from:
http://www.qsa.qld.edu.au/downloads/p_10/qcar_el_sose_yr7.pdf
Reynolds, R. (2012). Teaching history, geography & SOSE in the primary school. 2nd Ed. Oxford University
press: South Melbourne.
Reynolds, R. (2009). Teaching studies of society & environment in the primary school. Oxford University
press: South Melbourne.
Appendix A
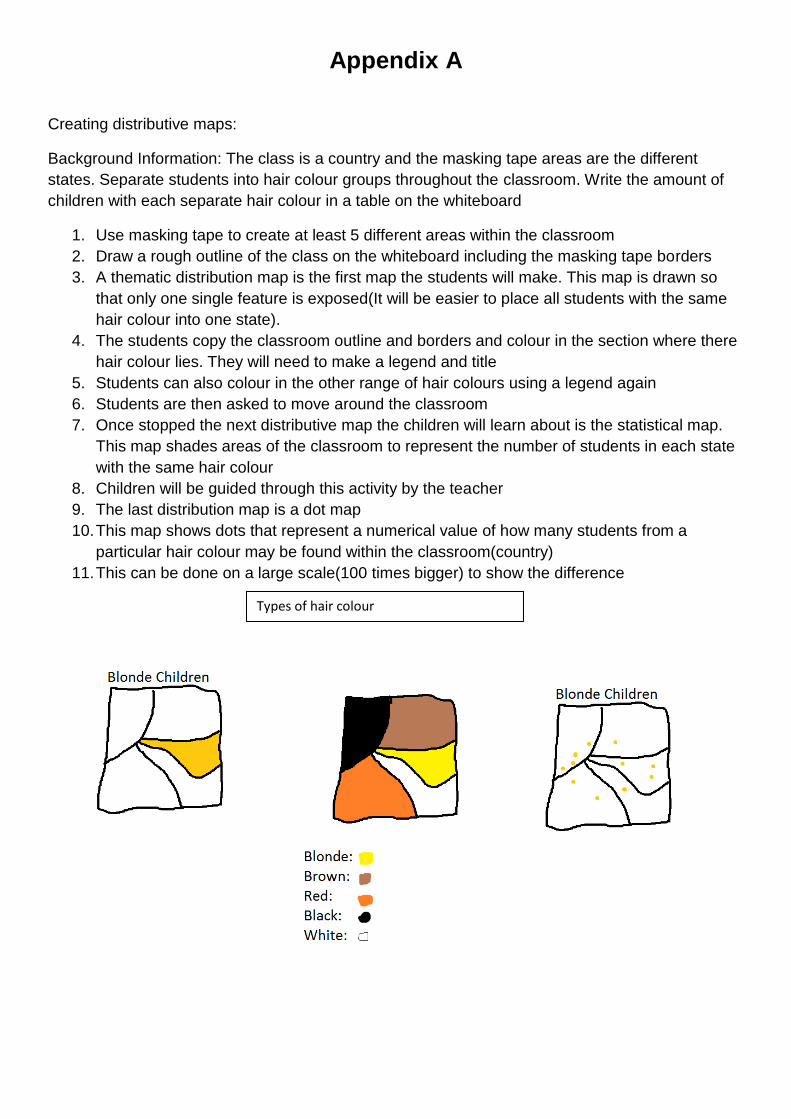
Creating distributive maps:
Background Information: The class is a country and the masking tape areas are the different
states. Separate students into hair colour groups throughout the classroom. Write the amount of
children with each separate hair colour in a table on the whiteboard
1. Use masking tape to create at least 5 different areas within the classroom
2. Draw a rough outline of the class on the whiteboard including the masking tape borders
3. A thematic distribution map is the first map the students will make. This map is drawn so
that only one single feature is exposed(It will be easier to place all students with the same
hair colour into one state).
4. The students copy the classroom outline and borders and colour in the section where there
hair colour lies. They will need to make a legend and title
5. Students can also colour in the other range of hair colours using a legend again
6. Students are then asked to move around the classroom
7. Once stopped the next distributive map the children will learn about is the statistical map.
This map shades areas of the classroom to represent the number of students in each state
with the same hair colour
8. Children will be guided through this activity by the teacher
9. The last distribution map is a dot map
10. This map shows dots that represent a numerical value of how many students from a
particular hair colour may be found within the classroom(country)
11. This can be done on a large scale(100 times bigger) to show the difference
Types of hair colour

Appendix B
Different Types of Maps - Worksheet
Rotation Folder 1 1. What type of map is provided?
___________________________________________________________________ ___________________________________________________________________ ___________________________________________________________________
2. When would this map be used?
___________________________________________________________________ ___________________________________________________________________ ____________________________________________________________________________
3. What are the key features of this map?
___________________________________________________________________ ___________________________________________________________________ ___________________________________________________________________
Rotation Folder 2
1. What type of map is provided?
___________________________________________________________________ ___________________________________________________________________ ____________________________________________________________________________
2. When would this map be used?
___________________________________________________________________ ___________________________________________________________________ ____________________________________________________________________________
3. What are the key features of this map?
___________________________________________________________________ ___________________________________________________________________ ___________________________________________________________________

Rotation Folder 3
1. What type of map is provided?
___________________________________________________________________ ___________________________________________________________________ ____________________________________________________________________________
2. When would this map be used?
___________________________________________________________________ ___________________________________________________________________ ____________________________________________________________________________
3. What are the key features of this map?
___________________________________________________________________ ___________________________________________________________________ ___________________________________________________________________
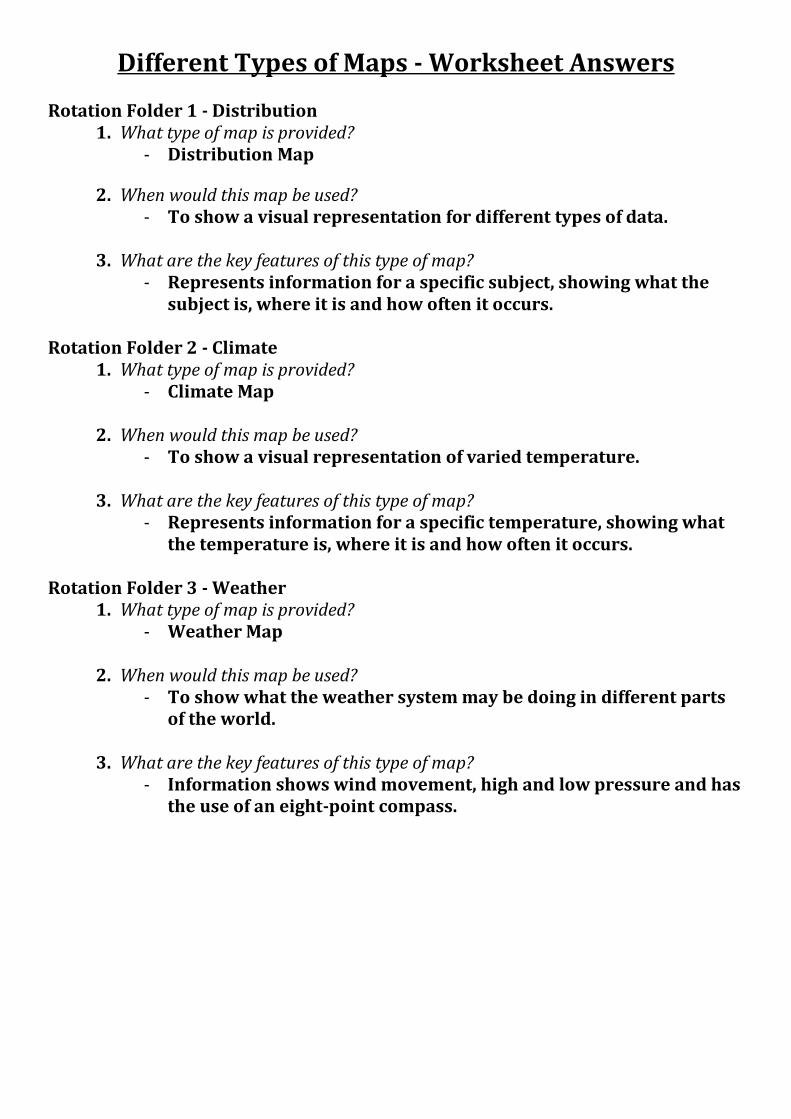
Different Types of Maps - Worksheet Answers
Rotation Folder 1 - Distribution 1. What type of map is provided?
- Distribution Map
2. When would this map be used? - To show a visual representation for different types of data.
3. What are the key features of this type of map?
- Represents information for a specific subject, showing what the subject is, where it is and how often it occurs.
Rotation Folder 2 - Climate 1. What type of map is provided?
- Climate Map
2. When would this map be used? - To show a visual representation of varied temperature.
3. What are the key features of this type of map?
- Represents information for a specific temperature, showing what the temperature is, where it is and how often it occurs.
Rotation Folder 3 - Weather
1. What type of map is provided? - Weather Map
2. When would this map be used?
- To show what the weather system may be doing in different parts of the world.
3. What are the key features of this type of map? - Information shows wind movement, high and low pressure and has
the use of an eight-point compass.
Appendix C
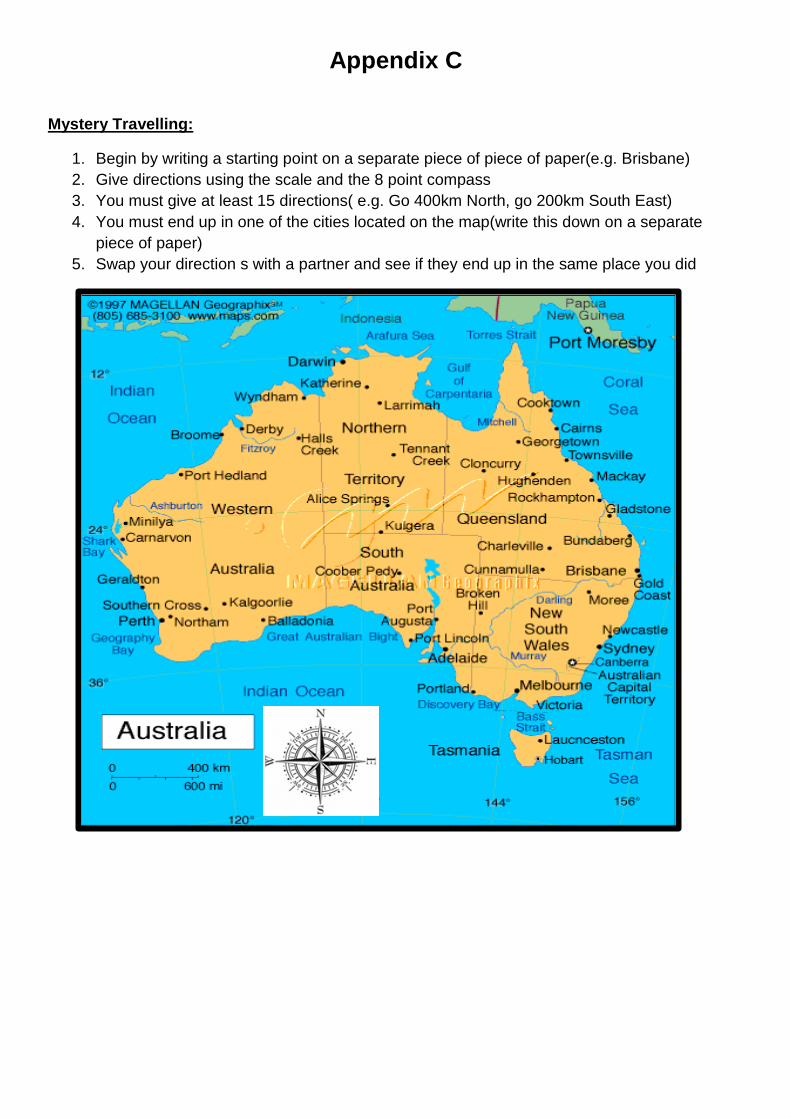
Mystery Travelling:
1. Begin by writing a starting point on a separate piece of piece of paper(e.g. Brisbane)
2. Give directions using the scale and the 8 point compass
3. You must give at least 15 directions( e.g. Go 400km North, go 200km South East)
4. You must end up in one of the cities located on the map(write this down on a separate
piece of paper)
5. Swap your direction s with a partner and see if they end up in the same place you did