the world bank economic review, vol. 11. no civil...
TRANSCRIPT

THE WORLD BANK ECONOMIC REVIEW, VOL. 11. NO . 2: 219 -42
© 1997 The International Bank for Reconstruction and Development / THE WORLD BANK
219
Civil Liberties, Democracy, and the Performanceof Government Projects
Jonathan Isham, Daniel Kaufmann, and Lant H. Pritchett
This article uses a cross-national data set on the performance of government investment projectsfinanced by the World Bank to expatriate the link between government efficacy and governance. Itdemonstrates a strong empirical link between civil liberties and the performance of governmentprojects. Even after controlling for other determinants of performance, countries with the strongestcivil liberties Date projects with an economic rate of return 8–22 percentage points higher thancountries with the weakest civil liberties. The strong effect of civil liberties holds trite even whencontrolling for the level of democracy.
The interrelationship among civil liberties, civil strife, and project performance suggests that thepossible mechanism of causation is front more civil liberties to increased citizen voice to betterprojects. This result acids to the evidence for the view that increasing citizen voice and publicaccountability—through both participation and better governance—can lead to greater efficacy ingovernment action.
Discussions of governance often generate more rhetorical heat than empirical light.Governance, like rel igion, is a broad topic that inspires strong beliefs and is difficult tomeasure reliably. Even a consensus on definitions is elusive: what do we mean bygovernance? A World Bank policy paper defines governance as “the manner in whichpower is exercised in the management of a country’s eco- and social resources fordevelopment,” which does not easily lend itself to quantification (World Bank 1992, p.1). “We hope to shed some empirical light on one dimension of governance bydemonstrating a positive link between a country’s civil liberties and the performance ofthe government’s investment projects.”
Governance involves actions of publicly vested authorities. We label three interrelateddimensions of government action as what, how, and how well. What public decisions aretaken—including the enactment of laws, policies, and regulations—affects the allocationof public expenditures and investments and determines incentives for all other actors.How public decisions and authority are exercised depends on underlying social structures,political structures, and official and unofficial institutions. How well public; decisionsand authority are exercised determines the efficacy of government in accomplishing itsobjectives,
Jonathan Isham is with the Institutional Reform and the Informal Sector (IRIS) Center it theUniversity of Maryland, Daniel Kaufmann is with the Harvard Institute for International Development(on leave from the World Bank), and Lant H. Pritchett is with the Policy Research Department at theWorld Bank. The authors thank Deon Filmer and Phil Keefer for helpful comments, as well as seminarparticipants at Columbia University, the University of Maryland, the Northeast Universities DevelopmentConference, and the World Bank. This article is a reworking of “Governance and the Returns onInvestment: An Empirical Investigation” (World Bank Policy Research Department Working Paper1550).

220 THE WORLD BANK ECONOMIC REVIEW VOL. 11, NO. 2
Although researchers have written a lot on what and how, they have written less onhow well. In this article, we analyze the impact of one element of how-degree of civilliberties-on one element of how well—the returns on government investments. Section Ireviews recent empirical, cross-national li terature linking economic outcomes withgovernment action as well as recent work on the efficacy of government action. SectionII discusses data on economic rates of return of public investment projects financed bythe World Bank. These data provide a unique quantitative measure of governmentperformance that is comparable across countries. Section III presents evidence of astrong relationship between civil liberties and these rates of return; this relationship isrobust to a wide variety of controls, including measures of democracy. Section IVexplores the links among civil liberties, citizen voice, and project performance.
I. WHAT, HOW, AND HOW WELL
Economic and social outcomes so depend on governance—for good and for ill—thatthe what, how, and how well of government action underlie the richest social sciencetraditions. We cannot begin to do justice (even in outline) to this literature. Therefore,in setting the context for our new results, we limit the scope of our review to recentempirical, cross-national research focused principally on economic outcomes (and hencewritten mostly by economists).
Much recent literature concerns the impact on economic growth of what governmentsdo. A small share of these studies examines the effects of directly measurable governmentactions on growth, such as levels and patterns of public investment expenditures (Easterlyand Rebelo 1993 and Devarajan, Swaroop, and Zou 1996). A larger share examinesthe effects of a specific outcome associated with government actions, including schoolenrollment rates (Barro 1991), outcome-based measures of outward orientation(Harrison 1995 and Dollar 1992), financial depth (King and Levine 1993),macroeconomic instability (Fischer 1993), and investment in machinery (de Long andSummers 1993). Most such studies, however, offer no explicit link between specificgovernment policies and actions (for example, building more schools) and the growth-promoting outcome (for example, higher enrollment rates).
Another strand of literature analyzes the effects of underlying social structures,political structures, and institutions that determine how governments exercise publicdecisions and authority. Much of this work focuses on the effects of civil and politicalliberties (Dasgupta 1993). Lipset (1960) demonstrated the association between higherlevels of income and higher levels of civil liberties and of popular political participation.However, whether democracy promotes or hinders economic growth remains ambiguous.In the 1960s and 1970s scholars debated whether democracy was an insuperableobstacle to development, Many argued that a premature move to democracy hinderedgrowth by increasing the influence of special interest groups, fomenting the competitionfor policy-induced rents, lowering savings rates, reducing the stability of policy (especiallymacroeconomic policy), and fostering political instability, This position seemedreasonable at the rime. The top 20 fastest growing major economies in 1960–74 includedonly three consistent democracies (and only one of those was a developing country), fourdecidedly authoritarian Asian economies, and four socialist countries. Current research,although deeply divided, tends to find no causal link at all between democracy andgrowth. Researchers have revisited the issue as part of the resurgence of empirical workon economic growth (Weede 1983; Kormendi and Maguire 1985; Scully 1988; Grier

Isham, Kaufmann. and Pritchett 221
and Tullock 1989; Helliwell 1992; Barro 1994; and Bhalla 1994). Przeworski andLimongi (1993) and Alesina and Perotri (1994) provide excellent reviews.
The what and how of government action are, of course, critically linked. Policies andactions matter, and underlying conditions partially determine the choice of good or badpolicies. The current studies on growth rarely document this link. However, theliterature on central bank independence has established the connection between specificpolitical institutional mechanisms that promote central bank independence andeconomic outcomes of inflation and growth (Cukierman, Webb, and Neyapti 1992).And recent work by Alesina (1996) shows how institutional arrangements affectbudgetary outcomes.
Much of the ambiguity about the impact of democracy on growth revolves aroundwhether more or less popular political participation leads to better or worse policyoutcomes. Two contrasting arguments seem to be well documented. One argument is thatmore democratic arrangements may lead to greater public investments ininfrastructure, greater (and more equitable) investments in human capital, more opentrade policies (Tavares and Wacziarg 1996), and better provision of a secure legalsystem and property rights (Clague and others 1997). The other argument is that moredemocratic arrangements may have negative effects on government policies and a ctionswhen vested interests lobby for preferential treatment and against efficiency-enhancingreforms (Olson 1965). Negative effects might occur when local pressures block neededinvestments because of “not in my backyard” attitudes or when interest groups engage inwars of attrition in order to avoid the costs of stabilization and promote populistmacroeconomic policy (Alesina and Drazen 1991). Recent work on economic reform isnot entirely sanguine about the ability of democratic politics as usual to bring abouteconomic reforms because the magnitudes of redistribution relative to efficiency gainsare often large (Rodrik 1996). According to one view of the success of some East Asiangovernments in pursuing sensible macroeconomic policies, authoritarian leaderseffectively insulated meritocratically selected civil servants from direct popular pressures(World Bank 1993b). This view also recognizes that authoritarian leaders in othercontexts have pursued disastrous policies.
A relatively small amount of literature addresses how well government accomplishesits objectives. A recent set of papers uses private service ratings for foreign investors IQanalyze government efficacy. Mauro (1995) examines the impact of various measures ofinstitutional quality and suggests that corruption is associated with lower economicgrowth, primarily by reducing investment. Knack and Keefer (1995) find significantnegative effects of the overall quality of government on economic outcomes. Chong andCalderón (1996) explore the connection between these same institutional quality indexesand economic inequality.
We focus not on the impact of the how or how well of government policies onaggregate economic outcomes, but on the connection between how and how well. Inparticular, we examine the link between civil liberties and democracy criticaldeterminants of how governments exercise public decisions and authority—and theefficacy of public investments.
Why might economists expect such a link? In competitive markets, shareholders andconsumers goad managers of private corporate firms—with separate management andownership—into efficacy. In competitive markets, profit-maximizing shareholders canchoose alternative investments, and discriminating buyers can choose alternativesuppliers. By contrast, shareholders and consumers do not pressure publicly vestedauthorities through these channels of choice. Citizens cannot freely choose to own shares
222 THE WORLD BANK ECONOMIC REVIEW VOL. 11, NO. 2
of another country. Citizen preferences are not linked to revenues for governmentservices, because taxation is ultimately coercive. Accordingly, other channels inducegovernment performance, including accountability, openness, transparency,predictability, and the rule of law (Brautigam 1992). In Hirschman’s evocative phrase,while markets create managerial discipline and induce efficacy through the exercise ofchoice, governments are principally disciplined through the exercise of voice (Hirschman1970).
However, very few empirical studies have documented the link between citizenvoice—facilitated by openness—and accountability and performance (Paul 1992, 1994,and 1996). Comparing the performance of public irrigation systems in India and Korea,Wade (1994) finds that when irrigation officials face more local connections andaccountability, the systems perform better than traditional arrangements that insulatecivil servants from performance pressures. Drèze and Sen (1989) argue that no countrywith a free press has ever had a major famine. They postulate that a free flow ofinformation pressures (even nondemocratic) governments into public action. Literatureon the involvement of potential beneficiaries in government-financed investment projectsalso suggests the importance of citizen voice (World Bank 1995 and Korten and Siy1988). For instance, Isham, Narayan, and Pritchett (1995) show that aid-financedrural water supply projects performed much better with greater participation of thebeneficiaries. Overall, these results suggest that citizen voice is an important determinantof government accountability and efficacy but do not identify the underlying social andpolitical conditions conducive to citizen voice.
This unexplored chain of reasoning—from social and political conditions to citizenvoice to government efficacy—frames the key hypothesis explored here, We hypothesizethat basic civil liberties—such as the freedom of individual expression, a pluralistic andfree media, the ability of groups to organize, and freedom of dissent andcriticism—facilitate greater citizen voice and hence more effective government action,We also consider whether citizen voice requires (or is enhanced by) democracy. Forexample the country that Wade (1994) argues had less public sector accountability(India) was clearly more democratic.
II. PROJECT PERFORMANCE AS AN INDICATOR OF GOVERNMENT EFFICACY
Conceptual and practical difficulties explain most of the lack of cross-nationalresearch on determinants of the efficacy of government action. Deep conceptualdisagreements about what governments ought to do, including the objectives chargovernments ought to pursue and the appropriate means to achieve those objectives,plague the efforts to measure efficacy. These differences imply that efficacy cannot beinferred from the success or failure in achieving measured aggregate outcomes likeeconomic growth. Mistaken beliefs may cause government to pursue policies that areinefficient, or even counterproductive, relative to its ultimate objectives. For instance,many governments have actively and deliberately discouraged many types of foreigninvestment. Whether that policy has been effectively implemented is a distinct questionfrom whether it has promoted the desired outcomes.
In addition, a practical difficulty hinders the analysis. Nearly all data concerninggovernment actions concern public resources spent on inputs, not comparable outcomes .The data document finances allocated for roads, bur not roads built, and spending onhealth clinics, but not health outcomes. Nearly every government supports education in aroughly similar way and collects a. fair amount of data on education spending. But

Isham, Kaufmann. and Pritchett 223
analysts cannot compare cross-country efficacy without comparable measures of studentlearning that are extremely rare in developing countries. Overall, because governmentsdo not spend money equally effectively, we can learn very little from input data alone,and certainly nothing about government efficacy (Pritchett 1996). For example,Putnam (1993) recognizes this problem and devises his own measures of governmentefficacy for assessing the performance of regional governments in Italy, where the scopeof regional government responsibility is assigned.
Our data provide an opportunity to overcome these conceptual and practicalobstacles. The data rate on a comparable quantitative scale the success of investmentprojects that governments hive chosen to undertake. We use the economic rate of return(ERR) is an indicator of outcomes (not just expenditures) calculated similarly for allCountries. Moreover, we do nor compare the amounts different governments chose toinvest, either in total or in distribution across sectors. Rather we compare returns ongovernment investments. The data also have the advantage of being microeconomic andhence much less susceptible to argument about reverse causation, Although the level ofeconomic growth could affect the level of civil liberties, we find it unlikely that the.returns on individual projects would affect the level of civil liberties.
The Data
The World Bank’s Operations Evaluation Department (OED) constructed our dataon the performance of government investment projects financed by the World Bank,including both loans from the International Bank for Reconstruction and Development(IBRD) and credits from the International Development Association (IDA). We excludeadjustment (or program) lending from our analysis, because it raises a large set ofproblems with evaluation, which have been addressed on several occasions both by theWorld Bank and its staff (Pritchett and Summers 1993) as well as by other lesssympathetic analysts. After full disbursement of each World Bank loan—typically five toeight years after the opening of the loan—staff from the World Bank and borrowercountry jointly write a project completion report assessing project performance. Theproject completion report, or implementation Completion report, is usually written by astaff member in the World Bank division that supervised the loan, but typically not byanyone with major project approval responsibilities. This practice minimizes theincentives to dissemble about project performance. As part of project assessment, OEDstaff judge each project as satisfactory or unsatisfactory in achieving its developmentobjectives.
In addition, for projects in eight economic subsectors with readily quantified andvalued project benefits—infrastructure, agriculture, industry, energy, water, urbandevelopment, transport, and tourism—project staff, sometimes in collaboration withOED, calculate an ERR. The ERR is the discounted stream of project costs and benefitsover the life of the project, evaluated at economic (as opposed to financial) prices andcalculated following (roughly) the methodology of Squire and van der Tak (1975). (SeeLittle and Mirrlees 1991 for a discussion of economic pricing in World Bank appraisalsand the quality of cost-benefit analysis overall.) The OED staff calculate the ERRs afterproject completion (ex post) in contrast to the ex ante ERRs computed as part of theinternal World Bank procedures for project approval. Ex ante and ex post calculationsof the ERRs differ by an enormous gap (6–10 percentage points on average). The gaphas a huge variability: regressing ex post on ex ante ERRs results in an R_ of only about0.2. Pohl and Mihaljek (1992) study the determinants of this gap. Follow-up studies tend

224 THE WORLD BANK ECONOMIC REVIEW VOL. 11, NO. 2
to find that even the ex post ERRs tend to overstate the true economic rate of returnbecause in many cases projects do nor sustain the benefit flows as long as anticipated inthe ex post ERR calculations. For ex post ERRs evaluators know actual implementationcosts and have somewhat more information about actual operating costs and demand,but must still estimate most of the future stream of benefits.
Government Efficacy
Are the rates of return on government investment projects a reasonable proxy forgovernment efficacy? To find the answer, we address two issues. First we evaluate thereliability and representativeness of the sample of World Bank-financed projects.Second, we distinguish the impact of civil liberties on government efficacy from othercountry- and project-level determinants of project performance,
PROJECT ERRS AS AN EFFICACY INDICATOR. Suppose we know the ERR on everygovernment project j undertaken in country i in period t , ERRjit Then we could calculatethe a verage ERR simply by averaging over all projects. But we do not know the ERRSfor all projects in any country, much less for all projects in many countries. We can,however, observe the ERR on the subset of projects financed by the World Bank.
Statistical inference based on this sample is difficult for three reasons. First, althoughour sample contains an absolutely large number of projects, the median number ofprojects per country is only 9 (average 13.5). Therefore, the average of these fewprojects is at best a very noisy indicator of a country average. Second, projects financedby the World Bank represent only a small fraction of most governments’ investments. Inour sample the average ratio of World Bank disbursements to government investment isjust 6 percent. Third, there is a great deal of within-country heterogeneity in projectreturns (between-country variation in ERRs accounts for only 13 percent of the totalERR variance), while there is very little variance over time in country conditions likecivil liberties. This combination implies that the governance variables (many of whichare for a single point in time in any case) do not vary sufficiently to allow country fixed-effects estimation. If we have a representative sample, however, these problems merelystack the deck against us; these problems create low explanatory power and largestandard errors. Thus, the results will reveal whether we can overcome these problems.
The present empirical exercise does nor focus on the representative ness of the sample,because World Bank involvement in the project may raise the ERR (compared withother government projects) through increased attention and resources. Instead, weinvestigate the potential relationship between ERRs and civil liberties that is specif ic toWorld Bank-financed projects. A simple growth accounting relationship allows us toestimate the relationship between overall returns to capital and our sample of ERRs.The regression results suggest that ERRs are representative of economywide (not justgovernment) returns.
If the difference in performance of World Bank-financed projects compared withthe government portfolio depends on a country’s civil liberties, then a sample selectionbias exists. This bias could happen for two reasons. Countries can choose which of theirpossible projects to finance through the World Bank. Thus the first reason for potentialbias is that this choice may involve cream skimming, in which governments seek WorldBank financing for projects with very high expected ERRs. Or, second, it may involvelaggard dumping, in which governments offer the World Bank the most problematicprojects and finance the best projects out of their own budget. In addition to these

Isham, Kaufmann. and Pritchett 225
potential causes for bias, the country’s civil liberties could affect the World Bank’sselection of projects. The World Bank as a development institution invests in a widevariety of investment climate subject to the projects’ meeting some minimum criteria.We return to this selection problem below in discussing the empirical results.
OTHER DETERMINANTS OF PROJECT PERFORMANCE. Even if the sample isrepresentative of the returns on the projects in the government's investment portfolio,many factors influence the realized return other than government efficacy. We canthink of a schedule of projects as a frontier of potential or achievable project returnsfrom which the government chooses a subset. Economywide and project-specific factorsdetermine the location of this schedule of returns (Isham and Kaufmann 1992, 1995 andKaufmann and Wang 1995). We identify the possible returns so that we can identify thedeviations from this potential as an indicator of government performance.
The lack of a strong correlation between the ERRs and other possible measures ofproject performance augurs against an interpretation of ERRs as an indicator ofgovernment: efficacy. For instance, the “Business Environmental Risk Intelligence” and“International Country Risk Guide” rank countries by various characteristics thatindicate their attractiveness for foreign investment. These various measures are notsignificantly correlated with the ERRs in our data set (although they do show areasonable correlation with the civil liberties variables). In part the lack of correlationmight occur because these private sector ratings are flawed indicators of governmenteffectiveness, as they are designed for foreign investors. Governments that are notattractive to foreign investors on these criteria might still be reasonably effective inimplementing their own projects.
The basic unit of observation in the data is the project, implemented in a specificcountry over a specific period. Prior to adding any indicator of civil liberties to ouranalysis, we specify an equation that relates the ERRjit to three sets of nongovernancevariables: sectoral dummies, country characteristics, and regional dummies. We reportthe results on these control variables in table A-1. An annual publication by OED onevaluation results uses these data to examine project performance by a number ofcharacteristics (see World Bank 1993a). Background papers for the most recentpublication also examine the effect of various country aggregate variables, includinginflation and World Bank-specific inputs, like supervision activity (Kilby 1995).
Three econometric issues deserve mention. First, the time-varying variables, such asthe black market premium, must be matched to the period relevant to projectperformance. While the arguments can be made in favor of various weights (such asdisbursement: profile weights), we use a three-year weighted average of the time-varyingvariable, going back from the year in which the project evaluation was done. Second,although the projects vary tremendously in total cost, from $1.7 million to more than $1billion, the standard tests do not indicate any conditional heteroscedasticity as a functionof project size, nor does weighting ordinary least squares (OLS) estimates by project sizeaffect the results. Third, by OED convention the lowest ERR reported is negative 5percent, which implies that the data are truncated from below; hence, the reportedregression results use Tobit estimation unless otherwise noted. However, because only 8.4percent of the sample is at the truncation point (–5), the Tobit estimates are quitesimilar to simple OLS estimates (Greene 1981). it is hard to believe that much is gained(or lost) by using Tobit estimates.
We include a set of sectoral dummy variables because the sectors differ substantiallyin their ability and in their techniques for assessing the ERR. By including the sector

226 THE WORLD BANK ECONOMIC REVIEW VOL. 11, NO. 2
dummies, the differing patterns of sectoral investment across countries do not affect theestimates of the other parameters. We also include a dummy variable for projectcomplexity, which accounts for a subset of agricultural projects, including all integratedrural development, irrigation and drainage, and livestock projects, which presented someparticular difficulties (World Bank 1988). Our estimates reconfirm that the ERRs forthese projects are about 4 percentage points lower on average.
We include a set of time-varying country characteristics that potentially determinereturns. We use the economywide capital-labor ratio because a higher capital-laborratio lowers the potential return on capital. Our estimates confirm this relation: a unitincrease in the natural log of the capital-labor ratio reduces the ERR by between 1 and1.6 percentage points (table A-1). We use the terms of trade because many analystssuspect that terms of trade shocks determine project returns, both in the affected sectorand in the economy as a whole. We do not find a particularly large or significant effect.Policy and outcome variables also potentially influence returns. We consider the blackmarker premium to be an omnibus indicator of distorted policies because it is associatedwith overvalued exchange rates, trade distortions, and macroeconomic instability, all ofwhich have a strong negative impact on ERRs. Even accounting for the black markerpremium, projects do better in countries with a larger fiscal surplus. We expected thatgross domestic product (GDP) growth would also have a large impact on returns, but theeffect is modest.
We also include a set of regional dummies based on the World Bank groupings forLatin America and the Caribbean, Sub-Saharan Africa, South Asia, East Asia, andEurope, the Middle East, and North Africa. We find as expected that projects in Sub-Saharan Africa do much worse (10 percentage points), projects in Latin America andthe Caribbean and in Europe, the Middle East, and North Africa do about 5percentage points worse, and countries in East Asia (which includes in addition to thehigh-performing East Asian countries, the underperforming Southeast Asian and Pacificcountries) do about 3 percentage points worse (table A-1). The inclusion of the regionalcontrols does have a significant impact on the estimates of other variables, so in allsubsequent tables we report regressions with and without regional controls.
III. CIVIL LIBERTIES, PROJECT PERFORMANCE, AND DEMOCRACY
Our results here are similar to those reported by Isham and Kaufmann (1995), whoargue that many variables, such as policy distortions, affect both public and privatesector projects. We ask whether civil liberties have an additional effect on projectperformance if we control for the set of project and country factors. We describe fourmeasures of basic civil liberties that are relevant to the ability of citizens to exercise voiceand present the results of including these measures as determinants of ERRs. We thenlook at the robustness of the relation between civil liberties and ERRs using a widevariety of controls, including measures of democracy.
Measuring Civil Liberties
Freedom House (1994) publishes a ranking of civil liberties on a scale of 1 to 7 for 165countries from 1972 to 1994 based on a checklist of 14 civil liberties. The checklistincludes media free of censorship, open public discussion, freedom of assembly anddemonstration, freedom of political organization, nondiscriminatory rule of law inpolitically relevant cases, freedom from unjustified political terror, free trade unions and

Isham, Kaufmann. and Pritchett 227
peasant organizations, free businesses and cooperatives, free professional and otherprivate organizations, free religious institutions, personal social rights (for example, theright to own property and to travel internally and externally), socioeconomic rights,freedom from gross socioeconomic inequality, and freedom from gross governmentindifference or corruption. Humana (1986) ranks human rights achievement in 89countries for 1985 on a scale of 0 to 100 (the actual range for our sample is 13 to 9 1)based on the definition of human rights adopted by the General Assembly of the UnitedNations in 1966 under the International Covenant on Civil and Political Rights. TheHumana index includes such items as the right of peaceful assembly, freedom of opinionand expression, the right and opportunity to rake part in the conduct of public affairs,the right to freedom of opinion and expression, and the right to form trade unions.Coppedge and Reinicke (1990) rank 170 countries on two dimensions—media pluralismand freedom to organize—on a scale of 1 to 3 for the year 1985.
Creating a reliable empirical cross-country indicator of civil liberties is obviouslydifficult, and any measure will be subjective and hence debatable. But the actualdifferences across countries in liberties are so large that, in spite of the complexity andsubtleties, any reasonable assessment will produce the same basic pattern across countries.This result is indicated by the high correlations among these measures of civil liberties.The correlation of the Freedom House index (averaged over 1979–86) with theHumana index is 0.83, with freedom to organize, 0.78, and with media pluralism, 0.8 1.The correlation of the Humana index with freedom to organize is 0.68, and with mediapluralism, 0.79. The correlation of freedom to organize with media pluralism is 0.82.(Coppedge and Reinicke’s use of the information in the Freedom House and Humanastudies in their own ranking procedure may account for at least part of the highcorrelation between the latter two and former two series.)
Civil Liberties and Project Performance
Each of the four of civil liberties shows a statistically significant and empirically largeassociation with the return co projects (table 1). The estimates that include regionaldummy variables suggest that if the Freedom House civil liberties index improved fromthat for the worst country (1) to that for the best (7, as in Costa Rica), the ERR wouldbe predicted to increase 8 percentage points, 50 percent of the mean ERR of 16.Similarly, improving from the least civil liberties by the Humana index (13) to one of thebest (91, again, Costa Rica) would improve the ERR by an amazing 20 percentagepoints.
Table 1. The Impact of Civil Liberties Indicators on the Economic Rate ofReturn of Government Projects, Controlling for Economic and ProjectVariables
Index
Withoutregionalvariables
With regionalvariables
Effect of a 1 standard deviationincrease in civil liberties on the
economic rate of return_(percentage points)
Freedom House civil liberties, 1.95 1.32 1.91978-87 (0.000)* (0.047)*
Humana, 1982-85 0.251 0.256 4.5(0.009)* (0.025)*
Media pluralism, 1983-87 2.89 2.85 2.6

228 THE WORLD BANK ECONOMIC REVIEW VOL. 11, NO. 2
(0.013)* (0.062)**
Freedom to organize, 1983-87 2.45 -0.057 2.71 b
(0.006)* (0-969)
*p-level less than 0.05.**p-level less than 0. 10.Note: The base specification includes capital-labor ratio, black market premium, GDP growth, fiscal surplus, terms of
trade changes. sectoral dummies, and a dummy for complex projects (see table A-1). The estimation is based on annualvalues for 1978-87 for the Freedom House civil liberties index. For the other three indexes. single value s were extrapolatedto cover the sample period. We report p-levels of the test for whether the coefficient is 0 rather than test statistics themselves.The p-level is the significance level at which the null hypothesis can be rejected, hence a p-level less than 0.05 indicates arejection of the null hypothesis at (at least) the 3 percent level. The p-levels are in parentheses. Sample sizes are 649 for theFreedom House civil liberties index, 236 for the Humana index, 389 for media pluralism, and 389 for fre edom to organize.
a. The standard deviations—for the entire sample for which each variable is available—are 1.47 for the FreedomHouse civil liberties index. 17.8 for the Humana index. 0.91 for media pluralism, and 1.12 for freedom to organize.
b. Using the estimate without regional dummies.Source: Authors’ calculations.
Each of the civil liberties indexes and other determinants of project performancediffers in scale. Therefore, to compare the different effects, we calculate the predictedincrease in the ERR if each index were improved by 1 standard deviation (column 3 oftable 1). A standard deviation improvement in civil liberties would raise the predictedERR 1.9 points using the Freedom House index, 4.5 points using the Humana index, and2.6 points using the media pluralism index. These effects of civil liberties on projectreturns are empirically large compared with those of macroeconomic policy, an effectthat has received a great deal of attention (World Bank 1991). The average of thestandardized effect of the four civil liberties indicators on project returns (2.9percentage points) is much larger than equivalent changes in terms of trade -shocks,fiscal deficits, or GDP growth (column 4 of table A-1). Improving civil liberties by astandard deviat ion would improve project performance by about as much as a standarddeviation fall in the black market premium (3.31, table A-1). Although the total effectof good macroeconomic policies is larger (as the effects are additive), clearly civilliberties are as important as any other single determinant of project success.
The relationship between civil liberties and ERRs is the central positive finding of thisarticle. We show that this result is robust to outliers, to the measure of projectperformance, to possible financing selection effects, and to the inclusion of othervariables in the base specification. Of special interest, the inclusion of indicators ofpolitical liberties or democracy does not shift the estimates of the importance of civilliberties.
OUTLIERS. A concern with any econometric result is its sensitivity to a fewobservations. Although the civil liberties indicators we use are bounded, some projectshave extreme values for the ERR (the maximum is 155, table A-2). We address therobustness of the estimates to extreme observations and influential data points in twoways. First, we estimate a Tobit specification with lower and upper truncation.Censoring the ERRs above at 50 percent (roughly 2 standard deviations above the mean)does not affect the results. Second, we estimate the same specifications using quantile(median) regression, a technique that is much more robust to extreme observations thanTobit estimates. All the civil liberties variables that are significant in table 1 are alsosignificant using median regressions.
PROJECT PERFORMANCE INDICATOR. The results are not unique to the ERR. If weuse the binary “satisfactory or unsatisfactory” rating created by OED, we obtain

Isham, Kaufmann. and Pritchett 229
qualitatively similar results. We have a larger sample of projects using only this rating asthe measure of project performance because we include social sector projects thatnormally do not receive an ERR. (See Kaufmann and Wang 1995 for a discussion of theperformance of social sector projects as a function of macroeconomic policies.) Table 2reports the estimates of a Probit regression. Naturally, because the binary indicatordiscards a great deal of statistical information, we obtain less precise results: the p -levelsire generally higher, and the estimates for the Humana ranking are even insignificant.1
Nevertheless, the other variables show large increases in the likelihood of a successfulproject when implemented in countries with higher civil liberties.
Table 2. The Impact of Civil Liberties on the Probability of a Project BeingRated Satisfactory Using a Probit Regression, Controlling for Economic andProtect Variables
Index
Withoutregionalvariables
With regionalvariables
Effect of a 1 standarddeviation increase on
the probability ofproject success a
(percentage points)Freedom House civil liberties, 0.018 0.022 3.2
1978-90 (0.056)* (0.060)*Humana, 1982-86 -0.00067 0.0012 2.1
(0.589) (0.388)Media pluralism, 1983-90 0.022 0.054 4.9
(0.296) (0.045)*Freedom to organize, 1983-90 0.042 0.040 4.5
(0.009)* (0.085)***p- level less than 0.05.**p- level less thin 0.10.Note: The value reported is nor the coefficient in the Probit regression, bur the marginal change in the
probability of a successful project as the variable changes, evaluated at the means of all independentvariables. See table A-1 for the complete specification. The estimation is based on annual values for1978–87 for the Freedom House civil liberties index. For the other three indexes, single values areextrapolated to cover the sample period. Sample sizes are 1,155 for the Freedom House civil libertiesindex, 604 for the Humana index, 740 for media pluralism, and 740 for freedom to organize. The p -levelsof the test for whether the Probit coefficient is 0 are in parentheses; note that this is not the same as the p -level of the statistic reported.
a. The standard deviations—for the entire sample for which each variable is available—are 1.47 for theFreedom House civil liberties index. 17.8 for the Humana index, 0.91 for media pluralism, and 1.12 forfreedom to organize.
Source: Authors’ calculations.
For instance, from table 2 using the mean of the Freedom House variable, an increaseof 1 standard deviation in civil liberties lowers the probability of a failed project 3.2percentage points, which reduces the predicted failure rate 16 percent (from the meanfailure of 20 percent). Similarly, an increase of 1 standard deviation in media pluralismreduces the failure rate almost 5 percentage points, or 25 percent (table 2).2
SELECTION EFFECTS. Do selection effects create the relationship between civilliberties and the performance of World Bank-financed projects? We consider two
1 In the tables we report p -levels of the test whether the coefficient is 0 rather than test statisticsthemselves. The p -level is the significance level at which the null hypothesis can be rejected, hence a p -level less than 0.05 indicates a rejection of the null hypothesis at (at least) the 5 percent level.2 It takes some calculations to compare, but the magnitudes of the effects arc roughly similar to thosewith ERRs.

230 THE WORLD BANK ECONOMIC REVIEW VOL. 11, NO. 2
perspectives on World Bank project selection decisions. One interpretation says that theWorld Bank’s Articles of Agreement preclude explicit consideration of noneconomicfactors, particularly civil liberties or political factors, in the selection of World Bankprojects. This view suggests that World Bank project selection should be uncorrelatedwith civil liberties. We create an indicator to measure World Bank involvement in acountry's investment as the ratio of World Bank loan or credit disbursements to totalgovernment investment. We find a negative bivariate correlation between World Bankinvolvement and civil liberties, principally because the World Bank has greaterinvolvement in poorer countries, which on average have fewer civil liberties. Controllingfor per capita income and population, we find no correlation between World Bankinvolvement and civi l liberties using the Freedom House index or the media pluralismindex. We find only mildly positive correlation between World Bank Involvement andcivil liberties using the Humana index (p -level, 0,07). If we introduce World Bankinvolvement as an independent explanatory variable, We obtain reasonably robustresults, in kit the sign and magnitude of the effects are roughly similar in ill regressionsand the statistical significance is maintained except ill some of the regressions withregional dummies.
The second perspective says that decisions concerning World Bank project selectionare based on the ex ante ERRs, not the ex post ERRs (which are obviously available onlyafter project completion). If World Bank project selection causes the partial associationof civil liberties and ERRs, the association should appear in the ex ante ERRs. However,when we use the ex ante ERR as the dependent variable, we find no relationship withthe Humana index (p -level, 0.98), no relationship with the media pluralism index (p -level, 0.59), and a modest negative relationship with the Freedom House index (p -level,0.10). These results suggest that differences in the implementation of the projects, notdifferences in project selection for financing, cause the relation between projectperformance and civil liberties.
OMITTED VARIABLES. The partial association between civil liberties and ERRs isrobust. We explore the possibility, however, that some other variable is associated withboth project performance and civil liberties and hence that the partial association ofcivil liberties is an artifact of bias from an omitted variable. This possibility has twoversions: an incidental association between the omitted variable and civil liberties, or,much worse, civil liberties as a proxy for the true omitted variable. We address theseconcerns in turn, with a separate section devoted to the impact of civil liberties anddemocracy on project performance.
The specification of the variables included in the general specification for projectperformance is not rightly theoretically constrained. Our analysis concerns the robustnessof the project performance result. Therefore, we experiment with “data undermining”by searching for variables whose inclusion changes the civil liberties results. Besides thosevariables reported in our base specification in table A-1, we experimented with theinclusion of other variables. We tried the stock of education because greater humancapital perhaps led to higher returns. We tried an indicator for trade policy becauseresults by López (1995) suggest an interaction between trade and returns to capital. Wetried ethnolinguistic fractionalization, which Easterly and Levine (1996) show isassociated with good economic outcomes and good government policies. And we trieddummy variables for whether the country gained independence from France, Spain, orthe United Kingdom and for the year the country gained independence; Chong andCalderón (1996) argue that these factors have a lasting effect on government

Isham, Kaufmann. and Pritchett 231
institutional arrangements. We also added a dummy variable for IDA credits (asseparate from IBRD loans) and found no difference. Although each of these variables isplausibly correlated with both civil liberties and government efficacy, their inclusion inthe project performance equation did nor substantially alter the magnitude orsignificance of the civil liberties coefficient. 3
Civil Liberties and Democracy
By far the most important question an robustness is whether, the results reflect civilliberties or capture some more directly political element. Civil and political liberties andmore democratic political regimes are closely associated with each other, both ofnecessity (a certain degree of civil liberties is a precondition for democracy) and inpractice. Yet there are clear analytical and practical distinctions between civil libertiesand more strictly political rights and practices. In particular, the degree of civil andpolitical liberties varies widely among nondemocracies. At the extremes, totalitarianregimes clearly differ from authoritarian regimes in the degree to which the regimeattempts to control nonpolitical dimensions of society and in the degree to which ittolerates opposition, criticism, and dissent. Therefore, finding an association betweenmore civil liberties and better ERRs does not imply an association between different typesof political regimes and better performance. Here we explore the association betweenERRs and political liberties and type of political regime.
As with civil liberties, measuring and classifying political regimes raises substantialdifficulties. The most widely used measure of democracy in the economic literature is theFreedom House index of political liberties, a subjective ranking from 1 to 7 based on 11indicators of political rights: chief authority recently elected by a meaningful process;legislature recently elected by a meaningful process; fair election laws; fair reflection ofvoter preference in distribution of power; multiple political parties; recent shifts inpower through elections; significant opposition vote; freedom from domination by themilitary, foreign powers, and other powerful groups; no major group or groups deniedreasonable self-determination; decentralized political power; and informal consensus (defacto opposition power). Alesina and others (1992) construct another index of type ofpolitical regime that provides an annual ranking for 1982-94 for 43 countries bydemocratic status on a three-point scale. The complexity of the classification of politicalsystems does not impede a reasonably reliable cross-national ranking of countries. Thecorrelation of the Freedom House political liberties index with Alesina’s democracyindex is 0.69.
Table 3. The impact of Civil Liberties and Democracy Variables on the Economic Rateof Return of Government Projects
Civil liberties indicator
Variable
No civillibertiesindicator
Freedom Housecivil liberties
index
Humanaindex
Mediapluralism
Freedom House political 0.138 -2.08 -0.798 -0.594liberties index (0.805) (0.025)* (0-526) (0.175)
Civil liberties indicator 3.39 0.297 3.41(0.003)* (0.024)* (0.062)**
3 Although the results on some of these variables might be of independent interest. we do not report theresults because we do not want to appear to be mining the data.
232 THE WORLD BANK ECONOMIC REVIEW VOL. 11, NO. 2
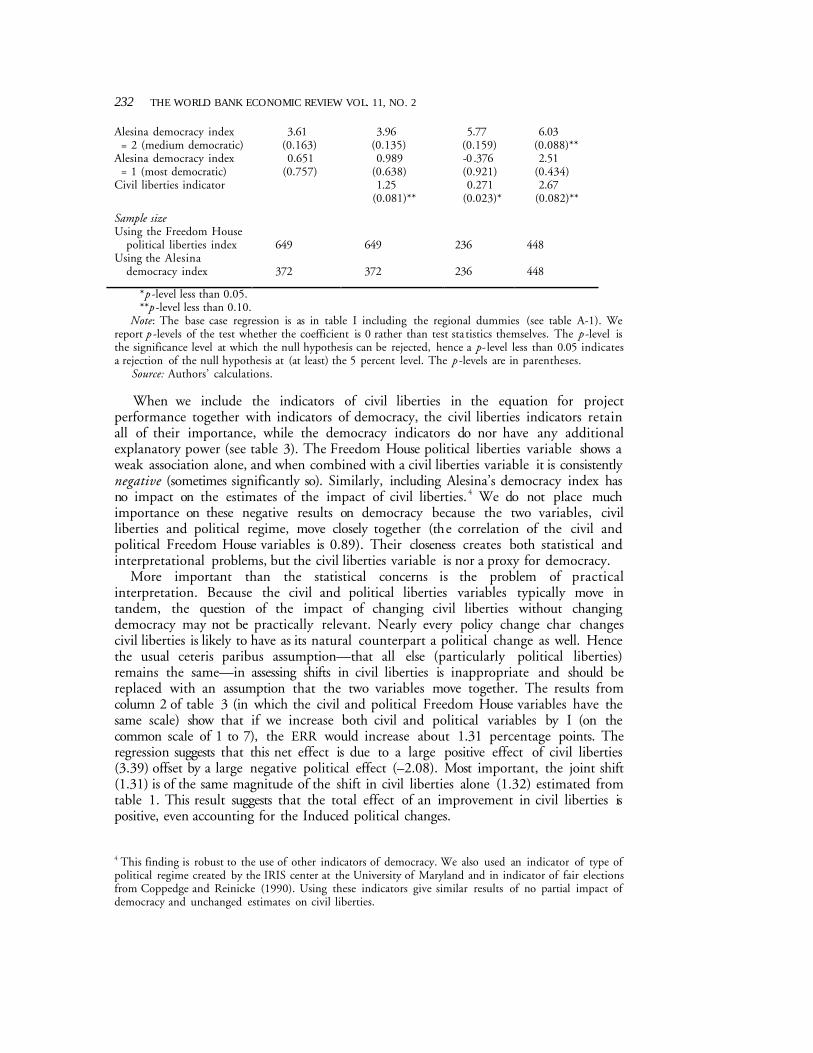
Alesina democracy index 3.61 3.96 5.77 6.03= 2 (medium democratic) (0.163) (0.135) (0.159) (0.088)**
Alesina democracy index 0.651 0.989 -0 .376 2.51= 1 (most democratic) (0.757) (0.638) (0.921) (0.434)
Civil liberties indicator 1.25 0.271 2.67(0.081)** (0.023)* (0.082)**
Sample sizeUsing the Freedom House
political liberties index 649 649 236 448Using the Alesina
democracy index 372 372 236 448
*p -level less than 0.05.**p -level less than 0.10.
Note: The base case regression is as in table I including the regional dummies (see table A-1). Wereport p -levels of the test whether the coefficient is 0 rather than test sta tistics themselves. The p -level isthe significance level at which the null hypothesis can be rejected, hence a p- level less than 0.05 indicatesa rejection of the null hypothesis at (at least) the 5 percent level. The p -levels are in parentheses.
Source: Authors’ calculations.
When we include the indicators of civil liberties in the equation for projectperformance together with indicators of democracy, the civil liberties indicators retainall of their importance, while the democracy indicators do nor have any additionalexplanatory power (see table 3). The Freedom House political liberties variable shows aweak association alone, and when combined with a civil liberties variable it is consistentlynegative (sometimes significantly so). Similarly, including Alesina’s democracy index hasno impact on the estimates of the impact of civil liberties. 4 We do not place muchimportance on these negative results on democracy because the two variables, civilliberties and political regime, move closely together (the correlation of the civil andpolitical Freedom House variables is 0.89). Their closeness creates both statistical andinterpretational problems, but the civil liberties variable is nor a proxy for democracy.
More important than the statistical concerns is the problem of practicalinterpretation. Because the civil and political liberties variables typically move intandem, the question of the impact of changing civil liberties without changingdemocracy may not be practically relevant. Nearly every policy change char changescivil liberties is likely to have as its natural counterpart a political change as well. Hencethe usual ceteris paribus assumption—that all else (particularly political liberties)remains the same—in assessing shifts in civil liberties is inappropriate and should bereplaced with an assumption that the two variables move together. The results fromcolumn 2 of table 3 (in which the civil and political Freedom House variables have thesame scale) show that if we increase both civil and political variables by I (on thecommon scale of 1 to 7), the ERR would increase about 1.31 percentage points. Theregression suggests that this net effect is due to a large positive effect of civil liberties(3.39) offset by a large negative political effect (–2.08). Most important, the joint shift(1.31) is of the same magnitude of the shift in civil liberties alone (1.32) estimated fromtable 1. This result suggests that the total effect of an improvement in civil liberties ispositive, even accounting for the Induced political changes.
4 This finding is robust to the use of other indicators of democracy. We also used an indicator of type ofpolitical regime created by the IRIS center at the University of Maryland and in indicator of fair electionsfrom Coppedge and Reinicke (1990). Using these indicators give similar results of no partial impact ofdemocracy and unchanged estimates on civil liberties.

Isham, Kaufmann. and Pritchett 233
IV. CIVIL LIBERTIES, CIVIL STRIFE, AND PROJECT PERFORMANCE
In the data, an interesting interrelationship among civil liberties, civil strife, andproject performance suggests that the possible mechanism of causation is from more civilliberties to increased citizen voice to better projects. After controlling for population,higher indicators of some types of civil strife, such as an increased number of riots, protestdemonstrations, and strikes, are strongly positively correlated with project performance(table 4). High ERR countries have average rates of return twice as high (22.2) as lowERR countries (11.2). High ERR countries have many more riots, demonstrations, andpolitical strikes per capita (adjusted for population) than countries with poor projectperformance.
The civil unrest variables (riots, protest demonstrations, and strikes) come as thenumber of incidents per country per year (Banks 1979, updates). This means thatcountries with larger populations have a greater absolute number of incidents. However,it does not seem right simply to normalize to per capita, as there are plausibly someincreasing returns to scale in civil unrest. Consequently, for each of the three variableswe regress the absolute number of incidents on population *|n(population), which isequivalent to adjusting the per capita level for the total population in semilog form. Wereport the residual of this regression as excess civil unrest over the amount expected for agiven level of population. The population adjustment is also very significant, and the R_varies from 0.02 (strikes) to 0.18 (riots). The results reported below were unchanged byusing other concave functional forms in place of this semilog form.
That greater civil tension is associated with better projects might appear puzzling.Typically, analysts associate all forms of political and social instability with worseinvestment climate. They base this reasoning on associating civil strife with risks toprivate projects and with political instability. In our analysis, governments finance all theprojects. We tried including as separate regressors indicators of political instability, suchas the Taylor and Jodice (1983 and supplements) series on irregular governmenttransfers and an index by Alesina and Perotti (1993) on sociopolitical instability, butneither had any impact on project success or the civil liberties variables.
Table 4. The Impact of Civil Strife Variables on the Economic Rate of Returnof Government Projects
Civil strife indicatora
Impact measure RiotsPoliticalstrikes
Protestdemonstrations
Deviation of civil strife from population-adjusted level b
High-ERR countriesc 2.48 3.19 0.30Medium-ERR countriesd 0 -0.02 0.16Low-ERR countriese -0.19 -0.23 -0.04Correlation of population-adjusted level of civil 0.27 0.34 0.17
strife with Freedom House civil liberties index (0.000)* (0.000)* (0.000)*Estimates of the project performance regression f
Without the Freedom House civil liberties index 0.42 1.67 0.81(0.040)* (0.097)** (0.003)*
With the Freedom House civil liberties index 0.21 0.45 0.68(0.34) (0.683) (0.013)*
*p- level less than 0.05.**p -level less than 0. 10.

234 THE WORLD BANK ECONOMIC REVIEW VOL. 11, NO. 2
Note: We report p -levels of the test whether the coefficient is 0 rather than rest statistics themselves.The p -level is the significance level at which the null hypothesis can be rejected, hence 3 p -level less than0.05 indicates a rejection of the null hypothesis at (at least) the 5 percent level. The p -levels are inparentheses. The sample size is 649.
a. Values for the civil strife indicators are per capita, adjusted for total population size. We regress theabsolute number of incidents on population*|n(population), which is equivalent to adjusting the percapita level for the total populat ion in semilog form, and report the residual of this regression as excesscivil unrest over the amount expected for a given level of population. The population adjustment is alsovery significant. and the R -squared varies from 0.02 (strikes) to 0.18 (riots).
b. ERR categories are determined by average rates of return classified by country for all countries with atleast 10 projects for 1974–87.
c. There are six high-ERR countries, three in South Asia and three in East Asia. The average ERR forthe high-ERR countries is 22.2.
d. There are 11 medium-ERR countries, five in Latin America and the Caribbean; two in Sub-SaharanAfrica; three in Europe, the Middle East. and North Africa; and one in South Asia. The average ERR forthe medium-ERR countries is 17.
e. There are low-ERR countries, nine in Sub-Saharan Africa, two in Latin America and the Caribbean,and one in South Asia. The average ERR for the low-ERR countries is 11.2
f. This is the base regression (see table A-1) without sectoral or regional dummies.Source: Authors’ calculations.
Some degree of civil tension reflects a citizen’s ability to agitate and influencegovernment’s behavior without negative repercussions, mechanism that plausibly leads togreater accountability and hence better choice and implementation of projects. Indeed,table 4 shows that higher civil liberties are strongly associated with higher levels of riots,demonstrations, and political strikes (although regional dummy variables sharplyattenuate this effect). Table 4 also shows, even controlling for our set of exogenous andpolicy variables, a positive and significant relation between the ERR and the number ofriots, protest demonstrations, and political strikes. However, adding the degree of civilliberties sharply reduces the estimated impact of political manifestations: the coefficienton riots falls from 0.42 to 0.21, and the coefficient on strikes falls from 1.67 to 0.45.
For a given level of civil liberties, neither riots nor political strikes are associated withbetter performance (although the protest demonstrations variable does retain someeffect). The results support a chain of causation that runs from greater civil liberties tohigher levels of citizen involvement and political participation—including as onedimension civil manifestations—to better projects. Environments that allow civil strifeor unrest to occur also allow other mechanisms for expression of popular (dis)contentwith government performance, The availability and effectiveness of those mechanismsimprove government efficacy,
V. CONCLUSIONS
The extent of a country’s civil liberties has a substantial impact on the successfulimplementation of government investment projects financed by the World Bank. Thisimpact of civil liberties is as empirically large as the more celebrated impact of economicdistortions on project returns. Given that citizen voice is an important precondition forgovernment accountability and, not coincidentally, that voice is suppressed in the absenceof civil rights, this result is perhaps not surprising. This result adds to the evidence for theview that increasing citizen voice and public accountability—through rough bothparticipation and better governance—can lead to greater efficacy in governmentaction. Some analysts argue that there is a trade-off between liberties and development.We find the opposite evidence, that suppressing liberties is likely to be inimical to

Isham, Kaufmann. and Pritchett 235
government performance. This has obvious implications not just for governments but alsofor development assistance (Picciotto 1995 and OECD 1995).
The most important aspects of civil liberties and political regimes go beyond whetherthey promote or discourage economic outcomes. Here we have examined theinstrumental value of civil liberties and political structure in producing greater efficacyof government. Although we have focused on the instrumental value, we want toemphasize that we believe government respect for civil liberties is valuable regardless ofits instrumental economic value.
(Appendix tables begin on the following page.)

236 THE WORLD BANK ECONOMIC REVIEW VOL. 11, NO. 2
Table A-1. Base Specification for the Nongovernance Determinants of the EconomicRate of Return of Government Projects, 1974-87
With regional dummiesVariable Mean a Number of
dummyvariables
Estimatewithoutregionaldummies
Estimate Effect of a 1 standarddeviation increase onthe economic rare of
returnExogenous variable|n(capital/labor) 8.22 -1.09 -1.66 -1.67
[1.01] (0.067)** (0.060)**Dummy for project 319 -4.29 -4.23complexity (0.017)* (0.016)*Terms of trade shock -3.29 0.0015 0.001 0.0035
[3.35] (0.889) (0.922)Policy variableBlack market premia 46.6 -0.046 -0.037 -3.31
[89.5] (0.000)* (0.000)*Fiscal surplus -5.21 0.197 0.266 0.925
[3.48] (0.149) (0.063)**GDP growth 3.71 0.193 0.013 0.646
[3.35] (0.357) (0.949)Regional dummy variable b
East Asia 278 -3.33(0.154)
Latin America and the 314 -4.74Caribbean (0.072)*
Europe, the Middle East, 283 -4.93and North Africa (0.100*)
Sub-Saharan Africa 430 -10.8(0.000)*
Sectoral dummy variable c
Agriculture 604 0.027 1.39(0.992) (0.602)
Energy and public utilities 339 -3.92 -3.18(0.136) (0.220)
Transport and tourism 413 3.85 6.24(0.137) (0.016)
Urban 48 10.1 11.9(0.011)* (0.003)*
* p -level less than 0.05.** p -level less than 0. 10.Note: We report p -levels of the test whether the coefficient is 0 rather than test statistics themselves.
The p -level is the significance level at which the null hypothesis can be rejected, hence a p -level less than0.05 indicates a rejection of the null hypothesis at (at least) the 5 percent level. The p -levels are inparentheses. The simple size is 761.
a. Standard deviations are in square brackets. Standard deviations are calculated for the entire sample.b. South Asia (184 observations) is excluded. Regions are based on World Bank regional classifications.c. Industry (84 observations) is excluded.Source: Authors’ calculations. For exogenous and policy variables, World Bank data.

Isham, Kaufmann. and Pritchett 237
Table A-2. Summary Statistics
Variable MeanStandarddeviation Range
Number ofcountries Years
Economic rare of return 16.01 15.16 -5-155 56a 1974-90
Civil liberties indexFreedom House 4.68 1.47 1-7 56 1974-90Humana 55.13 17.08 13-91 38 1986Media pluralism 2.50 0.91 1-4 56 1985Freedom to organize 2.45 1.12 1-4 56 1985
Political liberties indexFreedom House 4.73 1.85 1-7 55 1974-90Alesina 2.52 0.79 1-3 55 1974-82
Civil unrest indicatorRiots 0.14 1.61 -3.83-17.50 56 1974-89Protest demonstrations 0.29 1.63 -0.79-14.54 56 1974-89Strikes 0.07 0.50 -0.43-3.50 56 1974-89
a. 1,488 projects.Source: Authors’ calculations; Freedom House (1994); Humana (1986); Alesina and others (1992);
Banks (1979 and updates).
REFERENCES
The word “processed” describes informally reproduced works that may not be commonlyavailable through library systems.Alesina, Alberto. 1996. “Budget Deficits and Budget Institutions.” NBER Working
Paper 5556. National Bureau of Economic Research, Cambridge, Mass. Processed.Alesina, Alberto, and Allan Drazen. 1991. “Why Are Stabilizations Delayed?”
American Economic Review 81 (December): 1170-88.Alesina, Alberto, Sule Özler, Nouriel Roubini, and Philip Swagel. 1992. “Political
Instability and Economic Growth.” NBER Working Paper 4173. National Bureau ofEconomic Research, Cambridge, Mass. Processed.
Alesina, Alberto, and Roberto Perotti. 1993. “Income Distribution, Political Instability,and Investment.” NBER Working Paper 4486. National Bureau of EconomicResearch, Cambridge, Mass. Processed.
———. 1994. “The Political Economy of Growth: A Critical Survey of the RecentLiterature.” The World Bank Economic Review 8(3):351-73.
Banks, Arthur S. 1979 (and subsequent updates). “Cross-National Time Series DataArchive.” Center for Social Analysis, State University of New York at Binghamton.Processed.
Barro, Robert. 1991. “Economic Growth in a Cross Section of Countries.” QuarterlyJournal of Economics 106(2):407-43.
———. 1994. “Democracy and Growth.” NBER Working Paper 4909. NationalBureau of Economic Research, Cambridge, Mass. Processed.
Bhalla, Surjit. 1994. “Freedom and Economic Growth: A Virtuous Cycle.”' In AxelHadeneus, ed., Democracy’s Victory and Crisis: Nobel Symposium 1994. Cambridge,U.K.: Cambridge University Press.
Brautigam, Deborah. 1992. “Governance, Economy, and Foreign Aid.” Studies inComparative International Development 27(3, fall):3-25.
Chong, Alberto, and César Calderón. 1996. “Institutions and Income Inequality.”Department of Economics, University of Rochester, New York. Processed.

238 THE WORLD BANK ECONOMIC REVIEW VOL. 11, NO. 2
Clague, Christopher, Philip Keefer, Stephen Knack, and Mancur Olson. 1997.“Property Rights under Democracy and Dictatorship.” The Journal of EconomicGrowth . 1(2):243-76.
Coopedge, Michael, and Wolfgang H. Reinicke. 1990. “Measuring Polyarchy.” Studiesin Comparative International Development 25(1, spring):51-72.
Cukierman, Alex, Steven Webb, and Bilin Neyapti. 1992. “Measuring theIndependence of Central Banks and Its Effect on Policy Outcomes.” The World BankEconomic Review 6(September):353-98.
Dasgupta, Partha. 1993. Apt Inquiry into Well-Being and Destitution. Oxford:Clarendon Press.
De Long, Bradford, and Lawrence H. Summers. 1993. “How Strongly Do DevelopingEconomics Benefit from Equipment Investment.” Journal of Monetary Economics32(3):395-415.
Devarajan, Shanta, Vinaya Swaroop, and Hong-Fu Zou. 1996. “The Composition ofPublic Expenditures and Economic Growth.” Journal of Monetary Economics37(2):313-44.
Dollar, David. 1992. “Outward-Oriented Developing Economics Really Do Grow MoreRapidly: Evidence from 95 LDCs , 1976-1985.” Economic Development and CulturalChange 40(April):523-44.
Drèze, Jean, and Amartya Sen. 1989. Hunger and Public Action. New York: OxfordUniversity Press.
Easterly, William, and Ross Levine. 1996. “Africa’s Growth Tragedy.” Policy ResearchDepartment, World Bank, Washington, D.C. Processed.
Easterly, William, and Sergio Rebelo. 1993. “Fiscal Policy and Economic Growth: AnEmpirical Investigation.” Journal of Monetary Economics 32(3):417-58.
Fischer, Stanley. 1993. “Role of Macroeconomic Factors in Growth.” Journal ofMonetary Economics 32(3):485-512.
Freedom House. 1994. Freedom in the World: Political Rights and Civil Liberties. NewYork.
Greene, William H. 1981. “On the Asymptotic Bias of the Ordinary Least SquaresEstimator of the Tobit Model.” Econometrica 49(3):505-13.
Grier, Kevin B., and Gordon Tullock. 1989. “An Empirical Analysis of Cross-NationalEconomic Growth, 1951-1980.” Journal of Monetary Economics24(September):259-76.
Harrison, Ann. 1995. “Openness and Growth: A Time-Series, Cross-Country Analysis forDeveloping Countries.” NBER Working Paper 5221. National Bureau of EconomicResearch, Cambridge, Mass. Processed.
Helliwell, John. 1992. “Empirical Linkages between Democracy and Growth.” NBERWorking Paper 4066. National Bureau of Economic Research, Cambridge, Mass.Processed.
Hirschman, Albert O. 1970. Exit, Voice, and Loyalty: Responses to Decline in Firms,Organizations, and States. Cambridge, Mass.: Harvard University Press.
Humana, Charles, 1986. World Human Rights Guide. London: Hodder and Stoughton.Isham, Jonathan, and Daniel Kaufmann. 1992, “Does Policy-Based Lending Affect the
Productivity of Investment Projects?” Background paper for Adjustment Lending andMobilization of Private and Public Resources for Growth . Policy ResearchDepartment, World Bank, Washington, D.C. Processed.

Isham, Kaufmann. and Pritchett 239
———. 1995. “The Forgotten Rationale for Policy Reform, The Productivity ofInvestment Projects.” Policy Research Working Paper 1549, Policy ResearchDepartment, World Bank, Washington, D.C. Processed.
Isham, Jonathan, Deepa Narayan, and Lant Pritchett. 1995. “Does ParticipationImprove Performance? Establishing Causality with Subjective Data.” The WorldBank Economic Review 9(2):175-200.
Kaufmann, Daniel, and Yan Wang. 1995. “Macroeconomic Policies and ProjectPerformance in the Social Sectors.” World Development 23(5):751-65.
Kilby, Christopher. 1995. “Risk Management: An Econometric Investigation of Project-Level Factors.” Background paper for The Annual Review of Evaluation Results1994. Operations Evaluation Department, World Bank, Washington, D.C. Processed.
King, Robert G., and Ross Levine. 1993. “Finance, Entrepreneurship, and Growth:Theory and Evidence.” Journal of Monetary Economics 32(December):513-42.
Knack, Stephen, and Philip Keefer. 1995. “Institutions and Economic Performance:Cross-Country Tests Using Alternative Institutional Measures.” Economics and Politics7(3):207-28.
Kormendi, Roger C., and Philip G. Mcguire. 1985. “Macroeconomic Determinants ofGrowth.” Journal of Monetary Economics 16(2):141-63.
Korten, Frances F., and Robert Siy, Jr., eds. 1988. Transforming Bureaucracy: TheExperience of the Philippine National Irrigation Administration. West Hartford,Conn.: Kumarian Press.
Lipset, Seymour. 1960. Political Man. Garden City, N.J.: Doubleday.Little, I.M.D., and J.A. Mirrlees. 1991. “Project Appraisal and Planning Twenty Years
On.” In Proceedings of the World Bank Annual Conference on DevelopmentEconomics 1990, pp. 351-82. Washington, D.C.: World Bank.
López, Ramón. 1995. “Synergy and Investment Efficiency Effects of Trade and LaborMarket Distortions.” European Economic Review 39(7, August): 1321-44.
Mauro, Paulo. 1995. “Corruption, Country Risk, and Growth.” Quarterly Journal ofEconomics 110(3):681-712.
OECD (Organization for Economic Cooperation and Development). 1995.Participatory Development and Good Governance. Development CooperationGuideline Series. Paris.
Olson, Mancur. 1965. The Logic of Collective Action: Public Goods and the Theory ofGroups. Cambridge, Mass.: Harvard University Press.
Paul, Samuel. 1992. “Accountability in Public Services: Exit, Voice, and Control.”World Development 20(July): 1047-60.
———. 1994. “Does Voice Matter?” Policy Research Working Paper 1388. PolicyResearch Department, World Bank, Washington, D.C. Processed.
———. 1996. “A Citizen Report Card on Public Services: Mixing Barks and Bites?”Processed.
Picciotto, Robert. 1995. Putting Institutional Economics to Work: From Participation toGovernance. Discussion Paper 304. Washington, D.C.: World Bank.
Pohl, Gerhard, and Dubravko Mihaljek. 1992. “Project Evaluation and Uncertainty inPractice: a Statistical Analysis of Rate-of-Return Divergences in 1,015 World BankProjects.” The World Bank Economic Review 6(2):255-77.
Pritchett, Lant. 1996. “Mind Your p’s and q’s: The Value of Public Capital Is Not theCost of Public Investment.” Policy Research Working Paper 1660. Policy ResearchDepartment, World Bank, Washington, D.C. Processed.

240 THE WORLD BANK ECONOMIC REVIEW VOL. 11, NO. 2
Pritchett, Lant H., and Lawrence H. Summers. 1993. “The Structural AdjustmentDebate.” American Economic Review 83(May):383-89.
Przeworski, Adam, and Fernando Limongi. 1993. “Political Regimes and EconomicGrowth.” Journal of Economic Perspectives 7(3):51-71.
Putnam, Robert. 1993. Making Democracy Work. Princeton, N.J.: PrincetonUniversity Press.
Rodrik, Dani. 1996. “Understanding Economic Reform.” Journal of EconomicLiterature. 39(March):9-41.
Scully, Gerald W. 1988. “The Institutional Framework and Economic Development.”Journal of Political Economy 96(3):652-62.
Squire, Lyn, and Herman van der Tak. 1975. Economic Analysis of Projects . Baltimore,Md.: Johns Hopkins Press.
Tavares, José, and Romain Wacziarg. 1996. “How Democracy Fosters Growth.”Department of Economics, Harvard University, Cambridge, Mass. Processed.
Taylor, Charles Lewis, and David A. Jodice. 1983. World Handbook of Political andSocial Indicators. New Haven, Conn.: Yale University Press.
Wade, Robert. 1994. “Public Bureaucracy and the Incentive Problem.” Backgroundpaper for World Development Report 1994: Infrastructure for Development. WorldBank, Washington, D.C. Processed.
Weede, Erich. 1983. “The Impact of Democracy on Economic Growth: Some Evidencefrom Cross-National Analysis.” Kyklos 36(1):21-39.
World Bank. 1988. Rural Development: World Bank Experience, 1965-86. OperationsEvaluation Study. Washington, D.C.
———. 1991. World Development Report 1991: The Challenge of Development. NewYork: Oxford University Press.
———. 1992. Governance and Development. Washington, D.C.———. 1993a. Annual Evaluation Results for 1991. Washington, D.C.———. 1993b. The East Asian Miracle. New York: Oxford University Press.———. 1994. World Development Report 1994: Infrastructure for Development. New
York: Oxford University Press.———1995. “The World Bank and Participation.” Operations Policy Department,
Washington, D.C. Processed.