the world markets for transformers 2020 - 2030
TRANSCRIPT
The World Markets for
Transformers
2020 - 2030
© GOULDEN REPORTS March 2021
No 1, Priorsfield, Marlborough,Wiltshire SN8 4AQ, United Kingdom Tel: +44 1672 513316
Email: [email protected] Web site: www.gouldenreports.org
All rights reserved. No part of this publication may be reproduced, stored in a retrieval system, or transmitted in any form, or by any means, electronic, mechanical, photocopying, recording or
otherwise without the prior permission of the copyright owner.

The World Markets for Transformers, 2020 - 2030
NOTE
The information given in this report has been compiled from published sources and interpreted from fieldwork based on informed opinions. Whilst every care has been taken in the preparation of the report, there may have been some errors in the information obtained. Although it is impossible to verify every single detail by cross checking, we believe the general picture provided is reasonably accurate and comprehensive.
However:- The publisher owners officers and employees of Goulden Reports cannot be held liable for any or all losses or damages arising out of or attributable to the use of or reliance on any of the contents of this report or extracts thereof. Losses or damages include but may not be limited to loss of profits, indirect, consequential, special or punitive damages of any kind.
Many Goulden Reports publications contain an overview of selected company financial information and capabilities based on published sources where available. Although the companies represented are believed to be the major suppliers the profiles are meant to be indicative rather than definitive.
It is fundamental to the philosophy of Goulden Reports to constantly seek to extend and improve our service to clients. In pursuit of these aims, we shall be pleased to consider all requests for regular or periodic updating of all or any part of the information contained in this report, or for extensions in coverage in terms of product areas, market sectors and/or geographic regions.
We are, of course, always happy to discuss with any subscriber the possibility of undertaking further work, whether arising out of this report or in different business areas.
MORE INFORMATION ON GOULDEN REPORTS
Full details on all Goulden Reports published studies (including full tables of contents and tables of tables) and ad hoc research services can be found on our e-commerce website:
www.gouldenreports.org

The World Markets for Transformers, 2020 - 2030
CONTENTS
1. INTRODUCTION .......................................................................................................................................... 1
1.1 OBJECTIVES AND SCOPE .................................................................................................................. 1 1.2 METHODOLOGY .................................................................................................................................. 3
2. SUMMARY .................................................................................................................................................... 5
2.1 Transformer Demand to 2029 - Post Covid 19 First Wave Autumn 2020 .............................................. 6
3. THE WORLD MARKET ............................................................................................................................ 23
3.1 FORECAST WORLD MARKET 2015-2030 ....................................................................................... 31
4. THE WORLD’S MAJOR TRANSFORMER MANUFACTURERS ...................................................... 33
4.1 TRANSFORMER INDUSTRY CONTACT DETAILS ....................................................................... 40 4.1.1 ABB ....................................................................................................................................................... 40 4.1.2 Aichi ...................................................................................................................................................... 40 4.1.3 BHEL ..................................................................................................................................................... 41 4.1.4 CG Group .............................................................................................................................................. 41 4.1.5 Daihen ................................................................................................................................................... 43 4.1.6 Eaton Cooper ........................................................................................................................................ 43 4.1.7 GE ......................................................................................................................................................... 44 4.1.8 Hitachi ................................................................................................................................................... 45 4.1.9 Howard ................................................................................................................................................. 46 4.1.10 Hyosung ................................................................................................................................................ 46 4.1.11 Hyundai ................................................................................................................................................. 47 4.1.12 JHSP ..................................................................................................................................................... 48 4.1.13 Meidensha ............................................................................................................................................. 48 4.1.14 Mitsubishi .............................................................................................................................................. 49 4.1.15 Nissin ..................................................................................................................................................... 49 4.1.16 Schneider ............................................................................................................................................... 50 4.1.17 Siemens ................................................................................................................................................. 51 4.1.18 SPX Waukesha ...................................................................................................................................... 52 4.1.19 Takaoka ................................................................................................................................................. 53 4.1.20 TBEA ..................................................................................................................................................... 53 4.1.21 Toshiba .................................................................................................................................................. 55 4.1.22 TWBB - Baoding ................................................................................................................................... 57 4.1.23 WEG ...................................................................................................................................................... 58 4.1.24 XD Group .............................................................................................................................................. 60 4.1.25 ZTR ........................................................................................................................................................ 60
5. REGIONAL MARKETS ............................................................................................................................. 61
5.1 WESTERN EUROPE ........................................................................................................................... 61 5.2 EASTERN EUROPE ............................................................................................................................ 71 5.3 FORMER SOVIET UNION ................................................................................................................. 81 5.4 NORTH AFRICA ................................................................................................................................. 91 5.5 WEST AFRICA .................................................................................................................................... 95 5.6 CENTRAL AFRICA ........................................................................................................................... 105 5.7 EAST AFRICA ................................................................................................................................... 111 5.8 SOUTHERN AFRICA ........................................................................................................................ 121 5.9 MIDDLE EAST .................................................................................................................................. 127 5.10 INDIAN SUB CONTINENT .............................................................................................................. 137 5.11 ASIA ................................................................................................................................................... 143 5.12 SOUTH AMERICA ............................................................................................................................ 153 5.13 CENTRAL AMERICA AND CARIBBEAN ..................................................................................... 163 5.14 NORTH AMERICA ............................................................................................................................ 173
The World Markets for Transformers, 2020 - 2030
5.15 OCEANIA ........................................................................................................................................... 179
6. PRODUCTION .......................................................................................................................................... 185
7. TRADE ANALYSIS .................................................................................................................................. 187
7.1 TOP 25 EXPORTERS ........................................................................................................................ 187 7.2 TOP 25 IMPORTERS ......................................................................................................................... 193 7.3 EXPORT VALUES ............................................................................................................................ 199 7.4 EXPORT PERCENTAGES ................................................................................................................ 209 7.5 IMPORT VALUES & TYPICAL SUPPLIER PROFILES TOP 25 ................................................... 219
8. TRADE IN TRANSFORMER PARTS .................................................................................................... 233
8.1 Top 15 Exporters of Transformer Parts by Destination 2016 to 2019................................................. 235
9. APPENDICES ............................................................................................................................................ 253
9.1 COUNTRY PROFILES BY REGION................................................................................................ 253 9.1.1 Western Europe ................................................................................................................................... 253 9.1.2 Eastern Europe ................................................................................................................................... 255 9.1.3 Former Soviet Union ........................................................................................................................... 256 9.1.4 North Africa ........................................................................................................................................ 257 9.1.5 West Africa .......................................................................................................................................... 258 9.1.6 Central Africa ..................................................................................................................................... 259 9.1.7 East Africa........................................................................................................................................... 260 9.1.8 South Africa ......................................................................................................................................... 261 9.1.9 Middle East ......................................................................................................................................... 262 9.1.10 Indian Subcontinent ............................................................................................................................ 263 9.1.11 Asia ..................................................................................................................................................... 264 9.1.12 South America ..................................................................................................................................... 266 9.1.13 Central America &Caribbean ............................................................................................................. 267 9.1.14 North America ..................................................................................................................................... 269 9.1.15 Australasia .......................................................................................................................................... 270 9.2 EXCHANGE RATES ......................................................................................................................... 271 9.3 ESTIMATED PRODUCTION BY COMPANY BY COUNTRY ..................................................... 273

The World Markets for Transformers, 2020 - 2030
TABLE OF TABLES
1. INTRODUCTION .......................................................................................................................................... 1
1.1 OBJECTIVES AND SCOPE .................................................................................................................. 1 1.2 METHODOLOGY .................................................................................................................................. 3
2. SUMMARY .................................................................................................................................................... 5
2.1 Transformer Demand to 2029 - Post Covid 19 First Wave Autumn 2020 .............................................. 6 The Fastest Growing National Markets for Transformers 2015 - 2020 (US$ Thousand) ....................................... 17 The Fastest Growing National Markets for Transformers 2015 - 2020 (MVA) .................................................... 18 The Fastest Declining National Markets for Transformers 2015- 2020 (US$ Thousand) ..................................... 19 The Fastest Declining National Markets for Transformers 2015 - 2020 (MVA) ................................................... 20 The Largest National Markets for Transformers 2019 (US$ Million) .................................................................... 21 The Largest National Markets for Transformers 2020 (US$ Million) .................................................................... 22
3. THE WORLD MARKET ............................................................................................................................ 23 The World Market for Transformers, by Region, 2015 - 2020 (US$ Thousand) .................................................... 23 The World Market for Transformers, by Region,2015/2020 (% Change) .............................................................. 24 The World Market for Transformers, by Region, by Function Type 2020 (US$ Thousand) .................................. 25 The World Market for Transformers, by Region, by Number of Units 2020 (Units) ............................................ 26 The World Market for Transformers, by Region, by Function Type 2020 (MVA) ................................................ 27 The World Market for Transformers, by Region, by Insulation Type 2020 (US$ Thousand) ................................ 28 The World Market for Transformers, by Region, by Size of Transformer 2020 (US$ Thousand) ......................... 29 The World Market for Transformers, by Region, by End Use Customer 2020 (US$ Thousand) ........................... 30
3.1 FORECAST WORLD MARKET 2015-2030 ....................................................................................... 31 The Forecast World Market for Transformers, by Region, 2015 - 2030 (US$ Thousand) ..................................... 31 The Forecast World Market for Transformers, by Region, 2015 - 2030 (MVA Demand) ..................................... 32
4. THE WORLD’S MAJOR TRANSFORMER MANUFACTURERS ...................................................... 33 Leading Manufacturers’ Sales of Transformers 2020 (US$ Thousand) .................................................................. 33 Leading Manufacturers’ Sales of Transformers, per Region, 2020 (US$ Million) - continued .............................. 35 Leading Manufacturers’ Sales of Power Transformers 2020 (US$ Thousand)....................................................... 36 Leading Manufacturers’ Sales of Distribution Transformers 2020 (US$ Thousand).............................................. 38
4.1 TRANSFORMER INDUSTRY CONTACT DETAILS ....................................................................... 40 4.1.1 ABB ....................................................................................................................................................... 40 4.1.2 Aichi ...................................................................................................................................................... 40 4.1.3 BHEL ..................................................................................................................................................... 41 4.1.4 CG Group .............................................................................................................................................. 41 4.1.5 Daihen ................................................................................................................................................... 43 4.1.6 Eaton Cooper ........................................................................................................................................ 43 4.1.7 GE ......................................................................................................................................................... 44 4.1.8 Hitachi ................................................................................................................................................... 45 4.1.9 Howard ................................................................................................................................................. 46 4.1.10 Hyosung ................................................................................................................................................ 46 4.1.11 Hyundai ................................................................................................................................................. 47 4.1.12 JHSP ..................................................................................................................................................... 48 4.1.13 Meidensha ............................................................................................................................................. 48 4.1.14 Mitsubishi .............................................................................................................................................. 49 4.1.15 Nissin ..................................................................................................................................................... 49 4.1.16 Schneider ............................................................................................................................................... 50 4.1.17 Siemens ................................................................................................................................................. 51 4.1.18 SPX Waukesha ...................................................................................................................................... 52 4.1.19 Takaoka ................................................................................................................................................. 53 4.1.20 TBEA ..................................................................................................................................................... 53 4.1.21 Toshiba .................................................................................................................................................. 55 4.1.22 TWBB - Baoding ................................................................................................................................... 57 4.1.23 WEG ...................................................................................................................................................... 58
The World Markets for Transformers, 2020 - 2030
4.1.24 XD Group .............................................................................................................................................. 60 4.1.25 ZTR ........................................................................................................................................................ 60
5. REGIONAL MARKETS ............................................................................................................................. 61
5.1 WESTERN EUROPE ........................................................................................................................... 61 Western Europe: The Market for Transformers, by Country, 2015 - 2020 (US$ Thousand) .................................. 61 Western Europe: The Market for Transformers, by Country, 2015 - 2020 (% Change) ........................................ 62 Western Europe: The Market for Transformers, by Country, by Type 2020 (US$ Thousand) ............................... 63 Western Europe: The Market for Transformers, by Country, 2020 (MVA) ........................................................... 64 Western Europe: The Market for Transformers, by Country, by Insulation 2020 (US$ Thousand) ....................... 65 Western Europe: The Market for Transformers, by Country, by Size of Transformer 2020 (US$ Million) ........... 66 Western Europe: The Market for Transformers, by Country, by End Use Customer 2020 (US$ Thousand) ......... 67 Western Europe: The Market for Transformers, by Country, 2015 - 2030 (US$ Thousand) ................................. 68 Western Europe: The Market for Transformers, by Country, 2015 - 2030 (MVA Demand) ................................. 69
5.2 EASTERN EUROPE ............................................................................................................................ 71 Eastern Europe: The Market for Transformers, by Country, 2015 - 2020 (US$ Thousand) .................................. 71 Eastern Europe: The Market for Transformers, by Country, 2015 - 2020 (% Change) ......................................... 72 Eastern Europe: The Market for Transformers, by Country, by Type 2020 (US$ Thousand) ............................... 73 Eastern Europe: The Market for Transformers, by Country, 2020 (MVA)............................................................. 74 Eastern Europe: The Market for Transformers, by Country, by Insulation 2020 (US$ Thousand) ........................ 75 Eastern Europe: The Market for Transformers, by Country, by Size of Transformer 2020 (US$ Million) ............ 76 Eastern Europe: The Market for Transformers, by Country, by End Use Customer 2020 (US$ Thousand) .......... 77 Eastern Europe: The Market for Transformers, by Country, 2015 - 2030 (US$ Thousand) .................................. 78 Eastern Europe: The Market for Transformers, by Country, 2015 - 2030 (MVA Demand) .................................. 79
5.3 FORMER SOVIET UNION ................................................................................................................. 81 Former Soviet Union: The Market for Transformers, by Country, 2015 - 2020 (US$ Thousand) ......................... 81 Former Soviet Union: The Market for Transformers, by Country, 2015 - 2020 (% Change) ................................ 82 Former Soviet Union: The Market for Transformers, by Country, by Type 2020 (US$ Thousand) ...................... 83 Former Soviet Union: The Market for Transformers, by Country, 2020 (MVA) ................................................... 84 Former Soviet Union: The Market for Transformers, by Country, by Insulation 2020 (US$ Thousand) ............... 85 Former Soviet Union: The Market for Transformers, by Country, by Size of Transformer 2020 (US$ Million) ... 86 Former Soviet Union: The Market for Transformers, by Country, by End Use Customer 2020 (US$ Thousand) . 87 Former Soviet Union: The Market for Transformers, by Country, 2015 - 2030 (US$ Thousand) ......................... 88 Former Soviet Union: The Market for Transformers, by Country, 2015 - 2030 (MVA Demand) ......................... 89
5.4 NORTH AFRICA ................................................................................................................................. 91 North Africa The Market for Transformers, by Country, 2015 - 2020 (US$ Thousand) ....................................... 91 North Africa: The Market for Transformers, by Country, 2015 - 2020 (% Change) ............................................. 91 North Africa: The Market for Transformers, by Country, by Type 2020 (US$ Thousand) ................................... 92 North Africa: The Market for Transformers, by Country, 2020 (MVA)................................................................. 92 North Africa: The Market for Transformers, by Country, by Insulation 2020 (US$ Thousand) ............................ 93 North Africa: The Market for Transformers, by Country, by Size of Transformer 2020 (US$ Million) ................ 93 North Africa: The Market for Transformers, by Country, by End Use Customer 2020 (US$ Thousand) .............. 94 North Africa: The Market for Transformers, by Country, 2015 - 2030 (US$ Thousand) ...................................... 94 North Africa: The Market for Transformers, by Country, 2015 - 2030 (MVA Demand) ...................................... 94
5.5 WEST AFRICA .................................................................................................................................... 95 West Africa: The Market for Transformers, by Country, 2015 - 2020 (US$ Thousand) ....................................... 95 West Africa: The Market for Transformers, by Country, 2015 - 2020 Change) ..................................................... 96 West Africa: The Market for Transformers, by Country, by Type 2020 (US$ Thousand) .................................... 97 West Africa: The Market for Transformers, by Country, 2020 (MVA) .................................................................. 98 West Africa: The Market for Transformers, by Country, by Insulation 2020 (US$ Thousand) ............................. 99 West Africa: The Market for Transformers, by Country, by Size of Transformer 2020 (US$ Million) ............... 100 West Africa: The Market for Transformers, by Country, by End Use Customer 2020 (US$ Thousand) ............. 101 West Africa: The Market for Transformers, by Country, 2015 - 2030 (US$ Thousand) ..................................... 102 West Africa: The Market for Transformers, by Country, 2015 - 2030 (MVA Demand) ..................................... 103
5.6 CENTRAL AFRICA ........................................................................................................................... 105 Central Africa: The Market for Transformers, by Country, 2015 - 2020 (US$ Thousand) .................................. 105 Central Africa: The Market for Transformers, by Country, 2015 - 2020 (% Change) ......................................... 105 Central Africa: The Market for Transformers, by Country, by Type 2020 (US$ Thousand) ............................... 106 Central Africa: The Market for Transformers, by Country, 2020 (MVA) ............................................................ 106 Central Africa: The Market for Transformers, by Country, by Insulation 2020 (US$ Thousand) ........................ 107 Central Africa: The Market for Transformers, by Country, by Size of Transformer 2020 (US$ Million) ............ 107 Central Africa: The Market for Transformers, by Country, by End Use Customer 2020 (US$ Thousand) .......... 108 Central Africa: The Market for Transformers, by Country, 2015 - 2030 (US$ Thousand) .................................. 108 Central Africa: The Market for Transformers, by Country, 2015 - 2030 (MVA Demand) .................................. 109
5.7 EAST AFRICA ................................................................................................................................... 111 East Africa: The Market for Transformers, by Country, 2015 - 2020 (US$ Thousand) ...................................... 111
The World Markets for Transformers, 2020 - 2030
East Africa: The Market for Transformers, by Country, 2015 - 2020 (% Change) .............................................. 112 East Africa: The Market for Transformers, by Country, by Type 2020 (US$ Thousand) .................................... 113 East Africa: The Market for Transformers, by Country, 2020 (MVA) ................................................................. 114 East Africa: The Market for Transformers, by Country, by Insulation 2020 (US$ Thousand) ............................. 115 East Africa: The Market for Transformers, by Country, by Size of Transformer 2020 (US$ Million) ................. 116 East Africa: The Market for Transformers, by Country, by End Use Customer 2020 (US$ Thousand) ............... 117 East Africa: The Market for Transformers, by Country, 2015 - 2030 (US$ Thousand) ...................................... 118 East Africa: The Market for Transformers, by Country, 2015 - 2030 (MVA Demand) ...................................... 119
5.8 SOUTHERN AFRICA ........................................................................................................................ 121 Southern Africa: The Market for Transformers, by Country, 2015 - 2020 (US$ Thousand) ............................... 121 Southern Africa: The Market for Transformers, by Country, 2015 - 2020 (% Change) ...................................... 121 Southern Africa: The Market for Transformers, by Country, by Type 2020 (US$ Thousand) ............................ 122 Southern Africa: The Market for Transformers, by Country, 2020 (MVA) ......................................................... 122 Southern Africa: The Market for Transformers, by Country, by Insulation 2020 (US$ Thousand) ..................... 123 Southern Africa: The Market for Transformers, by Country, by Size of Transformer 2020 (US$ Million) ......... 123 Southern Africa: The Market for Transformers, by Country, by End Use Customer 2020 (US$ Thousand) ....... 124 Southern Africa: The Market for Transformers, by Country, 2015 - 2030 (US$ Thousand) ............................... 124 Southern Africa: The Market for Transformers, by Country, 2015 - 2030 (MVA Demand) ............................... 125
5.9 MIDDLE EAST .................................................................................................................................. 127 Middle East: The Market for Transformers, by Country, 2015 - 2020 (US$ Thousand) ..................................... 127 Middle East: The Market for Transformers, by Country, 2015 - 2020 (% Change) ............................................ 128 Middle East: The Market for Transformers, by Country, by Type 2020 (US$ Thousand) .................................. 129 Middle East: The Market for Transformers, by Country, 2020 (MVA) ................................................................ 130 Middle East: The Market for Transformers, by Country, by Insulation 2020 (US$ Thousand) ........................... 131 Middle East: The Market for Transformers, by Country, by Size of Transformer 2020 (US$ Million) ............... 132 Middle East: The Market for Transformers, by Country, by End Use Customer 2020 (US$ Thousand) ............. 133 Middle East: The Market for Transformers, by Country, 2015 - 2030 (US$ Thousand) ..................................... 134 Middle East: The Market for Transformers, by Country, 2015 – 2030 (MVA Demand) .................................... 135
5.10 INDIAN SUB CONTINENT .............................................................................................................. 137 Indian Sub Con.: The Market for Transformers, by Country, 2015 - 2020 (US$ Thousand) .............................. 137 Indian Sub Con.: The Market for Transformers, by Country, 2015 - 2020 (% Change) ...................................... 137 Indian Sub Con.: The Market for Transformers, by Country, by Type 2020 (US$ Thousand) ............................ 138 Indian Sub Con.: The Market for Transformers, by Country, 2020 (MVA) ......................................................... 138 Indian Sub Con.: The Market for Transformers, by Country, by Insulation 2020 (US$ Thousand) ..................... 139 Indian Sub Con.: The Market for Transformers, by Country, by Size of Transformer 2020 (US$ Million) ......... 139 Indian Sub Con.: The Market for Transformers, by Country, by End Use Customer 2020 (US$ Thousand) ....... 140 Indian Sub Con.: The Market for Transformers, by Country, 2015 - 2030 (US$ Thousand) .............................. 140 Indian Sub Con.: The Market for Transformers, by Country, 2015 - 2030 (MVA Demand) .............................. 141
5.11 ASIA ................................................................................................................................................... 143 Asia: The Market for Transformers, by Country, 2015 - 2020 (US$ Thousand) ................................................. 143 Asia: The Market for Transformers, by Country, 2015 - 2020 (% Change) ........................................................ 144 Asia: The Market for Transformers, by Country, by Type 2020 (US$ Thousand) .............................................. 145 Asia: The Market for Transformers, by Country, 2020 (MVA) ............................................................................ 146 Asia: The Market for Transformers, by Country, by Insulation 2020 (US$ Thousand) ....................................... 147 Asia: The Market for Transformers, by Country, by Size of Transformer 2020 (US$ Million) ........................... 148 Asia: The Market for Transformers, by Country, by End Use Customer 2020 (US$ Thousand) ......................... 149 Asia: The Market for Transformers, by Country, 2015 - 2030 (US$ Thousand) ................................................. 150 Asia: The Market for Transformers, by Country, 2015 - 2030 (MVA Demand) ................................................. 151
5.12 SOUTH AMERICA ............................................................................................................................ 153 South America: The Market for Transformers, by Country, 2015 - 2020 (US$ Thousand) ................................ 153 South America: The Market for Transformers, by Country, 2015 - 2020 (% Change) ........................................ 154 South America: The Market for Transformers, by Country, by Type 2020 (US$ Thousand) .............................. 155 South America: The Market for Transformers, by Country, 2020 (MVA) ........................................................... 156 South America: The Market for Transformers, by Country, by Insulation 2020 (US$ Thousand) ....................... 157 South America: The Market for Transformers, by Country, by Size of Transformer 2020 (US$ Million) ........... 158 South America: The Market for Transformers, by Country, by End Use Customer 2020 (US$ Thousand) ......... 159 South America: The Market for Transformers, by Country, 2015 - 2030 (US$ Thousand) ................................ 160 South America: The Market for Transformers, by Country, 2015 - 2030 (MVA Demand) ................................ 161
5.13 CENTRAL AMERICA AND CARIBBEAN ..................................................................................... 163 Central America and Caribbean: The Market for Transformers, by Country, 2015 - 2020 (US$ Thousand) ...... 163 Central America and Caribbean: The Market for Transformers, by Country, 2015 - 2020 (% Change) ............. 164 Central America and Caribbean: The Market for Transformers, by Country, by Type 2020 (US$ Thousand) ... 165 Central America and Caribbean: The Market for Transformers, by Country, 2020 (MVA) ................................. 166 Central America and Caribbean: The Market for Transformers, by Country, by Insulation 2020 (US$ Thousand) .............................................................................................................................................................................. 167

The World Markets for Transformers, 2020 - 2030
Central America and Caribbean: The Market for Transformers, by Country, by Size of Transformer 2020 (US$ Million) ................................................................................................................................................................. 168 Central America and Caribbean: The Market for Transformers, by Country, by End Use Customer 2020 (US$ Thousand) ............................................................................................................................................................. 169 Central America and Caribbean: The Market for Transformers, by Country, 2015 - 2030 (US$ Thousand) ...... 170 Central America and Caribbean: The Market for Transformers, by Country, 2015 - 2030 (MVA Demand) ...... 171
5.14 NORTH AMERICA ............................................................................................................................ 173 North America: The Market for Transformers, by Country, 2015 - 2020 (US$ Thousand) ................................ 173 North America: The Market for Transformers, by Country, 2015 - 2020 (% Change) ........................................ 173 North America: The Market for Transformers, by Country, by Type 2020 (US$ Thousand) .............................. 174 North America: The Market for Transformers, by Country, 2020 (MVA) ........................................................... 174 North America: The Market for Transformers, by Country, by Insulation 2020 (US$ Thousand) ....................... 175 North America: The Market for Transformers, by Country, by Size of Transformer 2020 (US$ Million) ........... 175 North America: The Market for Transformers, by Country, by End Use Customer 2020 (US$ Thousand) ......... 176 North America: The Market for Transformers, by Country, 2015 - 2030 (US$ Thousand) ................................ 176 North America: The Market for Transformers, by Country, 2015 - 2030 (MVA Demand) ................................ 177
5.15 OCEANIA ........................................................................................................................................... 179 Oceania: The Market for Transformers, by Country, 2015 - 2020 (US$ Thousand) ........................................... 179 Oceania: The Market for Transformers, by Country, 2015 - 2020 (% Change)................................................... 179 Oceania: The Market for Transformers, by Country, by Type 2020 (US$ Thousand) ........................................ 180 Oceania: The Market for Transformers, by Country, 2020 (MVA) ...................................................................... 180 Oceania: The Market for Transformers, by Country, by Insulation 2020 (US$ Thousand) .................................. 181 Oceania: The Market for Transformers, by Country, by Size of Transformer 2020 (US$ Million) ..................... 181 Oceania: The Market for Transformers, by Country, by End Use Customer 2020 (US$ Thousand) .................... 182 Oceania: The Market for Transformers, by Country, 2015 - 2030 (US$ Thousand) ........................................... 182 Oceania: The Market for Transformers, by Country, 2015 - 2030 (MVA Demand) ........................................... 183
6. PRODUCTION .......................................................................................................................................... 185 The Top 35 Producers of Transformers, 2020 (US$ Million) .............................................................................. 185
7. TRADE ANALYSIS .................................................................................................................................. 187
7.1 TOP 25 EXPORTERS ........................................................................................................................ 187 The Top 25 Exporters of Power & Distribution Transformers, 2017 to 2019 (US$ Thousands) .......................... 187 The Top 25 Exporters of Transformers up to 650kVA 2017 to 2019 (US$ Thousands) ...................................... 188 The Top 25 Exporters ofTransformers, 650-10,000kVA 2017 to 2019 (US$ Thousands) ................................... 189 The Top 25 Exporters of Transformers,over 10,000kVA 2017 to 2019 (US$ Thousands) .................................. 190 The Top 25 Exporters of Dry Transformers,up to 500kVA 2017 to 2019 (US$ Thousands) ............................... 191 The Top 25 Exporters of Dry Transformers over 500kVA 2017 to 2019 (US$ Thousands) ................................ 192
7.2 TOP 25 IMPORTERS ......................................................................................................................... 193 The Top 25 Importers of Power & Distribution Transformers, 2017 to 2019 (US$ Thousands) .......................... 193 The Top 25 Importers of Transformers up to 650kVA 2017 to 2019 (US$ Thousands) ...................................... 194 The Top 25 Importers of Transformers 650-10,000kVA 2017 to 2019 (US$ Thousands) ................................... 195 The Top 25 Importers of Transformers over 10,000kVA 2017 to 2019 (US$ Thousands) .................................. 196 The Top 25 Importers of Dry Transformers up to 500kVA 2017 to 2019 (US$ Thousands) ............................... 197 The Top 25 Importers of Dry Transformers Over 500kVA 2017 to 2019 (US$ Thousands) ............................... 198
7.3 EXPORT VALUES ............................................................................................................................ 199 The Top 25 Exporters of Transformers to Principal Destinations, Austria-Canada, 2019 (US$ Thousand) ........ 199 The Top 25 Exporters of Transformers to Principal Destinations, China-Denmark, 2019 (US$ Thousand) ....... 200 The Top 25 Exporters of Transformers to Principal Destinations, France-Hungary 2019 (US$ Thousand) ......... 201 The Top 25 Exporters of Transformers to Principal Destinations, India-Japan 2019 (US$ Thousand) ................ 202 The Top 25 Exporters of Transformers to Principal Destinations, Mexico-Taiwan, 2019 (US$ Thousand) ....... 203 The Top 25 Exporters of Transformers to Principal Destinations, Poland-Rep. Korea 2019 (US$ Thousand) .... 204 The Top 25 Exporters of Transformers to Principal Destinations, Slovenia-Sweden 2019 (US$ Thousand) ....... 205 The Top 25 Exporters of Transformers to Principal Destinations, Switzerland -Thailand 2019 (US$ Thousand) .............................................................................................................................................................................. 206 The Top 25 Exporters of Transformers to Principal Destinations, Turkey-USA, 2019 (US$ Thousand) ............. 207
7.4 EXPORT PERCENTAGES ................................................................................................................ 209 The Top 25 Exporters of Transformers to Principal Destinations, Austria-Canada, 2019 (%) ............................ 209 The Top 25 Exporters of Transformers to Principal Destinations, China-Denmark, 2019 (%) ........................... 210 The Top 25 Exporters of Transformers to Principal Destinations, France-Hungary 2019 (%) ............................. 211 The Top 25 Exporters of Transformers to Principal Destinations, India-Japan 2019 (%) .................................... 212 The Top 25 Exporters of Transformers to Principal Destinations, Mexico-Taiwan, 2019 (%) ............................ 213 The Top 25 Exporters of Transformers to Principal Destinations, Poland-Rep. Korea 2019 (%) ........................ 214 The Top 25 Exporters of Transformers to Principal Destinations, Slovenia-Sweden 2019 (%) ........................... 215 The Top 25 Exporters of Transformers to Principal Destinations, Switzerland -Thailand 2019 (%) .................... 216 The Top 25 Exporters of Transformers to Principal Destinations, Turkey-USA, 2019 (%) ................................. 217
The World Markets for Transformers, 2020 - 2030
7.5 IMPORT VALUES & TYPICAL SUPPLIER PROFILES TOP 25 ................................................... 219 Import Values By Importing Country, Australia – Belgium, 2017 – 2019 Averaged (US$ Thousand & % of Total) .............................................................................................................................................................................. 219 Import Values By Importing Country, Canada - China, 2017 – 2019 Averaged (US$ Thousand & % Total) ..... 220 Import Values By Importing Country, Denmark - Egypt, 2017 – 2019 Averaged (US$ Thousand & % Total)... 221 Import Values By Importing Country, France- Germany, 2017 – 2019 Averaged (US$ Thousand & % Total) 222 Import Values By Importing Country Indonesia-Italy 2017 – 2019 Averaged (US$ Thousand & % Total) ........ 223 Import Values By Importing Country, Japan-Malaysia, 2017 – 2019 Averaged (US$ Thousand & % Total) ..... 224 Import Values By Importing Country, Mexico-Netherlands, 2017 – 2019 Averaged (US$ Thousand & % Total) .............................................................................................................................................................................. 225 Import Values By Importing Country, Norway – Pakistan, 2017 – 2019 Averaged (US$ Thousand & % Total) .............................................................................................................................................................................. 226 Import Values By Importing Country, Philippines – Russia, 2017 – 2019 Averaged (US$ Thousand & % Total) .............................................................................................................................................................................. 227 Import Values By Importing Country, Saudi Arabia - Spain, 2017 – 2019 Averaged (US$ Thousand & % Total) .............................................................................................................................................................................. 228 Import Values By Importing Country Sweden – United Arab Emirates 2017 – 2019 Averaged (US$ Thousand & % Total) ................................................................................................................................................................ 229 Import Values By Importing Country United Kingdom – USA 2017 – 2019 Averaged (US$ Thousand & % Total) .................................................................................................................................................................... 230 Import Values By Importing Country Vietnam 2017 – 2019 Averaged (US$ Thousand & % Total) ................ 231
8. TRADE IN TRANSFORMER PARTS .................................................................................................... 233 Exports of Transformer Parts, by Country, 2015 to 2019 (US$ Million) ............................................................. 233 Imports of Transformer Parts, by Country, 2015 to 2019 (US$ Million) ............................................................. 234
8.1 Top 15 Exporters of Transformer Parts by Destination 2016 to 2019................................................. 235 Exports of Transformer Parts from Austria by Country, 2016 to 2019 (US$ Thousand) ..................................... 235 Exports of Transformer Parts from Canada by Country, 2016 to 2019 (US$ Thousand) ..................................... 236 Exports of Transformer Parts from China by Country, 2016 to 2019 (US$ Thousand) ........................................ 237 Exports of Transformer Parts from China Hong Kong by Country, 2016 to 2019 (US$ Thousand) .................... 238 Exports of Transformer Parts from France by Country, 2016 to 2019 (US$ Thousand) ...................................... 239 Exports of Transformer Parts from Germany by Country, 2016 to 2019 (US$ Thousand) .................................. 240 Exports of Transformer Parts from India by Country, 2016 to 2019 (US$ Thousand) ......................................... 241 Exports of Transformer Parts from Italy by Country, 2016 to 2019 (US$ Thousand) .......................................... 242 Exports of Transformer Parts from Japan by Country, 2016 to 2019 (US$ Thousand) ........................................ 243 Exports of Transformer Parts from Mexico by Country, 2016 to 2019 (US$ Thousand) ..................................... 244 Exports of Transformer Parts from South Korea by Country, 2016 to 2019 (US$ Thousand) ............................. 245 Exports of Transformer Parts from Singapore by Country, 2016 to 2019 (US$ Thousand) ................................. 246 Exports of Transformer Parts from Sweden by Country, 2016 to 2019 (US$ Thousand) ..................................... 247 Exports of Transformer Parts from USA by Country, 2016 to 2019 (US$ Thousand) ......................................... 248 Exports of Transformer Parts from Vietnam by Country, 2016 to 2019 (US$ Thousand).................................... 249
9. APPENDICES ............................................................................................................................................ 253
9.1 COUNTRY PROFILES BY REGION................................................................................................ 253 9.1.1 Western Europe ................................................................................................................................... 253
W Europe – Country by Country Profiles ............................................................................................................. 253 W Europe – Country by Country Profiles - continued .......................................................................................... 254
9.1.2 Eastern Europe ................................................................................................................................... 255 E Europe – Country by Country Profiles .............................................................................................................. 255
9.1.3 Former Soviet Union ........................................................................................................................... 256 FSU – Country by Country Profiles ..................................................................................................................... 256
9.1.4 North Africa ........................................................................................................................................ 257 N. Africa – Country by Country Profiles .............................................................................................................. 257
9.1.5 West Africa .......................................................................................................................................... 258 W. Africa – Country by Country Profiles ............................................................................................................. 258
9.1.6 Central Africa ..................................................................................................................................... 259 Central Africa – Country by Country Profiles ...................................................................................................... 259
9.1.7 East Africa........................................................................................................................................... 260 East Africa – Country by Country Profiles ........................................................................................................... 260
9.1.8 South Africa ......................................................................................................................................... 261 South Africa – Country by Country Profiles ........................................................................................................ 261
9.1.9 Middle East ......................................................................................................................................... 262 Middle East – Country by Country Profiles .......................................................................................................... 262
9.1.10 Indian Subcontinent ............................................................................................................................ 263 Indian Subcon. – Country by Country Profiles ..................................................................................................... 263
The World Markets for Transformers, 2020 - 2030
9.1.11 Asia ..................................................................................................................................................... 264 Asia – Country by Country Profiles ..................................................................................................................... 264 Asia – Country by Country Profiles - continued ................................................................................................... 265
9.1.12 South America ..................................................................................................................................... 266 South America – Country by Country Profiles ..................................................................................................... 266
9.1.13 Central America &Caribbean ............................................................................................................. 267 C. America &Caribb. – Country by Country Profiles ........................................................................................... 267 C. America &Caribb. – Country by Country Profiles - continued ........................................................................ 268
9.1.14 North America ..................................................................................................................................... 269 North America – Country by Country Profiles ..................................................................................................... 269
9.1.15 Australasia .......................................................................................................................................... 270 Australasia – Country by Country Profiles ........................................................................................................... 270
9.2 EXCHANGE RATES ......................................................................................................................... 271 Exchange Rates for Major Currencies against US Dollar 2013-2019 ................................................................... 271
9.3 ESTIMATED PRODUCTION BY COMPANY BY COUNTRY ..................................................... 273 Estimated Production by Company by Country Millions US Dollar 2020 ........................................................... 273
The World Markets for Transformers, 2020 - 2030
1
1. INTRODUCTION
1.1 OBJECTIVES AND SCOPE
The objective of this report is to provide a concise overview of the world transformer market. The report gives an estimate of the volume and value of transformer consumption in each national market, broken down by product category. For the purposes of this report the categories of transformers have been defined as follows:
Generator Transformers - defined as step-up transformers attached to power generation plants. The purpose of these transformers is to increase the voltage from alternator output to transmission level.
Transmission Transformers - defined as transformers installed in transmission sub-stations. For the purposes of this report, Transmission Transformers are further defined as generally in developing markets having a power handling capacity equal to, or greater than, 5MVA and in industrialised countries nearer 10MVA. Also know as system transformers, the purpose of these transformers is to step-down the voltage from transmission levels to sub-transmission and distribution levels.
Distribution Transformers - defined as transformers installed in distribution and consumer sub-stations. Distribution Transformers are further defined as generally having a power handling capacity of less than 5MVA.
These categories include all transformers with a power handling capacity exceeding 16kVA. Measuring transformers, instrument transformers or transformers for use in civil aircraft are not included in this report.
The scope for this report is world-wide - that is, every country having a significant transformer customer base. The report is designed to be used as a first line planning tool by companies interested in the global market for transformer products and as a screen on which to identify national markets worthy of further investigation.
The World Markets for Transformers, 2020 - 2030
2
1.2 METHODOLOGY
Data in the markets report is presented in both millions of US dollars and in terms of power capacity (MVA). The salient points of the methodology are as follows:-
For the data presented in US dollars, the survey was based primarily on desk research, including a review of available published production and trade statistics. Import and export figures are calculated from national and United Nations’ figures for 2013–2019 the most comprehensive and up-to-date statistics available. Market values are assumed to be equal to Production + (Imports - Exports). National production estimates are based on statistics provided by national governments and trade associations. Market sizes for 2020 are estimated by analysing a range of economic indicators together with trends in trade flow and the pattern of market size growth over the period 2013-2019.
Market values for the period 2020 to 2030 have been estimated based on two separate methodologies. Firstly the past growth rate in market values for each country have been extrapolated and have been compared with general macro-economic indicators such as GDP, GDP growth and inputs to the value added for each economy. Secondly, the development of the electrical power system in each country has been studied to provide indications for future system growth, and hence transformer market growth.
The future MVA demand for each country has been forecast using the following method. The current year-on-year growth in installed capacity for each country has been tracked for the last 40 years. The development over the last ten years has been used as the basis for establishing the new MVA of generator capacity in each country for the period 2020 to 2030. To this new capacity has been added the power station capacity that is necessary to replace redundant or retired plant. Typical rates for this are based on 2.5% of the installed capacity in the period 1975 to 2019, yielding an assumed plant life of approximately 46 years. The new and replacement generator MVA has then been used as the basis for calculating the transmission and distribution transformer MVA over the forecast period.
Market values are at factory gate prices - they reflect the prices for the products by the importer and do not include trade mark-ups and installation costs. It should be noted that published classifications of products, especially with respect to trade statistics, are sometimes inaccurate, as products may be shipped under generic titles. It should also be noted that Goulden Reports chronicles shipments rather than contracts. A contract to supply goods over a number of years will not appear as a one-off event in a Goulden Report, but rather will be recorded from the trade statistics. The nature of the market means that demand within countries, especially developing ones, can fluctuate greatly from year to year as purchases are often made on a one-off basis rather than spread evenly over a number of years.
Within national markets, where published figures were unavailable to us, the breakdown between different product categories is based on intelligence about the pattern of consumption in the country concerned. In these cases the breakdown is made from an estimate of the Total market size rather than the value of the entire market being calculated from the individual product categories.

The World Markets for Transformers, 2020 - 2030
3
Clients that have purchased previous editions of this report will note that this edition contains a more detailed analysis of the market in each country. Market data by value, by MVA, by insulation type, by size, by end use and forecasts through to 2030 by value and by MVA are all included in this report.
Figures for non-UN countries are based on data obtained from individual countries and are consequently not necessarily comparable with UN-derived information. Clearly the report is only as accurate as the information upon which it draws - the sources are regarded as being the best and most comprehensive available.

The World Markets for Transformers, 2020 - 2030
5
2. SUMMARY
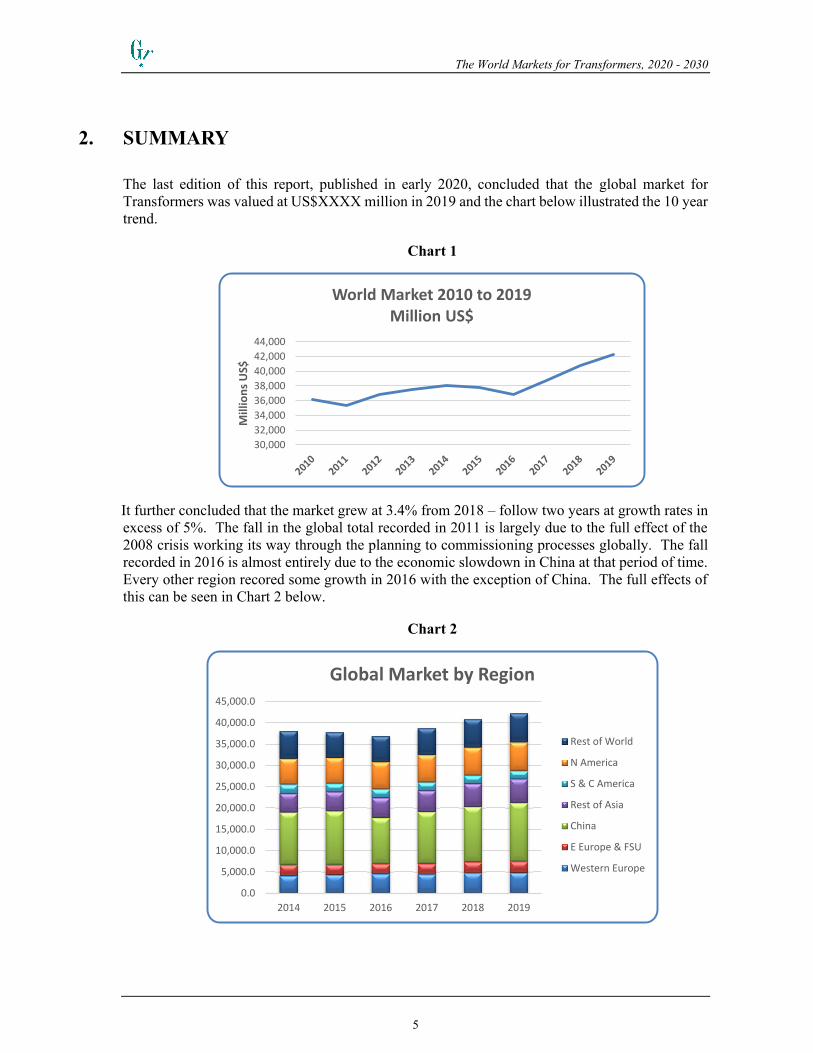
The last edition of this report, published in early 2020, concluded that the global market for Transformers was valued at US$XXXX million in 2019 and the chart below illustrated the 10 year trend.
Chart 1
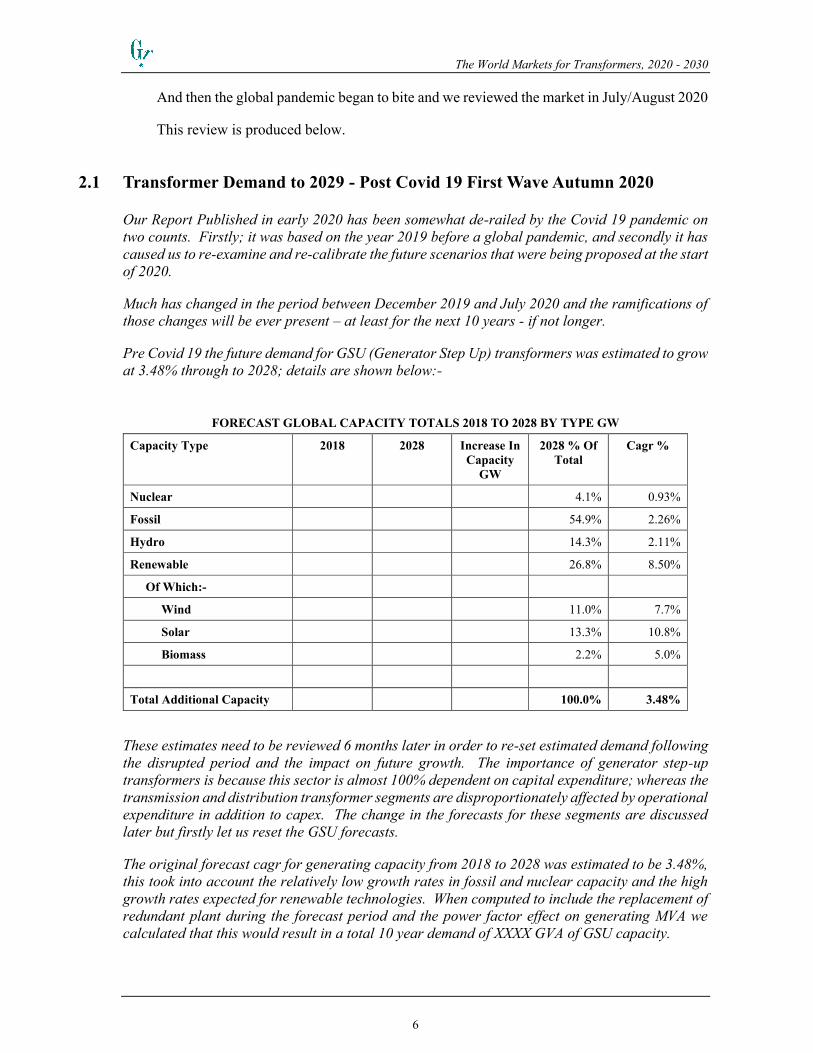
It further concluded that the market grew at 3.4% from 2018 – follow two years at growth rates in excess of 5%. The fall in the global total recorded in 2011 is largely due to the full effect of the 2008 crisis working its way through the planning to commissioning processes globally. The fall recorded in 2016 is almost entirely due to the economic slowdown in China at that period of time. Every other region recored some growth in 2016 with the exception of China. The full effects of this can be seen in Chart 2 below.
Chart 2
30,00032,00034,00036,00038,00040,00042,00044,000
Mill
ions
US$
World Market 2010 to 2019Million US$
0.0
5,000.0
10,000.0
15,000.0
20,000.0
25,000.0
30,000.0
35,000.0
40,000.0
45,000.0
2014 2015 2016 2017 2018 2019
Global Market by Region
Rest of World
N America
S & C America
Rest of Asia
China
E Europe & FSU
Western Europe
The World Markets for Transformers, 2020 - 2030
6
And then the global pandemic began to bite and we reviewed the market in July/August 2020
This review is produced below.
2.1 Transformer Demand to 2029 - Post Covid 19 First Wave Autumn 2020
Our Report Published in early 2020 has been somewhat de-railed by the Covid 19 pandemic on two counts. Firstly; it was based on the year 2019 before a global pandemic, and secondly it has caused us to re-examine and re-calibrate the future scenarios that were being proposed at the start of 2020.
Much has changed in the period between December 2019 and July 2020 and the ramifications of those changes will be ever present – at least for the next 10 years - if not longer.
Pre Covid 19 the future demand for GSU (Generator Step Up) transformers was estimated to grow at 3.48% through to 2028; details are shown below:-
FORECAST GLOBAL CAPACITY TOTALS 2018 TO 2028 BY TYPE GW
Capacity Type 2018 2028 Increase In Capacity
GW
2028 % Of Total
Cagr %
Nuclear 4.1% 0.93%
Fossil 54.9% 2.26%
Hydro 14.3% 2.11%
Renewable 26.8% 8.50%
Of Which:-
Wind 11.0% 7.7%
Solar 13.3% 10.8%
Biomass 2.2% 5.0%
Total Additional Capacity 100.0% 3.48%
These estimates need to be reviewed 6 months later in order to re-set estimated demand following the disrupted period and the impact on future growth. The importance of generator step-up transformers is because this sector is almost 100% dependent on capital expenditure; whereas the transmission and distribution transformer segments are disproportionately affected by operational expenditure in addition to capex. The change in the forecasts for these segments are discussed later but firstly let us reset the GSU forecasts.
The original forecast cagr for generating capacity from 2018 to 2028 was estimated to be 3.48%, this took into account the relatively low growth rates in fossil and nuclear capacity and the high growth rates expected for renewable technologies. When computed to include the replacement of redundant plant during the forecast period and the power factor effect on generating MVA we calculated that this would result in a total 10 year demand of XXXX GVA of GSU capacity.

The World Markets for Transformers, 2020 - 2030
7
The International Monetary Fund has recently published a June 2020 update to the World Economic Outlook series of publications. This edition revised downwards the projected growth and GDP forecasts from the earlier April edition.
The details by major region are shown below
GDP ESTIMATES 2017 TO 2021
REAL GDP ESTIMATES AND FORECASTS 2017 TO 2021 (PERCENT CHANGE FROM PREVIOUS YEAR) 2017 2018 2019E 2020F 2021F
WORLD 3.3 3.0 2.4 -5.2 4.2 ADVANCED ECONOMIES 2.5 2.1 1.6 -7.0 3.9 UNITED STATES 2.4 2.9 2.3 -6.1 4.0 EURO AREA 2.5 1.9 1.2 -9.1 4.5 JAPAN 2.2 0.3 0.7 -6.1 2.5 EMERGING MARKET & DEVELOPING ECONOMIES 4.5 4.3 3.5 -2.5 4.6
EAST ASIA AND PACIFIC 6.5 6.3 5.9 0.5 6.6 CHINA 6.8 6.6 6.1 1.0 6.9 EUROPE AND CENTRAL ASIA 4.1 3.3 2.2 -4.7 3.6 LATIN AMERICA AND THE CARIBBEAN 1.9 1.7 0.8 -7.2 2.8 MIDDLE EAST AND NORTH AFRICA 1.1 0.9 -0.2 -4.2 2.3 SOUTH ASIA 6.5 6.5 4.7 -2.7 2.8 SUB-SAHARAN AFRICA 2.6 2.6 2.2 -2.8 3.1
SOURCE WORLD BANK
More graphically the chart below illustrates the short term forecasts.
CHART 3
QUARTERLY WORLD GDP BY IMF
The World Markets for Transformers, 2020 - 2030
8
Given that most generating plant development projects are planned several years ahead of commissioning and that GSU transformers are ordered over a year in advance of grid synchronisation on the face of it the industry activity should be able to “bridge the gap”. Projects in design or in construction phases may be subjected to delays caused by covid 19 restrictions but it looks as though GSU transformer demand may not be impacted too greatly. However; the future – and these forecasts – are far from certain and will depend on a number of factors, including; speed of recovery, second or subsequent virus waves, government spending/debt, world commodity and oil prices, etc., etc. The June review does explore some of these scenarios and as a result the recovery illustrated above may be delayed but up to 3, 4 or 5 years into the future. In which case the ability of the industry to “bridge the gap” will definitely be compromised to the point that if global electricity demand does not increase, the need for new generating capacity will also largely disappear.
On the basis that if we do not know what the future will be, let us look back to see if history can provide any valid indication that will help with the analysis. There have been many recessions, conflicts and periods of negative growth but only a few during the period of time when electricity has been a major utility product. The 1914 -1918 war and the Wall street depression of the 1920’s were globally devastating but probably too far back in time to shed light on the 21st century. Similarly the 1973 oil crisis, whilst it did result in a re-assessment of fuel strategy in many countries happened at a time when the total global GDP was less that 25% of the current USA total today and happened well before China became the major global financial power that it now is. So; the nearest comparison from which we might learn is the 2008 financial crash that, albeit for very different reasons, constitutes a similarly sudden and globally devastating event.
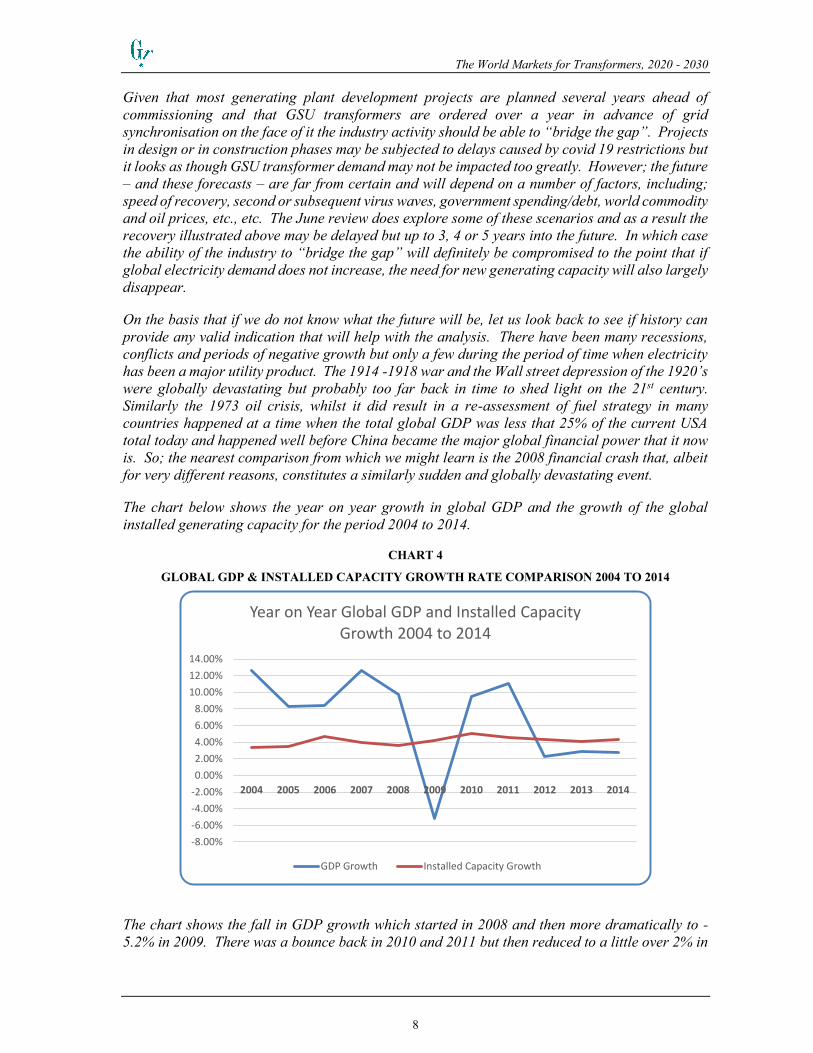
The chart below shows the year on year growth in global GDP and the growth of the global installed generating capacity for the period 2004 to 2014.
CHART 4
GLOBAL GDP & INSTALLED CAPACITY GROWTH RATE COMPARISON 2004 TO 2014
The chart shows the fall in GDP growth which started in 2008 and then more dramatically to -5.2% in 2009. There was a bounce back in 2010 and 2011 but then reduced to a little over 2% in
-8.00%-6.00%-4.00%-2.00%0.00%2.00%4.00%6.00%8.00%
10.00%12.00%14.00%
2004 2005 2006 2007 2008 2009 2010 2011 2012 2013 2014
Year on Year Global GDP and Installed Capacity Growth 2004 to 2014
GDP Growth Installed Capacity Growth
The World Markets for Transformers, 2020 - 2030
9
the following years. Interestingly the global installed generating capacity continued to grow at over 4% each year from 2008 through to 2010 when it breached the 5% level and then remained above 4% for the remainder of the period to 2014. The recovery of the worlds financial system took nearly a decade; and some would say that it has still not fully recovered 12 years later.
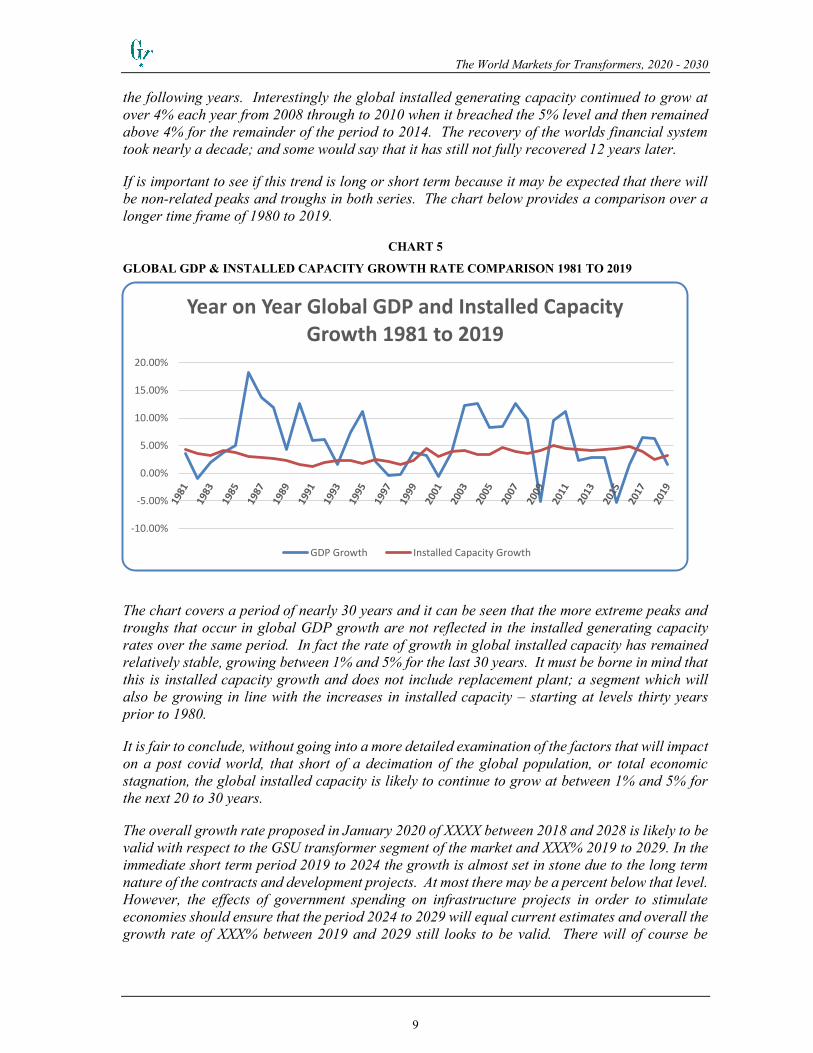
If is important to see if this trend is long or short term because it may be expected that there will be non-related peaks and troughs in both series. The chart below provides a comparison over a longer time frame of 1980 to 2019.
CHART 5
GLOBAL GDP & INSTALLED CAPACITY GROWTH RATE COMPARISON 1981 TO 2019
The chart covers a period of nearly 30 years and it can be seen that the more extreme peaks and troughs that occur in global GDP growth are not reflected in the installed generating capacity rates over the same period. In fact the rate of growth in global installed capacity has remained relatively stable, growing between 1% and 5% for the last 30 years. It must be borne in mind that this is installed capacity growth and does not include replacement plant; a segment which will also be growing in line with the increases in installed capacity – starting at levels thirty years prior to 1980.
It is fair to conclude, without going into a more detailed examination of the factors that will impact on a post covid world, that short of a decimation of the global population, or total economic stagnation, the global installed capacity is likely to continue to grow at between 1% and 5% for the next 20 to 30 years.
The overall growth rate proposed in January 2020 of XXXX between 2018 and 2028 is likely to be valid with respect to the GSU transformer segment of the market and XXX% 2019 to 2029. In the immediate short term period 2019 to 2024 the growth is almost set in stone due to the long term nature of the contracts and development projects. At most there may be a percent below that level. However, the effects of government spending on infrastructure projects in order to stimulate economies should ensure that the period 2024 to 2029 will equal current estimates and overall the growth rate of XXX% between 2019 and 2029 still looks to be valid. There will of course be
-10.00%
-5.00%
0.00%
5.00%
10.00%
15.00%
20.00%
Year on Year Global GDP and Installed Capacity Growth 1981 to 2019
GDP Growth Installed Capacity Growth

The World Markets for Transformers, 2020 - 2030
10
variations between countries and regions which will mean that manufacturers will need to be quick on their feet to identify the opportunities.
Transmission System Transformers
The drivers impacting on the transmission transformer market are different from the GSU segment. As noted earlier transmission network development is a mixture of capital expenditure (capex) and operational expenditure (opex). The critical difference between the two is that it is easier for utility companies to quickly cut back on opex than capex and in times of hardship that is what they do. This segment covers a broad range of transformers from the very largest auto-transformers measured in the 100’s of MVA down to 10 or 20 MVA (depending on the definition used in each country). There is another factor unique to this segment of the transformer industry; it is also extremely sensitive to industrial investment.
This combination of drivers means that demand is likely to be suppressed; particularly in the more industrialised regions immediately following the pandemic but that it is equally likely to spring back in the medium term supported by infrastructure development. On this basis it is estimated that the growth rate between 2019 and 2024 will be 2.83% cagr and will increase to 3.84% between 2024 and 2029.
TRANSMISSION SYSTEM TRANSFORMER GROWTH RATES 2019 TO 2029
Transmission System Transformer Growth Rates Region cagr 2019 to 2024 cagr 2024 to 2029 W Europe E Europe Fsu N Africa W Africa C Africa E Africa S Africa M East Indian Sub Con Asia S America C America & Carib N America Australasia World 2.83% 3.84%
As a result of these suppressed growth rates this global market segment which was worth US$XXX billion in 2019 will reach just over US$XXX billion in 2024 and US$XXX billion in 2029 (all values in 2019 US$).

The World Markets for Transformers, 2020 - 2030
11
Distribution Transformers
Of the three, this segment is the most at risk from sudden economic shock. The supply of distribution transformers is principally a commodity business and orders are often placed on a call-off basis from stock. The market is driven by a lesser extent by grid development in “new installations” or predominantly by maintenance and replacement of existing networks.
In the period post Covid 19 the demand for distribution transformers is likely to be disproportionately depressed, for many reasons. Labour shortages, the need to reduce utility opex, depressed industrial demand, depressed consumer demand, de-stocking, reduced house building, lack of consumer mobility will all be negative drivers on this segment of the transformer market.
DISTRIBUTION TRANSFORMER GROWTH RATES 2019 TO 2029
Distribution Transformer Growth Rates Region cagr 2019 to 2024 cagr 2024 to 2029 W Europe E Europe Fsu N Africa W Africa C Africa E Africa S Africa M East Indian Sub Con Asia S America C America & Carib N America Australasia World 2.10% 2.80%

The World Markets for Transformers, 2020 - 2030
12
Summary
Estimates for the transformer market that were produced at the start of 2020 – essentially pre-Covid 19 are shown in the table below compared with revised estimated as at Autumn 2020
GLOBAL TRANSFORMER MARKET ESTIMATES PRE & POST COVID 2019 TO 2029
Global Transformer Market Estimates Pre & Post Covid 19 – Values Us$ Million Base Year Original
Estimate Revised Estimate
Original Estimate
Revised Estimate
Region 2019 2024 2024 2029 2029 W Europe E Europe Fsu N Africa W Africa C Africa E Africa S Africa M East Indian Sub Con Asia S America C America & Carib N America Australasia Total
The effects of the analysis shown above result in a reduction of US$XXX billion by 2024 and US$XXX billion by 2029; this represents a reduction of 5% and 6.5% respectively.
The change in the overall composition of the market in terms of type of transformer in 2019 and 2029 are as shown below.
GLOBAL TRANSFORMER MARKET BY TYPE BY REGION 2019
Global Transformer Market By Type By Region 2019
% Generator % Transmission % Distribution Total Europe 100.00% Fsu 100.00% Asia 100.00% S & C America 100.00% N America 100.00% Row 100.00%
Total 100.00%
The World Markets for Transformers, 2020 - 2030
13
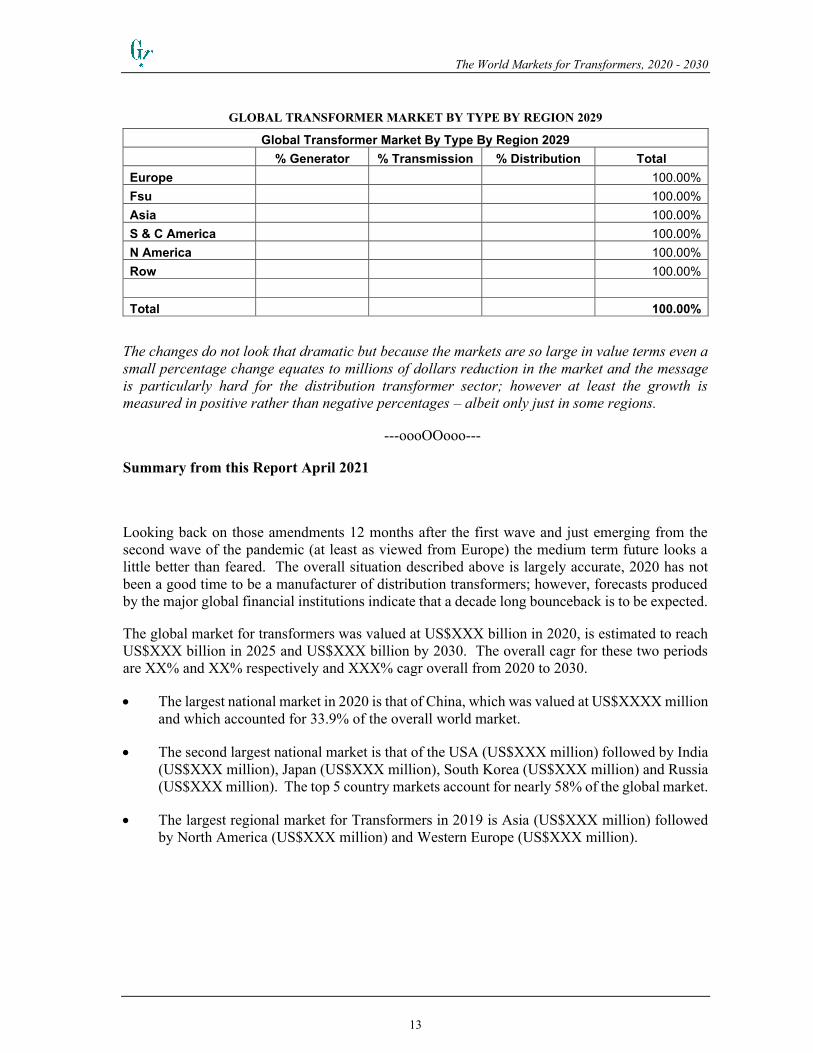
GLOBAL TRANSFORMER MARKET BY TYPE BY REGION 2029
Global Transformer Market By Type By Region 2029
% Generator % Transmission % Distribution Total Europe 100.00% Fsu 100.00% Asia 100.00% S & C America 100.00% N America 100.00% Row 100.00%
Total 100.00%
The changes do not look that dramatic but because the markets are so large in value terms even a small percentage change equates to millions of dollars reduction in the market and the message is particularly hard for the distribution transformer sector; however at least the growth is measured in positive rather than negative percentages – albeit only just in some regions.
---oooOOooo---
Summary from this Report April 2021
Looking back on those amendments 12 months after the first wave and just emerging from the second wave of the pandemic (at least as viewed from Europe) the medium term future looks a little better than feared. The overall situation described above is largely accurate, 2020 has not been a good time to be a manufacturer of distribution transformers; however, forecasts produced by the major global financial institutions indicate that a decade long bounceback is to be expected.
The global market for transformers was valued at US$XXX billion in 2020, is estimated to reach US$XXX billion in 2025 and US$XXX billion by 2030. The overall cagr for these two periods are XX% and XX% respectively and XXX% cagr overall from 2020 to 2030.
The largest national market in 2020 is that of China, which was valued at US$XXXX million and which accounted for 33.9% of the overall world market.
The second largest national market is that of the USA (US$XXX million) followed by India (US$XXX million), Japan (US$XXX million), South Korea (US$XXX million) and Russia (US$XXX million). The top 5 country markets account for nearly 58% of the global market.
The largest regional market for Transformers in 2019 is Asia (US$XXX million) followed by North America (US$XXX million) and Western Europe (US$XXX million).
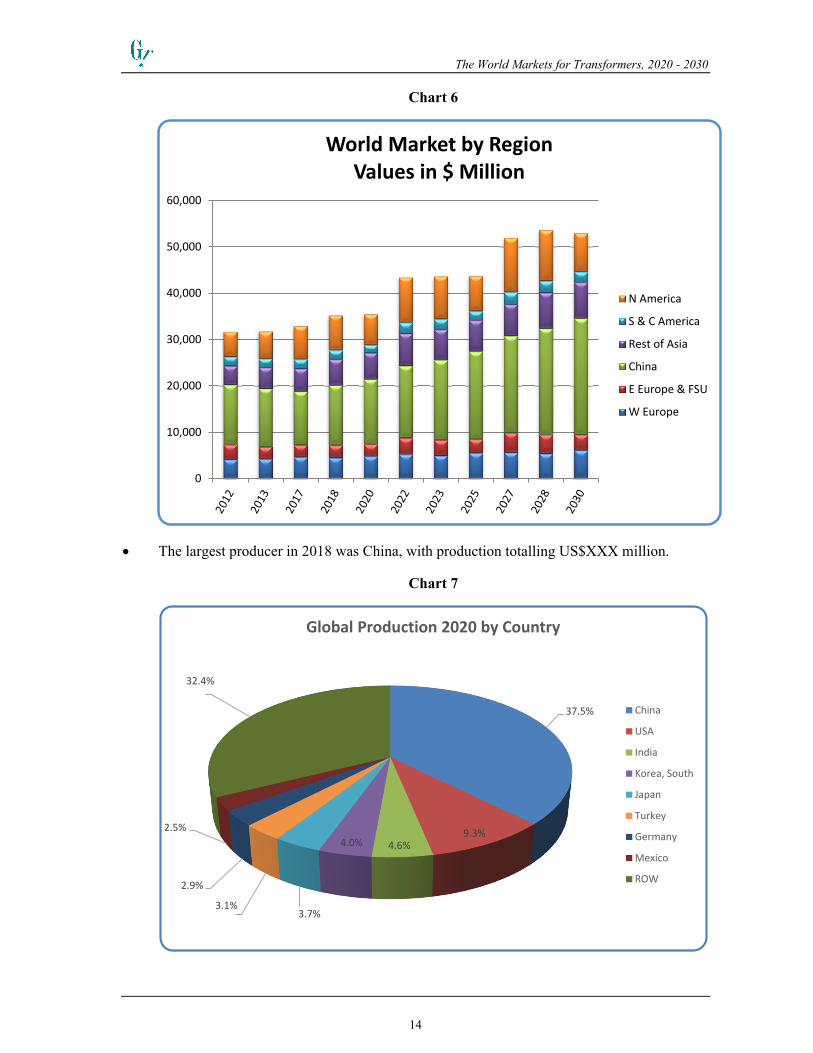
The World Markets for Transformers, 2020 - 2030
14
Chart 6
The largest producer in 2018 was China, with production totalling US$XXX million.
Chart 7
0
10,000
20,000
30,000
40,000
50,000
60,000
World Market by RegionValues in $ Million
N America
S & C America
Rest of Asia
China
E Europe & FSU
W Europe
37.5%
9.3%4.6%4.0%
3.7%3.1%
2.9%
2.5%
32.4%
Global Production 2020 by Country
China
USA
India
Korea, South
Japan
Turkey
Germany
Mexico
ROW
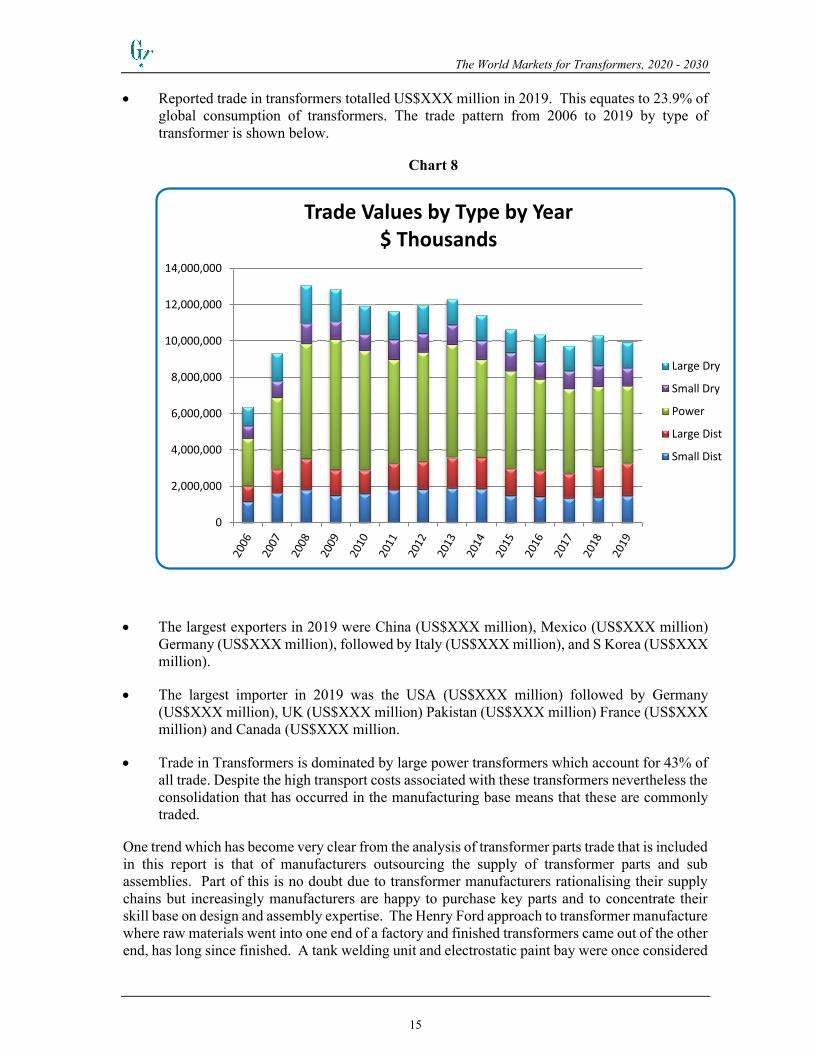
The World Markets for Transformers, 2020 - 2030
15
Reported trade in transformers totalled US$XXX million in 2019. This equates to 23.9% of global consumption of transformers. The trade pattern from 2006 to 2019 by type of transformer is shown below.
Chart 8
The largest exporters in 2019 were China (US$XXX million), Mexico (US$XXX million) Germany (US$XXX million), followed by Italy (US$XXX million), and S Korea (US$XXX million).
The largest importer in 2019 was the USA (US$XXX million) followed by Germany (US$XXX million), UK (US$XXX million) Pakistan (US$XXX million) France (US$XXX million) and Canada (US$XXX million.
Trade in Transformers is dominated by large power transformers which account for 43% of all trade. Despite the high transport costs associated with these transformers nevertheless the consolidation that has occurred in the manufacturing base means that these are commonly traded.
One trend which has become very clear from the analysis of transformer parts trade that is included in this report is that of manufacturers outsourcing the supply of transformer parts and sub assemblies. Part of this is no doubt due to transformer manufacturers rationalising their supply chains but increasingly manufacturers are happy to purchase key parts and to concentrate their skill base on design and assembly expertise. The Henry Ford approach to transformer manufacture where raw materials went into one end of a factory and finished transformers came out of the other end, has long since finished. A tank welding unit and electrostatic paint bay were once considered
0
2,000,000
4,000,000
6,000,000
8,000,000
10,000,000
12,000,000
14,000,000
Trade Values by Type by Year$ Thousands
Large Dry
Small Dry
Power
Large Dist
Small Dist

The World Markets for Transformers, 2020 - 2030
16
as much an essential integral part of any transformer plant as a winding shop or testing facility. Finished tanks are now routinely outsourced as are increasingly, windings, complete cores, bushings, tap changers, etc, etc,. Trade in parts grew by a cagr of 10.12% from 2009 to 2014, from US$XXX billion to US$XXX billion in 2014. This trend continues and it is notable that in 2016 the total trade in transformers and the total trade in parts were numerically equal at US$XXX billion. The trend continues and in 2017 exports of parts totalled US$XXX billion and in 2018 US$XXX billion increases of 10.8% and 6% respectively. The total recorded for 2019 is down slightly at US$XXX billion; China increased by US$XXX billion but all other in the top 5 showed reduced figures.
Recent Supply Changes
During the final editing of the 2018 report came an announcement from ABB and Hitachi that ABB is to sell the Grid business to Hitachi firstly 80% with a two year transition to 100% of the equity.
In December 2018 it is announced that ABB is to divest itself of the entire Power Grid business to Hitachi so that it can concentrate on the remaining 70% of the business and shape it as a "leader in digital industries". The information from ABB indicates that Enterprise Value of $11 billion for 100% of Power Grids, equivalent to an EV/op. EBITA multiple of 11.2x and that they intend "to return 100% of the estimated net cash proceeds of $7.6-7.8 billion from the 80.1% sale to shareholders in an expeditious and efficient manner through share buyback or similar mechanism." Clearly the management do not feel that they need to accumulate funds from the sale. However; the sale will provide a very welcome present for the shareholders and the advisers/market-makers and analysts that have ensured that the rumours circulating over the last few years have now come to pass. The EBIT return from the ABB Power Grid business (and the former Power Products and Power Systems divisions that preceded it) over the last 11 years have returned a total of US$18,430 million - not inflation adjusted. In the long term sticking with the grid business looks like the better of the two options for the shareholders but the opposing view that a "bird in the hand is worth two in the bush" has prevailed. So what does Hitachi benefit from the purchase from ABB other than an US$11 billion business? There are a lot of fine words in press releases issued by both parties but the attraction must be the acquisition of a truly leading global business ensuring that Hitachi will be the regions number one player with global capabilities.
In the 2018 edition of our report the ABB and Hitachi figures were shown separately and were not been amalgamented. The deal was finalised in the first half of 2020 and ABB can retain a 20% share until 2023. The new entity entity is styled Hitachi ABB Grid but we have still shown the two entities separately in the section on producers in this report. In all probability this will be the last time and we fully expect to combine the two in the next edition.
Other major changes in the supply base include the re-organisation of the CG business units following the financial problems that the company faced which have affected their overseas transformer businesses; similarly the changes that have occurred to the Toshiba businesses and specifically in Brazil. On a more positive front the WEG group is most definitely in the ascendancy with acquisitions and organic growth that places them firmly on the global stage.
The World Markets for Transformers, 2020 - 2030
17
2.1 Summary Tables
Table 1
The Fastest Growing National Markets for Transformers 2015 - 2020 (US$ Thousand)
Country Market Size 2015 Market Size 2020 Cagr 2015-2020
Source: Goulden Reports and United Nations
Note: Only countries with market sizes greater than US$25 million are included in this section. Smaller markets may display significantly larger percentage changes.
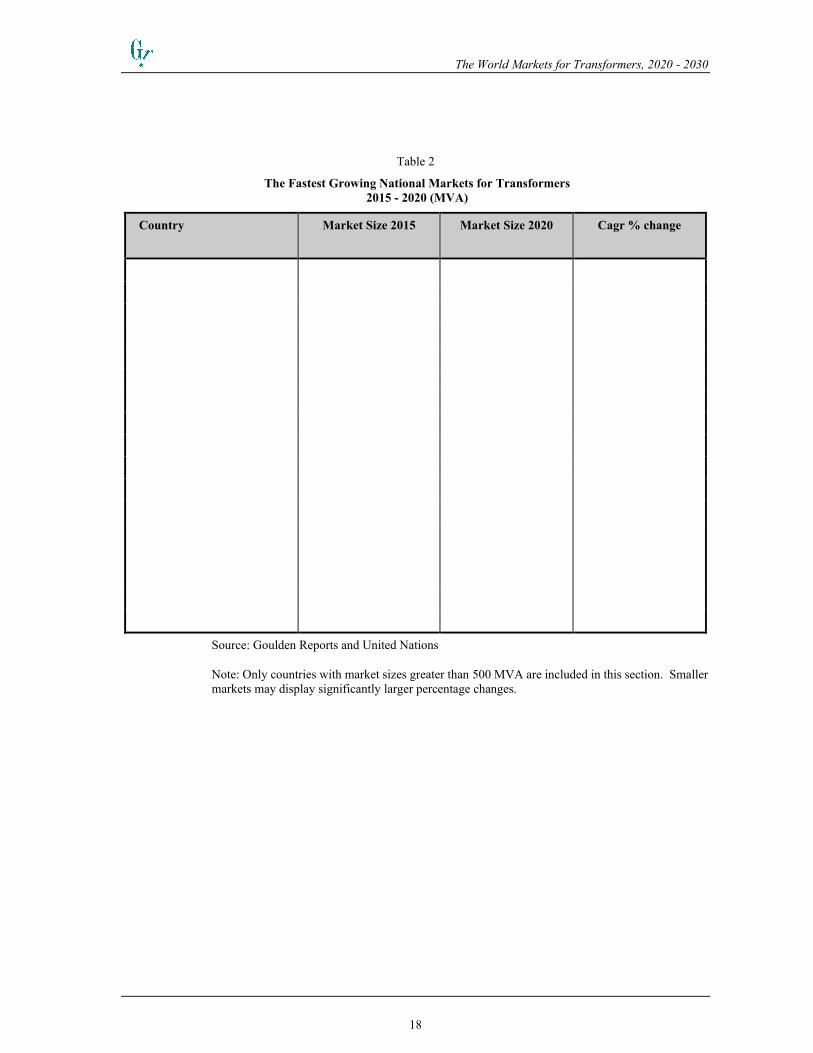
The World Markets for Transformers, 2020 - 2030
18
Table 2
The Fastest Growing National Markets for Transformers 2015 - 2020 (MVA)
Country Market Size 2015 Market Size 2020 Cagr % change
Source: Goulden Reports and United Nations
Note: Only countries with market sizes greater than 500 MVA are included in this section. Smaller markets may display significantly larger percentage changes.

The World Markets for Transformers, 2020 - 2030
19
Table 3
The Fastest Declining National Markets for Transformers 2015- 2020 (US$ Thousand)
Country Market Size 2015 Market Size 2020 Cagr 2015 - 2020
Source: Goulden Reports and United Nations
Note: Only countries with market sizes greater than US$25 million are included in this section. Smaller markets may display significantly larger percentage changes.
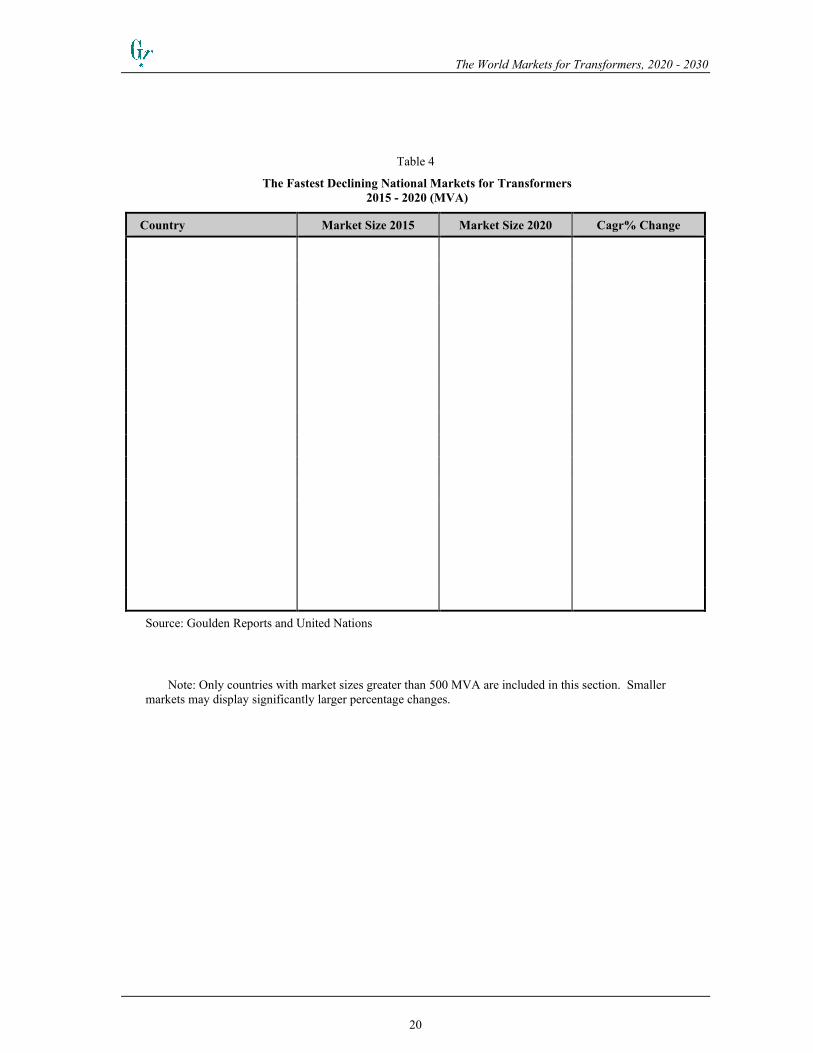
The World Markets for Transformers, 2020 - 2030
20
Table 4
The Fastest Declining National Markets for Transformers 2015 - 2020 (MVA)
Country Market Size 2015 Market Size 2020 Cagr% Change
Source: Goulden Reports and United Nations
Note: Only countries with market sizes greater than 500 MVA are included in this section. Smaller markets may display significantly larger percentage changes.
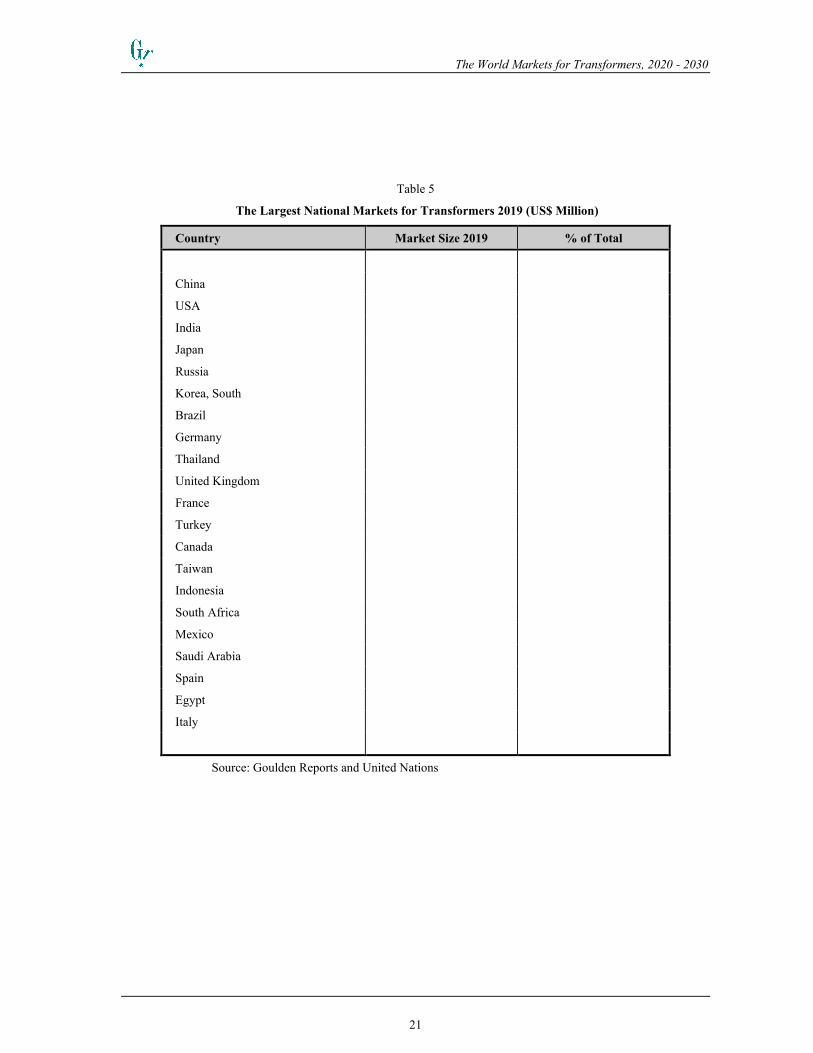
The World Markets for Transformers, 2020 - 2030
21
Table 5
The Largest National Markets for Transformers 2019 (US$ Million)
Country Market Size 2019 % of Total
China
USA
India
Japan
Russia
Korea, South
Brazil
Germany
Thailand
United Kingdom
France
Turkey
Canada
Taiwan
Indonesia
South Africa
Mexico
Saudi Arabia
Spain
Egypt
Italy
Source: Goulden Reports and United Nations

The World Markets for Transformers, 2020 - 2030
22
Table 6
The Largest National Markets for Transformers 2020 (US$ Million)
Country Market Size 2020 % of Total
China
USA
India
Japan
Korea, South
Russia
Brazil
Germany
Thailand
Turkey
Canada
France
United Kingdom
Taiwan
Indonesia
South Africa
Saudi Arabia
Egypt
Mexico
Spain
Source: Goulden Reports and United Nations

The World Markets for Transformers, 2020 - 2030
23
3. THE WORLD MARKET
Table 7
The World Market for Transformers, by Region, 2015 - 2020 (US$ Thousand)
Region 2015 2016 2017 2018 2019 2020
Western Europe
Eastern Europe
Former Soviet Union
North Africa
West Africa
Central Africa
East Africa
Southern Africa
Middle East
Indian Sub Continent
Asia
South America
Central America & Caribbean
North America
Oceania
World
Source: Goulden Reports and United Nations
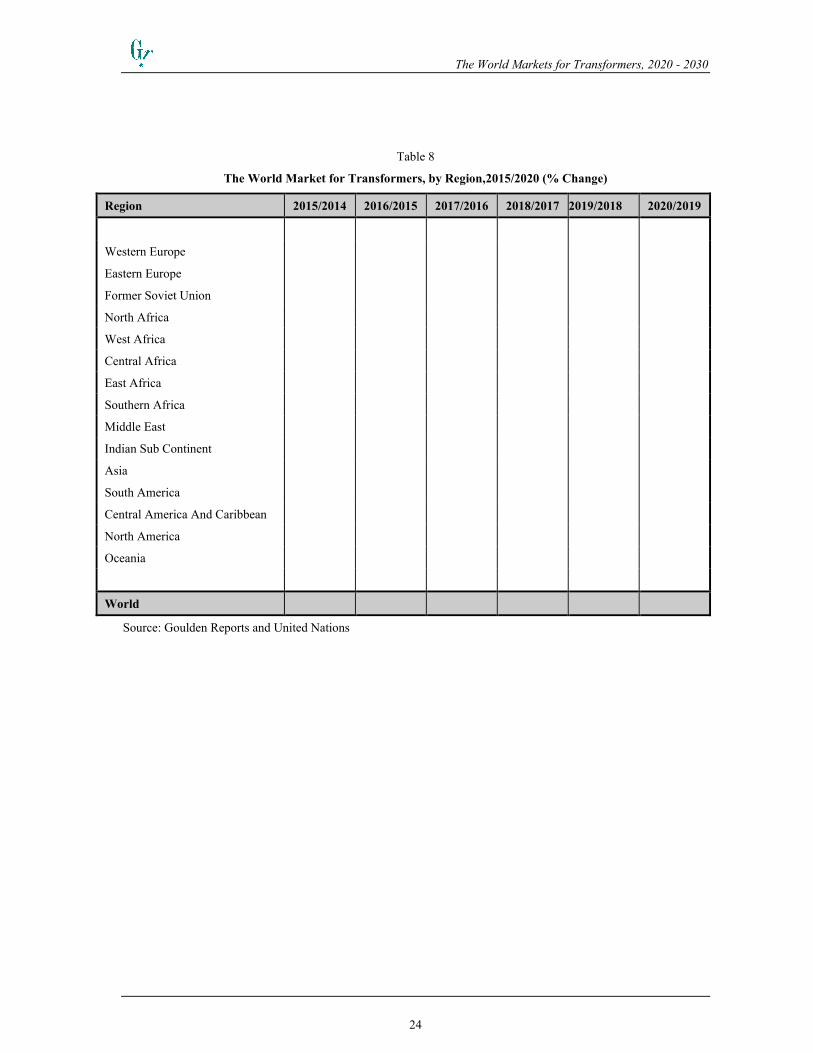
The World Markets for Transformers, 2020 - 2030
24
Table 8
The World Market for Transformers, by Region,2015/2020 (% Change)
Region 2015/2014 2016/2015 2017/2016 2018/2017 2019/2018 2020/2019
Western Europe
Eastern Europe
Former Soviet Union
North Africa
West Africa
Central Africa
East Africa
Southern Africa
Middle East
Indian Sub Continent
Asia
South America
Central America And Caribbean
North America
Oceania
World
Source: Goulden Reports and United Nations

The World Markets for Transformers, 2020 - 2030
25
Table 9
The World Market for Transformers, by Region, by Function Type 2020 (US$ Thousand)
Region Generator Transmission Distribution Of Which -
Pole Top
Total
Western Europe
Eastern Europe
Former Soviet Union
North Africa
West Africa
Central Africa
East Africa
Southern Africa
Middle East
Indian Sub Continent
Asia
South America
Central America Caribbean
North America
Oceania
World
Source: Goulden Reports and United Nations

The World Markets for Transformers, 2020 - 2030
26
Table 10
The World Market for Transformers, by Region, by Number of Units 2020 (Units)
Region Generator Transmission Distribution Of Which -
Pole Top
Total
Western Europe
Eastern Europe
Former Soviet Union
North Africa
West Africa
Central Africa
East Africa
Southern Africa
Middle East
Indian Sub Continent
Asia
South America
Central America Caribbean
North America
Oceania
World
Source: Goulden Reports and United Nations
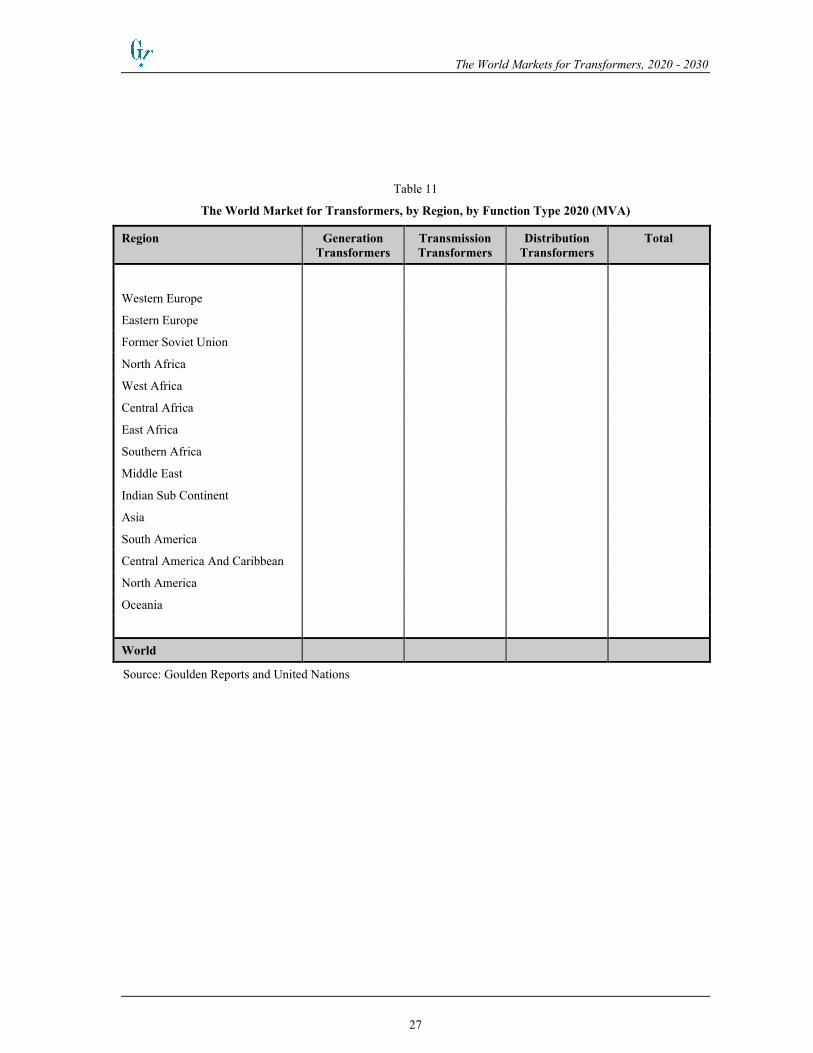
The World Markets for Transformers, 2020 - 2030
27
Table 11
The World Market for Transformers, by Region, by Function Type 2020 (MVA)
Region Generation Transformers
Transmission Transformers
Distribution Transformers
Total
Western Europe
Eastern Europe
Former Soviet Union
North Africa
West Africa
Central Africa
East Africa
Southern Africa
Middle East
Indian Sub Continent
Asia
South America
Central America And Caribbean
North America
Oceania
World
Source: Goulden Reports and United Nations

The World Markets for Transformers, 2020 - 2030
28
Table 12
The World Market for Transformers, by Region, by Insulation Type 2020 (US$ Thousand)
Region Oil Filled Safety Fluid Cast Resin & Dry Types
Total
Western Europe
Eastern Europe
Former Soviet Union
North Africa
West Africa
Central Africa
East Africa
Southern Africa
Middle East
Indian Sub Continent
Asia
South America
Central America And Caribbean
North America
Oceania
World
Source: Goulden Reports and United Nations
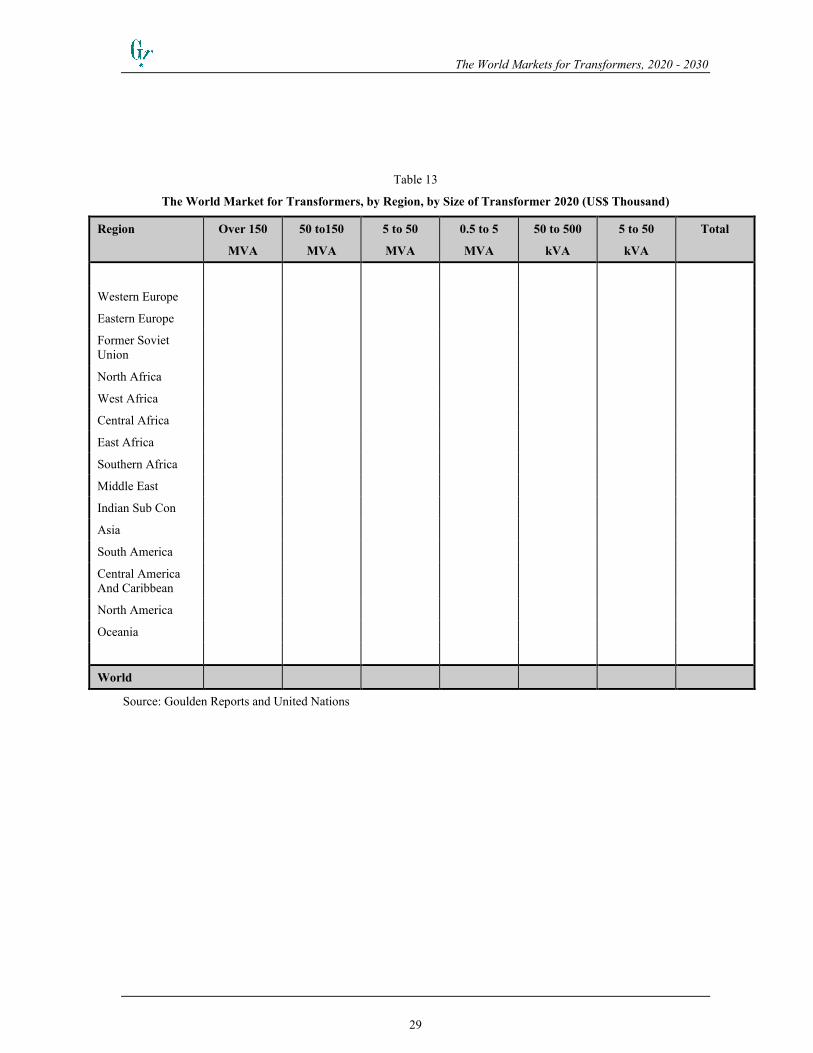
The World Markets for Transformers, 2020 - 2030
29
Table 13
The World Market for Transformers, by Region, by Size of Transformer 2020 (US$ Thousand)
Region Over 150
MVA
50 to150
MVA
5 to 50
MVA
0.5 to 5
MVA
50 to 500
kVA
5 to 50
kVA
Total
Western Europe
Eastern Europe
Former Soviet Union
North Africa
West Africa
Central Africa
East Africa
Southern Africa
Middle East
Indian Sub Con
Asia
South America
Central America And Caribbean
North America
Oceania
World
Source: Goulden Reports and United Nations
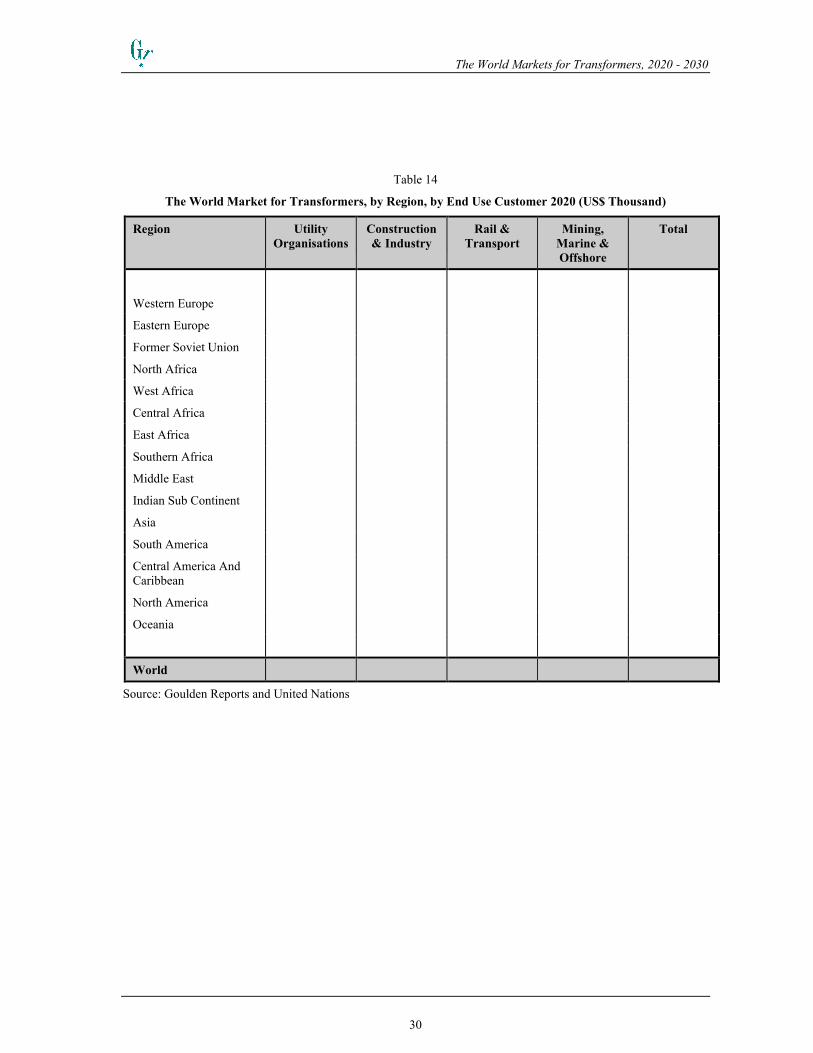
The World Markets for Transformers, 2020 - 2030
30
Table 14
The World Market for Transformers, by Region, by End Use Customer 2020 (US$ Thousand)
Region Utility Organisations
Construction & Industry
Rail & Transport
Mining, Marine & Offshore
Total
Western Europe
Eastern Europe
Former Soviet Union
North Africa
West Africa
Central Africa
East Africa
Southern Africa
Middle East
Indian Sub Continent
Asia
South America
Central America And Caribbean
North America
Oceania
World
Source: Goulden Reports and United Nations
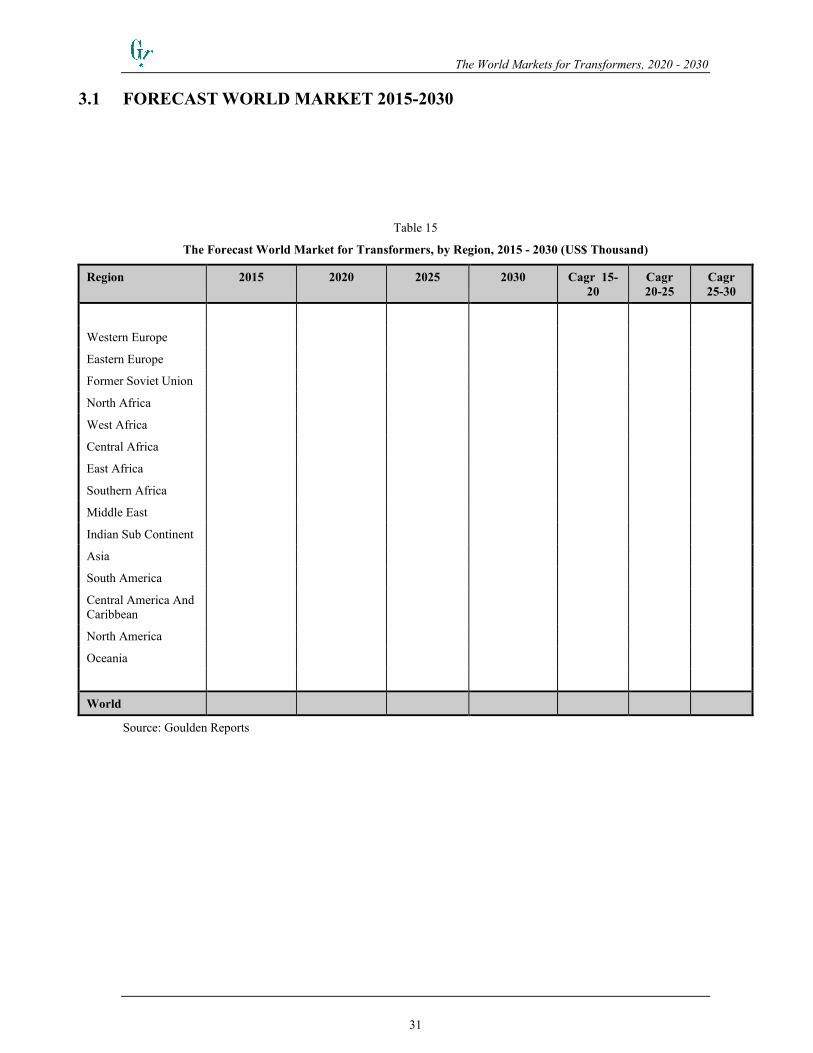
The World Markets for Transformers, 2020 - 2030
31
3.1 FORECAST WORLD MARKET 2015-2030
Table 15
The Forecast World Market for Transformers, by Region, 2015 - 2030 (US$ Thousand)
Region 2015 2020 2025 2030 Cagr 15-20
Cagr 20-25
Cagr 25-30
Western Europe
Eastern Europe
Former Soviet Union
North Africa
West Africa
Central Africa
East Africa
Southern Africa
Middle East
Indian Sub Continent
Asia
South America
Central America And Caribbean
North America
Oceania
World
Source: Goulden Reports

The World Markets for Transformers, 2020 - 2030
32
Table 16
The Forecast World Market for Transformers, by Region, 2015 - 2030 (MVA Demand)
Region 2015 2020 2025 2030 Cagr 15-20
Cagr 20-25
Cagr 25-30
Western Europe
Eastern Europe
Former Soviet Union
North Africa
West Africa
Central Africa
East Africa
Southern Africa
Middle East
Indian Sub Continent
Asia
South America
Central America and Caribbean
North America
Oceania
World
Source: Goulden Reports
The World Markets for Transformers, 2020 - 2030
33
4. THE WORLD’S MAJOR TRANSFORMER MANUFACTURERS This table has been compiled from published sources and are designed to serve only as a general overview. See notes in Summary section for comments on ABB sale of Grid Business to Hitachi
Table 17
Leading Manufacturers’ Sales of Transformers 2020 (US$ Thousand)
Company Country Transformer Sales 2020 Estimated World Market Share %
Total 41,316.0 100.00%
Source: Goulden Reports
The World Markets for Transformers, 2020 - 2030
34
Table 18
Leading Manufacturers’ Sales of Transformers, per Region, 2020 (US$ Million)
Company Western Europe Eastern Europe & Former USSR
Africa Middle East
continued...

The World Markets for Transformers, 2020 - 2030
35
Table 19
Leading Manufacturers’ Sales of Transformers, per Region, 2020 (US$ Million) - continued
Company Asia-Pacific North America South & Cen'l America & Caribbean
Total
Source: Goulden Reports
The World Markets for Transformers, 2020 - 2030
36
Table 20
Leading Manufacturers’ Sales of Power Transformers 2020 (US$ Thousand)
Company Western Europe Eastern Europe & Former
USSR
Africa Middle East
Source: Goulden Reports

The World Markets for Transformers, 2020 - 2030
37
Company Asia-Pacific North America South & Cen'l America & Caribbean
Total
Source: Goulden Reports

The World Markets for Transformers, 2020 - 2030
38
Table 21
Leading Manufacturers’ Sales of Distribution Transformers 2020 (US$ Thousand)
Company Western Europe Eastern Europe & Former USSR
Africa Middle East
Source: Goulden Reports

The World Markets for Transformers, 2020 - 2030
39
Company Asia-Pacific North America South & Cen'l America & Caribbean
Total
Source: Goulden Reports

The World Markets for Transformers, 2020 - 2030
40
4.1 TRANSFORMER INDUSTRY CONTACT DETAILS
4.1.1 ABB
4.1.2 ZTR
--OOOOOOOO--

The World Markets for Transformers, 2020 - 2030
41
5. REGIONAL MARKETS
5.1 WESTERN EUROPE
Table 22
Western Europe: The Market for Transformers, by Country, 2015 - 2020 (US$ Thousand)
Country 2015 2016 2017 2018 2019 2020
Austria
Belgium
Cyprus
Denmark
Finland
France
Germany
Greece
Iceland
Ireland
Italy
Luxembourg
Malta
Netherlands
Norway
Portugal
Spain
Sweden
Switzerland
United Kingdom
Total
Source: Goulden Reports and United Nations
The World Markets for Transformers, 2020 - 2030
42
Table 23
Western Europe: The Market for Transformers, by Country, 2015 - 2020 (% Change)
Country 2015/2014 2016/2015 2017/2016 2018/2017 2019/2018 2020/2019
Austria
Belgium
Cyprus
Denmark
Finland
France
Germany
Greece
Iceland
Ireland
Italy
Luxembourg
Malta
Netherlands
Norway
Portugal
Spain
Sweden
Switzerland
United Kingdom
Total
Source: Goulden Reports and United Nations
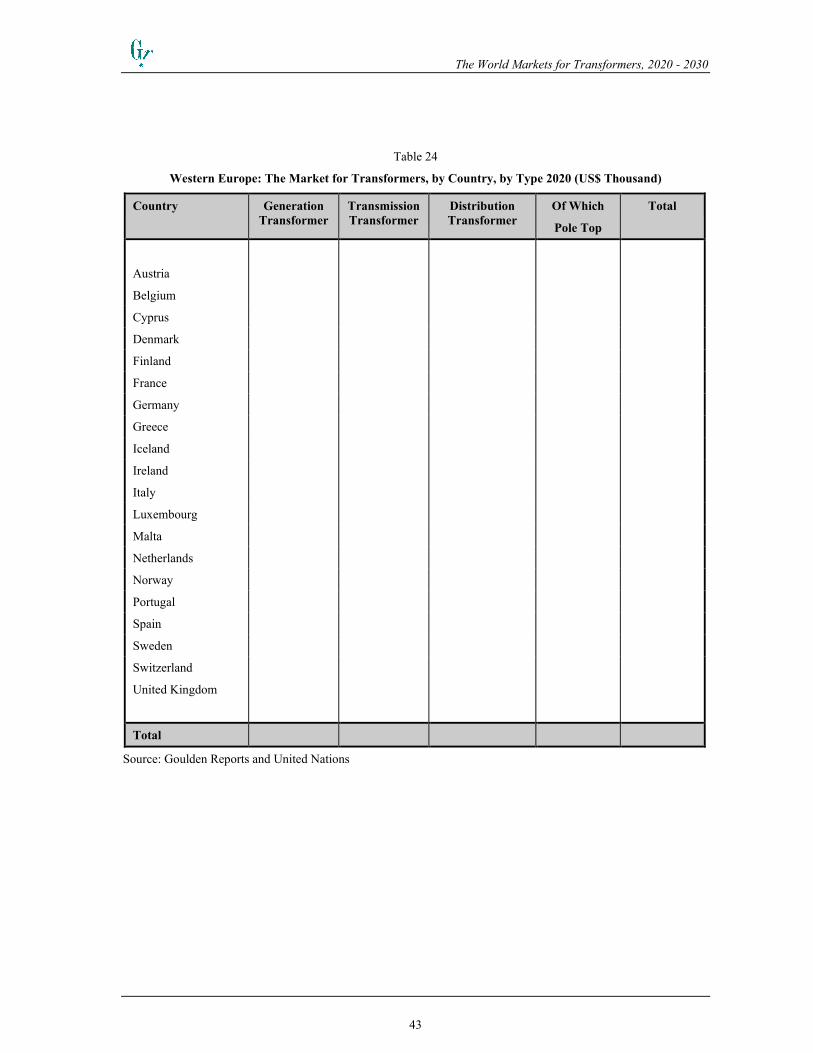
The World Markets for Transformers, 2020 - 2030
43
Table 24
Western Europe: The Market for Transformers, by Country, by Type 2020 (US$ Thousand)
Country Generation Transformer
Transmission Transformer
Distribution Transformer
Of Which
Pole Top
Total
Austria
Belgium
Cyprus
Denmark
Finland
France
Germany
Greece
Iceland
Ireland
Italy
Luxembourg
Malta
Netherlands
Norway
Portugal
Spain
Sweden
Switzerland
United Kingdom
Total
Source: Goulden Reports and United Nations
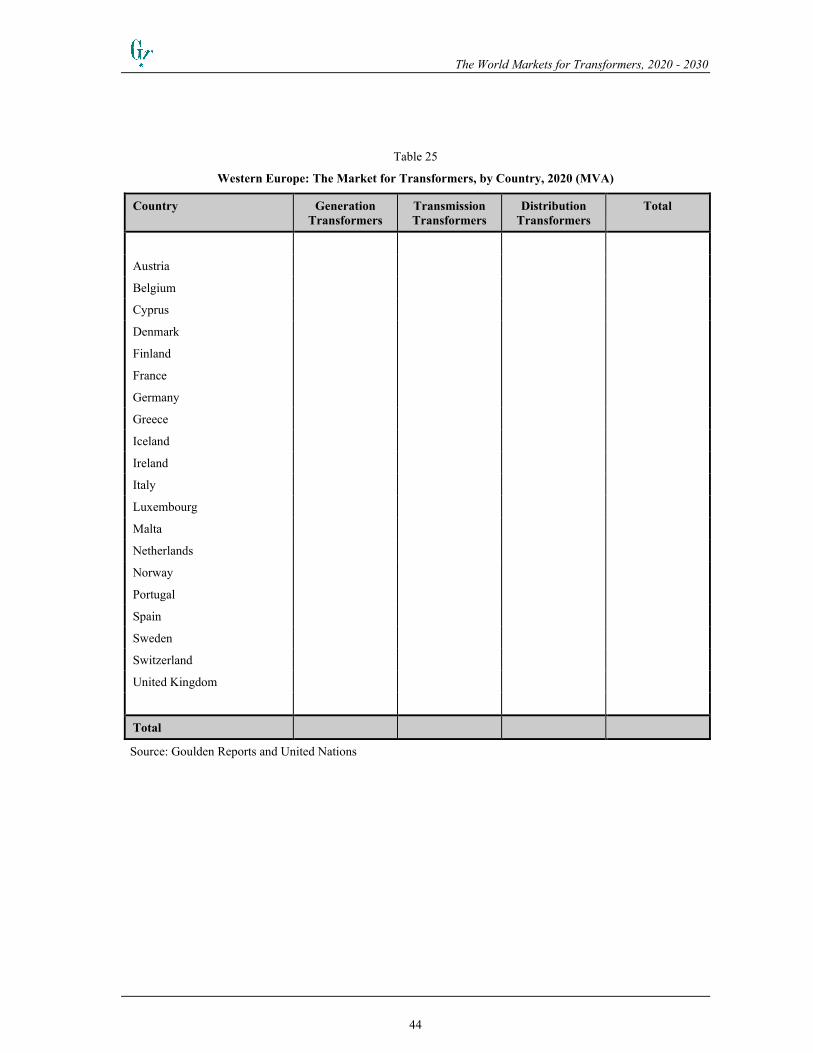
The World Markets for Transformers, 2020 - 2030
44
Table 25
Western Europe: The Market for Transformers, by Country, 2020 (MVA)
Country Generation Transformers
Transmission Transformers
Distribution Transformers
Total
Austria
Belgium
Cyprus
Denmark
Finland
France
Germany
Greece
Iceland
Ireland
Italy
Luxembourg
Malta
Netherlands
Norway
Portugal
Spain
Sweden
Switzerland
United Kingdom
Total
Source: Goulden Reports and United Nations

The World Markets for Transformers, 2020 - 2030
45
Table 26
Western Europe: The Market for Transformers, by Country, by Insulation 2020 (US$ Thousand)
Country Oil Filled Safety Fluid Cast Resin & Dry Types
Total
Austria
Belgium
Cyprus
Denmark
Finland
France
Germany
Greece
Iceland
Ireland
Italy
Luxembourg
Malta
Netherlands
Norway
Portugal
Spain
Sweden
Switzerland
United Kingdom
Total
Source: Goulden Reports and United Nations

The World Markets for Transformers, 2020 - 2030
46
Table 27
Western Europe: The Market for Transformers, by Country, by Size of Transformer 2020 (US$ Million)
Country Over 150
MVA
50 to150
MVA
5 to 50
MVA
0.5 to 5
MVA
50 to 500
kVA
5 to 50
kVA
Austria
Belgium
Cyprus
Denmark
Finland
France
Germany
Greece
Iceland
Ireland
Italy
Luxembourg
Malta
Netherlands
Norway
Portugal
Spain
Sweden
Switzerland
United Kingdom
Total
Source: Goulden Reports and United Nations

The World Markets for Transformers, 2020 - 2030
47
Table 28
Western Europe: The Market for Transformers, by Country, by End Use Customer 2020 (US$ Thousand)
Country Utility Organisations
Construction & Industry
Rail & Transport
Mining, Marine & Offshore
Total
Austria
Belgium
Cyprus
Denmark
Finland
France
Germany
Greece
Iceland
Ireland
Italy
Luxembourg
Malta
Netherlands
Norway
Portugal
Spain
Sweden
Switzerland
United Kingdom
Total
Source: Goulden Reports and United Nations

The World Markets for Transformers, 2020 - 2030
48
Table 29
Western Europe: The Market for Transformers, by Country, 2015 - 2030 (US$ Thousand)
Country 2015 2020 2025 2030 Cagr 15-20
Cagr 20-25
Cagr 25-30
Austria
Belgium
Cyprus
Denmark
Finland
France
Germany
Greece
Iceland
Ireland
Italy
Luxembourg
Malta
Netherlands
Norway
Portugal
Spain
Sweden
Switzerland
United Kingdom
Total
Source: Goulden Reports and United Nations
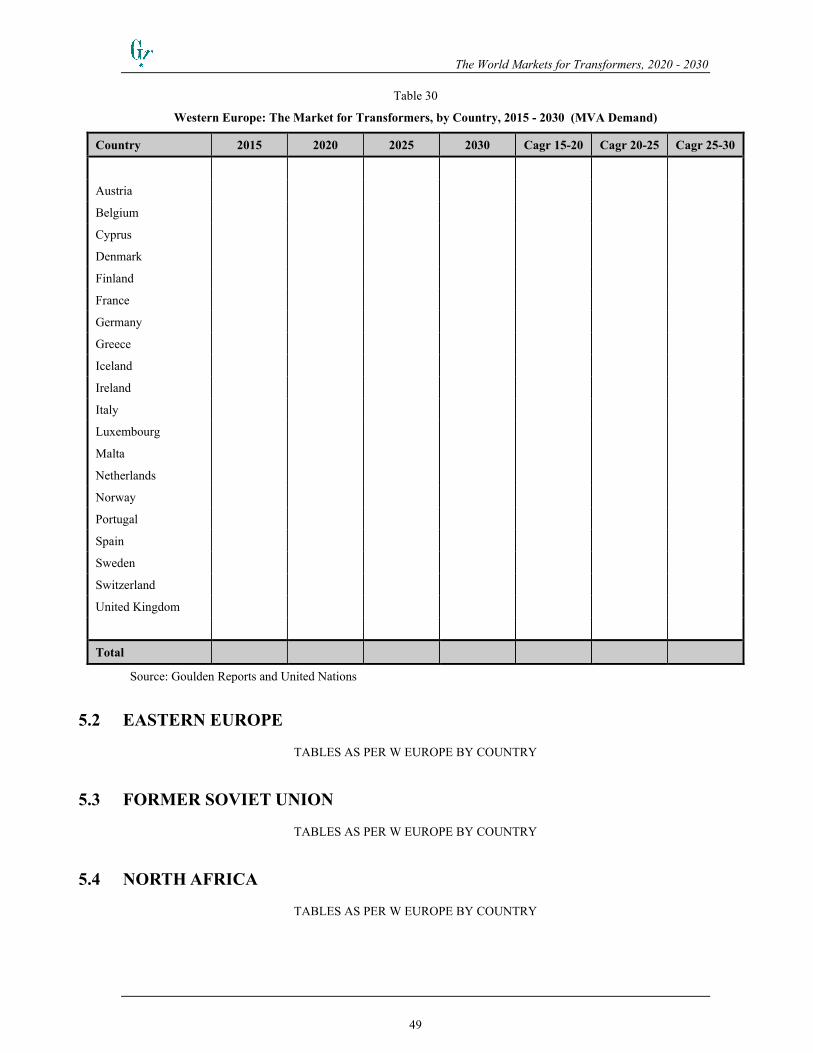
The World Markets for Transformers, 2020 - 2030
49
Table 30
Western Europe: The Market for Transformers, by Country, 2015 - 2030 (MVA Demand)
Country 2015 2020 2025 2030 Cagr 15-20 Cagr 20-25 Cagr 25-30
Austria
Belgium
Cyprus
Denmark
Finland
France
Germany
Greece
Iceland
Ireland
Italy
Luxembourg
Malta
Netherlands
Norway
Portugal
Spain
Sweden
Switzerland
United Kingdom
Total
Source: Goulden Reports and United Nations
5.2 EASTERN EUROPE
TABLES AS PER W EUROPE BY COUNTRY
5.3 FORMER SOVIET UNION
TABLES AS PER W EUROPE BY COUNTRY
5.4 NORTH AFRICA
TABLES AS PER W EUROPE BY COUNTRY
The World Markets for Transformers, 2020 - 2030
50
5.5 WEST AFRICA
TABLES AS PER W EUROPE BY COUNTRY
5.6 CENTRAL AFRICA
TABLES AS PER W EUROPE BY COUNTRY
5.7 EAST AFRICA
TABLES AS PER W EUROPE BY COUNTRY
5.8 SOUTHERN AFRICA
TABLES AS PER W EUROPE BY COUNTRY
5.9 MIDDLE EAST
TABLES AS PER W EUROPE BY COUNTRY
5.10 INDIAN SUB CONTINENT
TABLES AS PER W EUROPE BY COUNTRY
5.11 ASIA
TABLES AS PER W EUROPE BY COUNTRY
5.12 SOUTH AMERICA
TABLES AS PER W EUROPE BY COUNTRY
5.13 CENTRAL AMERICA AND CARIBBEAN
TABLES AS PER W EUROPE BY COUNTRY
5.14 NORTH AMERICA
TABLES AS PER W EUROPE BY COUNTRY
5.15 OCEANIA
TABLES AS PER W EUROPE BY COUNTRY

The World Markets for Transformers, 2020 - 2030
51
6. PRODUCTION Table 31
The Top 35 Producers of Transformers, 2020 (US$ Million)
Country Rank Previous Rank Production % share
China 1
USA 2
3
4
5
6
7
8
9
10
11
12
13
14
15
16
17
18
19
20
21
22
23
24
25
26
27
28
29
30
31
32
33
34
35
Others
Total 40,927.2 100.0%
Source: Goulden Reports and United Nations

The World Markets for Transformers, 2020 - 2030
52
7. TRADE ANALYSIS
7.1 TOP 25 EXPORTERS Table 32
The Top 25 Exporters of Power & Distribution Transformers, 2017 to 2019 (US$ Thousands)
Country 2017 2018 2019 % Total 2019
Source: Goulden Reports and United Nations

The World Markets for Transformers, 2020 - 2030
53
Table 33
The Top 25 Exporters of Transformers up to 650kVA 2017 to 2019 (US$ Thousands)
Country 2017 2018 2019 % Total 2019
Source: Goulden Reports and United Nations
Table 34
The Top 25 Exporters ofTransformers, 650-10,000kVA 2017 to 2019 (US$ Thousands)
Country 2017 2018 2019 % Total 2019
Source: Goulden Reports and United Nations
Table 35
The Top 25 Exporters of Transformers,over 10,000kVA 2017 to 2019 (US$ Thousands)
Country 2017 2018 2019 % Total 2019
Source: Goulden Reports and United Nations
Table 36
The Top 25 Exporters of Dry Transformers,up to 500kVA 2017 to 2019 (US$ Thousands)
Country 2017 2018 2019 % Total 2019
Source: Goulden Reports and United Nations
Table 37
The Top 25 Exporters of Dry Transformers over 500kVA 2017 to 2019 (US$ Thousands)
Country 2017 2018 2019 % Total 2019
Source: Goulden Reports and United Nations
The World Markets for Transformers, 2020 - 2030
54
7.2 TOP 25 IMPORTERS
Table 38
The Top 25 Importers of Power & Distribution Transformers, 2017 to 2019 (US$ Thousands)
Country 2017 2018 2019 % Total 2019
USA
Germany
Other
Total
Source: Goulden Reports and United Nations
The World Markets for Transformers, 2020 - 2030
55
Table 39
The Top 25 Importers of Transformers up to 650kVA 2017 to 2019 (US$ Thousands)
Country 2017 2018 2019 % Total 2019
Source: Goulden Reports and United Nations
Table 40
The Top 25 Importers of Transformers 650-10,000kVA 2017 to 2019 (US$ Thousands)
Country 2017 2018 2019 % Total 2019
Source: Goulden Reports and United Nations
Table 41
The Top 25 Importers of Transformers over 10,000kVA 2017 to 2019 (US$ Thousands)
Country 2017 2018 2019 % Total 2019
Source: Goulden Reports and United Nations
Table 42
The Top 25 Importers of Dry Transformers up to 500kVA 2017 to 2019 (US$ Thousands)
Country 2017 2018 2019 % Total 2019
Source: Goulden Reports and United Nations
Table 43
The Top 25 Importers of Dry Transformers Over 500kVA 2017 to 2019 (US$ Thousands)
Country 2017 2018 2019 % Total 2019
Source: Goulden Reports and United Nations

The World Markets for Transformers, 2020 - 2030
56
7.3 EXPORT VALUES
Table 44
The Top 25 Exporters of Transformers to Principal Destinations, Austria-Canada, 2019 (US$ Thousand)
Austria Brazil Canada
USA 154,267.3 Chile 33,936.0 USA 258,337.2
Others 4,677.0 Others 834.5 Others 299.4
Total Total Total
Source: Goulden Reports and United Nations
The World Markets for Transformers, 2020 - 2030
57
Table 45
The Top 25 Exporters of Transformers to Principal Destinations, China-Denmark, 2019 (US$ Thousand)
China Croatia Denmark
Source: Goulden Reports and United Nations
Table 46
The Top 25 Exporters of Transformers to Principal Destinations, France-Hungary 2019 (US$ Thousand)
France Germany Hungary
Source: Goulden Reports and United Nations
Table 47
The Top 25 Exporters of Transformers to Principal Destinations, India-Japan 2019 (US$ Thousand)
India Italy Japan
Source: Goulden Reports and United Nations
Table 48
The Top 25 Exporters of Transformers to Principal Destinations, Mexico-Taiwan, 2019 (US$ Thousand)
Mexico Netherlands Taiwan
Source: Goulden Reports and United Nations
Table 49
The Top 25 Exporters of Transformers to Principal Destinations, Poland-Rep. Korea 2019 (US$ Thousand)
Poland Portugal Rep Korea
Source: Goulden Reports and United Nations
The World Markets for Transformers, 2020 - 2030
58
Table 50
The Top 25 Exporters of Transformers to Principal Destinations, Slovenia-Sweden 2019 (US$ Thousand)
Slovenia Spain Sweden
Source: Goulden Reports and United Nations
Table 51
The Top 25 Exporters of Transformers to Principal Destinations, Switzerland -Thailand 2019 (US$ Thousand)
Switzerland Thailand
Source: Goulden Reports and United Nations
Table 52
The Top 25 Exporters of Transformers to Principal Destinations, Turkey-USA, 2019 (US$ Thousand)
Turkey USA
Source: Goulden Reports and United Nations

The World Markets for Transformers, 2020 - 2030
59
7.4 EXPORT PERCENTAGES
Table 53
The Top 25 Exporters of Transformers to Principal Destinations, Austria-Canada, 2019 (%)
Austria Brazil Canada
USA Chile USA
Germany USA Netherlands
Denmark Argentina Jamaica
United Kingdom Bolivia Cayman Isds
Switzerland Colombia Saudi Arabia
Canada Peru Mongolia
France Dominican Rep. Ecuador
Croatia Paraguay Brazil
Sri Lanka Germany China
South Africa Uruguay Indonesia
Azerbaijan Russia France
UAE Ecuador Libya
Iraq Nicaragua Taiwan
India Philippines Rep. of Korea
Sweden Malaysia Burkina Faso
China Algeria Thailand
Ireland Guatemala Poland
Viet Nam Mexico Guyana
Turkey France Australia
Netherlands South Africa India
Pakistan Norway Barbados
Greenland Suriname Dominican Rep.
Hungary Morocco Belgium
Mongolia Bahrain Japan
Belgium Oman Finland
Others Others Others
Total 100.00% Total 100.00% Total 100.00%
Source: Goulden Reports and United Nations

The World Markets for Transformers, 2020 - 2030
60
Table 54
The Top 25 Exporters of Transformers to Principal Destinations, China-Denmark, 2019 (%)
China Croatia Denmark
Total 100.00% Total 100.00% Total 100.00%
Source: Goulden Reports and United Nations
Table 55
The Top 25 Exporters of Transformers to Principal Destinations, France-Hungary 2019 (%)
France Germany Hungary
Total 100.00% Total 100.00% Total 100.00%
Source: Goulden Reports and United Nations
Table 56
The Top 25 Exporters of Transformers to Principal Destinations, India-Japan 2019 (%)
India Italy Japan
Total 100.00% Total 100.00% Total 100.00%
Source: Goulden Reports and United Nations
Table 57
The Top 25 Exporters of Transformers to Principal Destinations, Mexico-Taiwan, 2019 (%)
Mexico Netherlands Taiwan
Total 100.00% Total 100.00% Total 100.00%
Source: Goulden Reports and United Nations
Table 58
The Top 25 Exporters of Transformers to Principal Destinations, Poland-Rep. Korea 2019 (%)
Poland Portugal Rep Korea
Total 100.00% Total 100.00% Total 100.00%
Source: Goulden Reports and United Nations

The World Markets for Transformers, 2020 - 2030
61
Table 59
The Top 25 Exporters of Transformers to Principal Destinations, Slovenia-Sweden 2019 (%)
Slovenia Spain Sweden
Total 100.00% Total 100.00% Total 100.00%
Source: Goulden Reports and United Nations
Table 60
The Top 25 Exporters of Transformers to Principal Destinations, Switzerland -Thailand 2019 (%)
Switzerland Thailand
Total 100.00% Total 100.00%
Source: Goulden Reports and United Nations
Table 61
The Top 25 Exporters of Transformers to Principal Destinations, Turkey-USA, 2019 (%)
Turkey USA
Total 100.00% Total 100.00%
Source: Goulden Reports and United Nations
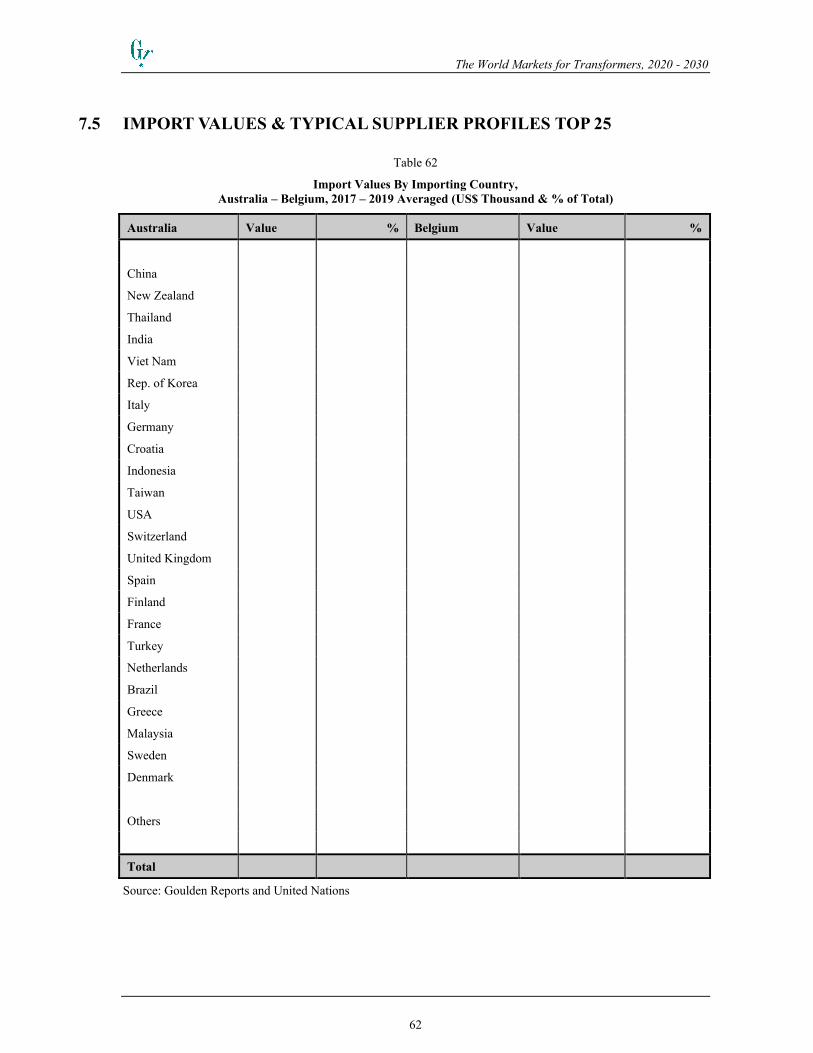
The World Markets for Transformers, 2020 - 2030
62
7.5 IMPORT VALUES & TYPICAL SUPPLIER PROFILES TOP 25
Table 62
Import Values By Importing Country, Australia – Belgium, 2017 – 2019 Averaged (US$ Thousand & % of Total)
Australia Value % Belgium Value %
China
New Zealand
Thailand
India
Viet Nam
Rep. of Korea
Italy
Germany
Croatia
Indonesia
Taiwan
USA
Switzerland
United Kingdom
Spain
Finland
France
Turkey
Netherlands
Brazil
Greece
Malaysia
Sweden
Denmark
Others
Total
Source: Goulden Reports and United Nations

The World Markets for Transformers, 2020 - 2030
63
Table 63
Import Values By Importing Country, Canada - China, 2017 – 2019 Averaged (US$ Thousand & % Total)
Canada Value % China Value %
Total
Source: Goulden Reports and United Nations
Table 64
Import Values By Importing Country, Denmark - Egypt, 2017 – 2019 Averaged (US$ Thousand & % Total)
Denmark Value % Egypt Value %
Total
Source: Goulden Reports and United Nations
Table 65
Import Values By Importing Country, France- Germany, 2017 – 2019 Averaged (US$ Thousand & % Total)
France Value % Germany Value %
Total
Source: Goulden Reports and United Nations
Table 66
Import Values By Importing Country Indonesia-Italy 2017 – 2019 Averaged (US$ Thousand & % Total)
Indonesia Value % Italy Value %
Total
Source: Goulden Reports and United Nations
Table 67
Import Values By Importing Country, Japan-Malaysia, 2017 – 2019 Averaged (US$ Thousand & % Total)
Japan Value % Malaysia Value %
Total
Source: Goulden Reports and United Nations
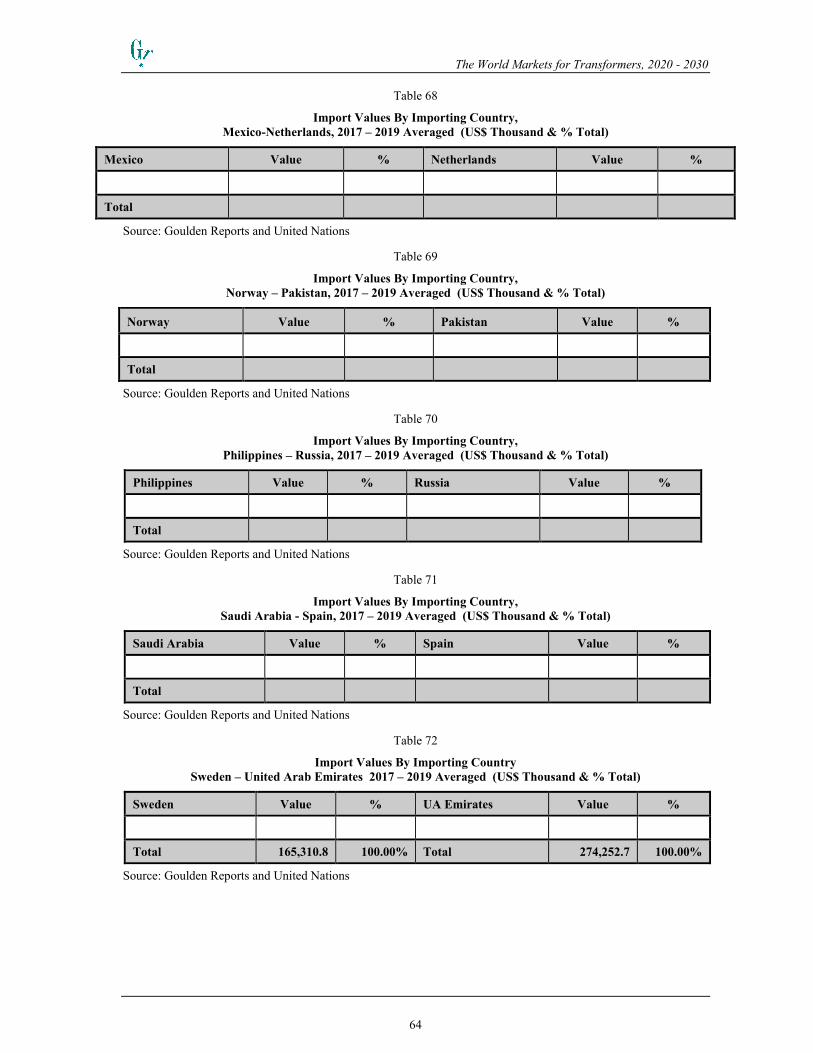
The World Markets for Transformers, 2020 - 2030
64
Table 68
Import Values By Importing Country, Mexico-Netherlands, 2017 – 2019 Averaged (US$ Thousand & % Total)
Mexico Value % Netherlands Value %
Total
Source: Goulden Reports and United Nations
Table 69
Import Values By Importing Country, Norway – Pakistan, 2017 – 2019 Averaged (US$ Thousand & % Total)
Norway Value % Pakistan Value %
Total
Source: Goulden Reports and United Nations
Table 70
Import Values By Importing Country, Philippines – Russia, 2017 – 2019 Averaged (US$ Thousand & % Total)
Philippines Value % Russia Value %
Total
Source: Goulden Reports and United Nations
Table 71
Import Values By Importing Country, Saudi Arabia - Spain, 2017 – 2019 Averaged (US$ Thousand & % Total)
Saudi Arabia Value % Spain Value %
Total
Source: Goulden Reports and United Nations
Table 72
Import Values By Importing Country Sweden – United Arab Emirates 2017 – 2019 Averaged (US$ Thousand & % Total)
Sweden Value % UA Emirates Value %
Total 165,310.8 100.00% Total 274,252.7 100.00%
Source: Goulden Reports and United Nations
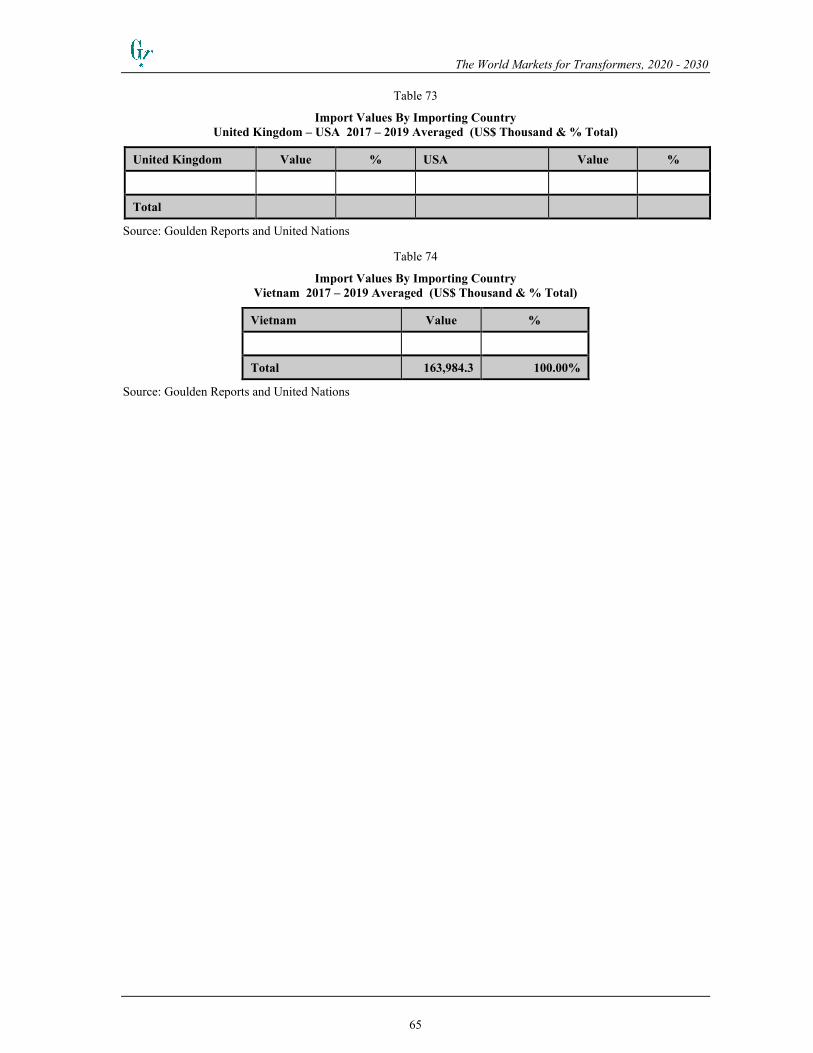
The World Markets for Transformers, 2020 - 2030
65
Table 73
Import Values By Importing Country United Kingdom – USA 2017 – 2019 Averaged (US$ Thousand & % Total)
United Kingdom Value % USA Value %
Total
Source: Goulden Reports and United Nations
Table 74
Import Values By Importing Country Vietnam 2017 – 2019 Averaged (US$ Thousand & % Total)
Vietnam Value %
Total 163,984.3 100.00%
Source: Goulden Reports and United Nations

The World Markets for Transformers, 2020 - 2030
66
8. TRADE IN TRANSFORMER PARTS
Table 75
Exports of Transformer Parts, by Country, 2015 to 2019 (US$ Million)
Country 2015 2016 2017 2018 2019 Cagr 15-19
China
China, Hong Kong
Germany
USA
Rep. of Korea
Italy
Japan
Viet Nam
Mexico
India
Sweden
France
Canada
Austria
Singapore
Poland
Slovakia
Turkey
Hungary
Netherlands
Switzerland
Taiwan
Czechia
Finland
U Arab Emirates
Thailand
Malaysia
Others
Total
Source: Goulden Reports and United Nations

The World Markets for Transformers, 2020 - 2030
67
Table 76
Imports of Transformer Parts, by Country, 2015 to 2019 (US$ Million)
Country 2015 2016 2017 2018 2019 Cagr 15-19
China, Hong Kong
USA
China
Germany
India
Mexico
Singapore
United Kingdom
Italy
Japan
France
Rep. of Korea
Netherlands
Taiwan
Austria
Poland
Finland
Viet Nam
Hungary
Canada
Switzerland
Pakistan
Czechia
Slovakia
Malaysia
Spain
Indonesia
Others
Total
Source: Goulden Reports and United Nations

The World Markets for Transformers, 2020 - 2030
68
8.1 Top 15 Exporters of Transformer Parts by Destination 2016 to 2019
Table 77
Exports of Transformer Parts from Austria by Country, 2016 to 2019 (US$ Thousand)
Destination
2016
2017
2018
2019
% of Total 2019
Germany 35.76%
USA 27.77%
Romania 6.95%
Czechia 3.41%
China 3.33%
Italy 2.77%
Serbia 2.24%
Canada 1.73%
Switzerland 1.71%
Hungary 1.65%
Belgium 1.26%
Netherlands 1.11%
United Kingdom 0.93%
India 0.62%
Poland 0.61%
France 0.59%
Slovenia 0.58%
Sri Lanka 0.56%
Bosnia Herzegovina 0.53%
South Africa 0.48%
Australia 0.44%
Croatia 0.42%
UA Emirates 0.37%
Azerbaijan 0.36%
Brazil 0.29%
Slovakia 0.26%
Others 3.26%
Total 100.00%
Source: Goulden Reports and United Nations
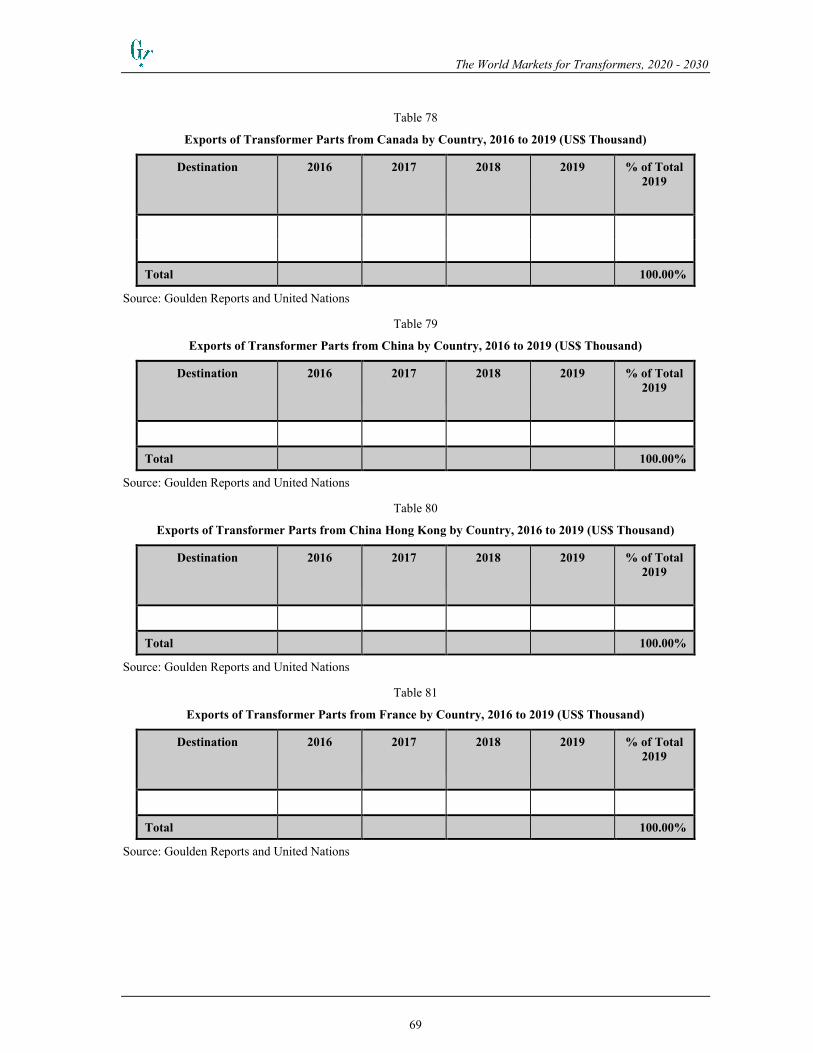
The World Markets for Transformers, 2020 - 2030
69
Table 78
Exports of Transformer Parts from Canada by Country, 2016 to 2019 (US$ Thousand)
Destination
2016
2017
2018
2019
% of Total 2019
Total 100.00%
Source: Goulden Reports and United Nations
Table 79
Exports of Transformer Parts from China by Country, 2016 to 2019 (US$ Thousand)
Destination
2016
2017
2018
2019
% of Total 2019
Total 100.00%
Source: Goulden Reports and United Nations
Table 80
Exports of Transformer Parts from China Hong Kong by Country, 2016 to 2019 (US$ Thousand)
Destination
2016
2017
2018
2019
% of Total 2019
Total 100.00%
Source: Goulden Reports and United Nations
Table 81
Exports of Transformer Parts from France by Country, 2016 to 2019 (US$ Thousand)
Destination
2016
2017
2018
2019
% of Total 2019
Total 100.00%
Source: Goulden Reports and United Nations
The World Markets for Transformers, 2020 - 2030
70
Table 82
Exports of Transformer Parts from Germany by Country, 2016 to 2019 (US$ Thousand)
Destination
2016
2017
2018
2019
% of Total 2019
Total 100.00%
Source: Goulden Reports and United Nations
Table 83
Exports of Transformer Parts from India by Country, 2016 to 2019 (US$ Thousand)
Destination
2016
2017
2018
2019
% of Total 2019
Total 100.00%
Source: Goulden Reports and United Nations
Table 84
Exports of Transformer Parts from Italy by Country, 2016 to 2019 (US$ Thousand)
Destination
2016
2017
2018
2019
% of Total 2019
Total 100.00%
Source: Goulden Reports and United Nations
Table 85
Exports of Transformer Parts from Japan by Country, 2016 to 2019 (US$ Thousand)
Destination
2016
2017
2018
2019
% of Total 2019
Total 100.00%
Source: Goulden Reports and United Nations
Table 86
Exports of Transformer Parts from Mexico by Country, 2016 to 2019 (US$ Thousand)
Destination
2016
2017
2018
2019
% of Total 2019
Total 100.00%
Source: Goulden Reports and United Nations

The World Markets for Transformers, 2020 - 2030
71
Table 87
Exports of Transformer Parts from South Korea by Country, 2016 to 2019 (US$ Thousand)
Destination
2016
2017
2018
2019
% of Total 2019
Total 100.00%
Source: Goulden Reports and United Nations
Table 88
Exports of Transformer Parts from Singapore by Country, 2016 to 2019 (US$ Thousand)
Destination
2016
2017
2018
2019
% of Total 2019
Total 100.00%
Source: Goulden Reports and United Nations
Table 89
Exports of Transformer Parts from Sweden by Country, 2016 to 2019 (US$ Thousand)
Destination
2016
2017
2018
2019
% of Total 2019
Total 100.00%
Source: Goulden Reports and United Nations
Table 90
Exports of Transformer Parts from USA by Country, 2016 to 2019 (US$ Thousand)
Destination
2016
2017
2018
2019
% of Total 2019
Total 100.00%
Source: Goulden Reports and United Nations
Table 91
Exports of Transformer Parts from Vietnam by Country, 2016 to 2019 (US$ Thousand)
Destination
2016
2017
2018
2019
% of Total 2019
Total 100.00%
Source: Goulden Reports and United Nations

The World Markets for Transformers, 2020 - 2030
72
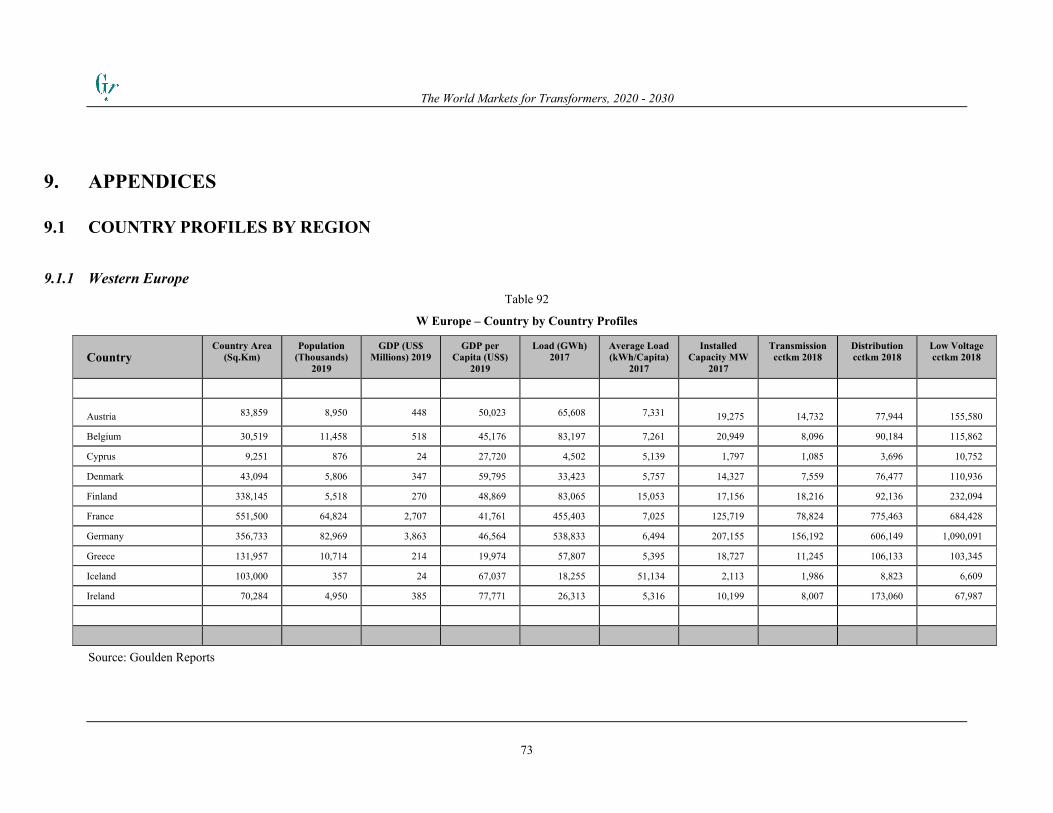
The World Markets for Transformers, 2020 - 2030
73
9. APPENDICES
9.1 COUNTRY PROFILES BY REGION
9.1.1 Western Europe Table 92
W Europe – Country by Country Profiles
Country Country Area
(Sq.Km) Population
(Thousands) 2019
GDP (US$ Millions) 2019
GDP per Capita (US$)
2019
Load (GWh) 2017
Average Load (kWh/Capita)
2017
Installed Capacity MW
2017
Transmission cctkm 2018
Distribution cctkm 2018
Low Voltage cctkm 2018
Austria 83,859 8,950 448 50,023 65,608 7,331 19,275 14,732 77,944 155,580
Belgium 30,519 11,458 518 45,176 83,197 7,261 20,949 8,096 90,184 115,862
Cyprus 9,251 876 24 27,720 4,502 5,139 1,797 1,085 3,696 10,752
Denmark 43,094 5,806 347 59,795 33,423 5,757 14,327 7,559 76,477 110,936
Finland 338,145 5,518 270 48,869 83,065 15,053 17,156 18,216 92,136 232,094
France 551,500 64,824 2,707 41,761 455,403 7,025 125,719 78,824 775,463 684,428
Germany 356,733 82,969 3,863 46,564 538,833 6,494 207,155 156,192 606,149 1,090,091
Greece 131,957 10,714 214 19,974 57,807 5,395 18,727 11,245 106,133 103,345
Iceland 103,000 357 24 67,037 18,255 51,134 2,113 1,986 8,823 6,609
Ireland 70,284 4,950 385 77,771 26,313 5,316 10,199 8,007 173,060 67,987
Source: Goulden Reports

The World Markets for Transformers, 2020 - 2030
74
W Europe – Country by Country Profiles - continued
Country Country Area
(Sq.Km) Population
(Thousands) 2019
GDP (US$ Millions) 2019
GDP per Capita (US$)
2019
Load (GWh) 2017
Average Load (kWh/Capita)
2017
Installed Capacity MW
2017
Transmission cctkm 2018
Distribution cctkm 2018
Low Voltage cctkm 2018
Italy 301,268 60,360 1,989 32,947 299,761 4,966 105,817 69,925 483,074 921,522
Luxembourg 2,586 614 69 113,196 6,405 10,432 402 99 2,839 5,054
Malta 316 485 15 30,650 2,293 4,729 617 354 2,421 2,632
Netherlands 40,844 17,231 902 52,368 109,535 6,357 33,823 11,734 119,402 150,023
Norway 323,877 5,356 418 77,975 122,226 22,820 32,708 21,447 109,281 91,111
Portugal 91,982 10,265 236 23,031 47,068 4,585 18,329 6,940 115,285 139,533
Spain 505,992 46,656 1,398 29,961 242,014 5,187 97,812 58,749 218,549 401,899
Sweden 449,964 10,322 529 51,242 133,405 12,924 39,329 36,224 177,238 263,899
Switzerland 41,284 8,545 715 83,717 58,753 6,876 10,372 10,258 142,833 131,244
United Kingdom 244,100 66,867 2,744 41,030 306,878 4,589 100,268 43,858 451,032 413,516
W Europe 3,720,555 423,123 17,815 42,103 2,694,745 6,369 876,894 565,529 3,832,019 5,098,119
Source: Goulden Reports

The World Markets for Transformers, 2020 - 2030
75
9.1.2 Eastern Europe
Table 93
E Europe – Country by Country Profiles
Country Country Area
(Sq.Km) Population
(Thousands) 2019
GDP (US$ Millions) 2019
GDP per Capita (US$)
2019
Load (GWh) 2017
Average Load (kWh/Capita)
2017
Installed Capacity MW
2017
Transmission cctkm 2018
Distribution cctkm 2018
Low Voltage cctkm 2018
E Europe 1,164,206 111,847 1,614 14,433 454,176 4,061 134,265 125,296 1,320,290 1,886,792
Source: Goulden Reports
9.1.3 Former Soviet Union Table 94
FSU – Country by Country Profiles
Country Country Area
(Sq.Km) Population
(Thousands) 2019
GDP (US$ Millions) 2019
GDP per Capita (US$)
2019
Load (GWh) 2017
Average Load (kWh/Capita)
2017
Installed Capacity MW
2017
Transmission cctkm 2018
Distribution cctkm 2018
Low Voltage cctkm 2018
FSU 22,275,800 297,705 2,353 7,903 1,317,336 4,425 408,406 608,018 3,455,449 2,222,318
Source: Goulden Reports
9.1.4 North Africa Table 95
N. Africa – Country by Country Profiles
Country Country Area
(Sq.Km) Population
(Thousands) 2019
GDP (US$ Millions) 2019
GDP per Capita (US$)
2019
Load (GWh) 2017
Average Load (kWh/Capita)
2017
Installed Capacity MW
2017
Transmission cctkm 2018
Distribution cctkm 2018
Low Voltage cctkm 2018
N Africa 5,752,890 196,570 666 3,387 292,723 1,489 98,583 112,291 502,031 908,639
Source: Goulden Reports

The World Markets for Transformers, 2020 - 2030
76
9.1.5 West Africa Table 96
W. Africa – Country by Country Profiles
Country Country Area
(Sq.Km) Population
(Thousands) 2019
GDP (US$ Millions) 2019
GDP per Capita (US$)
2019
Load (GWh) 2017
Average Load (kWh/Capita)
2017
Installed Capacity MW
2017
Transmission cctkm 2018
Distribution cctkm 2018
Low Voltage cctkm 2018
W Africa 5,638,152 396,674 731 1,844 67,183 169 26,442 31,588 190,929 154,115
Source: Goulden Reports
9.1.6 Central Africa Table 97
Central Africa – Country by Country Profiles
Country Country Area
(Sq.Km) Population
(Thousands) 2019
GDP (US$ Millions) 2019
GDP per Capita (US$)
2019
Load (GWh) 2017
Average Load (kWh/Capita)
2017
Installed Capacity MW
2017
Transmission cctkm 2018
Distribution cctkm 2018
Low Voltage cctkm 2018
Central Africa 5,860,842 143,741 83 580 12,036 84 3,538 9,378 69,825 28,178
Source: Goulden Reports
9.1.7 East Africa Table 98
East Africa – Country by Country Profiles
Country Country Area
(Sq.Km) Population
(Thousands) 2019
GDP (US$ Millions) 2019
GDP per Capita (US$)
2019
Load (GWh) 2017
Average Load (kWh/Capita)
2017
Installed Capacity MW
2017
Transmission cctkm 2018
Distribution cctkm 2018
Low Voltage cctkm 2018
E Africa 6,619,377 352,420 362 1,028 45,749 130 14,518 23,600 169,113 165,673
Source: Goulden Reports

The World Markets for Transformers, 2020 - 2030
77
9.1.8 South Africa Table 99
South Africa – Country by Country Profiles
Country Country Area
(Sq.Km) Population
(Thousands) 2019
GDP (US$ Millions) 2019
GDP per Capita (US$)
2019
Load (GWh) 2017
Average Load (kWh/Capita)
2017
Installed Capacity MW
2017
Transmission cctkm 2018
Distribution cctkm 2018
Low Voltage cctkm 2018
S Africa 5,112,916 176,001 528 3,002 257,304 1,462 60,648 34,665 258,356 196,396
Source: Goulden Reports
9.1.9 Middle East Table 100
Middle East – Country by Country Profiles
Country Country Area
(Sq.Km) Population
(Thousands) 2019
GDP (US$ Millions) 2019
GDP per Capita (US$)
2019
Load (GWh) 2017
Average Load (kWh/Capita)
2017
Installed Capacity MW
2017
Transmission cctkm 2018
Distribution cctkm 2018
Low Voltage cctkm 2018
Middle East 6,163,923 347,616 3,576 10,288 1,214,994 3,495 388,597 153,463 1,025,209 1,211,265
Source: Goulden Reports
9.1.10 Indian Subcontinent Table 101
Indian Subcon. – Country by Country Profiles
Country Country Area
(Sq.Km) Population
(Thousands) 2019
GDP (US$ Millions) 2019
GDP per Capita (US$)
2019
Load (GWh) 2017
Average Load (kWh/Capita)
2017
Installed Capacity MW
2017
Transmission cctkm 2018
Distribution cctkm 2018
Low Voltage cctkm 2018
Indian Subcon. 5,139,564 1,810,818 3,675 2,030 1,372,912 758 438,147 712,016 4,618,921 7,256,921
Source: Goulden Reports

The World Markets for Transformers, 2020 - 2030
78
9.1.11 Asia Table 102
Asia – Country by Country Profiles
Country Country Area
(Sq.Km) Population
(Thousands) 2019
GDP (US$ Millions) 2019
GDP per Capita (US$)
2019
Load (GWh) 2017
Average Load (kWh/Capita)
2017
Installed Capacity MW
2017
Transmission cctkm 2018
Distribution cctkm 2018
Low Voltage cctkm 2018
Asia 16,277,977 2,293,282 25,081 10,937 8,578,938 3,741 2,453,588 1,912,046 10,203,495 12,273,751
9.1.12 South America
Table 103
South America – Country by Country Profiles
Country Country Area
(Sq.Km) Population
(Thousands) 2019
GDP (US$ Millions) 2019
GDP per Capita (US$)
2019
Load (GWh) 2017
Average Load (kWh/Capita)
2017
Installed Capacity MW
2017
Transmission cctkm 2018
Distribution cctkm 2018
Low Voltage cctkm 2018
S America 17,765,151 425,402 3,473 8,163 953,882 2,242 310,522 282,151 2,610,245 1,938,009
Source: Goulden Reports
9.1.13 Central America &Caribbean Table 104
C. America &Caribb. – Country by Country Profiles
Country Country Area
(Sq.Km) Population
(Thousands) 2019
GDP (US$ Millions) 2019
GDP per Capita (US$)
2019
Load (GWh) 2017
Average Load (kWh/Capita)
2017
Installed Capacity MW
2017
Transmission cctkm 2018
Distribution cctkm 2018
Low Voltage cctkm 2018
C America & Carrib. 749,427 91,394 626 6,854 110,319 1,207 39,227 21,288 223,796 288,307
Source: Goulden Reports
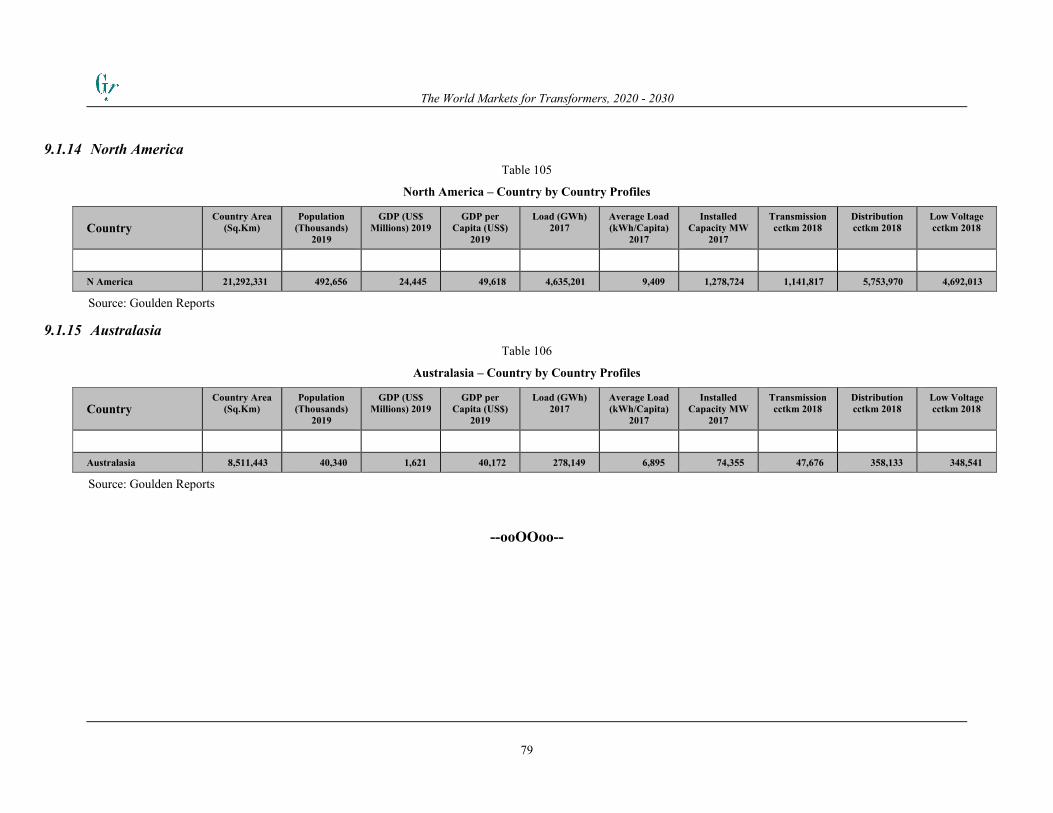
The World Markets for Transformers, 2020 - 2030
79
9.1.14 North America Table 105
North America – Country by Country Profiles
Country Country Area
(Sq.Km) Population
(Thousands) 2019
GDP (US$ Millions) 2019
GDP per Capita (US$)
2019
Load (GWh) 2017
Average Load (kWh/Capita)
2017
Installed Capacity MW
2017
Transmission cctkm 2018
Distribution cctkm 2018
Low Voltage cctkm 2018
N America 21,292,331 492,656 24,445 49,618 4,635,201 9,409 1,278,724 1,141,817 5,753,970 4,692,013
Source: Goulden Reports
9.1.15 Australasia Table 106
Australasia – Country by Country Profiles
Country Country Area
(Sq.Km) Population
(Thousands) 2019
GDP (US$ Millions) 2019
GDP per Capita (US$)
2019
Load (GWh) 2017
Average Load (kWh/Capita)
2017
Installed Capacity MW
2017
Transmission cctkm 2018
Distribution cctkm 2018
Low Voltage cctkm 2018
Australasia 8,511,443 40,340 1,621 40,172 278,149 6,895 74,355 47,676 358,133 348,541
Source: Goulden Reports
--ooOOoo--

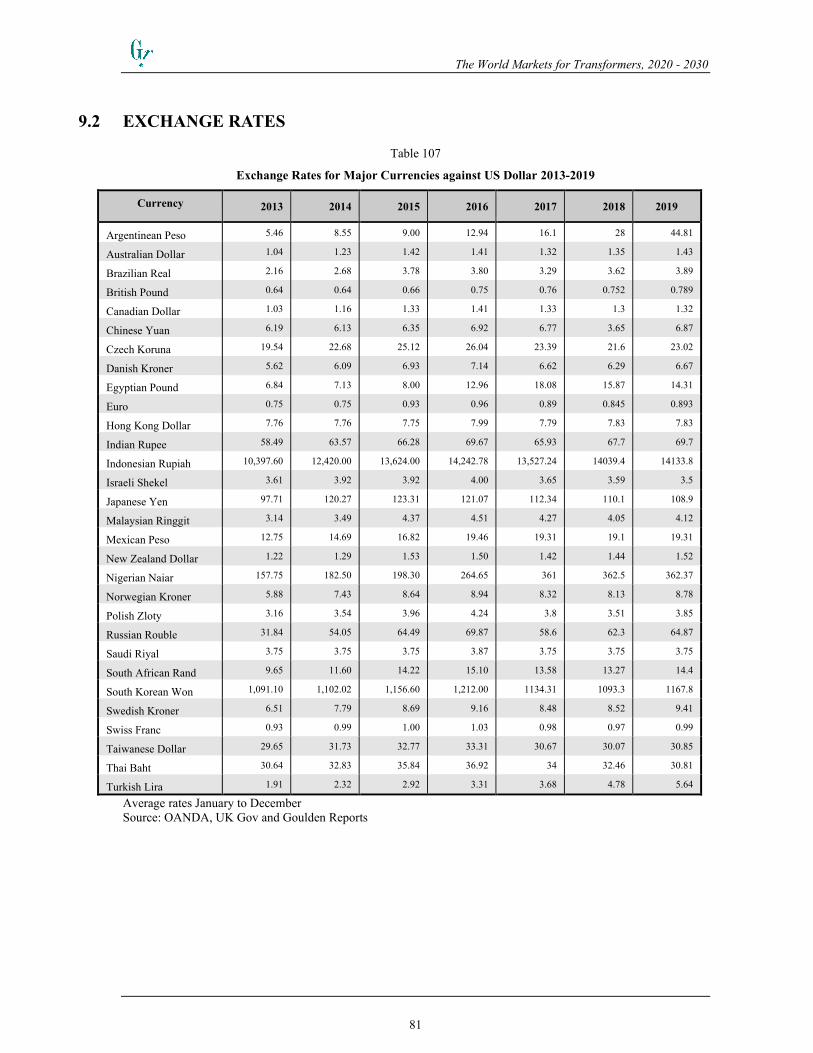
The World Markets for Transformers, 2020 - 2030
81
9.2 EXCHANGE RATES
Table 107
Exchange Rates for Major Currencies against US Dollar 2013-2019
Currency 2013 2014 2015 2016 2017 2018 2019
Argentinean Peso 5.46 8.55 9.00 12.94 16.1 28 44.81
Australian Dollar 1.04 1.23 1.42 1.41 1.32 1.35 1.43
Brazilian Real 2.16 2.68 3.78 3.80 3.29 3.62 3.89
British Pound 0.64 0.64 0.66 0.75 0.76 0.752 0.789
Canadian Dollar 1.03 1.16 1.33 1.41 1.33 1.3 1.32
Chinese Yuan 6.19 6.13 6.35 6.92 6.77 3.65 6.87
Czech Koruna 19.54 22.68 25.12 26.04 23.39 21.6 23.02
Danish Kroner 5.62 6.09 6.93 7.14 6.62 6.29 6.67
Egyptian Pound 6.84 7.13 8.00 12.96 18.08 15.87 14.31
Euro 0.75 0.75 0.93 0.96 0.89 0.845 0.893
Hong Kong Dollar 7.76 7.76 7.75 7.99 7.79 7.83 7.83
Indian Rupee 58.49 63.57 66.28 69.67 65.93 67.7 69.7
Indonesian Rupiah 10,397.60 12,420.00 13,624.00 14,242.78 13,527.24 14039.4 14133.8
Israeli Shekel 3.61 3.92 3.92 4.00 3.65 3.59 3.5
Japanese Yen 97.71 120.27 123.31 121.07 112.34 110.1 108.9
Malaysian Ringgit 3.14 3.49 4.37 4.51 4.27 4.05 4.12
Mexican Peso 12.75 14.69 16.82 19.46 19.31 19.1 19.31
New Zealand Dollar 1.22 1.29 1.53 1.50 1.42 1.44 1.52
Nigerian Naiar 157.75 182.50 198.30 264.65 361 362.5 362.37
Norwegian Kroner 5.88 7.43 8.64 8.94 8.32 8.13 8.78
Polish Zloty 3.16 3.54 3.96 4.24 3.8 3.51 3.85
Russian Rouble 31.84 54.05 64.49 69.87 58.6 62.3 64.87
Saudi Riyal 3.75 3.75 3.75 3.87 3.75 3.75 3.75
South African Rand 9.65 11.60 14.22 15.10 13.58 13.27 14.4
South Korean Won 1,091.10 1,102.02 1,156.60 1,212.00 1134.31 1093.3 1167.8
Swedish Kroner 6.51 7.79 8.69 9.16 8.48 8.52 9.41
Swiss Franc 0.93 0.99 1.00 1.03 0.98 0.97 0.99
Taiwanese Dollar 29.65 31.73 32.77 33.31 30.67 30.07 30.85
Thai Baht 30.64 32.83 35.84 36.92 34 32.46 30.81
Turkish Lira 1.91 2.32 2.92 3.31 3.68 4.78 5.64
Average rates January to December Source: OANDA, UK Gov and Goulden Reports

The World Markets for Transformers, 2020 - 2030
82

The World Markets for Transformers, 2020 - 2030
83
9.3 ESTIMATED PRODUCTION BY COMPANY BY COUNTRY Table 108
Estimated Production by Company by Country Millions US Dollar 2020
Country Company Power Transformer
Distribution Transformers
Dry Transformers
2020 Production US$ Million
WESTERN EUROPE
Austria 272.1 81.1 9.6 362.8 Producer 1 Producer 2 Producer 3 Belgium 100.9 56.4 50.4 207.6 Denmark Finland France Germany United Kingdom

The World Markets for Transformers, 2020 - 2030
84
EASTERN EUROPE Bulgaria
Slovenia
FORMER USSR Armenia
Uzbekistan
AFRICA Egypt South Africa
MIDDLE EAST Iran United Arab Emirates

The World Markets for Transformers, 2020 - 2030
85
NEAR EAST Bangladesh Sri Lanka
FAR EAST China Vietnam
SOUTH AMERICA Argentina Uruguay
NORTH AMERICA Canada USA AUSTRALASIA Australia New Zealand
World
------ooooooOOOOOOoooooo------