the worldwide reference in liner shipping - joc.com · pdf filethe worldwide reference in...
TRANSCRIPT

Supply & Demand :
Does it still matter?
ALPHALINER The worldwide reference in liner shipping
Web: www.alphaliner.com E-mail: [email protected]
Transpacific Maritime – March 2013 1
ALPHALINER Containership Market Outlook 2013 www.alphaliner.com – the worldwide reference in liner shipping © Alphaliner 1999-2013 – Contents not to be reproduced without permission
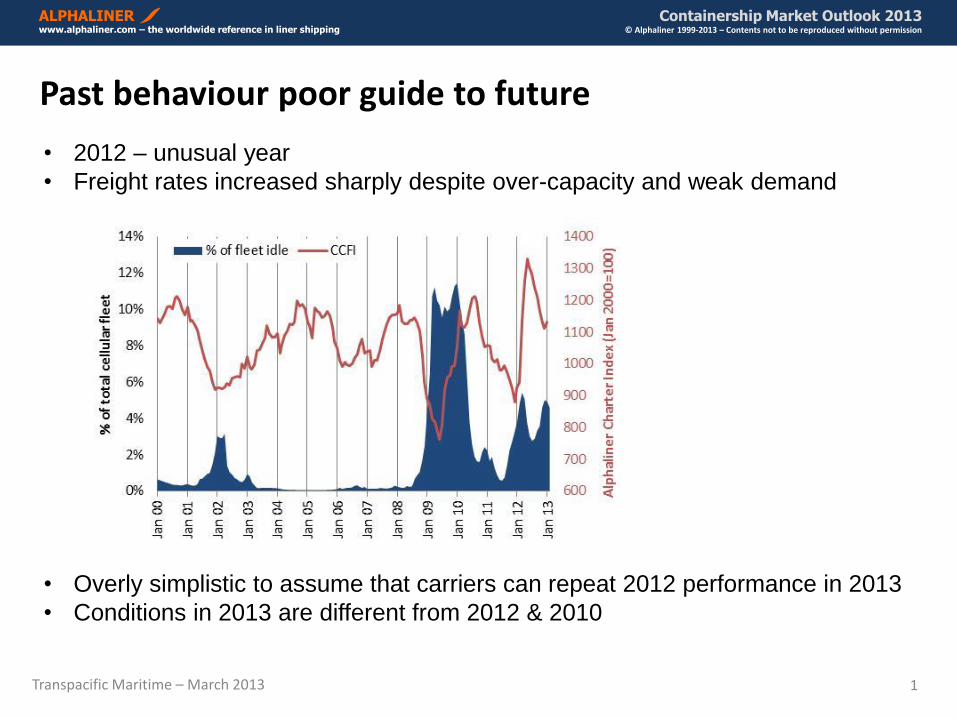
Past behaviour poor guide to future
• 2012 – unusual year
• Freight rates increased sharply despite over-capacity and weak demand
• Overly simplistic to assume that carriers can repeat 2012 performance in 2013
• Conditions in 2013 are different from 2012 & 2010
Transpacific Maritime – March 2013 2
ALPHALINER Containership Market Outlook 2013 www.alphaliner.com – the worldwide reference in liner shipping © Alphaliner 1999-2013 – Contents not to be reproduced without permission
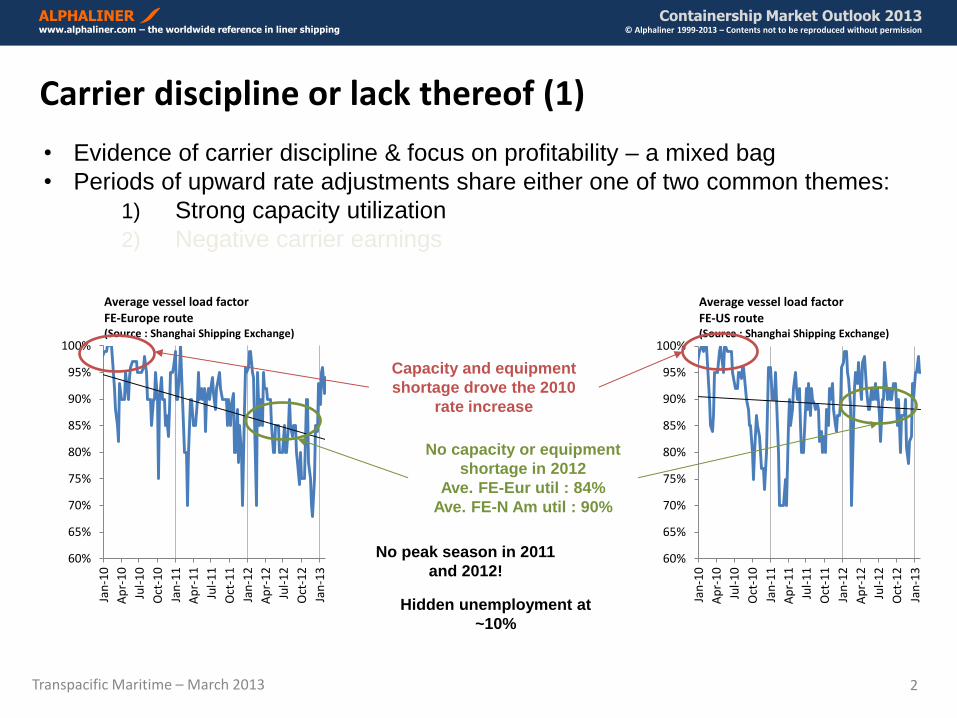
Carrier discipline or lack thereof (1)
• Evidence of carrier discipline & focus on profitability – a mixed bag
• Periods of upward rate adjustments share either one of two common themes:
1) Strong capacity utilization
2) Negative carrier earnings
60%
65%
70%
75%
80%
85%
90%
95%
100%
Jan
-10
Ap
r-1
0
Jul-
10
Oct
-10
Jan
-11
Ap
r-1
1
Jul-
11
Oct
-11
Jan
-12
Ap
r-1
2
Jul-
12
Oct
-12
Jan
-13
Average vessel load factor FE-Europe route (Source : Shanghai Shipping Exchange)
60%
65%
70%
75%
80%
85%
90%
95%
100%
Jan
-10
Ap
r-1
0
Jul-
10
Oct
-10
Jan
-11
Ap
r-1
1
Jul-
11
Oct
-11
Jan
-12
Ap
r-1
2
Jul-
12
Oct
-12
Jan
-13
Average vessel load factor FE-US route (Source : Shanghai Shipping Exchange)
Capacity and equipment
shortage drove the 2010
rate increase
No capacity or equipment
shortage in 2012
Ave. FE-Eur util : 84%
Ave. FE-N Am util : 90%
No peak season in 2011
and 2012!
Hidden unemployment at
~10%
Transpacific Maritime – March 2013 3
ALPHALINER Containership Market Outlook 2013 www.alphaliner.com – the worldwide reference in liner shipping © Alphaliner 1999-2013 – Contents not to be reproduced without permission
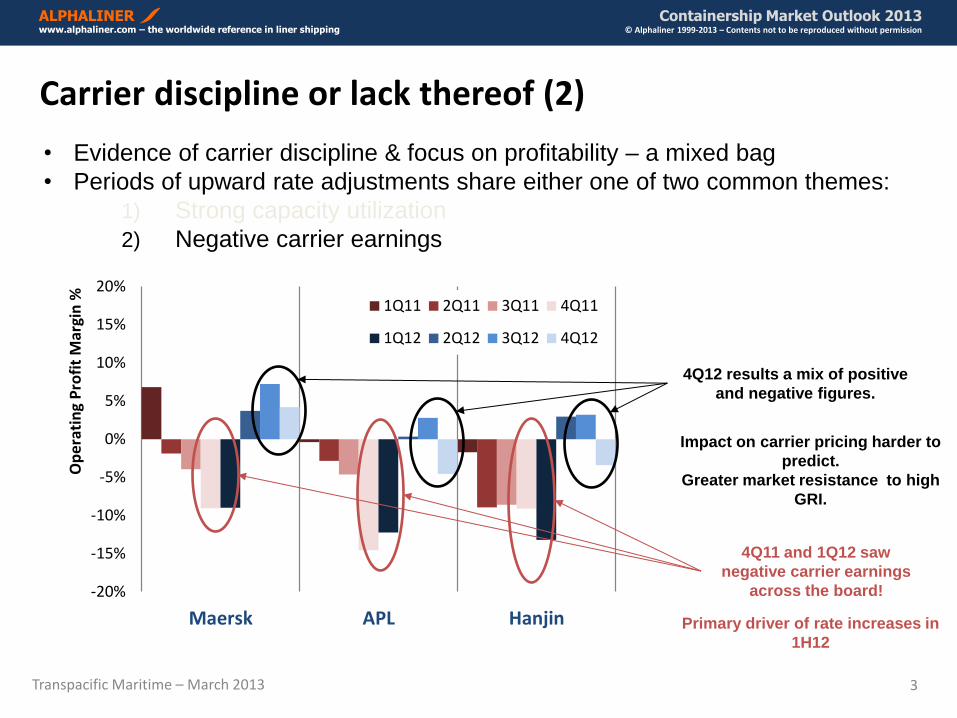
Carrier discipline or lack thereof (2)
• Evidence of carrier discipline & focus on profitability – a mixed bag
• Periods of upward rate adjustments share either one of two common themes:
1) Strong capacity utilization
2) Negative carrier earnings
-20%
-15%
-10%
-5%
0%
5%
10%
15%
20%
Maersk APL Hanjin
Op
era
tin
g P
rofi
t M
argi
n %
1Q11 2Q11 3Q11 4Q11
1Q12 2Q12 3Q12 4Q12
4Q11 and 1Q12 saw
negative carrier earnings
across the board!
Impact on carrier pricing harder to
predict.
Greater market resistance to high
GRI.
4Q12 results a mix of positive
and negative figures.
Primary driver of rate increases in
1H12
Transpacific Maritime – March 2013 4
ALPHALINER Containership Market Outlook 2013 www.alphaliner.com – the worldwide reference in liner shipping © Alphaliner 1999-2013 – Contents not to be reproduced without permission
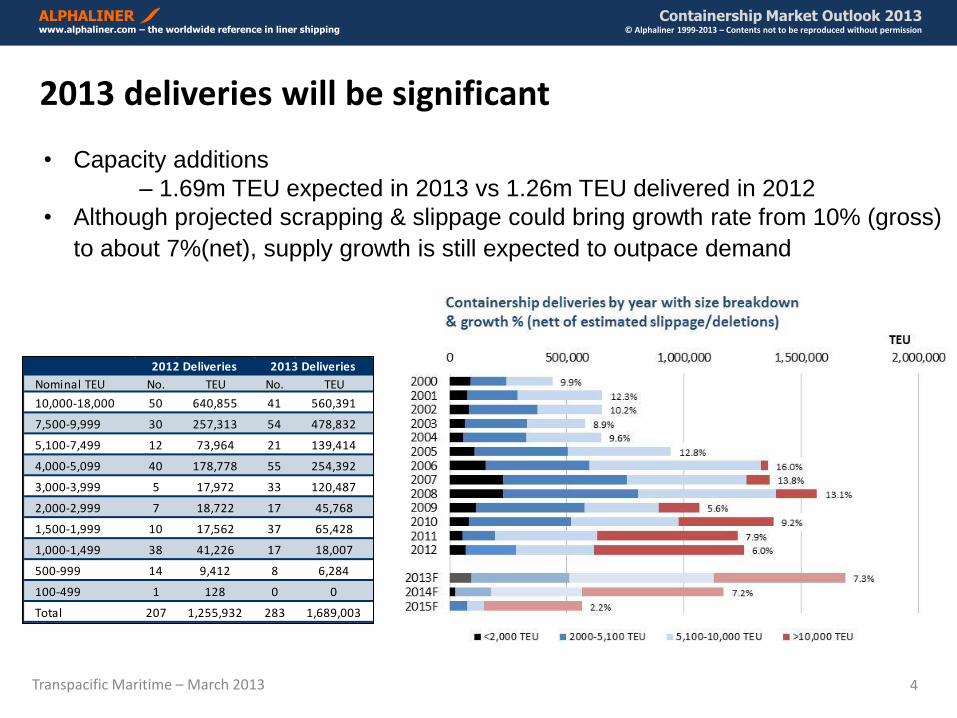
2013 deliveries will be significant
• Capacity additions
– 1.69m TEU expected in 2013 vs 1.26m TEU delivered in 2012
• Although projected scrapping & slippage could bring growth rate from 10% (gross)
to about 7%(net), supply growth is still expected to outpace demand
Nominal TEU No. TEU No. TEU
10,000-18,000 50 640,855 41 560,391
7,500-9,999 30 257,313 54 478,832
5,100-7,499 12 73,964 21 139,414
4,000-5,099 40 178,778 55 254,392
3,000-3,999 5 17,972 33 120,487
2,000-2,999 7 18,722 17 45,768
1,500-1,999 10 17,562 37 65,428
1,000-1,499 38 41,226 17 18,007
500-999 14 9,412 8 6,284
100-499 1 128 0 0
Total 207 1,255,932 283 1,689,003
2013 Deliveries2012 Deliveries
Transpacific Maritime – March 2013 5
ALPHALINER Containership Market Outlook 2013 www.alphaliner.com – the worldwide reference in liner shipping © Alphaliner 1999-2013 – Contents not to be reproduced without permission
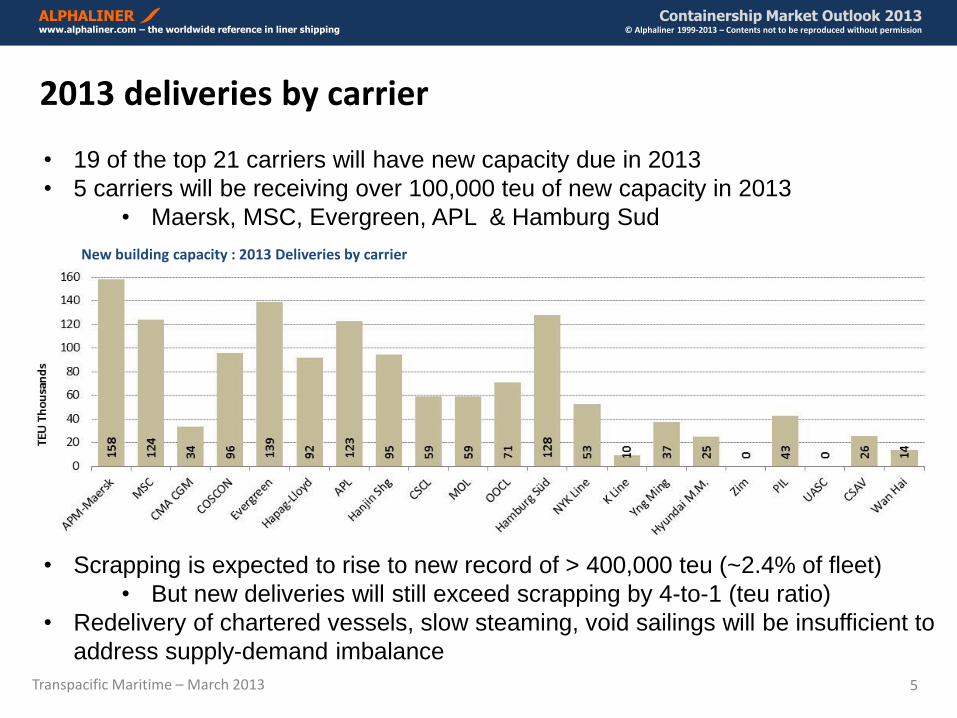
2013 deliveries by carrier
• 19 of the top 21 carriers will have new capacity due in 2013
• 5 carriers will be receiving over 100,000 teu of new capacity in 2013
• Maersk, MSC, Evergreen, APL & Hamburg Sud
• Scrapping is expected to rise to new record of > 400,000 teu (~2.4% of fleet)
• But new deliveries will still exceed scrapping by 4-to-1 (teu ratio)
• Redelivery of chartered vessels, slow steaming, void sailings will be insufficient to
address supply-demand imbalance
New building capacity : 2013 Deliveries by carrier
Transpacific Maritime – March 2013 6
ALPHALINER Containership Market Outlook 2013 www.alphaliner.com – the worldwide reference in liner shipping © Alphaliner 1999-2013 – Contents not to be reproduced without permission
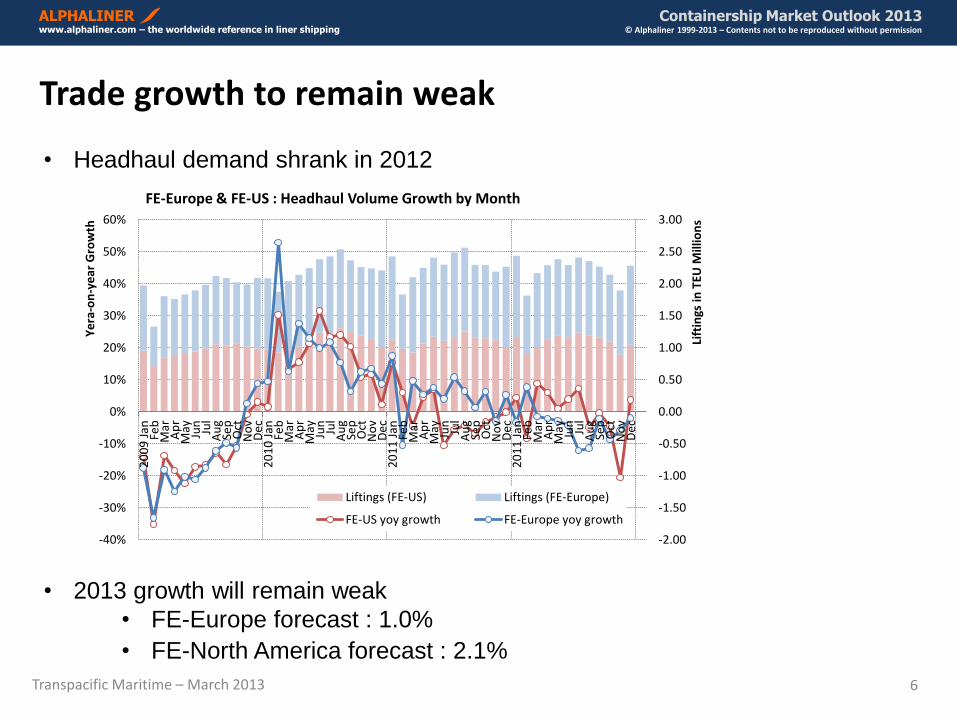
Trade growth to remain weak
• Headhaul demand shrank in 2012
• 2013 growth will remain weak
• FE-Europe forecast : 1.0%
• FE-North America forecast : 2.1%
-2.00
-1.50
-1.00
-0.50
0.00
0.50
1.00
1.50
2.00
2.50
3.00
-40%
-30%
-20%
-10%
0%
10%
20%
30%
40%
50%
60%
20
09
Jan Fe
bM
arA
pr
May Jun
Jul
Au
gSe
pO
ctN
ov
De
c2
01
0 J
an Feb
Mar
Ap
rM
ay Jun
Jul
Au
gSe
pO
ctN
ov
De
c2
01
1 J
an Feb
Mar
Ap
rM
ay Jun
Jul
Au
gSe
pO
ctN
ov
De
c2
01
1 J
an Feb
Mar
Ap
rM
ay Jun
Jul
Au
gSe
pO
ctN
ov
De
c
Lift
ings
in T
EU M
illio
ns
Ye
ra-o
n-y
ear
Gro
wth
FE-Europe & FE-US : Headhaul Volume Growth by Month
Liftings (FE-US) Liftings (FE-Europe)
FE-US yoy growth FE-Europe yoy growth
Transpacific Maritime – March 2013 7
ALPHALINER Containership Market Outlook 2013 www.alphaliner.com – the worldwide reference in liner shipping © Alphaliner 1999-2013 – Contents not to be reproduced without permission
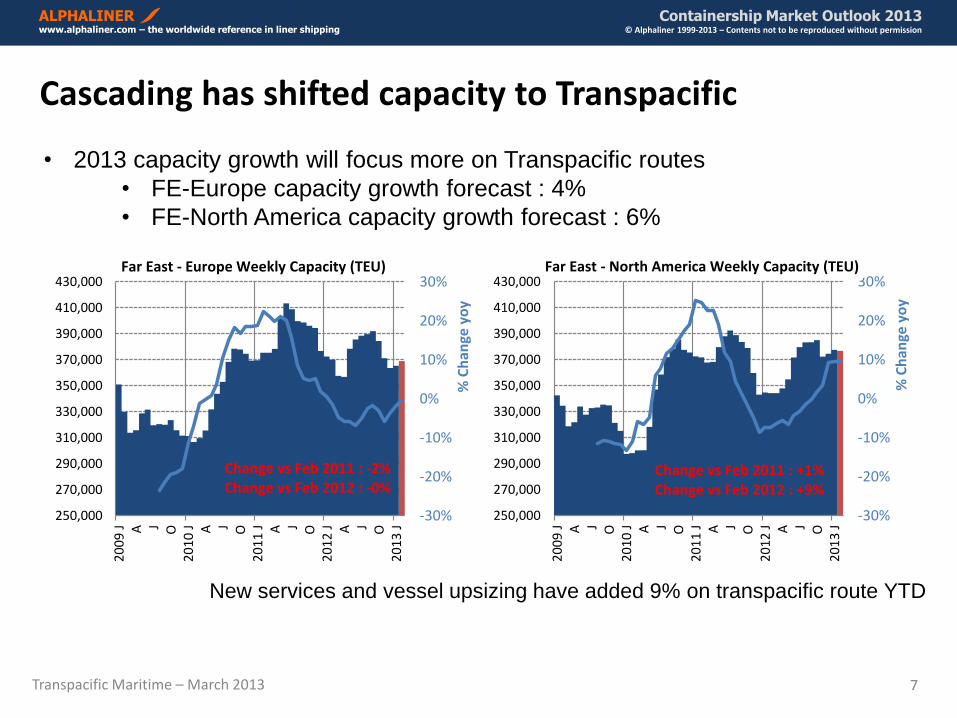
Cascading has shifted capacity to Transpacific
• 2013 capacity growth will focus more on Transpacific routes
• FE-Europe capacity growth forecast : 4%
• FE-North America capacity growth forecast : 6%
-30%
-20%
-10%
0%
10%
20%
30%
250,000
270,000
290,000
310,000
330,000
350,000
370,000
390,000
410,000
430,000
20
09
J A J O2
01
0 J A J O
20
11
J A J O2
01
2 J A J O
20
13
J
% C
han
ge y
oy
Far East - Europe Weekly Capacity (TEU)
Change vs Feb 2011 : -2% Change vs Feb 2012 : -0%
-30%
-20%
-10%
0%
10%
20%
30%
250,000
270,000
290,000
310,000
330,000
350,000
370,000
390,000
410,000
430,000
20
09
J A J O2
01
0 J A J O
20
11
J A J O2
01
2 J A J O
20
13
J
% C
han
ge y
oy
Far East - North America Weekly Capacity (TEU)
Change vs Feb 2011 : +1% Change vs Feb 2012 : +9%
New services and vessel upsizing have added 9% on transpacific route YTD
Transpacific Maritime – March 2013 8
ALPHALINER Containership Market Outlook 2013 www.alphaliner.com – the worldwide reference in liner shipping © Alphaliner 1999-2013 – Contents not to be reproduced without permission
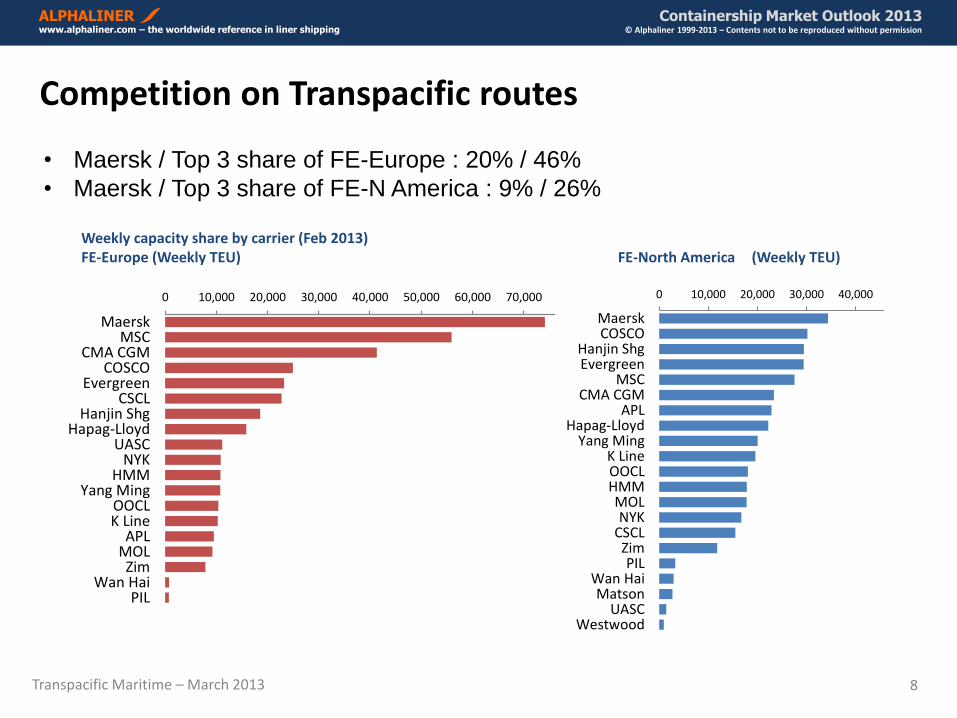
Competition on Transpacific routes
• Maersk / Top 3 share of FE-Europe : 20% / 46%
• Maersk / Top 3 share of FE-N America : 9% / 26%
Weekly capacity share by carrier (Feb 2013) FE-Europe (Weekly TEU) FE-North America (Weekly TEU)
0 10,000 20,000 30,000 40,000 50,000 60,000 70,000 80,000 90,000
MaerskCOSCO
Hanjin ShgEvergreen
MSCCMA CGM
APLHapag-Lloyd
Yang MingK LineOOCLHMMMOLNYK
CSCLZimPIL
Wan HaiMatson
UASCWestwood
FE - North America Weekly Capacity in nominal TEU
0 10,000 20,000 30,000 40,000 50,000 60,000 70,000 80,000 90,000
MaerskMSC
CMA CGMCOSCO
EvergreenCSCL
Hanjin ShgHapag-Lloyd
UASCNYK
HMMYang Ming
OOCLK Line
APLMOLZim
Wan HaiPIL
FE - Europe Weekly Capacity in nominal TEU
Transpacific Maritime – March 2013 9
ALPHALINER Containership Market Outlook 2013 www.alphaliner.com – the worldwide reference in liner shipping © Alphaliner 1999-2013 – Contents not to be reproduced without permission
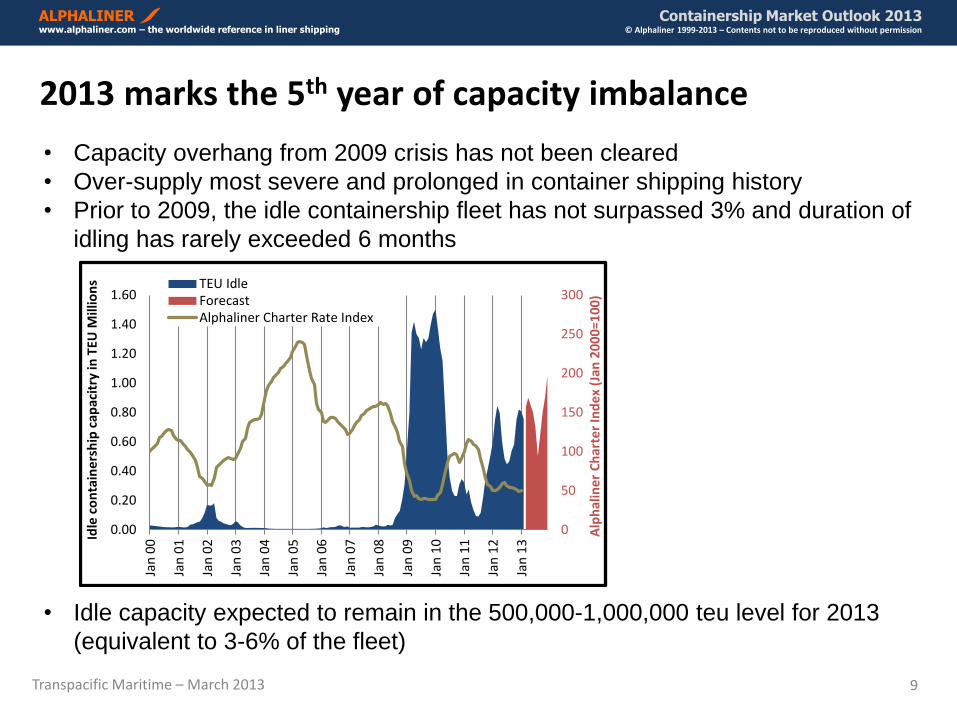
2013 marks the 5th year of capacity imbalance
• Capacity overhang from 2009 crisis has not been cleared
• Over-supply most severe and prolonged in container shipping history
• Prior to 2009, the idle containership fleet has not surpassed 3% and duration of
idling has rarely exceeded 6 months
• Idle capacity expected to remain in the 500,000-1,000,000 teu level for 2013
(equivalent to 3-6% of the fleet)
0
50
100
150
200
250
300
0.00
0.20
0.40
0.60
0.80
1.00
1.20
1.40
1.60
Jan
00
Jan
01
Jan
02
Jan
03
Jan
04
Jan
05
Jan
06
Jan
07
Jan
08
Jan
09
Jan
10
Jan
11
Jan
12
Jan
13
Alp
hal
ine
r C
har
ter
Ind
ex
(Jan
20
00
=10
0)
Idle
co
nta
ine
rsh
ip c
apac
itry
in T
EU M
illio
ns TEU Idle
ForecastAlphaliner Charter Rate Index

Transpacific Maritime – March 2013 10
ALPHALINER Containership Market Outlook 2013 www.alphaliner.com – the worldwide reference in liner shipping © Alphaliner 1999-2013 – Contents not to be reproduced without permission
Carriers unable to break surplus capacity trap in 2013
New deliveries
Return of chartered tonnage
Scrapping increases
Charter rates drop
Surplus Capacity
Rates fall below
breakeven
Idling of surplus capacity
Rates return to breakeven
Idle capacity re-activated
The surplus
capacity trap
may last to
2015
Transpacific Maritime – March 2013 11
ALPHALINER Containership Market Outlook 2013 www.alphaliner.com – the worldwide reference in liner shipping © Alphaliner 1999-2013 – Contents not to be reproduced without permission
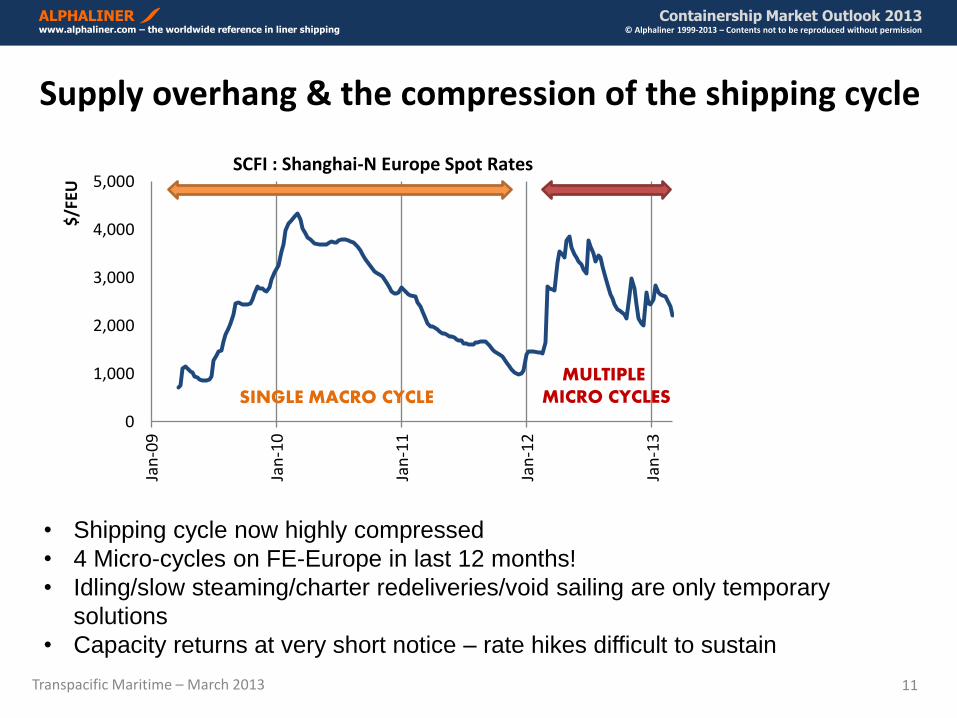
Supply overhang & the compression of the shipping cycle
0
1,000
2,000
3,000
4,000
5,000
Jan
-09
Jan
-10
Jan
-11
Jan
-12
Jan
-13
$/F
EU
SCFI : Shanghai-N Europe Spot Rates
SINGLE MACRO CYCLE MULTIPLE
MICRO CYCLES
• Shipping cycle now highly compressed
• 4 Micro-cycles on FE-Europe in last 12 months!
• Idling/slow steaming/charter redeliveries/void sailing are only temporary
solutions
• Capacity returns at very short notice – rate hikes difficult to sustain
Transpacific Maritime – March 2013 12
ALPHALINER Containership Market Outlook 2013 www.alphaliner.com – the worldwide reference in liner shipping © Alphaliner 1999-2013 – Contents not to be reproduced without permission
Supply-Demand still relevant
• Rate volatility will continue
• Expect more GRI announcements throughout the year
• But GRI success rate will be lower than 2012
• Supply overhang will continue to dictate rates cycle in 2013
• Oversupply is in the 5-15% range
• Observed unemployment of ~5%
• Hidden unemployment of ~5-10%
• Intense competitive will continue
• None of the main carriers will exit the market
• Predictions of industry consolidation are premature
• Key indicators to watch
• Capacity utilisation
• Carrier profitability (or lack thereof)

Transpacific Maritime – March 2013 13
ALPHALINER Containership Market Outlook 2013 www.alphaliner.com – the worldwide reference in liner shipping © Alphaliner 1999-2013 – Contents not to be reproduced without permission
END
Please send any queries to [email protected]
Alphaliner clients include the following top shipping lines :