the x-ray globular cluster population in ngc 1399
TRANSCRIPT
The X-ray Globular Cluster Population in NGC 1399
Lorella Angelini’, Michael Loewenstein2, and Richard F. Mushotzky
Laboratory for High Energy Astrophysics, NASA/GSFC, Code 662, Greenbelt, MD 20rr1
angeliniQdavide.gsfc.nasa.gov
ABSTRACT
We report on X-ray sources detected in the Chandru images of the elliptical galaxy NGC 1399 and identified with globular clusters (GCs). The 8‘x 8’ Chandru image shows that a large fraction of the 2-10 keV X-ray emission is resolved into point sources, with a luminosity threshold of 5 x ergs s-’. These sources are most likely Low Mass X-ray Binaries (LMXBs). More than 70% of the X-ray sources, in a region imaged by HST, are located within GCs. Many of these sources have super-Eddington luminosity (for an accreting neutron star) and their average luminosity is higher than the remaining sources. This association suggests that, in giant elliptical galaxies, luminous X-ray binaries preferentially form in GCs. The spectral properties of the GC and non-GC sources are in most cases similar to those of LMXBs in our galaxy. Two of the brightest sources, one of which is in GC, have a much softer spectra as seen in the high state black hole. The “apparent” super-Eddington luminosity in many cases may be due to multiple LMXB systems within individual GC, but with some of the most extreme luminous systems containing massive black holes.
Subject headings: X-rays:binaries, X-rays:galaxies, X-rays:individual NGC 1399 galaxies: elliptical and lenticular, globular clusters: general
‘Also with the Universities Space Research Association
2Also with the University of Maryland Department of Astronomy
https://ntrs.nasa.gov/search.jsp?R=20010047508 2019-04-12T01:11:30+00:00Z

1. In t roduc t ion
Early X-ray surveys in the 1970s revealed that the ratio of Low Mass X-ray Binaries (LMXB) to stellar mass is more than two order of magnitudes higher for Globular Clusters (GCs) than it is for the whole Galaxy (Clark 1975). This was surprising because globular clusters contain only a small fraction of the mass in our Galaxy, - 1 x Yet, according to current estimates, they host 12 out of - 130 bright (2 1036ergs s-l) Galactic X-ray sources. This overabundance of binaries led Fabian, Pringle & Rees (1975) to propose that the LMXB in GC are formed via tidal capture of neutron stars in close encounters with main-sequence or giant stars, a mechanism that operates preferentially at the higher stellar density found in GCs. As X-ray observatories have improved it has become possible to study the X-ray properties of GCs associated with the nearest galaxies. ROSAT observations revealed that the X-ray properties of the M31 GCs are similar to those observed in our galaxy, with a comparable fractions and luminosity distribution (Supper el al. 1997).
Globular clusters are amongst the oldest systems in the universe, common to all types of massive galaxies, and are related to galaxy formation. The GC populations of elliptical galaxies are of particular interest because, unlike our galaxy and other late-type galaxies, they show a bimodal distribution in optical colors and much higher number of GCs per galaxy luminosity (the specific frequency), with the highest number found in the central galaxies of clusters. How the excess originated is fundamentally connected to when it originated. One suggestion is that, since the galaxies with higher specific frequencies have higher mass- to-light ratios and deeper potential wells, variations in specific frequency reflect a different efficiency in GC formation relative to star formation in the field (Blakeslee 1999) with the redder clusters forming in a secondary collapse (Forbes, Brodie & Grillmair 1997). Other proposals include globular cluster formation during galaxy mergers (Ashman & Zepf 1992), and tidal stripping at an early epoch (Kissler-Patig et al. 1999) or accretion of metal-poor clusters from dwarfs to an already-existing metal-rich population (Cbt6, Marzke & West 1998). Whatever theory is correct, the two GC populations observed in elliptical galaxies may be reflected in differences in their associated X-ray source populations.
Early X-ray observations of elliptical galaxies showed that the dominant source of X-ray emission is from a - 1 keV hot interstellar medium (ISM) (e.g., Forman, Jones, & Tucker, 1985). More recent ASCA spectral analysis of elliptical galaxies revealed the presence of a hard component identified with the ensemble of LMXB. (Matsumoto et al. 1997, Matsushita et al. 1994). The LMXB origin was confirmed by 0.5’’ angular resolution Chundru X-ray observatory images of two faint elliptical galaxies, NGC 1553 and NGC 4697, which resolved 60% of the hard (> 1 keV) X-ray emission into point sources, most likely LhIXBs (Sarazin, Irwin 8~ Bregman 2000, &, Blanton, Sarazin SC Irwin 2001). Further, in NGC 4697 at least
- 20% of the X-ray point sources were foiiricl to be associated with globular cliistcrs (Sarazin et al. 2001). NGC 1399 is a giant elliptical galaxy in the center of the Fornax Cluster. It is particularly suitable for studying the X-ray properties of a GC population because it has - 4x the average elliptical galaxy GC specific frequency, and - 15x that of a typical spiral galaxy. In this paper we present the first Chundru X-ray observations of NGC 1399.
l
2. Observations and Data Reduction
NGC 1399 was observed with the Chundru ACIS-S detector on 2000 January 18 for a total exposure of 55973 s. The galaxy was positioned at the center of the S3 chip, - 2.3' from the aim point. Early standard data pipeline processing was used, with additional processing applied to remove bad pixels, to correct for the gain and quantum efficiency maps, and to apply a 1.5" aspect shift (see below). Additional observations were obtained with the ACE-I on 1999, October 18.(- 3500 s) and 2000, January 19 (2000 s immediately following the ACIS-S observation). In this Letter we concentrate on the portion of the S3 chip that overlaps with observations taken with WFPC2 on HST (Grillmair et al., 1999), and the identification of X-ray sources with globular clusters. The properties of the entire sample of the X-ray sources detected in the Chundru observations and the characteristics of the diffuse emission are given Mushotzky et al. 2001 (Paper I1 in preparation).
The X-ray point sources were identified using the sliding cell detection algorithm, as implemented in XIMAGE, on the cleaned event file in the 0.3-10.0 keV energy band, with the detection threshold set a t 20. The diffuse emission associated with the galaxy is the major source of background. It peaks at 1 keV and varies smoothly over the S3 chip. In the central 30" region of the galaxy the detection threshold is increased by a factor N 3-5 to correct for the diffuse emission (see fig 2 in Loewenstein, Mushotzky & Angelini 2001). A total of 214 sources were detected in the entire S3 chip of which 160 are above the N 30 level. These sources resolve a large fraction of the 2-10 keV diffuse X-ray emission (paper 11) previously detected with ASCA. The X-ray background is expected to contribute - 20 objects across this region (Mushotzky et al. 2000). Each source was visually inspected to ensure that it is a solid detection. The 0.3-10 keV count rates were corrected for exposure, vignetting, and point spread function. The source background was evaluated in nearby regions. The faintest source detected is - 1.7 x lod4 cts s1 - corresponding to a luminosity of 5 x ergs s-lfor a distance to NGC 1399 of 20.5 hlpc (hlerritt and Ferrarese 2001). No point source was detected at the galaxy nucleus (< 9.7 x ergs s-'; Loewenstein et al. 2001).
4
3. Source Identification with GCs and Their Character is t ics
To optically identify the Chundru X-ray sources we used the bVFPC2 HST images from Forbes et al. (1998). The list of GCs (678 objects) derived from these images, along with their B and I band magnitudes were provided by C. Grillmair. The HST image covers less than 30% of the 8’ x 8’ S3 Chundru field of view and includes 45 of the 214 X-ray sources detected in the S3 chip (Fig 1). Only 39 of these X-ray sources have a signal to noise ratio (SNR) greater than 30. One source is elongated in the X-ray image, inconsistent with a single point source, and is excluded from further analysis.
The X-ray contours overlaid on the HST image reveal a systematic offset in declination of about 1.5”. A similar displacement was seen comparing the Chandru ACIS-I October observation with the January ACIS-S observation. After a declination shift of 1.5” was applied to the Chundru data, the galaxy centroid measured in the HST image is consistent with that measured with Chundru and the ACIS-I and ACIS-S images come into alignment. Following this correction, we assumed that the absolute X-ray positions are accurate to - 0.5”, the size of the Chundru point spread function. For 29 X-ray sources the closest HST object - all identified with GCs in the Grillmair list - is within < 0.4” . An additional 8 X-ray sources are at distances from 0.7” - 1” to the closest HST object, all GCs. The remaining 7 X-ray sources are more than 1” from any HST object. We consider all 29 sources < 0.4” from GCs as positive identifications, corresponding to - 66% of the total X-ray sample (44 objects), - 70% when only > 3 0 sources (38 objects) are included. We note that if the 1.5” shift is not applied the number of matches, within < 0.5” is reduced t o 1, demonstrating the chance coincidence is very low. The GC X-ray sources are homogeneously distributed within the HST FOV (Fig 1). The 38 objects above 30 have count rates that range from 3 x to 1 x cts s-I. The GC X-ray sources are on average brighter than the unidentified sources. Three of the sources, of which two are associated with GCs, are exceptionally bright by a factor > 5 above the average count rate.
I
We constructed a color-color diagram (Fig 2) by dividing the data into 3 energy bands: 0.3-1 keV, 1-2 keV and 2-10 keV. Only sources above > 50 (> 42 counts) are included in the plot. There is a distinct cluster of sources with a “hard” color, consistent with low Nh and power-law photon indices ranging from 1-2. A few have softer (power-law index 2-3) spectra. GC and unidentified sources occupy identical regions in the color-color diagram. Two of the three brightest sources are very soft, with only one of these located in a GC. The other very bright (GC) source is harder, located in the densely populated region of the color-color diagram.
Composite spectra were obtained for the globular and non-globular samples, using only the detections above 30 and excluding the 3 brightest sources. The two spectra have 1828

and 612 total counts, 25% of which is background. Data were fit in the 0.3-6 keV energy range, with absorbed power-law and bremsstrahlung models. Both fit the data well with similar best-fit parameters for the two spectra. The best fit power-law photon indices are - 1.65ft:& and - 1.55 f 0.22 for the globular and non-globular spectra, respectively, with N h = 4 x 1020 cm-2. Fixing Nh at the Galactic value, 1.3 x lo2' cm-2, decreases the power-law index to 1.45 without significantly changing the quality of fit. The best fit bremsstrahlung temperatures are 7.2fk:g and 9.2f::t keV, for the globular and non-globular clusters sources, respectively, with the absorption fixed at the Galactic value. We adopt a conversion factor of 6 x 10-l2 erg cm-2 ct-l, consistent within 10% for both models. This is applied to all sources, except for the brightest that are individually fit. The brightest two GC sources have 550 and 710 counts and their spectra are well fit by power-laws of index 3.4 and 1.5, respectively, with the former requiring a higher absorption of 2 x lo2' cm-2 and the latter an absorption similar to the composite spectra. A power-law of slope 2.7 and Nh of 1 x lo2' cm-2 fits the spectrum of the brightest unidentified source. Including these brightest sources in the composite GC and non-GC source spectra introduces a bias and the spectra are no longer consistent: the non-GC spectrum is softer, requiring a much higher power-law photon index - 2 while the GC best-fit is relatively unchanged.
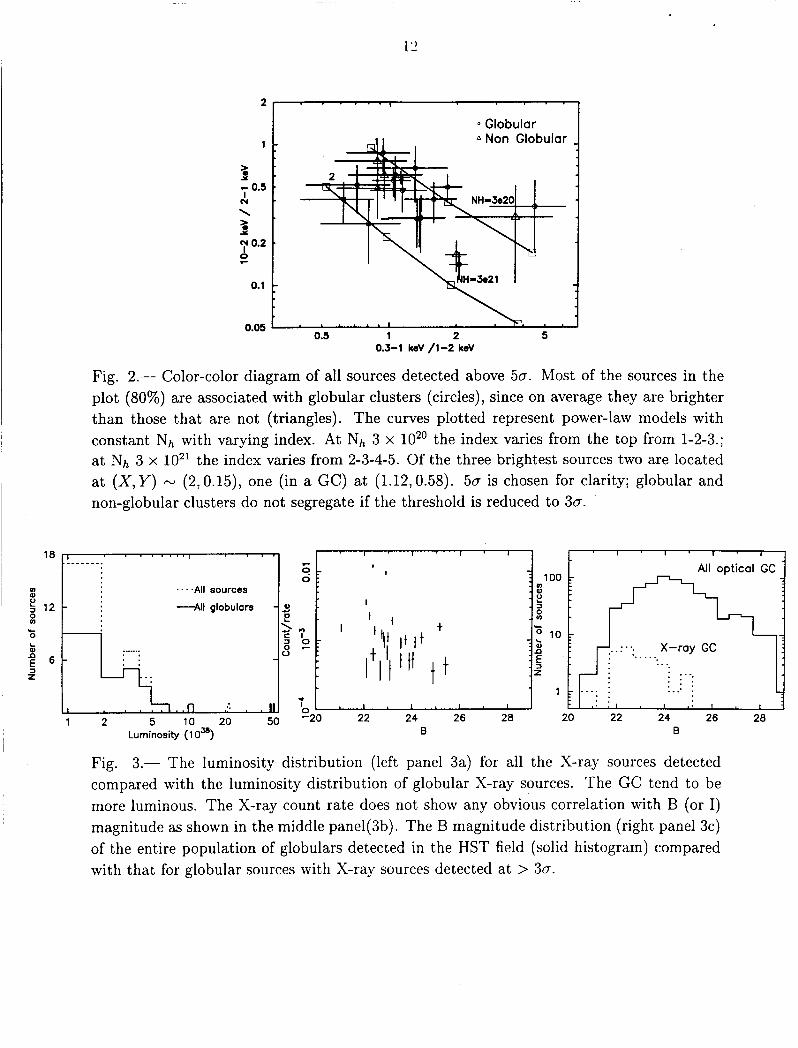
Figure 3a compares the X-ray luminosity distribution for all 38 objects with that of the X-ray GC sources. Most of the unidentified sources are within the 1 - 2 x ergs s-'bin. Above 2 x ergs s-l the GC sources are clearly in excess compared to the few unidentified sources. Excluding the 3 brightest sources, the average luminosity of the globular cluster X-ray sources is 3.2 x for the unidentified sources. Including the brightest sources, the average increases by 2 and 1.5 for the globular and non-globular samples, respectively.
ergs s-', compared to 2.1 x
Only the three brightest sources have sufficient counts (> 500) t o search for short term variability. Light curves with 320 and 3200 second bins of the 3 sources are consistent with a constant with probability > 1 x The observation performed in October 1999 provides a 3-month time-scale. Using the short January 2000 ACIS-I observation as a reference for the cross-calibration between chips, we predict the ACIS-I rate (using PIMMS) with the spectral parameters from ACIS-S. These are within la of the observed count rate in ACIS-I for the 3 brightest sources.
The average B and B-I of all > 30 X-ray globular sources are B= 23.2 f 1.0 and B- I=1.78 f 0.28 with 17 of 26 sources having B-I larger than the average for the entire optical sample. No correlation is seen between the X-ray flux and either B or I (Fig 3b). There is a notable absence of X-ray detections in GCs fainter than 25th magnitude (Fig 3c). Overall, only a small percentage of optically luminous GCs contain luminous X-ray sources. The
X-ray GC sources are on average - 1.5 magnitudes brighter in the optical than the avcrage of all GCs in the FIST FOV (Fig 3c). The KS test yir.lcls a low probability (3.6 x that the X-ray globular magnitudes are drawn from the same distribution as the total globular sample. This increases to 4.3 x if the total sample is restricted to 1 < B - I < 2.5. The color (B-I) distribution for all clusters (see Fig 2 in Grillmair et al. 1999) is bimodal as seen in other elliptical galaxies. The GCs with X-ray sources cover the full range of B-I, with a statistically marginal tendency to be redder than GCs in general. A weak correlation exists between the X-ray flux and B-I (redder GCs are fainter X-ray sources), that breaks down for the brightest sources.
4. Discussion
Chandru observations of NGC 1399 have shown that ~ 7 0 % of the detected X-ray point sources are associated with globular clusters. The spectral properties of most of these sources are similar to those of LMXBs. The X-ray sources in GCs have on average a higher luminosity compared to those not associated with GCs, with many above 2x ergs s-l, the Eddington limit for spherical accretion onto a 1.4 Ma neutron star. Estimates of the distance to NGC 1399 range from N 17 - 23 Mpc (20.5 Mpc is used here; Ferrarese et a]. 2000). Even including a 30% uncertainty in the luminosity the majority of sources still remain above the Eddington luminosity. Although the full luminosity range has not been explored, our findings suggests that luminous LMXBs in giant elliptical galaxies are preferentially located in globular clusters. This result is quite remarkable considering that in our galaxy (and in M31) only 10% of LMXB are in GCs with a typical luminosity of ergs s-l, well below the threshold luminosity, 5 x ergs s-l, for detecting point sources in this Chandra exposure of NGC 1399. Moreover, there are no GC sources with L x > ergs s-lin our galaxy, nor in any of the N 500 globular clusters in M31 (Supper et al. 1997). Super-Eddington luminosities in GC sources are seen in the faint elliptical galaxy NGC 4697 (Sarazin et al. 2001).
The luminosity distribution (Fig 3a) of all sources seems to be divided into three different groups. The three extremely bright sources detected at above > lo3' ergs s-'form one group. Of these, two are identified with GCs and two have unusually soft spectra - reminiscent of black holes in a high state. A second, intermediate luminosity, group of sources have luminosity between 2 and 10 x1O3' ergs s-'. Of these, 15 out of 18 are identified with GCs. A third group, about half of which are in GCs, have luminosities less than 2 x ergs s-l, and with an averages of 1.42 x ergs s-'.
All the LMXBs found in globular clusters in our galaxy have luminosities between -
ergs s-'and - 7 x ergs s-'with many of them transient sources (Hut et al. 1992). They tend to be, on average, less luminous than the galactic bulge or burst sources. Verbunt, van Paradijs and Elson (1984) showed that this difference cannot be explained by the metallicity or mass of the secondary and concluded, given the small number of sources, that the cluster sources are drawn from the same luminosity distribution. If the GC X-ray sources in the NGC 1399 are formed by the tidal capture or exchange collisions of a neutron star (Fabian,Pringle & Rees 1975; Hut, Murphy & Verbunt 1991), then these models must account for the large number of super-Eddington luminosity sources. One possibility is that some GCs contain multiple LMXB systems. In our galaxy there are a relatively small number of globular clusters that have a high frequency of collisions and hence binary formation. NGC 6388 has 20% of all collisions (Predehl, Hasinger & Verbunt 1991) and the expected number of LMXB in this cluster would be 2.4. If we used the same number of collisions for the much larger GC sample of NGC 1399 it is more likely to have several clusters with more than one binary. However, the number of binaries per cluster using the same argument can not be 10 (or more). To explain the upper tail of the luminosity distribution, it requires either a modest number of LMXBs (< 5 ) at the Eddington luminosity per GC or a much higher number of collisions, for these clusters, providing many more lower luminosity systems.
The higher luminosity sources, especially those at and above lo3' ergs s-'may form a distinct population. The ultra-soft spectra observed in two of the brightest systems, one of which is in a GC, are similar to those of high-state black holes seen in our galaxy. The luminosities are then accounted for by fairly massive black holes (> 7 Ma) accreting close to the Eddington limit. The last of the brightest GC sources has a power-law index of N 1.5, similar to the brighter sources in intermediate luminosity group which also show harder color in the color-color plot. This spectral characteristic is typical of low-state black hole systems (like GS 2000+251, GS 1124-68) and although this seems inconsistent with their high luminosity, similar spectral behavior at high luminosities has been seen from the black-hole transient GS2030+338 (Tanaka and Lewin 1995).
If these sources contain black holes it is particularly notable, because to date no black hole candidates have been detected in globular cluster sources in our galaxy. It had been suggested that this was because black holes formed in dense clusters are all likely to be ejected from the cluster due to dynamical effects (Zwart & MclLlillan 2000). In an intermediate density cluster, if a black hole survives, it may be able to form a LMXB (Kulkarni, Hut, MclLlillan 1993). In our galaxy such systems are expected to be in quiescence most of the time - with occasional transient outbursts (White, Swank and Holt 1983). If this is the case, we expect to observe flux variations on a time-scale of a month as the outburst decays. For our limited number of observations this has not yet been observed, but given the lack of monitoring to date, this is inconclusive.
8
The hard spectral component in elliptical gahxies seen with ASC.4 has been resolved into (mostly luminous) LiLIXBs. Both the high ratio of hard-X-ray-to-optical luminosity and the high coincidence rate of X-ray sources and globulars, can be attributed to the high globular cluster specific frequency in NGC 1399. Whether the specific frequency is the determining factor in the total number of LbIXBs in ellipticals in and, indeed, galaxies of all types in general (Sarazin et al. 2001), will be determined as more Chundru galaxy observations are analyzed and compared. As generally is the case in ellipticals, NGC 1399 has a GC bimodal B-I color distribution, but shows an unusually large fraction of red clusters. Whether this excess population is implicated in the unusual LMXB binary population in NGC 1399 also awaits additional observation.
The luminosity threshold of this Chundru observation of 5 x ergs s-’does not include the majority of the luminosity range of the 12 GCs detected in our own galaxy. The origin of the “super-Eddington” X-ray sources in the GCs in NGC 1399 may simply be explained as multiple LMXB within a single GC, or they may be black holes. Clearly we are sampling the tip of the distribution of a much larger LMXB population, both in GC and galactic systems. Understanding the relative size of the two populations, how the GC population of NGC 1399 relates to that of our own galaxy and models for their formation will require a factor of ten deeper exposure with Chundru. This will enable us to reach the threshold luminosity where LMXB (both GCs and galactic) are observed in our galaxy and allow for monitoring of the brightest sources for transient variability.
Acknowledgements. We are very grateful to C. Grillmair for providing the list of the globular positions and magnitudes, and to Eliot Malmuth for assistance with HST images. We thank Frank Verbunt for useful discussion and Nicholas White for many helpful com- ments.
REFERENCES
Ashman, K. M., & Zepf, S. E. 1992, ApJ, 429, 557
Blakeslee, J. 1999, AJ, 118, 1506
Blanton, E. L., Sarazin, C. L., & Irwin, J. A. 2001, ApJ, in press
Clark, G.W., 1975, ApJ, 199, L143
C M , P., Marzke, R. O., & West, hl. J. 1998, ApJ, 501, 544
Fabian,.A. C., Pringle,F.E. and Rees, M.J. , 1975, XINRAS, 172, 1Sp
- 9
Ferrarese, L. et al. A p J , 529, 745
Forbes, D. A., Brodie, .J. P., & Grillmair, C. J. 1997, AJ, 113, 1652
Forbes, D. A., Grillmair, C. J., Williger, G. M., Elson, R. A. W., & Brodie, J . P. 1998, MNRAS, 293, 325
Forman, W., Jones, C. & Tucker, W.C. 1985, ApJ, 293,102
Grillmair, C, J, Forbes, D.A., Brode, J.P., Elson, R.A.W., 1999 ApJ117, 180
Hut, P., Murphy,B.W., & Verbunt, F.,1991, A&A, 241,137
Hut, P., et al., 1992, PASP, 104,981
Kissler-Patig, M., Grillmair, C. J., Meylan, G., Brodie, J. P., Minniti, D., & Goudfrooij, P. 1999, AJ, 117, 1206
Kulkarni, S.R. and McMillan, S. 1993, Nature, 364, 421
Loewenstein, M., Mushotzky, R. F. & Angelini, L. 2001, ApJ, submitted
Matsumoto, H., Koyama, K., Awaki, H., Tsuru, T., Loewenstein, M., & Matsushita, K. 1997, ApJ, 482, 133
Matsushita, K., et al. 1994, ApJ, 436, L41
Merritt, D., & Ferrarese, L. 2001, MNRAS, 320, 30
Mushotzky, R. F., Cowie, L. L., Barger, A. J., Arnaud, K. A., Nature,404, 459.
Predehl,P., Hasinger, G., and Verbunt,F., 1991, A&A, 246, L21.
Sarazin, C. L., Irwin, J. A., & Bregman, J.N. 2000, ApJ, 544, 293
Sarazin, C. L., Irwin, J. A., & Bregman, J.N. 2001, ApJ, in press
Supper, R., Hasinger, G., Pietsch, W., Truemper, J., Jain, A., Magnier, E. A., Lewin, W. H. G., & van Paradijs, J. 1997, 8, 317,328
Tanaka Y. & Lewin W.H.G, 1995, X-ray binaries, ed. W.H.G Lewin, J. van Paradijs & E.P.J. van den Heuvel, Cambridge University Press, 126
Verbunt, F., van Paradijs, J., & Elson, R., 1984, MNRAS,210, 899
White, N. E., Swank, J, Holt, S.S., 1983, ApJ, 207, 711
- 10
Zwart, S.F.P., 8~ MciLIillan, S.L., 2000, Ap.J, 528, L17
This preprint was prepared with the AAS rpTEv macros v5.0.
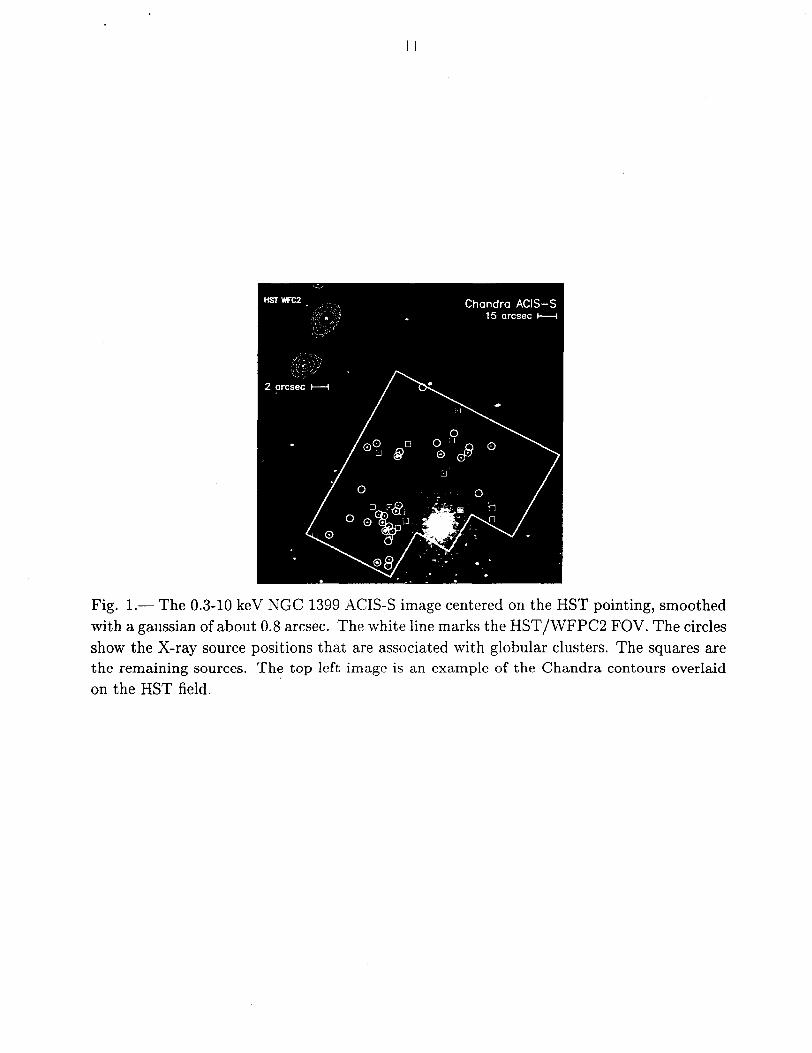
Fig. 1.- The 0.3-10 keV NGC 1399 ACIS-S image centered on the HST pointing, smoothed with a gaussian of about 0.8 arcsec. The white line marks the HST/WFPC2 FOV. The circles show the X-ray source positions that are associated with globular clusters. The squares are the remaining sources. The top left image is an example of the Chandra contours overlaid on the HST field.
2 1 1
I I ' I ' I ' I -
I I - 7 . - - - - - - -. 18 1
8 : J . . . .All sources - - A l l globulars - 3
m 9)
I
t e I I
0 E :
g 12 - I
9) - ' ' r ' 11 I +
3" 8 C I f
0
'c
l+/l '1 ' t t L
* I * . 6 - * . 5 z
n IL I *
I I . I . I . 1 0
1
> s - 0.5 I N \ > s
12 'I' 0.2
0.1
I ' I ' I . I
All optical GC 100 : -
m 0 - I f
. m 'c -: 10 9) -n
: E - 2 - 3
. * . . ' . ..: . 1 - .... : . . , . . . . I I I * . I . I
4 Globular A Non Globular -
I 1 5
0.05 0.5 1 2
0.3-1 keV /1-2 keV
Fig. 2.- Color-color diagram of all sources detected above 50. Most of the sources in the plot (80%) are associated with globular clusters (circles), since on average they are brighter than those that are not (triangles). The curves plotted represent power-law models with constant Nh with varying index. At Nh 3 x lo2' the index varies from the top from 1-2-3.; at Nh 3 x lo2' the index varies from 2-3-4-5. Of the three brightest sources two are located at ( X , Y ) - (2,0.15), one (in a GC) at (1.12,0.58). 50 is chosen for clarity; globular and non-globular clusters do not segregate if the threshold is reduced to 30.