the_economics of franchise
TRANSCRIPT


P1: JZP0521772524agg.xml CB802/Blair 0 521 77252 4 April 29, 2005 22:11
ii
This page intentionally left blank
P1: JZP0521772524agg.xml CB802/Blair 0 521 77252 4 April 29, 2005 22:11
THE ECONOMICS OF FRANCHISING
This book describes in much detail both how and why franchising works. It alsoanalyzes the economic tensions that contribute to conflict in the franchisor–franchisee relationship. The treatment includes a great deal of empirical evidenceon franchising, its importance in various segments of the economy, the termsof franchise contracts, and what we know about how all of these have evolvedover time, especially in the U.S. market. A good many myths are dispelled in theprocess. The economic analysis of the franchisor–franchisee relationship beginswith the observation that for franchisors, franchising is a contractual alternative tovertical integration. Subsequently, the tensions that arise between a franchisor andits franchisees, who in fact are owners of independent businesses, are examined inturn. In particular, the authors discuss issues related to product quality control,tying arrangements, pricing, location and territories, advertising, and terminationand renewals.
Roger D. Blair is Huber Hurst Professor in the Department of Economics at theUniversity of Florida, where he has served on the faculty since 1970. He teachescourses in antitrust economics, law and economics, and the economics of sports.Professor Blair has published 165 articles, primarily in economics journals andlaw reviews, and has contributed numerous chapters to books. He has servedas an antitrust consultant to the U.S. Department of Justice; the Federal TradeCommission; the attorneys general of Arizona, California, Florida, Missouri,Oregon, and Washington; and numerous corporations. The books he has coau-thored include Antitrust Economics, Law and Economics of Vertical Integrationand Control, Monopsony: Antitrust Law and Economics, and forthcoming fromCambridge University Press, Intellectual Property: Economics and Legal Dimen-sions of Rights and Remedies, with Thomas F. Cotter.
Francine Lafontaine is Professor of Business Economics and Public Policy at theStephen M. Ross School of Business at the University of Michigan and Professorof Economics, Department of Economics, University of Michigan. Since joiningthe faculty at Michigan in 1991, Professor Lafontaine has primarily taught appliedmicroeconomics to MBA students, along with elective courses on firm strategyand antitrust and on the economics of franchising. She has published numer-ous scholarly articles on franchising in top journals in her field, including theJournal of Political Economy, the RAND Journal of Economics, the Journal of Lawand Economics, the Journal of Law, Economics and Organization, and the Journalof Industrial Economics, as well as in marketing and entrepreneurship journals.Professor Lafontaine is widely recognized as a world expert on the subject of fran-chising and, as such, has acted as consultant to various companies and FederalTrade Commission.
i

P1: JZP0521772524agg.xml CB802/Blair 0 521 77252 4 April 29, 2005 22:11
ii
P1: JZP0521772524agg.xml CB802/Blair 0 521 77252 4 April 29, 2005 22:11
The Economics of Franchising
ROGER D. BLAIRUniversity of Florida
FRANCINE LAFONTAINEUniversity of Michigan
iii

cambridge university pressCambridge, New York, Melbourne, Madrid, Cape Town, Singapore, São Paulo
Cambridge University PressThe Edinburgh Building, Cambridge cb2 2ru, UK
First published in print format
isbn-13 978-0-521-77252-5
isbn-13 978-0-521-77589-2
isbn-13 978-0-511-16065-3
© Roger D. Blair and Francine Lafontaine 2005
2005
Information on this title: www.cambridge.org/9780521772525
This publication is in copyright. Subject to statutory exception and to the provision ofrelevant collective licensing agreements, no reproduction of any part may take placewithout the written permission of Cambridge University Press.
isbn-10 0-511-16065-8
isbn-10 0-521-77252-4
isbn-10 0-521-77589-2
Cambridge University Press has no responsibility for the persistence or accuracy of urlsfor external or third-party internet websites referred to in this publication, and does notguarantee that any content on such websites is, or will remain, accurate or appropriate.
Published in the United States of America by Cambridge University Press, New York
www.cambridge.org
hardback
paperback
paperback
eBook (EBL)
eBook (EBL)
hardback

P1: JZP0521772524agg.xml CB802/Blair 0 521 77252 4 April 29, 2005 22:11
To my parents, Jacques and Therese, who would have been proud,
and my family, Robert and Colette, for always being there for me.
To the memory of my parents, Duncan and Eleanor Blair,
who gave me so much.
v

P1: JZP0521772524agg.xml CB802/Blair 0 521 77252 4 April 29, 2005 22:11
vi

P1: JZP0521772524agg.xml CB802/Blair 0 521 77252 4 April 29, 2005 22:11
Contents
Preface page xi
1 Introduction 1
1.1 What Is a Franchise? 31.2 Traditional and Business-Format Franchising 51.3 In Which Industries Do We Find Franchising? 81.4 Plan of Study 18
2 Four Popular Misconceptions about Franchising 20
2.1 Growth: Fact and Fancy 212.2 Entry and Exit 342.3 The Size Distribution of Franchised Chains 462.4 Multi-Unit Franchisees 492.5 Conclusion 52
3 Franchise Contracts 54
3.1 Introduction 543.2 Franchise Fees 563.3 Royalty Rates 623.4 Advertising Fees 693.5 Non-Monetary Contract Clauses 783.6 Some Final Thoughts and Comments 79
4 Franchising, Vertical Integration, and Vertical Restraints 82
4.1 Introduction 824.2 Dual Distribution or Partial Vertical Integration
in Franchising 834.3 Contractual Equivalents 944.4 Incentive Issues and Agency Theory 1074.5 Conclusion 116
vii

P1: JZP0521772524agg.xml CB802/Blair 0 521 77252 4 April 29, 2005 22:11
viii Contents
5 Quality Control 117
5.1 Introduction 1175.2 A Simple Model of Vertical Externalities 1215.3 Contractual Efforts to Resolve Incentive Problems 1255.4 Costs of Control 1335.5 Observed Quality Differentials between Company and
Franchised Units 1355.6 Conclusion 137
6 Franchise Tying Contracts 139
6.1 Introduction 1396.2 Antitrust Treatment of Tying Contracts in General 1426.3 Application to Franchise Tying Contracts 1446.4 The Kodak Decision and Its Progeny 1506.5 Franchise Tying Cases After Kodak 1526.6 Identifying Market Power After Kodak 1566.7 Post-Contractual Opportunism 1646.8 Evaluating Franchise Opportunities 1666.9 Conclusion 168
6.10 Appendix: Vertical Integration and Tying Contracts 168
7 Vertical Price Controls in Franchising 174
7.1 Introduction 1747.2 The Legal History of Maximum Resale Price Fixing
in the United States 1777.3 An Economic Analysis of Maximum Resale Price Restraints 1827.4 The Public Policy Implications of Khan 1967.5 Conclusion 1977.6 Appendix: Sales-Based Royalties and Demand Externalities 198
8 Encroachment 202
8.1 Introduction 2028.2 Market Coverage and “Traditional” Encroachment 2048.3 Industry Responses 2228.4 Non-Traditional Encroachment 2318.5 Conclusion 2338.6 Appendix: Carvel Corporation’s Contract: Before and After 234
9 Advertising and Promotion 236
9.1 Introduction 2369.2 A Simple Model of Advertising as Information 2379.3 The Effect of Scale Economies 2449.4 Advertising as a Public Good in Franchised Chains 246
P1: JZP0521772524agg.xml CB802/Blair 0 521 77252 4 April 29, 2005 22:11
Contents ix
9.5 Advertising in Franchised Chains in Practice 2509.6 Franchisor–Franchisee Conflict 2539.7 Conclusion 257
10 Termination and Non-Renewal 258
10.1 Introduction 25810.2 Franchise Contract Duration, Termination, and Renewal:
A Look at the Data 25910.3 The Role of Duration, Termination, and Non-Renewal
in Theory 26410.4 Termination and Non-Renewal: Legal Considerations 27510.5 Assessing Damages for Wrongful Termination 28010.6 Conclusion 290
11 Concluding Remarks 291
11.1 Introduction 29111.2 A Summary 29311.3 International Franchising 29711.4 The Future 29811.5 Conclusion 300
Articles, Books, and Other Publications 303
Cases, Codes, and Statutes 321
Index 325

P1: JZP0521772524agg.xml CB802/Blair 0 521 77252 4 April 29, 2005 22:11
x

P1: JZP0521772524agg.xml CB802/Blair 0 521 77252 4 April 29, 2005 22:11
Preface
Franchising has become a very visible part of the economic landscape in theUnited States. Its role in distributing products to customers in the rest ofthe world has also grown considerably over the last several decades. In thisbook, we describe what franchising is and how it works. In most situations,franchising works very well for franchisors, franchisees, and consumers alike,which is why it has grown to the extent that it has. Because it works well mostof the time, we expect that franchising will continue to flourish in the worldeconomy. At the same time, however, we know from economic principles thatfranchise relationships are by their very nature fraught with many difficultiesarising essentially from differences between the needs and goals of the fran-chisors and those of the franchisees. Economists and management researchershave made significant progress in the last twenty or so years toward increasingour understanding of the sources of these problems. We highlight much oftheir work in this book.
We had many goals in writing this book. First, from a managerial perspec-tive, we hope that an improved understanding of the basic sources of frictionin franchise relationships will allow franchisors and franchisees alike to de-velop better ways of dealing with each other’s concerns, either through thefranchise contract itself or through other means of their choosing. Second,from a public policy perspective, we hope that jurisdictions considering var-ious forms of regulation and control of franchise relationships will be betterable to assess the validity and merit of the claims made by interested parties,and thus the cost and benefit of various forms of intervention. In particular,we explore the not-so-obvious consequences of many types of public policies.Finally, from an academic perspective, we want to provide researchers with aclearer understanding of franchising as an institutional framework. By doingso, we hope to foster more interest in the study of franchising itself and ofcontracts and organizations more generally.
xi

P1: JZP0521772524agg.xml CB802/Blair 0 521 77252 4 April 29, 2005 22:11
xii Preface
For past and continuing collaboration, we thank our colleagues, SugatoBhattacharyya, Amanda K. Esquibel, James Fesmire, Jill Boylston Herndon,Arturs Kalnins, David L. Kaserman, Patrick J. Kaufmann, Scott E. Masten,Emmanuel Raynaud, Richard E. Romano, Kathryn L. Shaw, and MargaretE. Slade. We also thank Robert Picard for his expert data management andassistance throughout this project. We are also grateful to Anne Parmigiani forher careful proofing of the manuscript and to Colette Picard for proofing thetables. Our editor at Cambridge University Press, Scott Parris, also deserves aspecial thanks for his patience and continuing encouragement. Finally, we aregrateful to the National Science Foundation (NSF), under grant SBR-9312083,and our respective institutions for their support.
P1: KsF0521772524c01.xml CB802/Blair 0 521 77252 4 April 29, 2005 18:26
1
Introduction
Franchising has become a part of everyday life for most consumers in theUnited States today – it is everywhere. Numerous firms in a variety of in-dustries have adopted franchising as a method of doing business. As a re-sult, consumers now often purchase meals and hotel services along withcar repairs, clothing, specialty foods, and many other types of goods andservices through franchised companies. Why have so many firms involvedin such different activities all chosen to organize themselves as franchisedcompanies? We know that a combination of factors makes franchising desir-able. On the one hand, the increased reliance of consumers on brand names,due in part to increased consumer mobility and greater time constraints,has played an important role in the development of retail and other chains.1
In addition, chains can benefit from lower costs through bulk purchasingprograms and by realizing economies of scale in production, new productdevelopment, and advertising. These benefits, however, really explain whychains have become more prevalent in the economy, not why franchisinghas become so ubiquitous. After all, the stores in these chains could all becorporately owned, as is the case in many chains. Why then do we see somany other chains organized as franchises? The answer apparently lies inthe capacity of franchising to combine the chain’s comparative advantagesin creating brand recognition and capturing economies of scale with the
1 The increased time constraints, in turn, can be traced to the increased participationof women in the labor force, and the resulting “out-sourcing” by households, as wellas the increasing complexity of products available for consumption. The result is thathouseholds must now make a greater number of more complex consumption decisions.Known brands that reduce uncertainty and thus save time become particularly valuableto customers in this context. Moreover, the cost of creating and maintaining nationalor internationally known brands has gone down dramatically over time.
1

P1: KsF0521772524c01.xml CB802/Blair 0 521 77252 4 April 29, 2005 18:26
2 Introduction
local entrepreneur’s local knowledge and drive.2 In other words, in the idealfranchise relationship, each party is able to specialize in what each does bestand yet benefit from the efforts of the other. In fact, as we will see in moredetail later, most franchise contracts are written such that both parties sharein the sales revenues of the franchised outlet. The contract thus ensures thatboth parties have incentives to put forth effort to increase those revenues.Such joint incentives are more difficult to achieve in a corporate environmentand therein lies the main long-term advantage of franchising over corporateorganization.
The capacity of franchising contracts to harness the effort of a central en-tity, the franchisor, and of a number of local entrepreneurs, the franchisees,explains in our view much of its current prevalence and popularity as a way oforganizing certain economic activities. In particular, franchising is well suitedto retailing and service businesses as firms in these sectors need to establish alarge number of geographically dispersed outlets to reach customers. In thatcontext, both suppliers of franchises, namely the firms who organize them-selves as franchised chains, and the demanders of franchises, that is thoseindividuals eager to develop a small local business, benefit from the intercon-nection that franchising affords them. Franchisors and their franchisees thuscooperate with one another in a kind of partnership. In many regards, theinterests of the franchisor and its franchisees are mutually compatible. Theircooperation increases value for both parties: both earn more profit than theywould absent this cooperation.
In an economic sense, we know that franchising must be efficient as anorganizational form since it continues to thrive in competition with other or-ganizational structures.3 In this book, we summarize much of what is knownabout the economics of franchising. We examine the economic principles thathelp explain its popularity as a method of distribution, but also highlight howeconomic principles can shed light on many ways in which franchisor andfranchisee needs diverge. These divergent interests create conflict between thefranchisor and its franchisees, conflict that undermines the value that coop-eration creates. For continued success, this conflict must be minimized. Webelieve that clearly laying out the sources of conflict is a good first step towardthat goal. We therefore devote a substantial portion of this book to the analysisof conflict in franchising. We also devote significant attention to describing
2 Caves and Murphy (1976) first made this point and developed the argument.3 This follows from the survivor principle. For more on this principle and its origins, see
Stigler (1968).

P1: KsF0521772524c01.xml CB802/Blair 0 521 77252 4 April 29, 2005 18:26
1.1 What Is a Franchise? 3
franchising and analyzing how it works. In the process, we report data onvarious aspects of the franchise relationship wherever available and relevant,complementing existing data with new empirical information we derive froma data set on U.S. franchisors that we have built over time from directories.Because our data and our knowledge of applicable law are particular to U.S.franchising, much of our discussion is focused on the way franchising worksin this country. This, however, is not as much of a shortcoming as one mightsuppose. First, we present non-U.S. information whenever we can. More im-portantly, the general economic principles that we highlight are relevant in allcountries and, as will be clear from available data, franchising practices do notdiffer markedly between countries. Thus, our hope is that the content of thisbook will prove relevant to anyone with an interest in franchising regardlessof where he or she lives and works.
Before launching into an economic analysis of franchising as an orga-nizational form, we explore a few basics to frame our subsequent analy-sis. We begin by defining the franchise relationship, distinguishing betweentraditional and business-format franchising, and identifying the locus andextent of franchising in the U.S. economy. We then describe our data onfranchisors, data that we rely on throughout the book. We conclude thisintroductory chapter by laying out a road map for the remainder of the book.
1.1 What Is a Franchise?
According to the American Heritage Dictionary of the English Language, theword franchise comes from the old French word franche, which means freeor exempt. In medieval times, a franchise was a right or privilege granted bya sovereign power – king, church, or local government. Sovereigns grantedfranchises for various activities, such as building roads, holding fairs, orga-nizing markets, or for the right to maintain civil order and collect taxes. Inessence, the sovereign gave an individual or group of individuals the monopolyrights over a particular activity in a particular location for a certain periodof time. In most cases, the grantee was required to make a payment to thesovereign power for this right or privilege, usually in the form of a share ofthe product or profit. That payment was called a royalty, a term still in use tothis day.
Today, a franchise agreement is most often understood as a contractualarrangement between two legally independent firms in which one firm, thefranchisee, pays the other firm, the franchisor, for the right to sell the fran-chisor’s product and/or the right to use its trademarks and business format

P1: KsF0521772524c01.xml CB802/Blair 0 521 77252 4 April 29, 2005 18:26
4 Introduction
in a given location for a specified period of time. But this use of the termfranchising in the English language only goes back to the late 1950s: accord-ing to Dicke (1992: 2), the word franchise – understood as a method of doingbusiness or distributing goods and services – entered the English businesslexicon in 1959. Moreover, governments still grant franchises in certain in-dustries. This occurs, for example, in the cable TV industry in the UnitedStates where the rights to be the sole provider of cable services in a givenmarket for a certain time period are sold by local governments to firms usu-ally through what is called a “franchise bidding” process.4 In addition, theword franchise is used in the sports industry to refer to the right to operatea team in a particular locale.5 In this book, however, we focus on the type offranchising that represents an ongoing business relationship between legallyindependent commercial firms, and accordingly we use the term to meanonly such arrangements.
According to the Federal Trade Commission (FTC), the body that has ju-risdiction in the United States over federal disclosure rules for franchisors,three elements must be present for a business relationship to be deemed afranchise.6 First, the franchisor must license a trade name and trademark thatthe franchisee operates under, or the franchisee must sell products or servicesidentified by this trademark. Second, the franchisor must exert significantcontrol over the operation of the franchisee or provide significant assistance tothe franchisee. Third, the franchisee must pay at least $500 to the franchisor atany time before or within the first six months of operation.7 Note that thoughthis definition of franchising is specific to the U.S., most definitions used byauthorities outside of the U.S., including Australia, Canada, and the European
4 For more on “franchise bidding” in the U.S. cable industry, see for example Zupan(1989a, 1989b) and Prager (1990) and the references therein. For an analysis of contem-porary highway construction franchise contracts granted by a government, see Engelet al. (2001).
5 For examples of this use of the term franchise, see Noll and Zimbalist (1997) and thehistory of the NFL at http://www.football.com/history/index.shtml.
6 For a detailed account of different definitions of commercial franchises used in theacademic literature across a variety of fields, see Stanworth and Curran (1999). For areview of the legal elements of franchises as per the text of various state franchise laws,see for example Pitegoff (1989).
7 See Federal Trade Commission (1979). See http://www.ftc.gov/bcp/franchise/netrule.htm for a guide to this rule. Note that in its interpretive guide, the FTC specifiesthat payments for inventory at bona fide wholesale prices for resale are not considereda “minimum payment” for the purposes of this last requirement. See Final InterpretiveGuides, 44 Fed. Reg. at 49967.
P1: KsF0521772524c01.xml CB802/Blair 0 521 77252 4 April 29, 2005 18:26
1.2 Traditional and Business-Format Franchising 5
Union (EU), rely on a similar set of criteria.8 In their implementation, how-ever, foreign definitions are often less inclusive. We come back to this brieflybelow.
1.2 Traditional and Business-Format Franchising
In the U.S., the Department of Commerce (USDOC) historically has distin-guished two separate types of franchised relationships: traditional (or productand trade name) franchising and business-format franchising. The formeris characterized by franchised dealers who “concentrate on one company’sproduct line and to some extent identify their business with that company”(USDOC 1988: 1). Thus, the Ford dealer, for example, is identified as a dis-tributor of Ford automobiles. As the name suggests, traditional franchisingis the oldest form of modern franchising. By most accounts, it can be tracedback in the U.S. at least to the mid-1800s when the McCormick Harvest-ing Machine Company and the Singer Sewing Machines Company sold theirproducts through sales agents who were given exclusive sales territories.9 Ini-tially, these firms, like others who used such agents at the time, imposed fewrestrictions or qualifications on their agents and exerted very little control overthem. Over time, however, both companies found they needed more controlover these sales agents if they were to protect their respective reputationsand brands. The McCormick Company responded by establishing company-owned branch houses throughout the U.S. and Canada. These branch houseswere given oversight responsibilities for the sales agents in their territories.As a result, McCormick was able to systematize procedures and communica-tions with its agents, thereby transforming them into what one would nowcall “dealers.” As for the Singer Company, it addressed the need for controlby converting many of the independent agencies into company outlets. Moreimportantly, it devised a series of recommendations for the remaining agentsas to how the offices should be run and, for the first time, required detailed
8 See the Franchising Code of Conduct, Commonwealth of Australia, 1998; the ArthurWishart Act in Ontario, Canada; and the EEC Block Exemption for Vertical Restraints. Notethat a definition of franchising is no longer included directly in the EEC Block Exemptionfor Vertical Restraints, but a description of the contents of franchise agreements is foundin the attached guidelines (text fig. 35, 36, 189ff.) and the know-how definition hasremained the same as in the old EEC Block Exemption for Franchise Agreements.
9 See Dicke (1992) on the history of franchising in the United States, including a de-tailed account of its evolution at these two companies. See also Marx (1985) on thedevelopment of franchising in automobile retailing in the U.S.
P1: KsF0521772524c01.xml CB802/Blair 0 521 77252 4 April 29, 2005 18:26
6 Introduction
financial reporting from these agents. The contracts and methods of controlthat Singer developed at the time are largely recognized as the forerunners ofthe modern franchise agreement.10
Traditional franchising today is comprised largely of automobile dealer-ships, gasoline service stations, and soft-drink bottlers.11 In all of these busi-nesses, the franchisor is a manufacturer who sells finished or semi-finishedproducts to its dealers/franchisees. In turn, the franchisees resell these prod-ucts to consumers or other firms in the distribution chain. Because the fran-chisor’s product is sold to its franchisees, the franchisor’s profits from itsdealer network flow from the markups it earns on these products. In contrastto what occurs in business-format franchising, as described below, traditionalfranchisees do not pay running royalties on their sales.
Traditional franchising accounted for 72.7 percent of all sales by fran-chised chains in 1986, the last year in which the U.S. government collectedand published statistics on franchising.12 The remaining 27.3 percent of allfranchised sales were generated by business-format franchising firms in whichthe franchisor primarily sells a way of doing business (i.e., a business format)to its franchisees. A business-format franchise thus “includes not only theproduct, service, and trademark, but the entire business format itself – amarketing strategy and plan, operating manuals and standards, quality con-trol, and continuing two-way communication” (USDOC 1988: 3).
The first true business-format franchise system was created by MarthaMathilda Harper (Plitt 2000). This entrepreneur developed her network ofHarper Beauty Shops from the early 1890s onward using a business model
10 In England, the development of franchising is usually traced back to the developmentof the “tied house system,” namely the ownership of licensed beer retailers by brewers.See especially Knox (1958) on the reasons behind the growth of this system in London.
11 William E. Metzger is said to have been the first franchisee in automotive retailing; heobtained a franchise to sell steam automobiles from General Motors Corporation in1898 (Justis and Judd 1998: 1–9). Coca-Cola sold its first bottling franchise in 1899.
12 The USDOC cancelled its publication of Franchising in the Economy in 1988 as part ofits privatization program. This publication was the only source of Census-type data onfranchising in the United States. Efforts by the International Franchise Association (IFA)to take over the publication of this annual report on a permanent basis were unsuccessful.However, in cooperation with Frandata Inc., the IFA Educational Foundation recentlyproduced The Profile of Franchising, Volumes I, II, and III. These profiles report summarydata per sector based on information contained in the disclosure documents of allfranchisors that had to file such documents in at least one of the twelve filing U.S. states.Though the resulting set of franchisors covered in the profiles is not the whole populationof franchisors in the U.S., these publications provide some very useful information thatwe rely on when appropriate in the remainder of this book.

P1: KsF0521772524c01.xml CB802/Blair 0 521 77252 4 April 29, 2005 18:26
1.2 Traditional and Business-Format Franchising 7
that included all of the components of a business format as described by theUSDOC, and more. But though she grew her network to more than 500 shopsin the U.S., Canada, and Europe by the mid-1920s, Mathilda Harper unfor-tunately did not leave a lasting mark on franchising. Other firms, such asthe supermarket chain Piggly Wiggly, Hertz Car Rentals, IGA (IndependentGrocers Association), A&W Restaurants, Ben Franklin Retailers, Maid Rite(a hamburger restaurant chain), and Terminix Termite and Pest Control allstarted franchising in the 1920s and are still franchising today. According to theFrench Franchise Federation, Jean Prouvost, owner of the Lainiere de Roubais,launched his network of Pingouin stores also in the 1920s, thereby initiat-ing the concept of franchised distribution in France.13 These early entrantswere followed in the 1930s by companies like Howard Johnson Restaurants,Stewart’s Drive-In, Arthur Murray Schools of Dancing, and Culligan in theU.S., and by the Canadian Tire retail chain and its Associate Store program,Merle Norman Cosmetics, and Le Groupe RONA among others in Canada.14
But it was not until the 1950s, with the advent of chains such as Burger Kingand McDonald’s, and the economic boom of the post–World War II era, thatbusiness-format franchising fully came into its own in the U.S. and Canada,and, even more recently, throughout much of the rest of the world.15
Business-format franchising today encompasses a very large number offirms that provide a wide array of goods and services: automotive productsand services, computer sales, business aids and services, construction andmaintenance, legal, domestic, and childcare services, and non-food retail-ing as well as the more visible hotel, fast-food, and car rental franchises.In exchange for the business format, franchisees typically pay a relativelysmall lump-sum fixed fee at the beginning of the contract period and payrunning royalties that are usually calculated as a fixed percentage of the
13 See Federation Francaise de la Franchise (2003: 12). Though this source indicatesthat the network of stores was developed in the 1930s, the French National Archivesstates that it was started in 1923. See http://www.archivesnationales.culture.gouv.fr/camt/fr/egf/lettrel.html.
14 Some networks, such as IGA, le Groupe RONA, and Best Western International, areorganized as cooperatives whose role it is to provide their franchisees (members) withpurchasing power and name recognition. The development and organization of thesecooperatives is interesting in light of Caves and Murphy’s (1976: 576) view of franchisingas a mechanism by which “franchisees hire out the collective and large-scale productionof goodwill.” See also Lafontaine and Raynaud (2002) for an analysis that draws ananalogy between food production cooperatives and franchises.
15 See Arthur Andersen & Co. (1995) for an overview of the number of franchisors andfranchisees in 36 countries around the world.
P1: KsF0521772524c01.xml CB802/Blair 0 521 77252 4 April 29, 2005 18:26
8 Introduction
franchisee’s sales revenues.16 Business-format franchisees also often con-tribute an additional fraction of their sales or revenues toward an adver-tising fund for the chain as a whole. Presumably, the advertising carried outwith these funds benefits all franchisees and thereby benefits the franchisoras well.
In the end, the distinction between traditional and business-format fran-chising is somewhat arbitrary and basically a matter of degree. Dnes (1992a)and Klein (1995), for example, both argue that there is little economic differ-ence between the two, in terms of either the type of agreements they rely onor the type of support provided or control exerted by franchisors. And whenit comes to theoretical analyses of franchise relationships, the distinction be-tween these two types of franchising indeed is largely irrelevant: researchershave considered both types simultaneously in many studies. But while intheory the distinction may not be so meaningful, it is important from a de-scriptive standpoint for two main reasons. First, in many countries outsidethe U.S., traditional franchising is not included in franchising statistics. As aresult, the franchising sector appears artificially large in the U.S. relative tothese other countries. Second, in the U.S., authors often refer to all franchis-ing when they emphasize its economic importance: after all, sales of goodsand services through traditional and business-format franchising togetheramounted to almost 13 percent of real gross domestic product (GDP) (seeChapter 2), or 34 percent of retail sales, in 1986 according to the USDOC(1988: 14). When presenting data about the growth in franchising in the U.S.,however, the data more often measure business-format franchising only. Thisis because business-format franchising has grown much faster than traditionalfranchising over the last few decades. Thus, the separation of franchising intotwo different types has allowed the trade press to mostly emphasize those fran-chising figures that show franchising in its most favorable light. We return tothe issue of franchising growth in the next chapter.
1.3 In Which Industries Do We Find Franchising?
As noted by the USDOC (1988: 14), “[r]etailing dominates franchising, ac-counting for 87 percent of all franchising receipts in 1987. The retail salesof all firms associated with franchising reached about $522 billion in 1987,
16 There are exceptions to royalties calculated as a percentage of total revenue. These includeminimum payment provisions, increasing and decreasing scales, and royalties definedas a percentage of profits. These alternatives, however, are observed far less frequentlythan constant rate sales revenue royalties. See Chapter 3 for details.

P1: KsF0521772524c01.xml CB802/Blair 0 521 77252 4 April 29, 2005 18:26
1.3 In Which Industries Do We Find Franchising? 9
or 34 percent of all U.S. retail sales, which are estimated at $1.5 trillion.”17
Table 1-1 shows the sectoral breakdown for sales, the number of establish-ments, and employment for franchised firms in the U.S. in 1986 as per theUSDOC (1988). It also shows average sales per establishment in each sector.
Table 1-1 first confirms that sales through traditional franchising are al-most three times the level of sales of business-format franchisors. In contrast,the bulk of the establishments and employment are in business-format fran-chising. The number of establishments is twice as large and the number ofemployees is almost three times larger in business-format than in traditionalfranchising. This implies that sales per unit and sales per employee are muchlarger in traditional than in business-format franchising. This is shown in thelast column of Table 1-1, in which sales per establishment for car dealershipsand soft-drink bottlers completely overwhelm those of gasoline stations aswell as those of every type of business-format franchise. While the govern-ment data above all pertain to 1986, a recent report on the economic impactof franchising in the U.S. economy suggests that business-format franchisingin 2001 encompassed 4.3 times as many establishments and employed fourtimes as many workers as traditional franchising did.18
Table 1-1 also illustrates that franchising occurs in a wide variety of retailand service industries in the U.S. economy. Within business-format fran-chising, the bulk of sales, units, and employees in 1986 were found in therestaurant sector, which includes such well-known chains as Burger King,KFC, Little Caesar’s, McDonald’s, and Subway, among many others. The nextlargest sector from a sales perspective was the non-food retailing sector, whichincludes chains such as The Athlete’s Foot, The Body Shop, Decorating Den,and General Nutrition Centers. From an establishment and an employmentperspective, however, the second largest business-format franchising sectorwas the business aids and services sectors, with firms such as Money Mailer,SignFast, and Snelling Personnel Services.
The data in Table 1-1, however, reflect the sector distribution of franchisingactivities as it existed in 1986. Unfortunately, since Franchising in the Economyis no longer published by the U.S. government, updated figures correspondingto those in Table 1-1 are unavailable. This lack of data has made it quite difficult
17 Retail sales in the U.S. reached $3.5 trillion in nominal terms in 2001 (U.S. CensusBureau, “Monthly Retail Trade Survey,” Historical Retail Trade Data). Assuming thatthe proportion of retail trade accounted for by franchised companies has remained atabout one-third of all retailing, franchising would now account for more than $1 trillionin retail business in the U.S. (in 2001 dollars). We address the issue of franchising growthin Chapter 2.
18 See IFA Educational Foundation and Price Waterhouse Coopers, 2004.

P1: KsF0521772524c01.xml CB802/Blair 0 521 77252 4 April 29, 2005 18:26
10 Introduction
Table 1-1: Sales, establishments, and employment in franchising in the U.S. in 1986
Sales perSales Number of Number of establishment
Sector ($ thousands) establishments employees∗ ($ thousands)
Automobile and Truck Dealers 307,256,000 27,600 947,400 11,132Gasoline Service Stations 86,618,000 120,510 596,400 719Soft-Drink Bottlers 19,662,000 1,203 126,200 16,344
All Traditional Franchising 413,536,000 149,313 1,670,000 2,770
Automotive Products and Servicesa 11,300,863 36,763 186,182 307Business Aids and Servicesb 13,288,254 52,718 669,522 252Construction, Home 4,615,360 18,900 118,991 244
Improvement, Maintenance,and Cleaning Servicesc
Convenience Stores 11,278,895 15,524 152,688 726Educational Products and Servicesd 935,166 8,625 41,210 108Hotels, Motels, and Campgrounds 15,983,990 8,203 555,674 1,949Laundry and Drycleaning Services 291,802 2,297 9,891 127Recreation, Entertainment, 3,549,025 7,901 27,732 449
and Travele
Rental Services (Auto–Truck) f 6,155,006 9,528 66,423 646Rental Services (Equipment)g 716,019 2,718 14,926 263Restaurants 52,273,863 78,203 2,453,621 668Retailing (Food 10,746,011 19,852 214,768 541
Non-Convenience)h
Retailing (Non-Food)i 23,102,779 45,456 274,663 508Miscellaneous j 1,305,715 6,122 44,486 213
All Business-Format Franchising 155,542,748 312,810 4,830,777 497
Total Franchising 569,078,748 462,123 6,500,777 1,231
Note: ∗ Includes part-time and working proprietors.a Includes Tire, Battery, and Accessory Stores; Auto and Truck Wash Services; Brake and Muffler Repair and
Services; and some establishments with significant sales of non-automotive products such as HouseholdAppliances, Garden Supplies, and others.
b Includes Computer Services, Business Consultants and Brokers, Security, Dentists, Insurance, and Others.c Includes Furniture Repairs, Water Conditioning, Lawn Care, Sewer Cleaning, and Carpet Cleaning.d Includes Day-Care Centers and Health and Diet Services.e Includes Travel Agencies, Miniature Golf Courses, and Dance Studios.f Includes Leasing.g Includes Formal Wear.h Includes Retail Specialty Food Shops, Donut Shops, Ice Cream Stores, Coffee Services, Candy Stores,
Bakeries and Supermarkets.i Includes General Merchandise, Drugs and Cosmetics, Gift Shops, Shoes and Apparel, Hardware, Paints
and Floor Covering, Furniture, Draperies and Bedding, Consumer Electronics, and Vending.j Includes Beauty Salons, Fitness Centers, Wholesale Services, and Others.
Source: USDOC (1988) (with calculations for rows involving “all traditional” and “all business format”).

P1: KsF0521772524c01.xml CB802/Blair 0 521 77252 4 April 29, 2005 18:26
1.3 In Which Industries Do We Find Franchising? 11
to accurately assess how franchising has evolved since the mid-1980s in theUnited States.19
In this book, we rely on a database on franchisors that we have constructedfrom franchisor directories to shed some light on the evolution of franchis-ing and the franchise relationship since the mid-1980s, and to provide amore accurate description of current data patterns. Our database covers allthe franchisors that appear at least once in the 1981 to 1993 Entrepreneur’s“Franchise 500” surveys or in the 1994 to 2002 editions of Bond’s SourceBook of Franchise Opportunities, now called the Bond’s Franchise Guide.20
Each year, these publications give detailed profiles for about 1,000 franchis-ing companies and, hence, cover a very significant portion of the industry. Ineach case, the data for a given year are obtained from the next year’s survey ordirectory as these are all published early in the calendar year. In other words,our 2001 data are from the 2002 Bond’s Franchise Guide. After 1994, we choseto use the Bond’s Franchise Guide because Entrepreneur’s 1994 survey coveredfewer chains than usual and, from 1995 onward, Entrepreneur stopped report-ing advertising fee data. Furthermore, the Bond’s Franchise Guide, which hasthe advantage of providing more details on each of the franchisors it profiles,had become an annual publication by then.21 Together, these sources provideinformation from 1980 through 2001 (except for 1999, as the 2000 Bond’sFranchise Guide was never published) and cover more than 5,000 franchisorsin total, 12 percent of which on average are Canadian.
Table 1-2 displays the specific number of franchisors included in our dataeach year. For the years when this information was available, namely the early1980s, the table also shows the total number of U.S. franchisors according tothe USDOC. It is clear from this information that our data are not of censusquality, meaning that not all U.S. franchisors are included in our sources. Infact, the number of U.S. franchisors in the data is slightly below the numbers
19 The 2001 snapshot provided by the IFA Educational Foundation and Price WaterhouseCoopers (2004) does not use the same sector classification as the USDOC. Moreover,it only provides aggregate information on total establishments, jobs, payroll, and valueadded in each sector and does not allow us to follow franchising activities over time.Of course, we still rely on it whenever it provides additional insights into franchisingactivity.
20 We exclude from our data the few chains that are in these sources but yet report eitherno outlet at all (that is, no company nor franchised outlet) or report absolutely no fees(that is, no royalty rate, franchise fee, advertising rate, or ongoing fixed payments) inthe survey year.
21 The Bond’s Franchise Guides were also published in 1985, 1989, and then in 1990–91and 1991–92, and in 1993. Since then, they have been published yearly, except for the2000 edition (with the 1999 data) that was skipped.
P1: KsF0521772524c01.xml CB802/Blair 0 521 77252 4 April 29, 2005 18:26
12 Introduction
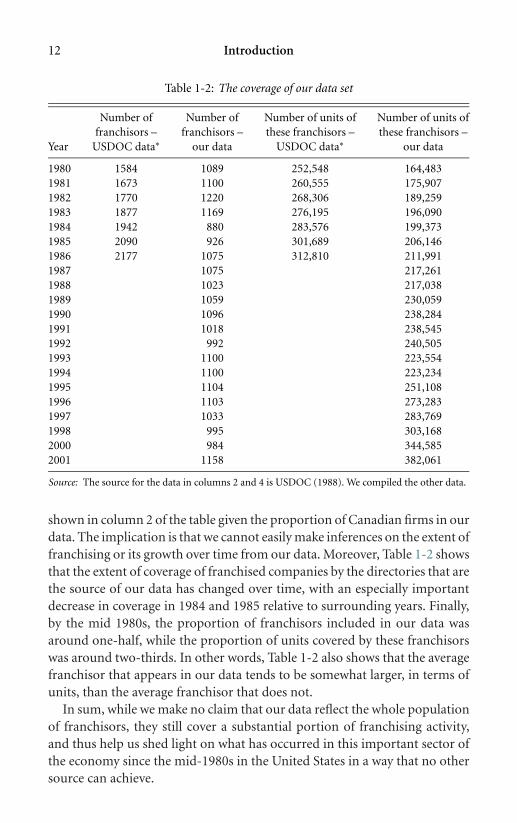
Table 1-2: The coverage of our data set
Number of Number of Number of units of Number of units offranchisors – franchisors – these franchisors – these franchisors –
Year USDOC data∗ our data USDOC data∗ our data
1980 1584 1089 252,548 164,4831981 1673 1100 260,555 175,9071982 1770 1220 268,306 189,2591983 1877 1169 276,195 196,0901984 1942 880 283,576 199,3731985 2090 926 301,689 206,1461986 2177 1075 312,810 211,9911987 1075 217,2611988 1023 217,0381989 1059 230,0591990 1096 238,2841991 1018 238,5451992 992 240,5051993 1100 223,5541994 1100 223,2341995 1104 251,1081996 1103 273,2831997 1033 283,7691998 995 303,1682000 984 344,5852001 1158 382,061
Source: The source for the data in columns 2 and 4 is USDOC (1988). We compiled the other data.
shown in column 2 of the table given the proportion of Canadian firms in ourdata. The implication is that we cannot easily make inferences on the extent offranchising or its growth over time from our data. Moreover, Table 1-2 showsthat the extent of coverage of franchised companies by the directories that arethe source of our data has changed over time, with an especially importantdecrease in coverage in 1984 and 1985 relative to surrounding years. Finally,by the mid 1980s, the proportion of franchisors included in our data wasaround one-half, while the proportion of units covered by these franchisorswas around two-thirds. In other words, Table 1-2 also shows that the averagefranchisor that appears in our data tends to be somewhat larger, in terms ofunits, than the average franchisor that does not.
In sum, while we make no claim that our data reflect the whole populationof franchisors, they still cover a substantial portion of franchising activity,and thus help us shed light on what has occurred in this important sector ofthe economy since the mid-1980s in the United States in a way that no othersource can achieve.
P1: KsF0521772524c01.xml CB802/Blair 0 521 77252 4 April 29, 2005 18:26
1.3 In Which Industries Do We Find Franchising? 13
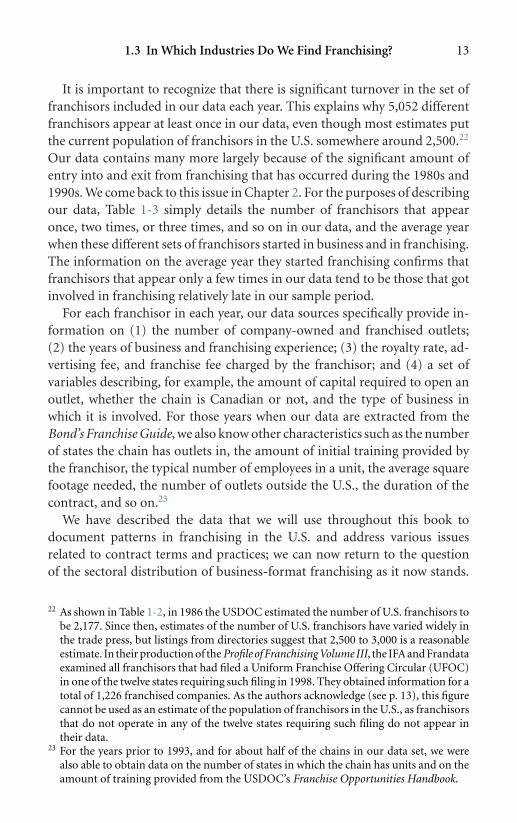
It is important to recognize that there is significant turnover in the set offranchisors included in our data each year. This explains why 5,052 differentfranchisors appear at least once in our data, even though most estimates putthe current population of franchisors in the U.S. somewhere around 2,500.22
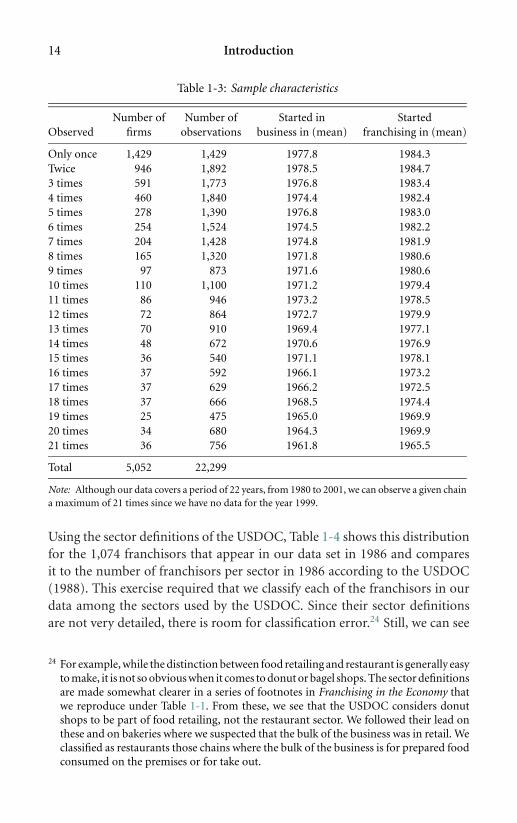
Our data contains many more largely because of the significant amount ofentry into and exit from franchising that has occurred during the 1980s and1990s. We come back to this issue in Chapter 2. For the purposes of describingour data, Table 1-3 simply details the number of franchisors that appearonce, two times, or three times, and so on in our data, and the average yearwhen these different sets of franchisors started in business and in franchising.The information on the average year they started franchising confirms thatfranchisors that appear only a few times in our data tend to be those that gotinvolved in franchising relatively late in our sample period.
For each franchisor in each year, our data sources specifically provide in-formation on (1) the number of company-owned and franchised outlets;(2) the years of business and franchising experience; (3) the royalty rate, ad-vertising fee, and franchise fee charged by the franchisor; and (4) a set ofvariables describing, for example, the amount of capital required to open anoutlet, whether the chain is Canadian or not, and the type of business inwhich it is involved. For those years when our data are extracted from theBond’s Franchise Guide, we also know other characteristics such as the numberof states the chain has outlets in, the amount of initial training provided bythe franchisor, the typical number of employees in a unit, the average squarefootage needed, the number of outlets outside the U.S., the duration of thecontract, and so on.23
We have described the data that we will use throughout this book todocument patterns in franchising in the U.S. and address various issuesrelated to contract terms and practices; we can now return to the questionof the sectoral distribution of business-format franchising as it now stands.
22 As shown in Table 1-2, in 1986 the USDOC estimated the number of U.S. franchisors tobe 2,177. Since then, estimates of the number of U.S. franchisors have varied widely inthe trade press, but listings from directories suggest that 2,500 to 3,000 is a reasonableestimate. In their production of the Profile of Franchising Volume III, the IFA and Frandataexamined all franchisors that had filed a Uniform Franchise Offering Circular (UFOC)in one of the twelve states requiring such filing in 1998. They obtained information for atotal of 1,226 franchised companies. As the authors acknowledge (see p. 13), this figurecannot be used as an estimate of the population of franchisors in the U.S., as franchisorsthat do not operate in any of the twelve states requiring such filing do not appear intheir data.
23 For the years prior to 1993, and for about half of the chains in our data set, we werealso able to obtain data on the number of states in which the chain has units and on theamount of training provided from the USDOC’s Franchise Opportunities Handbook.
P1: KsF0521772524c01.xml CB802/Blair 0 521 77252 4 April 29, 2005 18:26
14 Introduction
Table 1-3: Sample characteristics
Number of Number of Started in StartedObserved firms observations business in (mean) franchising in (mean)
Only once 1,429 1,429 1977.8 1984.3Twice 946 1,892 1978.5 1984.73 times 591 1,773 1976.8 1983.44 times 460 1,840 1974.4 1982.45 times 278 1,390 1976.8 1983.06 times 254 1,524 1974.5 1982.27 times 204 1,428 1974.8 1981.98 times 165 1,320 1971.8 1980.69 times 97 873 1971.6 1980.610 times 110 1,100 1971.2 1979.411 times 86 946 1973.2 1978.512 times 72 864 1972.7 1979.913 times 70 910 1969.4 1977.114 times 48 672 1970.6 1976.915 times 36 540 1971.1 1978.116 times 37 592 1966.1 1973.217 times 37 629 1966.2 1972.518 times 37 666 1968.5 1974.419 times 25 475 1965.0 1969.920 times 34 680 1964.3 1969.921 times 36 756 1961.8 1965.5
Total 5,052 22,299
Note: Although our data covers a period of 22 years, from 1980 to 2001, we can observe a given chaina maximum of 21 times since we have no data for the year 1999.
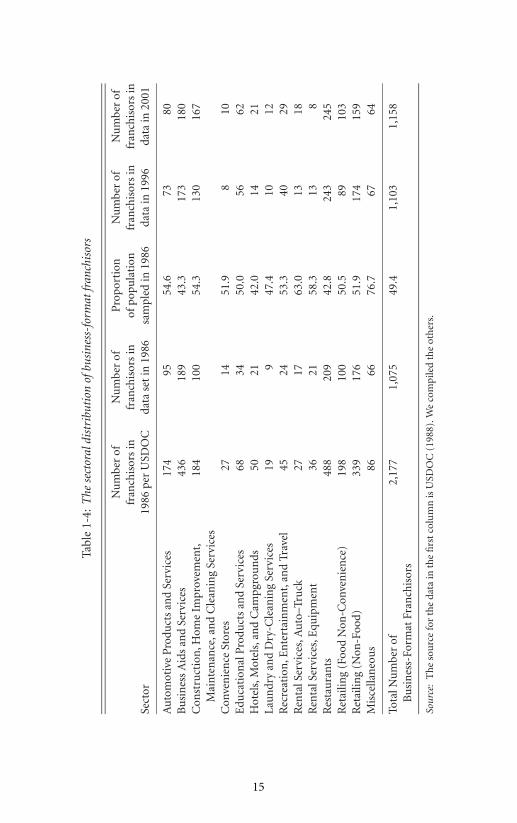
Using the sector definitions of the USDOC, Table 1-4 shows this distributionfor the 1,074 franchisors that appear in our data set in 1986 and comparesit to the number of franchisors per sector in 1986 according to the USDOC(1988). This exercise required that we classify each of the franchisors in ourdata among the sectors used by the USDOC. Since their sector definitionsare not very detailed, there is room for classification error.24 Still, we can see
24 For example, while the distinction between food retailing and restaurant is generally easyto make, it is not so obvious when it comes to donut or bagel shops. The sector definitionsare made somewhat clearer in a series of footnotes in Franchising in the Economy thatwe reproduce under Table 1-1. From these, we see that the USDOC considers donutshops to be part of food retailing, not the restaurant sector. We followed their lead onthese and on bakeries where we suspected that the bulk of the business was in retail. Weclassified as restaurants those chains where the bulk of the business is for prepared foodconsumed on the premises or for take out.
P1: KsF0521772524c01.xml CB802/Blair 0 521 77252 4 April 29, 2005 18:26
Tabl
e1-
4:T
hese
ctor
aldi
stri
buti
onof
busi
ness
-for
mat
fran
chis
ors
Nu
mbe
rof
Nu
mbe
rof
Pro
port
ion
Nu
mbe
rof
Nu
mbe
rof
fran
chis
ors
infr
anch
isor
sin
ofpo
pula
tion
fran
chis
ors
infr
anch
isor
sin
Sect
or19
86pe
rU
SDO
Cda
tase
tin
1986
sam
pled
in19
86da
tain
1996
data
in20
01
Au
tom
otiv
eP
rodu
cts
and
Serv
ices
174
9554
.673
80B
usi
nes
sA
ids
and
Serv
ices
436
189
43.3
173
180
Con
stru
ctio
n,H
ome
Impr
ovem
ent,
184
100
54.3
130
167
Mai
nte
nan
ce,a
nd
Cle
anin
gSe
rvic
esC
onve
nie
nce
Stor
es27
1451
.98
10E
duca
tion
alP
rodu
cts
and
Serv
ices
6834
50.0
5662
Hot
els,
Mot
els,
and
Cam
pgro
un
ds50
2142
.014
21La
un
dry
and
Dry
-Cle
anin
gSe
rvic
es19
947
.410
12R
ecre
atio
n,E
nte
rtai
nm
ent,
and
Trav
el45
2453
.340
29R
enta
lSer
vice
s,A
uto
–Tru
ck27
1763
.013
18R
enta
lSer
vice
s,E
quip
men
t36
2158
.313
8R
esta
ura
nts
488
209
42.8
243
245
Ret
ailin
g(F
ood
Non
-Con
ven
ien
ce)
198
100
50.5
8910
3R
etai
ling
(Non
-Foo
d)33
917
651
.917
415
9M
isce
llan
eou
s86
6676
.767
64
Tota
lNu
mbe
rof
2,17
71,
075
49.4
1,10
31,
158
Bu
sin
ess-
Form
atFr
anch
isor
s
Sour
ce:
Th
eso
urc
efo
rth
eda
tain
the
firs
tco
lum
nis
USD
OC
(198
8).W
eco
mpi
led
the
oth
ers.
15
P1: KsF0521772524c01.xml CB802/Blair 0 521 77252 4 April 29, 2005 18:26
16 Introduction
from Table 1-4 that our best effort at classifying all the franchisors suggeststhat our data covers between 42 and 77 percent of the franchisors in each ofthe USDOC sectors in 1986.
Table 1-4 also shows the number of franchisors in our data set, perUSDOC sector, ten years later in 1996, and then again in 2001. It is diffi-cult to disentangle from these figures how much of the change in numbersof franchisors per sector between 1986 and 1996 or 2001 is due to samplingchanges, and how much is due to real growth in some sectors compared toothers. Assuming that there has not been a major change over time in the sur-vey sampling procedures used by our sources, the data in Table 1-4 suggestthat there has been some decline since the mid-1980s in the number of auto-motive products and services franchisors and equipment rental franchisors.On the other hand, the data indicate that there are now more franchisors inthe construction, maintenance and cleaning services industry, in the educa-tional products and services sector, and in the restaurant sector. We expect thelatter reflects the relative growth in the number of sandwich and bagel shopsas well as the newer quick-casual segment of this industry. These patternsare confirmed generally by corresponding data from the IFA Educational andPrice Waterhouse Coopers (2004) report which show a significant decrease,relative to the 1986 USDOC data, in the number of establishments in theautomotive sector in the U.S. (from the 36,763 shown in Table 1-1 to 28,755in 2001 according to the IFA report) and a substantial increase in the numberof restaurants (from 78,203 in Table 1-1 to 183,318 in the IFA report). Un-fortunately, differences in sector definitions between the sources prevent usfrom making further comparisons.
As we discuss in some detail in Chapter 2, our data set offers a goodapproximation of the overall population of new franchisors except for thelast few years of our data. To provide a better sense of where entry has beenmost prevalent in the 1980s and early 1990s, we rely on the number of newfranchisors in our data per USDOC sector. Specifically, we present in Table 1-5the number of franchisors that started franchising in every three-year period,starting in 1980 and ending in 1997. We end with 1997 because we only have afew years of data to identify the new entrants at the end of our sample periodand, hence, we do not capture them all. But from our earlier data, more than90 percent of the franchisors appear in our data within five to six years ofwhen they start franchising. Thus, the number of new franchisors in 1995and 1996 may still be underestimated in Table 1-5; for all the years prior tothat, however, we have a reasonable estimate of the number of new entrants.
The data in Table 1-5 first show a sizable reduction in the number of newfranchisors in the early 1990s relative to the 1980s, even ignoring the 1995 to

P1: KsF0521772524c01.xml CB802/Blair 0 521 77252 4 April 29, 2005 18:26
Tabl
e1-
5:T
hese
ctor
aldi
stri
buti
onof
new
busi
ness
-for
mat
fran
chis
ors
Nu
mbe
rof
fran
chis
ors
inda
tase
tth
atst
arte
dfr
anch
isin
gin
:
Sect
or19
80–8
219
83–8
519
86–8
819
89–9
119
92–9
419
95–9
7To
tal
Au
tom
otiv
eP
rodu
cts
and
Serv
ices
5055
5030
1912
216
Bu
sin
ess
Aid
san
dSe
rvic
es14
310
213
111
470
3559
5C
onst
ruct
ion
,Hom
eIm
prov
emen
t,73
5868
7148
3935
7M
ain
ten
ance
,an
dC
lean
ing
Serv
ices
Con
ven
ien
ceSt
ores
54
43
53
24E
duca
tion
alP
rodu
cts
and
Serv
ices
3228
3424
329
159
Hot
els,
Mot
els,
and
Cam
pgro
un
ds8
811
74
745
Lau
ndr
yan
dD
ry-C
lean
ing
Serv
ices
28
114
43
32R
ecre
atio
n,E
nte
rtai
nm
ent,
and
Trav
el26
2620
2226
812
8R
enta
lSer
vice
s,A
uto
–Tru
ck13
84
33
233
Ren
talS
ervi
ces,
Equ
ipm
ent
1932
1318
32
87R
esta
ura
nts
139
107
134
120
8427
611
Ret
ailin
g(F
ood
Non
-Con
ven
ien
ce)
6469
6632
3519
285
Ret
ailin
g(N
on-F
ood)
130
105
143
9090
5261
0M
isce
llan
eou
s73
5152
5831
2428
9
Tota
lBu
sin
ess-
Form
atFr
anch
isin
g77
766
174
159
645
424
234
71
Sour
ce:
Com
pile
dby
the
auth
ors.
17
P1: KsF0521772524c01.xml CB802/Blair 0 521 77252 4 April 29, 2005 18:26
18 Introduction
1997 data. On average, for the three 3-year periods in the 1980s, there weremore than 700 new entrants; for the two 3-year periods in the early 1990s,the average declined to 525. Consistent with Table 1-4, Table 1-5 also showsfewer new franchisors in the automotive products and services sector and inthe equipment rental sector in the early 1990s than in earlier periods. Othersectors, such as the educational products and services sector and, to a lesserextent, the construction and maintenance and restaurant sectors, show a fairlyconstant number of new entrants over the 1980 to 1994 period despite thefairly large decline in total entry at the end of this time period. In other words,in proportion to total entry, these sectors are more than holding their own.This further supports the data in Table 1-4 in which we found significantgrowth in these sectors.25
According to the USDOC data and industry sources, the growth inbusiness-format franchising was tied to the fast-food industry in the 1960sand to the business aids and services and the automotive products and ser-vices in the 1970s. Our data suggest that in the 1980s and early 1990s, ithas been tied mostly to the personal service sector (such as maid services,day-care facilities, lawn maintenance, and health and fitness services) and tothe diversification and continued growth of franchising within the restaurantindustry.
1.4 Plan of Study
Our goal in The Economics of Franchising is to both describe how franchisingworks and highlight the economic tensions that contribute to conflict in thefranchisor–franchisee relationship. To this end, we begin in Chapter 2 withan examination of four popular misconceptions regarding franchising. Thesemisconceptions involve the extent of growth, the financial security affordedby franchising, the size of franchised chains, and the extent of single-unitownership by franchisees.
In Chapter 3, we highlight some of the main components of franchisecontracts, paying particular attention to the financial components of thecontract, namely royalty rates, franchise fees, and advertising fees. For each ofthese, we examine in particular their levels and how they vary across chainsand industries. We also investigate how the tendency to use these differentfees and the levels at which they are set have evolved between 1980 and 2001.
25 Of course, growth really depends not only on entry, but also on how many firms exitthe sector. We return to this issue in Chapter 2.

P1: KsF0521772524c01.xml CB802/Blair 0 521 77252 4 April 29, 2005 18:26
1.4 Plan of Study 19
We conclude, among other things, by pointing out the similarity between thefees structures and levels charged by U.S. and non-U.S. franchisors.
In Chapter 4, we explore franchising as a contractual alternative to verticalintegration for franchisors. We show how firms involved in franchising typ-ically use a mix of franchised and vertically integrated, or company-owned,outlets. We then present a more detailed examination of a set of vertical re-straints that can be used to replicate the vertically integrated outcome, at leastin theory, and evaluate their performance under various circumstances. Fi-nally, we discuss agency–theoretic arguments that have been used to explainvariation in the main financial contract terms used in franchise contracts, andshow how these arguments also can shed light on why different franchisorschoose different levels of vertical integration.
From that point on, each of the remaining chapters of this book is dedi-cated to a detailed examination of a specific conflict area between franchisorsand franchisees. We begin each of these chapters with the economic motiva-tion for the problem, followed by an examination of the relevant court casesand legislation, if applicable. We conclude each chapter by examining thelikely effect of this source of conflict on franchisors, franchisees, and fran-chising as a method of distribution. Specifically, we explore quality controland quality decisions in Chapter 5. We review input purchase requirements inChapter 6. Chapter 7 focuses on pricing decisions and price constraints. InChapter 8, we examine outlet location decisions and the encroachment prob-lem. We discuss inherent conflicts of interest related to advertising and pro-motion in Chapter 9 and terminations, renewals and transfers of franchisedunits in Chapter 10. Chapter 11 concludes by returning to the idea that despiteall these sources of conflict, franchising is a robust organizational form thathas withstood the test of time and will continue to play a major role in theU.S. and global economies.
P1: KsF0521772524c02.xml CB802/Blair 0 521 77252 4 April 30, 2005 12:17
2
Four Popular Misconceptions about Franchising
There are many misconceptions surrounding franchising in the United Statesand abroad. In our view, these misconceptions result from relying on casualimpressions rather than a careful evaluation of the empirical evidence. In thischapter, we focus our attention on four such misconceptions. By summarizingthe existing data, we hope to disabuse the reader of these misconceptions andthereby generate a more realistic appreciation of franchising.
We begin with the notion that franchising has been growing at a phenom-enal rate in the U.S. for several decades. As we shall show, this impression ismisleading: for the last two decades at least, our best estimates indicate thatfranchising in the U.S. has grown, at most, at rates commensurate with therest of the economy. Interestingly, research conducted in the United Kingdomsuggests that similar claims of tremendous growth in franchising in thatcountry in the 1990s are also ill-founded. Second, we examine the extentof entry and exit for franchisors, and then also for franchisees. The datashow that many firms indeed become new franchisors each year, a fact thatis well-publicized in the trade press. But many firms also exit franchisingor fail, and this generally receives much less attention. As for franchisees,we find that the notion that franchising poses substantially fewer businessrisks for franchisees than starting an independent business is not supportedby the data. Third, we consider the size of franchised chains. Contrary tothe impression created by the pervasive presence of very large franchisedchains with household names such as Dunkin’ Donuts, H&R Block, andMcDonald’s, we show that the majority of franchised chains are quite smalland, thus, not well-established contrary to what people expect. Fourth, andfinally, there is an impression that franchisees’ businesses are necessarilysmall, “mom-and-pop” ventures, with each of them operating a single unit.This is also not true: multi-unit franchising is pervasive, and a number of
20

P1: KsF0521772524c02.xml CB802/Blair 0 521 77252 4 April 30, 2005 12:17
2.1 Growth: Fact and Fancy 21
multi-unit franchisees are large enough to rival the size of their own or otherfranchisors.
2.1 Growth: Fact and Fancy
In this section, we explore how franchising has grown relative to the economyas a whole since the early 1970s. These facts are then compared to the impres-sion of tremendous growth found in the trade press. Our point here is not todeny the importance of franchising as an organizational form, nor the rolethat it has played in the growth of the economy over the last few decades. Onthe contrary, it should be clear from the preceding chapter that franchisingis a very important method of doing business in the U.S. and elsewhere. Butmany of the reports of its growth in the last two decades have been grosslyexaggerated and must be put in proper perspective.
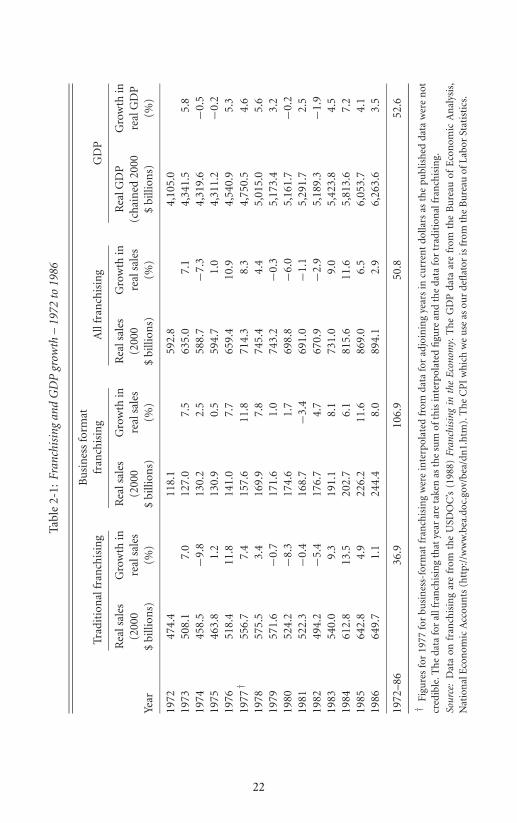
We begin our assessment with the period 1972 to 1986, when census-type data on the number of franchisors, the number of units, and sales byfranchised chains are available from the USDOC.26 Table 2-1 contains thesales data, in real 2000 U.S dollars, and the growth rates in these real saleslevels for traditional and business-format franchising, separately and overall(all franchising), between 1972 and 1986. For comparison purposes, the tablealso includes data on real GDP and its growth over the same period.
The data in this table imply that business-format franchising indeed hasoutperformed the economy as a whole over most of this period. Specifically,in real terms, business-format franchising sales have grown by 106.9 percentbetween 1972 and 1986 while GDP grew by 52.6 percent over the sameperiod. Traditional franchising, however, has grown less than the rest of theeconomy, by 36.9 percent during this time. The result is that the sum of allfranchising has grown at a rate that is basically the same as the rate of growthof the economy as a whole. This growth rate is nowhere near the double-digitgrowth rates suggested by the popular press. For example, the FranchiseTimes, April 1996, reports that “Franchising growth should increase in 1996,with total unit expansion projected between 12% and 14%, up from 1995’s10% to 12%.” Equivalent and even higher growth figures appeared regularlyin the trade press throughout the late 1970s and 1980s. We further examinethe genesis of some of these very optimistic growth figures below. For now, wesimply conclude that even business-format franchising did not grow at these
26 This source, which was first published in 1969, was modified significantly in 1972 suchthat only the data from that year onward are comparable.
P1: KsF0521772524c02.xml CB802/Blair 0 521 77252 4 April 30, 2005 12:17
Tabl
e2-
1:Fr
anch
isin
gan
dG
DP
grow
th–
1972
to19
86
Bu
sin
ess
form
atTr
adit
ion
alfr
anch
isin
gfr
anch
isin
gA
llfr
anch
isin
gG
DP
Rea
lsal
esG
row
thin
Rea
lsal
esG
row
thin
Rea
lsal
esG
row
thin
Rea
lGD
PG
row
thin
(200
0re
alsa
les
(200
0re
alsa
les
(200
0re
alsa
les
(ch
ain
ed20
00re
alG
DP
Year
$bi
llion
s)(%
)$
billi
ons)
(%)
$bi
llion
s)(%
)$
billi
ons)
(%)
1972
474.
411
8.1
592.
84,
105.
019
7350
8.1
7.0
127.
07.
563
5.0
7.1
4,34
1.5
5.8
1974
458.
5−9
.813
0.2
2.5
588.
7−7
.34,
319.
6−0
.519
7546
3.8
1.2
130.
90.
559
4.7
1.0
4,31
1.2
−0.2
1976
518.
411
.814
1.0
7.7
659.
410
.94,
540.
95.
319
77†
556.
77.
415
7.6
11.8
714.
38.
34,
750.
54.
619
7857
5.5
3.4
169.
97.
874
5.4
4.4
5,01
5.0
5.6
1979
571.
6−0
.717
1.6
1.0
743.
2−0
.35,
173.
43.
219
8052
4.2
−8.3
174.
61.
769
8.8
−6.0
5,16
1.7
−0.2
1981
522.
3−0
.416
8.7
−3.4
691.
0−1
.15,
291.
72.
519
8249
4.2
−5.4
176.
74.
767
0.9
−2.9
5,18
9.3
−1.9
1983
540.
09.
319
1.1
8.1
731.
09.
05,
423.
84.
519
8461
2.8
13.5
202.
76.
181
5.6
11.6
5,81
3.6
7.2
1985
642.
84.
922
6.2
11.6
869.
06.
56,
053.
74.
119
8664
9.7
1.1
244.
48.
089
4.1
2.9
6,26
3.6
3.5
1972
–86
36.9
106.
950
.852
.6
†Fi
gure
sfo
r19
77fo
rbu
sin
ess-
form
atfr
anch
isin
gw
ere
inte
rpol
ated
from
data
for
adjo
inin
gye
ars
incu
rren
tdo
llars
asth
epu
blis
hed
data
wer
en
otcr
edib
le.T
he
data
for
allf
ran
chis
ing
that
year
are
take
nas
the
sum
ofth
isin
terp
olat
edfi
gure
and
the
data
for
trad
itio
nal
fran
chis
ing.
Sour
ce:
Dat
aon
fran
chis
ing
are
from
the
USD
OC
’s(1
988)
Fran
chis
ing
inth
eE
cono
my.
Th
eG
DP
data
are
from
the
Bu
reau
ofE
con
omic
An
alys
is,
Nat
ion
alE
con
omic
Acc
oun
ts(h
ttp:
//w
ww
.bea
.doc
.gov
/bea
/dn
1.h
tm).
Th
eC
PI
wh
ich
we
use
asou
rde
flat
oris
from
the
Bu
reau
ofLa
bor
Stat
isti
cs.
22

P1: KsF0521772524c02.xml CB802/Blair 0 521 77252 4 April 30, 2005 12:17
2.1 Growth: Fact and Fancy 23
rates during this period: 106.9 percent over a 14-year period amounts to about7.6 percent per year.
Figures 2-1 and 2-2 show the data on franchising growth relative to GDPgrowth in two additional ways. Figure 2-1 presents information on theevolution of the number of units of business-format and traditional fran-chised chains, along with data on the evolution of real GDP, from 1972 to1986. We use the number of units instead of sales as an alternative way tocapture real rather than nominal growth in franchising. Figure 2-2 jointly ad-dresses the issue of same-unit growth along with growth in number of unitsby depicting the value of goods sold through franchising as a proportion ofreal GDP between 1972 and 1986. Such a ratio gives a “unit free” measure ofthe extent of franchising, eliminating the need to distinguish between nomi-nal and real figures.27 In both figures, the franchising data again are from theUSDOC (1988).
Figure 2-1 first shows the dramatic decrease in the number of units intraditional franchising over this period, mostly due to the closing of a largenumber of smaller gasoline stations that were replaced by the new “pumper”stations that could handle much larger sales volumes. It also shows that thenumber of units in business-format franchising has grown steadily over thisperiod. But, of course, GDP also has grown during this time. As the timetrends in the two series are quite similar, it appears that in terms of units,business-format franchising was growing at a rate similar to that of theeconomy as a whole even back in the 1970s and early 1980s. Perhaps mostimportantly, Figure 2-1 addresses directly one type of claim about franchisinggrowth that is currently found in the trade press: “With a new franchisebusiness opening somewhere in the U.S. every 17 minutes, franchising isindeed the success story of the 1980s and 1990s” (IFA, Winter 1992 FranchiseOpportunities Guide, 10). In the Winter 1995 edition, this figure had become“a new franchise business every 8 minutes” (12). But a new franchise businessevery 17 minutes is equivalent to 85 new franchises per day, or more than30,000 new franchises per year. A new franchise every 8 minutes amounts tomore than 65,000 new franchises a year. The data in the graph suggest a muchmore modest growth than either of these startling claims, even if we focuson business-format franchising and even if the period covered by the graphis seen by many as the prime period of growth for this form of franchising.On average, between 1972 and 1986, business-format franchising grew byabout 9,000 units per year. This is noteworthy growth, but nothing close
27 For meaningful comparisons, both franchising sales and GDP need to be measured inthe same units, either both in real dollars or both in nominal dollars.

P1: KsF0521772524c02.xml CB802/Blair 0 521 77252 4 April 30, 2005 12:17
Yea
r
Number of Units
GDP in billions of chained 2000 dollars
Tra
ditio
nal -
uni
ts
Bus
. For
mat
- u
nits
Rea
l GD
P
Figu
re2-
1:N
um
ber
ofu
nit
san
dre
alG
DP
inth
eU
.S.
24

P1: KsF0521772524c02.xml CB802/Blair 0 521 77252 4 April 30, 2005 12:17
Yea
r
% of GDP
Tra
ditio
nal (
ratio
of c
urre
nt $
)
Bus
. for
mat
(ra
tio o
f cur
rent
$)
Tot
al (
ratio
of c
urre
nt $
)
Figu
re2-
2:Fr
anch
isin
gsa
les
asa
per
cen
tof
GD
P19
72–1
986.
25

P1: KsF0521772524c02.xml CB802/Blair 0 521 77252 4 April 30, 2005 12:17
26 Four Popular Misconceptions about Franchising
to the claims above. Further, if we extrapolate from the data in the graph, thereis nothing there to suggest that this growth should be expected to increasedramatically later and thus justify the claims made in the early 1990s. Finally,the number of traditional franchised units actually decreased between 1972and 1986, and again there is nothing in the data and nothing going on inthe industry to suggest this would reverse itself. Indeed, the retail gasolineindustry at the time was replacing its large number of older stations, eachwith just a few pumps, service bays and full service, with a smaller numberof large self-serve multi-pump stations with attending convenience storesinstead of service bays (see, e.g., Marvel 1995). And in fact, according to theU.S. census of retailing, the number of establishments within the traditionalfranchising sectors of gasoline retailing, car retailing and soft-drink bottlingwas down from 149,313 in 1986 to 130,640 in 1992, and by 1997, it haddecreased further to 125,509.
Figure 2-1, however, and the discussion above focus solely on changes inthe number of franchising establishments. This is an important variable toconsider as most of the growth in franchising, especially in business-formatfranchising, is achieved through new units. Yet, sales revenues in franchisingcan increase independently from higher numbers of units if per unit salesvolumes are increasing in real terms, as happened for example in traditionalfranchising. In fact, for traditional franchising, the only way to reconcile thedata in Table 2-1 – where traditional franchising sales increased on averagethroughout the period in real terms – with the decrease in number of outletsshown in Figure 2-1 is to recognize that real sales per outlet have grown intraditional franchise businesses.
Figure 2-2 simultaneously captures growth in the number of units and insales per unit relative to GDP growth by showing the ratio of franchisingsales to GDP. From this figure, it is clear that the value of goods sold throughtraditional franchising outlets has fluctuated somewhat, but it has remainedfairly stable overall as a percent of GDP between 1972 and 1986. The value ofgoods sold in outlets of business-format franchisors, on the other hand, hasrisen from 2.3 to 3.5 percent of GDP. Combined then, the value of goods soldthrough outlets of franchised firms increased from 11.6 percent in 1972 to12.8 percent of GDP in 1986. Extrapolating from this trend, one would expectfranchising sales to represent about 13.6 percent of nominal GDP in 2001, or1.37 trillion dollars.28
28 Nominal GDP in 2001 in the U.S. was $10.08 trillion. Note that under the assump-tion that franchise retail sales have remained at about one-third of all retailing (as theywere in 1986, per the USDOC – see Chapter 1), and with retail sales in 2001 at close
P1: KsF0521772524c02.xml CB802/Blair 0 521 77252 4 April 30, 2005 12:17
2.1 Growth: Fact and Fancy 27
Unfortunately, with the demise of the USDOC’s Franchising in the Economy,it is quite difficult to assess how franchising as a whole in fact has grown inthe U.S. since 1986. Efforts by the IFA and various partners to take over thepublication of this report on a permanent basis have not been successful,mainly because the response rates achieved by the IFA and its collaboratorshave been too low.29 Thus, from the perspective of assessing the extent andgrowth of franchising in the U.S., the loss of Franchising in the Economy hasbeen a major setback.
In particular, it is the growth in business-format franchising since 1986 thatis difficult to assess given the loss of this publication. This is because business-format franchising is not an industry but a way of doing business that is usedin a number of different retail and service sectors. As a result, the standardsource of industry data, namely the Census, is not useful for our purposes.Specifically, as the U.S. Census Bureau does not request information fromretailers and service firms about how they are organized, one cannot findinformation relevant to business-format franchising in the data published bythe Census Bureau.30
In contrast, traditional franchising encompasses all businesses involved inonly a few sectors of economic activity. Hence, relevant data on this fran-chising segment are available directly from the U.S. Census Bureau. Table 2-2displays the evolution of sales revenues in current dollars for car dealers and
to $3.5 trillion, franchise retail sales would amount to about $1.15 trillion. Assumingretailing still constitutes about 87% of franchising sales, as the USDOC indicates it didin 1986, then total franchising would amount to $1.33 trillion. Because this estimateis very similar to the one we obtained above using GDP data, it is reasonable to con-clude that the retail portion of franchising indeed still represents about one-third of allretailing. This conclusion, however, contradicts the oft-quoted forecast that franchisingwould account for half of retail sales in 2000. This forecast, much too often quoted todayas fact, can be traced back to the Naisbitt Group (1989), a study commissioned by theIFA. We chose to focus our analyses on the importance of franchising vis-a-vis GDPrather than retail sales because an important part of business-format franchising occursoutside of retailing.
29 See, e.g., Lafontaine (1995a), Bond (1996), and IFA Educational Foundation andFrandate Corp. (2000) for discussions of the problems with issues of Franchising inthe Economy that were published by the IFA Educational Foundation along with variouspartners. The last issue published by the USDOC was the 1986–88 issue, with 1986 data.
30 Two exceptions are the “1997 Accommodation and Foodservices Series” and the “Char-acteristics of Business Owners (CBO) Survey” carried out in 1992 by the U.S. CensusBureau, which included some information about franchising. However, the former waslimited to the lodging and restaurant sectors. The CBO survey was not designed to allowinferences on the extent of franchising and has not yet been repeated. Going forward,we will refer to some studies that have relied on some of these data for other purposes.

P1: KsF0521772524c02.xml CB802/Blair 0 521 77252 4 April 30, 2005 12:17
28 Four Popular Misconceptions about Franchising
Table 2-2: Traditional franchising and GDP – 1972 to 2001 (current $ billions)
All traditionalNew car dealerships Gasoline stations Soft-drink bottling franchising
Sales % of Sales % of Sales % of Sales % ofYear ($ billions) GDP ($ billions) GDP ($ billions) GDP ($ billions) GDP
1972 75.4 6.1 33.1 2.7 5.5 0.4 113.9 9.21973 85.0 6.1 36.9 2.7 5.7 0.4 127.6 9.21974 77.2 5.1 43.1 2.9 6.7 0.4 127.0 8.51975 84.9 5.2 47.6 2.9 8.6 0.5 141.1 8.61976 105.6 5.8 52.0 2.9 8.8 0.5 166.5 9.11977 121.8 6.0 56.6 2.8 10.0 0.5 188.5 9.31978 136.4 5.9 59.9 2.6 11.4 0.5 207.7 9.11979 142.9 5.6 73.5 2.9 12.5 0.5 228.9 8.91980 130.5 4.7 94.1 3.4 13.9 0.5 238.5 8.51981 144.5 4.6 103.1 3.3 15.3 0.5 262.8 8.41982 154.7 4.8 97.4 3.0 16.8 0.5 269.0 8.31983 187.7 5.3 102.9 2.9 17.3 0.5 307.9 8.71984 225.9 5.7 107.6 2.7 18.1 0.5 351.5 8.91985 251.6 6.0 113.3 2.7 19.4 0.5 384.3 9.11986 270.4 6.1 102.1 2.3 20.7 0.5 393.2 8.81987 280.5 5.9 104.8 2.2 22.0 0.5 407.3 8.61988 303.3 5.9 110.3 2.2 23.3 0.5 436.9 8.61989 311.6 5.7 122.9 2.2 23.0 0.4 457.5 8.31990 316.0 5.4 138.5 2.4 23.8 0.4 478.3 8.21991 301.3 5.0 137.3 2.3 25.2 0.4 463.7 7.71992 333.8 5.3 156.6 2.5 25.4 0.4 515.8 8.11993 379.5 5.7 162.6 2.4 26.0 0.4 568.1 8.51994 435.7 6.2 171.4 2.4 28.3 0.4 635.4 9.01995 464.6 6.3 181.3 2.5 30.2 0.4 676.1 9.11996 502.3 6.4 194.6 2.5 32.0 0.4 729.0 9.31997 519.0 6.2 199.9 2.4 31.4 0.4 750.2 9.01998 545.1 6.2 191.7 2.2 32.3 0.4 769.1 8.81999 611.9 6.6 209.4 2.3 32.3 0.3 853.6 9.22000 638.0 6.5 244.5 2.5 33.0 0.3 915.4 9.32001 669.6 6.6 237.7 2.3 34.4 0.3 941.6 9.3
Source: U.S. Census Bureau: Car and Gasoline Retailing data are from the “Historical Retail TradeData” series; data for Soft-Drink Bottling are from the “Annual Survey of Manufacturers.”
gasoline stations and soft-drink bottlers from 1972 to 2001 per the “Histori-cal Retail Trade Data” from the U.S. Census Bureau (for car dealerships andgasoline stations) and the “Annual Survey of Manufacturers” (for soft-drinkbottling). The table also shows the proportion of nominal GDP that theserepresent.
P1: KsF0521772524c02.xml CB802/Blair 0 521 77252 4 April 30, 2005 12:17
2.1 Growth: Fact and Fancy 29
The data in this table first confirm what we found earlier, namely thatsales growth in traditional franchising between 1972 and 1986, although siz-able in nominal terms, has more or less followed the growth of the economyas a whole in real terms over this period. But this table also shows that thispattern has persisted after the mid-1980s, so that sales via traditional fran-chising have continued to represent a fairly stable 8 to 9 percent of GDP allalong. This is an important fact given that traditional franchising representsthe bulk of all franchising sales. Consequently, its growth is a main driver ofoverall franchising growth in the economy.
As for business-format franchising, one can obtain estimates of the num-ber of franchisors over recent years using various franchisor directories, andcalculate the growth in these figures. This exercise, of course, only makes senseif the number of franchisors closely tracks changes in the number of units andsales revenues of franchised chains. Table 2-3 shows the growth in the numberof franchisors, total sales of franchised chains, and the number of establish-ments over the 1972 to 1986 period, when all three measures were available.The correlation between the number of franchisors and real sales revenuesis 0.93 and the correlation between the number of franchisors and the num-ber of units is 0.99. Moreover, in every one of those years except 1976, thegrowth in the number of franchisors is greater than the growth in the numberof units. We conclude that data on the number of business-format fran-chisors can give a good indication of the overall evolution of business-formatfranchising.31
Having determined that the growth in the number of business-formatfranchisors provides a reasonable approximation for the growth in sales andunits when we can measure all three, we now turn to data on the num-ber of franchisors after 1986 to assess growth since then. We focus on two main
31 One might interpret the data presented in Chapter 1 in Table 1-2 as evidence againstthis conclusion. Indeed, the number of outlets of the franchisors in our data is clearlyincreasing over time despite the constancy of the number of franchisors surveyed.In other words, the growth in the number of franchisors in the U.S. cannot followthe growth in business-format franchising in the U.S. well if we see growth in thenumber of outlets and not in the number of franchisors in this table. However, thedata in Table 1-2 are from a different source, and they include foreign as well asU.S. units. As the proportion of foreign units in these chains is increasing over time(from an average of 20% in 1993 to 28% in 2001), much of the growth in the size ofthe chains is unrelated to the growth in business-format franchising in the U.S. Fur-thermore, the increasing average size of the chains in our data sources also reflectsthe incentives of growing franchisors to participate regularly in the surveys, whereasfranchisors that are declining in size choose to participate less frequently in suchsurveys.

P1: KsF0521772524c02.xml CB802/Blair 0 521 77252 4 April 30, 2005 12:17
Tabl
e2-
3:G
row
thin
busi
ness
-for
mat
fran
chis
ing
–19
72to
1986
Gro
wth
inN
omin
alG
row
thin
Rea
lsal
esG
row
thin
Gro
wth
inN
um
ber
ofn
um
ber
ofsa
les
nom
inal
(200
0re
alsa
les
Nu
mbe
rof
nu
mbe
rYe
arfr
anch
isor
sfr
anch
isor
s($
billi
ons)
sale
s(%
)$
billi
ons)
(%)
un
its
ofu
nit
s
1972
909
na
28.7
na
118.
2n
a18
9,64
0n
a19
731,
005
10.6
32.7
13.9
126.
87.
320
2,23
76.
619
741,
051
4.6
37.3
14.1
130.
32.
720
9,72
73.
719
751,
115
6.1
40.9
9.7
130.
90.
521
0,81
40.
519
761,
161
4.1
46.6
13.9
141.
07.
722
2,31
75.
519
77†
1,28
110
.355
.519
.115
7.6
11.7
240,
524
8.2
1978
1,39
48.
864
.315
.916
9.8
7.8
245,
694
2.1
1979
1,45
94.
772
.412
.617
1.7
1.1
252,
702
2.9
1980
1,58
48.
683
.515
.317
4.5
1.6
252,
548
−0.1
1981
1,67
35.
689
.16.
716
8.8
−3.3
260,
555
3.2
1982
1,77
05.
899
.011
.117
6.7
4.7
268,
306
3.0
1983
1,87
76.
011
0.5
11.6
191.
08.
127
6,19
52.
919
841,
942
3.5
122.
310
.720
2.7
6.1
283,
576
2.7
1985
2,09
07.
614
1.3
15.5
226.
111
.630
1,68
96.
419
862,
177
4.2
155.
510
.024
4.3
8.0
312,
810
3.7
†Sa
les
figu
res
for
1977
for
busi
nes
s-fo
rmat
fran
chis
ing
are
inte
rpol
ated
from
data
for
adjo
inin
gye
ars
incu
rren
tdo
llars
asth
eda
tain
USD
OC
wer
en
otcr
edib
le.T
he
data
for
allf
ran
chis
ing
that
year
are
calc
ula
ted
asth
esu
mof
this
inte
rpol
ated
figu
rean
dth
eda
tafo
rtr
adit
ion
alfr
anch
isin
g.
Sour
ce:
USD
OC
,Fra
nchi
sing
inth
eE
cono
my,
vari
ous
year
san
dB
ure
auof
Labo
rSt
atis
tics
(BLS
).
30
P1: KsF0521772524c02.xml CB802/Blair 0 521 77252 4 April 30, 2005 12:17
2.1 Growth: Fact and Fancy 31
franchisor listings, the Info Press’s Franchise Annual and Bond’s FranchiseGuide, earlier known as the Source Book of Franchise Opportunities.32
Compared to the Bond’s Franchise Guide, the Franchise Annual lists a largernumber of businesses each year. In the 1995 and later editions, the Bond’sFranchise Guide contains a note indicating that while the author aimed to coverthe universe of potential franchisors in earlier editions, he now only includesa franchisor in his listing if a company representative can be reached by phoneto confirm that the company is still franchising. From conversations with thepublisher of the Franchise Annual, we learned that in editions prior to 1996,franchisors were left in that listing for some time even if they did not respondto requests for information. For the 1996 and later editions, franchisors thatdid not respond to such requests were excluded from the listing. This ledto improved data quality for both of these directories, along with a dramaticdecrease in the number of businesses listed in these publications from the yearthey implemented these changes. Moreover, in the 1996 edition, the publisherof the Franchise Annual indicated that his listing includes 129 distributors and240 franchise consultants along with 2,338 actual U.S. franchisors. As suchfirms apparently were also present in prior years, the number of franchisorsin this publication before 1996 was overestimated by roughly 15 percent. Forall these reasons, we report the data on the number of U.S. franchisors inTable 2-4 starting with the 1996 editions of both publications. We take thenumber of franchisors in each edition to be an estimate of the populationfor the prior year because the directories are published early in each calendaryear. Consequently, the data in Table 2-4 begin with 1995.
As we saw in Table 2-3, the USDOC estimated the population of franchisorsin 1986 to be 2,177. From Table 2-4, it is clear that according to either of oursources, the population of business-format franchisors has grown on averagemore slowly than real GDP over the 1995 to 2001 period. Perhaps mostimportantly, the population of U.S. franchisors has grown little relative to the1986 figures. Even using the higher Franchise Annual figures, the total growthin the number of franchisors from 1986 to 2001 has been only 24.6 per-cent, well below the 57.9 percent average growth in real GDP over the sameperiod. As we have argued that the growth in the number of franchisors can
32 Several franchisor listings are excluded from this table. First, we do not include theEntrepreneur’s “Franchise 500” survey. This survey is not meant to represent the wholepopulation of franchisors at a point in time, but simply presents information onfranchisors that choose to respond. Thus, it should not be used to assess the totalsize of the franchisor population. Other franchisor listings not included here for similarreasons are the Franchise Opportunities Handbook, published by the U.S. Departmentof Commerce, and the IFA’s periodical Franchise Opportunities Guide.
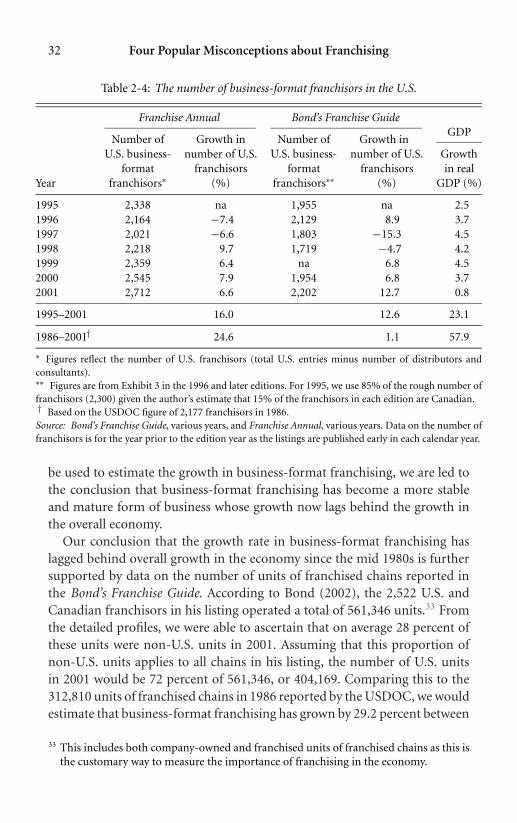
P1: KsF0521772524c02.xml CB802/Blair 0 521 77252 4 April 30, 2005 12:17
32 Four Popular Misconceptions about Franchising
Table 2-4: The number of business-format franchisors in the U.S.
Franchise Annual Bond’s Franchise GuideGDP
Number of Growth in Number of Growth inU.S. business- number of U.S. U.S. business- number of U.S. Growth
format franchisors format franchisors in realYear franchisors∗ (%) franchisors∗∗ (%) GDP (%)
1995 2,338 na 1,955 na 2.51996 2,164 −7.4 2,129 8.9 3.71997 2,021 −6.6 1,803 −15.3 4.51998 2,218 9.7 1,719 −4.7 4.21999 2,359 6.4 na 6.8 4.52000 2,545 7.9 1,954 6.8 3.72001 2,712 6.6 2,202 12.7 0.8
1995–2001 16.0 12.6 23.1
1986–2001† 24.6 1.1 57.9
∗ Figures reflect the number of U.S. franchisors (total U.S. entries minus number of distributors andconsultants).∗∗ Figures are from Exhibit 3 in the 1996 and later editions. For 1995, we use 85% of the rough number offranchisors (2,300) given the author’s estimate that 15% of the franchisors in each edition are Canadian.† Based on the USDOC figure of 2,177 franchisors in 1986.Source: Bond’s Franchise Guide, various years, and Franchise Annual, various years. Data on the number offranchisors is for the year prior to the edition year as the listings are published early in each calendar year.
be used to estimate the growth in business-format franchising, we are led tothe conclusion that business-format franchising has become a more stableand mature form of business whose growth now lags behind the growth inthe overall economy.
Our conclusion that the growth rate in business-format franchising haslagged behind overall growth in the economy since the mid 1980s is furthersupported by data on the number of units of franchised chains reported inthe Bond’s Franchise Guide. According to Bond (2002), the 2,522 U.S. andCanadian franchisors in his listing operated a total of 561,346 units.33 Fromthe detailed profiles, we were able to ascertain that on average 28 percent ofthese units were non-U.S. units in 2001. Assuming that this proportion ofnon-U.S. units applies to all chains in his listing, the number of U.S. unitsin 2001 would be 72 percent of 561,346, or 404,169. Comparing this to the312,810 units of franchised chains in 1986 reported by the USDOC, we wouldestimate that business-format franchising has grown by 29.2 percent between
33 This includes both company-owned and franchised units of franchised chains as this isthe customary way to measure the importance of franchising in the economy.

P1: KsF0521772524c02.xml CB802/Blair 0 521 77252 4 April 30, 2005 12:17
2.1 Growth: Fact and Fancy 33
1986 and 2001. If we assumed instead that the number of non-U.S. units ofnon-profiled firms in Bond (2002) was much lower than for profiled firms,we would obtain a larger estimate of growth. For example, if we thought non-profiled firms are likely to be small and operate only in the U.S., we couldassume at the limit that all non-profiled firms have zero units outside the U.S.Under this assumption, the number of U.S. outlets in 2001 would be 561,346less 28 percent of the units of profiled chains (382,061 from Table 1-2), or454,369, leading to a total growth in number of units of 45.3 percent over thesame period. This estimate is probably a good upper bound estimate on unitgrowth as it is likely that non-profiled firms operate some units outside theU.S. Note, that by comparison, real GDP grew by 57.9 percent over this period.Hence, we conclude once again that business-format franchising growth hasat best mirrored and, in fact, seems to have lagged behind the growth in theoverall economy between 1986 and 2001.34
The analyses above have pointed toward a number of reasons why theforecasts in the trade press of franchising growth often have been incor-rect. When discussing the extent of franchising, most often both traditionaland business-format franchising are included in the statistics presented. Butwhen discussing growth, commentators invariably focus on business-formatfranchising. This ignores the reality that traditional franchising as a pro-portion of GDP has remained stable over time, and that it has declined interms of number of outlets. Furthermore, growth forecasts typically haveignored the difference between nominal and real growth, and between fran-chisors’ forecasted and realized growth. On the latter, it is clear from theforecast data published in Franchising in the Economy that franchisors in-variably are overly optimistic when forecasting their own growth.35 Finally,
34 The recent IFA Educational Foundation and Price Waterhouse Coopers (2004) reportsuggests somewhat greater growth in business-format franchising as their estimate ofthe number of outlets in 2001 is 622,272. Taking this at face value, it implies totalgrowth of 98.9 percent, much above GDP growth over the same period, but still notsufficient to justify the claims made in the trade press. Moreover, we believe that thisfigure overestimates the number of business-format franchise establishments. Thoughthe report describes its methodology in some detail, it is not possible to assess the effectof various transformations used to derive the final estimate. In particular, the reportindicates that the data on franchising are derived from Dun & Bradstreet’s MarketPlaceCD-ROM and from franchisor surveys, but these data and their validity are not discussedin any detail and the report does not provide any sensitivity analyses using differentassumptions to derive final estimates.
35 This is easily ascertained by comparing the forecast in earlier editions of this publi-cation to the actual figures published later. Similarly, Seid (1988: 3) notes “Many newprospective franchisors I meet are certain they will sell far more franchises than can bereasonably expected.”
P1: KsF0521772524c02.xml CB802/Blair 0 521 77252 4 April 30, 2005 12:17
34 Four Popular Misconceptions about Franchising
estimates of franchising growth after the USDOC stopped publishing therelevant data typically have been based on data for small subsets of firms,often the most successful ones. For example, the Franchise Times (April 1996)article mentioned earlier was entitled “Growth forecast for 1996” and beganwith a statement that “Franchising growth should increase in 1996, with to-tal unit expansion projected between 12% to 14%, up from 1995’s 10% to12%.” It then went on to mention that this projection comes from FranchiseRecruiters Ltd., in its “Annual Franchise Business Development Survey.” Thissurvey represents opinions and executive outlook for growth for the 100 fran-chising corporations in the U.S. with the highest projected growth rates. Notsurprisingly, the estimates derived from such surveys cannot be applied toall franchising or even all business-format franchising. Yet, throughout the1990s, articles in the trade and popular press have touted the figures ob-tained in this yearly survey as forecasts of overall franchising growth for theyear, thereby suggesting double-digit growth each year. Together, all thesebiases have contributed to highly unrealistic forecasts of the future role offranchising in the U.S. economy, and by extension, its position in the globaleconomy.
We conclude that there is no evidence to support the phenomenal growthrates in franchising as claimed by much of the industry and trade press. Atbest, the growth in business-format franchising has mirrored that of the U.S.economy since the mid-1980s. Interestingly, research by Purdy, Stanworth,and Hatcliffe (1996: 2–3) shows a similar pattern in the United Kingdom(UK). These authors examine total sales through franchised companies andconclude that after the rapid growth of the 1980s, “ . . . franchising in Britainis currently going through a period of ‘consolidation’ in the 1990’s, havinggrown by a modest 12 percent [in total] in the period 1990–95 [ . . . ]. If thefigures were to be adjusted to allow for the effects of inflation, then we shouldsee British franchise turnover even having contracted modestly during thisperiod. . . . ” Thus, the British franchising experience in the 1990s has beensimilar to that of the U.S.
2.2 Entry and Exit
We now turn our attention to the extent of entry and exit by both franchisorsand franchisees. There is a perception that opportunities for franchisors andfranchisees are burgeoning. There is some truth to this as many new firmsget involved in franchising each year. But there is also a perception thatfranchising is safe, especially for franchisees as compared to independent

P1: KsF0521772524c02.xml CB802/Blair 0 521 77252 4 April 30, 2005 12:17
2.2 Entry and Exit 35
business start-ups. The data we present below show that, in reality, substantialbusiness risks exist for individuals who choose to invest in a franchise. In fact,franchising is no safer on average than independent business ownership, andin some cases is actually more risky. Similarly, franchising is risky for fran-chisors. Firms must invest significant amounts of money and resources toset up franchise systems. These investments are mostly lost when the firmceases franchising. The strain associated with developing a franchise systemsimultaneously with a new business concept easily can increase the likelihoodof failure. Of course, business failure is a fact of life. Our point is that thisis just as true for franchisors and franchisees as it is for other players in theeconomy. We see this as no cause for alarm, but as a fact that should be morewidely known and recognized in the franchise community. Ultimately, a falsesense of security can only lead to hardship and disappointment.
2.2.1 Franchisor Entry and Exit
Reports that many new franchise opportunities become available each yearas new firms start franchising certainly have contributed to the perceptionthat franchising is growing rapidly. For example, Entrepreneur’s annual sur-vey of new franchises has listed more than or close to 200 companies eachyear throughout much of the late 1980s and early 1990s. In 1996, the reportmentioned “Last year, hundreds of small businesses entered the franchisearena. . . . ” In this section, we examine the extent to which firms actually doget involved in franchising, but also consider the other side of the coin, theextent to which franchisors exit franchising.
When it still collected and disseminated data on franchising, the USDOCdid not directly report the number of new franchisors each year in Fran-chising in the Economy, but it did report the number of franchisors as wellas the number of “franchisor failures and departures” each year. We showthese figures in columns 2 and 3 of Table 2-5. By definition, the numberof franchisors at time t, or Nt, is equal to the number of franchisors in theprevious year, Nt –1, plus the number of entrants, Et, minus the number ofexits, Xt. In other words, Nt = Nt –1 + Et – Xt so Et = (Nt – Nt−1) + Xt . Thus,we can calculate the number of entrants in column 4 of Table 2-5 as the sumof the figures shown in columns 2 and 3.
Because the data from the USDOC are not available after 1986, we turnto our data set to obtain information on the extent of entry and exit sincethen. Note that while these data do not contain all franchisors in any givenyear, the surveys from which they are obtained tend to be biased toward those
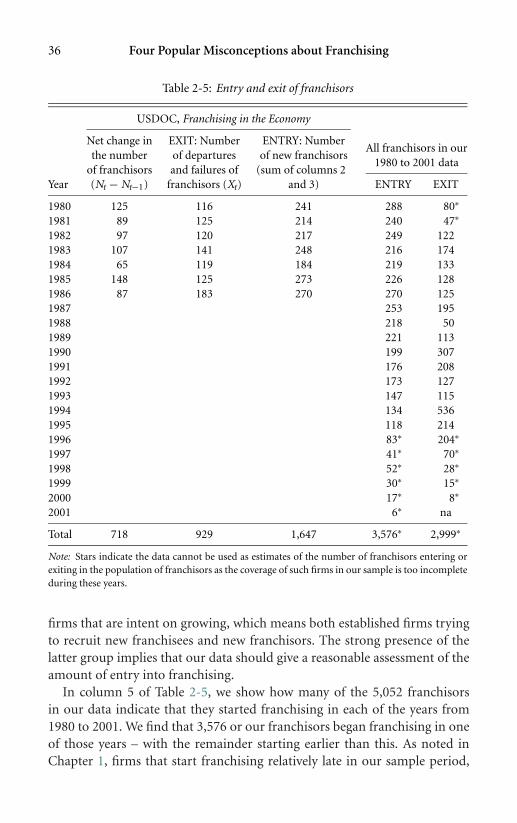
P1: KsF0521772524c02.xml CB802/Blair 0 521 77252 4 April 30, 2005 12:17
36 Four Popular Misconceptions about Franchising
Table 2-5: Entry and exit of franchisors
All franchisors in our
USDOC, Franchising in the Economy
1980 to 2001 data
Net change in EXIT: Number ENTRY: Numberthe number of departures of new franchisors
of franchisors and failures of (sum of columns 2Year (Nt − Nt−1) franchisors (Xt) and 3) ENTRY EXIT
1980 125 116 241 288 80∗
1981 89 125 214 240 47∗
1982 97 120 217 249 1221983 107 141 248 216 1741984 65 119 184 219 1331985 148 125 273 226 1281986 87 183 270 270 1251987 253 1951988 218 501989 221 1131990 199 3071991 176 2081992 173 1271993 147 1151994 134 5361995 118 2141996 83∗ 204∗
1997 41∗ 70∗
1998 52∗ 28∗
1999 30∗ 15∗
2000 17∗ 8∗
2001 6∗ na
Total 718 929 1,647 3,576∗ 2,999∗
Note: Stars indicate the data cannot be used as estimates of the number of franchisors entering orexiting in the population of franchisors as the coverage of such firms in our sample is too incompleteduring these years.
firms that are intent on growing, which means both established firms tryingto recruit new franchisees and new franchisors. The strong presence of thelatter group implies that our data should give a reasonable assessment of theamount of entry into franchising.
In column 5 of Table 2-5, we show how many of the 5,052 franchisorsin our data indicate that they started franchising in each of the years from1980 to 2001. We find that 3,576 or our franchisors began franchising in oneof those years – with the remainder starting earlier than this. As noted inChapter 1, firms that start franchising relatively late in our sample period,

P1: KsF0521772524c02.xml CB802/Blair 0 521 77252 4 April 30, 2005 12:17
2.2 Entry and Exit 37
for example in 1998, are less likely to have appeared in these data than firmsthat started earlier due to the small number of post-1998 surveys we can relyon to generate our sample. Thus, the number of franchisors that we findentering franchising from 1995 or so underestimates the total population ofnew firms.36 For the 1980s and early 1990s, however, we believe that our entryestimates are quite reliable. This is confirmed by the data in Table 2-5 as ourfigures on the number of entrants are very similar to the USDOC figures forall years when the two overlap.
The data in column 5 of Table 2-5 clearly show that the number of newfranchisors has been quite high, and relatively stable, between about 220 and280 each year, throughout the 1980s.37 This number has gone down, however,in the early 1990s, to an average of about 150 each year. As just noted, we cannotrely on the figures shown for the years 1995 onward and so do not draw anyinferences from them.
Finally, Table 2-5 contains information on the number of franchisor exits,first from the USDOC, in column 3, and then as per our data in column 6.To identify the year in which franchisors in our data exit franchising, wefind the last year in which each firm appears in our main sources. We thenestablish whether it appears in the Franchise Annual in subsequent years.38
When a firm is no longer found in the Entrepreneur surveys, Bond’s FranchiseGuide, or the Franchise Annual in any subsequent year, it is deemed to haveexited franchising in the year in which it first disappeared from all theselistings.39 Note that exiting here means either ceasing to franchise (departures
36 This is known as a right-censoring problem. As noted in Chapter 1, from the data in theearly 1980s, we can ascertain that it takes about 5 to 6 future surveys to identify morethan 90% of the set of firms that started franchising in any given year.
37 The publisher of the Franchise Annual notes that he encounters an average of 400 to800 new franchisors each year, a number that is much larger than our estimate of newfranchisors. However, his figure includes not only new U.S. franchisors, but also newCanadian and other foreign franchisors, and also new distributors and consultants.
38 We relied on the various internet sites, including individual franchisor and franchiseesites, to resolve a number of ambiguous cases, especially toward the end of our sampleperiod.
39 See Shane (1996) and Lafontaine and Shaw (1998, 1999) who also used this approach.We, like these authors, believe that these sources are comprehensive enough when com-bined over time to provide an accurate assessment of whether a firm is still franchising.In fact, from conversations with the author of the Franchise Annual, we concludedthat this listing had a systematic bias pre-1996 toward including firms that may nolonger have been franchising. The result is that we may systematically overestimatethe duration or longevity of firms in franchising. This bias would make it harderto find the result that many firms leave franchising shortly after becoming involvedin it.
P1: KsF0521772524c02.xml CB802/Blair 0 521 77252 4 April 30, 2005 12:17
38 Four Popular Misconceptions about Franchising
in the USDOC nomenclature) or ceasing to exist altogether (failures for theUSDOC).40 According to the USDOC (1988: 12–13), among firms that exitfranchising, roughly half simply leave franchising while the other half fail asbusinesses. Thus, we expect about half of the exits in our data to be failures offirms while the other half would be cases where firms decided that franchisingwas not right for them.41
In generating our information on the number of firms exiting, a selectionissue occurs at the beginning and end of our sample period. For example, thenumbers of franchisors we find exiting in 1981 is small because only a smallset of firms, namely the firms included in the 1980 and the 1981 surveys,can make it into our sample and thus possibly be reported as having stoppedfranchising by 1981. Since the 1980 survey does not include all franchisingfirms in existence at that point in time, it is not possible for the sample toreflect all the firms that stopped franchising in 1981. As more firms are in-cluded in subsequent years, the coverage of the population of franchisorsbecomes more complete. Consequently, we are more likely to measure ac-curately the total number of exits in later periods. As noted earlier, however,toward the end of our sample period, our coverage of the population is reducedagain, and so we once more lose the ability to capture the total number ofexits.
Using the USDOC data as a benchmark for the early years of our data andour understanding that we need six to seven future survey years to capture
40 A small portion of the exits observed here reflect cases where a chain is bought byanother firm that then consolidates all its holdings in a single listing. If this is donewhile continuing to support and develop the chain separately, it is not really an exit.Unfortunately, it is not possible to identify these cases and eliminate them from theexit data. However, this type of takeover is fairly infrequent: More typically, chains thatare purchased but continue to be developed separately are also listed separately in thesurveys. In a few more cases, the buyer decides to discontinue the use of the trade name.The latter should count as exits: franchisees are unlikely to receive much support fortheir old brand from the new owner in such cases, making this type of exit quite similarto a failure, at least from the franchisee’s perspective. Note that Shane (1996) contactedthe founders of the 138 firms in his sample and verified that none had been acquired orhad changed names, confirming that such events are quite rare.
41 To our knowledge, only two studies have examined why franchisors that continued tooperate chose to stop franchising. These studies were based on fairly small samples,one conducted in the UK construction industry (Kirby and Watson 1999) and theother in Australia with a convenience subsample of franchisors (Frazer 2001). Thesestudies suggest that firms mainly discontinue franchising due to difficulties in recruitingand monitoring franchisees to ensure performance. Frazer (2001) also finds that theeconomic climate affected firms’ decisions. Much more work is needed on franchisors’motives to discontinue franchising and on the effect this has on their franchisees.
P1: KsF0521772524c02.xml CB802/Blair 0 521 77252 4 April 30, 2005 12:17
2.2 Entry and Exit 39
most of the franchisors in operation at a point in time, we conclude that ourestimates of franchisor exits are quite good from 1982 to 1995. But our pointestimate each year depends both on publishers’ decisions to clean up theirdatabases and on actual exits. In drawing inferences below, we therefore focuson averages over several years rather than yearly exit rates.
In general, we find that the average exit rates are quite different before andafter 1990. Between 1982 and 1989, the average number of franchisor exitsper year is 130, whereas an average of 250 franchisors exit yearly between1990 and 1995 mostly due to the large exit figures for 1990 and 1994. Theoverall tendency in the data thus suggests larger numbers of exits in the early1990s than in the 1980s. The high rates of exits in the 1990s in particularare consistent with statements by Bond (2001: 25), for example, to the effectthat “Over a 12-month period between annual publications, 10–15% of theaddresses and/or telephone numbers [in his mailing list of approximately2,000 franchisors] become obsolete for various reasons.”
Most importantly, the data in Table 2-5 show that large numbers of fran-chisors enter franchising each year, but many also stop operating or chooseto stop franchising. Over the whole sample period, for example, 3,576 newfirms begin franchising, but 2,999 firms stop franchising, for a net increase ofonly 577 firms over two decades. Between 1982 and 1995, when the data aremore complete, the net increase in number of franchisors is only 272 (2,819entrants and 2,547 exits). It is quite clear that focusing on entry alone, assome of the trade literature tends to do, provides a very biased sense of thedynamics of franchising.
Table 2-6 explores the issue of the timing of exit relative to entry by ex-tending the work of Lafontaine and Shaw (1998) to our longer sample period.Specifically, we show in this table the number of franchisors that begin fran-chising each year between 1980 and 2001 and of these, the number that arestill franchising at the end of that year, and then at the end of the followingyear, and so on through 2000.42 Again, this table shows that franchisor exitsare sizable: of the firms that begin franchising in a given year, only 40 percenton average are still franchising after 10 years; after 15 years, only about 30 to35 percent of the firms are still franchising.43 Finally, the attrition shown in Ta-ble 2-6, though more rapid early on in a firm’s franchising history, continuessteadily over the life of the franchised companies in our data.
42 We end with 2000 as firms that have not exited by the end of 2000 are simply stilloperating at the end of our sample period.
43 Note that this occurs despite the fact that our methodology tends to overestimate thetime that firms stay in franchising.

P1: KsF0521772524c02.xml CB802/Blair 0 521 77252 4 April 30, 2005 12:17
40 Four Popular Misconceptions about Franchising
Table 2-6: Number (N) of franchisors starting to franchise each year and percentage stillfranchising at the end of each year
Year N 1980 1981 1982 1983 1984 1985 1986 1987 1988 1989
1980 288 88.9 84.4 78.1 67.0 61.1 55.6 51.4 44.8 44.1 41.01981 240 95.8 88.3 78.3 71.3 62.9 57.9 51.2 50.8 49.21982 249 94.4 87.1 79.5 73.9 69.1 61.0 59.4 56.21983 216 92.1 86.6 83.8 75.0 67.1 65.3 62.01984 219 95.9 92.2 88.6 82.6 82.2 78.51985 226 95.1 93.8 88.9 87.6 84.11986 270 98.5 95.9 93.3 87.01987 253 94.9 92.1 87.41988 218 97.7 93.61989 221 97.3
Year N 1990 1991 1992 1993 1994 1995 1996 1997 1998 1999 2000
1980 288 36.8 33.7 32.3 29.9 23.6 21.2 19.1 18.8 18.8 18.8 18.81981 240 39.2 38.3 37.1 35.8 28.3 27.1 24.6 22.9 22.9 22.1 22.11982 249 50.2 47.4 44.6 44.2 35.7 32.1 28.9 27.3 27.3 26.9 26.91983 216 51.4 46.8 45.4 44.4 35.6 33.3 30.1 30.1 30.1 30.1 30.11984 219 68.5 61.6 59.4 57.1 42.9 39.3 35.6 34.2 34.2 34.2 34.21985 226 71.2 61.5 61.1 59.7 43.8 41.2 37.6 37.2 37.2 37.2 37.21986 270 75.6 70.4 66.7 65.2 46.7 40.0 36.7 34.8 34.1 33.7 33.71987 253 76.3 70.0 66.8 62.8 46.6 41.5 38.3 36.0 35.2 34.4 34.41988 218 86.2 77.1 73.4 70.6 54.6 49.5 44.0 42.7 42.7 42.7 42.71989 221 92.8 85.5 79.2 75.1 56.1 48.4 43.4 42.5 42.1 42.1 41.21990 199 95.0 89.9 85.9 79.9 61.8 55.8 49.2 46.7 46.2 46.2 46.21991 176 92.6 88.1 81.8 61.4 54.5 48.3 47.2 46.0 45.5 44.91992 173 96.5 92.5 79.8 71.7 65.3 63.6 61.8 61.8 61.31993 147 93.2 85.0 76.2 66.7 61.2 61.2 60.5 59.91994 134 94.8 79.1 70.9 69.4 68.7 67.9 67.21995 118 94.1 78.8 77.1 75.4 74.6 74.61996 83 94.0 91.6 88.0 88.0 88.01997 41 95.1 92.7 92.7 92.71998 52 100.0 100.0 98.11999 30 100.0 100.02000 17 100.0
Our results on franchisor exits are not only consistent with those ofLafontaine and Shaw (1998), but also with those of Shane (1996), who ex-amined the rate of exit of 138 franchisors that started franchising in 1983,and with Stanworth’s (1996) survey results in the UK. The latter asked eightindustry experts to assess the success of a set of 74 UK franchisors known tobe in existence in 1984. The interviewees evaluated the firms on a scale from
P1: KsF0521772524c02.xml CB802/Blair 0 521 77252 4 April 30, 2005 12:17
2.2 Entry and Exit 41
A to E, where A meant that the company was still franchising and growingand B meant it had reached maturity – either way it was a success; C indicatedthat a firm was still franchising but not considered a success; D meant thecompany still existed but was no longer franchising for lack of success at it;and E indicated that the firm had ceased to exist. Stanworth concludes: “Atbest, one franchise company in four could be described as an unqualifiedsuccess story (categories A and B) over a ten-year period. . . . Around half thesample was judged to have failed completely and utterly (category E)” (27).Thus, exits are also not uncommon in the UK franchise community.44
From the perspective of franchisors, these high exit rates imply two mainthings: first, many firms try franchising but later decide not to pursue it. Inmost cases, these firms invest – and subsequently lose – substantial sums in theprocess. In his work, The Complete Handbook of Franchising, Seltz (1981) con-cluded his assessment of franchisor capital requirements with this statement:“As a general rule, then, franchisor initial capital requirements will fall intothe range of $150,000 to $1,000,000, plus a properly capitalized function-ing prototype operation” (58). In 2001 dollars, this would amount to capitalrequirements of $320,000 to $2,100,000. More recently, in a study commis-sioned by the U.S. Small Business Administration (SBA), Trutko, Trutko andKostecka (1993) estimated that initial franchise development costs could ex-ceed $500,000, or $630,000 in 2001 dollars.45 This amount includes expensesincurred to develop clear and complete operating manuals, contracts, disclo-sure documents, and so on, as well as franchise sales staff development andtraining. Of course, how much a franchisor spends depends on the type ofbusiness and on the amount of care a franchisor puts into developing its fran-chise program. The point remains that substantial investments are needed,and that the bulk of these is lost upon exiting franchising.
Second, assuming that the USDOC data are still relevant today, about halfof the exits documented above represent cases where the firm fails altogether.In other words, franchising is not a guarantee of success for franchisors. In fact,when firms must simultaneously invest resources to develop their franchisesystem along with their business concept, the strain can easily lead to failure.It is important that would-be franchisors understand the commitment ofresources involved in developing a franchise program before they engage init and that they spend time developing a viable business concept before theystart investing in a franchise program. In fact, in their study of franchisors’survival in franchising, Lafontaine and Shaw (1998) found that the number
44 Perrigot (2004) finds similar exit patterns among franchisors in France as well.45 See Stanworth et al. (1998) for further data and discussion.
P1: KsF0521772524c02.xml CB802/Blair 0 521 77252 4 April 30, 2005 12:17
42 Four Popular Misconceptions about Franchising
of years in business before franchising was one of the very few factors thatincreased the likelihood of success in franchising.
In the end, the entry and exit figures shown here explain much of theperception of rapid growth found in the trade press. This perception is basedon the correct observation that many new firms enter franchising each year.But this reality must be tempered by the knowledge that many firms also exitfranchising each year. In the end, the reality is that business-format franchisingin the U.S. has become a relatively mature industry, one that grows along withthe rest of the economy.
2.2.2 Franchised Units Entry and Exit
For decades, the International Franchise Association (IFA) and the tradepress have suggested that the failure rate of individual franchised units wasvery low compared to much higher rates of failure for independent firms.For example, in its Fall/Winter 1990–1991 Franchise Opportunities Guide, onp. 24, the IFA states that “In 1989, for example, less than 3 percent of business-format franchisee-owned outlets were discontinued – many for reasons otherthan business failure. By contrast, the SBA has reported that 65 percent ofbusiness start-ups fail within five years.” Similarly, in their survey report, theIFA Educational Foundation and Arthur Andersen & Co. (1992: 16) note that“96.9 percent of the franchised units opened within the last five years are stillin operation today.”46
There are a number of problems with these statements. First, they oftencompare yearly rates of franchise failures to multi-year failure rates for non-franchised businesses, per the IFA quote above. In other cases, the reportedfailure rates for franchised businesses are based on self-reported data fromsmall sets of franchisors. The failure rate reported in the Arthur Andersenquote above, for example, is based on self-reported data by a set of 366 fran-chised chains. Even if franchisors in this sample truthfully reported the data,the probability that mainly successful firms with low failure rates chose toparticipate in this survey makes it highly unlikely that the reported failurerate is a good estimate of franchised unit failure generally.
When one examines the failure rates of blue-chip franchises, the probabilityof failure is in fact relatively small. Using data from disclosure documents,47
46 See Bates (1998) for references to several other such claims. The author contradictsthese claims with his data. See also Bond (2001) for a pragmatic summary of existingevidence on this issue.
47 Though the FTC does not require the filing of disclosure documents, nor does it re-view the information contained in these documents, the contents are reviewed in a

P1: KsF0521772524c02.xml CB802/Blair 0 521 77252 4 April 30, 2005 12:17
2.2 Entry and Exit 43
Kolton (1992) found that 4.4 percent of all franchised units were cancelled,terminated, not renewed, or reacquired each year in the 584 leading franchisesystems in the U.S. Even this rate of failure, however, is much larger than thosetouted above. In particular, over five years, these failure rates for establishedfranchisors still amount to one out of every five outlets failing, a rate thatis lower than the five-year failure rate attributed by the IFA to independentbusinesses, but still not low in absolute terms.
Not surprisingly, when one considers all franchised chains, the failure ratesare even larger. Bates (1995a, 1995b), in particular, used the Characteristics ofBusiness Owners (CBO) database produced in 1992 by the U.S. Census Bureauto assess the rate of failure among a representative sample of small businesses,both franchised and non-franchised. He found that failure rates of franchisedsmall businesses were greater than those of independent businesses, thoughnot significantly so. Specifically, he observed that 34.7 percent of franchisedbusinesses failed as opposed to 28.0 percent for independents over a five-yearperiod. In other words, his data show that franchised unit failure rates areunderestimated in the trade press while at the same time the rates of failurequoted for independent businesses are exaggerated. This makes franchisinglook less risky, when in reality it is at least as risky as independent businessownership. Finally, IFA and Frandata Corp. (2000) dedicate a whole sectionof the Profile of Franchising to what they call turnover rates. They find that forthe sample of 834 franchisors for which they have data on this, 11.33 percentof franchised units in operation at the end of 1996, on average, had theircontract canceled, or were not renewed by the franchisor, or were reacquiredby the franchisor, or otherwise ceased to do business during 1997. The medianturnover rate in these chains was 5.5 percent. Since we do not know the ageof these units at the time they stopped franchising, the figures are not directlycomparable to those from Bates (1995a), but they still clearly support thehigh failure rates he found in the CBO data. Moreover, the difference betweenthe mean and the median failure rates confirms the existence of a group ofwell-established and relatively low-failure franchised systems (those belowthe median rate) that coexists with a number of franchise systems with veryhigh rates of failure. Those latter firms are responsible for raising the averagefailure rate of franchised businesses in the economy much above the medianrate.
number of cases by state franchise examiners, and franchisors are subject to both civiland criminal penalties if they misrepresent the information in these documents. Con-sequently, the data contained therein are much more objective than data obtained fromsurveys.
P1: KsF0521772524c02.xml CB802/Blair 0 521 77252 4 April 30, 2005 12:17
44 Four Popular Misconceptions about Franchising
To our knowledge, there has been no systematic study of the effect offranchisor exit, whether it be a departure from franchising or a business fail-ure, on the survival or growth of the franchised units that were tied to it.Frazer (2001) interviewed a set of franchisors that had stopped franchising inAustralia between 1996 and 1998. Though she does not indicate the numberof units or chains on which the statistics are based, she reports that imme-diately following the cessation of franchising by their franchisor, 37 percentof franchise units were converted to new employment relationships and laterdisbanded, 19 percent continued operating as independent businesses undernew names, 18 percent were sold to an external party, 9 percent closed outright,8 percent continued to work with their ex-franchisor under a distributor or li-cense agreement, 5 percent continued operating under the original name, and3 percent were purchased by the ex-franchisor and became company units.Thus, her data clearly show that the fate of one’s franchisor and its decisionto continue to franchise have a major impact on the future of any franchisedunit.
Anecdotal accounts of individual cases confirm that success for a franchisedunit is intimately tied to its franchisor’s success in franchising. In that context,the high rates of franchisor exit documented above are quite troubling. Infact, the high rate of franchisor exit surely explains the remaining differencebetween the rates of failures quoted in Kolton (1992) and those found inBates (1995a, 1995b). The latter examined failure rates of a random set ofsmall businesses, so the sample would include units of chains that are not asestablished and where the franchisor is more likely to fail or stop franchising.These outlets, thus, are themselves more likely to fail.
We conclude that the data contradict the notion that investing in a fran-chised business is a risk-free or very low-risk endeavor. In fact, high franchisorfailure rates suggest that joining a young or new franchised system is probablymore risky than starting one’s own business. Success in this case depends notonly on one’s own good ideas, resourcefulness, and dedication, but also on thecapacity of the franchisor and the other franchisees to pull things together.The upside of joining a new franchise system also is potentially very high.Those who joined McDonald’s when it was a fledgling chain have profitedhandsomely from this decision. When one joins an established chain, theprobability of failure is lower but so is the probability that the venture will behugely profitable.48
Three more points deserve attention. First, Bates (1998) further pursuedhis analyses of franchise failures using the same database, but this timedistinguished which units were sold to new franchisees and which were sold
48 This is an illustration of the usual trade-off between risk and expected returns.

P1: KsF0521772524c02.xml CB802/Blair 0 521 77252 4 April 30, 2005 12:17
2.2 Entry and Exit 45
to existing franchisees. He found that “franchise units have better survivalprospects than independents, . . . (while) young firms formed without thebenefit of a franchisor parent are more likely to remain in operation thanfranchised start-ups” (113). He explains these seemingly contradictory re-sults by using the fact that the vast majority (84 percent) of new franchisedunits are opened by existing multi-unit operators. These units benefit fromthe multi-unit owner’s experience in the business and are, not surprisingly,very likely to survive. In fact, they are much more likely to survive thanindependent businesses, and as they represent the vast majority of new fran-chised businesses, their high survival prospect gives rise to the first conclusionabove. New units opened by new franchisees, which Bates called “franchisestart-ups,” however, were less likely to survive than independents in his data,giving rise to his second finding. He concluded that it matters greatly, whenassessing survival, whether one considers firm-level or outlet-level data. Infact, he notes that “[t]he potential franchisee needs to know how start-upfirms have performed, and data describing new establishment’s performancecannot provide this information” (127). We return to the issue of multi-unitfranchising in Section 2.4.
Second, it is important to recognize that in the majority of studies, the defi-nition of a failure is that the firm ceases to exist. But failure in franchising is notreally that simple. For example, in Franchising in the Economy, the USDOCsupplied data on franchised unit discontinuations but also on (1) con-tract terminations by franchisors, by franchisees, and by mutual agreement;(2) non-renewals by franchisors, franchisees, and by mutual agreement; and(3) the number of franchised units repurchased by the company.49 Holm-berg and Boe Morgan (1996) discuss how all of these figures relate in someway to “failure” in a franchising context. The IFA Educational Foundationand Frandata (2000) study further describes different concepts of success andfailure for franchised units and note how different indicators relate to each ofthese. In the end, the definition of turnover they adopt is guided as much bydata availability as by their desire to limit double counting and define failureproperly. Though these issues of definition make it difficult to arrive at a finalsimple “failure” rate, it remains true that all the studies suggest a much higherincidence of failure than that claimed traditionally by the popular and thetrade press.
Finally, having established that franchising is not a panacea, we now returnto our earlier statement that franchising is a useful way to organize certain
49 In addition, for terminations by franchisors, the USDOC data further described whetherthe termination resulted from a financial default, a quality control violation, or “other.”We return to some of these data in Chapter 10.

P1: KsF0521772524c02.xml CB802/Blair 0 521 77252 4 April 30, 2005 12:17
46 Four Popular Misconceptions about Franchising
types of businesses and to the reasons why we expect it to continue to thrive.Franchising does not guarantee success to franchisees, but it gives them away to develop a business locally as part of a larger system. That system, ifwell-established, provides access to products and suppliers, to a set of businessmethods, to managerial support, to a recognized brand, and so on. These areparticularly valuable to individuals who do not possess the level of humancapital needed to start a business from scratch. Again, early empirical evidencesuggests that franchising attracts people who would not have chosen to opena business by themselves. Hunt (1972) in the U.S. and Stanworth (1977) in theUK both found that a large proportion of the franchisees in their samples –52 percent and about one-third, respectively – would not have gone intobusiness by themselves. Williams’ (1999) work, which also relies on the CBOdatabase, documents differences in human capital, such as formal training,business experience, and so on, between individuals who choose to purchase afranchise and those who go in business for themselves. He finds that on averagethose who opt for franchising have higher education and work experience,but lower levels of business experience. His analyses further show that thosewho choose franchising are substantially better off as franchisees than theywould have been if they had tried to start their business on their own.
The conclusion to be drawn from this body of work is that while franchisingis not risk-free, it does make it possible for people who might otherwise nothave this opportunity to develop a business locally and, with some luck, thriveas part of a larger business entity.
2.3 The Size Distribution of Franchised Chains
In this section, we focus on another misconception about franchising: theidea that all franchisors are large chains. Most people think about large fast-food chains, or hotel or car rental chains, or even large gasoline station or cardealership networks when they think about franchising. But the reality is thatwhile traditional franchising is fairly concentrated, with very large networksoperating under just a few brand names, the vast majority of the 2,500 orso business-format franchisors in the U.S. operate small numbers of outlets.As in the preceding sections, we begin with information available from theUSDOC’s franchising data and then consider more recent data.
Table 2-7 shows data on the size distribution of U.S. franchisors in 1986,where size is measured by the total number of franchised and company outletsin each chain.50 Of the 2,177 franchisors in the U.S. in 1986, only 56 operated
50 We address the issue of dual distribution, namely the tendency chains have to operateboth franchised and company units, in Chapter 4.
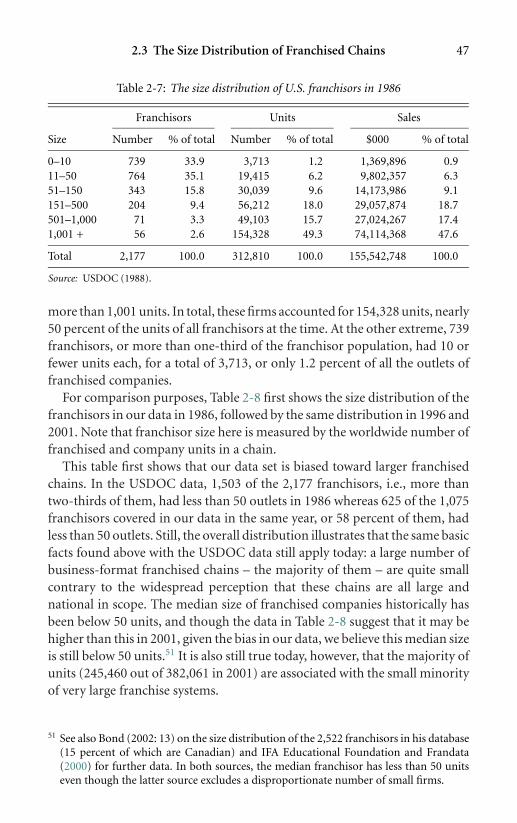
P1: KsF0521772524c02.xml CB802/Blair 0 521 77252 4 April 30, 2005 12:17
2.3 The Size Distribution of Franchised Chains 47
Table 2-7: The size distribution of U.S. franchisors in 1986
Franchisors Units Sales
Size Number % of total Number % of total $000 % of total
0–10 739 33.9 3,713 1.2 1,369,896 0.911–50 764 35.1 19,415 6.2 9,802,357 6.351–150 343 15.8 30,039 9.6 14,173,986 9.1151–500 204 9.4 56,212 18.0 29,057,874 18.7501–1,000 71 3.3 49,103 15.7 27,024,267 17.41,001 + 56 2.6 154,328 49.3 74,114,368 47.6
Total 2,177 100.0 312,810 100.0 155,542,748 100.0
Source: USDOC (1988).
more than 1,001 units. In total, these firms accounted for 154,328 units, nearly50 percent of the units of all franchisors at the time. At the other extreme, 739franchisors, or more than one-third of the franchisor population, had 10 orfewer units each, for a total of 3,713, or only 1.2 percent of all the outlets offranchised companies.
For comparison purposes, Table 2-8 first shows the size distribution of thefranchisors in our data in 1986, followed by the same distribution in 1996 and2001. Note that franchisor size here is measured by the worldwide number offranchised and company units in a chain.
This table first shows that our data set is biased toward larger franchisedchains. In the USDOC data, 1,503 of the 2,177 franchisors, i.e., more thantwo-thirds of them, had less than 50 outlets in 1986 whereas 625 of the 1,075franchisors covered in our data in the same year, or 58 percent of them, hadless than 50 outlets. Still, the overall distribution illustrates that the same basicfacts found above with the USDOC data still apply today: a large number ofbusiness-format franchised chains – the majority of them – are quite smallcontrary to the widespread perception that these chains are all large andnational in scope. The median size of franchised companies historically hasbeen below 50 units, and though the data in Table 2-8 suggest that it may behigher than this in 2001, given the bias in our data, we believe this median sizeis still below 50 units.51 It is also still true today, however, that the majority ofunits (245,460 out of 382,061 in 2001) are associated with the small minorityof very large franchise systems.
51 See also Bond (2002: 13) on the size distribution of the 2,522 franchisors in his database(15 percent of which are Canadian) and IFA Educational Foundation and Frandata(2000) for further data. In both sources, the median franchisor has less than 50 unitseven though the latter source excludes a disproportionate number of small firms.
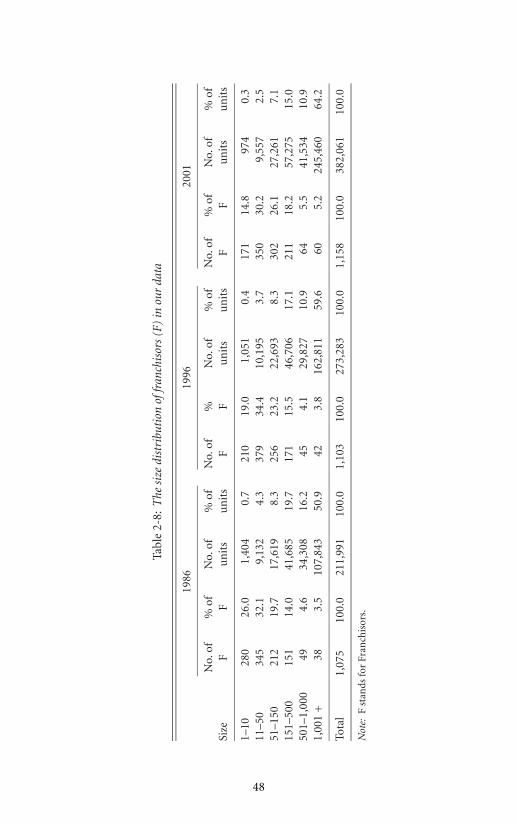
P1: KsF0521772524c02.xml CB802/Blair 0 521 77252 4 April 30, 2005 12:17
Tabl
e2-
8:T
hesi
zedi
stri
buti
onof
fran
chis
ors
(F)
inou
rda
ta
1986
1996
2001
No.
of%
ofN
o.of
%of
No.
of%
No.
of%
ofN
o.of
%of
No.
of%
ofSi
zeF
Fu
nit
su
nit
sF
Fu
nit
su
nit
sF
Fu
nit
su
nit
s
1–10
280
26.0
1,40
40.
721
019
.01,
051
0.4
171
14.8
974
0.3
11–5
034
532
.19,
132
4.3
379
34.4
10,1
953.
735
030
.29,
557
2.5
51–1
5021
219
.717
,619
8.3
256
23.2
22,6
938.
330
226
.127
,261
7.1
151–
500
151
14.0
41,6
8519
.717
115
.546
,706
17.1
211
18.2
57,2
7515
.050
1–1,
000
494.
634
,308
16.2
454.
129
,827
10.9
645.
541
,534
10.9
1,00
1+
383.
510
7,84
350
.942
3.8
162,
811
59.6
605.
224
5,46
064
.2
Tota
l1,
075
100.
021
1,99
110
0.0
1,10
310
0.0
273,
283
100.
01,
158
100.
038
2,06
110
0.0
Not
e:F
stan
dsfo
rFr
anch
isor
s.
48
P1: KsF0521772524c02.xml CB802/Blair 0 521 77252 4 April 30, 2005 12:17
2.4 Multi-Unit Franchisees 49
2.4 Multi-Unit Franchisees
In theoretical as well as empirical analyses, the franchised chain is typicallydescribed as a combination of franchisor-owned and franchisee-owned units,with the presumption that the latter are all individually owned and operated.In other words, franchisees all operate small mom-and-pop ventures, and areinexperienced and unsophisticated in business matters. The result has beena perception of imbalance of power between franchisors and franchisees, aperception that motivates many calls for regulation.
While many franchisees are indeed small business owners with just oneoutlet, it is important to realize that most franchised chains also includea number of franchisee-owned “mini chains” (Bradach 1995). For exam-ple, McDonald’s franchisees own an average of three franchised restau-rants.52 In their study of multi-unit ownership and its effect on franchisorgrowth, Kaufmann and Dant (1996) found that 88 percent of the 152 fran-chised fast-food chains they surveyed included multi-unit owners. They note:“ . . . multi-unit franchising is the modal form of franchising” (355). Kalninsand Lafontaine (2004), moreover, found that multi-unit owners accountedfor 84 percent of all the franchised restaurants in seven large national chainsin Texas in 1995. In terms of owners, however, franchisees with a singleunit were still the majority in two of the seven chains (Dairy Queen andSubway). Finally, the IFA Educational Foundation (2002) documents that20 percent of franchisees, each owning 4.3 units on average, were respon-sible for the majority (53 percent) of the units in the 145 franchised sys-tems that responded to their survey. The remaining 47 percent of units wereowned by the other 80 percent of franchisees, all of whom owned a singleunit.53
The figures above imply that franchisees tend to be small, and indeedmost are. But there is huge variance in the size of franchisees. Each year,the Franchise Times publishes a list of the largest 200 restaurant franchiseesin the U.S., where size is measured by total revenue.54 According to thissource, the top 200 franchisees in the U.S. in 2001 operated 16,544 restau-rants, or an average of more than eighty restaurants each. The top 100 oper-ated 12,472 restaurants, or more than 120 each. The sales revenue of the top
52 See Kaufmann and Lafontaine (1994).53 See also Kaufmann and Kim (1995) and Bradach (2000) for more data on multi-unit
ownership.54 This list is produced by its sister publication, the Restaurant Finance Monitor, and is
entitled The Monitor 200. It usually appears in the August issue of the Franchise Times.It has been produced yearly since 1993.

P1: KsF0521772524c02.xml CB802/Blair 0 521 77252 4 April 30, 2005 12:17
50 Four Popular Misconceptions about Franchising
200 reached $16.7 billion, or 12.2 percent of the $136.5 billion sales revenueof the largest 100 restaurant chains in the U.S. Many of these franchiseesare publicly traded companies. Moreover, these franchisees often are asso-ciated with more than one chain, operating different types of restaurantsunder various brands. In fact, several of them also are franchisors for otherconcepts.55
The main conclusions to draw from the data are that a very large numberof franchisees, most likely the majority of them, to this day are single-unitowners, but multi-unit ownership is present at least to some degree in almostall franchised chains, and a large proportion of franchised units belong tomulti-unit franchisees. Moreover, many multi-unit franchisees are large andsophisticated companies. In fact, the data imply that the largest 200 franchiseesare larger on average than the typical (median) franchisor.
There are two main ways for franchisees to become multiple-unit owners.The most common is through the sequential acquisition of franchised units.Franchisors typically grant the right to buy additional units to franchiseesonce they have demonstrated that they can operate their current unit or set ofunits and that they can do so within the constraints imposed by the franchisor.In that sense, franchisors who allow franchisees to grow use the granting ofadditional units as a reward for high-performing franchisees and, hence, anincentive mechanism as well.56 Note that most of the time franchisees areassessed the then current franchise fee and royalty rate for each additional
55 For example, the largest franchisee in 2001 was RTM Restaurant Group in Atlanta,Georgia, the largest Arby’s franchisee with 775 Arby’s and 17 Sbarro units at the endof 2001. Through Winners International, an affiliate of RTM, it is also the franchisorof Mrs. Winner’s Chicken & Biscuits and Lee’s Famous Recipe Chicken restaurants.NPC International, the largest Pizza Hut franchisee in the world, was the second largestrestaurant franchisee in the U.S. in 2001. At the end of that year, it operated 835 PizzaHut restaurants. This franchisee was a publicly traded company from 1984 to 2001.Finally, rounding out the top three is Carrols Corp. in New York, a firm that operated359 Burger King restaurants at the end of 2001. This Burger King franchisee is also afranchisor for Pollo Tropical, a regional chain of 70 restaurants, and Taco Cabana, achain of 130 restaurants, that it acquired in 2000. The fourth largest franchisee in 2001was AmeriKing, which operated 373 Burger King restaurants at that time. This firmfiled for Chapter 11 bankruptcy protection in 2002.
56 See Kaufmann and Lafontaine (1994) on this, and for evidence that McDonald’s ex-pressly recognizes the granting of additional units as an important mechanism to controlfranchisee behavior and give them incentives to perform. In the IFA Educational Foun-dation (2002) survey, 15.1 percent of franchisors indicated that they use multi-unitfranchising as a way to reward good franchisees, and another 14.1 percent said they useit in response to franchisee requests (which presumably came from good franchisees,otherwise franchisors would have no reason to go along).
P1: KsF0521772524c02.xml CB802/Blair 0 521 77252 4 April 30, 2005 12:17
2.4 Multi-Unit Franchisees 51
unit they buy, paying whatever new franchisees joining the chain at that timeare required to pay.57
The other way to become a multiple-unit owner is with an area developmentagreement, in which the area developer is granted the right to establish a pre-specified number of units in an exclusive territory over a prescribed timetable.58 In the 2002 Bond’s Franchise Guide, just over half of the franchisorsthat provided information on this (595 out of 1,128) used area developmentagreements. The standard practice in these cases is for the area developer tobe the franchisee for the units, to own and operate them directly or througha local partnership in which the area developer maintains equity. The areadeveloper usually is assessed a fixed fee for the right to develop the territoryand then pays the then current franchise fee and royalty rate for each unit as itbecomes operational. Bond (2002), however, indicates that both the franchisefee and the royalty rate are sometimes reduced under this type of agreement.59
While multi-unit franchising is pervasive, only a few studies have explicitlyfocused on it. In particular, Kaufmann and Kim (1995) have examined empir-ically the relationship between the use of area development agreements (andsubfranchising agreements) and system growth rates (in number of units).They find that the use of these agreements correlates positively with chaingrowth. Bradach (1995) considers more generally the reasons why firms usemulti-unit franchising. Using in-depth interviews, he finds that chain execu-tives perceive multi-unit franchisees to be better than single-unit franchiseesin terms of adding units, of maintaining uniformity within the chain, and ofsystem-wide adaptation to changes in the firm’s competitive environment.This suggests that franchisors do not really want unsophisticated mom-and-pop operations. But multi-unit operations also come at a price: executives alsonoted that owners of mini-chains may not adapt to local conditions as wellas single-unit owners. Moreover, Brickley (1999) relates the extent to which
57 Franchisees buying additional units may pay a lower franchise fee for these units; seeChapter 3 on this and on typical fees in franchising.
58 Area development agreements should not be confused with subfranchising agreements,where the subfranchisor is granted the right to find the franchisees to develop a territoryand to contract with them. Under an area development agreement, the grantee estab-lishes and operates the units, whereas under a subfranchising agreement the granteeis given the right “to grant to others the right to establish and operate units” in theterritory (Lowell 1991: 22). Note that both types of agreements are sometimes calledmaster franchising. See Lowell (1991), Kaufmann and Kim (1995), and Bond (2002)for more on this.
59 Bhattacharyya and Lafontaine (1995) document the existence of reduced franchisefees but not reductions in royalty rates for area development agreements among the54 franchisors in their sample. See Chapter 3.
P1: KsF0521772524c02.xml CB802/Blair 0 521 77252 4 April 30, 2005 12:17
52 Four Popular Misconceptions about Franchising
firms use area development agreements to the degree of repeat business theygenerate. Consistent with his argument that area development agreementsare used to reduce free-riding problems – expected to be particularly acute innon-repeat businesses – he finds that area development agreements are signif-icantly more likely to be used by franchisors involved in non-repeat customerindustries.60 Finally, Kalnins and Lafontaine (2004) use data on all outlets ofseven major fast-food chains in the State of Texas to examine how franchisorsallocate the ownership of new outlets between new and existing franchiseesand, if the unit goes to an existing franchisee, what characteristics of an owneror of its units affect the likelihood that they are chosen as the owner of thenew unit. They find that franchisors, even those that do not use area devel-opment agreements, are most likely to allocate units to franchisees in waysthat generate clusters of geographically close and adjacent units belonging tothe same owner. Their results imply that franchisors do not shy away fromdecisions that may result in a franchisee obtaining significant control over aparticular market. Instead, the decisions that franchisors make suggest thattheir goal is to minimize unit control costs, as multi-unit owners are givencontrol over sets of units that are close to each other so they are easy to travelbetween and oversee, but at the same time minimize competition and conflictamong franchisees.
According to most sources, the extent of multi-unit franchising has grownsignificantly over the last decade. In examining the different needs and goalsof franchisors and franchisees in the remainder of this book, we will considerthe extent to which multi-unit and single-unit franchisees’ goals and behavioralso might differ.
2.5 Conclusion
Franchising clearly plays an important role in the U.S. economy and hasproved to be a very successful method of doing business. Sales through fran-chised chains represent more than 13 percent of U.S. GDP. Given its economicimportance, it is crucial to have a realistic assessment of franchising’s currentgrowth and the security it offers. The data suggest that franchising is growingin real terms at best at a rate similar to that of the economy as a whole. Thisis inconsistent with the extravagant claims made by the trade press through-out the 1980s and 1990s. The data also contradict the trade press claims andgeneral perception of the financial safety that franchising offers investors.
60 We come back to the issue of free riding on several occasions throughout this book, butsee in particular Chapter 5.

P1: KsF0521772524c02.xml CB802/Blair 0 521 77252 4 April 30, 2005 12:17
2.5 Conclusion 53
Franchising turns out to be no safer than investing in other new businesses:the failure rates observed in franchising, for franchisors and for franchisees,are very similar to those of non-franchised businesses. What this means isthat an investment in a franchised system should be investigated and assessedin much the same way as an investment in any other type of business venture.
We also examined two other misconceptions about franchising: (1) thatfranchised chains are all large, well-established companies; and (2) that fran-chisees are small, mostly single-unit owners. In spite of the impression createdby the omnipresence of large fast-food systems and gasoline station and au-tomobile dealership networks, we have shown that the majority of franchisedsystems are quite small, with less than fifty units. For a franchisee seeking thesupport of a tested business format and of a recognized brand – the mainadvantages usually associated with buying a franchise rather than startingan independent business – our data show that most franchised systems aretoo small to offer these. Franchisees that invest in small franchised systemsmust be buying in the hopes that the chain will grow and develop further.This is a fairly risky endeavor and must be recognized as such. Finally, it isalso important to recognize that franchisees are not all single-unit operations.Several multi-unit operators own and operate very large chains within andeven across other chains. Indeed, many of those multi-unit owners are largerthan most franchised chains.
P1: Kad0521772524c03.xml CB802/Blair 0 521 77252 4 April 29, 2005 20:0
3
Franchise Contracts
3.1 Introduction
Franchise contracts stipulate the conditions under which a franchised outletis to be operated and, in particular, the rights and obligations of both parties.In this chapter, we examine the terms of franchise contracts, with specialemphasis on the monetary contract terms, namely franchise fees, royaltyrates, ongoing fixed payments, and advertising fees. These fees, as mentionedin Chapter 1, are not used in traditional franchising and, therefore, this chapteris really about monetary contract terms in business-format franchising.61
As we will see in more detail in Chapter 4, if the franchisor is to maxi-mize its profit, economic theory generally suggests that it should tailor itsfranchise contract terms for each unit and franchisee in a chain. In practice,however, contracts are remarkably uniform within chains and thus insensitiveto variations in individual, outlet, and specific market conditions. Indeed, abusiness-format franchisor most often uses a single business-format fran-chising contract – a single royalty rate and franchise fee combination – forall of its franchised operations that join the chain at a given point in time. Inher survey of 130 business-format franchised chains, for example, Lafontaine(1992b) found that 42 percent of her respondents offered their contracts on atake-it-or-leave-it basis with another 38 percent allowing some negotiations,but only for non-monetary terms. Thus, uniformity, especially for mone-tary terms, is the norm. Moreover, Lafontaine and Oxley (2004) show thatAmerican franchisors that have outlets in Mexico also typically use the exactsame monetary contract terms with their Mexican franchisees as with theirdomestic franchisees. Thus, to a large degree, contract uniformity extendseven across borders.
61 In traditional franchising, the franchisor earns its profit through its own markups overcost when it sells its product to the franchisee.
54
P1: Kad0521772524c03.xml CB802/Blair 0 521 77252 4 April 29, 2005 20:0
3.1 Introduction 55
Within the U.S., the Robinson-Patman Act encourages upstream firms toset uniform wholesale prices.62 This law, however, cannot explain contractuniformity in business-format franchising as the law applies to the sale ofcommodities, and that does not include franchising rights. Various state leveldisclosure rules also increase the cost of using different contract terms withfranchisees, as franchisors must file new versions of these documents in somestates when they modify the terms of their contract for an individual fran-chisee. Yet, these constraints do not appear to be the main reason for thedegree of uniformity in monetary contract terms that is observed in practice.First, legal constraints cannot explain the cross-border uniformity identifiedby Lafontaine and Oxley (2004). Second, disclosure requirements do not in-crease the cost of specifying fees using formulas, such as making the franchisefee or royalty rate a function of local population levels, specifying minimumand maximum levels of fees, and so on. In fact, as we describe below, fran-chisors do use formulaic fees, but only to a limited extent. Finally, and mostinterestingly, franchisors themselves point to other main reasons for unifor-mity. When asked why they use a uniform contract, only 22 percent of the130 business-format franchisors in Lafontaine’s (1992b) survey mentionedlegal considerations as a factor despite the fact that franchisors could giveseveral answers. Most, 73 percent of them, indicated that contract uniformitywas desirable because of the resulting consistency and fairness toward fran-chisees, and another 27 percent of the respondents cited transaction costs asa main factor driving uniformity, stating that such uniformity makes it easierto administer and enforce the contract.63
The main disadvantage of contract uniformity that franchisors identifiedwas the chain’s inability to deal with special circumstances and the lost fran-chise sales that resulted. The existence of this drawback was mentioned, how-ever, by only about half of the franchisors – the other half stated either thatthey saw no disadvantage at all in the use of uniform contracts or they didnot identify any disadvantage when asked to do so.64
62 The Robinson-Patman Act, 15 U.S.C. 13, forbids price discrimination by manufacturersor distributors toward resellers where the effect is to reduce competition or tend to createa monopoly.
63 See McAfee and Schwartz (1994) for an opportunism-based explanation for contractuniformity, and Bhattacharyya and Lafontaine (1995) for a model that suggests thatthe benefit from contract customization may not be large enough to warrant even lowcustomization costs. We come back to these explanations for contract uniformity in thenext chapter.
64 While franchise contract terms offered to potential franchisees at a point in time tend tobe uniform, in the course of the franchise relationship a franchisor may adjust the terms
P1: Kad0521772524c03.xml CB802/Blair 0 521 77252 4 April 29, 2005 20:0
56 Franchise Contracts
The uniformity of the monetary contract terms offered by a franchisor ata given point in time is useful from our perspective in that it allows us todetail those contracts. If each firm used a large number of contracts withvarying terms, it would be much more difficult to describe franchise con-tracting. We come back to the issue of why the contracts are uniform in thenext chapter, after establishing some of their main features in the presentone. In the remainder of this chapter, we focus on the most typical mon-etary terms in franchise contracts, namely franchise fees, royalty rates, andadvertising fees, and examine the frequency with which they are used andthe typical amounts involved.65 We discuss non-monetary contract terms,such as contract duration, termination clauses, input purchase requirementsand territorial exclusivity, only briefly in the last section as we postpone tothe relevant chapter any detailed description of those aspects of the con-tracts that relate specifically to each of the issues we address later in thisbook.
3.2 Franchise Fees
The vast majority of franchisors require that their franchisees pay an initiallump-sum fee called a franchise fee. This fee is paid only once at the beginningof the contract period. Of the various financial contract terms, this one variesthe most across franchisees in a given chain. Table 3-1 reproduces data fromBhattacharyya and Lafontaine (1995), which they obtained from a carefulreview of the disclosure documents provided by 54 franchisors. This tableshows that the variation in franchise fees flows from three main causes. First,some franchisors set this fee in a formulaic way, most often based on the sizeof the territory that a franchisee is awarded or on its market potential. Second,some franchisors require different fees for different types of franchised units,that is, different franchise options such as a free-standing fast-food operationversus a food-court version of the same business. Third, franchisors mayrequire different fees for additional units sold to existing franchisees, or for
of the contract temporarily to give struggling franchisees a chance to survive. In otherwords, given that franchisee failure is damaging for the system, franchisors sometimesgrant rent relief or reduce required royalties for struggling but otherwise promisingfranchisees in spite of specific contract terms.
65 Franchisors also may require franchisees to pay a renewal fee at the end of the contractperiod in consideration for a new contract, and/or a fee to process ownership transferwhen one franchisee sells his or her unit to a new or existing franchisee. We discussthese fees briefly along with other issues related to contract renewal and transfers inChapter 10.

P1: Kad0521772524c03.xml CB802/Blair 0 521 77252 4 April 29, 2005 20:0
3.2 Franchise Fees 57
Table 3-1: Variation in franchise fees
Single Fee (including two firms for which the fee is zero): 19
Multiple Fees: 35As a Function of Market Potential: 10Special Fee for Area Development Agreements: 10For Different Franchise Options: 6Discounts for Additional Units: 6Conversion Discounts: 2No Explanation for range of fee: 1
Total: 54
Source: Bhattacharyya and Lafontaine (1995).
area developers, or set their fee differently for a “conversion” franchise, thatis, when an existing business joins a chain.
The use of different fees for different types of transactions is not surprising –these are very often very different products, after all. Moreover, franchise feesare often understood in the franchise community as “payment to reimbursethe franchisor for the incurred costs of setting the franchisee up in business –from recruiting through training and manuals” (Bond 2001: 29). As the fran-chisor incurs lower costs when selling a new unit to an existing franchisee,or when an existing business converts to become part of a chain, it makessense that the franchise fees be lower in these cases. In fact, given that costsand franchisees’ willingness to pay must vary across a variety of options andcircumstances, what is more puzzling in Table 3-1 is that a full third of thefranchisors in the survey indicated that their franchise fee does not varyat all.
Figure 3-1 displays the distribution of franchise fees charged by the 1,125franchisors in our data that provided information on the level of these feesin 2001.66 Note that when conveying information on the size of the fees, inthis and in other figures and tables in this chapter, we use the average of a feewhenever a range is given in the data source.67
66 What we refer to as 2001 data are obtained from the 2002 Source Book and thus reflectcontracting practices in 2001. Also, we use the end of 2001 exchange rate for Canadiandollars to transform the franchise fees of Canadian firms into U.S. dollars.
67 When only a lower bound was given, as in “$30,000 and up,” we use twice the lowerbound as an estimate for the upper bound, and then calculate the mean between thesetwo values. This amounts to using 1.5 times the lower bound as our measure of averagefranchise fee. When only an upper bound is given, as in “up to $40,000,” we use half theupper bound as an estimate for the lower bound, and again calculate the mean. Thisamounts to using 0.75 times the upper bound as our estimate of the mean franchise fee.
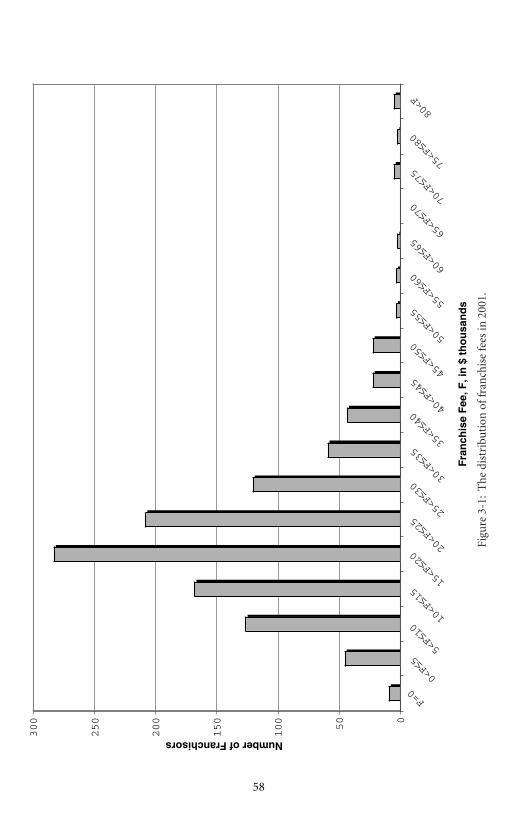
P1: Kad0521772524c03.xml CB802/Blair 0 521 77252 4 April 29, 2005 20:0
Fra
nch
ise
Fee
, F, i
n $
th
ou
san
ds
Number of Franchisors
Figu
re3-
1:T
he
dist
ribu
tion
offr
anch
ise
fees
in20
01.
58
P1: Kad0521772524c03.xml CB802/Blair 0 521 77252 4 April 29, 2005 20:0
3.2 Franchise Fees 59
Figure 3-1 shows that the vast majority of franchisors charge an initialfranchise fee somewhere between $5,000 and $30,000, and most commonlybetween $15,000 and $25,000. The median fee is $20,000. Very few fran-chisors, only 9 out of 1,125, charge no such fee. At the other extreme, only20 of the franchisors, or less than 2 percent of them, request a franchise feeabove $50,000. In the 1998 Profile of Franchising, a slightly higher proportion,7 percent of the 1,209 franchisors in the study, charged a franchise fee above$50,000. The difference might be due to a disproportionate number of firmswith low franchise fees choosing to appear in franchise directories, and hencein our data, as such directories may be more useful franchisee recruiting toolsfor such firms. In any case, the main point of this figure is that it illustrates howsmall franchise fees really are, especially relative to the total payments madeby franchisees to franchisors. Over the life of these contracts, franchise feesrepresent in most cases only 5 to 10 percent of the revenues that a franchisorobtains from a franchised unit, with the remainder coming from sales-basedroyalties or advertising fees.68
Figure 3-1 also shows the variance in franchise fees across firms. Table 3-2explores this further by showing the distribution of franchise fees acrosssectors. The set of franchisors included in this table is lower, at 980 ratherthan 1,125, because we restrict the sample to those firms for which we havedata on all the fees we describe in this chapter.69 This makes it possible tocompare the distribution of the different fees across a constant set of firms.Also, the sector definitions that we use in this and other sections of this book,when referring to our own data set, are not those of the USDOC. Those sectorsdefinitions are based on old data and we have limited information as to whatthese sectors really contained. We therefore generated our own set of sectorsto better describe the types of firms found in our data.
Table 3-2 shows a tendency for franchise fees to be higher on average insome sectors than others. Franchisors in the sit-down restaurant industry(Restaurants), for example, charge relatively high franchise fees, as repre-sented by Bennigan’s $65K franchise fee. Franchisors in the Contractors and
68 For example, for a firm charging the median franchise fee of $20,000 and the medianroyalty rate of 5 percent, and assuming relatively low sales revenues of $500,000 peryear in real terms over a fifteen-year contract (the average contract duration accordingto the USDOC data), total royalty revenues would be $375,000. Thus, the franchise feewould be just slightly above 5 percent of the total payments from the franchisee to thefranchisor over the life of the contract (assuming no advertising fee).
69 We also exclude the few firms that require royalty rates above 25 percent of sales to bepaid to the franchisor, on the notion that such percentages must be applied to somethingelse beside sales revenues (e.g., gross margins).

P1: Kad0521772524c03.xml CB802/Blair 0 521 77252 4 April 29, 2005 20:0
60 Franchise Contracts
Table 3-2: The distribution of initial franchise fees in 2001, per sector
Sector 0< x ≤ 10 10< x ≤ 20 20< x ≤ 30 30< x ≤ 40 40< x ≤ 50 50< x Total
Automotive 10 17 36 4 2 1 70Business 21 27 25 12 3 5 93Contractors 4 18 12 4 38Cosmetic 2 14 4 1 21Education 6 8 10 5 5 34Fast Food 18 110 73 14 7 3 225Health and 3 9 9 1 22
FitnessHome 3 7 9 1 3 23
FurnishingsHotels and 1 4 9 2 16
MotelsMaintenance 25 35 16 4 3 83Personal 12 30 16 4 3 65
ServicesReal Estate 8 13 6 1 28Recreation 4 7 3 1 1 16Rental 3 6 5 1 2 17Restaurants 1 12 23 22 8 3 69Retail Food 2 13 24 2 41Retail Other 6 35 56 14 7 1 119
Total 125 358 335 95 47 20 980
Personal Services sectors charge lower fees on average. But this table alsoshows that even within sectors there remains significant variance in franchisefees. In most sectors, we find firms that charge very low fees and firms thatcharge relatively high fees. Note that some franchisors try to attract fran-chisees by being “low-cost,” defined typically as having a low initial fee. Firmsthat are interested in appearing in listings of “low-cost” franchises thus havean incentive to keep their upfront fee relatively low.
Finally, Table 3-3 describes how initial franchise fees have changed since1980. Column 3 shows that the proportion of firms requesting an initialfranchise fee has increased during the 1980s, to the point where almost allfranchisors now request such payments. But these fees have always been quitepopular: only about 10 percent of the chains did not request such fees in 1980.The last four columns provide information on the average and maximumfranchise fee observed in the data each year since 1980, in nominal and then inreal (2001) U.S. dollars.70 Not surprisingly, in nominal terms, these initial fees
70 We do not display minima as these are always zero.

P1: Kad0521772524c03.xml CB802/Blair 0 521 77252 4 April 29, 2005 20:0
3.2 Franchise Fees 61
Table 3-3: The evolution of initial franchise fees, 1980 to 2001
% offranchisors Mean fee, Max. fee
Number with an Mean fee, real Max. fee realof upfront nominal ($ 2001 nominal ($ 2001
Year franchisors franchise fee ($ thousands) thousands) ($ thousands) thousands)
1980 952 89.8 13.0 27.9 300.0 644.81981 1,017 92.0 14.7 28.7 450.0 876.71982 1,136 93.0 15.1 27.8 250.0 458.81983 1,102 94.6 15.4 27.5 82.5 146.71984 843 95.3 16.7 28.5 100.0 170.51985 887 96.7 17.8 29.3 112.5 185.21986 1,032 97.0 18.2 29.4 250.0 404.01987 1,036 97.5 19.0 29.6 150.0 233.81988 1,005 98.5 20.0 29.9 120.0 179.61989 1,041 98.8 20.6 29.4 127.5 182.11990 1,082 98.7 20.7 28.0 110.0 149.11991 1,008 98.8 20.6 26.8 125.0 162.51992 981 99.1 21.0 26.5 128.0 161.61993 1,075 99.1 20.0 24.5 125.0 153.21994 1,071 98.8 20.0 23.9 128.0 153.01995 1,090 99.2 20.2 23.5 131.3 152.51996 1,079 99.2 20.8 23.5 128.0 144.51997 1,015 99.1 20.9 23.1 128.0 141.21998 971 99.2 21.6 23.5 300.0 326.02000 959 99.2 22.3 23.0 300.0 308.52001 1,125 99.2 22.2 22.2 300.0 300.0
Note: We do not display minima as these are always zero. Data for 1999 are unavailable as the BondFranchise Guide was not published in 2000.
on average have increased over this period. In constant 2001 dollars, however,franchise fees increased over most of the 1980s, but have been decreasingsince. In other words, nominal franchise fees did not keep up with the rateof inflation in the 1990s. Consequently, the average franchise fee in 2001 ismore than $5,000 lower than its 1980 counterpart when both are expressed in2001 dollars. Much of this decline, and the large reduction in the variance ofthese initial fees (not shown), can be traced to a reduction in the use of veryhigh initial fees by just a few firms (see in particular the very high maximumvalues in the early 1980s).71
71 The high maximum franchise fee in the last few years in Table 3-3 is for the U.S. BasketballLeague, which considers itself a business-format franchisor and offers contracts thatqualify as such according to the FTC rule.

P1: Kad0521772524c03.xml CB802/Blair 0 521 77252 4 April 29, 2005 20:0
62 Franchise Contracts
3.3 Royalty Rates
In addition to collecting an initial franchise fee, franchisors typically requirefranchisees to make ongoing payments throughout the life of their contracts.In most, but not all, franchise systems, these payments are calculated as apercentage of sales revenues. In their Profile of Franchising, the IFA Educa-tional Foundation and Frandata (2000) reported that 1,006 franchisors, or82 percent of their sample, requested some form of percentage royalties. Theyfound that 61 franchisors, or 5 percent of their sample, instead charged aflat dollar amount per time period on an ongoing basis, and 22 of them, or2 percent, required a fee per unit sold or per transaction (such as a fee peraudit for an accounting firm, or per room rented for a hotel). Finally, 62 fran-chisors, or 5 percent of the firms in their sample, charged no royalties at all.Among the 1,006 franchise systems that operated under a percentage royalty,the report goes on to mention that this fee was based on sales revenues for 932franchisors, while it was based on gross margins for another six franchisors.72
The remaining 52 franchisors, almost all from the personnel, real estate, travelagency, and business services sectors, used some other basis that the authorsdo not describe.73
A number of franchisors that charge a percentage rate also specify someminimum level of royalty payments. Such minimum payments are the norm inother industries that use percentage fees, such as retail leasing, for example.74
It is, however, difficult to ascertain the extent to which minimum royaltypayments are used in franchising. To our knowledge, the only source of suchinformation is Lafontaine’s (1992b) survey, where 40 of the 123 franchisorsthat levied royalties said that franchisees are subject to some minimum dollaramount in royalty when their sales are too low.
Finally, a few franchisors that charge percentage fees rely on an increasingor decreasing scale, making the percentage rate itself a function of sales levels.Of the 118 franchisors that levied percentage royalties in Lafontaine (1992b),93 charged a constant royalty rate no matter what level of sales or profitsor margins franchisees achieve, while 18 franchisors used a decreasing scale
72 Consistent with these figures, Lafontaine (1992b) also reports that 112 of the 123 re-spondents that levied royalties used a percentage of sales royalty. Two respondents useda percentage of profits royalty, four used a percentage of gross margins, and anotherfour levied a fixed ongoing fee per month or week.
73 One could speculate that this alternative basis for royalties would be some form of netrevenues to the franchisee as these sectors are ones where sales revenues to the franchiseare different from total outlet receipts.
74 See, e.g., Pashigian and Gould (1998) and Wheaton (2000) on the structure of retailleases.
P1: Kad0521772524c03.xml CB802/Blair 0 521 77252 4 April 29, 2005 20:0
3.3 Royalty Rates 63
for royalties, that is a royalty rate that declines as outlet sales reach certaintarget levels, and two used an increasing scale. Both the use of minimumroyalty payments and of royalty rates that change as outcomes reach giventargets suggest that a number of franchisors find it useful to introduce somenon-linearity in their contracts. Our data suggest moreover that the use ofvarying rates may be on the rise: in 1980, only 49 of the 938 franchisors forwhich we have royalty rate data indicated a range of possible rates, whereas114 franchisors (out of 1,023) gave a range in 1990, and 149 franchisors (outof 1,085) gave one in 2001. Bhattacharyya and Lafontaine’s (1995) detailedlook at 54 disclosure documents suggests that most royalty rate ranges reflecteither decreasing or increasing scales, or a policy of granting lower royaltyrates for the first few years of the franchisee’s business.
For all those cases where franchisors use percentage of sales rates, we canrely on our data to see in more detail the kinds of rates found in franchisecontracts.75 Figure 3-2 presents this distribution for the 1,085 franchisorsfor which we have this information for 2001.76 This figure shows that roy-alty rates typically vary between 3 and 6 percent, and that 26 percent of thefranchisors charged the modal royalty rate of 5 percent, which in this case isalso the median rate. Interestingly, 8 percent of business-format franchisorsdo not require the payment of any royalties at all. Examples include Fan-tastic Sam’s, Snap-on Tools, Ben and Jerry’s Ice Cream, and I Can’t BelieveIt’s Yogurt. Some such franchisors, like Fantastic Sam’s, instead require fran-chisees to pay a fixed amount per week or month for the duration of thecontract – we explore this further below. Others, such as Ben & Jerry’s, ob-tain revenues from sales of goods to their franchisees, just like traditionalfranchisors do. We return to the issue of input purchase requirements inChapter 6.77
75 As noted earlier, we exclude from our sample the few franchisors whose royalty rateis above 25 percent. Our data source does not specifically indicate whether the ratesare applied to sales revenue, to gross margins, or to profits. As we just saw, for the vastmajority of franchisors, the rates are a percentage of sales. But percentage rates above25 percent suggest the use of an alternative basis, and thus we want to preclude comparingthese with our sales-based rates or including them in our reported averages and so on.
76 Again we use the mean value whenever a range of royalty rates was given in our datasource. We also impute minima and maxima when these are not stated using the method-ology described earlier for franchise fees.
77 Rao and Srinivasan (1995) argue that retail franchised chains charge lower royalty ratesthan those in service industries because the former have an alternative mechanism attheir disposal to extract revenues from their franchisees, namely they can sell inputs tofranchisees at a markup. See also Lafontaine (1992a) for some discussion and relatedevidence.
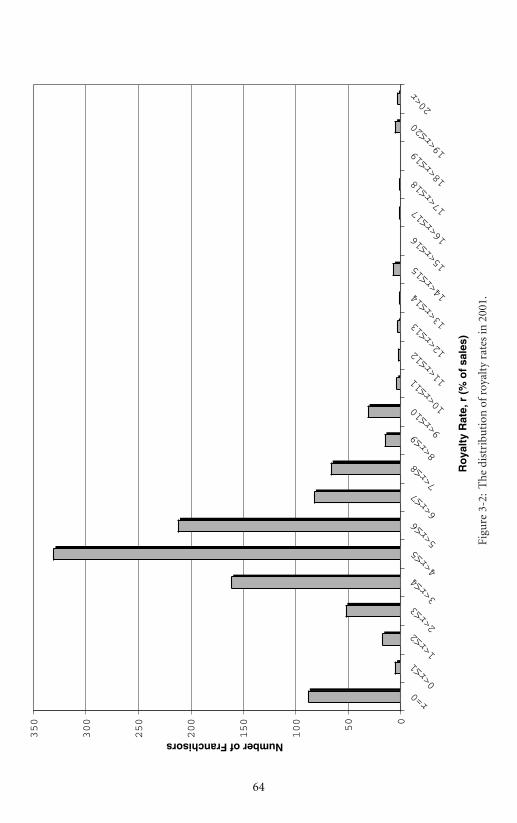
P1: Kad0521772524c03.xml CB802/Blair 0 521 77252 4 April 29, 2005 20:0
Ro
yalt
y R
ate,
r (
% o
f sa
les)
Number of Franchisors
Figu
re3-
2:T
he
dist
ribu
tion
ofro
yalt
yra
tes
in20
01.
64
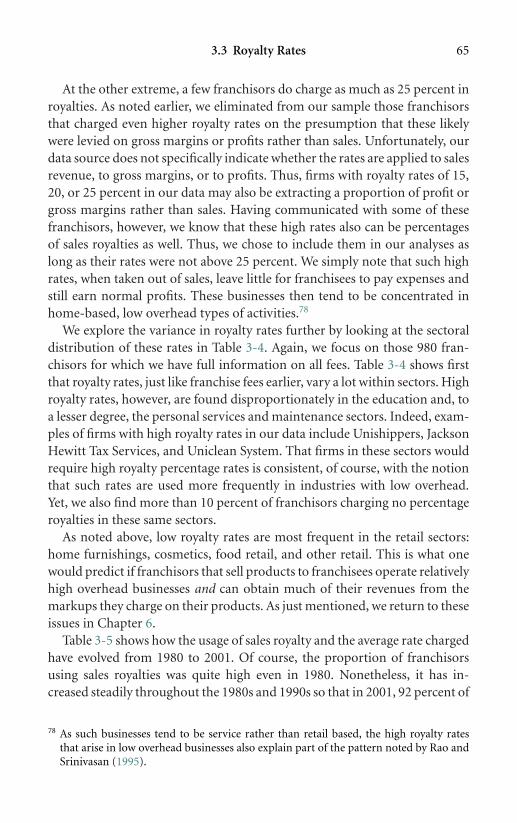
P1: Kad0521772524c03.xml CB802/Blair 0 521 77252 4 April 29, 2005 20:0
3.3 Royalty Rates 65
At the other extreme, a few franchisors do charge as much as 25 percent inroyalties. As noted earlier, we eliminated from our sample those franchisorsthat charged even higher royalty rates on the presumption that these likelywere levied on gross margins or profits rather than sales. Unfortunately, ourdata source does not specifically indicate whether the rates are applied to salesrevenue, to gross margins, or to profits. Thus, firms with royalty rates of 15,20, or 25 percent in our data may also be extracting a proportion of profit orgross margins rather than sales. Having communicated with some of thesefranchisors, however, we know that these high rates also can be percentagesof sales royalties as well. Thus, we chose to include them in our analyses aslong as their rates were not above 25 percent. We simply note that such highrates, when taken out of sales, leave little for franchisees to pay expenses andstill earn normal profits. These businesses then tend to be concentrated inhome-based, low overhead types of activities.78
We explore the variance in royalty rates further by looking at the sectoraldistribution of these rates in Table 3-4. Again, we focus on those 980 fran-chisors for which we have full information on all fees. Table 3-4 shows firstthat royalty rates, just like franchise fees earlier, vary a lot within sectors. Highroyalty rates, however, are found disproportionately in the education and, toa lesser degree, the personal services and maintenance sectors. Indeed, exam-ples of firms with high royalty rates in our data include Unishippers, JacksonHewitt Tax Services, and Uniclean System. That firms in these sectors wouldrequire high royalty percentage rates is consistent, of course, with the notionthat such rates are used more frequently in industries with low overhead.Yet, we also find more than 10 percent of franchisors charging no percentageroyalties in these same sectors.
As noted above, low royalty rates are most frequent in the retail sectors:home furnishings, cosmetics, food retail, and other retail. This is what onewould predict if franchisors that sell products to franchisees operate relativelyhigh overhead businesses and can obtain much of their revenues from themarkups they charge on their products. As just mentioned, we return to theseissues in Chapter 6.
Table 3-5 shows how the usage of sales royalty and the average rate chargedhave evolved from 1980 to 2001. Of course, the proportion of franchisorsusing sales royalties was quite high even in 1980. Nonetheless, it has in-creased steadily throughout the 1980s and 1990s so that in 2001, 92 percent of
78 As such businesses tend to be service rather than retail based, the high royalty ratesthat arise in low overhead businesses also explain part of the pattern noted by Rao andSrinivasan (1995).
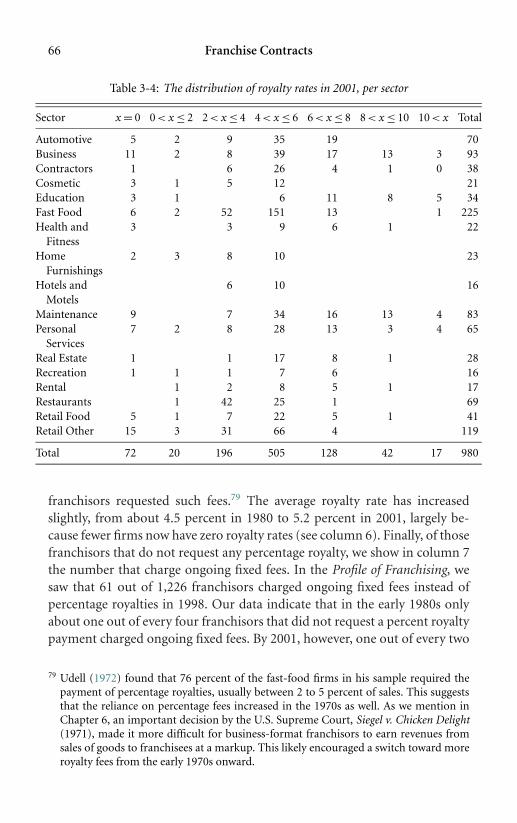
P1: Kad0521772524c03.xml CB802/Blair 0 521 77252 4 April 29, 2005 20:0
66 Franchise Contracts
Table 3-4: The distribution of royalty rates in 2001, per sector
Sector x = 0 0< x ≤ 2 2< x ≤ 4 4< x ≤ 6 6< x ≤ 8 8< x ≤ 10 10< x Total
Automotive 5 2 9 35 19 70Business 11 2 8 39 17 13 3 93Contractors 1 6 26 4 1 0 38Cosmetic 3 1 5 12 21Education 3 1 6 11 8 5 34Fast Food 6 2 52 151 13 1 225Health and 3 3 9 6 1 22
FitnessHome 2 3 8 10 23
FurnishingsHotels and 6 10 16
MotelsMaintenance 9 7 34 16 13 4 83Personal 7 2 8 28 13 3 4 65
ServicesReal Estate 1 1 17 8 1 28Recreation 1 1 1 7 6 16Rental 1 2 8 5 1 17Restaurants 1 42 25 1 69Retail Food 5 1 7 22 5 1 41Retail Other 15 3 31 66 4 119
Total 72 20 196 505 128 42 17 980
franchisors requested such fees.79 The average royalty rate has increasedslightly, from about 4.5 percent in 1980 to 5.2 percent in 2001, largely be-cause fewer firms now have zero royalty rates (see column 6). Finally, of thosefranchisors that do not request any percentage royalty, we show in column 7the number that charge ongoing fixed fees. In the Profile of Franchising, wesaw that 61 out of 1,226 franchisors charged ongoing fixed fees instead ofpercentage royalties in 1998. Our data indicate that in the early 1980s onlyabout one out of every four franchisors that did not request a percent royaltypayment charged ongoing fixed fees. By 2001, however, one out of every two
79 Udell (1972) found that 76 percent of the fast-food firms in his sample required thepayment of percentage royalties, usually between 2 to 5 percent of sales. This suggeststhat the reliance on percentage fees increased in the 1970s as well. As we mention inChapter 6, an important decision by the U.S. Supreme Court, Siegel v. Chicken Delight(1971), made it more difficult for business-format franchisors to earn revenues fromsales of goods to franchisees at a markup. This likely encouraged a switch toward moreroyalty fees from the early 1970s onward.

P1: Kad0521772524c03.xml CB802/Blair 0 521 77252 4 April 29, 2005 20:0
3.3 Royalty Rates 67
Table 3-5: Descriptive statistics for the royalty rates, 1980 to 2001
Number offranchisors
% of Number of with nofranchisors franchisors royalty but
Number of with non- Mean Maximum with zero positivefranchisors zero sales royalty royalty royalty ongoing
Year in the data royalty rate rate rate payments
1980 938 85.7 4.5 22.5 134 281981 1,016 87.1 4.6 22.5 131 301982 1,141 87.9 4.7 25 138 371983 1,093 88.9 4.7 25 121 461984 821 87.3 4.8 25 104 371985 853 90.6 5 22 80 291986 988 90.4 4.9 25 95 311987 1,006 90.4 4.9 25 97 391988 963 91.7 5 22 80 371989 993 91.2 5 22 87 461990 1,023 90.8 5 22 94 491991 948 91.4 5 22 82 441992 928 90.9 5 22 84 401993 1,035 90.4 5 25 99 521994 1,035 89.9 5 22.4 105 551995 1,045 90.7 5 22.4 97 541996 1,045 91.2 5.1 22 92 471997 982 91.6 5 22 82 441998 942 91.3 5.1 22 82 442000 927 92.0 5.2 22 74 372001 1,085 91.9 5.2 22 88 48
such firms, including, for example, Fantastic Sam’s, used ongoing fixed feesinstead of sales-based fees. Combined with the increased frequency in the useof percentage royalties, by 2001 we find that 96 percent of franchisors chargedsome form of royalty, either a percentage fee or ongoing fixed fees, whereas89 percent of franchisors did one or the other back in 1980.
We provide more details on the amount of ongoing fixed fees in Table 3-6.Specifically, this table shows the evolution in the frequency with which suchfees are used, and in the amounts requested, between 1980 and 2001. Column3 shows the total number of firms requesting such fees, and the proportionof the sample they represent, regardless of what other fees the franchisor maycharge. The data in this column confirm that such fees are the exception ratherthan the rule: The proportion of firms that rely on ongoing fixed payments is

P1: Kad0521772524c03.xml CB802/Blair 0 521 77252 4 April 29, 2005 20:0
68 Franchise Contracts
Table 3-6: The frequency and amounts of ongoing fixed payments (per month,in U.S. dollars)
Number offranchisors
(and %) with Mean fixed Mean fixed Mean fixed Mean fixedongoing fee, all fee, all fee when fee when
Number of fixed franchisors franchisors used usedYear franchisors payments (nominal) (real, 2001$) (nominal) (real, 2001$)
1980 1,089 40 (3.7) 17.7 38.0 481.2 1034.21981 1,100 46 (4.2) 17.0 33.2 407.5 793.91982 1,220 58 (4.8) 19.9 36.5 418.7 768.41983 1,169 75 (6.4) 36.4 64.8 567.7 1009.41984 880 63 (7.2) 39.2 66.9 548.2 934.41985 926 55 (5.9) 33.4 54.9 562.1 925.21986 1,075 60 (5.6) 38.6 62.4 692.4 1118.91987 1,075 69 (6.4) 33.0 51.5 514.4 801.91988 1,023 61 (6.0) 32.3 48.4 542.5 812.21989 1,059 64 (6.0) 29.3 41.9 485.2 692.91990 1,096 71 (6.5) 35.5 48.0 547.4 741.71991 1,017 64 (6.2) 37.3 48.5 601.9 782.71992 992 61 (6.1) 33.5 42.3 545.3 688.31993 1,088 86 (6.8) 33.5 41.1 493.2 604.51994 1,090 90 (7.3) 35.7 42.6 486.0 580.81995 1,096 93 (7.8) 41.2 47.9 531.7 617.91996 1,092 84 (6.7) 31.4 35.4 469.3 529.71997 1,022 82 (6.9) 29.3 32.3 421.5 465.11998 995 76 (7.6) 36.0 39.1 470.8 511.52000 984 67 (6.8) 33.5 34.5 492.4 506.42001 1,158 82 (7.1) 34.1 34.1 481.6 481.6
relatively low, and it has remained quite stable, around 6 to 7 percent, sinceat least the mid-1980s. Moreover, a comparison of the number of franchisorsthat use fixed payments with the number of franchisors with zero royalty thatuse such fees, as per column 7 of Table 3-5, reveals that one-third to one-halfof the franchisors that rely on ongoing fixed payments collect those alongwith positive royalty payments.
The next four columns of data in Table 3-6 show the average amountsinvolved, per month, both in nominal and in real (2001) U.S. dollars, firstacross all firms in the data (columns 4 and 5) and then for those firms thatuse these types of fees only (columns 6 and 7). Focusing on the latter twocolumns for now, we see that the average fee charged by firms that use thesefees has remained about the same in nominal terms over this period. But in
P1: Kad0521772524c03.xml CB802/Blair 0 521 77252 4 April 29, 2005 20:0
3.4 Advertising Fees 69
real terms, there has been a steady and important reduction in the amountof fixed ongoing payments from an average of about $900 per month to onlyabout $500 in 2001. This, it turns out, is mostly due to the disappearance of afew franchisors that charged very high ongoing fees. When one considers theimportance of these fees for franchising as a whole (that is, on average acrossall firms in the data as per columns 4 and 5), one finds that in real terms theaverage monthly amounts collected went up slightly in the mid-1980s andthen started to go down again. By 2001, these fees were back to about thesame level, on average, as they were in the early 1980s.
3.4 Advertising Fees
In addition to charging an initial franchise fee and running royalties, manyfranchisors also stipulate in their contracts that the franchisee must makecontributions to support national, regional, and/or local advertising. For lo-cal advertising, the contributions are often stated as minima: the franchisorrequires that the franchisee spend at least X percent of its sales revenues, or atleast $X, on local advertising. For advertising fees generally, franchisors oftenstate in their disclosure documents that the rates may be changed later, or,for those that do not require an advertising contribution, that an advertisingfund may be instituted later, at the discretion of the franchisor. Franchisorsthus leave themselves much leeway in this part of their financial dealings withfranchisees. Contrary to franchise fees, which often vary across franchiseesin a chain, this leeway relates to the ability to make changes over time, notto treat different franchisees differently. Of course, raising the amount thatfranchisees must devote to advertising at any point in time is apt to causesome conflict in a franchise system. We return to this potential problem inChapter 9, which focuses specifically on advertising issues.
Like royalty payments, advertising fees are most often stipulated as a con-stant proportion of the franchisees’ sales revenues. But again like royaltypayments, advertising fees are also sometimes specified as a fixed monthly orweekly amount, or calculated as a function of the number of transactions, andso on. In Volume III of the Profile of Franchising, the IFA and Frandata foundthat 634 (or 52 percent) of the 1,221 franchisors for which they had advertis-ing fee data required that franchisees pay a percentage of their sales towardadvertising. The remaining franchisors either required no contribution at all(340, or 28 percent), or contributions only to local or regional advertisingfunds (149, or 12 percent), or a flat fee (66, or 5 percent of them), or a pertransaction fee (13, or 1 percent of the sample). The remaining few firms usedsome other unspecified basis to calculate the advertising requirement.
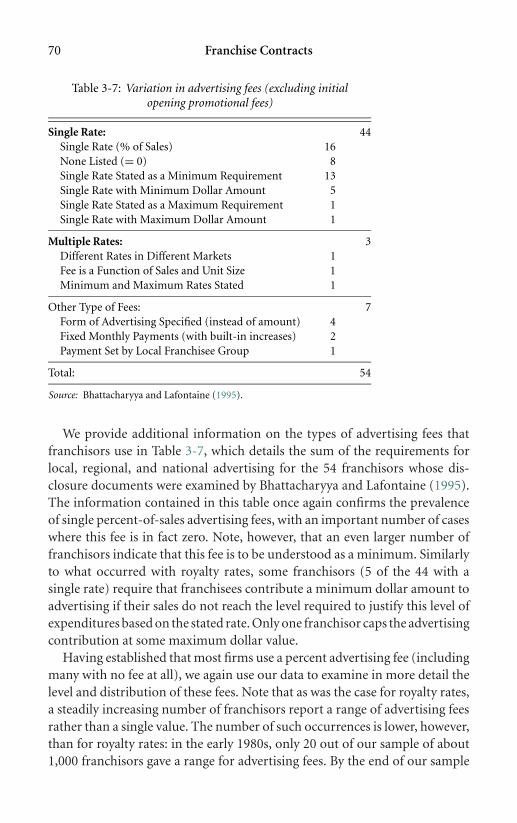
P1: Kad0521772524c03.xml CB802/Blair 0 521 77252 4 April 29, 2005 20:0
70 Franchise Contracts
Table 3-7: Variation in advertising fees (excluding initialopening promotional fees)
Single Rate: 44Single Rate (% of Sales) 16None Listed (= 0) 8Single Rate Stated as a Minimum Requirement 13Single Rate with Minimum Dollar Amount 5Single Rate Stated as a Maximum Requirement 1Single Rate with Maximum Dollar Amount 1
Multiple Rates: 3Different Rates in Different Markets 1Fee is a Function of Sales and Unit Size 1Minimum and Maximum Rates Stated 1
Other Type of Fees: 7Form of Advertising Specified (instead of amount) 4Fixed Monthly Payments (with built-in increases) 2Payment Set by Local Franchisee Group 1
Total: 54
Source: Bhattacharyya and Lafontaine (1995).
We provide additional information on the types of advertising fees thatfranchisors use in Table 3-7, which details the sum of the requirements forlocal, regional, and national advertising for the 54 franchisors whose dis-closure documents were examined by Bhattacharyya and Lafontaine (1995).The information contained in this table once again confirms the prevalenceof single percent-of-sales advertising fees, with an important number of caseswhere this fee is in fact zero. Note, however, that an even larger number offranchisors indicate that this fee is to be understood as a minimum. Similarlyto what occurred with royalty rates, some franchisors (5 of the 44 with asingle rate) require that franchisees contribute a minimum dollar amount toadvertising if their sales do not reach the level required to justify this level ofexpenditures based on the stated rate. Only one franchisor caps the advertisingcontribution at some maximum dollar value.
Having established that most firms use a percent advertising fee (includingmany with no fee at all), we again use our data to examine in more detail thelevel and distribution of these fees. Note that as was the case for royalty rates,a steadily increasing number of franchisors report a range of advertising feesrather than a single value. The number of such occurrences is lower, however,than for royalty rates: in the early 1980s, only 20 out of our sample of about1,000 franchisors gave a range for advertising fees. By the end of our sample

P1: Kad0521772524c03.xml CB802/Blair 0 521 77252 4 April 29, 2005 20:0
3.4 Advertising Fees 71
period, this number was up to about 50 per year. As we did for the other fees,we rely on the average rate in those cases where a range is given.80
Figure 3-3 shows the distribution of the advertising fees as a percent ofsales for the 1,028 firms with advertising fee information in our data in 2001.This distribution first confirms what was reported in the Profile of Franchising,namely that many franchisors (289, or 28 percent of our sample) do not chargeany advertising fee. Advertising fees also are rather low relative to royalty rates.Of the firms that charge an advertising fee, the majority (466 out of 739, or63 percent) set it at a level of 2 percent or less. Almost all firms set this feebelow 5 percent, our modal (and median) royalty rate. These patterns are veryconsistent with those reported in the Profile of Franchising, where 68 percentof the firms that used a percentage of sales advertising fee charged 2 percentor less, while 98 percent of them requested fees of less than 5 percent.
We show the sectoral distribution of advertising rates in Table 3-8, restrict-ing our data to those franchisors for which we observe all fees. This tablemostly illustrates that relatively high advertising fees are found only in a fewsectors, most strikingly the automotive and health and fitness sectors. A rela-tively small number of firms from the personal services and from the fast-foodindustries also charge high advertising rates. In many other sectors, no firmrequires more than a 4 percent contribution.
Table 3-9 provides information on how the frequency and amounts ofadvertising fees have changed between 1980 and 2001. This table clearly showsthat the mean percent advertising fee has gone up over this period, but thisis entirely due to the increasing number of firms that request such fees. Inother words, the average advertising fee charged by users of such fees has notchanged on average over this period, but more franchisors now stipulate anadvertising fee separately from royalties. In addition, the last two columnsof this table show that the number of franchisors that charge ongoing fixedpayments represents an increasing proportion of all franchisors with a zeroadvertising rate. This occurs because the number of franchisors requestingongoing fixed payments has remained quite stable while the number that donot specify a separate advertising percentage fee has decreased substantiallyover the period of our data.
Finally, while percent advertising fees are often specified and administeredseparately from royalty payments, from a franchisee’s perspective it is the sumof these rates that really matters – this sum determines the portion of eachdollar of sales revenue that must be sent back to the franchisor. It is also the sum
80 Here also we impute minima and maxima when these are not stated explicitly, as we didfor franchise fees (see earlier footnote).

P1: Kad0521772524c03.xml CB802/Blair 0 521 77252 4 April 29, 2005 20:0
Ad
vert
isin
g R
ate,
ad
v (%
of
sale
s)
Number of Franchisors
Figu
re3-
3:T
he
dist
ribu
tion
ofp
erce
nt
ofsa
les
adve
rtis
ing
fees
in20
01.
72
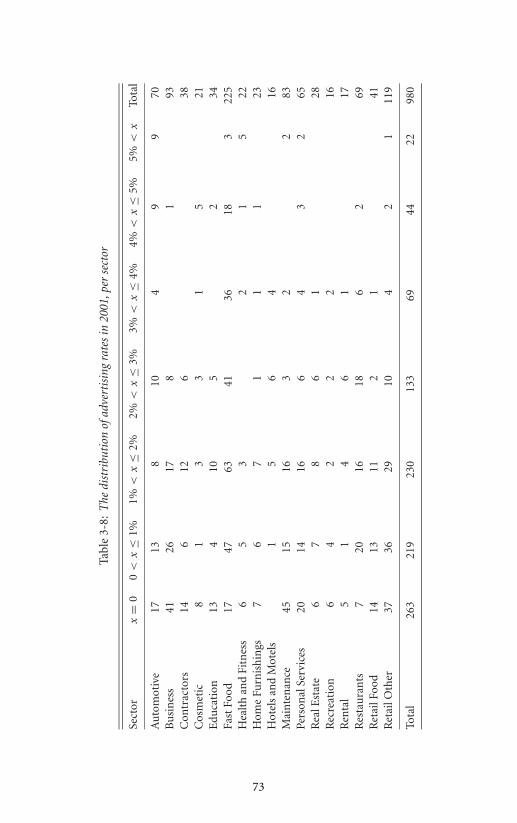
P1: Kad0521772524c03.xml CB802/Blair 0 521 77252 4 April 29, 2005 20:0
Tabl
e3-
8:T
hedi
stri
buti
onof
adve
rtis
ing
rate
sin
2001
,per
sect
or
Sect
orx
=0
0<
x≤
1%1%
<x
≤2%
2%<
x≤
3%3%
<x
≤4%
4%<
x≤
5%5%
<x
Tota
l
Au
tom
otiv
e17
138
104
99
70B
usi
nes
s41
2617
81
93C
ontr
acto
rs14
612
638
Cos
met
ic8
13
31
521
Edu
cati
on13
410
52
34Fa
stFo
od17
4763
4136
183
225
Hea
lth
and
Fitn
ess
65
32
15
22H
ome
Furn
ish
ings
76
71
11
23H
otel
san
dM
otel
s1
56
416
Mai
nte
nan
ce45
1516
32
283
Pers
onal
Serv
ices
2014
166
43
265
Rea
lEst
ate
67
86
128
Rec
reat
ion
64
22
216
Ren
tal
51
46
117
Res
tau
ran
ts7
2016
186
269
Ret
ailF
ood
1413
112
141
Ret
ailO
ther
3736
2910
42
111
9
Tota
l26
321
923
013
369
4422
980
73

P1: Kad0521772524c03.xml CB802/Blair 0 521 77252 4 April 29, 2005 20:0
Tabl
e3-
9:D
escr
ipti
vest
atis
tics
for
adve
rtis
ing
perc
enta
gera
tes,
1980
to20
01
Mea
nN
um
ber
offr
anch
isor
sN
um
ber
offr
anch
isor
sw
ith
%fr
anch
isor
sw
ith
(use
rsan
dw
ith
adve
rtis
ing
adve
rtis
ing
rate
=0,
but
Year
N>
0ad
vert
isin
gra
ten
onu
sers
)M
axim
um
rate
=0
pos
itiv
efi
xed
paym
ents
1980
925
44.2
1.1
13.0
516
3719
811,
026
48.5
1.2
16.3
528
4619
821,
167
52.5
1.3
16.3
554
5519
831,
114
54.9
1.3
16.3
502
7119
8483
058
.31.
413
.034
659
1985
873
60.1
1.5
10.0
348
4819
861,
024
64.7
1.6
13.0
361
5319
871,
043
65.2
1.6
12.0
363
6519
8898
668
.41.
713
.031
255
1989
1,01
867
.61.
615
.033
056
1990
1,04
668
.91.
615
.032
561
1991
972
68.2
1.6
14.0
309
5719
9295
266
.71.
510
.031
755
1993
1,03
868
.11.
610
.033
167
1994
1,02
167
.01.
510
.033
774
1995
1,00
767
.91.
510
.032
376
1996
979
71.2
1.6
10.0
282
6519
9792
670
.51.
610
.027
361
1998
894
71.9
1.7
10.0
251
6620
0087
672
.71.
710
.023
959
2001
1,02
871
.91.
714
.028
969
74
P1: Kad0521772524c03.xml CB802/Blair 0 521 77252 4 April 29, 2005 20:0
3.4 Advertising Fees 75
of these percentage-of-sales fees then that affects the franchisee’s decisions atthe margin. From the franchisor’s perspective also, advertising expendituresare not bound by the amount collected specifically for this purpose. In chainsthat do not specify such a fee, franchisors still spend money on advertising. Inother words, not all franchisors necessarily draw a clear distinction betweenroyalty revenue and advertising related funds, especially early in our sampleperiod.81 For these reasons, in Figure 3-4 and Table 3-10 we present thedistribution of the sum of royalty and advertising rates, overall and per sectorrespectively, in 2001.
Figure 3-4 shows that most franchisees paid somewhere between 4 and9 cents out of every dollar of sales in the form of royalties and/or advertisingfees to their franchisor in 2001, with a median (equal to modal) total rateof 7 percent. Only 65 franchisors (6.5 percent) do not charge any royalty oradvertising fee based on sales. As described above, this includes of courseFantastic Sam’s and Snap-on Tool. On the other hand, only a few franchisors(16 out of 1,000) require contributions that can add up to more than 15 percentof a franchisee’s sales revenues, including again some well-known firms suchas Pearle Vision and Jackson Hewitt Tax Service, a subsidiary of CendantCorporation that had over 4,000 locations in 2002.
The data in Table 3-10 generally confirm that high total rates are usedrelatively more frequently in service industries such as education, health andfitness, personal services, automotive, and maintenance sectors. Franchisorsin retail businesses, in contrast, tend to rely on relatively lower total rates. Thisis consistent with the conclusion we reached upon observing royalty rates bythemselves. Thus, our data suggest that franchisors that choose a low royaltyrate do not “make it up” by choosing a comparatively high advertising rate, orvice versa: in fact, high royalty and advertising rates generally go hand in hand.We confirmed this tendency by calculating the correlation between royaltyrates and advertising fees. For the 980 firms present in our data in 2001,this correlation is 0.13 and highly statistically significant. But even withinsectors, the correlation between these fees tends to be positive. Specifically,the correlation is positive in 13 of our 17 sectors, and significantly so (atthe 0.10 level) in 8 cases. For the other sectors, the correlations are negativebut not statistically different from 0. Note that we find the highest positivecorrelation between these fees (0.38 and 0.35, both significantly differentfrom 0 at the 0.05 level) in the other retail and in the personal services sectors,respectively.
81 See Stassen and Mittelstaedt (2001) and Chapter 9 of this book for more on advertisingfees and advertising in franchising.

P1: Kad0521772524c03.xml CB802/Blair 0 521 77252 4 April 29, 2005 20:0
Ro
yalt
y +
Ad
vert
isin
g R
ates
, r +
ad
v (%
of
sale
s)
Number of Franchisors
Figu
re3-
4:T
he
dist
ribu
tion
ofro
yalt
ypl
us
adve
rtis
ing
perc
enta
gera
tes,
2001
.
76

P1: Kad0521772524c03.xml CB802/Blair 0 521 77252 4 April 29, 2005 20:0
Tabl
e3-
10:
The
dist
ribu
tion
ofro
yalt
ypl
usad
vert
isin
gpe
rcen
tage
rate
sin
2001
,per
sect
or
Sect
orx
=0
0<
x≤
2%2%
<x
≤4%
4%<
x≤
6%6%
<x
≤8%
8%<
x≤
10%
10%
<x
Tota
l
Au
tom
otiv
e3
32
1324
1213
70B
usi
nes
s11
14
2631
1010
93C
ontr
acto
rs1
412
155
138
Cos
met
ic3
17
44
221
Edu
cati
on3
29
911
34Fa
stFo
od3
853
107
468
225
Hea
lth
and
Fitn
ess
34
71
722
Hom
eFu
rnis
hin
gs1
41
96
223
Hot
els
and
Mot
els
312
116
Mai
nte
nan
ce9
518
309
1283
Pers
onal
Serv
ices
63
1920
89
65R
ealE
stat
e2
710
928
Rec
reat
ion
11
36
41
16R
enta
l1
11
86
17R
esta
ura
nts
927
285
69R
etai
lFoo
d4
21
1812
31
41R
etai
lOth
er13
315
3937
93
119
Tota
l61
1655
261
366
143
7898
0
77

P1: Kad0521772524c03.xml CB802/Blair 0 521 77252 4 April 29, 2005 20:0
78 Franchise Contracts
Table 3-11: Descriptive statistics for the sum of royalty and advertisingpercentage rates, 1980 to 2001
% zors with % of zorsnon-zero # of zors at zero with
Year N % fee Mean Max at zero fixed payments
1980 875 88.2 5.7 22.5 103 261981 976 89.3 5.9 27 104 301982 1111 90.5 6.0 27 106 341983 1063 91.1 6.0 27 95 431984 797 90.3 6.3 30 77 351985 824 93.2 6.5 25.8 56 231986 954 93 6.5 27 67 241987 988 92.1 6.5 27 78 351988 942 93.1 6.8 27 65 311989 971 92.9 6.7 27 69 381990 995 93 6.7 27 70 391991 928 92.5 6.7 22 70 381992 906 92.3 6.6 23 70 341993 1007 92 6.6 25 81 451994 989 91.5 6.5 25 84 491995 982 91.6 6.5 25 82 461996 956 92.4 6.6 23 73 391997 910 92.6 6.6 20 67 351998 869 92.5 6.8 22 65 352000 855 93.2 6.8 23 58 302001 998 93.5 6.8 21 65 36
Finally, we present data on the evolution of the sum of royalty and advertis-ing rates in Table 3-11. Not surprisingly, given the data presented earlier, theproportion of franchisors in our data that use some percentage fee has risenby about five percentage points. By 2001, a full 93.5 percent of the franchisorscharge a percentage-of-sales fee to their franchisees, leaving only the same65 franchisors mentioned above with no such fee. Moreover, mostly due tothis increased participation, the sum of the average percentage fees has in-creased by a full percentage point between 1980 and 2001, from 5.8 to 6.8percent. Finally, about half of the franchisors with no percentage fee requestsome type of ongoing payment from their franchisees. The remaining fewbusiness-format franchisors – less than 4 percent of the sample – must ex-tract most of their revenues from franchise fees or, more likely, from markupson items that they sell to their franchisees just like traditional franchisors do.82
82 Of course, firms that stated in the survey that they do not collect any franchise fee, orany royalty or advertising fee, were excluded from our analyses on the basis that theseare not franchisors. See Chapter 1, Section 1.3, where we first describe our data.

P1: Kad0521772524c03.xml CB802/Blair 0 521 77252 4 April 29, 2005 20:0
3.5 Non-Monetary Contract Clauses 79
3.5 Non-Monetary Contract Clauses
Aside from the set of financial contract terms reviewed in this chapter, fran-chise contracts contain numerous clauses governing the obligations of bothparties during and after the contract period. These include statements abouthow the franchisee is expected to run the franchise, whether or not the fran-chisee has an exclusive territory, who owns or leases the property, the durationof the agreement and the circumstances under which the franchisor or fran-chisee may terminate it, when and where the franchisee may open anotherbusiness, and so on. We describe many of these contractual obligations andclauses in the remainder of this book, as they relate to the issues we focuson in each chapter. For example, we discuss in Chapter 5 how franchisorsmay use a combination of contract clauses to monitor the behavior of, andprovide incentives to, their franchisees in an effort to control the quality ofthe products and services offered by the franchisees and ensure a consistentexperience for customers. In Chapter 6, which focuses on tying, we describethe extent to which franchisors require franchisees to purchase particular in-puts directly from them or rely on approved suppliers. In our discussion ofencroachment issues, in Chapter 8, we present data on the extent to whichfranchisors grant exclusive territories to franchisees; and in Chapter 10, ontermination and non-renewals, we present data on contract length, termina-tion, transfers, and non-compete clauses.83
3.6 Some Final Thoughts and Comments
In this chapter, we have described the main monetary contract terms found infranchise contracts in the U.S. In particular, we have shown the type and levelof fees collected by franchisors, the variance of these fees, and how the feeshave evolved since 1980. Before moving on to discuss dual distribution andvertical restraints in Chapter 4, a few final points should be made in relationto these fees. First, using our data but only up to 1992, Lafontaine and Shaw(1999) have shown that while franchise fees and royalty rates vary across fran-chisors, they remain quite stable over time within franchised chains. In fact,franchisors do not systematically increase or decrease their royalty rates orfranchise fees as they become better established, whether this is measured
83 A few franchise contract clauses, such as choice of law or mandatory arbitration clauses,relate to interpretation and enforcement rather than defining the franchise relationshipitself or its economic underpinnings. Readers interested in learning more about suchcontract clauses, or about franchise law, would do well to consult a legal treatise such asGarner (2002). For an overview of laws that affect franchising in a number of differentcountries, see Zeidman (1989) and, more recently, Mendelsohn (2003).

P1: Kad0521772524c03.xml CB802/Blair 0 521 77252 4 April 29, 2005 20:0
80 Franchise Contracts
in number of years in franchising or in terms of total outlets. The ten-dency instead is to keep the fees, especially the percentage of sales fees, rel-atively constant. Thus, the uniformity in fees described earlier across fran-chisees within a chain, and across borders, also applies over time within achain.
Second, we have explored somewhat in this chapter the relationship be-tween royalty and advertising rates on the one hand, and ongoing fixed pay-ments on the other hand. Sometimes franchisors use both sales-based per-centage fees and ongoing fixed payments. But in other cases, franchisors relyon fixed payments in lieu of a percentage royalty or advertising fee, in whichcase the use of fixed payments and percentage fees is negatively correlated.The theoretical literature on franchising implies that sales-based fees and ini-tial franchise fees should be negatively correlated everything else being thesame and, in particular, if the value of the franchise is held constant. Afterall, if a franchisee is asked to pay more in initial fees, this must be made upby a reduction in ongoing payments later on and vice versa. Empirically, thisnegative relationship has been quite elusive. For example, Lafontaine (1992a)and Sen (1993) found no negative relationship between the sum of royalty andadvertising rates and the initial franchise fee for the sets of U.S. franchisorsthey studied, even after controlling for variables that proxy the value of thefranchise. More recently, Kaufmann and Dant (2001) even find a positiverelationship between royalty rates and franchise fees after controlling for unitsales. One could argue that the lack of observed negative relationship arisesfrom differences in contract terms that affect both fees in similar ways and arenot controlled for in these analyses. Along these lines, Sen (1993) finds thatboth fees decline if the franchisor imposes input purchase requirements on itsfranchisees, a requirement that allows the franchisor to collect markup dollarsfrom their franchisees as discussed earlier. Any correlation analysis for roy-alty rates and franchise fees that would not account for such a clause mightyield a positive or zero correlation simply because differences in the inputpurchase requirements make franchisors adjust both fees similarly. If firmsdo not modify their other contracting practices frequently, however, one canaccount for them possibly by examining the relationship between changes inthe fees of individual chains over time. Lafontaine and Shaw (1999) performthis type of test and again find no relationship between total percentage feesand initial franchise fees. Of course, it may be that not all relevant factors areheld constant in these analyses either. At this point, however, the empiricalevidence suggests that franchise fees are set quite independently from sales-based fees. The absence of a negative relationship between the two types offees implies that the franchise fee may not be set at a level to extract all of

P1: Kad0521772524c03.xml CB802/Blair 0 521 77252 4 April 29, 2005 20:0
3.6 Some Final Thoughts and Comments 81
the economic rent that franchisees earn.84 This would occur, for example, iffranchisors mostly set their initial franchise fee to compensate for the coststhey incur in setting up the outlet, as Bond (2001) suggests they do.
Finally, although fewer data are available on contract terms used by non-U.S. franchisors, studies of franchise practices outside the U.S. suggest that thebasic types of fees, the extent to which they are used, and their levels are fairlysimilar to those described here for the U.S. Canadian franchisors includedin our data, for example, use the same types of fees and set them at levelsthat are quite similar to those chosen by U.S. franchisors. Penard, Raynaudand Saussier (2003) examined the fees used by more than 200 franchisors inFrance, and found that most of them also use percentage of sales royaltiesand initial franchise fees, though the latter appear to be slightly lower inFrance.85 Frazer (1998) shows that while the same types and levels of fees areused by franchisors in Australia, there is a greater reliance on ongoing fixedpayments as 17 percent of the firms in her sample of 262 franchisors rely onsuch payments compared to just 7 percent of franchisors doing the same inour data. Finally, Seaton’s (2003) data show that the fees of 161 franchisorsin the UK in 1998 are very similar on average, and follow the same generaldistribution, as the ones found here for U.S. and Canadian franchisors.86
Moreover, the conclusions about the lack of correlation between the fees andtheir stability over time also apply to non-U.S. franchisors. Specifically, Gagneet al. (1998) establish a lack of negative correlation in fees for franchisorsoperating in Quebec, Canada, while Seaton’s (2003) analyses indicate thatthe fees used by franchisors in the UK also are not negatively correlated anddo not change much over time either.
84 See Kaufmann and Lafontaine (1994) and Michael and Moore (1995) for evidence thatfranchisees earn economic profit at least in some franchised systems and for discus-sion of the reasons why franchisors many choose to leave profit with their franchisees.Lafontaine and Raynaud (2002) argue that downstream profit (combined with moni-toring and termination rights) and residual claims are complementary incentive mech-anisms in franchised chains, i.e., they are used to reinforce one another.
85 The authors do not mention advertising fees, but a report from the Federation Francaisede la Franchise (French Federation of Franchising) (2003) contains data on such fees.
86 Many other descriptive studies also have found similar fees in other countries.

P1: KSF0521772524c04.xml CB802/Blair 0 521 77252 4 April 29, 2005 18:49
4
Franchising, Vertical Integration, andVertical Restraints
4.1 Introduction
This chapter covers a lot of ground, focusing as it does on the relationshipsamong franchising, vertical integration, and various types of vertical restraintsin both theory and practice. We begin with a description of the extent of com-pany ownership in franchised chains. The vast majority of franchised firmsoperate at least some of their units themselves while franchising the rest. Thus,they choose some degree of vertical integration and then use contractual de-vices to organize the other units in the chain. There is considerable variationacross franchised chains in the extent of company ownership, which in it-self is worth exploring. In fact, why firms choose different proportions ofcompany-owned units is a question that has received significant attention inthe empirical literature on franchising.
Next, we describe a set of vertical restraints, many of which appear in fran-chise contracts. We show how, in combination or individually, these verticalrestraints in theory allow franchisors to achieve the same results as verticalintegration would permit. In particular, we examine the use of simple lump-sum fees, sales royalties, output royalties, input purchase requirements, resaleprice controls, and output quotas. We introduce these here, and then returnto many of them in later chapters as we explore the sources of conflict be-tween franchisors and franchisees. Finally, in the last section of this chapter,we review agency-theoretic arguments that have been used to explain varia-tion in royalty rates across franchised chains. We then return to the issue ofwhy firms use different proportions of company-owned and franchised unitsand show how the same arguments used to explain royalty rate variation canyield insights into why the extent of vertical integration also varies acrossfranchised chains.
82

P1: KSF0521772524c04.xml CB802/Blair 0 521 77252 4 April 29, 2005 18:49
4.2 Dual Distribution or Partial Vertical Integration 83
4.2 Dual Distribution or Partial Vertical Integration in Franchising
Firms involved in franchising typically engage in dual distribution, i.e., theyoperate some units directly and franchise the rest. For example, at the end of2001, McDonald’s had 30,093 restaurants worldwide. Some 8,378, or almost28 percent of them, were company-owned and operated. The majority offranchisors, however, operate a smaller proportion of their outlets directly.In this section, we explore systematically the extent of dual distribution infranchising in the United States. We begin with the 1986 census-type datafrom the USDOC as it includes information on sales and employment levelsthat cannot be replicated today. We then move on to describe the currentextent of dual distribution according to our data.
4.2.1 The Extent of Dual Distribution: 1986 and Now
Table 4-1 shows how total sales, establishments, and employees were dis-tributed between company-owned and franchised units across sectors in 1986according to the USDOC. Table 4-2 further shows average sales and numberof employees per establishment, as well as sales per employee, for company-owned and franchised units in the various sectors. These tables establish that(1) the majority of the activity in franchised chains, or about 75 percentof sales, takes place in franchised outlets; (2) company-owned units achievehigher per unit sales, on average, than franchised units in almost all of thebusiness-format franchising sectors defined by the USDOC; (3) the averagenumber of employees is also larger in company-owned units than in fran-chised units; and (4) sales per employee, which can be interpreted as a measureof labor productivity, are not systematically greater in one type of unit or theother.
In Table 4-3, we explore how the average number of company-owned andfranchised units per chain has changed since 1980, both in the USDOC andour data.
This table shows again that the average size of the franchised chains includedin our data set has increased especially during the early 1980s and then againin the late 1990s. The latter growth in part reflects the increased internationalexpansion of the chains in our data, as we find that the proportion of non-U.S.to total outlets has grown from 20 percent in 1993 to 28 percent by 2001.In the early 1980s, we find growth in our data, but not in the USDOC data.Assuming that the average size of franchised chains did not change during theearly 1980s (as per the USDOC), the growth in our sample must be due to an
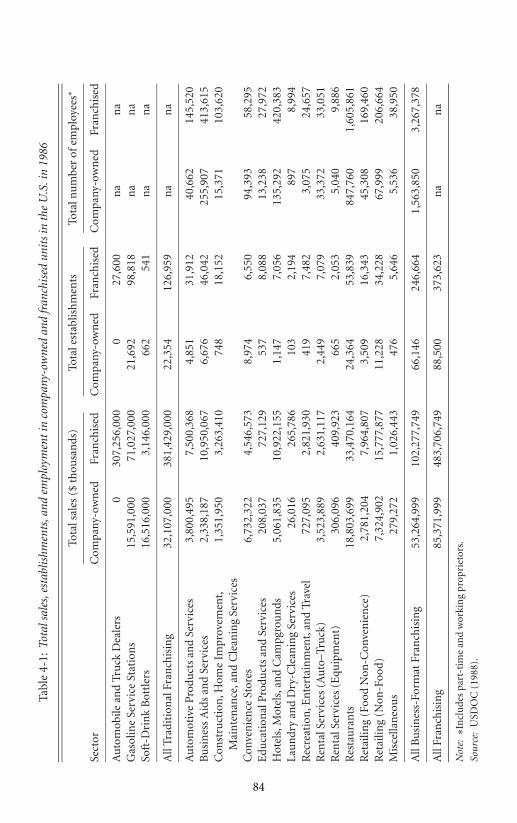
P1: KSF0521772524c04.xml CB802/Blair 0 521 77252 4 April 29, 2005 18:49
Tabl
e4-
1:To
tals
ales
,est
ablis
hmen
ts,a
ndem
ploy
men
tin
com
pany
-ow
ned
and
fran
chis
edun
its
inth
eU
.S.i
n19
86
Tota
lsal
es($
thou
san
ds)
Tota
lest
ablis
hm
ents
Tota
lnu
mbe
rof
empl
oyee
s∗
Sect
orC
ompa
ny-o
wn
edFr
anch
ised
Com
pany
-ow
ned
Fran
chis
edC
ompa
ny-o
wn
edFr
anch
ised
Au
tom
obile
and
Tru
ckD
eale
rs0
307,
256,
000
027
,600
na
na
Gas
olin
eSe
rvic
eSt
atio
ns
15,5
91,0
0071
,027
,000
21,6
9298
,818
na
na
Soft
-Dri
nk
Bot
tler
s16
,516
,000
3,14
6,00
066
254
1n
an
a
All
Trad
itio
nal
Fran
chis
ing
32,1
07,0
0038
1,42
9,00
022
,354
126,
959
na
na
Au
tom
otiv
eP
rodu
cts
and
Serv
ices
3,80
0,49
57,
500,
368
4,85
131
,912
40,6
6214
5,52
0B
usi
nes
sA
ids
and
Serv
ices
2,33
8,18
710
,950
,067
6,67
646
,042
255,
907
413,
615
Con
stru
ctio
n,H
ome
Impr
ovem
ent,
1,35
1,95
03,
263,
410
748
18,1
5215
,371
103,
620
Mai
nte
nan
ce,a
nd
Cle
anin
gSe
rvic
esC
onve
nie
nce
Stor
es6,
732,
322
4,54
6,57
38,
974
6,55
094
,393
58,2
95E
duca
tion
alP
rodu
cts
and
Serv
ices
208,
037
727,
129
537
8,08
813
,238
27,9
72H
otel
s,M
otel
s,an
dC
ampg
rou
nds
5,06
1,83
510
,922
,155
1,14
77,
056
135,
292
420,
383
Lau
ndr
yan
dD
ry-C
lean
ing
Serv
ices
26,0
1626
5,78
610
32,
194
897
8,99
4R
ecre
atio
n,E
nte
rtai
nm
ent,
and
Trav
el72
7,09
52,
821,
930
419
7,48
23,
075
24,6
57R
enta
lSer
vice
s(A
uto
–Tru
ck)
3,52
3,88
92,
631,
117
2,44
97,
079
33,3
7233
,051
Ren
talS
ervi
ces
(Equ
ipm
ent)
306,
096
409,
923
665
2,05
35,
040
9,88
6R
esta
ura
nts
18,8
03,6
9933
,470
,164
24,3
6453
,839
847,
760
1,60
5,86
1R
etai
ling
(Foo
dN
on-C
onve
nie
nce
)2,
781,
204
7,96
4,80
73,
509
16,3
4345
,308
169,
460
Ret
ailin
g(N
on-F
ood)
7,32
4,90
215
,777
,877
11,2
2834
,228
67,9
9920
6,66
4M
isce
llan
eou
s27
9,27
21,
026,
443
476
5,64
65,
536
38,9
50
All
Bu
sin
ess-
Form
atFr
anch
isin
g53
,264
,999
102,
277,
749
66,1
4624
6,66
41,
563,
850
3,26
7,37
8
All
Fran
chis
ing
85,3
71,9
9948
3,70
6,74
988
,500
373,
623
na
na
Not
e:∗In
clu
des
part
-tim
ean
dw
orki
ng
prop
riet
ors.
Sour
ce:
USD
OC
(198
8).
84
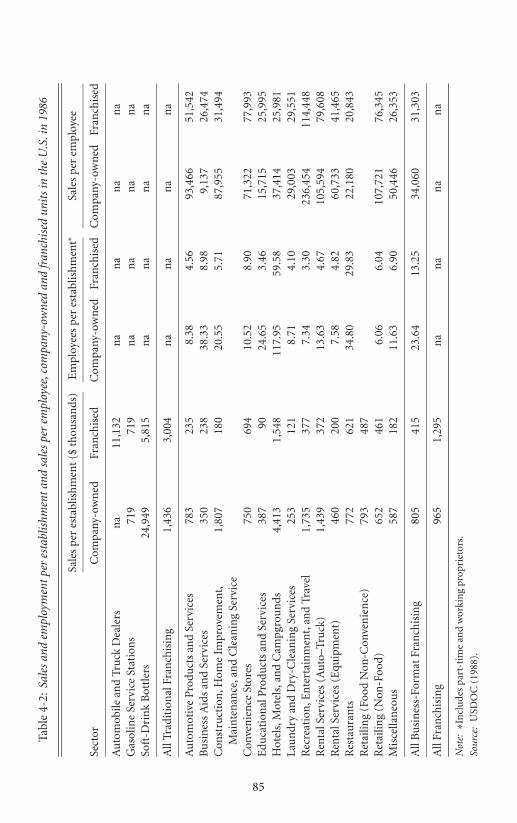
P1: KSF0521772524c04.xml CB802/Blair 0 521 77252 4 April 29, 2005 18:49
Tabl
e4-
2:Sa
les
and
empl
oym
entp
eres
tabl
ishm
enta
ndsa
les
per
empl
oyee
,com
pany
-ow
ned
and
fran
chis
edun
its
inth
eU
.S.i
n19
86
Sale
spe
res
tabl
ish
men
t($
thou
san
ds)
Em
ploy
ees
per
esta
blis
hm
ent∗
Sale
spe
rem
ploy
ee
Sect
orC
ompa
ny-o
wn
edFr
anch
ised
Com
pany
-ow
ned
Fran
chis
edC
ompa
ny-o
wn
edFr
anch
ised
Au
tom
obile
and
Tru
ckD
eale
rsn
a11
,132
na
na
na
na
Gas
olin
eSe
rvic
eSt
atio
ns
719
719
na
na
na
na
Soft
-Dri
nk
Bot
tler
s24
,949
5,81
5n
an
an
an
a
All
Trad
itio
nal
Fran
chis
ing
1,43
63,
004
na
na
na
na
Au
tom
otiv
eP
rodu
cts
and
Serv
ices
783
235
8.38
4.56
93,4
6651
,542
Bu
sin
ess
Aid
san
dSe
rvic
es35
023
838
.33
8.98
9,13
726
,474
Con
stru
ctio
n,H
ome
Impr
ovem
ent,
1,80
718
020
.55
5.71
87,9
5531
,494
Mai
nte
nan
ce,a
nd
Cle
anin
gSe
rvic
eC
onve
nie
nce
Stor
es75
069
410
.52
8.90
71,3
2277
,993
Edu
cati
onal
Pro
duct
san
dSe
rvic
es38
790
24.6
53.
4615
,715
25,9
95H
otel
s,M
otel
s,an
dC
ampg
rou
nds
4,41
31,
548
117.
9559
.58
37,4
1425
,981
Lau
ndr
yan
dD
ry-C
lean
ing
Serv
ices
253
121
8.71
4.10
29,0
0329
,551
Rec
reat
ion
,En
tert
ain
men
t,an
dTr
avel
1,73
537
77.
343.
3023
6,45
411
4,44
8R
enta
lSer
vice
s(A
uto
–Tru
ck)
1,43
937
213
.63
4.67
105,
594
79,6
08R
enta
lSer
vice
s(E
quip
men
t)46
020
07.
584.
8260
,733
41,4
65R
esta
ura
nts
772
621
34.8
029
.83
22,1
8020
,843
Ret
ailin
g(F
ood
Non
-Con
ven
ien
ce)
793
487
Ret
ailin
g(N
on-F
ood)
652
461
6.06
6.04
107,
721
76,3
45M
isce
llan
eou
s58
718
211
.63
6.90
50,4
4626
,353
All
Bu
sin
ess-
Form
atFr
anch
isin
g80
541
523
.64
13.2
534
,060
31,3
03
All
Fran
chis
ing
965
1,29
5n
an
an
an
a
Not
e:∗In
clu
des
part
-tim
ean
dw
orki
ng
prop
riet
ors.
Sour
ce:
USD
OC
(198
8).
85
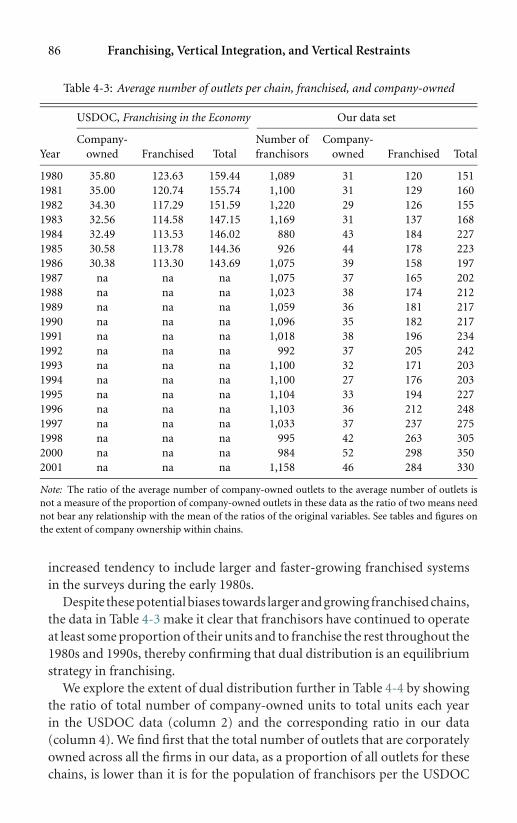
P1: KSF0521772524c04.xml CB802/Blair 0 521 77252 4 April 29, 2005 18:49
86 Franchising, Vertical Integration, and Vertical Restraints
Table 4-3: Average number of outlets per chain, franchised, and company-owned
USDOC, Franchising in the Economy Our data set
Company- Number of Company-Year owned Franchised Total franchisors owned Franchised Total
1980 35.80 123.63 159.44 1,089 31 120 1511981 35.00 120.74 155.74 1,100 31 129 1601982 34.30 117.29 151.59 1,220 29 126 1551983 32.56 114.58 147.15 1,169 31 137 1681984 32.49 113.53 146.02 880 43 184 2271985 30.58 113.78 144.36 926 44 178 2231986 30.38 113.30 143.69 1,075 39 158 1971987 na na na 1,075 37 165 2021988 na na na 1,023 38 174 2121989 na na na 1,059 36 181 2171990 na na na 1,096 35 182 2171991 na na na 1,018 38 196 2341992 na na na 992 37 205 2421993 na na na 1,100 32 171 2031994 na na na 1,100 27 176 2031995 na na na 1,104 33 194 2271996 na na na 1,103 36 212 2481997 na na na 1,033 37 237 2751998 na na na 995 42 263 3052000 na na na 984 52 298 3502001 na na na 1,158 46 284 330
Note: The ratio of the average number of company-owned outlets to the average number of outlets isnot a measure of the proportion of company-owned outlets in these data as the ratio of two means neednot bear any relationship with the mean of the ratios of the original variables. See tables and figures onthe extent of company ownership within chains.
increased tendency to include larger and faster-growing franchised systemsin the surveys during the early 1980s.
Despite these potential biases towards larger and growing franchised chains,the data in Table 4-3 make it clear that franchisors have continued to operateat least some proportion of their units and to franchise the rest throughout the1980s and 1990s, thereby confirming that dual distribution is an equilibriumstrategy in franchising.
We explore the extent of dual distribution further in Table 4-4 by showingthe ratio of total number of company-owned units to total units each yearin the USDOC data (column 2) and the corresponding ratio in our data(column 4). We find first that the total number of outlets that are corporatelyowned across all the firms in our data, as a proportion of all outlets for thesechains, is lower than it is for the population of franchisors per the USDOC

P1: KSF0521772524c04.xml CB802/Blair 0 521 77252 4 April 29, 2005 18:49
4.2 Dual Distribution or Partial Vertical Integration 87
data for all the years when the two data sets overlap. The difference in theratios, however, is quite small, only one to two percentage points.
In column 5 of Table 4-4, we show the average proportion of company-owned units in the set of firms included in our data. If all the chains in thedata operated about the same proportion of outlets corporately, the ratioin column 4 and the mean proportion of company outlets across chains incolumn 5 would be about the same.87 The fact that the mean proportion incolumn 5 is systematically larger than the ratio in column 4 implies that largerfranchisors on average have a lower proportion of company units than dosmaller franchisors. We argue below that this is because many small (or young)franchisors are still in their adjustment phase after starting to franchise. Thatadjustment phase necessarily begins at 100-percent company-owned at thetime they start franchising. This proportion decreases dramatically as newoutlets are added under a franchise mode of operation, but remains relativelyhigh until they become established.88
For now, going back to the data in Table 4-4, we note that, on average, firmsin our data operated about 23 percent of their units directly throughout the1980s. This proportion decreased, however, during the 1990s so that by 2001,the average franchisor in our data operated only 16 to 17 percent of its outletsdirectly. It is not possible to tell whether this decrease is due to changes in thecomposition of the sample over time, or whether it reflects real changes in theextent of company ownership by firms involved in franchising. We addressthis further below.
The extent of company ownership varies considerably across franchisedcompanies, with the proportion of company-owned units ranging from 0 to100 percent every year in our data (see Table 4-4, where a positive number offranchisors appears each year in the last two columns). Figure 4-1 illustratesthe full cross-firm variation in the proportion of company-owned outlets forthe chains in our data in 2001.
In addition to confirming the heterogeneity in the choices that firmsmake with respect to their proportion of company-owned units, Fig-ure 4-1 establishes that most franchising firms directly operate only a small
87 The difference between the figures shown in columns 4 and 5 arises because a ratioof means generally is different from a mean of ratios. Specifically, in column 5, eachfranchisor is given the same weight regardless of its total number of outlets, whereasin column 4, franchised units are all given the same weight, regardless of whether theybelong to a large or a small franchised chain.
88 The reduction in the average proportion of company-owned units over time in oursample of franchisors (see column 5) is driven largely by a reduction in the number offully corporate chains in the sample, from over 50 in the early years to only about 20 inthe last few years of the data (see last column).
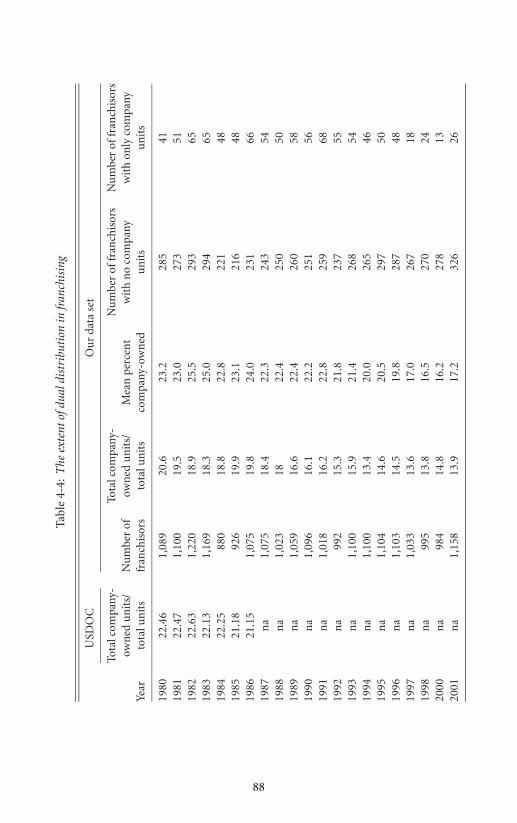
P1: KSF0521772524c04.xml CB802/Blair 0 521 77252 4 April 29, 2005 18:49
Tabl
e4-
4:T
heex
tent
ofdu
aldi
stri
buti
onin
fran
chis
ing
USD
OC
Ou
rda
tase
t
Tota
lcom
pany
-To
talc
ompa
ny-
Nu
mbe
rof
fran
chis
ors
Nu
mbe
rof
fran
chis
ors
own
edu
nit
s/N
um
ber
ofow
ned
un
its/
Mea
npe
rcen
tw
ith
no
com
pany
wit
hon
lyco
mpa
nyYe
arto
talu
nit
sfr
anch
isor
sto
talu
nit
sco
mpa
ny-o
wn
edu
nit
su
nit
s
1980
22.4
61,
089
20.6
23.2
285
4119
8122
.47
1,10
019
.523
.027
351
1982
22.6
31,
220
18.9
25.5
293
6519
8322
.13
1,16
918
.325
.029
465
1984
22.2
588
018
.822
.822
148
1985
21.1
892
619
.923
.121
648
1986
21.1
51,
075
19.8
24.0
231
6619
87n
a1,
075
18.4
22.3
243
5419
88n
a1,
023
1822
.425
050
1989
na
1,05
916
.622
.426
058
1990
na
1,09
616
.122
.225
156
1991
na
1,01
816
.222
.825
968
1992
na
992
15.3
21.8
237
5519
93n
a1,
100
15.9
21.4
268
5419
94n
a1,
100
13.4
20.0
265
4619
95n
a1,
104
14.6
20.5
297
5019
96n
a1,
103
14.5
19.8
287
4819
97n
a1,
033
13.6
17.0
267
1819
98n
a99
513
.816
.527
024
2000
na
984
14.8
16.2
278
1320
01n
a1,
158
13.9
17.2
326
26
88
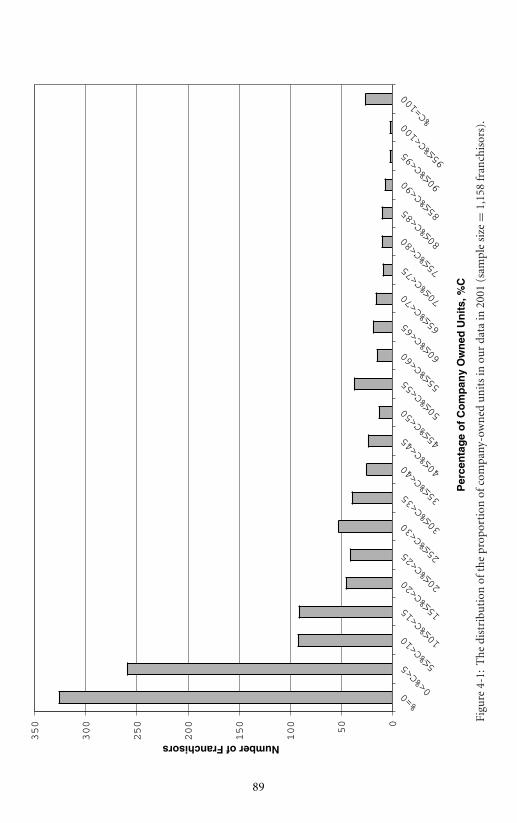
P1: KSF0521772524c04.xml CB802/Blair 0 521 77252 4 April 29, 2005 18:49
Per
cen
tag
e o
f C
om
pan
y O
wn
ed U
nit
s, %
C
Number of Franchisors
Figu
re4-
1:T
he
dist
ribu
tion
ofth
epr
opor
tion
ofco
mpa
ny-o
wn
edu
nit
sin
our
data
in20
01(s
ampl
esi
ze=
1,15
8fr
anch
isor
s).
89
P1: KSF0521772524c04.xml CB802/Blair 0 521 77252 4 April 29, 2005 18:49
90 Franchising, Vertical Integration, and Vertical Restraints
proportion of their outlets, i.e., the distribution is quite skewed to the left.In fact, 28 percent of franchisors (326 out of 1,158) choose to own and op-erate no units. From Table 4-4, we see that the proportion of firms with nocompany units (column 6) has remained fairly stable, at 25 to 28 percent ofthe sample of franchisors, implying that a substantial number of franchisorsmake a conscious decision to operate no unit corporately. At the other ex-treme, Figure 4-1 also shows that a number of franchisors operate more thanhalf of the units in their chain. In most cases, the chains that are at or close to100-percent company-owned tend to be those that are just becoming involvedin franchising and thus are still in their adjustment phase. We now explorethis issue in more detail.
4.2.2 The Dynamics of Dual Distribution
Using a subset of our data on U.S. franchisors over the 1980 to 1997 period,Lafontaine and Shaw (2005) explored in some detail how the extent of com-pany ownership varies not only between firms, but also over time within fran-chised chains. They have shown that in the first seven years in franchising,firms indeed reduce their proportion of company-owned units significantly.But they note that this effect of increased experience in franchising is simply anartifact: franchised chains almost all begin with one or two company-ownedpilots, so they are 100-percent company-owned chains when they start fran-chising. As they open new franchised units, this proportion can only go down.It is this decrease in the early years in franchising for each chain that leadsto the lower proportion of company outlets for mature or large franchisedchains compared to new and small ones that we noted above. In other words,in a cross-section of franchisors of varying ages, there will be a tendency tofind a systematic reduction in the proportion of company outlets as firmsbecome established simply because newcomers to franchising are necessarilysmall chains of mostly corporate stores.
After the initial seven or so years of adjustment, however, the authors showthat the proportion of company-owned units stabilizes at about 15 percenton average. Moreover, the proportion of company units becomes quite stablewithin individual franchised networks after this period: Lafontaine and Shawshow that franchisors open or close both company and franchised outletsin a way that maintains a stable mix. As the authors point out, a number offranchisors also publicly announce what they consider the optimal proportionof company-owned outlets in their chains to be, or answer inquiries abouttheir targets in surveys.89
89 See, for example, Ozanne and Hunt (1971) and Lafontaine and Kaufmann (1994).
P1: KSF0521772524c04.xml CB802/Blair 0 521 77252 4 April 29, 2005 18:49
4.2 Dual Distribution or Partial Vertical Integration 91
Lafontaine and Shaw (2005) conclude that franchisors actively managetheir portfolio of outlets with the goal of maintaining their target mix. Forthe majority of franchisors, the targets are neither zero nor 100 percent, con-firming that dual distribution truly is an equilibrium strategy in franchising.90
However, the targeted levels of company ownership vary tremendously acrossfranchised chains. We illustrate this variation in Figure 4-2, where we show theproportion of company-owned outlets of each franchisor in our data that hasbeen franchising for eight years or more. Each of the franchisors is countedonly once in the figure: we take their proportion of company units in the lastyear they appear in the data, making sure that this last year is at least theireighth year in franchising. A total of 1,967 different franchisors are therebyincluded in Figure 4-2.
This figure confirms the large variation in the proportion of company unitsthat franchisors target. The proportion of franchisors that have a strategy ofoperating no unit directly in the long term is about the same, at 28 percent,as in Figure 4-1. But only a few firms now are found in the fully company-owned category: most likely these are firms that never succeeded in becominginvolved in franchising despite appearing in the surveys we use as our sourceof data. Finally, the distribution shown in Figure 4-2 is skewed to the left to agreater extent than is the distribution shown in Figure 4-1. Thus, franchisorstend to operate an even smaller proportion of their outlets directly in thelong term. Specifically, more than 70 percent of the franchisors in Figure 4-2operate less than 20 percent of their outlets directly, and less than 5 percentof them operate three quarters or more of their outlets directly.
Table 4-5 shows the sectoral variation in the stable proportion of company-owned outlets. Again this table is constructed using the proportion of com-pany units of each franchisor in the last year in which they appear in ourdata if, and only if, this last year represents at least their eighth year infranchising.
Table 4-5 makes it clear that there is cross-sector variation in the extentof company ownership. Franchisors in the Hotels and Motels and in theMaintenance sectors, for example, are more likely to have no companyunits at all, while those in the sit-down Restaurant sector are more likely tohave an above average proportion of company units. But the table mostlyindicates that there is still much variation in the stable proportion ofcompany units within sectors. This is consistent with Lafontaine and Shaw(2005) who found that sectoral differences explained some of the variationin the stable proportions of company units in established chains, but thatvariation in the value of the brand was an important factor affecting this
90 See also Scott (1995) and Bradach (1998) on the value of dual distribution in franchising.
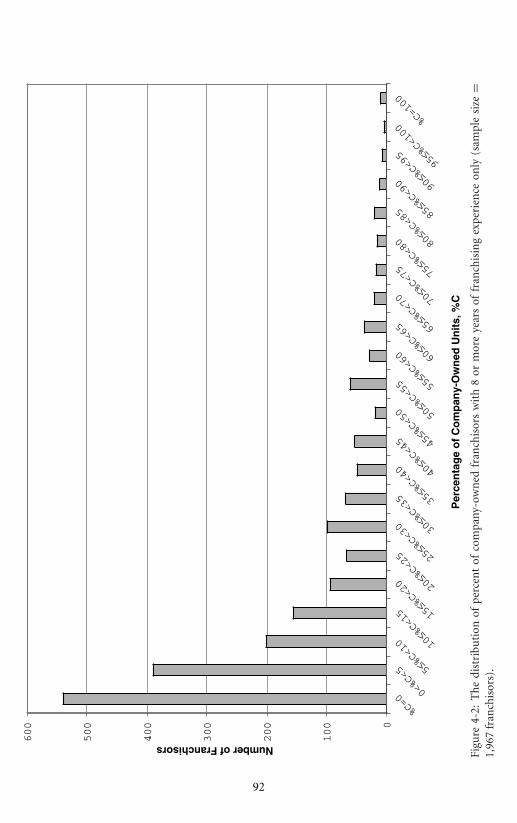
P1: KSF0521772524c04.xml CB802/Blair 0 521 77252 4 April 29, 2005 18:49
Per
cen
tag
e o
f C
om
pan
y-O
wn
ed U
nit
s, %
C
Number of Franchisors
Figu
re4-
2:T
he
dist
ribu
tion
ofp
erce
nt
ofco
mpa
ny-o
wn
edfr
anch
isor
sw
ith
8or
mor
eye
ars
offr
anch
isin
gex
peri
ence
only
(sam
ple
size
=1,
967
fran
chis
ors)
.
92
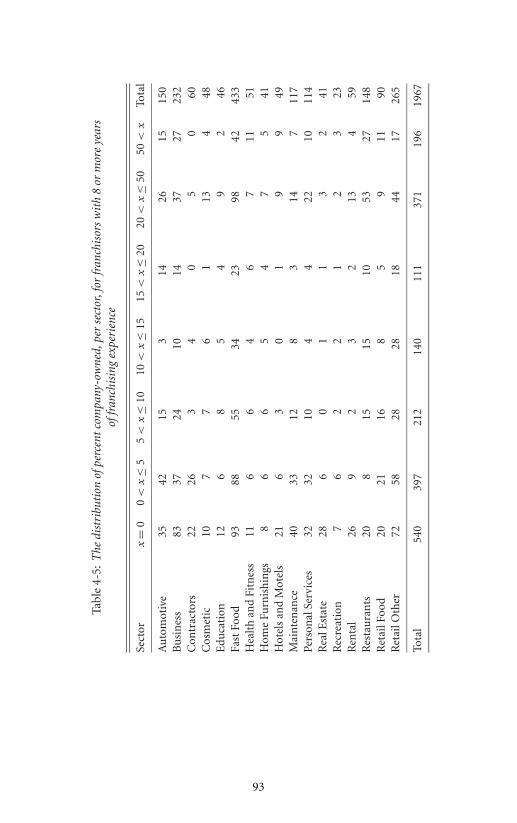
P1: KSF0521772524c04.xml CB802/Blair 0 521 77252 4 April 29, 2005 18:49
Tabl
e4-
5:T
hedi
stri
buti
onof
perc
entc
ompa
ny-o
wne
d,pe
rse
ctor
,for
fran
chis
ors
wit
h8
orm
ore
year
sof
fran
chis
ing
expe
rien
ce
Sect
orx
=0
0<
x≤
55
<x
≤10
10<
x≤
1515
<x
≤20
20<
x≤
5050
<x
Tota
l
Au
tom
otiv
e35
4215
314
2615
150
Bu
sin
ess
8337
2410
1437
2723
2C
ontr
acto
rs22
263
40
50
60C
osm
etic
107
76
113
448
Edu
cati
on12
68
54
92
46Fa
stFo
od93
8855
3423
9842
433
Hea
lth
and
Fitn
ess
116
64
67
1151
Hom
eFu
rnis
hin
gs8
66
54
75
41H
otel
san
dM
otel
s21
63
01
99
49M
ain
ten
ance
4033
128
314
711
7Pe
rson
alSe
rvic
es32
3210
44
2210
114
Rea
lEst
ate
286
01
13
241
Rec
reat
ion
76
22
12
323
Ren
tal
269
23
213
459
Res
tau
ran
ts20
815
1510
5327
148
Ret
ailF
ood
2021
168
59
1190
Ret
ailO
ther
7258
2828
1844
1726
5
Tota
l54
039
721
214
011
137
119
619
67
93
P1: KSF0521772524c04.xml CB802/Blair 0 521 77252 4 April 29, 2005 18:49
94 Franchising, Vertical Integration, and Vertical Restraints
target both within and across sectors. They conclude that “franchisors withhigh trade-name value target high rates of company ownership [ . . . ] both interms of controlling franchisee free-riding and in terms of franchisor incen-tives, one expects higher rates of company ownership in franchised systemswith more valuable brands. The evidence we present supports this implicationfrom the theories.”
4.3 Contractual Equivalents
In this section, we consider various vertical restraints that may allow upstreamfirms (i.e., franchisors) to emulate the vertically integrated outcome (i.e.,company ownership) without in fact resorting to vertical integration.91 Webegin by describing outcomes under the vertical integration benchmark andthen move on to examine the effect of lump-sum franchise fees, royaltieson sales, output royalties, tying, resale price controls, and, finally, outputquotas on the decisions made by franchisees. In many instances we model therelationship for a single franchisor–franchisee pair, but the analysis appliessimilarly if the franchisor imposes these vertical controls to all the units inthe franchised system.
4.3.1 Vertical Integration
If an upstream firm decided to distribute as well as produce its product, orown all its outlets, it would be fully vertically integrated. Its performance as avertically integrated firm provides a useful benchmark against which variouscontractual arrangements can be measured as suitable alternatives. Accord-ingly, we first examine the profit potential under full vertical integration.
Because the vertically integrated firm both produces and distributes itsproduct, we can write its profit function in a given downstream market as
� = P Q − (MCP + MCR)Q,
where price and quantity sold in this market are P and Q, respectively, marginal(and average) cost of production is MCP, and the marginal (and average) costof retailing is MCR.92 The first-order condition for a maximum is familiar:
d�/d Q = P + Q d P/d Q − MCP − MCR = 0,
91 Much of this section is based on Blair and Kaserman (1983). More algebraic detail andformal proofs can be found there.
92 Throughout, we use � to refer to franchisor or franchised system profit, and π to referto franchisee profit.

P1: KSF0521772524c04.xml CB802/Blair 0 521 77252 4 April 29, 2005 18:49
4.3 Contractual Equivalents 95
Figure 4-3: The vertically integrated outcome.
which implies that marginal revenue should equal the sum of the marginalcost of production and distribution. This solution is shown in Figure 4-3 forthe simple case of linear demand and constant marginal cost.93
The optimal price and quantity are shown as P ∗ and Q∗, respectively. Wecan see that at Q∗ marginal revenue (MR) equals the sum of the marginalcosts of production and retailing. Under the assumed conditions, the verticallyintegrated firm is earning the maximum profits that can be squeezed out ofthis market:
�∗ = (P ∗ − C ∗)Q ∗,
where C ∗ represents the sum of the MCP and MCR. This solution provides abenchmark against which we can assess the efficacy of the various contractualequivalents considered below.
4.3.2 Lump-Sum Franchise Fees
In principle, an upstream firm could extract all the profit from a verticallyseparated retailer or franchisee through a franchise contract that requiredthe payment of a lump-sum franchise fee equal to the profit inherent in
93 We make the assumption that demand is linear and marginal cost is constant to simplifyall the graphs in this section, but the results discussed generally hold for well-behaveddemand and cost functions.
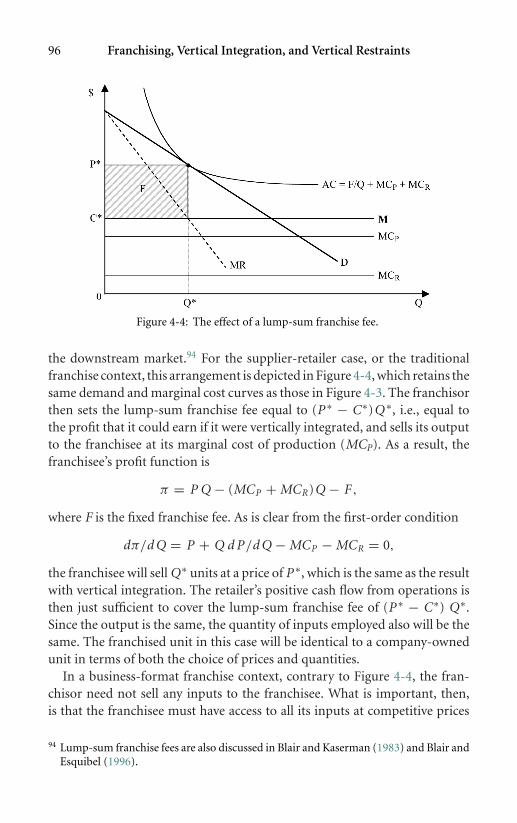
P1: KSF0521772524c04.xml CB802/Blair 0 521 77252 4 April 29, 2005 18:49
96 Franchising, Vertical Integration, and Vertical Restraints
Figure 4-4: The effect of a lump-sum franchise fee.
the downstream market.94 For the supplier-retailer case, or the traditionalfranchise context, this arrangement is depicted in Figure 4-4, which retains thesame demand and marginal cost curves as those in Figure 4-3. The franchisorthen sets the lump-sum franchise fee equal to (P ∗ − C∗)Q ∗, i.e., equal tothe profit that it could earn if it were vertically integrated, and sells its outputto the franchisee at its marginal cost of production (MCP). As a result, thefranchisee’s profit function is
π = P Q − (MCP + MCR)Q − F ,
where F is the fixed franchise fee. As is clear from the first-order condition
dπ/d Q = P + Q d P/d Q − MCP − MCR = 0,
the franchisee will sell Q∗ units at a price of P ∗, which is the same as the resultwith vertical integration. The retailer’s positive cash flow from operations isthen just sufficient to cover the lump-sum franchise fee of (P ∗ − C∗) Q∗.Since the output is the same, the quantity of inputs employed also will be thesame. The franchised unit in this case will be identical to a company-ownedunit in terms of both the choice of prices and quantities.
In a business-format franchise context, contrary to Figure 4-4, the fran-chisor need not sell any inputs to the franchisee. What is important, then,is that the franchisee must have access to all its inputs at competitive prices
94 Lump-sum franchise fees are also discussed in Blair and Kaserman (1983) and Blair andEsquibel (1996).
P1: KSF0521772524c04.xml CB802/Blair 0 521 77252 4 April 29, 2005 18:49
4.3 Contractual Equivalents 97
regardless of who supplies them. The franchisor can then request the pay-ment of a lump-sum fee equal to the franchisee’s maximum profits, which, ifall inputs are purchased at competitive prices, will again equal the verticallyintegrated level of profits.
From the upstream firm’s perspective, a franchise contract involving alump-sum fee thus is economically equivalent to vertical integration: price,quantity, and producer profit are all the same. The franchisee, however, earnsonly a normal return on its investment. The franchisor achieves this resultby committing to sell its product to the franchisee at marginal cost (MCP) inFigure 4-4. If the franchisor is not the supplier, as in a business-format fran-chise, the franchisor must ensure, as noted above, that the franchisee can buyall of its inputs at competitive prices.95 Then, if there is a competitive supplyof potential franchisees, competition among potential franchisees will bid upits “price,” or franchise fee, to the present value of the future profit stream ofthe franchise. In other words, franchisees will pay in advance to obtain thefranchise license and the profit stream that the franchise will generate overits lifetime. This fee will leave a competitive return for the franchisee’s capitaland effort, a return that is necessary over the life of the franchise contractfor the franchisee to be willing to perform the distribution function. Graph-ically, in Figure 4-4, we can see that the lump-sum fee causes the winningfranchisee’s average total cost curve to be the rectangular hyperbola AC and,thus, economic profits to be zero.
In practice, however, the franchisor faces several problems in using thefranchise fee as its sole means of compensation. First, most potential fran-chisees are wealth constrained and cannot pay the full present value of thefuture profit flow in advance.96 As a result, the franchisor may not be able toextract all of the profit with this type of contract. For example, Kaufmannand Lafontaine (1994) have estimated, based on 1982 figures, that the presentvalue of the profits of a McDonald’s franchise over the duration of the contractwas between $300,000 and $450,000, while the franchise fee was only $12,500at the time. The authors argued that franchisee capital constraints explain atleast part of this discrepancy. Klein (1995: 29) posits instead that “contract
95 This can be difficult under some circumstances. Suppose, for example, that the fran-chisor has a recipe for its special sauce. If it can only license one or two firms to producethe sauce for its franchisees, it must make sure that the licensees do not overchargethe franchisees because such overcharges would reduce franchisee, and thus franchisor,profit.
96 Of course, franchisees could borrow from third parties, and many do. This raises someselection and incentive issues as the franchisee may default on this loan. We examineincentive issues further below.

P1: KSF0521772524c04.xml CB802/Blair 0 521 77252 4 April 29, 2005 18:49
98 Franchising, Vertical Integration, and Vertical Restraints
law and the good faith obligation of the Uniform Commercial Code imposesa duty on a franchisor in all states for good faith and fair dealing” and thatthis obligation makes it difficult to request large lump-sum fees such as thoseneeded here.
Second, there is the potential for franchisor opportunism with a lump-sumfranchise contract. Once the franchisor has extracted all of the future profits,it has no incentive to maintain product quality or to advertise on behalfof the franchise system. In a traditional franchise, the franchisor who haspromised to supply the product at marginal cost will now have an incentiveto misrepresent MCP. In business-format franchising, franchisors that werenot going to be involved in selling inputs to franchisees at all may now try torequire franchisees to buy some inputs from them, inputs whose prices wouldbe marked up above the competitive level. To the extent that the franchisorbehaves opportunistically in these ways, the franchisee will not fully recoverhis costs. Anticipating those problems, franchisees will refuse to sign contractsinvolving large up-front fixed payments.97
Third, and finally, predictions tend to be less reliable the further into thefuture they go. Hence, the franchisor and franchisee may not be able to –or want to – rely on their estimates of demand and costs over the wholeperiod of an average 15-year contract to set a single upfront franchise fee.98
Therefore, although in theory the lump-sum franchise contract should leavethe upstream firm indifferent between franchising and vertical integration, itis not likely to be employed by the franchisor. The fact of the matter is thatfranchisors generally do not extract the present value of all future profits inlump-sum franchise fees. As we saw in Chapter 3, upfront franchise fees aretypically only a small proportion of the payments by franchisees to franchisors.
There is, however, a variant of the upfront fee that may be economi-cally equivalent and viable. As we saw in Chapter 3, a small proportion offranchisors charge royalties that are fixed periodic amounts. For example,Fantastic Sam’s charges its hair salon franchisees $225 per week in royalty and$104 per week as an advertising fee, while Chem-Dry Carpet and UpholsteryCleaning charges a fee of $198 per month.99 Clearly, these periodic lump-sumroyalty payments could be selected to extract all of the profit over the length of
97 See, notably, Mathewson and Winter (1985) on this. Also, for a related form of franchisoropportunism that operates through the terms of the franchise contract, see McAfee andSchwartz (1994). We discuss franchisor opportunism on several occasions throughoutthis book as it relates to the subject of individual chapters.
98 Data on contract duration are from the USDOC (1988).99 See Bond (2002) for these data.
P1: KSF0521772524c04.xml CB802/Blair 0 521 77252 4 April 29, 2005 18:49
4.3 Contractual Equivalents 99
the contract. That is, the present value of these weekly or monthly paymentscould be set equal to the optimal lump-sum franchise fee, which is equalto the present value of the profit stream. As we saw, however, this option isused infrequently in the U.S. – only 7 percent of the franchisors in our datain 2001 required franchisees to pay some such periodic lump-sum amount,and less than half of these relied solely on such payments, with no additionalsales-based fee.100 The reason for the relative infrequency of these periodiclump-sum fees is not entirely clear. After all, this option basically finessesthe franchisee’s wealth constraint by getting the franchisor to “finance” thelump-sum fee. However, this type of contract does not deal entirely with thefranchisor moral hazard problem nor does it resolve the uncertainty issue.Thus, it is perhaps not really surprising that sales-based rather than lump-sumfees have become the norm in franchising.
4.3.3 Sales Revenue Royalties
As we saw in Chapter 3, extracting royalties as a percentage of the sales rev-enue of franchisees is extremely common in franchising. Under some marketconditions, this also will be equivalent to vertical integration, but in otherscases it will not be. First, consider the case where there is perfect competitionamong the franchisees. Under these conditions, price is set by market forces –it is exogenous to franchisees or, put differently, they are powerless to affectit. Taking this price as a given then, franchisees will maximize their profitsby setting the output level such that their marginal cost equals the marketprice. The marginal cost, of course, includes the marginal cost of retailingand the wholesale price of the product or, in a business-format franchisingcontext, the cost of all inputs and local production. By setting the wholesaleprice equal to the marginal cost of production, or allowing the franchiseeto buy all inputs competitively, the franchisor can select a royalty rate thatextracts all of the profit inherent in the franchisee’s market. More specifically,the franchisor selects a royalty rate, r, such that
r P ∗ Q ∗ = (P ∗ − MCP − MCR)Q ∗.
Dividing both sides by P ∗ Q∗ yields
r = (P ∗ − MCP − MCR)/P ∗.
100 According to Frazer (1998), some 17 percent of franchisors use lump-sum royalties inAustralia. She advances some potential reasons why these are more popular in Australiathan in the U.S.

P1: KSF0521772524c04.xml CB802/Blair 0 521 77252 4 April 29, 2005 18:49
100 Franchising, Vertical Integration, and Vertical Restraints
$
P*
C*
0Q* Q
MR D
MCP
MCP + MCR
MCRd = (1– r)D
Figure 4-5: The effect of sales revenue royalties under perfect competition downstream.
Setting r at this level will allow the franchisor to extract exactly the profitthat a vertically integrated firm could earn. This is illustrated in Figure 4-5.Here, the effect of the royalty rate is to rotate the net demand curve – or thedemand that each franchisee sees – from D to d. This new demand curve (d )intersects the sum of the marginal costs at a quantity of Q∗. Consumers payP ∗ for that output and, of course, total revenue in the market is P ∗ timesQ∗
(denoted P ∗ Q∗). The franchisee pays total royalties of
r P ∗ Q ∗ = [(P ∗ − MCP − MCR)/P ∗](P ∗ Q ∗),
= (P ∗ − MCP − MCR)Q ∗
which is precisely equal to the profits available under vertical integration.In contrast, if the franchisee has some measure of market power in his
local market, then the franchisor will be unable to extract the fully integratedprofit using only sales royalties. This can be seen by examining the resultingfranchisee’s profit function
π = (1 − r )PQ − (MCP + MCR)Q,
and the associated first-order condition
dπ/d Q = (1 − r )(P + Q d P/d Q) − MCP − MCR = 0.
In other words, when the franchisee can exercise some market power, with0 < (1 − r ) < 1, he will sell an output where marginal revenue exceeds thesum of the marginal costs, MCP + MCR. That output will be below Q∗ andthus will generate less profits in the channel. Consequently, there will not exist

P1: KSF0521772524c04.xml CB802/Blair 0 521 77252 4 April 29, 2005 18:49
4.3 Contractual Equivalents 101
an ad valorem royalty rate that could be applied to the reduced total revenueto generate the vertically integrated level of profit for the franchisor withoutimposing economic losses on the franchisee.
The conclusion that no percentage of sales royalty exists that can give riseto the vertically integrated level of profits for the franchisor when franchiseeshave some market power is somewhat troubling as we expect franchisees tohave some market power in most retail and service industries if only becauseof location. Vertical integration and lump-sum franchise fees or ongoingfixed payments could achieve the optimal outcome for the franchisor underthe same circumstances. This begs the obvious question: why do we find somany firms opting for franchising, and given that they do, why use sales-based royalties? The answer as to why they rely on franchising versus verticalintegration, we argue below, has to do with franchisee incentives. As to whysales-based rather than fixed fees, this has to do at least in part with franchisorincentives and uncertainty, as mentioned above. To introduce these differentincentive considerations, however, one needs to introduce demand and costcurves that depend on unobservable franchisee and franchisor effort. In theremainder of this section, we maintain our assumption of known demand andcost as this keeps our comparison of different types of vertical restraints rela-tively simple. We address incentive issues and how they affect the conclusionshighlighted here in section 4.4.
4.3.4 Output Royalties
Another option for the franchisor is to levy a royalty on each unit of output soldby the franchisee. Specifically, the franchisor in a traditional franchise systemwould again commit to supplying its product at marginal cost but wouldcharge a fixed sum each time the franchisee sells a unit. In a business-formatfranchise system, the franchisor would need to ensure that the franchiseeis able to purchase all inputs competitively and then levy a per unit royaltyon the franchisee’s output.101 As with sales revenue royalties, with perfectcompetition among franchisees, an output royalty will generate the maximum
101 Most business-format franchisees sell a number of different products, such as thesandwiches, chips, soft-drinks, juices, and the like sold at Subway sandwich shops.This makes it difficult to define units and count units sold. One would have to set aper unit of output royalty for each product sold and keep track of the quantities soldseparately for each. Alternatively, if the franchisor could set the price at which outputsare sold, then franchisee output could be measured in dollars of sales. In that case, anoutput royalty would be exactly the same as a sales royalty.

P1: KSF0521772524c04.xml CB802/Blair 0 521 77252 4 April 29, 2005 18:49
102 Franchising, Vertical Integration, and Vertical Restraints
$
P*
C*
0Q* Q
MR D
MCP
MCP + MCR
MCRd’= (1-t)D
Figure 4-6: The effect of output royalties under perfect competition downstream.
profits for the franchisor. If the franchisees have some degree of local marketpower, however, the maximum profits cannot be extracted in this fashion.
When there is competition among the franchisees, the franchisor can setthe per unit of output royalty, t, as follows:
t = P ∗ − MCP − MCR
where MCP corresponds to the wholesale price in a traditional franchise,or the sum of all input prices for the business-format franchisee, and MCR
represents the constant retailing cost for a traditional franchisee or the costof local production for the business-format franchisee. This output-basedroyalty gives rise to a net demand curve, d ′, that is parallel to the originaldemand, D, as shown in Figure 4-6. If the franchisor selects the correct t, thefranchisees will produce Q∗ and consumers will pay P ∗ per unit. The royaltyrevenue to the franchisor will be
t Q ∗ = (P ∗ − MCP − MCR)Q ∗,
which is precisely equal to the profits that the franchisor could earn if it werevertically integrated.
If the franchisees have a measure of local market power, as we expect theywould given differentiation (including spatial differentiation) in retail andservice markets, the franchisor will not be able to extract the full verticallyintegrated level of profit with this franchise contract. As with the sales revenueroyalties, the output royalty will lead the franchisee to restrict its output be-low Q∗ and thereby reduce the royalty payments below the level that vertical
P1: KSF0521772524c04.xml CB802/Blair 0 521 77252 4 April 29, 2005 18:49
4.3 Contractual Equivalents 103
integration would provide. This again follows immediately from the fran-chisee’s profit function,
π = P Q − (MCP + MCR)Q − t Q,
and the franchisees’ maximum profit condition,
dπ/d Q = P + Q d P/d Q − MCP − MCR − t = 0.
Since t > 0, this condition shows that the franchisee will restrict its out-put below the quantity at which marginal revenue equals marginal cost ofproduction and distribution (the sum of MCP and MCR). Thus, we reachthe conclusion that no output royalty can generate the vertically integratedlevel of profits for the franchisor without imposing economic losses on thefranchisees.
4.3.5 Input Purchase Requirements and Tying
Franchisors can also generate revenues by selling inputs to their franchisees. Infact, this is the standard way in which most manufacturers deal with their dis-tributors, and as noted in Chapter 1, the way in which traditional franchisors –car manufacturers, oil companies, and soft-drink producers – all generatetheir stream of revenues. In business-format franchising, many franchisorsdo not have the option of selling a finished product to their franchisee as pro-duction usually takes place downstream. For example, meals are produced atthe restaurant, not at the franchisor’s head office. But business-format fran-chisors can sell various inputs, such as paper products, cooking equipment,pizza dough, hamburger patties, and so on. If such inputs are sold at a markup,the franchisor successfully extracts at least some downstream profit with thiscontractual requirement. Under certain circumstances, input purchase re-quirements are indeed economically equivalent to vertical integration. Aswith sales revenue and output royalties, they yield maximum profits for thefranchisor if franchisees operate in a perfectly competitive environment, butnot when the franchisees have local market power.
The effect of forcing franchisees in a perfectly competitive environment topurchase goods from the franchisor at a markup is illustrated in Figure 4-7,where the franchisor charges a wholesale price of
Pw = P ∗ − MCR
for the good(s) it sells. Assuming for simplicity that no other physical inputsare needed downstream, franchisees in a perfectly competitive market thenwill sell Q∗ since the competitive supply, Pw + MCR, equals demand at Q∗.
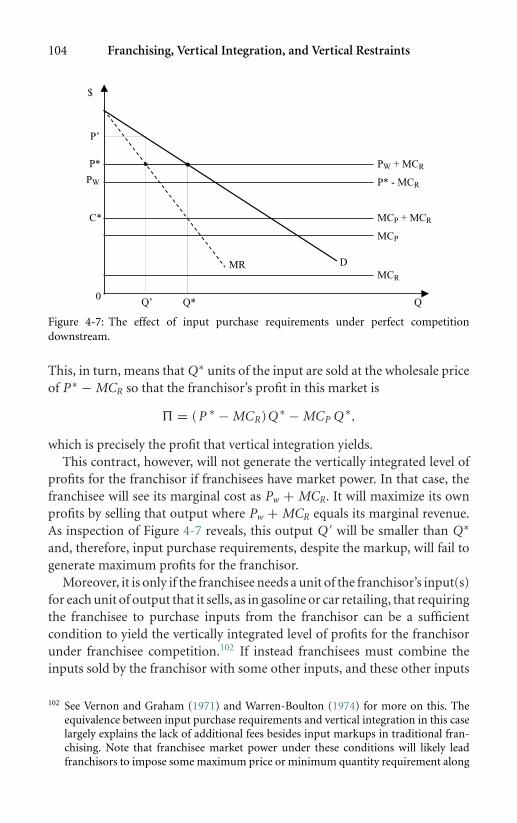
P1: KSF0521772524c04.xml CB802/Blair 0 521 77252 4 April 29, 2005 18:49
104 Franchising, Vertical Integration, and Vertical Restraints
P’
$
P*
C*
0Q* Q
MR D
MCP
MCP + MCR
MCR
P* - MCR
PW + MCR
PW
Q’
Figure 4-7: The effect of input purchase requirements under perfect competitiondownstream.
This, in turn, means that Q∗ units of the input are sold at the wholesale priceof P ∗ − MCR so that the franchisor’s profit in this market is
� = (P ∗ − MCR)Q ∗ − MCP Q ∗,
which is precisely the profit that vertical integration yields.This contract, however, will not generate the vertically integrated level of
profits for the franchisor if franchisees have market power. In that case, thefranchisee will see its marginal cost as Pw + MCR. It will maximize its ownprofits by selling that output where Pw + MCR equals its marginal revenue.As inspection of Figure 4-7 reveals, this output Q ′ will be smaller than Q∗
and, therefore, input purchase requirements, despite the markup, will fail togenerate maximum profits for the franchisor.
Moreover, it is only if the franchisee needs a unit of the franchisor’s input(s)for each unit of output that it sells, as in gasoline or car retailing, that requiringthe franchisee to purchase inputs from the franchisor can be a sufficientcondition to yield the vertically integrated level of profits for the franchisorunder franchisee competition.102 If instead franchisees must combine theinputs sold by the franchisor with some other inputs, and these other inputs
102 See Vernon and Graham (1971) and Warren-Boulton (1974) for more on this. Theequivalence between input purchase requirements and vertical integration in this caselargely explains the lack of additional fees besides input markups in traditional fran-chising. Note that franchisee market power under these conditions will likely leadfranchisors to impose some maximum price or minimum quantity requirement along
P1: KSF0521772524c04.xml CB802/Blair 0 521 77252 4 April 29, 2005 18:49
4.3 Contractual Equivalents 105
can be substituted for the ones provided by the franchisor, then input purchaserequirements on the one input provided by the franchisor will not suffice evenunder perfect competition downstream.
Finally, input purchase requirements raise special legal concerns, espe-cially for business-format franchisors. In legal terms, a tying arrangement isdefined as a conditional sale in which product “A” is sold on the conditionthat the buyer also buys a second product “B” from the supplier of “A.” Inbusiness-format franchising, the franchisor sells a license to do business aspart of the franchise system. Thus, if the franchisor also sells products toa franchisee as a condition of obtaining the license, and these products aredistinct from the license, then the franchisor is using a tying arrangement. Ifthe goods sold are not really distinct from the license, as occurs, for example,for trademarked gasoline at a gasoline station or for particular brands of carssold at authorized dealerships, there is no tying. In that sense, input purchaserequirements do not raise the same degree of legal concerns in traditionalfranchising. We return to these issues in detail in Chapter 6, where we exam-ine the conflicts between franchisors and franchisees that are created by inputpurchase requirements and tying.
4.3.6 Resale Price Controls
In circumstances where the franchisee has market power, the franchisor’sconcern is that the franchisee’s prices may be set above the optimal levelfrom the franchisor’s perspective. We examine this problem in more detailin Chapter 7. Here, however, we show briefly how maximum resale pricecontrols can generate the same outcome as vertical integration.103
Suppose that the franchisor sets its wholesale price as follows:
Pw = P ∗ − MCR
Left to its own devices, the franchisee who has market power would equateits marginal cost to its marginal revenue:
M R = Pw + MCR
with the exclusive purchasing requirement. On this, see, e.g., Shepard (1993) and ourdiscussion of resale price maintenance in Chapter 7.
103 Note that setting a minimum resale price, as opposed to setting a maximum price, isstill per se illegal under U.S. antitrust laws. We focus on maximum resale price controlshere as pricing disputes in franchising usually involve such controls. Maximum resaleprice controls are not illegal per se.

P1: KSF0521772524c04.xml CB802/Blair 0 521 77252 4 April 29, 2005 18:49
106 Franchising, Vertical Integration, and Vertical Restraints
and produce an output Q ′ below Q∗ (see Figure 4-7). From the franchisor’sperspective, this is an unfortunate result because its profit falls below themaximum that vertical integration would yield. But all is not lost. Maximumresale price constraints can be employed to aid in this regard. In Figure 4-7,we can see that the franchisor could set its wholesale price as before equal toP ∗ − MCR and then also impose a maximum resale price of P ∗ = Pw + MCR.This again will lead to an output of Q∗ and profits of
� = (P ∗ − MCP − MCR)Q ∗
for the franchisor. At the same time, the franchisee earns a competitivereturn – zero economic profit – for performing the retail distribution function,as he would under perfect competition.
4.3.7 Output (or Sales) Quotas
The last option that we consider briefly here is the establishment, by thefranchisor, of performance standards such as sales quotas.104 Returning toFigure 4-7, one can see that the franchisor can obtain the desired result byestablishing a sales quota of Q∗ units. Given the demand function, the only waythat the franchisee can satisfy the performance standard is by charging a resaleprice of P ∗. The franchisor would still set the wholesale price at Pw = P ∗ –MCR and would earn precisely the same profit as under vertical integration.Again, the franchisee earns a competitive return on his or her investment.
Provided that the franchisor knows the demand in the franchisee’s market,there is no problem in selecting the profit maximizing output quota. Thepractical difficulty is in enforcing that output quota. If the franchisee fails tomeet the quota, the franchisor must impose a penalty of some sort. Termina-tion is the sanction that comes to mind, but that may be too much of a penalty.Also, as we shall see in Chapter 10, there are legal constraints on a franchisor’sfreedom to terminate its franchisees. These legal constraints reduce the at-tractiveness of termination as a sanction and, by raising the costs associatedwith franchising, reduce the attractiveness of franchising as a distributionsystem from the perspective of franchisors.105
A variant of the performance standard is quantity forcing. This may take theform of “overfilling” orders from the franchisee. For example, an automobilemanufacturer may decide how many of each car model will be supplied to
104 See, e.g., Shepard (1993) for a discussion of the use of sales quotas in gasoline retailing.105 For an interesting analysis of the economic effect of imposing legal limits on termina-
tion, see Brickley, Dark, and Weisbach (1991b).

P1: KSF0521772524c04.xml CB802/Blair 0 521 77252 4 April 29, 2005 18:49
4.4 Incentive Issues and Agency Theory 107
a dealer. Since the dealer must eventually pay for the automobiles that aresupplied, these automobiles must be sold. Assuming that the manufacturerknows the local demand for its automobiles, it can select the quantity that itfinds optimal. In Figure 4-7, the manufacturer would select quantity Q∗ andship it to the dealer. Again, there is only one way that the dealer can sell Q∗
automobiles and that is to set price at P ∗.
4.4 Incentive Issues and Agency Theory
In section 4.3, we have shown that various vertical restraints are economi-cally equivalent to one another. In principle, by themselves or in combination,they are also economically equivalent to full vertical integration, that is, theygenerate the same profit for the franchisor. In practice, however, we showedin section 4.2 that most franchised chains are hybrids: partially verticallyintegrated and partially franchised. Moreover, initial franchise fees and sales-based royalties (and/or advertising rates) are by far the most frequently usedcontract terms in franchising, and sales-based fees represent the bulk of pay-ments by franchisees to franchisors. We have hinted earlier at some reasonswhy some forms of vertical restraints – such as input purchase requirementsand resale price maintenance – are not used as much as sales-based fees infranchise contracts. Throughout our discussion of vertical restraints, however,we have assumed that the level of demand and distribution costs are knownby the franchisor and are independent of any effort by the franchisee or thefranchisor. In this section, we relax this assumption in order to generate the-oretical explanations for the levels of royalty rates and initial franchise feeschosen by franchisors.106 We then return to dual distribution in franchisingand explain how theories about optimal royalty rates can be used to under-stand some of the variation in the extent of company ownership across firms.
4.4.1 Royalty Rate and Franchise Fee Decisions
Agency theory has been the theoretical lens most frequently applied to thequestion of how firms select the terms of their franchise contract. The basicagency model views the primary purpose of contract design as a mechanism toprovide appropriate insurance and incentives to risk-averse franchisees whoseeffort level is not directly observable by the franchisor. In this section, we firstdescribe this basic model when the relationship between effort and sales is
106 Much of this section is based on parts of Lafontaine and Slade (2001) and Lafontaineand Raynaud (2002).
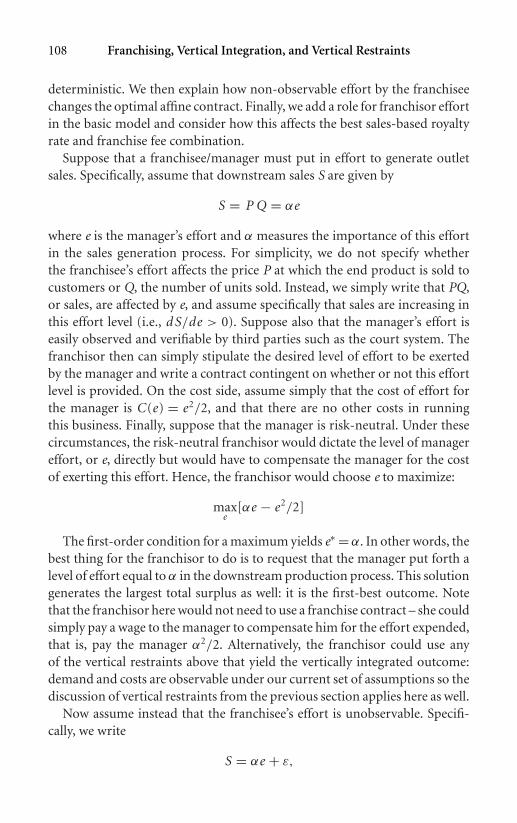
P1: KSF0521772524c04.xml CB802/Blair 0 521 77252 4 April 29, 2005 18:49
108 Franchising, Vertical Integration, and Vertical Restraints
deterministic. We then explain how non-observable effort by the franchiseechanges the optimal affine contract. Finally, we add a role for franchisor effortin the basic model and consider how this affects the best sales-based royaltyrate and franchise fee combination.
Suppose that a franchisee/manager must put in effort to generate outletsales. Specifically, assume that downstream sales S are given by
S = P Q = αe
where e is the manager’s effort and α measures the importance of this effortin the sales generation process. For simplicity, we do not specify whetherthe franchisee’s effort affects the price P at which the end product is sold tocustomers or Q, the number of units sold. Instead, we simply write that PQ,or sales, are affected by e, and assume specifically that sales are increasing inthis effort level (i.e., d S/de > 0). Suppose also that the manager’s effort iseasily observed and verifiable by third parties such as the court system. Thefranchisor then can simply stipulate the desired level of effort to be exertedby the manager and write a contract contingent on whether or not this effortlevel is provided. On the cost side, assume simply that the cost of effort forthe manager is C (e) = e2/2, and that there are no other costs in runningthis business. Finally, suppose that the manager is risk-neutral. Under thesecircumstances, the risk-neutral franchisor would dictate the level of managereffort, or e, directly but would have to compensate the manager for the costof exerting this effort. Hence, the franchisor would choose e to maximize:
maxe
[αe − e2/2]
The first-order condition for a maximum yields e∗ = α. In other words, thebest thing for the franchisor to do is to request that the manager put forth alevel of effort equal to α in the downstream production process. This solutiongenerates the largest total surplus as well: it is the first-best outcome. Notethat the franchisor here would not need to use a franchise contract – she couldsimply pay a wage to the manager to compensate him for the effort expended,that is, pay the manager α2/2. Alternatively, the franchisor could use anyof the vertical restraints above that yield the vertically integrated outcome:demand and costs are observable under our current set of assumptions so thediscussion of vertical restraints from the previous section applies here as well.
Now assume instead that the franchisee’s effort is unobservable. Specifi-cally, we write
S = αe + ε,

P1: KSF0521772524c04.xml CB802/Blair 0 521 77252 4 April 29, 2005 18:49
4.4 Incentive Issues and Agency Theory 109
where ε is a random variable with mean 0 and variance σ 2 that preventsthe franchisor from inferring e from observed S. Then the optimal solutionis to sell the outlet outright to the franchisee for a lump-sum franchise fee.This sale at a fixed price would make the manager a full residual claimant,thereby giving him incentives to put forth the optimal level of effort.107 Wecan see this from the maximization problem of the manager/franchisee: usingF to denote the lump-sum franchise fee that the franchisor charges, the risk-neutral manager/franchisee will want to maximize his expected profits, E(π),given by
E(π) = αe − e2/2 − F .
The first-order condition for this maximization problem gives e∗ = α,which corresponds to the first-best level of effort and, thus, to the level ofeffort that the franchisor would have chosen if she had control over it. In thatsense, selling the outlet at a fixed price to the franchisee completely resolves thefranchisee’s incentive issues. The franchisor can extract all the profits from theoutlet operations by appropriately setting the price, F, equal to α2/2.108 Note,however, that when franchisee effort is not observable, sales or output-basedroyalty schemes are not optimal: they prevent the realization of the first-bestoutcome. In particular, the risk-neutral franchisee who must pay a portionr of his revenues to the franchisor (where 0 < r < 1 represents the sum ofall revenue-based fees such as royalty rates and advertising fees) maximizesexpected profits
E(π) = (1 − r )αe − e2/2 − F ,
by setting effort e ′ = (1 − r )α. In other words, the effort level e ′ chosen bythe franchisee subject to royalty payments is strictly lower than the effort levele∗ that the franchisee chooses under a pure lump-sum franchise fee contract.Hence, one would not expect revenue sharing to be used in this setting.
The standard agency model introduces one more complication to yielda contract that involves profit or revenue sharing. Specifically, assume nowthat the franchisee is risk-averse instead of risk-neutral. In other words, hevalues income levels that he knows he will obtain with certainty above thesame income level obtained in expectation only. One simple way to represent
107 See, for example, Rubin (1978) and Mathewson and Winter (1985) for more on this.108 To simplify the algebra, we ignore issues of contract duration and discounting. This
in no way affects the generality of the result that a fixed price contract resolves allincentive issues when franchisees are risk-neutral. Note that F could be set at any levelnot exceeding α2/2. But any F below α2/2 means that the franchisor does not make asmuch as she could, and the franchisee earns above normal returns.

P1: KSF0521772524c04.xml CB802/Blair 0 521 77252 4 April 29, 2005 18:49
110 Franchising, Vertical Integration, and Vertical Restraints
such preferences is to specify that the franchisee has a utility of income func-tion given by u(y) = −exp(-ρy), where y represents income and ρ is thefranchisee’s coefficient of absolute risk aversion. It is well-known that withthis type of utility function, the agent behaves as if he were maximizinghis certainty-equivalent income, CE, which is E(y) − (ρ/2)Var(y), where Estands for the expectation operator, and Var refers to the variance.109
We saw in Chapter 3 that most franchisors use sales-based, linear com-pensation rules with franchisees.110 Why franchisors use sales rather thanprofit-based fees is usually attributed to the fact that profits are too easy forfranchisees to manipulate.111 As for why franchisors rely on linear sharingrules, authors typically argue that the costs of implementing more complexcontracts are too high. Beyond that, the models that address this questionrapidly become quite technical and are beyond the scope of this book.112
Whatever the reasons for the reliance on simple franchise fee plus sales-based royalty contracts, the franchisee’s profit under such a contract isπ = (1 − r )S − F − C (e), where F is the initial franchise fee and r is theroyalty rate. The franchisee’s certainty-equivalent, income, CE, then is
CE = E(y) − (ρ/2)Var(y)
= (1 − r )αe − F − e2/2 − (ρ/2)(1 − r )2σ 2,
where E(y) is his expected income, or outlet profit, and σ 2 is the variance ofε. Taking the first derivative of CE with respect to e and setting that equal tozero, the solution to the franchisee’s maximization problem is to choose aneffort level e† = (1 − r )α. This level of effort is clearly lower than the first-best level, α, but given franchisee risk aversion and unobservable effort thisis the best the franchisor can achieve.113
The franchisor’s problem then is to choose r to maximize total surplustaking for granted that the franchisee will provide an effort level e† = (1 − r )α,
109 See Milgrom and Roberts (1992) at 217 for this proposition.110 In reality, the compensation rules are affine, that is the franchise fee is not zero. The
literature, however, tends to refer to these as linear by opposition to non-linear. Wefollow that convention from here on.
111 See, for example, Maness (1996). Rubin (1978) proposes instead that franchisors arepaid a portion of outlet sales because these are what their effort affect. We return toRubin’s point below.
112 See Holmstrom and Milgrom (1987), who show that such contracts are optimal inintertemporal settings, and Romano (1994) and Bhattacharyya and Lafontaine (1995),who show that such contracts are optimal under double-sided moral hazard with riskneutral parties.
113 Specifically, under these assumptions, there is no contract that will allow the franchisorto achieve the first-best, even if we do not restrict ourselves to affine contracts.

P1: KSF0521772524c04.xml CB802/Blair 0 521 77252 4 April 29, 2005 18:49
4.4 Incentive Issues and Agency Theory 111
and then set F to extract that surplus. Substituting e† in the equation forexpected total surplus (given by αe – e2/2 – (ρ/2)(1 − r)2σ 2), we have
maxr
[(1 − r )α2 − (1 − r )2α2/2 − (ρ/2)(1 − r )2σ 2].
The first-order condition for the franchisor’s problem implies that r† =[ρσ 2/(α2 + ρσ 2)] > 0. In other words, the best linear contract from thefranchisor’s perspective now involves some revenue sharing. This sharingarises as a way to balance the need to motivate franchisee effort (which makesthe optimal r lean toward 0) while providing insurance to the franchiseesgiven that they are risk-averse (which makes the optimal r lean toward 1).114
Finally, the standard agency model above has been amended to allow fran-chisor effort to also play a role in franchise contracting. Thus, instead ofassuming that sharing occurs as a way to provide insurance along with in-centives to risk-averse franchisees, a number of authors have focused on salesroyalties as a franchisor incentive device under double-sided moral hazard.115
Specifically, in addition to considering franchisee effort, models based on two-sided moral hazard formally recognize that the effort that the franchisor putsinto maintaining the value of its trademark, updating the product offerings,selecting franchisees, and so on, also affects outlet sales. When both partiesmust provide effort in these ways, and neither effort level is observable, then,even if both parties are risk-neutral, the optimal contract will involve revenuesharing. To see this, assume now that outlet sales are given by
S = αee + βer + ε,
where ee stands for franchisee effort, and er for franchisor effort. The presenceof a random term, ε, in the sales function implies that neither party can inferthe effort level of the other from observing sales, S, and their own effort.Suppose further that the franchisee’s and franchisor’s cost of effort are given
114 We do not model the choice of F explicitly but instead leave it intentionally vague giventhat this fee affects neither the choice of effort nor total surplus.
115 See notably Rubin (1978), Lal (1990), Romano (1994), and Bhattacharyya andLafontaine (1995). Carmichael (1983) has shown that with two agents or more, andmoral hazard on the principal’s side as well as the agents’ side, the first-best can beachieved with a contract based on relative output. See also Gupta and Romano (1998)for more on relative performance contracts. In spite of their theoretical benefits, we donot observe explicit relative performance contracts in franchising. One could specu-late that this is because the markets are too distinct to make performance comparisonsmeaningful, or perhaps that such contracts would lead to excessive intrabrand com-petition. Bradach (1998), Chapter 5, examines the less formalized, but still important,use of relative performance evaluation in practice.
P1: KSF0521772524c04.xml CB802/Blair 0 521 77252 4 April 29, 2005 18:49
112 Franchising, Vertical Integration, and Vertical Restraints
by C (ee ) = e2e /2 and C(er ) = e2
r /2, respectively. The franchisee maximizinghis expected profits given r will choose e∗
r = (1 − r )α. The franchisor whogets a fraction r of outlet sales will set e∗
r = rβ. Substituting these two effortlevels into the franchisor’s maximization problem yields
maxr
[(1 − r )α2 + rβ2 − (1 − r )2α2/2 − r 2β2/2].
The first-order condition for this maximization problem gives r ∗ = α2/
(α2 + β2) > 0, which once again implies revenue sharing even though wehave assumed away franchisee risk aversion (i.e. ρ = 0). If we assumed in-stead that ρ > 0, the result would imply that both franchisee risk aversionand franchisor effort lead r away from 1.
The standard incentive-cum-insurance agency model and the double-sidedmoral hazard model just described generate clear predictions concerningfactors that should influence the financial terms of the franchise contractor, more specifically, the share parameter (royalty rate). In the basic model,these are the level of risk, the degree of franchisee risk aversion, and theimportance of the franchisee’s effort. Double-sided moral hazard models addthe importance of franchisor effort to this list. The empirical literature hasfound support generally for the notion that the need to provide incentives tofranchisees and to franchisors play a role in the setting of the actual rates.116
The evidence relative to the level of risk, however, does not conform to thepredictions from these models.117
The basic agency model has been challenged also by the surprisingly highdegree of franchise contract term uniformity and stability that has beenobserved empirically. While the framework predicts a different optimal
116 See Lafontaine and Slade (1997, 2001) for reviews of the empirical literature. Thoughthese authors mention the few studies that have examined the determinant of sales-based fees, they review the bulk of the literature that focuses instead on the mix ofcompany-owned and franchised outlets. We discuss the relationship between the con-tract mix and contract terms in the next section.
117 See Lafontaine and Bhattacharyya (1995) for a review of the empirical evidence es-tablishing a positive rather than negative relationship between risk and franchising.This positive relationship runs counter to the idea that franchisees need to be betterinsured by franchisors when they face greater risk. The authors explain this result ina double-sided moral hazard setting where the variance of outcomes, i.e., measuredrisk, is endogenously greater for franchisees because they make better use of their ownprivate information about the market. See also Prendergast (2002) for more on this.Ackerberg and Botticini (2002) provide an alternative explanation for this same em-pirical fact using the notion of endogenous matching. They argue that less risk-averseindividuals will choose riskier contracts, making it difficult for the econometricianto correctly assess the relationship between risk and franchising. Finally, see Mazzeo(2004) on a related empirical analysis of motel owners’ decisions to join chains oroperate independently.
P1: KSF0521772524c04.xml CB802/Blair 0 521 77252 4 April 29, 2005 18:49
4.4 Incentive Issues and Agency Theory 113
contract for each franchisor-franchisee pair due to different preferences offranchisees and to differences in the characteristics of individual outlets andtheir markets, in reality franchisors tend to offer a single franchise contract toall franchisees applying for a franchise at a given point in time (e.g., Lafontaine1992a, 1992b). Furthermore, the frequency of changes in the financial termsof this single franchise contract is quite low (Lafontaine and Shaw 1999).
Authors seeking to explain the observed incidence of franchise contractuniformity have proposed a number of extensions to the basic agency frame-work. One set of arguments focuses on the costs of contract customiza-tion, including the direct costs associated with tailoring and enforcing alarge number of contracts (e.g., Holmstrom and Milgrom 1987; Lafontaine1992b) or with regulatory and disclosure constraints on contracting practices(Lafontaine 1992b). Cost-based explanations for the lack of contract cus-tomization also include arguments about the indirect costs of customization,such as the potential for franchisor opportunism once contracts are signed.From this perspective, a commitment to contract uniformity may reassurefranchisees that the financial terms of the contract in a given chain will notbe modified for new franchisees in a way that would be detrimental to exist-ing franchisees (McAfee and Schwartz, 1994).118 A second set of extensionsto the basic agency framework focuses on a different rationale for contractuniformity, namely that the benefits of contract customization are quite lowunder double-sided moral hazard (Bhattacharyya and Lafontaine 1995).119
This tendency for contract uniformity and stability also has led researchersto examine whether adjustments to the ownership structure of the franchisechain may substitute for contract customization. We now turn briefly to anexamination of how the agency-theoretic arguments above, or extensionsof these, can help shed light on franchisors’ decisions concerning contractmixing given the reality that franchise contracts terms tend to be uniformwithin any given franchise network and quite stable over time.
4.4.2 Dual Distribution Decisions
Starting from the assumption that contract terms are uniform within fran-chised chains, under certain conditions those factors that would ordinarilyinfluence the terms of the contract instead affect the likelihood that particular
118 This is an application of the Coase conjecture for durable goods; see Coase (1972).119 More specifically, Bhattacharyya and Lafontaine (1995) show that when the production
function is Cobb-Douglas and the cost-of-effort function is exponential, the optimal-share parameter is independent of the scale of operation and, as a result, of the levelof demand and the degree of competition in the market. The share parameter is alsoindependent of both parties’ cost-of-effort parameters.
P1: KSF0521772524c04.xml CB802/Blair 0 521 77252 4 April 29, 2005 18:49
114 Franchising, Vertical Integration, and Vertical Restraints
outlets will be franchised or company operated. In particular, we are inter-ested in whether the same factors that would lead to granting higher-poweredincentives to franchisees if contracts were allowed to vary within a chain in-stead lead to a higher fraction of franchised outlets in the uniform-contractcase. We now describe a setting in which this is the case.120
Suppose that each outlet or unit is associated with some outlet character-istic x that affects its profitability, and let the expected profitability of thatunit depend on the power of the agent’s incentives (inversely related to theroyalty rate) as well as on this characteristic. One can express this relation-ship as E[π(r, x)] and assume that as x increases, the marginal profitabilityof higher-powered incentives (lower r) also increases. For example, x mightbe the distance between the outlet and the closest monitoring headquartersor a parameter indicating the need for local customization of the business. Ifcontracts were outlet specific, the franchisor’s problem would be to choose aseries of royalty rates ri
∗, where i = 1 . . . n (and n is the number of outlets inthe chain), to maximize expected profit in each outlet, E[πi (ri , xi )], subjectto the constraint that the franchisee in each outlet will choose its effort levelto maximize its own profit given ri. The assumption that the marginal prof-itability of higher-powered incentives increases as x increases guarantees thatthe solution to this problem, r ∗
i , is decreasing in xi .Now suppose that fine tuning the contracts is sufficiently expensive for the
franchisor to choose to offer only two contracts: a franchise contract with0 < r < 1, where r is the same for all franchisees, and a vertical integrationcontract that amounts to a contract with r = 1 and a negative F. If the fran-chisor has n units, one can order those units such that x1 ≤ x2 ≤ x3 . . . ≤ xn.Then the franchisor’s problem involves choosing r ∗ and an index i ∗ such thatall outlets with i ’s below i ∗ – in other words low x ’s – will be company-ownedand all others will be franchised. In this situation, an exogenous increase inx at some units would lead the franchisor to adopt both higher-poweredfranchisee incentives (lower r ∗) for its set of franchised units and a greaterproportion of franchised units (lower i ∗) in the chain.
In empirical tests, authors have found support for the idea that fran-chisors at least partly address issues of outlet or market heterogeneity throughtheir choice of contract type, that is, company-ownership versus franchising,instead of tailoring the terms of their franchise contract. For example, theevidence suggests that smaller, rural units that are farther away from head-quarters are more likely than others to be franchised (see Lafontaine and
120 This section borrows heavily from Section 3 of Lafontaine and Slade (2001).

P1: KSF0521772524c04.xml CB802/Blair 0 521 77252 4 April 29, 2005 18:49
4.4 Incentive Issues and Agency Theory 115
Slade (1997, 2001) and the references therein). Thus, local market and unitcharacteristics clearly affect the ownership decision.
The evidence, however, also strongly suggests that the proportion of acompany’s units that are franchised versus company owned does not arisesimply as a passive outcome resulting from a set of individual ownershipdecisions based on the characteristics of each of the outlets in a chain, asthe agency models might imply. Using data on the proportion of companyowned units in almost 5,000 franchised chains in the U.S. over the 1980 to1997 period, Lafontaine and Shaw (2005) show that established firms – thosewith eight or more years of franchising experience – tend to hold their pro-portion of company units stable over time. Franchisors do this by addingboth types of units when growing and closing both types when the chaindecreases in size. The authors also cite a number of instances when fran-chisors have stipulated what they see as the optimal mix of franchised andcompany units in their chain.121 Lafontaine and Shaw conclude that this mixis a decision variable that firms actively work toward, and that this decisionvariable then informs or constrains the individual outlet-level decisions onownership.
Lafontaine and Shaw (2005) also show that the target mix varies substan-tially across franchised chains. They find that variation in brand-name valueacross chains is an important determinant of the targeted mix: franchisorswith high brand-name value, as measured by advertising fees or major mediaexpenditures per outlet, target high rates of company ownership. The authorsargue that targeting high rates of company ownership is desirable in chainswith more valuable brands because individual franchisees have incentives tofree ride on brand-name value or to simply adopt policies that make thembetter off at the expense of the brand. Consequently, high-value franchisorsneed to exert more direct managerial control over outlets in their chain. Inaddition, according to double-sided moral hazard arguments, high companyownership rates give franchisors better incentives to maintain the value oftheir brand.122
121 Lafontaine and Kaufmann (1994) further show that most franchisors will answer ques-tions about their optimal mix, and the majority of them operate what they perceive tobe the optimal mix.
122 For further discussions of these arguments and others on the role of dual distri-bution in franchising, see notably Oxenfeldt and Kelly (1969), Caves and Murphy(1976), Brickley and Dark (1987), Dant, Kaufmann and Paswan (1992), Gallini andLutz (1992), Lafontaine (1992a), Kaufmann and Lafontaine (1994), Scott (1995), andBradach (1997, 1998).
P1: KSF0521772524c04.xml CB802/Blair 0 521 77252 4 April 29, 2005 18:49
116 Franchising, Vertical Integration, and Vertical Restraints
4.5 Conclusion
In this chapter, we have reviewed the extent to which franchisors verticallyintegrate some outlets versus franchising others. We examined also a num-ber of instruments that franchisors could use in their contracts to obtain, atleast in theory, as much profit from their franchisees as with direct opera-tions. In this discussion, we have abstracted from the underlying reason whyfranchisors choose to franchise rather than operate all their units directly: inparticular, we assumed that outlet-level demand and costs were known byall and unaffected by the outlet manager’s effort. When demand and costsare affected by local effort – and potentially by franchisor effort as well –we showed that revenue sharing arises as a way to motivate franchisees andfranchisors. This is the central theme of the agency-theoretic arguments thatwe reviewed. These arguments suggest that franchisors will choose to givefranchisees higher-powered incentives (i.e., lower royalty rates or rely on fran-chising more) the more important the franchisee’s effort, an implication thathas been supported in the empirical literature. We also discussed specificallyhow the same agency arguments can shed light on decisions about contractterms and decisions to both own and franchise outlets in a chain, but notedthat the extent of contract mixing seems to reflect a stable policy decision infranchised chains. We described how franchisors with more valuable brandstend to own and control directly a larger proportion of their units, suggestingthat such franchisors have a greater need for control given that brand-namevalue can be significantly eroded by franchisees’ profit-maximizing behavior.
Finally, although our account of franchisor practices again focused onU.S. franchising, it is important to note that the few studies conducted else-where suggest that dual distribution also is the norm for non-U.S. franchisors.For example, Azevedo and Dos Santos Silva (2001), Penard, Raynaud andSaussier (2003), and Windsperger (2002), who study the Brazilian, French,and Austrian franchise sectors respectively, all find that dual distribution isthe norm in these countries as well. Moreover, Azevedo and Dos Santos Silva(2001), and Penard, Raynaud and Saussier (2003) show that the contract mixis quite stable within established franchised chains in Brazil and in France, re-spectively, and that it also relates positively to measures of brand-name valuein these countries.
P1: KaD0521772524c05.xml CB802/Blair 0 521 77252 4 April 30, 2005 12:32
5
Quality Control
5.1 Introduction
The strength of franchise systems typically does not lie in the absolute qual-ity of the products offered. Instead, it resides largely in the capacity of thefranchised chain to offer a uniform product at a reasonable price. Customersknow what to expect when they patronize an outlet in a franchised chain,and it is important for the chains to successfully meet these expectations timeafter time. The importance of uniformity to mobile customers is clear. Speak-ing about airport restaurants, Nancy Kruse, of the restaurant consulting firmTechnomic, notes: “Travelers love to see fast-food chains at airports. Even ifthey’re 2000 miles from home, they can go into an airport McDonald’s, ordera Big Mac, and know exactly what they’re getting and more or less what it’sgoing to cost” (quoted in Frequent Flyer, March 1991). Similarly, the founderof Ember’s America, a new franchise conversion concept for locally ownedfamily restaurants, points out: “If Big Macs were different from McDonald’sto McDonald’s, people wouldn’t stop at McDonald’s very often.”123 In otherwords, it is the consistency of the system’s operation, service, and productquality that attracts customers and induces loyalty: customers become loyalif the experiences they enjoy at diverse units of these chains routinely meettheir expectations.124
Franchisors are, of course, well-aware of the importance of consistencyto their customers. Bradach (1998) interviewed several managers and fran-chisees in five major fast-food franchised chains to gain insight into how thesefirms were organized and why. In characterizing the shared identity of outletsin these chains and the importance of product uniformity, Bradach quotes in
123 Quoted in Johnson (1998).124 See, e.g., Kaufmann and Eroglu (1998) for more on this.
117
P1: KaD0521772524c05.xml CB802/Blair 0 521 77252 4 April 30, 2005 12:32
118 Quality Control
particular Gregg Reynolds, then vice-president of public affairs at KFC: “KFCchicken should taste the same and be served with the same friendly serviceregardless of whether it is purchased in Tiannamen Square in Beijing, China,or in Louisville, Kentucky” (Bradach 1998: 16–17). Franchisees also are well-aware of the importance of meeting customers’ expectations at every visit.Franchisees will complain to the franchisor about under-performing outletsand request that the franchisor intervene because they know how a bad expe-rience by a customer in one location can have an adverse impact throughoutthe entire franchise system and ultimately on them.125 In other words, qualityand service variation have external effects that damage other franchisees aswell as the franchisor, and this creates a tension between the franchisor andindividual franchisees. The problem is aptly described by Caves and Murphy(1976: 577):
A franchisee who reduces the quality of the good or service he offers for a givenprice might increase his own profits, yet by disappointing buyers’ expectationshe could reduce by a greater amount the net returns to the common intangiblegoodwill asset – maintained by the franchisor and used jointly by his otherfranchisees.
Similarly, Klein (1980: 358) observes that
there is an incentive for an individual opportunistic franchisee to cheat the fran-chisor by supplying a lower quality of product than contracted for. Because thefranchisee uses a common trademark, this behavior depreciates the reputationand hence the future profit stream of the franchisor.
These statements highlight the fact that the individual franchisee’s incen-tives are not aligned with those of its franchisor: the profit-maximizing be-havior of an individual franchisee can have adverse external effects on thefranchisor and other franchisees as well.126 Thus, a donut shop owner mightreduce costs, and so enhance profits, by selling rather than throwing away
125 Tannenbaum and Mehta (1997) mention the case of Fernando Galaviz, an Hispanic whosaid he refused to book any travel with one national hotel chain because he and somecolleagues “experienced specific racist attitudes” at one of the chain’s hotels. AlthoughMr. Galaviz said he realized that he might be penalizing non–racist franchisees in theprocess, he felt that he was justified in doing this as “They’re all part of the samefamily.”
126 For further analysis, see Dnes and Garoupa (2005). Note that the racist behavior men-tioned in the previous footnote may be better explained by franchisee utility maxi-mization rather than profit maximization, that is, the franchisee might be focused onwhat makes him happy rather than his profit. However, utility maximizing behavioris necessarily constrained in highly competitive markets where other firms focus onprofits.
P1: KaD0521772524c05.xml CB802/Blair 0 521 77252 4 April 30, 2005 12:32
5.1 Introduction 119
donuts that are no longer completely fresh. Such a strategy, in turn, is morelikely to be profitable if most of his customers are transient: knowledgeablelocal customers would be unlikely to continue to patronize a place with lowquality. At the same time, the more transient consumers are, the more thismisbehavior will hurt the franchisor and other franchisees as it depreciatesthe value of the franchisor’s trademark.
Franchisees can hurt the franchise system not only by using lower costproducts or not observing performance requirements, but also by cateringtoo much to the needs of their local market or by refusing to implementsystem-wide innovations. While local responsiveness can have positive ef-fects on a unit’s profits and be a source of innovative ideas for the systemas a whole, local changes and adaptation affect the uniformity of the chainand can have a detrimental effect on the value of the brand. For example, ifMcDonald’s franchisees offer “Cajun burgers” in New Orleans, “teriyakiburgers” in Honolulu, and “Tex-Mex burgers” in San Antonio, consumerswill not know what to expect at a McDonald’s in San Francisco or St. Louis.Given customer risk aversion, such uncertainty might result in lower system-wide sales.
Uniformity also brings with it several operational advantages.127 First, uni-form operations across outlets increase the opportunities for economies ofscale in procurement and marketing. Second, uniform operations make iteasier and less costly to develop and introduce new processes and products.If franchisees individualize their outlets, then procedures developed by thehead office to increase productive efficiency or for the introduction of newproducts and production processes will not necessarily be adaptable in eachfranchised outlet. Finally, uniformity facilitates comparisons across outletsand thereby reduces learning and monitoring costs. More specifically, themore similar outlet operations are, the more useful will be the sales, cost,and best practices information that franchisors can collect from all of theoutlets in their chains. Franchisors can then use this information to evaluateindividual outlets and/or disseminate it throughout the system and therebyfacilitate learning by franchisees and managers.128
For all these reasons, franchisors care about maintaining uniformity. Tothis end, they exercise control over many important aspects of the franchisee’sbusiness, including appearance, hours of operation, location, and product
127 See Kaufmann and Eroglu (1998).128 See, e.g., Bradach (1998), p. 24. In Chapter 5 of his book and on several other occasions
in it, the author also notes how comparisons between the company and franchisedsides of these chains can be used to more effectively manage these chains.

P1: KaD0521772524c05.xml CB802/Blair 0 521 77252 4 April 30, 2005 12:32
120 Quality Control
quality.129 A major function of the franchise agreement under these circum-stances is to specify contractual provisions that will remove or at least mitigatethe fundamental incentive issue that arises because franchisees care about theirown outlets’ profits while the franchisor cares about system profits. Almostall franchise contracts contain specific provisions concerning expected fran-chisee performance. In fact, most franchise contracts incorporate by referencethe whole set of directives contained in a very thick and detailed operationsmanual. Further, the contracts provide for the franchisor’s right to moni-tor the performance of the franchisee through inspections, audits, mysteryshopper programs, and so on. Most contracts also give franchisors the rightto terminate the contract unconditionally or for good cause.130 Finally, theterms of franchise contracts typically give rise to ex-post rent, namely amountsof money that the franchisee can earn within the relationship that are abovewhat he could earn in his next best alternative. The amount of such rent insome chains is simply limited to the up-front franchise fee and potentiallysome other specific investments. In other words, the franchisee may only beable to earn quasi-rents on his operations that are just sufficient in total overthe duration of the contract to compensate him fully for the franchise feeand the other sunk costs he incurred to join the chain. In order to recoupthese investments, however, the franchisee will need to remain in the system –termination would mean he would lose the opportunity to earn the quasi-rentand thereby recoup his investments. But the rent need not be limited to theamount of such payments. All that matters from an incentive perspective isthat the franchisee be better off remaining within the franchise relationshipat any point in time in the contract period than moving on to the next bestalternative use of his time and capital.131 If the franchisee earns such rents,
129 There are a few notable exceptions, such as conversion franchises like Best Western inthe hotel industry and Embers America in the restaurant industry, and other franchiseconcepts such as the Great Harvest Bread Co. that cater to franchisees and customerswho value local flavor (and hence these chains consistently offer such flavor). EmbersAmerica, for example, recruits owners of existing restaurants. To be attractive to suchowners, they allow franchisees to “maintain their individuality and blend that with ourmarketing, purchasing, technology and other programs” (Walkup 2001). Still, suchconcepts have various criteria that franchisees must meet for consistency purposes.Thus, Embers restaurants must have the Embers signage, use the merchandising ma-terials of the system, and include Embers’ signature menu items on their menus. Therestaurants are allowed to maintain different looks, store sizes, additional menu itemsand other touches that have worked for them in their markets.
130 We discuss termination in detail in Chapter 10.131 See Kaufmann and Lafontaine (1994) for the calculation of positive rents both ex post
and ex ante at McDonald’s and for more discussion of their incentive effects; see alsoKlein (1995) on the fact that it is the amount of rent that matters for incentives, notthe amount of specific assets.
P1: KaD0521772524c05.xml CB802/Blair 0 521 77252 4 April 30, 2005 12:32
5.2 A Simple Model of Vertical Externalities 121
then he has something to lose from termination. This, in turn, will make himtry to keep the likelihood of termination low, which requires that he abideby the rules imposed by the contract even if such rules prevent him frommaximizing his short-term operating profits.
The rest of this chapter is organized as follows. In the next section, wepresent a simple model that illustrates the fundamental incentive misalign-ment problem generated by the use of the common brand name. We thenexamine how contractual performance requirements, product specification,tying, and vertical integration can be used to resolve this incentive problem.We describe how each of these mechanisms works and the costs of using themto solve this incentive problem. We then briefly look at the limited empiricalevidence on the effect of franchising on quality and offer some concludingcomments.
5.2 A Simple Model of Vertical Externalities132
In this section, we present a simple model that illustrates the externalityproblem that arises under common branding in franchising. Suppose thatthe franchisor has licensed exactly one franchisee in each of several distinctgeographic markets. This, of course, means that each franchisee has a lo-cal monopoly on the distribution of the franchised good, which is differ-entiated from other substitute products by the goodwill associated with thetrademark. In many instances, such as in gasoline retailing, the differencesbetween the brands may not be great. But in other cases, as in car deal-erships for Ford and Toyota, for example, the differentiation may be morepronounced. In the fast-food sector, Kalnins (2003) and Thomadsen (2005)examine the prices charged at a number of individual outlets at McDonald’sand Burger King among others, and specifically analyze how the prices set ata given outlet relate to prices set at other outlets within and across chains.They both find evidence that cross-chain competition is relatively weak, im-plying that the amount of differentiation due to branding is quite large in thisindustry.
For present purposes, the degree of monopoly power enjoyed by a fran-chisee in his market is not important: we simply need the franchisees operatingunder the common brand to have some market power. Let
P = [P1, P2, . . . , Pn]
represent the vector of output prices set by the individual franchisees fortheir product. In some instances, the franchisor may try to control these
132 This section relies largely upon Blair and Kaserman (1994).
P1: KaD0521772524c05.xml CB802/Blair 0 521 77252 4 April 30, 2005 12:32
122 Quality Control
prices, but there are legal problems associated with franchisors controllingfranchisee prices.133 Thus, pricing decisions are usually in the hands of thefranchisees. We assume also that franchisees control various other decisionsin their outlet that affect the quality of the good or purchase experience thatthey offer customers. The quality of the products sold by the n franchiseescan be represented by the following vector:
q = [q1, q2, . . . , qn].
If franchisees all chose the same quality level, then q i = q j for all i, j. Weposit that franchisee profits depend upon the prices and qualities in the entiresystem:
πi = πi(P , q) i = 1, 2, . . . , n.
The externalities are captured by the partial derivatives of π i:
∂πi/∂ P j < 0 and ∂πi/∂q j > 0, i �= j.
We are assuming for simplicity that the n franchisees are located in n sep-arate geographic markets and, therefore, the external effects arise only fromthe use of a common trademark.133 The assumptions that ∂π i/∂P j < 0 and∂π i/∂q j > 0 capture the following influences: if a single franchisee raises itsprice or reduces its quality in its own market, the profits earned by all otherfranchisees in their own markets will fall. These external effects exist becausea consumer’s experience at one franchised outlet influences that consumer’sdecision of whether to patronize another outlet of the same franchised sys-tem in a different geographic location. If consumers are disappointed withtheir experience at one outlet because of an unexpectedly high price or un-expectedly poor quality, they will tend to shy away from other outlets of thesame franchise system. Offering quality, however, is costly. Because quality iscostly to the franchisee offering it, we assume that each franchisee’s revenuesincrease at a decreasing rate with quality. Hence, there exists a quality levelq j
∗, where ∂π j/∂q j = 0, that maximizes each franchisee’s profits.Finally, we assume that the franchisor receives a proportion k of the profit
earned by each of its franchisees, and that this proportion is the same for
133 See Chapter 7 on the issue of maximum resale prices. Minimum resale prices are illegalper se under U.S. antitrust laws; see Blair and Kaserman (1985).
133 What we really need is that the externality that arises from common branding be moreimportant than any within-chain competitive effect. This should be the case if joiningthe chain is to be worthwhile for franchisees.

P1: KaD0521772524c05.xml CB802/Blair 0 521 77252 4 April 30, 2005 12:32
5.2 A Simple Model of Vertical Externalities 123
all franchisees.134 As a result, the franchisor’s total profit from the franchisesystem is
� =n∑
i=1
k[πi (P , q)]. (1)
We are now in a position to examine analytically the problem of incom-patible incentives. The fundamental conflict of incentives that exists betweenthe franchisor and its franchisees concerning product quality can be shownby proving the following proposition.
Proposition 1. Under a franchise contract, the franchisee who owns a singleunit will have a profit incentive to provide a lower level of quality than thatwhich maximizes the franchisor’s profit.
Proof. Maximization of the franchisor’s profits as per equation (1) requiresthat quality levels across the franchise system be set such that
∂�
∂q j=
n∑i=1
k∂πi
∂q j= 0, j = 1, . . . , n. (2)
We can write (2) as
k∂π j
∂q j= −k
n∑i=1i �= j
∂πi
∂q j(3)
or more simply
∂π j
∂q j= −
n∑i=1i �= j
∂πi
∂q j. (4)
Equation (4) implies that
∂π j
∂q j< 0 (5)
since ∂π i/∂q j > 0 for i �= j . In other words, at the franchisor’s profit max-imizing level of quality, each franchisee has a profit incentive to reduce its
134 From Chapter 3, we know that franchisors are much more likely to charge franchiseesa fee that is a proportion of their sales rather than profits. Making the assumption thatthe fee is a proportion of profits, however, allows us to introduce less notation andsimplify the exposition tremendously, and the conclusions we draw are qualitativelythe same as if we assumed a sales-based fee.
P1: KaD0521772524c05.xml CB802/Blair 0 521 77252 4 April 30, 2005 12:32
124 Quality Control
quality towards q j∗, where ∂π j/∂q j = 0. This completes the proof of Propo-
sition 1. Moreover, while the proposition is in terms of a single-unit franchiseowner, it remains valid as long as the franchisee does not own all of thefranchisor’s units.135 �
Note that an analogous incentive conflict exists with regard to the pricecharged by the franchisees. This conflict is stated in the following proposition:
Proposition 2. Under a franchise contract, the franchisee will have a profitincentive to charge a price above that which maximizes the franchisor’s profit.
In this case, at the set of prices that maximizes the franchisor’s profits,
∂π j
∂ P j> 0. (6)
In other words, each franchisee has an incentive to raise its price at the expenseof the rest of the franchise system. The proof of this Proposition proceeds ina completely analogous manner. We examine pricing conflict and controls inChapter 7.
As for quality issues, Proposition 1 implies that a franchisee cannot be leftfree to select the product quality that maximizes its profit as this underminesthe profitability of the franchise system as a whole.136 This creates a need forsome vertical controls that will more closely align the interest of each indi-vidual franchisee with those of the other franchisees and of the franchisor.The greater the effect of each franchisee’s choice of quality level on other fran-chisees’ profits, that is, the stronger the externality effects, the more importantit will be for the franchisor to establish strong vertical controls. Conversely,the lower these effects, namely the more repeat customers franchised outletsface, the less important it will be for the franchisor to devise such controls.Brickley (1999) uses data from a large sample of franchised chains to examinethe likelihood that firms use certain types of controls, specifically that theyimpose restrictions on passive ownership, mandate advertising expenditures,and rely on area development agreements. He finds that firms rely on thesetypes of controls more often if they operate in industries that cater to mobileas opposed to mostly repeat customers. He also argues that franchised units
135 The incentive incompatibility problem becomes less severe the larger the number ofunits that the franchisee owns, which is why multi-unit ownership can solve at leastpart of the incentive incompatibility problem.
136 For a detailed account, including a comparison of control policies at McDonald’s andBurger King, see Makar (1988).

P1: KaD0521772524c05.xml CB802/Blair 0 521 77252 4 April 30, 2005 12:32
5.3 Contractual Efforts to Resolve Incentive Problems 125
are more likely to be affected by decisions made at other outlets if they aregeographically close together as this increases the likelihood that the same pa-trons could frequent the different outlets. Consistent with his arguments, hefinds that firms whose outlets are more geographically concentrated tend touse passive ownership restrictions and mandatory advertising requirementsmore often.
The use of various controls, however, can create tension and friction be-tween the franchisor and its franchisees. These contractual controls chafefor two reasons. First, they limit the franchisee’s ability to behave oppor-tunistically. Second, and perhaps most importantly, these controls reduce thefranchisee’s independence and limit his capacity to personalize his businessand cater more specifically to his local clientele.
Yet, franchisees clearly benefit from having these controls exerted on theother franchisees in the chain. In fact, franchisees request franchisor inter-vention when they are aware of other franchisees who are not “doing theirjob.” Bradach (1998: 130–131) quotes a franchisee saying “if someone is run-ning a poor operation it hurts the chain and it hurts my business . . . it isthe job of the chain operator to get on the people running a shoddy op-eration.” In all fairness, each franchisee must accept then that the samecontrols be applied to him as to all other franchisees. Milton Gurwitz, aSubway franchisee in Bellingham, Massachusetts, put it simply: “If you’rea free-spirited person and want to do it your own way . . . you don’t buy afranchise.”137
5.3 Contractual Efforts to Resolve Incentive Problems
There are a number of contractual provisions that are designed to deal withquality control problems, such as specific performance clauses, product spec-ifications, and input purchase requirements. Ultimately, the franchisor alsocan choose to resolve the quality issues by owning and operating outlets di-rectly rather than franchising them. We discuss each of those options in thissection. It should be clear at the outset, however, that none of these optionsrepresents a perfect solution to the control problem. For one thing, some ofthese vertical control mechanisms are legal while others are not. Moreover,none of them are free. Consequently, by using these controls, the franchisorwill achieve profits that only approximate those that are possible in a perfectworld of voluntary compliance among franchisees.
137 Quoted in Flaherty (2001).

P1: KaD0521772524c05.xml CB802/Blair 0 521 77252 4 April 30, 2005 12:32
126 Quality Control
5.3.1 Specific Performance Clauses
Not surprisingly, incentive incompatibility regarding the franchisee’s choiceof product quality motivates each franchisor to include quality control mech-anisms in their franchise contract directly. In other words, the franchisor willattack the incentive incompatibility problem by reducing the managerial dis-cretion retained by each franchisee. Thus, franchisors often specify that theyare allowed to dictate the exact set of products to be sold, the hours of opera-tion, the type of information system to be used by the franchisee in runningits business, and so on.
For example, McDonald’s operates the most extensive fast-food restaurantchain in the world. By 2002, it had more than 30,000 restaurants worldwide,and around 70 percent of them were franchised while the others were corpo-rate outlets. The golden arches are literally everywhere. At each McDonald’s,however, one can expect basically the same overall experience. McDonald’sfranchise agreement itself points to the central importance of uniformity. Itstates that “[t]he foundation of the McDonald’s System and the essence ofthis Franchise is the adherence by Franchisee to standards and policies ofMcDonald’s providing for the uniform operation of all McDonald’s restau-rants within the McDonald’s system . . .” (emphasis added). These standardsand policies are spelled out in detail in its operations manual, which it up-dates regularly and includes by reference in its franchise contract: “Licenseeagrees to promptly adopt and use exclusively the formulas, methods, andpolicies contained in the business manuals now and as they may be modifiedby McDonald’s from time to time” (McDonald’s “Franchise Agreement,” asincluded in McDonald’s Uniform Franchise Offering Circular, 2003).
From very early on, Ray Kroc, the founder of McDonald’s System Inc.,understood how vital uniformity was to the success of his enterprise. Butdespite his best efforts to convince and control his franchisees, he foundthat his California franchisees “were experimenting with new products, newprocedures, and new (and higher) prices. Few maintained the high standardsof quality and cleanliness that the (McDonald’s) brothers had established . . .”(Love 1986: 68). Similarly, the Rolling Green franchisees – those small andmedium business owners that Ray Kroc knew from his country club and towhom he turned when he needed investors – insisted on broadening the menu,increasing prices, and so on. Kroc reacted to these problems by refusing torenew licenses or refusing to grant new franchises to existing franchisees, or,in the case of egregious deviations from Quality, Service, Cleanliness (QSC)standards, suing franchisees for breach of contract. These types of reactionswere unheard of in franchising at the time. Kroc faced these types of problems

P1: KaD0521772524c05.xml CB802/Blair 0 521 77252 4 April 30, 2005 12:32
5.3 Contractual Efforts to Resolve Incentive Problems 127
again later in the international arena, in particular with Raymond Dayan, whohad bought an exclusive license for Paris:
McDonald’s in Paris was considered “a QSC wasteland” by everyone else in thesystem. The company’s strict specifications on food products had been blatantlyignored. Hamburgers were prepared without all of the standard ingredients.Food was held so long and served so cold that McDonald’s managers inspectingthe stores found it difficult to eat . . . the stores were so unclean that McDon-ald’s franchisees elsewhere around the world began hearing complaints aboutthem from their own local customers who had seen Dayan’s units while vis-iting Paris. . . . George Cohon, the president of McDonald’s of Canada, wrotea letter . . . about Paris, insisting that “it is time to remove the cancer.” (Love:409–410)
Cohon attempted to negotiate a buyout of Dahan’s license. When Dayanrefused, McDonald’s terminated his license, and Dayan sued in Illinois court.In the court’s 1982 decision, Judge Curry found for McDonald’s, rejectingDayan’s claim that McDonald’s was trying to pocket the profits of the Parisoperations:
Far more realistic . . . is the conclusion that McDonald’s herculean effort in thiscase is motivated by a zeal to rid itself of a cancer within its system before itgrows and further infects the 6900 store organization . . . if Dayan, the grade ‘F’operator in Paris, can thumb his nose at the system and its standards, then sotoo can operators everywhere. (Quoted in Love: 410)
This was McDonald’s most significant QSC victory. Combined with a num-ber of other decisions regarding termination, non-renewal, and its policy ofcontrolling the real estate of its stores, McDonald’s set numerous precedentsand convinced the courts that for franchising to function properly, franchisorsmust be allowed to control their franchisee’s behavior and impose sanctionson those that do not abide by the rules set forth in the contract.138
Similarly, Doctor’s Associates, Inc., which is the franchisor of the Sub-way restaurant chain, imposes controls on its franchisees. In particular, thefranchise agreement itself contains a number of controls on the managerialdiscretion of its franchisees. In addition, as for McDonald’s, the franchiseemust agree to operate the business “in accordance with our [Subway’s] Op-erations Manual . . . which contains mandatory and suggested specifications,standards, and operating procedures, which may be updated from time totime as a result of experience, or changes in the law or marketplace.” More-over, “[t]he Operations Manual, as amended from time to time, is intended
138 See Love (1986), especially Chapter 16 of that book, for a detailed account.

P1: KaD0521772524c05.xml CB802/Blair 0 521 77252 4 April 30, 2005 12:32
128 Quality Control
to further the purposes of this Agreement and is specifically incorporatedinto this Agreement” (Subway “Franchise Agreement,” as incorporated in itsUniform Franchise Offering Circular, 2002).
McDonald’s and Subway are not unusual in including their operationsmanual by reference in their franchise contract – many franchisors do justthat. The contract also typically includes more general statements about bestefforts. Dnes (1992a: 269) cites a Midas Franchise Agreement: “The franchiseeshall diligently carry on the said business at the said premises and shall useits best endeavours to promote and extend the said business. . . .”
As McDonald’s experience makes clear, however, specifying what the fran-chisee must do does not eliminate the franchisee’s incentive to deviate from theprescribed behavior. Therefore, there must also be monitoring – audits, mys-tery shopper programs, and so on – and some sanctions for noncompliance.Dnes (1992a) and Bradach (1998) provide detailed accounts of the businesspractices of nineteen British and five U.S. franchised chains, respectively. Bothshow that noncompliance is dealt with generally under what Bradach refers toas “proportional response.” In other words, noncompliance on minor issuesis tolerated so that the chain can focus on those deviations that matter mostto the value of the business. Bradach offers the following example:
[D]uring an interview a Pizza Hut franchisee asked me if the vice-presidentof franchising (whom I had interviewed earlier that day) mentioned anythingabout the nonstandard window shades the franchisee had recently installed. Hesaid that the franchise consultant “has been after me for awhile, and I wonderedhow big a deal they were going to make of this.” Later, when I talked to thevice-president of franchising again, he said, “I might send him a letter, but itisn’t a giant issue. As long as it doesn’t affect the consumer on a day-to-day basis,we just keep up the pressure but we won’t push it.” (101)
Bradach also cites Dave Hoban, an area director of franchising at Hardee’s:“You don’t want to burn your goodwill bothering franchisees with little things.There are too many big issues that we have to deal with – like convincing themto install new ovens – to get caught up in the little ones” (102). Dnes (1992a)notes, “Mr. Rowntree of Mobiletuning . . . states that it is not worth his whileto police minor infringements of the agreement” (283).
When faced with more important deviations from performance standards,franchisors will “quote the contract” and try to get franchisees to conform. Ifthat does not yield the desired result, franchisors will at some point suggestthat a franchisee leave the system, by selling to another franchisee or backto the franchisor, as McDonald’s tried to do in the case of Raymond Dayan.Even if such a sale is constrained by the franchisor’s insistence that it occur

P1: KaD0521772524c05.xml CB802/Blair 0 521 77252 4 April 30, 2005 12:32
5.3 Contractual Efforts to Resolve Incentive Problems 129
relatively quickly, the franchisee can sell the unit at a price that captures at leastsome of the future expected profits associated with the business. The ultimatethreat or sanction, however, is termination. If his franchise is terminated, thefranchisee loses the entire present value of the profits that he could have earnedby operating the franchised outlet rather than using his time and capital intheir next best alternative. If the present value of those profits exceeds the(expected) profits that can be earned by engaging in the kind of cheating onquality that could lead to termination, this type of cheating will be deterred;otherwise, cheating on quality will occur and franchise terminations will benecessary.139
Coupled with these penalties for noncompliance, the performance stan-dards are designed to make it unprofitable for a franchisee to deviate fromthe product quality that is optimal from the perspective of the franchise sys-tem as a whole. The higher the penalties are, and in particular the more rentfranchisees are apt to lose if they are terminated, the more likely franchisorswill be successful in preventing major deviations from the business formatby franchisees. Kaufmann and Lafontaine (1994) used data from McDonald’searnings claims in their disclosure documents to calculate the expected profitsper outlet at McDonald’s. They found that in 1982, franchisees at McDonald’scould expect to earn economic profits of between $300,000 and $450,000 onaverage over the life of the contract for each new outlet they purchased.140 Inother words, franchisees at McDonald’s had a lot to lose if they were deniedexpansion rights. Ex post economic profits were, of course, even higher, atabout $600,000 on average after taxes, as ex post economic profits include theex ante amounts plus all initial fees and specific investments. In other words,the average franchisee stood to lose $600,000 upon termination. With suchamounts of money at stake, McDonald’s is able to exert significant controlover their franchisees’ operations.
5.3.2 Product Specifications
In addition to specifying performance requirements such as hours of opera-tion, cleanliness standards, management information systems, and so on, the
139 Deviations will occur also if franchisees expect that franchisors will not terminate orwill not be allowed by the courts to terminate noncompliant franchisees. This bestexplains why Dayan refused the buy-back offer.
140 See also Michael and Moore (1995) for evidence of rent in other franchised sys-tems, and Lafontaine and Raynaud (2002) for an argument that such rent, combinedwith the threat of termination, complement residual claims in providing incentives tofranchisees.
P1: KaD0521772524c05.xml CB802/Blair 0 521 77252 4 April 30, 2005 12:32
130 Quality Control
franchisor can affect quality by using precise contractual language to limitthe franchisee’s discretion regarding the products and services it can use. Thisagain does not remove the incentive to reduce quality for private gain, but itdoes limit the franchisee’s discretion and provides grounds for termination ifthe franchisee behaves opportunistically.
For example, at Subway, the franchisee must agree to adhere to Subway’squality control standards regarding goods and services sold to the customer.Similarly, uniformity at McDonald’s extends to “serving only designated foodand beverage products” that meet McDonald’s specifications. In this way,McDonald’s can assure quality uniformity for the products sold at all of itsrestaurants. Again, early McDonald’s franchisees did not all abide by these:for example, Kroc accused Richard Picchietti, one of the Rolling Green fran-chisees, of “purchasing inferior food supplies in order to get a cheaper price”(Love, 76). Even Kroc’s first true owner-operator husband and wife franchiseeteam, the Agates – whose undeniable success in the business led a number oftheir peers to become franchisees themselves and helped Kroc identify goodprospects at a critical juncture in the chain’s development, became knownas “price buyers” – franchisees who substituted cheaper products from non-approved suppliers. On particular, Sandy Agate signed a deal with Pepsi to selltheir cola instead of Coke, the only approved cola at McDonald’s. In both thePicchietti and Agate cases, Kroc reacted by denying them the opportunity tobuy additional stores later on. In fact, Agate became known throughout theMcDonald’s system “as the one punished by Kroc for switching from Coketo Pepsi,” although this was not the only reason he was denied the opportu-nity to expand (Love, 85). No other franchisee ever tried to make that switchafter that.
Finally, Anheuser-Busch operates what amounts to a traditional franchisesystem in the form of an extensive network of wholesale beer distributors.141
These distributors buy Anheuser-Busch beer from the nearest Anheuser-Busch brewery and resell the beer to retail accounts – convenience stores,grocery stores, bars, restaurants, and the like. Beer has three enemies: age, heat,and light. To deal with heat as a source of quality deterioration, Anheuser-Busch requires that its beer be kept in temperature-controlled warehousesunder strict guidelines. To deal with age, all beer containers have a date code,and the distributors are required to remove from the market and destroy over-age (i.e., old) beer at their expense. No doubt, there are some distributors that
141 The Anheuser-Busch wholesalers are not technically franchisees, but the wholesale con-tract and obligations of both parties amount to something very similar to a traditionalfranchise.
P1: KaD0521772524c05.xml CB802/Blair 0 521 77252 4 April 30, 2005 12:32
5.3 Contractual Efforts to Resolve Incentive Problems 131
do not like having to incur the cost of meeting these contractual obligations,but they must do so or face penalties, including, ultimately, the possibility oftermination and the associated loss of profits.
5.3.3 Input Purchase Requirements142
In some circumstances, a franchisor may assure quality by imposing a require-ment that franchisees buy certain inputs from it directly, that is, by imposing atying arrangement on its franchisees. In that event, the franchisee is obligatedto buy a package of items from the franchisor that is designed to eliminateopportunities for the substitution of alternative (and, of course, cheaper) in-puts. Unfortunately, despite these requirements, it may still be possible forthe franchisee to supplement the tied inputs or replace them with unautho-rized inputs and dilute product quality. Thus, franchisors need to monitorinput use and punish transgressors even if the contract includes tying clauses.For example, Barnie’s Coffee & Tea Co. sells specialty coffees along with theusual array of coffee mugs, coffee makers, and other supplies. Some of thespecialty coffees are flavored according to the franchisor’s own recipes. Attimes, some franchisees have tried to purchase similar coffees elsewhere (atlower prices) and substitute them for the more expensive coffees supplied bythe franchisor. The franchisor, of course, insists that a franchisee distributeBarnie’s coffee rather than someone else’s coffee.143 The offending franchiseeswere threatened with termination if they insisted on selling coffee suppliedby unauthorized third parties.
The use of tying contracts to assure input quality and consistency andthereby protect the value of the franchisor’s trademark has a long history infranchising. It is also subject to various legal restrictions under U.S. antitrustlaws. In the early 1920s, Sinclair already required its licensed dealers to sellonly Sinclair gasoline from pumps bearing its trademark.144 And while thispractice has been the subject of a number of court cases over time, all major oilrefiners continue to require that lessee dealers operating under their brandssell exclusively their gasoline.145 To the extent that the refiners can control
142 The role of input purchase requirements in franchising is examined in detail inChapter 6.
143 A similar dispute was at the heart of Krehl v. Baskin-Robbins Ice Cream Co., 664 F. 2d1348 (9th Cir. 1982). The franchisee did not want to sell Baskin-Robbins ice cream, butwanted to use the Baskin-Robbins trademark. The court decided against the franchisee,a perfectly reasonable outcome for consumers.
144 Federal Trade Commission v. Sinclair Refining Co., 261 U.S. 463 (1923).145 Redd v. Shell Oil Co., 524 F. 2d 1054 (10th Cir. 1975), and Phillips v. Crown Central
Petroleum Corp., 395 F. Supp. 453 (E.D. Mich. 1975).
P1: KaD0521772524c05.xml CB802/Blair 0 521 77252 4 April 30, 2005 12:32
132 Quality Control
the quality of what they produce, these requirements preserve that qualityat the pump. Some oil companies even extended the requirements to tires,batteries, and accessories as a way, potentially, to assure the quality level of allthe products offered for sale at the dealership. Such requirements, however,were found to be in violation of U.S. antitrust laws. The requirement that thedealers purchase the gasoline from the company under whose name they dobusiness, on the other hand, has traditionally not been considered a tie bythe courts as the trade name and the gasoline in those cases are not reallyseparate products. For the same reason, Baskin-Robbins was able to impose arequirement in its franchise contract that its franchisees buy all their ice creamfrom Baskin-Robbins. But Chicken Delight’s requirement that franchiseespurchase paper products and other similar inputs from it was found to bean illegal tie. The court reasoned that the franchisor could ensure quality byproviding its franchisees with a set of approved suppliers instead of selling theinputs itself, as the inputs and the trade name were two different products.
The practical result of this jurisprudence has been that most business-format franchise contracts rely on approved suppliers rather than tying ar-rangements. Recent court cases have thus been brought against franchisorsnot for tying, but rather for limiting the set of approved suppliers.146 As an ex-ample, consider the dispute in Subsolutions, Inc. v. Doctor’s Associates, Inc.147
All Subway franchisees need a cash register or a computerized point-of-sale(POS) alternative. Most of the franchisees had signed franchise agreementsthat permitted them to make a choice from an array of specific alternatives.Subsequently, the franchisor decided that it wanted all of its franchisees to buythe same POS system, the one designated by Subway. A provider of an alter-native POS system sued Subway on the grounds that it was illegally foreclosedfrom selling its product to Subway franchisees. The district court found thatthe Kodak ruling applied because the franchisor had changed the terms ofits contract without prior disclosure. (See Eastman Kodak Company v. ImageTechnical Service, 1992.) The case subsequently settled. Note that one poten-tial reason for the franchisor’s insistence on uniformity in POS system is theresulting ease of measuring and monitoring franchisee performance.
5.3.4 Vertical Integration
The most extreme reaction to the incentive incompatibility problem regardingquality would be to replace the franchise system with company-operated
146 See, e.g., Queen City Pizza v. Domino’s Pizza, 124 F. 3d 430 (3d Cir. 1997).147 62 F. Supp. 2d 616 (D. Conn. 1999).

P1: KaD0521772524c05.xml CB802/Blair 0 521 77252 4 April 30, 2005 12:32
5.4 Costs of Control 133
outlets, i.e., to employ ownership, as opposed to contractual, integration.In this way, the franchisor might better ensure that quality is not sacrificedto increase the profit of a given franchisee.148 In the context of the modeldeveloped above, it is still true under vertical integration that starting fromthe quality level that the franchisor finds optimal, a reduction in quality atany given location will increase profits at that location, i.e., ∂π j/∂q j < 0 at thefranchisor’s choice of quality. But with vertical integration, there is no one toact on this fact because the manager of each outlet, contrary to the franchisee,typically is not rewarded heavily on the basis of his outlet’s profits. Instead,to obtain desired results, managers of corporate units should be rewarded onthe basis of their contributions to the system as a whole, bearing in mind theexternalities. After all, it is the elimination of the residual claimant status of thefranchisee in the vertical chain that is the distinguishing property of verticalintegration and that reduces the free-riding types of incentive incompatibilityproblems encountered under franchising.
As noted in Chapter 4, Lafontaine and Shaw (2005) have found that fran-chisors with more valuable brands tend to own and operate more of theiroutlets directly. This is consistent with vertical integration being used in partto prevent franchisee free-riding on the more valuable brands. The move to-wards a more vertically integrated structure, however, comes at the cost ofthe store manager’s reduced incentives to work hard – the original shirking ormoral hazard problem that led to franchising in the first place. After all, witha franchisee, the franchisor benefits from the dedication and drive of an indi-vidual who is building a business for himself or herself. And this motivationand drive of the individual franchisee, as compared to the typical companymanager, is a main reason why franchisors use franchising to begin with.
5.4 Costs of Control
As should be clear from our discussion, each of the quality control mechanismsdescribed above has problems of its own. There are costs associated withownership integration, which undermines the desirability of this strategy. Forone thing, managers can still engage in opportunistic behavior. The preciseform that it takes will depend upon the incentive and monitoring systems
148 Katz (1989) points out that vertical integration does not eliminate or resolve moralhazard problems. In a vertically integrated firm, the principal–agent problems thatgave rise to the need for franchising in the first place are likely to be quite severe.The free-riding problems, however, are alleviated because the manager is not a profitmaximizer (assuming his pay is not based largely on his unit’s profits).

P1: KaD0521772524c05.xml CB802/Blair 0 521 77252 4 April 30, 2005 12:32
134 Quality Control
that are in place for them. For example, if each location is treated as a profitcenter, the manager will continue to have an incentive to increase his location’sprofits at the expense of other locations. Moreover, company managers whoare not residual claimants of their outlet’s profits have lower incentives towork hard and make their outlet a success. The vertically integrated firmmust balance these issues to arrive at an appropriate choice of compensationplans. Franchisors also complain about the lack of managerial stability withcompany managers, as the latter change jobs relatively frequently. For anotherthing, managerial diseconomies of scale may increase the cost of operatingoutlets directly in various ways. Finally, the cost of capital may be an increasingfunction of the quantity of capital demanded by the firm. In this event, thevertically integrated firm may face significantly higher capital costs.149
As noted earlier, tying arrangements pose other problems as they may vio-late the antitrust laws and thereby expose the franchisor to litigation costs and,potentially, both civil and criminal sanctions.150 Under some circumstances,tying to assure quality control has been found legal, but there is still some riskof antitrust exposure. As if this were not enough, consider the problems whenthe franchisee employs a multi-input variable proportions production func-tion. In that case, the franchisor would have a far more complicated task ofspecifying the optimal input proportions. These proportions will, of course,change whenever any input price changes. As a result, the provisions of a tyingcontract may be prohibitively complex to negotiate and enforce.
Finally, the monitoring and enforcing of contractual performance stan-dards and product specifications are clearly not free. Periodic inspectionshave to be made to check franchisee behavior and verify what products areused and in what quantities. Moreover, one should anticipate that franchiseeswill resist penalties and/or termination, which means that litigation againmay accompany enforcement efforts as it did for McDonald’s and its Parisfranchisee.151
149 For a further examination of the difficulties associated with vertical integration, seeBlair and Kaserman (1983), at pp. 23–25 and 77–78.
150 As a per se violation of Section 1 of the Sherman Act, tying can be prosecuted by theDepartment of Justice and fines of up to $100 million may be levied on corporations.Further, private suits by franchisees can result in treble damage awards. See Chapter 6of this book for a more detailed treatment.
151 Franchisees often resist quality controls and litigation results in some circumstances.For example, see Wilson v. Mobil Oil Corp., 940 F. Supp. 944 (E. D. La. 1996), and MetrixWarehouse, Inc. v. Daimler-Benz A. G., 828 F. 2d 1033 (4th Cir. 1987). Terminating afranchisee can be especially difficult due to limits imposed by state termination lawsor common law doctrines. See Eaton (1980: 1331–1350) and Chapter 10 of this bookfor more on this subject.
P1: KaD0521772524c05.xml CB802/Blair 0 521 77252 4 April 30, 2005 12:32
5.5 Observed Quality Differentials 135
Efforts to control quality will only succeed if opportunistic behavior isdeterred. As we mentioned above, the ongoing rents that the franchisee canexpect to earn as part of the distribution system act as a “hostage” from anincentive perspective. As Williamson has explained, the use of hostages servesthe interests of both parties and not just the franchisor’s interests.152 Althoughthe loss of the hostage may appear to be a one-sided “unfair” contractualprovision, in fact it simultaneously protects the interests of the franchisorin developing and promoting the goodwill associated with the franchise andthe interests of the franchisees who have invested both their time and moneybased on the market value of that goodwill. Equivalently, according to Klein(1980, 1995), the potential loss of the stream of future profits makes thefranchise contract self-enforcing.
Note that our discussion of the role of rent combined with terminationin resolving the incentive issues inherent in the franchise relationship im-plies that franchisors should terminate only when franchisees are not per-forming according to the terms of their contract. But various state laws havebeen enacted to prevent termination without cause. Such laws presume thatfranchisors terminate contracts opportunistically, namely with the goal ofappropriating the investments of the franchisee rather than to resolve a per-formance problem. We examine the issue of termination and non-renewal indetail in Chapter 10. For now, we note simply that the empirical evidence sug-gests that franchisors on average do not behave opportunistically but insteadterminate poorly performing franchisees. Specifically, using data on 830 fran-chised outlets drawn from the Census Bureau’s “Characteristics of BusinessOwners” database, Williams (1996) shows that greater outlet performance,measured by a higher return on investment, decreases the likelihood of con-tract termination by franchisors. Laws that make termination more difficultthus make it more costly for franchisors to rely on the threat of termina-tion to discipline franchisees and enforce uniform quality standards in thechain.
5.5 Observed Quality Differentials between Companyand Franchised Units
One issue that we have not addressed above is whether we observe franchiseefree riding on quality, which would imply lower observed quality levels infranchised than in company-owned outlets. Empirically, this is a complicatedissue for a number of reasons. First, the decision as to which outlet in a chain
152 Williamson (1983).

P1: KaD0521772524c05.xml CB802/Blair 0 521 77252 4 April 30, 2005 12:32
136 Quality Control
should be franchised and which should be company-owned is not a randomprocess. If, as argued by Brickley and Dark (1987), franchisors systematicallychoose to own those units where free riding would be especially problematicand franchise only those outlets where there is not much scope for free riding,then we would find no difference in quality between the two sets of units ina chain. Second, the various forms of vertical controls described above canbe used by franchisors to generate a very similar outcome for franchised andcompany units. Finally, while franchisees’ ownership of their outlets may leadthem to free ride, it also gives them substantial incentives to succeed. If qualityis partially a result of franchisee effort, then quality might actually be higher infranchised outlets than in corporate stores. In other words, economic theorycan lead to different predictions depending on whether we focus on the basicincentive issue (too little effort) that is solved by having a franchisee ownits outlet, as we did in the agency theory section in Chapter 4, or whetherwe focus on the fact that profit maximizing franchisees who own their outletcan then increase their individual profits through free riding. Our economicmodel in this chapter focused on the latter, but the existence of the formermakes it less likely that we can identify free riding on quality.
Bradach (1998: 109) notes that most of the franchisees and company man-agers he interviewed (in five different fast-food chains) “agreed that the twoarrangements exhibited similar levels of (standard adherence) uniformity.”He adds that for the two firms in his sample that use third-party evalua-tors to assess quality, the average score was 94.6 (out of 100 points) for thefranchised units and 93.9 for the company units in the first chain, and 89.7and 90.6, respectively, in the other chain. Thus, one may reasonably concludethat there is no meaningful quality difference between the two types of units.Finally, Bradach refers a few times to instances where franchisees complainedabout under-performing company outlets, implying that company owned-outlets do not systematically outperform franchised outlets from a qualityperspective.
Michael (2000a) examines the effect of franchising on the quality ratingspublished for restaurant and hotel chains in Consumer Reports. His sampleincludes fully corporate as well as franchised chains. He finds that within nar-row industry segments – steakhouses, family restaurants, and dinner housesin the restaurant industry, and budget, moderate and high-end hotels in thehotel sector – and after controlling for price, chains that use more companyownership display higher quality on average than chains that rely more onfranchising. Note that this result confuses somewhat the notion of quality levelin an absolute sense with deviation from a quality standard no matter what

P1: KaD0521772524c05.xml CB802/Blair 0 521 77252 4 April 30, 2005 12:32
5.6 Conclusion 137
the intended level is. Opportunism or free riding really refers to deviationfrom the intended standard, not to absolute levels.
Finally, Lafontaine and Shaw’s (2005) finding mentioned earlier – thatfirms with a more valuable brand as measured by their advertising expendi-tures on average over time tend to use more company units – is consistentspecifically with the idea that franchisors try to protect their brand by usingmore company units when their brand is more valuable. Note that the causal-ity is reversed between the two studies in Michael (2000a), more companyownership leads to higher quality whereas in Lafontaine and Shaw (2003)it is the more valuable brand (actual or desired) that leads franchisors tochoose a form of governance that affords them more direct control over theunits. In either case, however, the causal effect is predicated on the notion thatcompany managers have fewer incentives to free ride than franchisees do.
All in all, though very limited, the empirical evidence seems consistentwith the concept that free riding, or individual profit maximization by op-portunistic franchisees, is an issue in franchised chains. But Bradach’s casestudies, combined with the low levels of company ownership one finds inmost franchised chains (see Chapter 4), support the idea that franchisorscontrol franchise free riding and associated costs fairly well, and that the in-centive and innovation benefits of having owner operators rather than hiredmanagers outweigh the remainder of these costs in many different contexts.
5.6 Conclusion
Franchising is a pervasive contractual alternative to ownership integrationin geographically dispersed retail and service industries, and it arises for avariety of reasons. These arrangements represent a market response to oneor more problems of vertical control between successive stages of productionwhere the use of an intangible asset is involved. Inherent in the franchiserelationship, however, is incentive incompatibility regarding product quality.In this chapter, we have modeled the problem of incompatible incentives andexamined several ways of reducing, if not resolving, the conflict between theindividual franchisee and the franchise system. In the end, the limited evidencewe have suggests that quality differentials between company and franchisedunits are fairly low in practice. In other words, it appears that most franchisorshave sufficient ways to control franchisee behavior and thus obtain fairlyconsistent operations throughout their chain. This fact is not as surprisingas might first appear. After all, if the outcomes were significantly differentbetween company and franchised outlets along a dimension as central to
P1: KaD0521772524c05.xml CB802/Blair 0 521 77252 4 April 30, 2005 12:32
138 Quality Control
these chains as outlet-level quality, one would expect that franchisors wouldalways choose the organizational form yielding the better, or perhaps evenmore important, the most consistent level of quality. Instead, the coexistenceof company and franchised outlets in most chains suggests that in some basicsense, these two modes of organization yield comparable outcomes from thefranchisor’s perspective.

P1: KaD0521772524c06.xml CB802/Blair 0 521 77252 4 April 30, 2005 12:43
6
Franchise Tying Contracts
6.1 Introduction∗
A tying contract is a vertical restraint that involves a conditional sale. Inits simplest form, the producer of product A agrees to sell that product,but only on the condition that the buyer also purchase product B. In thisscenario, product A is the tying good while product B is the tied good. Thesituation can be more complicated, involving possibly a collection of tiedgoods rather than just one. Moreover, tying may involve services and otherintangibles, or extend to leases as well as sales. Finally, the tying arrangementmay involve third parties, that is, the buyer of A may have to buy the tiedgood B from a designated third party rather than from the seller of A. In allof these scenarios, however, the essence of tying is the condition that limitsthe buyer’s freedom to purchase the tied good(s) wherever he deems optimalfrom his own perspective.
In the franchising context, the alleged tying good is usually the franchiselicense, which is normally subject to intellectual property protection. Thetied goods may be other goods that are resold with little modification or theymay be inputs into the production of a final good. An example of the formerwould be branded products such as Baskin-Robbins ice cream or Shell gaso-line. The Baskin-Robbins franchisor licenses its franchisee on the conditionthat it buy Baskin-Robbins ice cream for resale. Business format franchisors,such as Domino’s Pizza, provide an example of the latter as they may li-cense their franchisees on the condition that they buy certain inputs fromthe franchisor or a designated supplier. Domino’s, for example, may requirethat its franchisees buy pizza dough and perhaps other ingredients necessaryfor a real Domino’s pizza from Domino’s or from a designated third party.
∗ This chapter relies heavily on Blair and Herndon (1999) and Blair and Kaserman (1978).
139
P1: KaD0521772524c06.xml CB802/Blair 0 521 77252 4 April 30, 2005 12:43
140 Franchise Tying Contracts
Table 6-1 shows the frequency of mandatory purchase requirements inbusiness format franchising in 1988 and 1989, the only years for which in-formation on such requirements is available for some subset of firms in ourdata.153 Not surprisingly, we find that franchisors involved in various typesof retailing, including those in the Health and Fitness sector and the FoodRetail sector, tend to impose such requirements rather frequently. Franchisorsthat provide mostly services, on the other hand, such as those in the Busi-ness, Hotel and Motel, Rental, and Real Estate services sectors, typically donot require that franchisees buy any inputs from them. On average, about 30percent of franchisors impose some supply restrictions on their franchisees.Michael (2000b) has examined the disclosure documents of 100 restaurantand fast-food franchisors to provide more detailed evidence on tying in thesesectors. Of the 100 chains whose documents he analyzed, he found that 30imposed a requirement that the franchisee purchase some product from thefranchisor. In other words, tying occurs with the same frequency in thesesectors as it does on average in all franchises sectors. Franchisors that usedtying were found disproportionately among the chicken, pizza, sandwiches,seafood, and sit-down restaurant chains while very few hamburger and hotdog chains and Mexican restaurants had such requirements. Among the 30firms with purchase requirements, he found that on average the amount ofpurchases that were required represented about 8.4 percent of all the whole-sale purchases of the franchisees. Most of the franchisors in the chicken, pizza,and seafood fast-food sectors, however, only imposed requirements for spices,batter, or sauces. Firms with the largest proportions of wholesale purchasessubjected to a tie tended to be those that sold some proprietary products,such as batter for pancake houses, bread for sandwich shops (Subway), or icecream for family restaurants (e.g., Brigham’s and Howard Johnson).
In Chapter 4 we showed that through the judicious use of a tying contract,a franchisor can induce the same input usage and the same final outputthat would result under ownership integration if the downstream market iscompetitive.154 At that stage, we assumed that there was only one downstreaminput, and that the production function was such that the franchisee hadto use one unit of the franchisor’s input for each unit of output, so he hadno opportunity to substitute away from the franchisor’s high-priced input.
153 The data are obtained from Bond’s Franchise Guide 1989 and 1990–91 editions, respec-tively, for 1988 and 1989. As only a subset of the firms described in the EntrepreneurFranchise 500 – our main source of data for 1988 and 1989 – also appear in the corre-sponding Bond publication, our sample sizes for this variable are reduced to 643 and630, respectively.
154 See Blair and Kaserman (1978) for a detailed proof.
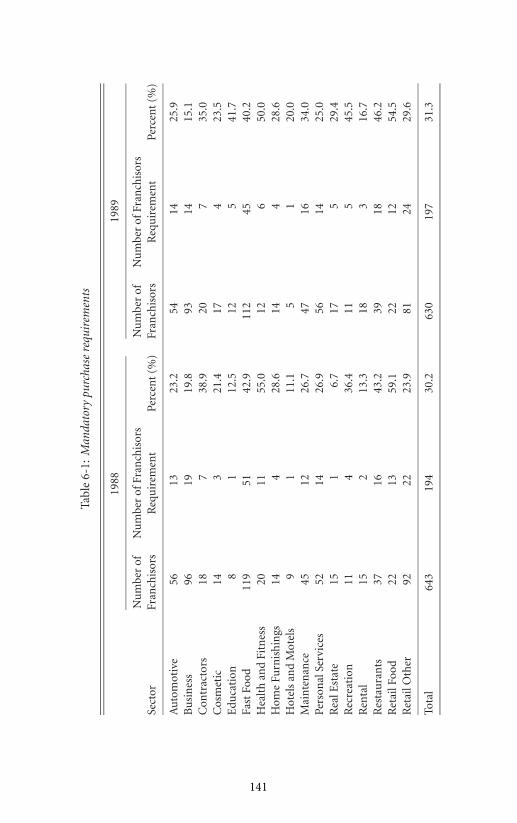
P1: KaD0521772524c06.xml CB802/Blair 0 521 77252 4 April 30, 2005 12:43
Tabl
e6-
1:M
anda
tory
purc
hase
requ
irem
ents
1988
1989
Nu
mbe
rof
Nu
mbe
rof
Fran
chis
ors
Nu
mbe
rof
Nu
mbe
rof
Fran
chis
ors
Sect
orFr
anch
isor
sR
equ
irem
ent
Perc
ent
(%)
Fran
chis
ors
Req
uir
emen
tPe
rcen
t(%
)
Au
tom
otiv
e56
1323
.254
1425
.9B
usi
nes
s96
1919
.893
1415
.1C
ontr
acto
rs18
738
.920
735
.0C
osm
etic
143
21.4
174
23.5
Edu
cati
on8
112
.512
541
.7Fa
stFo
od11
951
42.9
112
4540
.2H
ealt
han
dFi
tnes
s20
1155
.012
650
.0H
ome
Furn
ish
ings
144
28.6
144
28.6
Hot
els
and
Mot
els
91
11.1
51
20.0
Mai
nte
nan
ce45
1226
.747
1634
.0Pe
rson
alSe
rvic
es52
1426
.956
1425
.0R
ealE
stat
e15
16.
717
529
.4R
ecre
atio
n11
436
.411
545
.5R
enta
l15
213
.318
316
.7R
esta
ura
nts
3716
43.2
3918
46.2
Ret
ailF
ood
2213
59.1
2212
54.5
Ret
ailO
ther
9222
23.9
8124
29.6
Tota
l64
319
430
.263
019
731
.3
141

P1: KaD0521772524c06.xml CB802/Blair 0 521 77252 4 April 30, 2005 12:43
142 Franchise Tying Contracts
This assumption reasonably describes gasoline or car retailing where eachdealer sale must involve a unit of the franchisor’s input. In the appendix tothis chapter, we revisit the economic equivalence between vertical integra-tion and input tying in the more general case of several downstream inputsthat franchisees can use in variable proportions. We show that the economicequivalence between vertical integration and tying continues to hold un-der these conditions as well, provided that the downstream market remainscompetitive.155
Using an agency-theory perspective, we also showed in Chapter 4 thatthere are benefits associated with having highly motivated owners manag-ing a chain’s outlets and we argued that these benefits are what lead fran-chisors to choose franchising rather than corporate ownership. But corporateownership remains a very feasible way to organize a chain of geographicallydispersed outlets: Starbucks, for example, is not a franchise. It is important torealize that judicial hostility toward the kind of vertical controls used generallyin franchise contracts, which of course include tying, may tilt more franchisorstoward a greater degree of vertical integration. This outcome would be a per-verse result of an antitrust effort to protect franchisees as it would reduce theset of franchised opportunities for potential and existing franchisees alike.
The rest of this chapter is organized as follows. In the next section, weexamine what tying is and how it is treated under U.S. antitrust policy. Wethen review the major franchise tying cases and their outcomes. As Kodak156
represented somewhat of a shift in the antitrust treatment of tying, specif-ically in the market power and market definition aspects of these cases, wediscuss the Kodak case and its relationship to more recent franchise cases inthe following sections. We next consider the argument made in many fran-chise tying cases that tying represents a form of post-contractual franchisoropportunism. Finally, we revisit the issue of franchisee evaluation of franchiseopportunities in light of the possibility of explicit or implicit ties in franchiseagreements and offer a few concluding remarks.
6.2 Antitrust Treatment of Tying Contracts in General
To the extent that tying benefits the franchisor at the franchisee’s expense, thereis apt to be conflict and, given the current status of tying under antitrust, such
155 The incentive of firms to vertically integrate when they face variable proportionsin downstream production was pointed out by Vernon and Graham (1971), whichspawned a revival of interest in the theory of vertical integration.
156 Eastman Kodak Company v. Image Technical Service (1992).
P1: KaD0521772524c06.xml CB802/Blair 0 521 77252 4 April 30, 2005 12:43
6.2 Antitrust Treatment of Tying Contracts 143
conflict can give rise to an antitrust suit.157 After all, tying contracts restrainthe freedom of the contracting parties just as all contracts do. If a tying con-tract unreasonably restrains trade, it violates Section 1 of the Sherman Act.158
From its earliest decisions, the Supreme Court has displayed a hostile attitudetoward tying contracts. In fact, the Court’s rulings in Northern Pacific Railwayv. United States (1958) and Fortner Enterprises v. United States Steel Corpo-ration (1969) endorsed a harsh rule of per se illegality. Although subsequentdecisions – United States Steel Corporation v. Fortner Enterprises (1977) andJefferson Parish Hospital District No. 2 v. Hyde (1984) – appeared to soften thisattitude and move the Court toward a rule of reason approach to tying, itsmost recent decision in Eastman Kodak Company v. Image Technical Services(1992) reconfirmed its earlier rulings that tying remains illegal per se.
As used in price-fixing cases, per se illegality means that the plaintiff needonly prove the fact of price fixing for a finding of illegality. There is no needto assess the actual economic impact as it is presumed to be deleterious,which is an economically sensible view of price fixing. When it comes totying contracts, however, the per se label is a bit misleading. In fact, extensiveeconomic analysis is required to prove that a tying contract is illegal. Thereare five elements to a per se illegal tying contract:159
First, there must be two distinct products involved – a tying product anda tied product. In a franchise setting, the franchise license is usually thetying product while all sorts of supplies and equipment may serve as thetied product(s).
Second, there must be a conditional sale. That is, the franchisor must haveagreed to accept a prospective franchisee but only on the condition thatthe franchisee agree to buy the tied product(s) from the franchisor or adesignated third party.
Third, the franchisor must enjoy substantial economic – or market – powerin the tying good market. Since proof of market power can be elusive,
157 In most instances, the franchisee is the plaintiff in a franchise tying suit. But a tyingarrangement arguably forecloses rival suppliers of the tied goods. These foreclosedrivals may also file suit, as in Subsolutions, Inc. v. Doctor’s Associates, Inc. (1999), forexample, a case that involved computerized cash registers that were prescribed for allSubway shops. A foreclosed cash register supplier was the plaintiff in that case.
158 Section 1 holds that “[e]very contract, combination . . . , or conspiracy, in restraint oftrade or commerce . . . is hereby declared to be illegal.” 15 U.S.C. §1. In a tying case,the contract between the buyer and the seller may be deemed to be unreasonable if itrestrains competition.
159 For an extremely thorough treatment of antitrust tying, see Areeda (1991). For morecompact treatments, see Blair and Kaserman (1978) and Hovenkamp (1999).
P1: KaD0521772524c06.xml CB802/Blair 0 521 77252 4 April 30, 2005 12:43
144 Franchise Tying Contracts
courts have been willing to infer the existence of market power from thefranchisor’s trademark, but this attitude may be changing since intellec-tual property does not confer market power.
Fourth, the tying contract must have anticompetitive effects or must injurethe competitive process. In most Federal circuits, the franchisee wouldhave to show actual foreclosure of rival suppliers of the tied product(s).
Fifth, the contract must involve a “not insubstantial” volume of commerce.Usually, this is a de minimis standard that can be met by showing that thedollar volume is not trivial; it does not require showing that a substantialmarket is involved.
A tying contract is unlawful per se when all five of these elements arepresent. The analysis involved is a far cry from the relatively simple matter ofproving a per se illegal agreement to fix prices or allocate markets. In tyingcases, there are thorny issues of defining markets, measuring market power,and assessing competitive impact. In private suits, there are also difficultproblems in proving and calculating damages (if any).
6.3 Application to Franchise Tying Contracts
Franchisors often require their franchisees to purchase goods and servicesdirectly from them. In fact, traditional franchising is a distribution systemwhereby manufacturers engage dealers in selling their products to end cus-tomers under an exclusive dealing agreement. Of course, such systems involvethe sale of products and services to the dealers. Business-format franchisingarose from this tradition with the same goal of selling an end product tocustomers. But in this case, the end product, such as meals, haircuts, cleaningservices, and so on, was largely produced locally rather than by the fran-chisor. Thus, franchisors evolved a system of royalty payments to compensatethem for the use of the business format and the trade name when they hadno product to sell to franchisees. Earlier on, however, some business-formatfranchisors tried a different formula: in addition to, or instead of, imposingsales-based royalty fees, they requested that the franchisee buy various inputsfrom them, inputs that franchisors sold to franchisees at a markup. In part,this strategy allowed franchisors to control the quality of the inputs used,but it was also a way for franchisors to extract fees from franchisees. Becausebusiness-format franchisors also sold the business format to their franchisees,and because the inputs that franchisors sold to their franchisees were separatefrom the business format itself, some of these input sales requirements werebrought to the attention of the antitrust authorities. The result has been that

P1: KaD0521772524c06.xml CB802/Blair 0 521 77252 4 April 30, 2005 12:43
6.3 Application to Franchise Tying Contracts 145
franchising has been no stranger to antitrust suits involving tying contracts.These suits have played important roles in developing the standards regarding(1) the existence of two or more products, (2) proof of a conditional sale, and(3) proof of market power. In this section, we deal with the first two issues andintroduce the third. Given its central role in a large body of recent cases, wethen devote much more attention to the third issue in subsequent sections.
6.3.1 Proof of Separate Products
If the plaintiff franchisee cannot prove that there are at least two separateproducts, then his suit must fail because by definition tying cannot exist inthat case. Ordinarily, the franchisee will argue that the franchise license is thetying product and something else that he or she might have to buy is the tiedproduct. As we will see, whether this argument is valid depends upon the factsof the particular case.
Siegel v. Chicken Delight (1971). The Chicken Delight case involved a sit-uation in which the franchisor charged neither a franchise fee nor a runningroyalty for the privilege of doing business as a Chicken Delight franchisee.In order to earn some profit from its franchise system, the franchisor didrequire that its franchisees buy a certain number of cookers and fryers as wellas packaging supplies and mixes from Chicken Delight. The franchisees wereprecluded from buying these items at lower prices from Chicken Delight’srivals in the tied good markets. Siegel, who was one of the franchisees, com-plained that he was being overcharged on the tied goods and sued ChickenDelight. The court found that even though Chicken Delight had no separatecharge for using its trademark, the trademark (or franchise license) servedas the tying product while the cooking equipment and supplies were thetied products. In this situation, which involved business-format franchising,the trademark was deemed to be a separate product to which other distinctproducts could be tied.160
Principe v. McDonald’s Corporation (1980). In a later case, however,the court looked more carefully at the business of franchising and foundthat the license was not always a distinct product. Frank Principe, aMcDonald’s franchisee, entered into two agreements with the McDonald’sCorporation. Under the franchise license agreement, Principe was permitted
160 Whether Siegel was actually injured is an interesting question. On the one hand, hewas at least arguably overcharged for the cooking equipment and supplies. On theother hand, he paid no fees to Chicken Delight and, therefore, at least arguably, he wasundercharged for the franchise license. On balance, was there injury?
P1: KaD0521772524c06.xml CB802/Blair 0 521 77252 4 April 30, 2005 12:43
146 Franchise Tying Contracts
to use McDonald’s food preparation system and to sell food products underthe McDonald’s trademark. In return, Principe paid a $10,000 lump-sumlicense fee and a running royalty of 2.2 percent of his gross receipts. The sec-ond agreement was a store lease that permitted Principe to use the store towhich the franchise pertained. In return, Principe agreed to pay 8 percent ofhis gross receipts as rent plus a non-negotiable, non-interest bearing securitydeposit of $15,000.161 Since the two agreements were necessary to become aMcDonald’s franchisee, the store lease appeared to be tied to the franchiselicense, which is essentially what Principe argued.
The court observed that McDonald’s is in the business of “developingand collecting royalties from limited menu fast food restaurants operated byindependent business people.” Development plans were carefully made andreal estate specialists used economic and demographic data to find suitablelocations for the new sites. The land was either bought or was secured under along-term lease by McDonald’s. Store design was dictated by the anticipatedvolume of business, lot size and shape, local zoning, and land elevation. Onceit had built the store, McDonald’s was ready to install the new franchisee.
The court noted that McDonald’s does not simply license its franchiseesto sell products under its “Golden Arches.” Instead, it provides a completemethod of doing business. The court explained that
[McDonald’s] takes people from all walks of life, sends them to its managementschool, and teaches them a variety of skills ranging from hamburger grilling tofinancial planning. It installs them in stores whose market has been researchedand whose location has been selected by experts to maximize sales potential. Itinspects every facet of every store several times a year and consults with eachfranchisee about his operation’s strengths and weaknesses. Its regime pervadesall facets of the business, from the design of the menu board to the amountof catsup on the hamburgers, nothing is left to chance. This pervasive fran-chisor supervision and control benefits the franchisee in turn. His business isidentified with a network of stores whose very uniformity and predictabilityattracts customers. In short, the modern franchisee pays not only for the rightto use a trademark but for the right to become a part of a system whose business
161 The security deposit provided McDonald’s with an interest-free loan for the life of thefranchise agreement. In an economic sense, the cost to the franchisee is the differencebetween the value of the deposit when it was made and the value when it would bereturned:
C = $15,000 − $15,000/(1 + r )t
where r is the discount rate and t is the life of the agreement. This sum should be addedto the lump-sum franchise fee to obtain the true initial cost.

P1: KaD0521772524c06.xml CB802/Blair 0 521 77252 4 April 30, 2005 12:43
6.3 Application to Franchise Tying Contracts 147
methods virtually guarantee his success. It is often unrealistic to view a franchiseagreement as little more than a trademark license.
Given the realities of modern franchising, we think the proper inquiry is notwhether the allegedly tied products are associated in the public mind with thefranchisor’s trademark, but whether they are integral components of the busi-ness method being franchised. Where the challenged aggregation is an essentialingredient of the franchised system’s formula for success, there is but a singleproduct and no tie in exists as a matter of law.162
Applying this reasoning to the Principe facts, the court ruled that McDonald’slease was not separable from the McDonald’s franchise system. The restaurantlocation and design was an integral part of McDonald’s success. As a result,there was a single product and, therefore, tying could not exist.
Krehl v. Baskin-Robbins Ice Cream Company (1982). Both Chicken Delightand Principe dealt with pure business-format franchise systems. In contrast,Krehl involved a product distribution franchise system.163 The franchiseealleged that Baskin-Robbins illegally tied its ice cream to the Baskin-Robbinstrademark. The court pointed out that in a distribution franchise system, thetrademark “serves merely as a representation of the end product marketedby the system.” Thus, the trademark provides information to the consumerregarding the quality and source of the product that reduces search costs.Because the source of the product can be identified, the franchisor has anincentive to preserve quality.164 Accordingly, “the franchised outlets servemerely as conduits through which the trademarked goods of the franchisorflow to the ultimate consumer.” The court found that the Baskin-Robbinsice cream was not separable from the trademark and, therefore, there was notying arrangement – illegal or otherwise. This, of course, is an economicallysensible result. When consumers buy ice cream at a Baskin-Robbins ice creamstore, they do not expect to get Breyer’s ice cream. They quite reasonablyexpect to get Baskin-Robbins ice cream. If franchisees were free to sell otherbrands under the Baskin-Robbins trademark, consumers would be deceived.
162 It is clear from the court’s description that it is quite useful to think of franchisingas vertical integration by contract. McDonald’s control over the operation is apparentand not unlike the control exercised by a vertically integrated firm.
163 Ice cream franchises are among those in the grey area between traditional and business-format franchising that we alluded to when we defined both types and noted that thedistinction is more a matter of degree than anything else. Baskin-Robbins sells itsice cream to its franchisees – on which it may or may not charge a markup – butalso provides a turn-key operation like business-format franchisors do, and charges afranchise fee and sales-based royalties to its franchisees.
164 See, for example, Klein and Leffler (1981).

P1: KaD0521772524c06.xml CB802/Blair 0 521 77252 4 April 30, 2005 12:43
148 Franchise Tying Contracts
Moreover, as consumers became aware of the fact that the trademark nolonger identified the source of the product being purchased, they would haveto incur search costs to identify the source of various stores’ ice cream andguarantee that they get the type that they want. Hence, the trademark wouldlose its informational value and its economic purpose.
In some of the recent franchise tying suits, the plaintiff franchisees do notdispute having to purchase proprietary ingredients, such as Little Caesar’spizza dough, or other supplies that would ordinarily be considered integralto the success of the franchise system. Instead, they complain that relativelygeneric supplies, such as “logoed” paper products and nonproprietary ingre-dients, such as pepperoni, are tied to the franchise license as per the ChickenDelight case. In these cases, the “system argument” offered in Principe is notlikely to be persuasive and, therefore, the courts will reasonably conclude thatthe separate products condition has been satisfied. This is consistent withpositions taken with respect to traditional franchising, where requirementsthat franchisees purchase products other than the main manufactured prod-uct of the franchisor have also been challenged and ultimately abandoned byfranchisors. Specifically, the practice of requiring that gasoline dealers pur-chase tires, batteries, and accessories through their franchisor (the oil refinerto which they were affiliated), or from designated suppliers under sales com-mission plans that allowed refiners to profit from these sales, was challengedby the FTC in the 1960s. Ultimately, such sales commission plans were aban-doned as a result of these challenges.165 Thus, the legal constraints on tyingapply to traditional franchisors if they try to control the sales of productsother than the one that the franchise relates to directly.
6.3.2 Proof of Conditional Sales
In some instances, franchise agreements are explicitly conditioned on thefranchisee’s buying some specific good(s). In many others, the conditionalsale is implicit in the sense that the actual implementation of the franchisecontract results in de facto tying. Either situation can result in an antitrustsuit by unhappy franchisees.
Explicit Conditioning. A recent example of explicit conditioning is pro-vided by Wilson v. Mobil Oil Corporation. In Wilson, the plaintiffs were fran-chisees of the SpeeDee Oil Change Systems, which provided quick car-careservices, such as oil changes. The franchise agreement explicitly requiredthe franchisees to purchase automotive products, such as engine oil and
165 See, e.g., Marvel (1995) for more details on this.
P1: KaD0521772524c06.xml CB802/Blair 0 521 77252 4 April 30, 2005 12:43
6.3 Application to Franchise Tying Contracts 149
lubricants, as well as financial services from Mobil. One could not be in com-pliance with the franchise agreement if one did not purchase Mobil products.Thus, the conditioning in this franchise agreement was explicit and, therefore,quite easy to prove in court.166
Implicit Conditioning. In many franchise agreements, the franchisee isrequired to use inputs that meet certain specifications. In order to be surethat they do, the franchisor will supply these inputs – sometimes at inflatedprices. Typically, the franchise agreement permits the franchisee to buy theseinputs elsewhere provided that the inputs are approved by the franchisoras conforming to its standards and specifications.167 If the franchisor pro-vides alternative suppliers with incomplete specifications to hinder approvalor simply refuses to approve an alternate supplier without good cause, thefranchisee will have to purchase those inputs from the franchisor. In suchinstances, there will be an implicit conditioning in the franchise agreement.This, of course, will be much more difficult to prove in court than explicitconditioning. For example, a competent meat supplier may offer a perfectlygood chicken breast for a chicken breast sandwich, but the franchisor may stillcontend that it does not conform to the franchisor’s specifications. Whetherit does or not is not subject to a priori reasoning.
6.3.3 Proving Market Power in the Tying Good168
If a seller conditions the sale of “A” on the purchase of “B,” but lacks marketpower in “A,” the tying arrangement will not be illegal. Absent market powerin “A,” buyers will only agree to the tie if it confers benefits to them, thatis buyers cannot be coerced. Moreover, the seller’s rivals (in the market for“A”) can presumably offer the same set of options and, therefore, there canbe no anticompetitive foreclosure. Proving market power in the tying good,therefore, is a crucial element of a tying suit. Clearly, to speak of market powerpresupposes a market definition. After defining the relevant markets for thetying and the tied goods, one can proceed to an evaluation of market power.
166 The McDonald’s franchise agreement at issue in Principe was also explicit as prospec-tive franchisees had to enter into two agreements. Similarly, all product distributionagreements are explicit; see, e.g., Krehl.
167 There are many recent examples; see, e.g., Queen City Pizza, Inc. v. Domino’s Pizza, Inc.(1996), and Little Caesar Enterprises, Inc. v. Smith (1995).
168 An excellent analysis of this issue is provided by Silberman (1996). Ordinarily,economists use “market power” and “monopoly power” to refer to the ability of afirm to raise price above the competitive level and thereby earn higher profits. See alsoKrattenmaker, Lande, and Salop (1987).
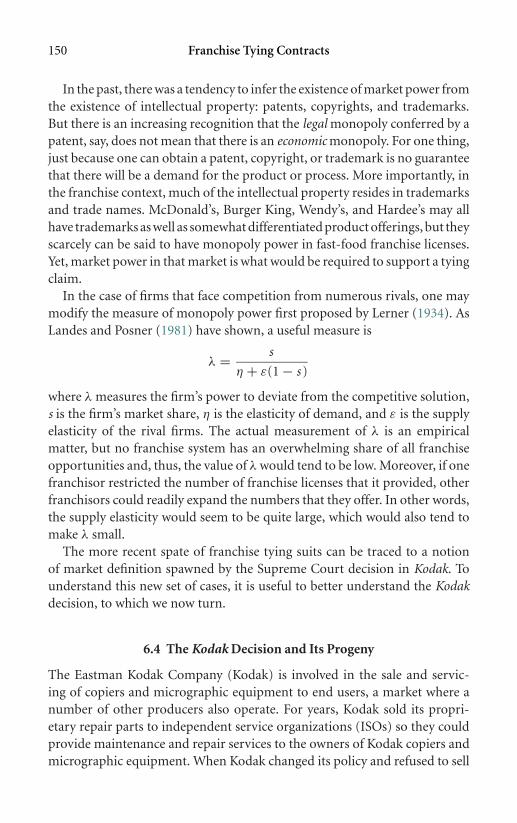
P1: KaD0521772524c06.xml CB802/Blair 0 521 77252 4 April 30, 2005 12:43
150 Franchise Tying Contracts
In the past, there was a tendency to infer the existence of market power fromthe existence of intellectual property: patents, copyrights, and trademarks.But there is an increasing recognition that the legal monopoly conferred by apatent, say, does not mean that there is an economic monopoly. For one thing,just because one can obtain a patent, copyright, or trademark is no guaranteethat there will be a demand for the product or process. More importantly, inthe franchise context, much of the intellectual property resides in trademarksand trade names. McDonald’s, Burger King, Wendy’s, and Hardee’s may allhave trademarks as well as somewhat differentiated product offerings, but theyscarcely can be said to have monopoly power in fast-food franchise licenses.Yet, market power in that market is what would be required to support a tyingclaim.
In the case of firms that face competition from numerous rivals, one maymodify the measure of monopoly power first proposed by Lerner (1934). AsLandes and Posner (1981) have shown, a useful measure is
λ = s
η + ε(1 − s )
where λ measures the firm’s power to deviate from the competitive solution,s is the firm’s market share, η is the elasticity of demand, and ε is the supplyelasticity of the rival firms. The actual measurement of λ is an empiricalmatter, but no franchise system has an overwhelming share of all franchiseopportunities and, thus, the value of λ would tend to be low. Moreover, if onefranchisor restricted the number of franchise licenses that it provided, otherfranchisors could readily expand the numbers that they offer. In other words,the supply elasticity would seem to be quite large, which would also tend tomake λ small.
The more recent spate of franchise tying suits can be traced to a notionof market definition spawned by the Supreme Court decision in Kodak. Tounderstand this new set of cases, it is useful to better understand the Kodakdecision, to which we now turn.
6.4 The Kodak Decision and Its Progeny
The Eastman Kodak Company (Kodak) is involved in the sale and servic-ing of copiers and micrographic equipment to end users, a market where anumber of other producers also operate. For years, Kodak sold its propri-etary repair parts to independent service organizations (ISOs) so they couldprovide maintenance and repair services to the owners of Kodak copiers andmicrographic equipment. When Kodak changed its policy and refused to sell

P1: KaD0521772524c06.xml CB802/Blair 0 521 77252 4 April 30, 2005 12:43
6.4 The Kodak Decision and Its Progeny 151
its repair parts to the ISOs, Kodak became the only source of maintenance andrepair services to its end customers. Image Technical Service and seventeenother ISOs sued Kodak alleging that it had illegally tied its service to its repairparts.169 Thus, the Kodak case involved the tie of one aftermarket productto another. This raised an interesting question regarding the relevant marketdefinition for antitrust purposes. Kodak argued that since it sold its equip-ment in competition with other manufacturers, it could not have appreciableeconomic power in the (tying good) aftermarket for repair parts. In essence,Kodak argued that the relevant product market for antitrust analysis is theprimary market for photocopying and micrographic equipment, rather thanthe aftermarket for repair parts. Kodak argued that when a buyer is choosingamong alternative copiers, he or she recognizes that buying a durable goodinvolves a financial commitment to paying for future maintenance and repairin addition to the initial price of the copier. The Supreme Court, however,rejected Kodak’s reasoning and ruled that the relevant market for determin-ing market power is based on “the choices available to Kodak equipmentowners.” Accordingly, it held that the relevant market for determining mar-ket power was the market for replacement parts for Kodak equipment. Ofcourse, the more narrowly the market is defined, the greater the market sharea firm will have and the stronger the inference of market power. In this case,since the repair parts were proprietary, Kodak was found to have a marketshare of virtually 100 percent. Despite this large market share, however, Kodakmaintained that it could not have any real economic power in the market forrepair parts since it did not have market power in the primary equipmentmarket. Specifically, Kodak argued that charging supra-competitive prices inthe aftermarket would result in a loss of customers in the primary equipmentmarket. But the Supreme Court was not persuaded and concluded that sincerepair parts for Kodak equipment are unique (i.e., neither IBM repair partsnor Xerox repair parts will fit a Kodak copier), the owners of Kodak copiersare “locked in” to Kodak if they want to keep their copiers operational. Theonly alternative is to switch to another brand of copier. But the SupremeCourt reasoned that the high costs associated with switching prevented thisoption from being economically viable and provided Kodak with the powerto exploit the locked-in owners.170
169 Eastman Kodak Company v. Image Technical Service (1992a, 1992b).170 For an analysis of the reasons for vertical restraints by durable goods producers, see
Blair and Herndon (1996). It should also be noted that switching to an IBM copiermerely locks one in to a different repair parts supplier. As such, it does not solve thecustomer’s problem.

P1: KaD0521772524c06.xml CB802/Blair 0 521 77252 4 April 30, 2005 12:43
152 Franchise Tying Contracts
6.5 Franchise Tying Cases After Kodak
The concept of being locked in to a particular manufacturer and therebysubject to aftermarket exploitation is the most significant of the Court’s find-ings in Kodak. This is the foundation of its determination that the marketpower for Kodak repair parts – a single manufacturer’s brand – was suffi-ciently great to restrain competition in the tied product market for service.Consequently, Kodak presented a new angle from which to allege an illegaltying arrangement. Plaintiffs may craft arguments that they are powerless,locked-in consumers, subject to all sorts of onerous demands by their sup-plier. When the relevant market is confined to a particular firm’s product orservice, that firm will appear to have market power in that “market.” In therecent franchise tying cases, the franchisees all employed the lock-in argu-ment to support their claims of illegal tying. Interestingly, these argumentshave generally been unsuccessful.
The recent franchise tying cases have the following common characteristics:
1. All cases involve business-format franchises. As noted above, the Krehldecision has made it difficult for distribution franchisees to prevail ontying claims and Kodak did not change that. Consequently, it is notsurprising that the post-Kodak suits have been filed by business formatfranchisees.
2. Plaintiffs define the relevant tying product market narrowly, typically as-serting that it is restricted to the market for the defendant’s franchise.171
3. Plaintiffs correspondingly offer a narrow definition of the tied productmarket, alleging that it is the market for supplies to a particular fran-chise system, rather than supplies in general. For example, in Collins v.International Dairy Queen, franchisees alleged that International DairyQueen (IDQ) inhibited competition in the market for “food productsand supplies that are sold to Dairy Queen franchises.” Thus, the DairyQueen franchisees would allege that the tied product market is ham-burger patties sold to Dairy Queen franchisees, rather than hamburgerpatties supplied to fast-food restaurants or, more generally, the whole-sale market for hamburger patties.
171 Collins v. International Dairy Queen (1996) is an exception. The Dairy Queen fran-chisees apparently offered a market definition restricted to the Dairy Queen franchisesystem, but recognizing the narrowness of this market definition, also offered soft-serveice cream as a relevant product market in which Dairy Queen had over a 90-percentmarket share. It is interesting to note that soft-serve ice cream specifically was proposed,rather than all ice cream (including both hard pack and soft-serve), or ice cream andfrozen yogurt, or all franchise opportunities for that matter.

P1: KaD0521772524c06.xml CB802/Blair 0 521 77252 4 April 30, 2005 12:43
6.5 Franchise Tying Cases After Kodak 153
4. The cases focus on the franchisor’s refusal to approve or allow alternatesources of supply. In Wilson v. Mobil Oil Corporation, this refusal wasexplicitly specified in the franchise agreement. In the other cases, theplaintiffs alleged that the franchisor had imposed a more restrictivepolicy of approving alternate suppliers than was contemplated in thefranchise agreements.172
5. In each case, the franchisor has a financial interest in the sales of the tiedproducts. Franchisors are more likely to escape antitrust condemnationwhen the franchisor does not have a financial interest in the sales of thetied product.173
Before proceeding to the economic analysis of franchise tying suits sinceKodak, we summarize the central claims in recent cases to clarify how theyappeal to the Kodak logic. This summary is divided into explicit and implicittying arrangements.
6.5.1 Contractually Explicit Tying after Kodak
Wilson appears to be a classic case of tying. In Wilson, the plaintiffs werefranchisees of SpeeDee Oil Change Systems, Inc. The franchisees, who pro-vide quick car-care services such as oil changes and minor engine tune-ups,alleged that SpeeDee and Mobil Oil Corporation engaged in illegal tying byrequiring that franchisees purchase automotive products and financial ser-vices from Mobil in order to acquire or retain a SpeeDee franchise license.SpeeDee received $650,000 from Mobil as part of a 15-year agreement thatallowed Mobil to become the exclusive supplier of automotive products forthe SpeeDee franchise system, and the franchisees were allegedly requiredto purchase these automotive products from Mobil at “undisclosed pricesto be set by Mobil without negotiation.” The plaintiffs identified the tyingproduct market as the SpeeDee franchise and associated trade and servicemarks.174 The plaintiffs then defined the tied product market as the market forMobil lubricants and financial services. The franchisees asserted that the
172 This raises the question as to why the appropriate complaint is not a breach of contract.173 See Kentucky Fried Chicken Corporation v. Diversified Packaging Corporation (1977).174 The court initially stated that “Plaintiffs define the relevant product market as the
SpeeDee trademarks, trade names and copyrights, or alternatively, the market forproviding quick automotive oil change, goods and services.” The plaintiff’s subsequentallegations, defendant’s arguments, and the court’s decision, however, are all based ona product market definition restricted to the SpeeDee franchise system and not thebroader market for quick car-care services.

P1: KaD0521772524c06.xml CB802/Blair 0 521 77252 4 April 30, 2005 12:43
154 Franchise Tying Contracts
Mobil products that they were forced to purchase were more expensiveand inferior to those that they would have preferred to purchase, therebyplacing them at a competitive disadvantage. Notably, they did not explainhow this would benefit the franchisor. The franchisees relied heavily uponKodak to support their allegations, charging that (1) single-brand marketpower is applicable since the franchise agreement creates an “aftermar-ket” for the requisite automotive products and financial services; and (2)they are “locked into” the franchise system as a result of high “switchingcosts” due to a significant capital investment, penalty payments to Mobiland SpeeDee, and a non-compete covenant in their franchise agreementthat prevents them from operating a similar business within a specified pe-riod of time and geographic region.175 In its 1996 decision, the court re-fused to follow the Queen City approach and dismiss the case. However, in1997, following discovery, the court granted defendants’ motion for sum-mary judgment and endorsed the views of the majority in Queen City (seebelow).
6.5.2 Implicit Tying Arrangements after Kodak
The rest of the post-Kodak franchise tying cases involve de facto tying thatstems from the franchisor’s alleged refusal to approve alternative sources ofsupply. To get a flavor of these complaints, we summarize the salient facts ofsome typical suits.
Queen City Pizza, Inc. v. Domino’s Pizza, Inc. (1996, 1997). Domino’sPizza, Inc. (DPI) required that its franchisees buy the necessary ingredi-ents and supplies from DPI or from a DPI-approved supplier. Consequently,Domino’s franchisees purchased approximately 90 percent of their ingredi-ents and supplies from DPI. Further, DPI typically did not produce thesegoods; rather, it purchased them from third parties and resold them to itsfranchisees.
Queen City Pizza and ten other franchisees along with the InternationalFranchise Advisory Council filed suit against DPI, alleging various antitrustviolations, including two tying claims. First, they alleged that DPI illegallytied ingredients and supplies to the purchase of fresh pizza dough. Second,they alleged that DPI illegally tied ingredients and supplies to the fran-chise license itself. Integral to these complaints were the allegations that(1) DPI unreasonably withheld its approval of alternative sources of supplyand (2) DPI provided incomplete product specifications, thereby eliminating
175 We discuss such covenants further in Chapter 10.
P1: KaD0521772524c06.xml CB802/Blair 0 521 77252 4 April 30, 2005 12:43
6.5 Franchise Tying Cases After Kodak 155
viable competitive sources of supplies to the Domino’s franchise system. Thenet effect was that most of the necessary ingredients and supplies had to bepurchased from DPI.
The Queen City litigation was notable in many respects. It is the only fran-chise tying case that has received substantive appellate court consideration inlight of Kodak. Interestingly, the court concluded that Kodak is not applicablein the context of franchise tying suits, and the case ultimately was resolvedin favor of the franchisor. In doing so, however, it raised additional questionsand concerns about the appropriate analysis of franchise tying claims. Weaddress these questions in the next section.
Collins v. International Dairy Queen (1996, 1997). International DairyQueen (IDQ) purchased products that it approved and then resold to itsfranchisees directly or through independent distributors or warehouses thatwere designated as approved sources of supplies. Thus, many of the suppliespurchased by Dairy Queen franchisees were, in effect, supplied by IDQ it-self. But IDQ’s franchise agreements allowed franchisees to purchase thesesupplies from alternate sources as long as they were approved by IDQ as be-ing in conformity with certain standards and specifications. The franchiseesalleged that IDQ violated the spirit of this agreement by providing incom-plete specifications, altering specifications without good cause, and refusingto approve or unreasonably delaying approval of alternate sources of supply,thereby forcing the franchisees to purchase virtually all of their supplies fromthose distributors and warehouses designated by IDQ. The franchisees thusasserted that IDQ implicitly and illegally tied the purchase of supplies to theDairy Queen franchise license. The franchisees restricted the relevant tyingproduct market to the market for soft-serve ice cream franchises and the rele-vant tied product market to food products and supplies sold to Dairy Queenfranchisees. The court in this case declined to follow district court’s ruling inQueen City. The case subsequently settled.176
Little Caesar Enterprises v. Smith (1998). The franchisees of Little Caesar’sEnterprises (LCE) alleged that LCE illegally tied non-proprietary supplies to
176 In an order signed March 13, 2000, the U.S. District Court Senior Judge Wilbur D.Owens Jr. said the proposed settlement seemed reasonable. The agreement requiresInternational Dairy Queen to pay $30 million in advertising, $250,000 to each of thesuit’s five original Central Georgia plaintiffs, and $11.3 million in legal fees. Defendantsalso must make concessions on supply and other franchise issues. Interestingly, in its2000 decision on the matter of Maris Distributing Company v. Anheuser-Busch, Inc.,in the same federal circuit as Dairy Queen, the court went out of its way to state “wereject [Dairy Queen] in favor of what we consider to be the more persuasive rationaleof Queen City and its progeny.”
P1: KaD0521772524c06.xml CB802/Blair 0 521 77252 4 April 30, 2005 12:43
156 Franchise Tying Contracts
its franchise license.177 It accomplished this by requiring that its franchiseesbuy all of their “logoed” paper products from a wholly owned subsidiary ofLCE. Since there are economies of “one-stop shopping,” that is dealing witha single outside supplier, the franchisees bought all of their non-proprietarysupplies from LCE’s subsidiary as well. LCE’s market power was based onits intellectual property – copyrights, trademark, service name, and tradename. LCE allegedly rejected alternate sources of supply, which meant thatthe franchisees would buy the “non-logoed” supplies as well as the “logoed”supplies from the franchisor.
The franchisees alleged market power in two respects. First, they allegedthat LCE had market power in LCE franchise licenses. They alleged that LCEalso had market power over its logoed products and used it to foreclose rivalsuppliers of these paper products. Additionally, they claimed that this prac-tice had the practical effect of tying non-logoed supplies as well. Since theLCE subsidiary was the only distributor from which the franchisees couldobtain logoed products, including paper products and packaged condiments,the franchisees argued that this had the twofold effect of excluding otherdistributors from competing for sales of logoed products as well as mak-ing it economically unattractive to purchase non-logoed supplies from otherdistributors due to economies from “one-stop shopping.” This argument ap-peals to an aftermarket type of tying claim. Based on its market power overits franchise licenses, LCE has market power over the “aftermarket” sales oflogoed products to its franchisee and it effectively uses that power to (eco-nomically) compel franchisees to purchase other non-logoed supplies from itas well.
In the end, the court decided that franchisees could not use a Kodak typeof lock-in argument because the risk of such a tie was known or predictablewhen they signed their franchise agreement. The court indicated that a Kodaktype of analysis might have been appropriate on the exclusion of competingsuppliers’ argument but that there was no evidence that the franchisor hadused its power over logoed supplies to exclude other distributors. The courtthus granted summary judgment for the franchisor.
6.6 Identifying Market Power After Kodak
As noted above, courts are likely to find that the license to operate a busi-ness format franchise and the other inputs required to run the business are
177 The plaintiffs did not dispute LCE’s right to distribute its “Pan! Pan!” pizza dough mixor its secret spice mix.

P1: KaD0521772524c06.xml CB802/Blair 0 521 77252 4 April 30, 2005 12:43
6.6 Identifying Market Power After Kodak 157
separate products. The “system” argument, which was successful in Principe,will not be persuasive in cases concerning generic supplies that are not likelyto be considered integral in and of themselves to the success of the franchisesystem. As a result, the fate of the franchisor lies primarily in the determina-tion of market power in the tying product market. Indeed, this issue has beenthe major point of contention in all these cases. Assessing market power, inturn, hinges largely on the definition of the relevant product market. Natu-rally, the narrower the market definition, the greater the firm’s market sharewill be and, therefore, the more likely is the inference of market power.178
When evaluating market power for a pizza franchisor, for example, thereare at least four possible market definitions: (1) all franchise opportunities,(2) the franchise segment, for example, fast-food, (3) all pizza franchises, and(4) a particular franchise system such as Domino’s. Since there are thousandsof franchise opportunities, no one has market power in the broadest marketdefinition. At the other extreme, every franchisor controls all of its licenses.Applying Kodak to franchise tying cases, one would argue that the commit-ted franchisee is locked in by high switching costs and is disadvantaged byinformation costs.
6.6.1 Locus of Competition: Pre-Contract v. Post-Contract
Following Kodak, franchisees typically adopt a post-contractual perspective,thereby asserting a very narrow market definition limited to the franchisor’sown system. Franchisees appeal to Kodak ’s focus on “the choices availableto Kodak equipment owners.” For example, in Queen City, the franchiseesalleged that the relevant market for determining market power was Domino’sPizza franchises since “[o]nly Domino’s-approved products may be usedby Domino’s franchisees without violating . . . Domino’s standard franchiseagreement.” Naturally, DPI will have market power in a market so definedgiven that no one else can issue a Domino’s franchise license.
Franchisors argue that a broader market definition is appropriate by cor-rectly emphasizing that at the pre-contractual stage the potential franchiseeshave a substantial number of franchise opportunities from which to choose.The district and appellate courts in Queen City apparently understood thepre-contract versus post-contract distinction and thus observed that DPIhad no market power in selling franchise licenses (the tying good): “The
178 Although it has been pointed out that market share is not the sole determinant ofmarket power, the judiciary continues to be persuaded by such evidence. See, e.g.,Landes and Posner (1981).

P1: KaD0521772524c06.xml CB802/Blair 0 521 77252 4 April 30, 2005 12:43
158 Franchise Tying Contracts
franchise transaction between Domino’s Pizza, Inc. and plaintiffs was sub-jected to competition at the pre-contract stage.” Indeed, prior to signinga franchise contract, a franchisee has literally thousands of options. Infor-mation on opportunities is readily available. For example, the 2001 Bond’sFranchise Guide provides detailed information on more than 1,000 franchisesystems and lists yet another 1,000 or so. These franchisors must competewith one another for franchisees. While it is true that a DPI franchisee sellingpizza does not compete for customers with a SpeeDee franchisee selling oilchanges, the DPI and SpeeDee franchisors compete with one another in thesale of franchise licenses. Consequently, a single franchisor has no appreciablemarket power in the market for franchise licenses to exploit through a tyingarrangement.
One might make a case, however, that franchisors only compete with otherfranchisors in the same business sector for franchisees. The few studies thathave examined the decision process of prospective franchisees have found thatthe majority of franchisees – 63 percent in Bradach and Kaufmann (1988) and75 percent in Kaufmann and Stanworth (1995) – expected they would choosea business sector first and then decide whether they should buy a franchiseor start an independent business. Hence, for the majority of franchisees, itseems that only those franchises within the same sector are potential substi-tutes for one another. But even then, the franchisees have numerous choiceswithin any segment. For example, in Bond (2002) there are fifteen detailedlistings in the tune-up and oil change segment of the automotive productsand services sector that SpeeDee belongs to, and thirty in the pizza segment.If one considers the firms listed but not profiled in Bond, or includes chainsinvolved in other types of automotive services or of fast-food services, re-spectively, the number of options grows much higher. Finally, the figuresabove also imply that between 25 to 37 percent of franchisees are willingto consider different franchise opportunities from different business sectorsaltogether.179
When deciding on which franchise system to join from among these sets ofoptions, the prospective franchisees will be aware of their obligations underthe contracts offered after reviewing the franchising agreements. Presumably,those obligations will play a role in determining their investment decisions.From a pre-contract perspective, the relevant product market in Queen Citycannot reasonably be defined more narrowly than pizza franchises. But it
179 In fact, proprietary research by a large U.S. franchisor cited in Kaufmann and Stanworth(1995) revealed that 75 percent of that chain’s franchisees had considered anothercategory of franchise in the process of deciding which chain to join.

P1: KaD0521772524c06.xml CB802/Blair 0 521 77252 4 April 30, 2005 12:43
6.6 Identifying Market Power After Kodak 159
would not be unreasonable to argue for the broader market definition of allfast-food franchises, if not all franchise opportunities.180
6.6.2 Cost Comparisons
In each period, the franchisee’s net operating revenue (π) can be expressedas
π = (1 − r )P Q −n∑
j=1
wi xi
where P is the franchisee’s output price, Q is the quantity of output (whichfor simplicity we assume is just one product), r is the sales-based royalty, xi
represents the quantity of input i, and wi denotes the price of input i. Theseinputs, of course, include ingredients, paper products with logos, and the like.Assuming that the wi ’s are competitive prices, π then represents the maxi-mum profit that the franchise location will generate per period. The fran-chisor wants all or at least a big part of this profit – whether and how theprofit is obtained is not an issue that would normally fall within the scope ofantitrust.
In comparing franchise opportunities, potential franchisees will comparethe net present values (NPV) of investments in the various franchise systems:
NPV =(
T∑t=1
πt/(1 + δ)t
)− F
where F stands for the initial franchise fee and/or specific investments, πt
represents the net operating revenue in each period, T is the length of thefranchise contract, and δ is the discount rate. Naturally, πt is influenced bythe costs incurred by the franchisee, including all periodic royalty payments tothe franchisor. To the extent that the franchisee must also buy equipment, sup-plies, and ingredients from the franchisor at supracompetitive prices, initialinvestments or operating costs will be higher than they would be otherwise.This will reduce the net revenues and make that franchise opportunity lessattractive, which will be reflected in a lower franchise fee. That is, ceteris
180 A telephone survey of 500 franchisees and 200 potential franchisees conducted by aprivate survey firm for the FTC in 1984 indicates that 58 percent of franchisees con-sidered other opportunities seriously enough to meet in person with other franchisorsbefore they chose to invest in their franchise. Franchisees who comparison shoppedconsidered four other opportunities on average. See Beales and Muris (1995) for moredetails.

P1: KaD0521772524c06.xml CB802/Blair 0 521 77252 4 April 30, 2005 12:43
160 Franchise Tying Contracts
paribus, those franchise systems that employ tying arrangements as part ofthe franchise agreement will have lower initial franchise fees since prospectivefranchisees will factor the potential for post-contractual exploitation on thepart of the franchisor into their cost comparisons. This process of cost analysisis referred to as “life-cycle costing.”181
There is no doubt that various business uncertainties make precise cost cal-culations problematic. For example, a potential franchisee cannot accuratelyforecast future prices of all necessary inputs, it cannot accurately forecastdemand for its output, it cannot know the results of menu changes, and itcannot know in advance about competition from new entrants. But thesesorts of uncertainties plague all business decisions. At least in a subjectivesense, probabilities of various outcomes can be assigned and expectationsformed. If one franchise contract subjects a franchisee to a higher risk of ex-ploitation in aftermarkets than another contract, this should be factored intothe franchisee’s evaluation of profit potential for the two systems and thusinto the final decision as to which franchise contract best suits him.
6.6.3 The Lock-In Argument
Kodak argued that it could not charge supracompetitive prices in the aftermar-ket because such pricing behavior would lead to lost sales in the competitiveprimary equipment market. But the Supreme Court rejected this rationale asit was persuaded by the plaintiffs that Kodak copier owners were effectively“locked-in” to Kodak repair parts and services and, therefore, subject to af-termarket exploitation. Franchisees have tried to adopt the same notion oflock in.
Queen City Pizza, Inc., for example, relied upon the Kodak court’s reason-ing in suing DPI, asserting that it was locked in to the franchisor’s system. Thatis, it did not allege that DPI had pre-contractual power in the market for fast-food franchise licenses. Instead, it argued that DPI employed post-contractualpower to coerce its franchisees into purchasing ingredients and supplies fromDPI. In essence, the argument is that franchisees sign a franchise agreementin reliance on contractual promises that they can buy ingredients and sup-plies from approved sources. DPI’s refusal to approve competitive sourcesof supply changes the rules of the game. The substantial time and moneythat each franchisee has invested in the franchise means that each will suffera considerable loss if the franchise agreement is terminated. Thus, DPI has
181 See Williams (1996) and Brickley (2001) for more details on this in the context offranchise contracts.
P1: KaD0521772524c06.xml CB802/Blair 0 521 77252 4 April 30, 2005 12:43
6.6 Identifying Market Power After Kodak 161
post-contractual power to coerce its franchisees to purchase ingredients andsupplies from it. This power, however, derives from the franchise agreementitself and is not the sort of market power that raises antitrust concerns. Thus,while the dispute between DPI and its franchisees may well have involved le-gitimate claims of contract breach, it should not be confused with an antitrustconcern. The franchisor’s “power” flows from the terms of the contract. Itis not a manifestation of market power, which is the proper concern of theantitrust laws.
The Queen City district court recognized this issue explicitly: “[t]he eco-nomic power DPI possesses results not from the unique nature of the productor from its market share in the fast food franchise business, but from the fran-chise agreement.” The Third Circuit affirmed the lower court’s reasoning andfurther noted: “If Domino’s Pizza, Inc. acted unreasonably when, under thefranchise agreement, it restricted plaintiffs’ ability to purchase supplies fromother sources, plaintiffs’ remedy, if any, is in contract, not under the antitrustlaws.” In our view, this is precisely correct.
Recognizing that DPI’s actions did not reflect true economic power, yetprocedurally unable to ignore the Kodak decision, the district and appellatecourts in Queen City distinguished Kodak by arguing that the service marketfor Kodak equipment arose out of the unique nature of the Kodak equipmentwhereas the sale of ingredients and supplies to the DPI franchisees arose from“a valid and binding franchise agreement.” This reasoning, however, is notpersuasive. Just as a Kodak equipment owner needs repair parts and serviceon a continuing basis over the life of the Kodak copier, a DPI franchisee needsingredients and supplies on a continuing basis over the life of the franchiseagreement.
The Supreme Court’s finding that Kodak customers were locked in toKodak repair parts and services hinged largely on its analysis of switchingand information costs incurred by Kodak equipment owners. These elementshave similarly played a major role in recent franchise tying suits.
Switching Costs. In Kodak, the equipment owners were “locked-in” ascaptive customers by the high costs of switching to a different brand of copier.The plaintiffs in Wilson asserted that franchisees face even greater switchingcosts than Kodak equipment owners due to the significant capital investmentsthat are necessary to obtain a franchise license. At first glance, the higher initialinvestment associated with a franchise license would seem to indicate that afranchisee is every bit as locked in to the franchise as a Kodak copier owner isto Kodak repair parts. If so, there is no economically meaningful distinctionbetween the two situations. But there is a meaningful difference betweencopiers and franchises.

P1: KaD0521772524c06.xml CB802/Blair 0 521 77252 4 April 30, 2005 12:43
162 Franchise Tying Contracts
Although it is true that the franchisees have a larger investment than copierowners, it is also true that franchisees have a revenue-generating asset that hassignificant resale value. Kodak equipment owners, however, had invested in adepreciating durable good with rapidly declining resale value.182 Thus, whileswitching costs may have effectively locked-in the owners of Kodak copiers,switching costs may not present a similar problem for franchisees: franchiseescan sell their franchise if they find that it does not live up to their expectations.Further, in contrast to a Kodak copier that depreciates rapidly, a franchise may,in fact, appreciate considerably. Franchisees may well be unhappy that theirprofits are lower than they would be if they were permitted to buy ingredientswherever they choose, and/or that they cannot sell their franchise at as high aprice as they could obtain were it not for these restrictions on sources of supply,but that does not mean that they are earning no profits.183 Importantly, thatfranchisee profits are not as high as they could be in the absence of a tyingcontract does not by itself implicate anticompetitive injury.
Information Costs. The Supreme Court was persuaded by the plaintiffs’argument in Kodak that information costs prevent buyers from effectively per-forming life-cycle cost calculations.184 Similarly, plaintiffs in recent franchisetying cases claim to fall victim to information asymmetries. It is difficult to beswayed by such arguments, however, in an industry that has extensive disclo-sure requirements that should reduce asymmetric information. Specifically,since 1979, Federal Trade Commission Rule 436 has required the disclosure ofinformation to prospective franchisees, including requisite supplies that mustbe purchased and whether they must be purchased from particular suppliers.Furthermore, many states have added their own disclosure requirements withthe prospective franchisees’ interests in mind. Consequently, most franchisesystems now have some type of UFOC that provides information regard-ing expected costs for requisite supplies. In addition, existing franchiseesserve as valuable and accessible sources of information to prospective fran-chisees. Indeed, prospective franchisees are encouraged by trade publications,
182 Akerlof (1970) explains why market prices of used durables tend to be low. Whendurables are resold, some of them are better than average and some are worse. Sellersknow the difference, but buyers do not. As a result, buyers rely on the average quality.This leads sellers to withhold those durable goods that are better than average, whichcauses the average quality of those on the market to fall further and thus leads to an evenlower market price. Asymmetric information about product quality between buyersand sellers is the root of this problem.
183 See Kaufmann and Lafontaine (1994) for an analysis of the profitability of a McDonald’sfranchise.
184 See Blair and Herndon (1996) for a technical analysis of life-cycle pricing and a critiqueof Kodak.
P1: KaD0521772524c06.xml CB802/Blair 0 521 77252 4 April 30, 2005 12:43
6.6 Identifying Market Power After Kodak 163
attorneys, consultants, and franchisors themselves to contact existing fran-chisees of various systems before investing in any particular franchiseopportunity.
Despite the prevalence of such information, Grimes (1996) argues thatfranchisors may have information advantages that allow them to engage in“pre-contract opportunism.” That is, the franchisors are able to dupe would-be franchisees into making poor investment decisions. But he concedes thatthis is more likely to occur in newer, high-risk systems rather than for well-established franchise systems, such as McDonald’s. This is because a largeamount of information is readily available on such systems and they havevaluable reputations at stake that make it expensive for them to engage insuch deceptive practices. Interestingly, however, recent franchise tying casesconcern well-established and relatively low-risk systems. This suggests that itmay be the franchisees, not the franchisors, who are behaving opportunisti-cally in these cases.
In explicit tying cases, such as Wilson, the potential franchisees know thatpost-contractual exploitation is possible because the obligation to buy thesupplies is explicit even though the prices are not guaranteed. Indeed, as-serting that Kodak was inapplicable, the defendants in Wilson noted that thefranchisees were aware of the obligation to buy from Mobil prior to signingtheir franchise agreements. The court, however, stated that the facts of the casewere not clear in indicating to what extent franchisees did indeed know aboutthe arrangement and, moreover, that “it is not self-evident . . . that before-the-fact disclosure of the tie-in means in all cases that information costs arenot so high as to preclude accurate life-cycle pricing. . . . It may well be thatdisclosure that a tie-in exists does not allow accurate life-cycle pricing of thelong-term franchise agreement and the purchase of ten-years’ worth of tiedproducts, equipment, and financial services.”
To the extent that an explicit tie creates uncertainty for the franchisee,it makes the franchise opportunity less attractive. This greater uncertaintywill be reflected in a lower initial franchise fee as a risk-averse franchisee’swillingness to pay will be reduced. It is clear that eliminating the tied salesof equipment and supplies would raise the periodic net operating revenues.Competition among potential franchisees for the opportunity to own thisbusiness, however, and/or the desire of the franchisor to capture the outletprofits to the same extent as before, would then lead to an increase in theinitial franchise fee or in the periodic fees so that the net present value ofjoining the chain would be unaltered in the end. Note that those franchiseesalready “locked in,” however, who agreed to pay the earlier set of fees underthe presumption that they would pay relatively high prices for the inputs
P1: KaD0521772524c06.xml CB802/Blair 0 521 77252 4 April 30, 2005 12:43
164 Franchise Tying Contracts
provided by the franchisor, stand to benefit if they can get these purchaserequirements eliminated from their set of contractual obligations.
In the case of an implicit tie, the franchisor allegedly misleads the franchiseeby promising to approve alternative sources of supply, but never doing so. Inessence, the franchisee is led to believe that competition for sales of equipmentand supplies will protect him from post-contractual exploitation, but thatcompetition never materializes because the franchisor reneges on his promise.
There are two points to make here. First, while this is a breach of contract,it is not monopolization in the antitrust sense. A promise was made, but notkept. If there are damages, they are contract damages rather than antitrustdamages. Second, this strategy of reneging on contractual obligations makeslittle sense. As potential franchisees become aware of the fact that the contrac-tual guarantees are not guarantees at all, they must assume that they will beobligated to purchase all equipment and supplies from the franchisor. Thus,the implicit tie becomes an explicit tie.
6.7 Post-Contractual Opportunism
Whether the tie is explicit or implicit in nature, all of the recent franchise tyingallegations essentially involve concerns of post-contractual opportunism bythe franchisor. Basically, recent franchisee allegations boil down to the com-plaint that they are being overcharged for requisite ingredients and supplies.This overcharge must be the underlying source of the franchisees’ complaint,for otherwise they would suffer no injury. It is important to emphasize that thealleged monopoly power that the franchisor has is ex post since the franchiseeis presumably locked in to purchasing requisite supplies for the franchiseoperation. Ex ante, of course, the franchisor has no market power since itis competing with hundreds of other franchisors for the sales of franchiselicenses.
Since the franchisor ultimately operates in a fairly competitive industryfor franchise licenses, it will earn a competitive return no matter how itstructures the cost to the franchisee. If the franchisee is effectively “lockedin” to the franchisor’s particular system once a commitment is made, thefranchisor may indeed recognize that it has the opportunity to earn quasi-rents in the “aftermarket” for supplies. That is, the franchisor may be temptedto exercise post-contractual opportunism. But the economic reality is that thecompetition that exists for the sales of franchise licenses will cause the initialfranchise fee to fall until a new competitive equilibrium is attained. In otherwords, vigorous competition for franchise licenses drives the franchisor’seconomic profit to zero. No matter how the franchisor structures its revenue

P1: KaD0521772524c06.xml CB802/Blair 0 521 77252 4 April 30, 2005 12:43
6.7 Post-Contractual Opportunism 165
stream, market forces will compel it to earn a competitive return. Interestingly,the Eleventh Circuit implicitly recognized this fact in Kypta v. McDonald’sCorporation (1982) in its discussion of damages: “A determination of thevalue of the tied product alone would not indicate whether the plaintiff indeedsuffered any net economic harm, since a lower price might conceivably havebeen exacted by the franchisor for the tying product. Unless the fair marketvalue of both the tied and tying products are determined and an overchargein the complete price found, no injury can be claimed; suit, then, would beforeclosed.”
The franchisor has at least two rational and reasonable incentives to lowerthe initial franchise fee and earn quasi-rents on supplies. When one considersthat there is typically a high initial lump-sum cost in obtaining a franchise li-cense, this may be a particularly appealing strategy for both the franchisor andthe franchisee since it allows the franchisee to pay a lower initial fee and spreadmore of the cost over time. A lower franchise fee may enable the franchisorto attract a greater number of potential franchisees.185 The obvious questionthen is why not simply raise the royalty payments rather than employ a tyingarrangement. One argument that has been offered is that by restricting thesources of supplies, franchisors are better able to monitor quality and preventfree riding by franchisees, that is, prevent post-contractual opportunism bythe franchisee. Klein and Saft (1985) have noted that such a tying arrange-ment serves as an efficient means for “policing” the behavior of the franchisee.Michael’s (2000b) data, which we mentioned in the introduction, support thisargument as they show that franchisors that impose such requirements mostlydo so for inputs that are central to the identity of the product and the chain.Of course, the same analysis performed in the late 1960s or early 1970s beforethe Chicken Delight decision may have revealed otherwise. But at this point,tied inputs in business-format franchising seem to be limited in scope to thosetypes of inputs that the franchisor needs to ensure consistent product quality.The tie-in arrangement thus serves the twofold purpose of allowing the fran-chisor to compete in the sales of franchise licenses by offering a lower initialfee and to monitor quality and prevent free riding.186 Ironically, it is the very
185 The existence of numerous listings and articles advertising “low-cost” franchises basedon low initial investments and fees suggests that indeed initial cost matters in a fran-chisee’s decision or ability to join a franchise. Kaufmann and Lafontaine (1994) alsoargue that McDonald’s leaves rents with franchisees above and beyond the initial feesand investments in specific assets because it could not successfully attract the type ofowner operators it desires if it charged the level of fees upfront that would be requiredto recover all the ex post profits.
186 See Chapter 5.
P1: KaD0521772524c06.xml CB802/Blair 0 521 77252 4 April 30, 2005 12:43
166 Franchise Tying Contracts
incentives that the franchisor has to implement tying arrangements that havebeen employed against it in antitrust litigation. The high initial franchise feethat is characteristic of many franchise systems, and that the franchisor maybe lowering in its attempts to sell franchise licenses by making them moreaffordable, has served as the basis for the lock-in argument. The franchisor’sincentive to deter post-contractual opportunism by franchisees has resultedin franchisees accusing the franchisor of post-contractual opportunism.
Indeed, the lure of treble damages under the Sherman Act may be induc-ing franchisees to engage in post-contractual opportunism by alleging illegaltying. For example, in Wilson, the franchisees were obviously aware of the tiesince it was spelled out in the franchise agreement. The fact that they agreedto the franchise contract indicates that the value of owning a SpeeDee fran-chise was at least as great as the net present value of the associated costs andthat despite the tie-in. As noted above, any uncertainty regarding future costswould only serve to decrease the franchisee’s willingness to sign the franchiseagreement. That they made this commitment in a competitive franchise en-vironment indicates that they expected to receive at least a competitive returnfrom joining the SpeeDee franchise system – even in the presence of uncertainfuture costs. The franchisees’ tying allegations in that context thus indicatethat franchisees also are apt to try and capture additional surplus by engagingin some post-contractual opportunism of their own.
6.8 Evaluating Franchise Opportunities
For a potential franchisee to select among the enormous range of franchise op-portunities that exist, he or she must compare the anticipated profit flows thateach affords. In order to do this, the prospective franchisee must have someability to forecast future revenues and future costs at least in some rough fash-ion. He or she must also take into account any timing differences and estimatethe present values of the profit flows, which must then be compared to the ini-tial franchise fees demanded by the various franchisors. Clearly, this assumesthat the prospective franchisee is well informed and somewhat sophisticatedeconomically. In fact, prospective franchisees may be economically unsophis-ticated and not particularly well-informed. They may not be able to performlife-cycle cost calculations, net present value calculations, or revenue fore-casts. Moreover, franchisees may not receive adequate information from thefranchise disclosure documents to perform life-cycle cost calculations evenif they did know how to perform them. Due to the complications related todocumenting earnings claims, the vast majority of franchisors choose to notprovide revenue and profit projections to prospective franchisees. According

P1: KaD0521772524c06.xml CB802/Blair 0 521 77252 4 April 30, 2005 12:43
6.8 Evaluating Franchise Opportunities 167
to the IFA Educational Foundation and Frandata (2000), only 25 percent ofthe 1226 franchisors in their data offered an earnings claim as part of theirdisclosure document.187 The lack of relevant data on income and costs is com-pounded by the fact that most prospective franchisees are unable to projectpotential revenues given the economic and demographic characteristics ofthe trade area surrounding the proposed location. All these data limitationscombine with the technical difficulty of the required calculations to under-mine the prospect’s ability to make a well-informed decision. They also putthe prospect at the mercy of unscrupulous franchisors who may choose toinflate the potential franchisee’s expectations of profitable investments intheir systems, thereby adding to the confusion. In this event, the prospectivefranchisee will be hard-pressed to make intelligent choices among the extantfranchise opportunities.
All of these considerations mean that prospective franchisees must use allof the resources that are available to them to evaluate available franchise op-portunities. Irrespective of the fact that the franchisor may be friendly, he isnot a friend, but rather a potential business associate. The same is true of fran-chisees. While they may be very cooperative during the courting stage, theyare not friends. Both franchisors and franchisees must adopt a strictly busi-ness attitude toward one another. No unverified or unverifiable claims shouldbe believed.188 Prospective franchisees should consult existing franchisees todiscover which franchisor claims are fact and which are fancy. Attorneys andaccountants who are experienced with franchising should be, and in factare, relied upon. They can offer valuable advice and protect franchisees fromavoidable errors.189
Our point, however, in relation to tying contracts is that prohibiting theiruse does not improve the franchisee’s access to information or ability toevaluate different franchise options. Tie-ins in franchising are simply one
187 Franchised systems that do not divulge an earnings claim are then required by law tomake no claim at all as to the likely financial results of the business they are trying to en-tice the franchisee to invest in. Not surprisingly, there are numerous claims in the tradepress that franchise sales people try to get around this rule by “unofficially” disclosingfinancial information to potential franchisees even though this is not permitted.
188 Some prospective franchisees refuse to take care of themselves; see, e.g., Gibson (1998),which reports on several prospective franchisees who ignored information on poorgrowth in sales. Some prospects do not even talk to other franchisees before makingtheir own commitment.
189 A telephone survey of 500 franchisees and 200 potential franchisees conducted by aprivate survey firm for the FTC in 1984 revealed that 69 percent of franchisees obtainedoutside assistance before signing franchise contracts, with 49 percent of franchiseesconsulting an attorney specifically. See Beales and Muris (1995) for more details.
P1: KaD0521772524c06.xml CB802/Blair 0 521 77252 4 April 30, 2005 12:43
168 Franchise Tying Contracts
of the mechanisms by which franchisors earn returns from their franchisedoutlets, and they should be recognized and treated as such by all concerned,including the antitrust authorities and the courts.
6.9 Conclusion
In traditional franchising as in most distribution channels, franchisors obtainrevenues from their franchisees by selling goods to them at a markup. Whereassuch practices are legal in traditional franchising, the antitrust definition andtreatment of tying arrangements has meant that business-format franchisorsare subject to litigation if they rely on input markups as a source of rev-enues because their franchisees already are purchasing “a business format”from them. Hence, most business-format franchisors limit input purchaserequirements to just the few items that are indistinguishable from the tradename itself, and use approved supplier programs for the rest.
In this chapter, we have detailed the antitrust treatment of tying contractsgenerally, and specifically as it applies to franchising. We have also discussedhow the treatment of tying cases has evolved over time, and especially how theKodak decision affected the regulatory regime for franchisors, and reviewedsome of the more important decisions since.
In the end, it is important to reiterate that tie-ins in franchising serve thedouble purpose of facilitating quality control and allowing franchisors toobtain revenues from their franchised outlets. Explicit contractual restraintsshould be treated as an integral part of the agreement – attempts by franchiseesto have such components of the agreements they signed rendered void by thecourt system may best be seen as a form of franchisee post-contractual op-portunism. And while after-the-fact changes in the extent of input purchaserequirements by franchisors may constitute franchisor opportunism, thesecan give rise to claims of contractual breach, but are not a source of antitrustinjury. Finally, as other forms of vertical control and, especially, vertical in-tegration, are treated less harshly by the courts, the strict regulatory regimethat prevents tying in franchised chains might lead franchisors to rely onfranchising less, thereby reducing the set of future opportunities for potentialand existing franchisees alike. This would be a perverse result indeed for apolicy whose goal presumably is to protect franchisees.
6.10 Appendix: Vertical Integration and Tying Contracts
In Chapter 4, we showed that for a monopoly selling an input to a down-stream firm, tying is economically equivalent to vertical integration if the
P1: KaD0521772524c06.xml CB802/Blair 0 521 77252 4 April 30, 2005 12:43
6.10 Appendix: Vertical Integration and Tying 169
downstream market is competitive and the franchisee uses only this input or,equivalently, when he must use one unit of the franchisor’s input for every unitof output it produces. This type of downstream production process exhibitswhat are called fixed proportions. In our discussion of this result, we hintedthat the situation is more complex when the franchisee uses several differentinputs that he can combine in different proportions to generate his output,that is, when his production function exhibits what are called variable propor-tions. In this appendix, we show that the economic equivalence of tying andvertical integration holds under downstream competition if the franchisee’sproduction function is characterized by variable proportions.190 To achievethe vertically integrated outcome in this case, however, the franchisor mustrequire that the franchisee purchase all inputs from him or her.
In what follows,191 we let P (Q) represent the inverse demand function forthe franchisee’s output, Q(x1, x2) stand for a linearly homogenous productionfunction so that we have constant returns to scale downstream, and ci denotesthe constant marginal cost of input xi , i = 1, 2. We limit ourselves to twoinputs, for simplicity. The result is the same with more inputs, but as will beclear, the tie then must involve all of them. We assume that the production ofx1 is monopolized while the markets for input x2 and for the final good Q arecompetitive. If Q(x1, x2) admits variable proportions, the full monopoly rentscannot be obtained solely from the sale of x1 because the derived demand forthe monopolized input will reflect both consumer and franchisee substitutionin response to the supracompetitive price of x1. Franchisee substitution leadsto economically inefficient use of inputs in production that the franchisorcan circumvent through forward integration.
Suppose that x1 is only used in the production of Q, and that the producerof x1 can successfully vertically integrate all producers of Q. This strategywould then yield the following profit function for the integrated monopolist(who would not be a franchisor),
�V = P · Q(x1, x2) − c1x1 − c2x2, (A1)
since x1 would be priced at marginal cost internally to achieve maximumprofits.
190 Vernon and Graham (1971) showed that with variable proportions downstream, amonopolist that would tie only his input would not achieve the vertically integratedlevel of outcome. This gave rise to a new reason to vertically integrate and fueled arevival in interest for theories of vertical integration.
191 This section relies on Blair and Kaserman (1978).
P1: KaD0521772524c06.xml CB802/Blair 0 521 77252 4 April 30, 2005 12:43
170 Franchise Tying Contracts
Alternatively, the producer of x1 could remain separate from the down-stream firms and sign a franchise agreement with each of them. The producercould then purchase x2 at the competitive price c2 and tie the purchase of x2
by its franchisees to the purchase of the monopolized input x1. Following thisstrategy, the franchisor would have the following profit function,
�T = p1(x1, x2) · x1 + p2(x1, x2) · x2 − c1x1 − c2x2, (A2)
where pi is the price charged by the franchisor to all its franchisees for thei th input. Note that both prices need to be set optimally as a function of theamount of both types of inputs purchased to induce the franchisees to usethem in the right proportions; therefore they are both functions of x1 and x2.To simplify notation, however, we refer to them simply as p1 and p2 in whatfollows.
Under these conditions, vertical integration and tying are economicallyequivalent. That is, these strategies yield identical results with regard to bothprofitability and productive efficiency. This assertion can be shown by provingthe following two propositions:
Proposition I. Given a monopoly in x1, vertical integration that results in themonopolization of the market for Q and tying the purchase of x2 to the purchaseof x1 yields identical profits to the producer of x1.
Proof. We want to show that �V = �T . Canceling input costs from (A1) and(A2), this requires that
P · Q(x1, x2) = p1 · x1 + p2 · x2. (A3)
Under the tying arrangement, the franchisees accept p1, p2, and P as given: p1
and p2 are chosen by the franchisor as a function of x1 and x2 so as to inducethe optimal input mix, and P is exogenous to the franchisee due to compe-tition. Profit maximization on the part of the franchisee requires that he setthe value of the marginal product of each input equal to its price, i.e., that
P · ∂ Q
∂xi= pi , i = 1, 2 (A4)
Substituting (A4) into (A3) and factoring P, we obtain
P · Q(x1, x2) = P
(∂ Q
∂x1· x1 + ∂ Q
∂x2· x2
), (A5)
which yields the desired result, namely,
P · Q(x1, x2) = P · Q(x1, x2), (A6)
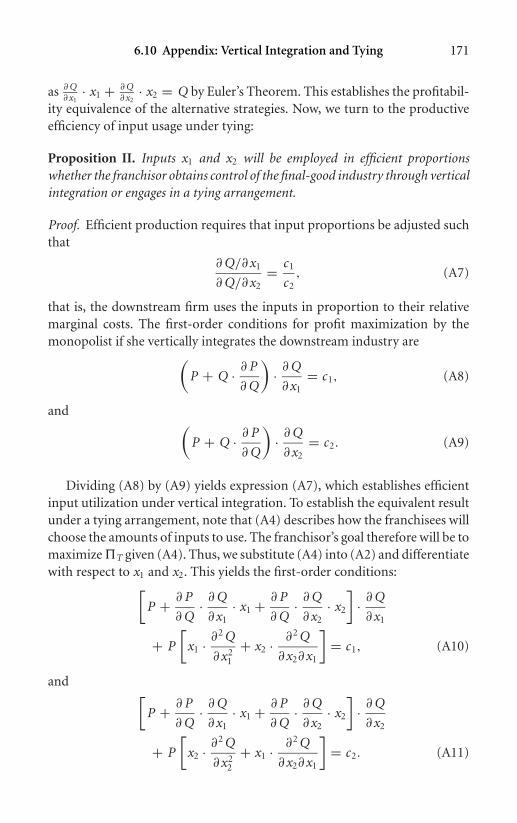
P1: KaD0521772524c06.xml CB802/Blair 0 521 77252 4 April 30, 2005 12:43
6.10 Appendix: Vertical Integration and Tying 171
as ∂ Q∂x1
· x1 + ∂ Q∂x2
· x2 = Q by Euler’s Theorem. This establishes the profitabil-ity equivalence of the alternative strategies. Now, we turn to the productiveefficiency of input usage under tying:
Proposition II. Inputs x1 and x2 will be employed in efficient proportionswhether the franchisor obtains control of the final-good industry through verticalintegration or engages in a tying arrangement.
Proof. Efficient production requires that input proportions be adjusted suchthat
∂ Q/∂x1
∂ Q/∂x2= c1
c2, (A7)
that is, the downstream firm uses the inputs in proportion to their relativemarginal costs. The first-order conditions for profit maximization by themonopolist if she vertically integrates the downstream industry are(
P + Q · ∂ P
∂ Q
)· ∂ Q
∂x1= c1, (A8)
and (P + Q · ∂ P
∂ Q
)· ∂ Q
∂x2= c2. (A9)
Dividing (A8) by (A9) yields expression (A7), which establishes efficientinput utilization under vertical integration. To establish the equivalent resultunder a tying arrangement, note that (A4) describes how the franchisees willchoose the amounts of inputs to use. The franchisor’s goal therefore will be tomaximize �T given (A4). Thus, we substitute (A4) into (A2) and differentiatewith respect to x1 and x2. This yields the first-order conditions:[
P + ∂ P
∂ Q· ∂ Q
∂x1· x1 + ∂ P
∂ Q· ∂ Q
∂x2· x2
]· ∂ Q
∂x1
+ P
[x1 · ∂2 Q
∂x21
+ x2 · ∂2 Q
∂x2∂x1
]= c1, (A10)
and [P + ∂ P
∂ Q· ∂ Q
∂x1· x1 + ∂ P
∂ Q· ∂ Q
∂x2· x2
]· ∂ Q
∂x2
+ P
[x2 · ∂2 Q
∂x22
+ x1 · ∂2 Q
∂x2∂x1
]= c2. (A11)

P1: KaD0521772524c06.xml CB802/Blair 0 521 77252 4 April 30, 2005 12:43
172 Franchise Tying Contracts
Linear homogeneity of the production function implies that the secondbracketed term on the left-hand side of (A10) and (A11) is zero. Drop-ping these terms, we factor ∂ P
∂ Q from the last two terms of the first brack-eted expression, apply Euler’s Theorem, and write conditions (A10) and(A11) as (
P + Q · ∂ P
∂ Q
)· ∂ Q
∂x1= c1, (A12)
and (P + Q · ∂ P
∂ Q
)· ∂ Q
∂x2= c2. (A13)
Dividing (A12) by (A13) again results in expression (A7), thereby confirmingefficient input utilization under a tying arrangement.
Propositions I and II establish an equivalence between both the privateand the social effects of vertical integration and tying under input monopolyand variable proportions with downstream competition. Given such sym-metry, the firm holding monopoly power over an input for which (imper-fect) substitutes exist must select between alternative strategies on the basisof factors that lie outside our simplified model. Important considerationsthat will influence this choice include the number of substitutable inputsthat must be tied to the monopolized input in order to ensure efficientdownstream production; the frequency of changes in the costs, ci, and thecost of changing the prices to franchisees in response to those changes incosts; potential cost savings that may be available through vertical integra-tion because of transactional efficiencies or technological inseparability ofthe various stages of production; the feasibility of vertical integration withthe whole downstream sector; and the comparative treatment afforded thealternative strategies by the antitrust authorities. The latter is determinedby the policy thrust of the antitrust enforcement agencies as well as legalprecedents.
Of course, if the franchisor cannot impose requirements on all inputs, thenvertical integration will dominate franchising unless there are incentive is-sues under vertical integration (e.g., paid managers have weaker incentivesto provide effort than owner operators do). Moreover, while in many indus-tries manufacturers cannot reasonably vertically integrate all downstreamresellers – their product is just one of a large mix of products sold at su-permarkets or in large department or discount stores – in the franchising

P1: KaD0521772524c06.xml CB802/Blair 0 521 77252 4 April 30, 2005 12:43
6.10 Appendix: Vertical Integration and Tying 173
context, however, vertical integration is a readily available option. As we saw inChapter 4, most franchisors operate some of their outlets directly as it is. In-creasing their reliance on vertical integration is always an option they canturn to if they find that their capacity to contract with franchisees is tooconstrained by the regulatory regime.
P1: KaD0521772524c07.xml CB802/Blair 0 521 77252 4 April 30, 2005 12:51
7
Vertical Price Controls in Franchising
“Why do your prices vary from one restaurant to another and why do somerestaurants charge for extra condiments?[”]
Approximately 85 percent of McDonald’s restaurants are locally owned andoperated. As independent businesspeople, each individual determines his or herown prices taking their operating costs and the company’s recommendationsinto consideration. Therefore, prices do vary from one McDonald’s restaurantto another. Also, for this same reason, charges for condiments may vary fromone McDonald’s restaurant to another. (McDonald’s Corporation Web site, June2003)
7.1 Introduction∗
Prices vary somewhat from outlet to outlet in most franchised chains. This hasbeen confirmed in several empirical studies, including Lafontaine (1995b),Graddy (1997), Thomadsen (2002), and Kalnins (2003), all of which examinedprice data they had gathered from the individual outlets of large fast-foodchains within relatively small geographical markets. Moreover, Lafontaine(1999) has examined the relationship between the extent of franchising andthe degree of price dispersion in local markets, namely the Pittsburgh andthe Detroit metropolitan areas. She finds that several fast-food chains allowsome price dispersion even within their set of corporate stores. The amount ofprice dispersion, however, is larger for fully franchised than for fully corporatechains. She finds the greatest total amount of price dispersion among thosechains with a mix of corporate and franchised stores.
Although the quote above from the McDonald’s Web site suggests thatprice differences across outlets are a normal and accepted part of franchising,
∗ This chapter relies heavily on Blair and Lafontaine (1999).
174

P1: KaD0521772524c07.xml CB802/Blair 0 521 77252 4 April 30, 2005 12:51
7.1 Introduction 175
it is not uncommon for franchisors and franchisees to disagree about theprices that the franchisees charge their customers. In fact, earlier in the his-tory of McDonald’s, Ray Kroc became furious at one of his first franchisees,Bob Dondanville, for raising his price from 15 to 18 cents. “The 15-centshamburger was central to McDonald’s image. . . . As soon as he learned ofDondanville’s price increase, Kroc fired off a telegram . . . ‘Take down yourarches,’ it demanded” (Love 1986: 75). More recently, Gibson (1996) re-ported that McDonald’s franchisees were complaining about their franchisor’suse of “value meals” as they found the prices of these meals too low. In anearly survey of franchisees, Ozanne and Hunt (1971) found that franchisees’“. . . complaints about the poor quality of pricing assistance center aroundfranchisors trying to keep prices low” (158).
In the United States, franchisors have been on shaky legal ground his-torically when they have tried to impose resale price controls on their fran-chisees. In 1968, the Supreme Court decided Albrecht v. Herald Company andthereby made vertically imposed maximum resale prices illegal per se.192 Theresulting Albrecht rule meant that upstream firms could not impose a ceilingon the prices charged by their resellers. This rule applied not only to arm’slength seller–reseller relationships, but also to franchisors, in their relation-ships with their franchisees, as the latter are independent businesses underthe law. After some 30 years of sustained academic criticism, of firms find-ing and implementing alternatives to maximum price controls, and of lowercourts evading the dictates of Albrecht, the Supreme Court recently overruledAlbrecht. In State Oil Company v. Khan, the Court returned the antitrusttreatment of maximum resale price fixing to the rule of reason. For all in-tents and purposes, this ruling will permit maximum resale price restraints inthe U.S.
In our view, this change in the Court’s treatment of maximum resale pricemaintenance is a good thing in general and for franchising in particular.193
192 Minimum resale price maintenance is also per se illegal in the U.S., but the economicrationale for minimum resale price maintenance, and the set of precedents govern-ing the per se rule against it, are different from those that govern maximum resaleprice maintenance. Given that the complaints from franchisees, and the legal casesagainst franchisors, have been about franchisors imposing price ceilings or pushingfranchisees’ prices down, we focus exclusively on maximum resale price maintenance.For treatments of minimum resale price maintenance under U.S. antitrust, see Blairand Kaserman (1985).
193 In addition to Blair and Lafontaine (1999), see Blair and Lopatka (1998a, 1998b) forextended analyses.
P1: KaD0521772524c07.xml CB802/Blair 0 521 77252 4 April 30, 2005 12:51
176 Vertical Price Controls in Franchising
Because such restraints preclude franchisees from raising prices, they ob-viously benefit consumers. As we shall show below, they also increase theprofits of franchisors and thereby make them better off – in fact, therein liestheir desire to impose such restraints. Not so obviously, however, actual andprospective franchisees as a group may also be better off because a franchisor’sability to restrict the pricing freedom of its franchisees makes franchising moreattractive and thereby expands available franchise opportunities.
Interestingly, a similar change in the treatment of maximum prices hasoccurred in Europe: the stance adopted by the European Commission in itsnew block exemption for vertical restraints, which took effect on June 1,2000, is in line with Khan. The block exemption specifically distinguishesmaximum price restraints from other vertical price controls – minimum resaleprices or set prices – treating the latter as “hardcore restrictions” that takean agreement outside the block exemption. Maximum prices, on the otherhand, like suggested prices, are treated much less harshly: They are completelylegal for suppliers whose market share is below 30 percent, and are subjectto review, but not presumed illegal still, when a supplier has more than a30 percent market share.194 Under the old block exemption for franchises, allforms of price controls – maximum, minimum, or direct – were “blacklisted,”meaning that their presence in an agreement took the agreement outside thescope of the exemption.
In this chapter, we provide a thorough examination of the U.S. antitrustlaw and the economics of maximum resale price restraints. Because the an-titrust prohibitions have been so severe, we begin by examining briefly theforerunners of Albrecht, the landmark Albrecht decision, and the Khan deci-sion. We then turn our attention to an economic analysis of the three mainreasons why franchisors may want to impose a ceiling on the prices chargedby their franchisees. The first flows from the standard successive monopolyargument, common to all retailing, where upstream and downstream firmsboth have some degree of market power. The second stems from the use ofa common tradename in franchising, a tradename that gives rise to positivedemand externalities. The third is based on the argument that franchisorsmay behave opportunistically toward their franchisees. This last explanationis the one that franchisees explicitly or implicitly rely on when complainingabout their franchisor’s attempt to control their prices. Finally, we combinethe law and the economics when we examine the public policy implicationsof Khan.
194 See European Commission (2002) and Flohr (2000).

P1: KaD0521772524c07.xml CB802/Blair 0 521 77252 4 April 30, 2005 12:51
7.2 Maximum Resale Price Fixing 177
7.2 The Legal History of Maximum Resale Price Fixing inthe United States
7.2.1 Forerunners of Albrecht
In the case of United States v. Socony-Vacuum, against the backdrop of ahorizontal agreement among competitors to raise prices, the Supreme Courtsweepingly stated that “[a]ny combination which tampers with price struc-tures is engaged in an unlawful activity” (Socony-Vacuum at 221). To under-score the point, the Court went on to say that “[u]nder the Sherman Act acombination formed for the purpose and with the effect of raising, depress-ing, fixing, pegging, or stabilizing the price of a commodity in interstate orforeign commerce is illegal per se” (Socony-Vacuum at 212–213; emphasisadded). Through this expansive ruling, the Supreme Court set the stage forspecifically condemning maximum resale price fixing, a practice that tendsto depress prices and thus benefit consumers.
The pronouncement of the per se illegality of “depressing” prices was nottested until the Supreme Court’s 1951 ruling in Kiefer-Stewart v. Joseph E.Seagram & Sons. In response to a horizontal conspiracy among Kiefer-Stewartand other wholesale liquor dealers to raise their resale prices to retailers, twoliquor suppliers, Calvert and Seagram, agreed to refuse to sell their products tothese wholesalers unless the wholesalers agreed not to charge more than a spec-ified maximum price (Kiefer-Stewart at 212–213). When Kiefer-Stewart re-fused to respect these maximum resale prices, its supplies were cut off. Kiefer-Stewart subsequently sued for the lost profits on the lost sales of Calvert andSeagram products. Despite the obvious benefit to consumers of lower prices,the Court ruled in favor of Kiefer-Stewart. Embracing the Socony-Vacuumpronouncement, the Court ruled that agreements to fix maximum resaleprices “cripple the freedom of traders and thereby restrict their ability to sellin accordance with their own judgment” (Kiefer-Stewart at 213).195 As a result,such agreements were declared illegal and the first step was taken in deprivingfranchisors of their ability to control the resale prices of their franchisees.
In Socony-Vacuum and Kiefer-Stewart, the facts suggested the existenceof horizontal agreements among competitors. As horizontal agreements re-garding price are among the most pernicious evils that the antitrust lawsare designed to thwart, the Court in these cases had some cause for alarm.
195 This, of course, ignores the impact on their customers as well as on their suppliers whowant to restrict their pricing freedom.

P1: KaD0521772524c07.xml CB802/Blair 0 521 77252 4 April 30, 2005 12:51
178 Vertical Price Controls in Franchising
Therefore, the question remained as to whether – absent any hint of horizontalcollusion among competitors – the Supreme Court would still stand so solidlybehind its Socony-Vacuum pronouncement. In other words, it was not yetclear how the Socony-Vacuum test would be applied in a case where there wasa purely vertical attempt (e.g., by a franchisor) to impose maximum resaleprices (e.g., on a franchisee). In Albrecht, the Court was confronted with thesesimplified facts and gave a clear answer favoring resellers.
7.2.2 The Albrecht Rule
The Herald Company, which published the Globe-Democrat newspaper,awarded exclusive territories to its carriers, thereby giving each carrier a lo-cal monopoly. The carriers purchased the newspapers at wholesale pricesfrom the Globe-Democrat. The carriers then performed the retail distributionfunction by delivering the newspapers to subscribers’ homes. The HeraldCompany advertised a home delivered price and required, under threat oftermination, that its carriers honor that price. Despite this threat, one of thecarriers, Albrecht, decided to charge his customers more than the advertisedprice. When the Herald Company terminated Albrecht, a lawsuit ensued.The lower courts found that the Globe-Democrat’s policy did not constitute arestraint of trade, but the Supreme Court reversed and ruled for Albrecht.
In its ruling, the Supreme Court, reaffirming Kiefer-Stewart and echo-ing Socony-Vacuum, once again condemned maximum resale price fixing:“. . . schemes to fix maximum prices, by substituting the perhaps erroneousjudgment of a seller for the forces of the competitive market, may severelyintrude upon the ability of buyers to compete and survive in that market”(Albrecht at 152). Without specifying what “forces of the competitive market”it thought were operative in Albrecht’s exclusive territory, the Court went onto explain:
Maximum prices may be fixed too low for the dealer to furnish services es-sential to the value which goods have for the consumer or to furnish servicesand conveniences which consumers desire and for which they are willing topay. Maximum price fixing may channel distribution through a few large orspecifically advantaged dealers who otherwise would be subject to significantnonprice competition. Moreover, if the actual price charged under a maximumprice scheme is nearly always the fixed maximum price . . . the scheme tends toacquire all the attributes of an arrangement fixing minimum prices. (Albrechtat 152–153)
Thus, erroneously equating the economic effects of maximum resale pricefixing with those of minimum resale price fixing, the Court found that fixing

P1: KaD0521772524c07.xml CB802/Blair 0 521 77252 4 April 30, 2005 12:51
7.2 Maximum Resale Price Fixing 179
maximum resale prices is illegal per se under Section 1 of the Sherman Act.Unilateral restraints on a reseller’s freedom to raise price became illegal per se,irrespective of their potential benefits to consumers. Albrecht, in that sense,gave resellers a considerable weapon to wield against upstream firms whomight seek to limit their pricing decisions. The Albrecht decision gave resellersa treble damage claim against upstream firms that imposed maximum resaleprices.196 It also provided an appealing rationale for failing to give customerslower prices. This rationale was, in essence, that the imposition of lower pricesby upstream firms would ultimately harm consumers by squeezing profits outof the resellers, which would in turn lead to a reduction in the availabilityof desired products and services. Although such a rationale has superficialappeal, it ignores the fact that it would be contrary to the upstream firm’sinterest to prevent resellers from offering goods and services that consumersvalue as this would ultimately damage the market for the upstream firm’sproduct.
In fact, because maximum resale price maintenance implies lower con-sumer prices, it is difficult to comprehend why the practice should be illegalper se under our antitrust laws. Not surprisingly then, the decision gener-ated substantial academic criticism.197 Despite this criticism and a judicialopportunity to respond to it, the Supreme Court let the rule stand. In AtlanticRichfield Co. v. USA Petroleum Co (or ARCO), for example, Atlantic Richfieldhad imposed maximum resale prices on its gasoline dealers.198 As a result ofAtlantic Richfield’s low, but not predatory, prices, one of its gasoline dealers’competitors, USA Petroleum, alleged that it lost sales and profits. It sued onthe grounds that its injuries were the result of Atlantic Richfield’s illegal policyof imposing maximum resale prices on its dealers.
On these facts, the Supreme Court might have seized the opportunity tooverturn the Albrecht rule or at least severely curtail it. But it did not expresslydo so. Instead of confronting Albrecht, the Court observed that USA Petroleumwas merely frustrated by its inability to raise prices.199 Therefore, the Court
196 Section 4 of the Clayton Act provides in relevant part that “anyone who shall be injuredin his business or property by reason of anything forbidden in the antitrust laws maysue therefor . . . and shall recover threefold the damages by him sustained, and the costof suit, including a reasonable attorney’s fee. . . . ” 15 USC § 15.
197 For the earliest, severe criticisms, see the dissenting opinions of Justices Harlan (Albrechtat 156) and Stewart (Albrecht at 168). In addition, see Blair and Kaserman (1981),Easterbrook (1981), Blair and Fesmire (1986), and Areeda and Hovenkamp (1993Supp.).
198 For an analysis of this case, see Blair and Lang (1991).199 On remand from the Supreme Court, the Ninth Circuit affirmed the district court’s
original grant of summary judgment (USA Petroleum Co. v. Atlantic Richfield Co.).

P1: KaD0521772524c07.xml CB802/Blair 0 521 77252 4 April 30, 2005 12:51
180 Vertical Price Controls in Franchising
ruled USA Petroleum had not suffered antitrust injury (ARCO at 337–338).200
But the Court did not address in its decision the potential benefit to consumersfrom maximum resale price maintenance, perhaps because the case was filedby competitors of the dealers that were subject to the alleged maximum verticalpricing arrangement. Although it had sidestepped the Albrecht rule, therewas, nonetheless, a skeptical tone in the Court’s opinion about Albrecht’scontinuing vitality. Moreover, the finding of no antitrust injury (a requirementto maintain all private antitrust actions) suggested that the practice did notwarrant the per se label. Despite this, Albrecht still remained as precedent forthe Khan case.
7.2.3 State Oil Company v. Khan
Khan was a lessee-dealer of Union 76 brand gasoline. He leased his stationand bought gasoline from State Oil Company. The price agreement in thefranchise contract was a thinly veiled attempt to evade the Albrecht rule.Under this agreement, State Oil suggested a retail price for Khan to charge.The wholesale price201 was set 3.25 cents below this suggested retail price. IfKhan decided that he wanted to raise price above the price suggested by StateOil, he was free to do so, but he could not profit from that change because hehad to rebate the premium to State Oil. In other words, Khan was obligatedto pay State Oil the wholesale price plus a sum equal to the difference betweenhis actual price and State Oil’s suggested price, all the times the quantity soldat the higher price. Thus, at the higher price, Khan would still receive thesame gross profit of 3.25 cents per gallon. But he would sell fewer gallonsand, therefore, his net profit would be lower due to unexploited economiesof scale and to fewer related sales (motor oil, cigarettes, beer, and so on). Ineffect, Khan would have no incentive to raise price above the level suggested
In response to the Supreme Court’s ruling that a competitor did not have standingto challenge vertical maximum resale pricing if the prices are not predatory, USAPetroleum wanted additional discovery to gather evidence of below cost (predatory)pricing (USA Petroleum Co. at 1277–1278). But the panel majority found that USAPetroleum had waived its right to present evidence of below cost pricing (USA PetroleumCo. at 1279). Thus, it refused to permit additional discovery.
200 For an examination of antitrust injury, which is injury that flows from the anticompet-itive consequences of a practice that violates the antitrust laws, see Blair and Harrison(1989).
201 This price included all taxes and transportation charges; it was the laid-in cost of thegasoline to Khan.
P1: KaD0521772524c07.xml CB802/Blair 0 521 77252 4 April 30, 2005 12:51
7.2 Maximum Resale Price Fixing 181
by State Oil. Thus, the contract was equivalent to a maximum resale pricerestraint.202
Albrecht was decided in 1968 and the Supreme Court had not had a caseuntil Khan that squarely posed the same question, namely, whether ver-tically imposed maximum resale price restraints were so pernicious (andpredictable) in their competitive effects that they deserved to be illegalper se. In other words, Khan offered an opportunity to revisit the competitiveconcerns expressed in Albrecht. After some 30 years of critical commentaryand an improved understanding of vertical relationships, the Court decidedthat it was “difficult to maintain that vertically-imposed maximum pricescould harm consumers or competition to the extent necessary to justify theirper se invalidation” (Khan, 282). The Court recognized that the competi-tive concerns in Albrecht were purely theoretical. Moreover, it found that“Albrecht’s dire predictions have not been borne out, even though man-ufacturers and suppliers appear to have fashioned schemes to get aroundthe per se rule against vertical maximum price fixing” (Khan, 283).203 Find-ing that the conceptual foundations of Albrecht were “gravely weakened,”the Court overruled Albrecht’s per se prohibition of maximum resale pricerestraints.
We believe that this was a wise decision in general, and in particular forfranchising. In the next section, we provide an economic analysis of threemain reasons why franchisors may want to impose maximum resale prices ontheir franchisees. We show that consumer welfare is enhanced by maximumresale price maintenance under at least two of these, namely the successivemonopoly and the positive demand externalities arguments. In addition, weargue that the third, which has to do with franchisor opportunism, is a popularbut much less likely explanation for this practice. Most importantly for ourpurposes, it does not generate antitrust injury. Thus, we conclude that Khanis a positive policy change.
202 Based on local market conditions, if Khan believed that the suggested retail price wastoo high, it could request a reduction. If State Oil agreed, it would adjust the wholesaleprice to maintain the 3.25 cents margin. If it did not agree, and Khan wanted toreduce the retail price anyway, then Khan would have to absorb the reduction andearn a reduced margin. Given the realities of gasoline retailing, such price reductionswere extremely unlikely because a gross margin of 3.25 cents per gallon was alreadyprobably too small to make Khan’s gasoline sales operations profitable. Hence, StateOil effectively controlled price reductions as well as price increases.
203 See Blair and Esquibel (1996) for an extensive look at economic equivalents to maxi-mum resale prices.
P1: KaD0521772524c07.xml CB802/Blair 0 521 77252 4 April 30, 2005 12:51
182 Vertical Price Controls in Franchising
7.3 An Economic Analysis of Maximum Resale Price Restraints
In order to better understand the economic irrationality of the Albrechtrule, it is useful to examine the potential motivations for setting maxi-mum resale prices. As we now demonstrate, consumers normally bene-fit from the reduced prices that maximum price restraints yield. Thus,assuming that consumer welfare is the primary concern of the antitrustlaws, one is driven to the conclusion that the demise of Albrecht was longoverdue.
We begin with an examination of the standard successive monopoly argu-ment, which applies to all supplier-reseller relationships, including traditionalfranchising. We then move on to show that even though business-format fran-chising may not involve any product sale from the franchisor to the franchisee,the double-marginalization problem still arises there due to franchisors’ re-liance on sales-based royalties.204 Finally, we discuss two other reasons whyfranchisors, traditional or business format, may want to impose maximumresale price restraints, namely positive demand externalities and franchisoropportunism.
7.3.1 The Successive Monopoly Argument for the Supplier-Reseller(or Traditional Franchising) Case
Suppose, for the sake of simplicity, that a single producer holds the patentfor the production and sale of the proverbial widget; in other words, thereis a perfectly legal monopoly in the market for widgets. This manufacturerdecides to franchise the distribution of his widgets. In each local market, thefranchisor appoints a single franchisee with an exclusive territory. Because thefranchisee faces no local competition, it also enjoys some monopoly power. Inthis event, the market structure is one of successive monopoly.205 Empirically,maximum price restraints arise mostly in these kinds of markets where thereis some element of successive monopoly, that is, where there is market powerat the production stage and independent market power at the distribution
204 Our point is that even if there are no sales of products by the franchisor to the fran-chisees, the argument still goes through. Obviously, if there are such sales in somebusiness-format franchised chains, the successive monopoly argument applies to theseas well.
205 A full understanding of successive monopoly dates at least to Spengler (1950). Seealso Machlup and Taber (1960). The argument follows through in the same way if themarkets are oligopolistic. See, in particular, Greenhut and Ohta (1979).

P1: KaD0521772524c07.xml CB802/Blair 0 521 77252 4 April 30, 2005 12:51
7.3 An Economic Analysis of Maximum Resale Price 183
$
1
0 100 Q
mr d = MR - MCR
MCP
MCP + MCR
MCR
PW + MCR
200
56
10
MR
D
13
14
12
9
Figure 7-1: Double marginalization.
stage, as is typically the case in traditional franchising.206 As the subsequentanalysis makes clear, from the perspective of consumer welfare, this marketstructure is worse than having a single, integrated monopoly involved in bothproduction and distribution.
Under conditions of successive monopoly, the franchisor must set its priceand quantity taking into account the profit-maximizing behavior of the fran-chisee. Now, each franchisee will maximize its profit in the usual way byselling that quantity where its marginal revenue equals its marginal cost. Inthis endeavor, the franchisee must have widgets to sell. It demands widgetsfor resale – not for its own use. As a result, the franchisee’s demand is derivedfrom the consumer demand for widgets. It is this derived demand that thefranchisor then faces. To begin the analysis, then, we must find the deriveddemand for widgets.
In Figure 7-1, we assume that the consumers’ inverse demand for wid-gets in a representative territory is given by D(Q) = P , and the associatedmarginal revenue is MR.207 This, of course, is the demand that the franchiseefaces. The derived demand for the franchisor’s product that arises from each
206 The upstream market power found in the reported court cases stems from the (nearly)pure monopoly of local newspapers or the branded products such as automobiles, softdrinks, gasoline, packaged meats, and prefabricated farm buildings. The downstream(successive) market power stems primarily from exclusive territories.
207 In the example shown in the figure, the consumers’ inverse demand is D(Q), where
D(Q) = P = 14 − 0.02Q,

P1: KaD0521772524c07.xml CB802/Blair 0 521 77252 4 April 30, 2005 12:51
184 Vertical Price Controls in Franchising
market can then be ascertained from the franchisees’ profit maximizing cal-culus. Without loss of generality, we focus on a single franchisee market inwhat follows. As mentioned above, the franchisee will maximize its profits byequating its marginal revenue (MR) to its marginal cost. Now, the franchisee’smarginal cost equals the marginal cost of goods sold, which is the wholesaleprice (PW) charged by the franchisor, plus the marginal cost of performingthe retailing function. The latter is shown in Figure 7-1 as MCR. Thus, thefranchisee will sell that quantity where
M R = PW + MC R .
Rearranging this condition yields the following derived demand:
PW = M R − MC R .
In other words, given the profit-maximizing behavior of the franchisee, themaximum price that the franchisor can charge for any specific quantity ofwidgets is the difference between the franchisee’s marginal revenue at thatquantity and the marginal cost of performing the distribution function. InFigure 7-1, we show this derived demand as d(Q) = MR − MCR, and theassociated marginal revenue, which we denote by mr.208
The franchisor maximizes its profits by producing the quantity where itsmarginal revenue (mr) equals its marginal cost, where the latter is the marginalcost of production (MCP). Hence, the franchisor produces the quantity where:
mr = MC P .
As shown in Figure 7-1, the profit maximizing quantity is 100 widgets.209 Theprofit maximizing wholesale price that corresponds to an output of 100 is
so that the associated marginal revenue is
M R = 14 − 0.04Q.
This specific numerical example is traced through the analysis to make the generalanalysis more concrete. Note that while our example and figures assume a linear demandcurve for the sake of simplicity, the results hold for general well-behaved demand curves.
208 The derived demand facing the manufacturer is PW = MR − MCR. Assuming thatMCR = $1, we can use the equation for MR – see last footnote – to write PW = 14 −0.04 Q − 1 or PW = 13 − 0.04Q = d. In this case, the derived marginal revenue ismr = 13 − 0.08Q.
209 In Figure 7-1, we have assumed that the marginal cost of production is $5. Equatingmarginal revenue – see last footnote – to the marginal cost of production gives 13 −0.08Q = 5. Solving for Q yields the optimal output of 100.

P1: KaD0521772524c07.xml CB802/Blair 0 521 77252 4 April 30, 2005 12:51
7.3 An Economic Analysis of Maximum Resale Price 185
found by substituting 100 for Q in the derived demand, d. In our numericalexample, the optimal wholesale price is $9.210
Once the franchisor selects a wholesale price, the marginal cost of thefranchisee is set since the franchisee’s marginal cost is PW plus MCR. Thefranchisee then will maximize its profits by selling that quantity where itsmarginal revenue (MR) equals its marginal cost:
M R = PW + MC R .
In our numerical example, the franchisee’s marginal cost is $10, so its optimaloutput is also 100 (as it must be), and the price charged to consumers is $12.211
The profits of the franchisor and the franchisee are easy to calculate. Forthe franchisor, profits (�) are the difference between wholesale price andproduction cost times the quantity sold:
� = (PW − MC P )Q.
In our numerical example, this amounts to $400.212 For the franchisee, profits(π) are calculated in a similar fashion:
π = (P − PW − MC R)Q.
In our example, the franchisee’s profits are $200. 213 Thus, total channel profitswhen there is a successive monopoly are � + π = $600.
This market structure is inefficient because it is possible to generate moreprofit. We can see this by considering what would happen if the franchisorwere vertically integrated. By this, we mean that the franchisor would producethe widgets and also perform the retailing function itself, through company-owned retail outlets. In that case, the manufacturer would produce anddistribute that quantity of widgets where the marginal revenue equals themarginal cost of production plus the marginal cost of retailing:
M R = MC P + MC R .
In Figure 7-1, we have added the marginal cost of production and retail-ing (MCP + MCR). In our numerical example, this marginal cost is $6 and
210 The derived demand is PW = 13 − 0.04Q so that when Q = 100, PW = 9.211 Since the wholesale price is $9 and the marginal cost of performing the distribution
function is $1, the franchisee’s marginal cost is $10. The franchisee sells the quantitywhere MR = PW + MCR or 14 − 0.04Q = 10, which yields an optimal quantity of 100.Substituting Q = 100 into the demand function yields P = 14 − 0.02(100) = 12.
212 Substituting $9 for PW, $5 for MCP, and 100 for Q gives � = (9 − 5)100 = 400.213 Substituting $12 for P, $9 for PW, $1 for MCR, and 100 for Q gives π = (12 − 9 − 1)
100 = 200.
P1: KaD0521772524c07.xml CB802/Blair 0 521 77252 4 April 30, 2005 12:51
186 Vertical Price Controls in Franchising
the profit maximizing output is QV = 200. At this output, the correspond-ing profit maximizing price is $10.214 The integrated firm’s profit is thengiven by
�V = (P − MC P − MC R)QV ,
which is $800. This level of profit exceeds the combined profit of the franchisorand the franchisee found above.
Our example has shown that in a successive monopoly context, vertical in-tegration leads to an expansion of output, a reduction in price to consumers,and an increase in total channel profits. In spite of the fact that price is lower,the profit of the vertically integrated monopolist is larger than the sum of theprofits earned by a production monopolist and a separate distribution mo-nopolist. This reflects the inefficiency associated with the double marginal-ization problem inherent in a successive monopoly. Consequently, one wouldexpect vertical integration to occur under these structural conditions, whichwould mean the end of franchising.
There is, however, “more than one way to skin a cat.” Vertical integration isnot necessary to achieve the same economic results because there are contrac-tual alternatives.215 One of these contractual alternatives is maximum resaleprice maintenance. In our setup, the franchisor knows the demand curvefaced by the franchisee and thus also knows what retail price will maximizechannel profit. In our example, that price is $10. The franchisor can thenagree to sell its widgets to its franchisee on the condition that the franchiseenot charge more than $10 to its customers. In that event, the franchisee willsell 200 widgets (given the demand it faces for widget). The franchisor willsell those 200 widgets to its franchisee at a wholesale price of $9. This whole-sale price will permit the franchisee to sell 200 widgets at a retail price of $10because the marginal cost to the franchisee is the wholesale price ($9) plus themarginal cost of distributing the widgets ($1). Thus, maximum resale pricingyields results that are the same as those of vertical integration: Q = 200 andP = $10. The franchisor’s profit is
� = (PW − MC P )Q = (9 − 5)200 = $800.
Even though the franchisee has a monopoly on retailing in its territory, itis forced to behave as a competitive firm would, namely, to sell that output
214 Given the marginal revenue of MR = 14 − 0.04 Q, and marginal cost for an integratedfirm of MC = 5 + 1 = 6, the optimal output for the integrated case is found by solving14 − 0.04Q = 6 for Q, which yields a profit maximizing quantity of 200. SubstitutingQ = 200 in the demand equation yields P = 14 − .02(200) = 10.
215 For extensive examinations, see Blair and Kaserman (1983) and Warren-Boulton(1978). See also Katz (1989) for a survey of the related literature.

P1: KaD0521772524c07.xml CB802/Blair 0 521 77252 4 April 30, 2005 12:51
7.3 An Economic Analysis of Maximum Resale Price 187
where price equals marginal cost. As a result, the franchisee’s profit is zero:
π = (P − (PW + MC R))Q = 0,
because P = PW + MCR. This is not to say that the franchisee just barelybreaks even or makes no accounting profits. But it does mean that he makesno economic profits, that is, the franchisee is limited to a competitive returnon his investment and time, a competitive return that is already reflected inits economic costs.
It should be clear that the franchisor employs maximum resale price re-straints not because this is good for consumers, but rather because it improvesher profits. Indeed, in our numerical example, her profits double from $400 to$800. But the franchisor’s interests and those of consumers happen to coincidein the context of successive monopolies. To show this more clearly, note thatwe have already established that quantity doubles from 100 to 200 widgets,and that price to the consumer falls from $12 to $10, when the franchisorimposes the maximum price restraints. One would suspect that consumerwelfare rises as a consequence and, indeed, it does. We can measure con-sumer welfare using the net consumer surplus (CS ), which is the area belowthe demand curve and above the price. In our numerical example, this areawill be
C S = 0.5(14 − 12)100 = 100
in the presence of successive monopoly. But when maximum resale pricemaintenance is imposed (or when the producer is vertically integrated), con-sumer surplus rises substantially to
C S = 0.5(14 − 10)200 = 400.
Thus, the use of maximum resale price restraints leads to increased output,reduced prices, and increased consumer welfare.
All else being equal then, a ban on maximum resale price restraints isinconsistent with the promotion of consumer welfare. Of course, existingfranchisees who operate under no pricing constraints are worse off whenmaximum resale price maintenance is imposed on them. In our example,the franchisee’s profits go from $200 to zero, or from supracompetitive tocompetitive levels. In that sense, franchisees are hurt by the imposition ofmaximum prices in a successive monopoly context. But total welfare (thesum of consumer surplus and channel profits) increases when we allow max-imum resale price maintenance, and, therefore, it is socially desirable to do so.Furthermore, franchising is much more likely to be used by manufacturersif they can control prices. In our example, the franchisor would most likely
P1: KaD0521772524c07.xml CB802/Blair 0 521 77252 4 April 30, 2005 12:51
188 Vertical Price Controls in Franchising
integrate rather than forgo the extra $400 in profits that are available underan integrated channel. Thus, franchise opportunities are much more likelyto arise in successive monopoly contexts if franchisors are allowed to controlresale prices. In that sense, franchisees as a group (including potential andexisting franchisees) may well benefit from these price controls as this willmake it possible for them to become or remain franchisees in the future.
7.3.2 The Successive Monopoly Argument forBusiness-Format Franchises
Our previous analysis was conducted in the context of traditional franchis-ing, where the franchisor generally sells a product under exclusive marks toits franchisees. We now want to show how the same “successive monopoly”problems arise in the context of business-format franchising. In other words,we show that the use of royalties on sales in business-format franchise con-tracts gives rise to increased prices in the same way and for the same reasonthat successive markups in the more traditional analysis lead to non-optimaldownstream prices. As a result of these royalties (or percentage advertisingfees), franchisees face a net demand curve that is lower than it would be atthe same unit if it were operated corporately or without such payments. This,in turn, leads franchisees to sell less, and to demand a higher price – onceadjusted to include the royalty payment – than would occur under verticalintegration (or corporate ownership).216
The “successive monopoly” effect of a royalty or advertising fee on saleson optimal downstream prices can be shown algebraically using a simpleexample. Assume a linear demand curve at the outlet level,
P = a − b Q,
a constant marginal (and average) cost of retailing, MCR= c, and a royaltyrate, and/or advertising fee, (r), which is a percentage of total sales revenue,
0 < r < 1.
Given any value for the royalty rate (r), the franchisee’s profits are given by
π = (1 − r )P Q − c Q
216 See Schmidt (1994) for an algebraic example of the “successive monopoly” problemunder a royalty payment. Note that in a linear demand example, the marginal cost ofperforming the retail functions must be greater than zero for the optimal quantity tobe reduced under a royalty on sales. This condition does not appear overly restrictivesince marginal cost is necessarily positive in a world of scarce resources.

P1: KaD0521772524c07.xml CB802/Blair 0 521 77252 4 April 30, 2005 12:51
7.3 An Economic Analysis of Maximum Resale Price 189
or
π = (1 − r )(a − b Q)Q − c Q.
Now, the franchisee will maximize its profit by operating where
dπ/d Q = (1 − r )(a − 2b Q) − c = 0,
which yields the optimal output
Q∗D = [a(1 − r ) − c]/[2b(1 − r )]
where the subscript D refers to downstream. By substituting this quantityinto the demand curve, we find that the franchisee’s optimal retail price, onceadjusted to include the royalty payment or advertising fee, is
P ∗ = a − b Q∗D = [a(1 − r ) + c]/[2(1 − r )].
This price is higher than it would be if there were no royalties or advertisingfees based on sales. This is easily seen if we set r equal to zero. In that case, theoptimal price becomes
P ′ = (a + c)/2,
which is lower than P ∗ for any r ∈ (0,1).217 Thus, the franchisee’s price ishigher when the franchisee pays some royalties on sales than when these areset equal to zero. Note also that if the franchisor had been operating the unitdirectly, it would have chosen to set the price at P ′ rather than at the higherP ∗ as total channel profits are higher with a price of P ′. In that sense, thefranchisor will find the price that the franchisee selects to be too high justas he does in the traditional “successive monopoly” analysis. So again, bothfranchisors and consumers will benefit from maximum resale price restraints.Finally, as P ∗ is increasing in r, it should be clear that franchisee prices willbe higher the higher the proportion of sales revenue paid by the franchisee tothe franchisor.
7.3.3 Demand Externalities
Aside from the “successive monopoly” problem, franchisors may impose max-imum prices on their franchisees for two main reasons: first as a way to forcefranchisees to internalize positive demand externalities; second, because they
217 P ∗ − P ′ = cr/(2(1–r)), which is positive whenever 0 < r < 1.
P1: KaD0521772524c07.xml CB802/Blair 0 521 77252 4 April 30, 2005 12:51
190 Vertical Price Controls in Franchising
are behaving opportunistically. Here, we consider the demand externalityargument.218 We discuss franchisor opportunism in the next subsection.
We live in a mobile society. As a result, in a chain of units operating under acommon tradename, it is likely that what one franchisee does can affect otherfranchisees. For example, a franchisee who does not maintain his premiseswell will hurt the brand image generally, and likely have a negative impacton all units in the chain. Similarly, a franchisee that provides a particularlypositive experience to his customers will probably have a positive influenceon demand at all units as satisfied customers from his units will choose topatronize other units when the occasion arises. Both of these situations implythat demand is positively correlated across units sharing the same brand name,which in turn means that there exist positive demand externalities in brandedchains. In other words, low prices at one unit (which is one way to generate apositive customer experience) will increase demand at all units in the chain.But no franchisee has an incentive to modify its behavior for the benefit ofthe other franchisees: the positive effect of one’s prices on demand at otherunits is ignored by franchisees in their pricing decisions because it does notaffect their individual profits. Corporate chains, on the other hand, wouldinternalize this effect in their pricing decisions as they obtain the profits fromall outlets. As we show below, this means that the franchisor would wantprices to be lower in any given unit than the price that the franchisee chooses.
We can examine this conflict analytically.219 Assume that a franchisor hasn franchisees located in n separate geographic markets. Let P = [P1, P2, . . . ,Pn] be a vector of prices set by the franchisees. Positive demand externalitiesexist when the profit of each franchisee depends upon the vector of prices:
πi = πi(P),
where ∂π i/∂ P j < 0, for all i , j. Thus, if one franchisee raises its price in itsown market, the profits of other franchisees suffer. This, of course, arisesbecause a customer’s experience at one franchised location influences his orher decision to frequent another unit in the same system.
The reason why the franchisor cares about this is because its profits dependon how well all franchisees do. To highlight the fact that this conflict is not dueto franchisors levying royalties on sales rather than profits, we show how thisconflict would arise even if the franchisor shared in outlet profits. However,
218 See also Barron and Umbeck (1984), Blair and Kaserman (1994), Lafontaine (1995b)and Lafontaine and Slade (2001) for more on this argument.
219 This analysis is based on Blair and Kaserman (1994) and follows the same logic weused in Chapter 5.

P1: KaD0521772524c07.xml CB802/Blair 0 521 77252 4 April 30, 2005 12:51
7.3 An Economic Analysis of Maximum Resale Price 191
we should say at the outset that royalties on sales rather than profits wouldmake this problem even worse, that is, the optimal price from the franchisor’sperspective will be even lower and the franchisee’s optimal price higher if thefranchisor levies sales royalties. For completeness, we cover this case in theappendix to this chapter.
If we assume that a franchisor collects a proportion of each franchisee’sprofits, we can write the franchisor’s profit as
� =n∑
i=1
k · πi (P), (1)
where k is the profit-based royalty rate, or the uniform share of franchiseeprofits that the franchisor collects, with 0 < k < 1. In order to maximize theseprofits it is necessary that
∂�
∂ P j=
n∑i=1
k∂πi
∂ P j= 0, j = 1, . . . , n
or
k∂π j
∂ P j= −
n∑i=1i �= j
k · ∂πi
∂ P j, (2)
which amounts to
∂π j
∂ P j= −
n∑i=1i �= j
∂πi
∂ P j. (3)
At the level of prices that maximizes the franchisor’s profit, equation (3)implies that
∂π j
∂ P j> 0,
since ∂π i/∂ P j < 0 for i �= j. In other words, beginning at the franchisor’s profitmaximizing vector of prices, each franchisee has an independent incentive toraise its price to the detriment of the franchisor and the other franchisees.
We can get a somewhat better understanding of this phenomenon by ex-amining a simple algebraic illustration. Assume that a franchised chain iscomposed of only two outlets, that demand is linear and identical for bothoutlets, and that marginal (and average) cost, c, is also the same for bothoutlets. Further, assume that the cost is unaffected by whether the outlet is

P1: KaD0521772524c07.xml CB802/Blair 0 521 77252 4 April 30, 2005 12:51
192 Vertical Price Controls in Franchising
corporately owned or franchised.220 Finally, to operationalize the positive ex-ternality, assume that the quantity demanded at one outlet depends not onlyon the price set at this outlet, but also on the price at the other outlet. Thus,we have
Qi = a − b Pi − d P j , for i, j = 1, 2,
where b > 0 and d > 0. Note that the assumption that d > 0 implies thatthese two units are not competing for customers. Presumably, the outlets arein different geographic markets, but customers’ goodwill toward the branddepends on the prices they see at both units.
If these outlets are franchised to different individuals, the two franchiseeswill choose their prices to maximize their own outlet’s profits. We discuss in theappendix the case where royalties are based on sales. Here, both for simplicityand to make clear that the conflict is not due to the difference between sales andprofit maximization for franchisors and franchisees respectively, we assumethat royalties are collected in proportion to outlet profits. Thus, we writefranchisee profits as
πi = (1 − k)[(Pi − c)(a − b Pi − d P j )], i = 1, 2.
Each franchisee selects its optimal price by solving
∂πi/∂ Pi = (1 − k)(a − 2b Pi − d P j + bc) = 0 = a − 2b Pi − d P j + bc
for Pi. Thus, the optimal prices for the franchisees are independent of theshare of profits that franchisees earn. Specifically, they are:
P1 = (a − d P2 + bc)/2b
and
P2 = (a − d P1 + bc)/2b.
Since we assumed that demands and costs in each market are the same, it isnot surprising to find that solving these leads to identical optimal prices:
P ∗1 = P ∗
2 = (a + bc)/(2b + d).
While these prices are the ones that the two franchisees would select inde-pendently, that is, when ignoring the positive demand externality, they arenot optimal from the franchisor’s perspective. This is because the franchisor
220 In other words, we are assuming away any agency costs, which are a major explanationfor the existence and use of franchising.
P1: KaD0521772524c07.xml CB802/Blair 0 521 77252 4 April 30, 2005 12:51
7.3 An Economic Analysis of Maximum Resale Price 193
wants to maximize the sum of the profits earned at the two outlets, that is,
Π = k(π1 + π2) = k[(P1 − c)(a − b P1 − d P2)
+ (P2 − c)(a − b P2 − d P1)].
As a result, the franchisor is compelled to take the demand externalities intoaccount.221
The franchisor’s optimal prices are given by the solutions to
∂�/∂ P1 = k[a − 2b P1 − 2d P2 + bc + dc] = 0
and
∂�/∂ P2 = k[a − 2b P2 − 2d P1 + bc + dc] = 0.
Solving these first-order conditions for the optimal prices yields
P ′1 = P ′
2 = [a + bc + dc]/(2b + 2d).
Comparing these prices to the franchisees’ optimal prices, prices infranchisee-owned units will be higher than franchisor prices if a > c(b + d),which is the condition that is necessary for the franchisor (and hence fran-chisees) to want to produce positive quantities in the first place. In otherwords, if this market exists, franchisee prices will be above those that thefranchisor would like them to choose. Hence, the franchisor will have a profitincentive to impose maximum prices at
P1 = P2 = [a + bc + dc]/(2b + 2d).
By the fact that the imposed prices are lower than those that the franchiseeswould choose, consumers will benefit from the franchisor’s use of price ceil-ings in this context as in the successive monopoly case. But as these are not theprices that maximize the franchisees’ profits, existing franchisees will be hurtif such restraints are imposed on them. Still, as in the successive monopolycase, the divergence between the franchisor’s and the franchisee’s optimalprices may well lead franchisors to vertically integrate and thereby reducefranchise opportunities if they cannot control prices. Thus, once again, max-imum resale price maintenance may be beneficial to franchisees in the sensethat it makes franchising more attractive to franchisors, thereby increasing
221 Note that if the two units were franchised to the same individual, this individual wouldinternalize the externality just like the franchisor does. But the point is that as long asdifferent individuals own different units in a chain, they will not fully internalize theseexternalities whereas these are fully internalized in a corporate entity.
P1: KaD0521772524c07.xml CB802/Blair 0 521 77252 4 April 30, 2005 12:51
194 Vertical Price Controls in Franchising
the likelihood that they will continue to operate with their existing franchisednetworks and even allow new franchisees to join.
7.3.4 Franchisor Opportunism
As noted by Ozanne and Hunt (1971), Hadfield (1990), and Stassen andMittelstaedt (1991), franchisors may also push franchisee prices down becausethey are opportunistic.222 In other words, because franchisors extract theirrevenues as a percentage of the sales revenue rather than the profits of theirfranchisees, a franchisor might want its franchisees to maximize unit salesrevenue rather than profits. Franchisees, on the other hand, are interested inmaximizing their unit’s profits, which requires a higher price than that whichmaximizes sales. Hence, franchisors might exert pressure on franchisees toreduce their prices and increase their sales volume. The result, of course, isconflict between the franchisor and its franchisees.
While this is a popular explanation for the pressure imposed by fran-chisors on franchisee prices, it fails to recognize some of the effects of thisbehavior. First, if franchisors systematically force franchisee prices down tolevels that maximize sales, they may not earn a sufficient return in the shortrun and so would close down. This, of course, cannot ultimately be benefi-cial to the chain as it reduces the availability of its product and the visibilityof the trademark. If the prices are pushed down a bit less so that the fran-chisee can cover its variable costs in the short run, the franchisee can remainopen for a time. But in the longer run, again, the unit will close and thefranchisor will be hurt by this. Furthermore, assuming that potential fran-chisees can see that this is happening, it will become very difficult for thisfranchisor to find new franchisees, which will limit the growth and size ofthe chain.
It is sometimes argued that the franchisor will push prices down enough sothat the franchisee will nearly fail. The franchisor then exploits the strugglingfranchisee by buying back the unit at a very low price and reselling it at a profitto a new franchisee. But for this to work, it is necessary that new franchiseesremain unaware of such behavior. Otherwise, they would refuse to buy andexpose themselves to the same opportunistic treatment. Other franchisees inthe chain also must be unaware of this behavior or they would start to takeprotective actions. They might even stop investing in their franchise. These
222 The trade press often refers to this to explain why franchisors exert pressure on fran-chisees to lower their prices.

P1: KaD0521772524c07.xml CB802/Blair 0 521 77252 4 April 30, 2005 12:51
7.3 An Economic Analysis of Maximum Resale Price 195
actions again will ultimately hurt the chain and, therefore, cannot be in thefranchisor’s interest.
The point of this discussion is not to say that franchisors never behaveopportunistically. Rather, our point is that reputation concerns, combinedwith the inefficiency the franchisor presumably faces if he has to operate cor-porately because he can no longer find franchisees willing to work with him,will by themselves curb the franchisors’ tendency to behave opportunisticallytoward their franchisees.223
In addition, the empirical evidence to date reveals that prices are higherin franchised than in company-owned stores of the same chains.224 This isconsistent with the general idea that franchisors find franchisee prices toohigh and try to push them down. But it is not consistent with franchisoropportunism as an explanation for this behavior. This is because company-owned outlets are profit centers for the franchisors. Thus, franchisors wouldnot want to maximize sales revenues in those outlets. Instead, they would wantto maximize profits. As a result, the franchisor would choose the higher price,the one that maximizes profits, in its company-owned units rather than thelower price that maximizes sales revenue. In other words, post-contractualopportunism by franchisors implies that prices at company-owned outletswould be above the prices they would be trying to get the franchised units tocharge, which is contrary to the existing evidence. Under successive monopolyand the positive demand externality arguments, on the other hand, prices infranchised units would be above those in company units, as the evidenceshows they are.
We conclude that franchisor opportunism, while still a possible explana-tion in some cases for franchisors imposing maximum resale prices, is notthe most likely explanation for this practice. Rather, we believe that the is-sues of successive monopolies and demand externalities play a much largerrole in a franchisor’s desire to adopt these restraints. In addition, franchisoropportunism is not an antitrust issue. Thus, we conclude that the decision
223 Klein (1980, 1995) explores these issues in more detail.224 See Lafontaine and Slade (1997) for a review of this evidence. This literature includes
studies of gasoline retailing (Shepard 1993), soft-drink bottling (Muris, Scheffman,and Spiller 1992), pubs (Slade 1998a), and fast food (Graddy 1997 and Lafontaine1995b). In all cases where a significant difference in prices was found, the franchisee’sprices were higher than those in the franchisor-owned outlets. More recent studies ofthe prices at the outlets of major fast-food chains in specific markets performed byThomadsen (2002) and Kalnins (2003) also confirm this pattern of higher prices infranchised than in company units.
P1: KaD0521772524c07.xml CB802/Blair 0 521 77252 4 April 30, 2005 12:51
196 Vertical Price Controls in Franchising
to overturn the Albrecht rule in Khan can only be viewed as a positive policychange.
7.4 The Public Policy Implications of Khan
We have seen that there are procompetitive reasons for franchisors to employmaximum resale price restraints. We have also seen that post-contractual op-portunism provides an alternative explanation and this is not procompetitive.The public policy implications of these conflicting incentives are examinedin turn in what follows.
7.4.1 Antitrust Policy
First, and foremost, Khan was an antitrust case that dealt with vertically im-posed maximum resale prices. For some 30 years, we had a per se prohibition ofthis business practice. When a practice is deemed illegal per se that means thatthe Supreme Court has determined that the practice inevitably has anticom-petitive consequences. While this is generally true of horizontal agreements onprice, it is usually not true of vertical price agreements. Under conditions ofsuccessive monopoly or in the presence of positive demand externalities, theper se ban on maximum resale price restraints is perverse. Instead of promot-ing consumer welfare, the Albrecht rule protected downstream monopoly andthereby reduced consumer welfare. We have shown this quite clearly in thepreceding section. Thus, as an antitrust matter, the Khan decision was correctand should lead to consumer welfare gains. Similarly, the new attitude towardmaximum resale prices embodied in the recent block exemption for verticalrestraints in the EU should benefit consumers.
7.4.2 Opportunism
As an economic matter, we do not want to encourage opportunistic behavior.It is not socially productive. In fact, opportunism is unproductive becauseresources are wasted by those engaging in such behavior and by those whotry to defend against it. In the case of maximum resale pricing, franchiseeswill waste resources in devising ways to protect themselves. They may debaseproduct or service quality in an effort to evade the effects of maximum resaleprices. This is especially likely if their economic survival is at stake. Alterna-tively, they may refrain from making certain investments if they are concernedabout having them confiscated by the franchisor.

P1: KaD0521772524c07.xml CB802/Blair 0 521 77252 4 April 30, 2005 12:51
7.5 Conclusion 197
Post-contractual opportunism by franchisors is also not good for the fran-chise community at large. To the extent that it makes franchising less attractiveto prospective franchisees, this hurts all franchisors. Opportunistic behavior,however, is not a competitive evil. That is, it is not an antitrust problem.Rather, it is a contractual problem. If a franchisor restricts the franchisee’spricing freedom to the point that total revenues cover variable costs, but donot provide a competitive return on the franchisee’s sunk investment, then thefranchisee faces economic duress. The choices are unpleasant: if he refuses toadhere to the restriction, he faces termination; if he acquiesces, he will slowlyslide into bankruptcy. Neither option is appealing. There may, however, besome contractual relief.
Plaintiff-franchisees and their attorneys surely prefer antitrust relief be-cause the antitrust laws provide for treble damages plus a reasonable attorney’sfee. Clearly, this is more lucrative than contract damages, which are confinedto the actual lost profit and do not provide for an attorney’s fee. But if there isno real anticompetitive significance to maximum resale price restraints, therecan be no antitrust violation and, therefore, no antitrust damages.
7.5 Conclusion
The Supreme Court overruled Albrecht in its recent Khan decision. Thisshould bring to a close some 30 years of criticism of a misguided prohibitionof maximum resale price restraints. Under conditions of successive monopolyor positive demand externalities, franchisors will have an incentive to limitthe maximum prices that franchisees can charge. We have argued that thiswill benefit consumers along with the franchisors. It is therefore appropriatethat franchisors should be free of antitrust prosecution to pursue this businessstrategy.
We have been mindful of the possibility that franchisors could use maxi-mum resale price restraints in an opportunistic fashion to abuse their fran-chisees. Our concern is that the franchisor could reduce resale prices to thepoint where the franchisees are not earning a competitive return on their sunkinvestments. One cannot prove that this behavior makes no economic sense.But we have discounted the likelihood of post-contractual opportunistic be-havior because of its adverse reputation and operational effects. Franchisorshave a continuing interest in licensing new franchisees and in keeping theirexisting franchised networks in good working order. If a franchisor developsa reputation for engaging in opportunistic behavior, its system will not beattractive to prospective franchisees and it will find it difficult to expand. It

P1: KaD0521772524c07.xml CB802/Blair 0 521 77252 4 April 30, 2005 12:51
198 Vertical Price Controls in Franchising
will also face uncooperative franchisees. In other words, market forces willblunt the incentives for opportunistic behavior on the part of franchisors.Furthermore, we have noted that existing empirical evidence contradictsthe franchisor opportunism argument. Perhaps most importantly for publicpolicy purposes, franchisor opportunism is not anticompetitive, and thus notan antitrust issue. In fact, allowing franchisees to sue franchisors for trebledamages in the U.S. when they face pressure to reduce their prices may wellamount to endorsing opportunistic behavior on the part of some franchisees.Thus, in our view, the new attitude toward maximum resale prices embodiedin the Khan decision in the U.S. and in the new block exemption on verti-cal restraints in the EU represent a change for the better in general, and forfranchising in particular.
7.6 Appendix: Sales-Based Royalties and Demand Externalities
In this appendix, we show that the demand externality problem is exacerbatedwhen franchisors levy royalties based on sales rather than profits. In this case,we can write the franchisor’s profits as
� =n∑
i=1
r [T Ri (P)],
where TRi represents the total revenue or sales of franchisee i, r is theuniform sales-based royalty rate, with 0 < r < 1, and P is the vector ofall prices chosen by franchisees. To maximize � by choice of price we musthave
∂�
∂ P j=
n∑i=1
r∂T Ri
∂ P j= 0, j = 1, . . . , n,
or
r∂T R j
∂ P j= −
n∑i=1i �= j
r · ∂T Ri
∂ P j,
which amounts to
∂T R j
∂ P j=
n∑i=1i �= j
·∂T Ri
∂ P j.
In other words, at the level of prices that maximizes the franchisor’s salesroyalties, ∂T R j
∂ P j> 0 since ∂T Ri/∂ P j < 0 for i �= j. Hence, beginning at the
franchisor’s profit maximizing vector of prices, each franchisee would have
P1: KaD0521772524c07.xml CB802/Blair 0 521 77252 4 April 30, 2005 12:51
7.6 Appendix 199
an incentive to raise its price further if it wanted to maximize its own totalrevenues. But in reality, franchisees whose royalties are based on sales wantto maximize the difference between the portion of sales that they retain andtheir cost. Since they bear the full cost of selling an extra unit, but only receivepart of the extra revenues, their incentives will be to choose a price that iseven higher than the sales revenue-maximizing price at the outlet level. Tosee this, assume that the cost of selling a unit of the good for an outlet j isconstant and equal to c. The franchisee’s profits then can be written as
π j = (1 − r )T R j − c j Q j .
Maximizing these by choice of P j entails setting the first derivative equal tozero, that is
∂π j
∂ P j= (1 − r )
∂T R j
∂ P j− c j
∂ Q j
∂ P j= 0.
As (1 − r ) is positive by assumption, and ∂ Q j /∂ P j < 0, this condition im-plies that ∂T R j /∂ P j < 0 at the price that maximizes the franchisee’s profits.This in turn requires that the price be set at a level that is even higher than theprice that would maximize outlet revenues, which in turn is higher than theprice that maximizes the sum of outlet revenues and thus franchisor profits. Ofcourse, such a result makes sense if we consider that the franchisee only gets aportion of the sales revenue associated with selling more but bears the full costof extra sales himself, making extra sales less attractive and, correspondingly,the optimal price higher. Moreover, we have assumed that the franchisor onlycares about outlet sales, so his incentive is to have franchisees sell even largeramounts at lower prices than would occur under profit sharing.
Here again, we can get a better understanding of the problem by examiningour simple algebraic illustration – with two outlets – linear and identicaldemand for both outlets, and constant marginal (and average) cost, c, for boththat is unaffected by whether the outlet is corporately owned or franchised.As before, the quantity demanded at one outlet depends not only on the priceset at this outlet, but also on the price at the other outlet. Thus,
Qi = a − b Pi − d P j , for i, j = 1, 2,
where b > 0 and d > 0. If these outlets are franchised to different individuals,the two franchisees will choose their prices to maximize their own outlet’sprofits. Assuming a sales-based royalty rate of r, the franchisee’s profits are
πi = (1 − r )[Pi (a − b Pi − d P j )] − c(a − b Pi − d P j ).

P1: KaD0521772524c07.xml CB802/Blair 0 521 77252 4 April 30, 2005 12:51
200 Vertical Price Controls in Franchising
Each franchisee selects its optimal price by solving
∂πi/∂ Pi = (1 − r )(a − 2b Pi − d P j ) + bc = 0
for Pi. Thus the optimal prices for the franchisees now depend on the salesroyalties. Specifically, they are:
P1 =(a − d P2 + bc
1−r
)2b
and
P2 =(a − d P1 + bc
1−r
)2b
.
Solving these gives:
P ∗1 = P ∗
2 =(a + bc
1−r
)2b + d
.
When r = 0, there are no royalties on sales and we get the same solution aswhen the franchisor shares in the franchisees’ profits directly. We would alsoget this solution if the franchisor extracted only a fixed fee with neither salesnor profit royalties – the solution with r = 0 is the one that maximizes eachfranchisee’s profits directly. With 0 < (1 − r ) < 1, P ∗
1 and P ∗2 are higher
than those we found under profit sharing, and they are higher the higher r is.In other words, the franchisee’s optimal prices are higher under sales royaltiesthan under profit sharing. Again this is not surprising: sales royalties meanthat the franchisee gets a smaller part of revenue per unit but bears all costs.This makes him want to stop selling when the contribution of a unit to hisrevenues equals the contribution to his cost which, with a tax on revenue,occurs for a smaller quantity and higher price than the one that would ariseif he did not face this tax on revenue.
As for the franchisor, they would now want to maximize:
� = r (T R1 + T R2) = r [P1(a − b P1 − d P2) + P2(a − b P2 − d P1)].
From this perspective optimal prices would be given by the solutions to
∂�/∂ P1 = r [a − 2b P1 − 2d P2] = 0
and
∂�/∂ P2 = r [a − 2b P2 − 2d P1] = 0.
Solving these first-order conditions for the optimal prices yields
P ′1 = P ′
2 = a/(2b + 2d).

P1: KaD0521772524c07.xml CB802/Blair 0 521 77252 4 April 30, 2005 12:51
7.6 Appendix 201
Comparing these prices to the franchisor’s solution under profit sharing, wesee that these are even lower. In other words, we have shown that under salesroyalties, the franchisee wants even higher prices than under profit sharing,while the franchisor’s optimal prices go down further. Hence, the pricingconflict is even more acute with sales instead of profit royalties. Part of thisconflict now relates to the different objectives of the franchisor and franchisee:the franchisee wants to maximize outlet profits, which are the differencebetween what he retains of revenues and all costs, while the franchisor nowwants the franchisees to maximize sales instead of profits. In the body ofthe chapter, we have focused on profit maximization to highlight the partof the conflict that arises from the presence of demand externalities only.In other words, we showed that even when we eliminate the component ofthe conflict that comes from the different objectives, franchisees still wouldwant higher prices than those that maximize the franchisor’s profit if thereare demand externalities in the franchise system, something that commonbrands are meant to generate.

P1: KSF0521772524c08.xml CB802/Blair 0 521 77252 4 April 30, 2005 13:3
8
Encroachment
8.1 Introduction
Many of the business sectors where franchising occurs are mature, and fran-chising itself has become a fairly mature mode of organization in these in-dustries. As a result of this maturity, competition has intensified and the issueof “impact” or “encroachment” has come to the forefront. In fact, as someindustry analysts would have it, traditional encroachment – “the franchisor’splacement of a new company-owned or franchised unit too close to an exist-ing one – has emerged to be one of the most vexing, emotional and yet leastunderstood [franchising] problems of today.” (Barkoff and Garner 1994a)
While encroachment is defined most often in terms of geographic com-petition, it can take many different forms. All alternative channels throughwhich a franchisor can distribute its products or services to customers willpotentially “encroach” on its franchisees’ businesses and impact their prof-itability. For example, when Carvel sells its frozen desserts at the supermarket,customers who purchase them there might reduce the frequency of their visitsto individual Carvel restaurants. Franchisees thus can claim that they are hurtby such sales. On the other hand, customer awareness of the Carvel brandmay be increased by the availability of the product at non-franchised loca-tions, thereby increasing traffic at the chain’s franchised outlets. A similar setof potentially negative and positive impacts on franchisees can occur withinternet sales, non-traditional franchised or company outlets, and any otheralternative route used to reach the ultimate customer. In the end, whetherdistribution through such alternative channels has a negative impact on anyindividual franchisee is an empirical matter that depends on how customersreact to this new option as well as how the franchisor chooses to organize thedistribution through this alternative channel. In particular, it will be a func-tion of whether this activity is centralized at the franchisor’s headquarters or
202

P1: KSF0521772524c08.xml CB802/Blair 0 521 77252 4 April 30, 2005 13:3
8.1 Introduction 203
involves the local franchisee directly, either in the sales process or in the ser-vicing of the same, whether the franchisor shares the revenues or profits fromsuch sales with local franchisees, and so on. In other words, we cannot drawgeneral conclusions on the effect of “encroachment” decisions based on apriori reasoning – the net effect on franchisees always depends on the specificcircumstances and methods involved. Whatever strategy is used, however,conflict between franchisees and their franchisor will emerge if either partyfeels constrained by the other, or finds that it is being unfairly treated by theother.225
The same basic trade-off that we just described between building brandpresence and visibility while minimizing the negative impact on existing unitsoccurs, of course, under the traditional, or geographic, notion of encroach-ment as well. Increasing the geographical density of stores can have a harmfuleffect on nearby units’ sales, yet it can also increase demand for the productsor services sold under the common, and now more visible, brand and thusbenefit the same nearby stores. In fact, disputes about chains developing “toofew” units in particular geographic markets also arise regularly in franchising.As Bassuk (2000) puts it, “encroachment is the disease of the rich and suc-cessful” while “lack of clusters and adequate market penetration is the diseaseof the masses.” Indeed, for the majority of franchised systems, encroachmentis not really an issue – as we discussed in Chapter 2, most franchised chainssimply do not operate enough outlets for geographical encroachment to arise.But as we established also in Chapter 2, the majority of franchisees are partof large chains, and, as such, encroachment by new nearby outlets is indeedan issue for many of them.226 Since growth within franchised chains mostlyoccurs through the development of new outlets rather than outlet level salesgrowth, the issue of geographic encroachment in franchising, in some sense,is here to stay. Finally, encroachment through alternative channels or conceptscan occur even in relatively small franchised systems.
In general, whether the negative “impact” on sales or the positive businessgeneration effect dominates in any particular instance of “encroachment”ultimately must be addressed on a case-by-case basis by franchisors andtheir franchisees. Calls for regulatory intervention must be tempered by the
225 Problems with alternative channels are not limited to franchising. See, e.g., Gertnerand Stillman (2001) on how apparel manufacturer internet policies were shaped, atleast in part by channel conflict issues.
226 See Chapter 2 for data on the size distribution of franchised chains, most of which aremuch too small for traditional encroachment to be an issue. However, those data alsoestablish that most franchisees are associated with a relatively few, very large, franchisedsystems.
P1: KSF0521772524c08.xml CB802/Blair 0 521 77252 4 April 30, 2005 13:3
204 Encroachment
recognition that encroachment is not as simple an issue as some proponentsof legislative remedies suggest.
This chapter begins with a discussion of geographical encroachment, thetypes of industries most affected by it, and the potential motivations behind it.We then describe, in section 3, various ways in which industry members havereacted to this issue, along with current legislative solutions, actual and pro-posed. In section 4, we discuss encroachment through alternative channelsand alternative concepts, from both a theoretical and a practical perspec-tive. Here as well, we present information on various solutions implementedby industry members and on current legislative proposals. We conclude insection 5.
8.2 Market Coverage and “Traditional” Encroachment
Franchisors and their franchisees all want their franchise systems to thrive.They also all understand that more outlets in a chain means greater visibilityand customer brand awareness. Moreover, an increase in the number of outletsleads to larger marketing and advertising budgets not only globally, but alsoregionally and locally. In addition, it leads to increased bargaining powervis-a-vis suppliers. In other words, a larger number of outlets in a chaintheoretically benefits everyone as it simultaneously increases demand andreduces costs.
Geographic encroachment comes into play at the local rather than regionalor national level. While franchisees agree in principle that more outlets in theirchain is a good thing, they do not necessarily feel the same way about theirlocal markets. In other words, franchisees expect to do better if they do notface “too much” competition from their own brand nearby.
8.2.1 Defining Geographic or Traditional Encroachment
The word encroachment has a very negative connotation. Its origins are foundin real estate law, where it was defined as an illegal invasion or intrusion by alandowner’s building or other structure on someone else’s property. As usedin franchising, it has come to refer to any interference by the franchisor witha franchisee’s perceived market rights. Contrary to the real estate situation,then, the franchisor’s behavior need not be unlawful at all to be deemed aform of encroachment.
In 1992, the Iowa legislature enacted what has remained, through its variousrevisions, the most comprehensive franchise relationship law in the United

P1: KSF0521772524c08.xml CB802/Blair 0 521 77252 4 April 30, 2005 13:3
8.2 Market Coverage and “Traditional” Encroachment 205
States. This law addresses directly the issue of encroachment. In its most recentversion, this statute defines encroachment as follows:
If a franchisor develops, or grants to a franchisee the right to develop, a new outletor location which sells essentially the same goods or services under the sametrademark, service mark, trade name, logotype or other commercial symbol asan existing franchisee and the new outlet or location is in unreasonable proximityto the existing franchisee’s outlet or location and has an adverse effect on thegross sales of the existing franchisee’s outlet or location, the existing adverselyaffected franchisee has a cause of action for monetary damages. . . . (Iowa Code2001 Supplement, Section 537A.10)
Though “unreasonable proximity” is not explicitly defined, the statute fur-ther refines its encroachment definition by eliminating recourse where theeffect on the existing outlet’s gross sales, relative to the twelve months imme-diately preceding the opening of the new outlet, is below 6 percent. Further,for franchisees to have recourse when there is more than a 6 percent effect,it must be established that the sales reduction is not due to other factors,such as changes in the business environment or changing consumer tastes.Other factors that eliminate the possibility of franchisee action include (1) thefranchisee was offered the right to develop the new unit under then currentcontract terms, (2) the franchisee is not in compliance with the franchisor’s“then current reasonable criteria” for eligibility for a new franchise, or (3) theexisting franchisee has been granted “reasonable” territorial rights and thenew outlet does not violate those rights.
Note that the definition above replaced an earlier one that used a 5 percent“impact” threshold (Iowa Code 523H, 1995), which in turn had replaced aneven earlier version that based the definition of encroachment strictly onphysical proximity and population density (3 miles/30,000 population basearound the outlet) (Iowa Code 523H, 1992).
The Small Business Franchise Act of 1999, proposed in November 1999 byCongressman Coble (HR 3308) at the federal level, used a similar definitionof encroachment:
A franchisor may not place, or license another to place, one or more new outletsfor a franchised business in an unreasonable proximity to an established outletof a similar kind of franchised business, if . . . the intent or probable effect ofestablishing the new outlets is to cause a diminution of gross sales by the estab-lished outlet of more than 5 percent in the 12 months immediately followingestablishment of the new outlet.
Under this proposal, franchisors can prevent franchisees from bringing anaction only by paying the owner of each established outlet whose sales are

P1: KSF0521772524c08.xml CB802/Blair 0 521 77252 4 April 30, 2005 13:3
206 Encroachment
affected by more than 5 percent an amount equal to 50 percent of the newoutlet’s gross sales for the first 24 months of operation of the new outlet. Thiswould seem to be a high price indeed.227
The idea behind these definitions, of course, should be to capture what isperceived to be the central problem with encroachment, namely franchisormarket development and expansion policies that are not based on legitimatecommercial interests but instead are intended directly to hurt franchisees.228
After all, franchisees themselves want their franchisor to develop the chainaggressively and compete well with other product offerings in the market. Inwhat follows, we use a very stylized example to examine diverse circumstanceswhere the “impact” threshold is likely to be operative, and yet the expansionnot only serves the franchisor’s commercial interests, but is desirable alsofrom the perspective of consumer welfare and the commercial interests ofpotential franchisees. One of our goals in this process is to show that thetype of territorial protection requested by individual incumbent franchiseesis often not in the chain’s or society’s best interest.229
8.2.2 Territorial Conflict – Pinpointing the Source(s)
In what follows, we use a stylized example to illustrate the basic source of con-flict between franchisors and franchisees in geographic markets. The specificsof this example have been chosen purposely to allow us to highlight the mostcommon sources of conflict within a single framework. As our goal is simplyto illustrate the issues at hand, we abstract from many real-world consider-ations. However, even though our example is very stylized, we use realistic
227 This would also provide an enormous windfall for the franchisee. Suppose that thefranchisee’s yearly sales were $1,000,000. Thus, a 5-percent reduction would be $50,000.If the profit margin on those lost sales were 40 percent, profits would fall by $20,000 peryear. At a discount rate of 10 percent, the present value of the perpetual stream of lostprofits would be $200,000. If the new franchisee’s annual gross sales were expected tobe $1,000,000, the incumbent would receive a $1,000,000 payment (50% of $1,000,000for two years) to offset its loss of $200,000, which amounts to an $800,000 windfall.
228 See Far Horizons Pty Ltd v. McDonald’s Australia Ltd., VSC 310 (August 18, 2000) fora case where an existing franchisee specifically argued that the franchisor’s decisionsto open two new outlets and not offer them to him were meant to apply pressure onhim to sell his stores and leave the McDonald’s system, and to make an example ofhim so as to intimidate other franchisees as well. For a discussion of this case, see Terry(2001).
229 See also Smith (1982) and Eckard (1985) for evidence that the territorial protectionafforded to car dealers has been costly for consumers in that the result has been bothhigher prices for cars and fewer hours of operation for dealers.
P1: KSF0521772524c08.xml CB802/Blair 0 521 77252 4 April 30, 2005 13:3
8.2 Market Coverage and “Traditional” Encroachment 207
figures to calibrate it and the main points it illustrates are, in fact, quitegeneral.230
Assume a circular market – say an island – where consumers are uniformlydistributed along the circumference of the island. To make things concrete, weassume this circumference to be 120 miles long.231 Each consumer is willingto consume some amount of the good offered by a firm – say a fast-foodrestaurant chain. But consumers do not frequent these restaurants as often ifthey are located far away from their home. More specifically, we assume thatconsumers incur travel costs and that these reduce the frequency of their visitsor, equivalently, induce a smaller proportion of the population in the regionto frequent the restaurant regularly. In particular, we assume that consumerswho live within a mile from a restaurant will visit it on average six timesper time period. We abstract from issues of pricing by measuring units ofthe goods in dollars, assuming that each visit costs the consumer $5. Thus,customers living within a mile of a restaurant will spend $30 per time periodthere. We assume also that customers who live between one and two miles visittheir closest restaurant four times and thus spend $20 per time period there,whereas those who live between two and four miles visit twice, and those wholive between four and six miles visit the restaurant only once per time period.Finally, we assume that people will not travel more than six miles to go tothese restaurants, so those who live further than six miles away from any of theoutlets do not purchase any meals there.232 To finalize our characterizationof the demand side, we need to specify the number of consumers per mileand what a time period is. To get relatively realistic but “round” numbers, weassume that population density is 1,000 people per mile, and the number ofperiods per year is 10 (so our time periods are slightly longer than a montheach), for a total of 10,000 potential customers per year per mile.
On the cost side, we assume, again for concreteness, that the yearly fixedcost of operating one of these stores is $320,000 and the variable costs (costof goods sold plus crew labor) represent 60 cents out of every dollar in sales.
230 See Schmidt (1994) for a more complete model demonstrating some of the pointsbelow.
231 We choose this number not because it represents any particular reality, but because ithas a large number of divisors such that the solutions to our many scenarios tend tobe round numbers.
232 Our stylized assumptions about the trade areas around a restaurant are consistent,for example, with McDonald’s location policy as described in Salvaneschi (1996: 76):“McDonald’s used to follow a distance rule of 3, 5, and 7 minutes of travel time. Arestaurant’s core part of its RTZ (retail trade zone) was under three minutes of traveltime, the secondary part of its RTZ was within 3 to 5 minutes, and the outer area waswithin 5 to 7 minutes.”

P1: KSF0521772524c08.xml CB802/Blair 0 521 77252 4 April 30, 2005 13:3
208 Encroachment
While these figures are chosen somewhat arbitrarily, they approximate thecosts of operating certain types of fast-food restaurants. Using S to denoteyearly sales, we can write the yearly total costs as
TC = $320,000 + .6S,
with yearly profits at the store level then equal to
πi = S − TC = .4S − $320,000.
As is standard in economics, we consider that the costs described hereinclude all opportunity costs such as a normal return on investment andcompensation for the owner’s time spent managing the store. When eco-nomic profit, πi , is greater than zero, the owner is making economic or“above-normal” profits. When economic profits are zero, accounting profitsare positive and amount to normal compensation for the owner’s capital andtime. Put differently, with zero economic profits the owner is as well off usinghis capital and time in this business as he would be in his next best alternative.Hence, zero economic profit is the minimum required profit for the ownerto be “just satisfied” with the outlet’s performance. Finally, for simplicity, weassume that the stores described by the cost function above are always largeenough to serve all customers who come under our various scenarios.
Given this setup, we now turn to an assessment of the optimal number ofstores in this market from different perspectives and under different scenar-ios. As a benchmark, we first consider the competitive solution, which is whatindependent business owners, who would establish independent fast-foodoutlets all around the island, would choose to do. For simplicity, we assumethat the lack of a common brand does not affect local demand levels noroutlet costs. This assumption, of course, rules out some of the main reasonswhy a franchisee would opt for franchising rather than independent businessownership or why a franchisor would prefer franchising to company own-ership. While restrictive in that sense, it is worth making as it simplifies ouranalyses significantly and the results obtained under this assumption in factgive a good sense of the general issues at hand.
8.2.2.1 The Competitive Benchmark
Under this scenario of independent businesses all around the island compet-ing with one another locally, we ask how many stores one would expect to seeultimately, what would be individual store sales and profits, and how well offconsumers would be.
P1: KSF0521772524c08.xml CB802/Blair 0 521 77252 4 April 30, 2005 13:3
8.2 Market Coverage and “Traditional” Encroachment 209
Fundamentally, under competition, entry into this market will continueas long as business owners can earn more profit doing this than in their nextbest alternative. This means that entry stops only when each owner earnsnormal returns, or zero economic profits, which amounts to πi = S − TC =.4S − $320,000 = 0. Solving for S gives a sales level of $800,000 per store.This level of sales per store, in turn, occurs if stores locate every 3 miles sothat they each attract all those customers living within 1.5 miles from them inboth directions.233 Each store then gets the $30 per period per customer forall those living within a mile of it in either direction, for a total of two times10,000 times $30, or $600,000 in sales, plus the demand from all those wholive in the next closest half mile in either direction. Their demand is $20 percustomer per period for 5,000 customers on each side, for $200,000 in sales.Thus, if we have unaffiliated business owners competing with one anotherto serve this market, we expect to get a total of 40 stores with revenues of$800,000 each and zero economic profits. Consumers are very well off underthis scenario as they get to purchase 6.4 million “units” of the good each year,at $5 each. Put differently, consumers are well off because everyone has a storenearby, within 1.5 miles of their home.
8.2.2.2 The Optimal Store Configuration under Monopoly
Assume now that a single chain provides fast food on the island, and noother firm is considering entering this market. Thus, we have a monopolyprotected from entry. Supposing that all the stores are corporately ownedand operated, what is the optimal number of stores for this monopolist toset up along the circumference of the island? Presumably, the chain will wantto maximize the profits it derives from all the stores. With individual storeprofits of πi = S − TC = .4S − $320,000, the firm wants to choose n to
max � =n∑
i=1
πi = n(S − TC) = .4n · S(n) − $320,000 · n,
where S(n) represents the fact that sales at an individual outlet depend onthe number of outlets in the market. Since demand was assumed to be astep function, we cannot use calculus to solve this problem. Taking as given
233 Customers who live more than 1.5 miles away will have access to another restaurant thatis closer to them than this one. In equilibrium, as prices are the same at all restaurants,consumers frequent only the restaurant that is closest to them. Hotelling (1929) firstproposed and solved this type of location model in economics. See also Carlton andPerloff (2000) for a textbook treatment.
P1: KSF0521772524c08.xml CB802/Blair 0 521 77252 4 April 30, 2005 13:3
210 Encroachment
the fact that the number of stores must be an integer, however, by trial anderror one finds that the firm maximizes � by establishing 15 stores, eacheight miles apart. With average expenditures of $30 by all customers within amile of the store, on either side, followed by $20 for those between miles oneand two, and $10 for all those living two to four miles away on each side –the point where the customers instead choose to visit the adjacent store –we get total store revenues per year under this configuration of 10,000 ·(30 + 30 + 20 + 20 + 10 + 10 + 10 + 10) = $1.4 million. Store profits are.4 · $1,400,000 − $320,000 = $240,000 per year. With 15 stores generatingsuch profits, the chain as a whole earns $3.6 million.
As one would expect, consumers are worse off under monopoly than undercompetition: they get to consume only 4.2 million units per year comparedto the 6.4 million they purchased under competition. Put differently, someconsumers are not served as well under monopoly because the closest storeto their homes is up to four miles away rather than just 1.5 miles away. As wewill see below, however, consumers are better off under monopoly than underthe configuration that maximizes the profits of individual stores. Hence, ifconsumers value having access to a branded product, where a firm necessarilyholds some market power associated with its brand, they are better off underthe solution that the brand owner prefers than under the solution that thosewho might purchase the rights to distribute the branded product wouldprefer.
8.2.2.3 Franchisees’ Optimal Configuration
Instead of operating all the units corporately, the same chain might franchiseall the restaurants. Suppose for now that the chain allows each franchiseeto own only one restaurant. For simplicity, assume also that the franchisecontract requires that the franchisee pay a fixed fee each year to the franchisorrather than sales-based royalties.
Franchisees of course would prefer not to face any competition from otherrestaurants operating under the same brand. Since any given restaurant candraw customers from up to six miles away, the franchisee will maximize itsprofits if it has an exclusive territory extending six miles from its store in bothdirections around the island. With a total market length of 120 miles, single-unit franchisees then would find it optimal if the chain established a total often restaurants distributed uniformly every twelve miles around the island. Inother words, they would not mind if the franchisor set up another restauranttwelve miles away from theirs in either direction as such restaurants wouldnot “infringe” at all on their sales given that consumers will not travel morethan six miles to buy this product.
P1: KSF0521772524c08.xml CB802/Blair 0 521 77252 4 April 30, 2005 13:3
8.2 Market Coverage and “Traditional” Encroachment 211
With a total of ten restaurants around the island, each of them wouldgenerate yearly sales of 10,000 · (30 + 30 + 20 + 20 + 10 + 10 + 10 + 10 +5 + 5 + 5 + 5) = $1.6 million. Each franchisee would earn .4 · $1,600,000 –$320,000 = $320,000 per year, minus whatever yearly fee they have agreedto pay to the franchisor. Total sales in the market would be equal to 10 ·$1.6 million = $16 million. In other words, consumers are worse off underthe single-unit franchisee scenario than under the monopoly solution: theynow consume only 3.2 million units per year versus 4.4 million. Equivalently,some consumers now live quite far, up to six miles away, from their closestrestaurant.
Note that franchising will be less appealing than company ownership tothis firm if it is bound to establish only the number of stores that franchiseesprefer. Under the 10-store configuration favored by franchisees, total profitsin the market are $3.2 million as opposed to the $3.6 million generated underthe monopolist’s 15-store configuration. Thus, even if the franchisor wereto extract all the franchisees’ profit through the annual fixed fee, namelysetting that fee at $320,000 per year so that in the end the franchisee onlyearns “normal returns,” the franchisor would still not fare as well under thisscenario as under company ownership. This illustrates the most fundamentalsource of conflict between franchisors and franchisees as it relates to storelocation: the franchisees’ preferred number of stores is below the number ofstores that maximizes chain profits. The franchisor will always want to locateother stores “too close” to the existing franchisees’ stores except in the oneparticular case where a single franchisee owns all the stores in the market.In that case, the franchisee will choose to maximize the sum of store profitsin the market just as the franchisor would and will reach the same conclusionas the franchisor regarding the optimal configuration to achieve this goal.What this last point illustrates is that as long as the franchisee does not ownall of the outlets in a market, he or she will want other outlets to be fewer innumber and farther away than what the franchisor finds best.
From a public policy perspective, it is important to note that franchisorsthat choose to locate outlets “too close” to one another for their franchisees arein fact serving their customers and society better than they would if they fol-lowed the wishes of their franchisees. Of course, vertical restraints such as ex-clusive territories can have procompetitive effects due to increased interbrandcompetition, as the Supreme Court recognized in Sylvania.234 In that particu-lar case, Sylvania imposed location restrictions on its distributors. This strat-egy resulted in an increase in market share from 1–2 percent to about 5 per-cent. But when such procompetitive effects are present, franchisors have every
234 Continental T.V., Inc. v. GTE Sylvania, Inc.

P1: KSF0521772524c08.xml CB802/Blair 0 521 77252 4 April 30, 2005 13:3
212 Encroachment
incentive to rely on these vertical restraints. When they instead choose to notprovide exclusive territories or to locate outlets “too close” to one anotherfrom the franchisees’ perspective, this is presumably because they do not be-lieve that the restraints will benefit them. In those cases, the restraints alsowill not benefit consumers. And indeed, studies of the effect of state laws thathave conferred territorial protection on car dealers have confirmed this. Smith(1982) and Eckard (1985) have studied the prices charged at car dealerships be-fore and after such territorial protection, and both found that consumers paymore for their cars due to state statutes that restrict the car manufacturers’ability to establish new car dealerships. They also find evidence that customersobtain less service after the imposition of these restrictions, as evidenced bya reduction in hours of operation. While our stylized example abstracts frompotential pricing effects, higher prices would ensue in our model, as well, ifwe allowed price competition among our more or less densely located stores.In that sense, it is troubling that courts and public policy decisions, underthe notion of protecting small businesses, have sometimes favored the fran-chisees’ position in encroachment disputes at the expense of consumers. Wewill return to the legal treatment of encroachment claims later.
8.2.2.4 Franchisees’ Optimal Configuration – Revisited
The discussion above suggests that single-unit franchisees will always wantfewer units than franchisors in any given market. This is true, however, onlyfor those single-unit franchisees who own one of the original ten outlets.As they are the ones who bring up the issue of encroachment, they are thecorrect group of franchisees on which to focus to understand the source ofthe basic conflict. There is another set of franchisees, however, the ones whowill not get one of the ten outlets, who would rather that the franchisorestablish more than ten outlets in the same market. In fact, fundamentally,when a franchisor sells a new franchised outlet that is “too close” to existingoutlets, it must be that some franchisee is willing to purchase an outlet inthat location. Alternatively, if the chain sets up a new company-owned unit,it must be willing to operate one in that new location as well. This suggeststhat such an outlet is expected to be profitable. But how could it be profitableif it is so close to other outlets as to render them unprofitable? Of course, forfranchisees the issue is not really one of profitability versus no profitability – itis a question of the level of profitability.235 And franchisees do better if they do
235 Franchisees sometimes argue that because it is clean and new, the new outlet “unfairly”draws their customers away, and that is what makes the new outlet profitable (see, for
P1: KSF0521772524c08.xml CB802/Blair 0 521 77252 4 April 30, 2005 13:3
8.2 Market Coverage and “Traditional” Encroachment 213
not compete with other restaurants operating under the same brand, as seenabove. But the owner of the new outlet can still expect to make some amountof positive profit. He may not expect as much as the existing franchisee hadbeen making, but it is still enough to entice him to invest and entice a bank orother lender to lend. In fact, were it not for the franchisor restricting entry orthe number of outlets in the market, individuals would be willing to continueto purchase restaurants in a market until they drive economic profits to zero,as we saw above in our analysis of the competitive benchmark. In that sense,relative to the case of free entry – the situation they would face were it notfor their belonging to a chain – the franchisor already reduces substantiallythe number of restaurants they must compete with in the market and therebyincreases the amount of profits each of them can earn. Of course, as the ownerof the brand, the franchisor extracts at least some, if not all, of those profitsthrough its franchise fees.236
As for existing franchisees, if they were offered a choice at the outset betweeninvesting in a restaurant belonging to a chain that would establish 15 outletsin our stylized market or going on their own, they would opt for investing inthe chain as long as the franchise fees were below $240,000 per year. This isbecause the positive economic profits they would earn imply that they stillearn a higher return on their time and capital within the chain, even with15 outlets, than they could earn in their next best alternative.
This points to one important component of a solution to the encroachmentproblem: franchisors need to be as explicit as possible about target sales levelsper outlet in markets where they sell franchises, and let franchisees knowbeforehand that sales levels much above those – whether they occur becausedemand is high in the market to begin with or because the market has grownover time – will induce them to locate other units in that same market just assuch sales levels would induce the franchisee to do so if he or she owned thechain or were granted the rights to fully develop the chain in this market. In
example, Zarco’s points in Zarco and Dienelt 1994). If this were the main reason fornew outlet profitability and thus attractiveness to investors, it should be countered byrenovations and good service and aggressive pricing by the owner of the old outlet.Such actions would prevent customers from leaving the established outlets, which inturn would mean that the new outlet would not be profitable, and thus no one wouldwant to establish such an outlet.
236 See Lafontaine and Kaufmann (1994) for evidence that McDonald’s leaves at least someof the profits to the franchisees. The authors explain this as part of McDonald’s self-enforcement policy with franchisees, which functions in part, at least, via promises ofadditional outlets. Michael and Moore (1995) show evidence that other chains alsoleave some rent with their franchisees.

P1: KSF0521772524c08.xml CB802/Blair 0 521 77252 4 April 30, 2005 13:3
214 Encroachment
other words, if expectations are set correctly, then conflict over encroachmentwill be minimized.237
8.2.2.5 Franchisor Opportunism and Sales Maximization
Using our stylized example, we have shown that franchisors and franchiseeswill typically disagree on the optimal number of franchises that should beestablished in a given market. This conclusion is based on simple profit maxi-mization by both parties, where neither party was intentionally taking advan-tage of the other. Yet many accounts of encroachment situations – specificallymany franchisee complaints about franchisor encroachment – suggest thatencroachment is a form of franchisor opportunism, namely that franchisorsintentionally harm their franchisees. In some cases, it is assumed that thefranchisor gains from the resulting churning in outlet ownership as the fran-chisor collects new franchise fees each time a store is sold. In other cases,the source of the misbehavior is traced to the fact that franchisors may beinterested more in sales revenue maximization than in profit maximizationat the outlet level given that the typical franchise contract entails sales-basedroyalty payments.
Let us first consider the sales maximization argument. In our example, afranchisor who would want to maximize sales revenue rather than profitswould locate a large number of stores in the market. Specifically, since con-sumers consume more if they live within a mile of a store than if they do not,a sales maximizing franchisor would want to establish enough outlets so thatevery customer can frequent a store within a mile from his or her house. Inour hypothetical example, this means a store every two miles, for a total of 60stores. Individual stores then achieve yearly sales levels of (30 + 30) · 10,000 =$600,000 as they only sell to those customers living within a mile from theirstore in both directions, and profits per store are .4 · $600,000 − $320,000 =− $80,000. Of course, with the break-even level of sales revenue calculatedabove at $800,000, it is clear that this store density, optimal from a sales rev-enue maximization perspective, would give rise to losses for all stores in ourexample. This, of course, cannot persist in the long run.
237 One might worry that franchisees would react to such information by keeping effortlow so as to not achieve sufficient sales for the franchisor to want to add an outlet. Iffranchisee effort mostly affects costs, this will of course not be an issue. But if franchiseeeffort affects sales revenues, this is something the franchisor will need to be on the look-out for. Franchisors can, for example, compare outcomes across similar markets and/oroperate company units to get better information on the demand side and thus be ableto identify these types of behaviors.

P1: KSF0521772524c08.xml CB802/Blair 0 521 77252 4 April 30, 2005 13:3
8.2 Market Coverage and “Traditional” Encroachment 215
The question then becomes whether this is really profitable for the fran-chisor. Obviously, if the franchisor announced from the outset that this was itsgoal, no franchisee would purchase any of the 60 stores. This cannot be prof-itable. So this sales revenue maximization goal must set in later, after at leastsome franchisees have signed on. Suppose then that the franchisor sells thefirst ten franchises and locates them sequentially and symmetrically aroundthe whole market. This is exactly the configuration that franchisees find op-timal so that, during this initial market development period, each franchiseeearns the largest possible profits and is very happy with the franchise. Thefranchisor who is ultimately interested in maximizing sales revenue wouldthen want to establish more outlets. Let us assume that he now locates onemore outlet halfway between each existing pair of outlets, for a new total of20 outlets in the market, one every six miles. Franchisees who owned the firstten units now earn less revenues and profit so they would complain of en-croachment. But new franchisees would be willing to purchase these units asthe expected profit per outlet is still positive (assuming of course that they donot predict that the franchisor is headed toward 60 units, and assuming alsothat the yearly fees are set below the yearly expected profits of $160,000). Thelast phase of development to achieve sales revenue maximization would be toestablish two new units within each of the six miles separating the current 20units. Assuming the franchisor succeeded in attracting investors to these – adubious assumption given the “writing on the wall” – all the units would earnnegative profits and fail. Again, this could not be profitable for the franchisor.So franchisors are very unlikely to ever reach the revenue maximizing numberof stores.
In essence, opportunism refers to the fact that the incentives of the fran-chisor may become different once the contracts have been signed and thefranchise fees paid. And indeed there is some basis for this concern: once aninitial set of contracts is signed and the franchisees have made their invest-ments and paid their fixed fees, the franchisor can exploit any quasi-rent238
the franchisees may be earning ex post by selling additional franchises close byat different terms. The terms of the new contracts would have to be differentbecause new franchisees would not agree to sign under the old contract sincethey face a higher level of competition.239 Note that franchisees who boughtfranchises in the first stage will regret this decision. Had they known that the
238 A quasi-rent is a payment above the opportunity cost, in this case, any positive profit.239 This can be seen in our example from the fact that the franchisor could charge franchise
fees up to $320,000 for the first 10 units – assuming franchisees expected that therewould be no more than 10 units in the market. For the second set of 10 units, the new
P1: KSF0521772524c08.xml CB802/Blair 0 521 77252 4 April 30, 2005 13:3
216 Encroachment
franchisor would sell more later, they would not have agreed to the originalterms.
This type of intertemporal “inconsistency” or regret about one’s purchasingdecision due to an incorrect assessment of the future behavior of the sellerwas analyzed by Coase (1972). In general, a monopolist can charge a priceabove the competitive level by restricting the quantity of its product belowthe competitive level. Coase argued that for durable goods (i.e., those that areconsumed over many periods), the monopolist will have to develop some sortof contractual assurance that it will not sell additional units at necessarily lowerprices in the future, otherwise the original set of customers will not agree topay the monopoly price. The same reasoning applies here. Franchisors wouldneed to look for ways to commit to “monopoly” contract terms, or would findthey cannot sell their contracts at prices above the “competitive” price unlessfranchisees are myopic.240 In other words, for franchisor opportunism to bea major issue, franchisees must not see how their welfare can be affected bytheir franchisors’ future decisions. In that context, there are good reasons tobe somewhat skeptical about how widespread this problem is likely to be. Thereasons for this skepticism relate to why opportunism through outlet churningis unlikely to be profitable as well. We turn, therefore, to an examination ofthe latter.
To analyze the possibility of franchisor opportunism related to churning,it is important to consider what franchisors stand to gain and lose if theymistreat their franchisees. As noted by Klein (1980, 1995), franchisors pre-sumably have opted for franchising rather than corporate ownership as an or-ganizational form because the cost of operating the chain in this way is lowerthan under full corporate ownership. Shelton (1967) and Krueger (1991)provide very convincing empirical evidence that costs are indeed lower un-der franchisee management. Of course, if franchisee effort affects customers’experiences, it is easy to imagine that outlet revenues also may be higherunder franchisee ownership than under company management. Evidence onthe effect of franchisee ownership on revenues is more anecdotal, but still
franchisees see that they will not get as much of the market as if they had been amongthe initial 10, and so they will not pay above $160,000 each.
240 One way to achieve this will be to offer franchisees an exclusive territory. McAfee andSchwartz (1994) show that when sellers can charge a two-part tariff (i.e., both an initialfranchise fee and running royalties) and buyers compete with one another, promisesto offer any future discounts also to initial buyers do not resolve the franchisor com-mitment problem. The authors thus discuss the potential role of exclusive territories asan alternative source of commitment. They also examine franchisor policies of usinguniform and stable “take-it-or-leave-it” contracts in this light.

P1: KSF0521772524c08.xml CB802/Blair 0 521 77252 4 April 30, 2005 13:3
8.2 Market Coverage and “Traditional” Encroachment 217
compelling. For example, in a private conversation with one of the authors ofthis book, a franchisor mentioned how, if he had hired one of his franchisees,he could never have brought himself to pay him a salary commensurate withthe level of profit that this franchisee was earning. But the franchisor alsoadmitted that he never considered buying back this franchisee’s outlets be-cause he could not make as much money under corporate ownership as hewas getting in royalties given this franchisee’s management skills and effort.Of course, implicit in this analysis was the expectation that this franchisee,if hired as a company manager, would not have put forth an equivalent levelof effort. Another franchisor put it simply: “You can’t pay a manager enoughto make them get up in the morning and do what the franchisee will do!”241
The reason, he argued, is that the franchisee has his own money on theline.242
The bottom line is that, though our simple analysis so far has not addressedthe issue of why firms franchise, in the end we expect franchising to be chosenby franchisors if it is more profitable for them than company ownership.243
This, in turn, has consequences relative to their incentives to mistreat theirfranchisees, consequences to which we now turn.
Let us consider what happens if a franchisor, after establishing a numberof franchised units, behaves opportunistically toward its franchisees by, say,requiring new fees, establishing competing outlets nearby, and so on. If these
241 David McKinnon, Chairman and CEO, Service Brands International, during a paneldiscussion organized as part of Entrepalooza 2002, held on September 13, 2002, at theUniversity of Michigan Business School.
242 See Lutz (1995) for a model showing that asset ownership is a major aspect of the differ-ential incentives of franchisees compared to managers as it gives them residual claimson future profits. Thus, even if the incomes of hired managers are made contingent onoutlet profits, their incentives to put forth effort to increase sales or reduce costs willnot be as strong as a franchisee’s because they do not share in the outlet’s future profitsto the same extent that franchisees do. Note that the franchisee’s longer-term incentivesdue to asset ownership work through the continuation of the franchise relationshipor the option that franchisees can exercise to sell their outlet at any given point intime.
243 An alternative, and potentially complementary, reason for franchisors to adopt fran-chising is that it gives them access to capital. This explanation was first proposed by Ox-enfeldt and Kelly (1969). But, empirical analyses contradict this argument in that theyfind that chains do not become fully corporate when they become established and thushave greater access to financing; see Lafontaine and Kaufmann (1994) and Lafontaineand Shaw (2005) and the references therein for more on this. Established franchisorsmention, generally, the stronger motivation of franchisees as the main reason theycontinue to rely on franchising. They do, however, associate these stronger incen-tives with the capital investment that franchisees make in their business, as per Lutz(1995).
P1: KSF0521772524c08.xml CB802/Blair 0 521 77252 4 April 30, 2005 13:3
218 Encroachment
behaviors become public knowledge, the franchisor will no longer be able toconvince new franchisees to join the chain. Thus, not only will she no longercollect franchise fees from such sales, but the growth of the chain will belimited to growth in the number of corporate units. Moreover, many exist-ing franchisees ultimately will abandon the chain, leaving the franchisor tooperate as a corporate entity. To the extent that the profits are lower undercorporate operations, the chain will earn lower returns after this transforma-tion. It may even fail if its competitors can continue to operate more efficientlyas franchised chains. Thus, to the extent that it becomes public, the cost ofmistreating franchisees is high for any established franchisor.244
Perhaps the more important point, however, is to note how low the benefitof opportunistic behavior really is for franchisors. The franchisor may beable to appropriate a few outlets and resell them to new franchisees. Butthese new individuals must be unaware of the opportunistic behavior asthey would not buy the outlets otherwise. The profit that the franchisorcan earn from such churning is basically limited to the franchise fee, a verysmall proportion of total payments by franchisees to franchisors.245 This isbecause both the old and the new franchisee typically pay the same royaltieson sales, so churning does not affect the level of these revenues. And theextra franchise fees themselves will rapidly go to zero as the reputation of thefranchisor is eroded and new owners can no longer be attracted to the chain.The alternative, rather than sell the outlet to a franchisee, will be to operateit corporately. If, as argued above, this is a less profitable way to organizethe business, the benefit is again very small compared to the cost imposedon the franchisor’s reputation and operations. After all, the old unit that thechain will now operate directly is unlikely to be very profitable with the newunit(s) now established close by (which is what led to the initial encroachmentclaim).
244 It is less clear that this disciplines new franchisors to the same extent. Of course, if anew franchisor wants to grow and become an established franchisor, it needs to offeran attractive business to potential franchisees, and its desire to sell units in the futurewill curb any tendency to behave opportunistically. There can be, and in fact have been,some less scrupulous individuals who have sold just a few franchises and collected theassociated fees, but made no effort to really develop viable franchised chains. Whenthere is no desire to sell future outlets, there is nothing to prevent this opportunism. Forthis reason, among many others, it is always riskier for a franchisee to invest in a newfranchise opportunity. Our discussion above, of course, presumes that the franchisoris “real” in that this is a firm that at least plans to develop a franchise system if it hasnot yet done so.
245 Lafontaine and Shaw (1999) note that on average, franchise fees represent only about8 percent of all payments from franchisees to franchisors.

P1: KSF0521772524c08.xml CB802/Blair 0 521 77252 4 April 30, 2005 13:3
8.2 Market Coverage and “Traditional” Encroachment 219
8.2.2.6 Extensions
To provide clear intuition about the main issues, our stylized example hasabstracted from many relevant complications. In particular, ours is a staticmarket, where demand and costs are stable, yet market expansion is one of themain reasons why franchisors would want to establish new outlets. Further-more, we have ignored the effect of competitive pressures on the franchisor byassuming that there was a single provider of fast food on our island and thatthere was no threat of entry by a competing chain. Yet franchisors often arguethat they need to establish new outlets to prevent other chains from gainingmarket share. Finally, we have ignored one of the central arguments madeby franchisees in relation to encroachment, which is their role in developingboth the local market and the value of the brand. We briefly discuss each ofthese issues and their effects on our conclusions in this section, beginningwith market stability.
Instead of assuming stable market conditions, suppose now that each yearthe population around the island grows by 5 percent or, equivalently, the in-come of island residents increases and that leads them to increase the amountthey spend on fast food by 5 percent each year. As these increases do not affectthe distance – which remains at a maximum of six miles in both directionsfrom the store – over which stores can draw customers, the franchisee’s op-timal configuration is unaffected by this growth. But the franchisor whosegoal is to maximize chain profits will want to adjust the number of storesupward over time. Thus, the potential for market growth only reinforces ourearlier conclusion about the basic conflict that exists between franchisors andfranchisees on store density. This holds a fortiori if the profits earned in eachlocation become much larger than the initial contract envisioned and yet thefees cannot be adjusted within the contract period.246
Second, we have ignored the possibility that other firms might enter themarket. In defending their choices of location, franchisors often point out thatif demand warrants it, a competitor will open a new outlet if they do not, andthe franchisee will be no better off. Franchisees counter that increased intra-brand competition is more damaging to them than increased inter-brandcompetition.247 Consistent with franchisees’ claims, Kalnins (2003) finds thatprices of goods at a chain’s outlets are negatively correlated to prices set atnearby outlets of the same chain, but not with the prices of nearby units from
246 In that context, one can think of franchisors’ right of termination and non-renewal asa mechanism through which they can exercise a call option. See Chapter 10, as well asWilliams (1996a, b) and Brickley (2001) for more on this.
247 See, for example, Zarco and Dienelt (1994).

P1: KSF0521772524c08.xml CB802/Blair 0 521 77252 4 April 30, 2005 13:3
220 Encroachment
competing chains.248 In other words, franchisees respond more aggressivelyto prices at same-chain stores in the vicinity than they do to those of storesfrom different brands, which, given the lack of differentiation among same-chain stores, is what one would expect. Thus, the fact that a competitor mighthave taken the particular location may not be a compelling reason to locatetwo stores near one another under the same banner. Still, the possibility thatother chains might enter the market will affect a franchisor’s decisions as tothe optimal location and density of its stores. Specifically, assuming that thereare some sunk costs related to establishing a store in a particular location, ithas been shown that one way to prevent entry by a competing chain or byindependent competitors would be to proliferate the number of outlets in themarket or enter earlier than these competitors.249 Though franchisees alsowould want their franchisor to be aggressive in preventing entry or expansionby other firms, they are unlikely to agree with their franchisor as to the extentof intra-brand development that this entails. 250
Finally, we turn to the argument that franchisees who take the risk of beingthe first few in a market, and who work hard developing brand recognitionin their market, should reap the fruits of their labor. There is no denying thatfranchisees need to be compensated for the risks they take and the effort thatthey put in their business. But it is also true that franchisees that establishthemselves in markets that their franchisors have not developed yet choosethese markets because they know the markets in question and believe thechain would be successful there. This is a gamble, but one that each suchfranchisee is embracing based on the information he possesses about themarket and the chain. Most likely, if he is right, he will earn high returnsduring at least some period of time before the franchisor decides that this
248 See also Thomadsen (2002) for an analysis emphasizing the effect of geography onprices and Mazzeo (2002) for evidence that price competition is more intense whenoutlets offer more similar goods.
249 See Schmalensee (1982) and Eaton and Lipsey (1979). See also Hadfield (1991) onthe possibility that franchising makes proliferation credible. Note that sunk costs areexpenditures on highly specialized inputs that cannot be recovered if one withdrawsfrom the market.
250 The notion that firms should proliferate their number of competing divisions or offranchisees arises also in the strategic divisionalization literature. Here, franchisors thatface competitors should establish more outlets – each of which should be owned bydifferent individuals for maximum competitive effect – to capture a bigger share of themarket. See especially Baye, Crocker, and Ju (1996) on this. But see Rysman (2001) fora model where firms can also use the terms of their contracts strategically. In this case,there is no more strategic advantage associated with divisionalization. Instead, firmsshould place only one outlet in each market but sign a contract with a low wholesaleprice to generate high output levels from that one franchisee.
P1: KSF0521772524c08.xml CB802/Blair 0 521 77252 4 April 30, 2005 13:3
8.2 Market Coverage and “Traditional” Encroachment 221
market is ripe for additional outlets. These higher returns are in some basicsense the compensation he gets for developing this market. If the franchiseeneeds more than those early returns to make the gamble worthwhile, he mustnegotiate lower fees, or the right to develop further outlets himself, or theright to some other form of exclusivity, before he agrees to purchase his firstfranchise. In other words, he cannot wait until after he experiences success torequest guarantees on the level of returns he desires.
Note that if franchisors want franchisees to invest in the value of the brand,they need to compensate franchisees specifically for that. One way to achievethis is to offer franchise contracts involving lower fees or some form of long-term guarantee, such as those implied by the right to develop a specific numberof additional outlets, or the right to develop auxiliary businesses, or exclusiverights within a particular territory over the long run. For franchisees to haveincentives to develop the brand, however, these rights must be granted ex anteand explicitly. The converse then is also true: if the franchise contract givesfranchisees no long-term guarantees, but on the contrary is explicit about thefranchisor’s full ownership of the brand and states that the franchisees’ rightsare limited to the right to operate an outlet at a given address for a certainperiod of time, then the franchisee must recognize his contract for what itis. It is not an opportunity to develop a business and invest in developing abrand in partnership with the franchisor, but rather a shorter-term licensefrom which the franchisee must derive short-term benefits. Rental contractsare a standard solution to the type of durable goods monopoly problem thatthe encroachment issue is akin to. In that context, it makes sense to think ofa franchise contract as a rental contract over an intangible asset, namely thebrand with the terms of the franchise contract clearly defining the relationship.After-the-fact complaints that it should be otherwise ought to “fall on deafears.”
From a franchisee’s perspective, then, perhaps the biggest problem withfranchising lies not so much in what it is, but rather in what it is not, andyet sometimes appears to be. The franchise contract confers certain rightson the franchisee for a period of time. It does not grant him generally anyform of ownership of the chain or the brand and therefore should not inany sense be construed as a mandate to develop the brand beyond whatwill serve the franchisee’s best interest locally and for the expected dura-tion of the relationship. Any franchisor that wants more than a local finite-term focus from its franchisees must embed extra franchisee rights and ex-pectations within the contract: verbal promises to the franchisee about fu-ture prospects should never suffice from the franchisee’s perspective (theyare not worth the paper they are written on!), especially in light of the

P1: KSF0521772524c08.xml CB802/Blair 0 521 77252 4 April 30, 2005 13:3
222 Encroachment
frequent use of integration clauses in franchise contracts.251 In other words,we conclude again that if expectations are set correctly and both partiesfully understand what each is getting from the contract, conflict over en-croachment – and over many other aspects of the contract – will be mini-mized. But when expectations are set unrealistically, conflict almost invariablyensues.
In the following section, we examine some mechanisms through whichfranchisors have offered guarantees to franchisees, and other related practicesthat address franchisee concerns over territorial encroachment.
8.3 Industry Responses
8.3.1 The Role and Extent of Territorial Guarantees
One simple solution to the issue of geographical encroachment is for fran-chisors to offer exclusive territories to franchisees, that is, to guarantee thatthey will not open another unit within a certain area around the franchisee’sbusiness.252 Until the U.S. Supreme Court’s decision in Sylvania, such territo-rial guarantees would have been per se illegal under U.S. antitrust laws. Sincethen, however, non-price vertical restraints, such as exclusive territories, havebeen analyzed under the rule of reason. Without this change in the Court’sattitude toward non-price vertical restraints, encroachment claims could notbe levied against franchisors as franchisees could not have claimed any explicitright to a territory without breaking the antitrust laws.253
Table 8-1 shows the frequency with which franchisors in different industriesoffer an exclusive territory to their franchisees according to the InternationalFranchise Association (IFA) and Frandata (1998) survey of disclosure docu-ments. Any form of exclusive territory, described by geography, population,miles, or number of vehicles, is counted as a “yes” in this table.
251 See Cohn (1998) on the use of integration clauses in franchise contracts.252 This is common, for example, in the beer industry. Wholesale beer distributors usually
are granted exclusive territories that contractually protect them from dual distribution(or non-traditional encroachment) as well as from distributors in adjacent territories.These arrangements have been analyzed by Sass and Saurman (1993, 1996) and foundto be efficient in the sense of promoting greater sales.
253 Special industry state laws in automotive and liquor distribution provide territorialprotection to dealers. As noted earlier, Smith (1982) and Eckard (1985) have shownthat the resulting territorial exclusivity for car dealers has led to higher car prices andlower service, namely fewer hours of operation, for customers.

P1: KSF0521772524c08.xml CB802/Blair 0 521 77252 4 April 30, 2005 13:3
8.3 Industry Responses 223
Table 8-1: Exclusive territories
Number of Number with % with ExclusiveSector Franchisors Exclusive Territories Territories
Automotive 89 62 70Baked Goods 39 28 72Building & Construction 70 61 87Business Services 57 42 74Children Products 27 24 89
and ServicesEducation Products 21 20 95
and ServicesFast Food 197 136 69Lodging 39 13 33Maintenance Services 77 49 64Personnel Services 35 33 94Printing 21 14 67Real Estate 39 26 67Restaurants 99 79 80Retail Food 60 27 45Retail Non-food 130 101 78Service Businesses 105 90 86Sports and Recreation 37 31 85Travel 14 8 57
Total 1,156 844 73
Source: IFA Educational Foundation, 1998. Exclusive territories are defined as per item 12 ofUFOC. Any territory, described by geography, population, miles, or number of vehicles, countsas a “yes”. “No” means the territory is limited to the store itself.
Table 8-1 shows that the majority of franchisors offer some form of territo-rial protection to their franchisees. Since the industry (or sector) definitionsare rather broad, the average frequency of territorial protection probablymasks a good deal of within-sector variance. Despite this, Table 8-1 alsoshows substantial variation in the use of exclusive territories across indus-try sectors. In particular, in franchising sectors such as personnel services,franchisees specifically purchase the right to be the sole provider of person-nel for businesses that operate in a specified territory. The same is true ineducation-related and services businesses more generally. Thus, most fran-chisors in those industries include territorial protections in their contracts.But even in mobile businesses, exclusivity is not a given: Murphy (2000), forexample, cites the case of a franchisee in the mobile windshield repair industrywho was surprised to find that his Novus franchise did not guarantee him anyexclusive business territory. At the other extreme, in sectors such as lodging,
P1: KSF0521772524c08.xml CB802/Blair 0 521 77252 4 April 30, 2005 13:3
224 Encroachment
food retail, travel and fast food, so there is no explicit territory embedded inthe definition of the business concept and a larger proportion of franchisorschoose not to offer any exclusive territory.
The grant of an exclusive territory, moreover, does not eliminate the pos-sibility of encroachment. For example, if a territory is a geographical area,say one mile around an outlet, establishing a new outlet one mile away doesnot constitute an incursion in the exclusive territory of the original fran-chisee, yet it may still give rise to decreased sales at his outlet. Using thedefinition of encroachment in current and proposed legislation, namely adecrease in sales for the original outlet of 5 or 6 percent, this new outlet maywell encroach. In that context, what an exclusive territory does is make itclear what the franchisor may not do, which in our hypothetical examplewould be to open a unit within the one-mile region. The grant of an exclusiveterritory then offers some level of security to franchisees, or at least com-municates to them more clearly how the franchisor’s future plans may affectthem.
It is undeniable that exclusive territories provide at least some form ofsecurity against encroachment. In this light, Azoulay and Shane (2001) findthat a contractual guarantee of an exclusive territory significantly increasesthe likelihood that new franchised chains survive beyond their first few yearsin business. They interpret their finding to mean that territorial protectionis so important to franchisees that those franchisors that fail to offer suchprotection from encroachment are unable to attract franchisees, which thenleads to their failure.
In a 1993 study of territorial restrictions as described in chains’ disclo-sure documents, the Frandata Corporation found that only 26 of the largest50 restaurant franchisors offered some territorial exclusivity. This is muchlower than the 80 percent reported for the sit-down restaurant industry inTable 8-1, or the 69 percent reported for the fast-food industry. In contrast, fortheir set of 170 new franchisors from a variety of business sectors, Azoulay andShane (2001) found 83.5 percent offering exclusive territories as comparedto an overall rate of 73 percent in Table 8-1. Together, these data suggest thatlarger franchisors, for which encroachment is more likely to be an issue, have alower tendency than average to offer territorial protection. New franchisors,in contrast, offer it more often than average, potentially to counteract thelikely negative effect of their newness and small size on franchisee recruiting.Anecdotal evidence from Love (1986) further supports this conclusion: hementions that while Ray Kroc offered territories to early McDonald’s fran-chisees, he reduced the size of the territories over time and then eliminatedthem entirely by 1969.

P1: KSF0521772524c08.xml CB802/Blair 0 521 77252 4 April 30, 2005 13:3
8.3 Industry Responses 225
The desire to maintain flexibility in developing their franchised systemis the main reason franchisors give for not granting exclusive territories tofranchisees.254 This is consistent with the results of our stylized example: iffranchisors cannot modify the terms of their contract in a growing market,they will want to increase store density. Thus, they may choose not to grantexclusive territories because they want to maintain the required flexibilityto add outlets. But the need for flexibility as the market grows is not theonly source of encroachment friction. Azoulay and Shane (2001) report thatthe main concern of franchisors that did not offer exclusive territories wasthat “exclusivity would allow franchisees to hold them up through underde-velopment.” They cite the rationale of one franchisor: “If they (franchisees)can’t afford new stores and they don’t operate well, they will slow down ourgrowth if we can’t put someone else in the area.” In other words, even iffranchisors expect franchisees who are granted the whole local market ulti-mately to choose the same level of market development as the franchisor, thisdevelopment may be postponed due to liquidity constraints or, even worse,because a particular franchisee is not talented enough or ambitious enoughto operate more stores. Such concerns clearly make it harder for franchisorsto provide guarantees at the start of the franchise relationship.
The problem, however, is not insurmountable. Basically, it requires thatguarantees of exclusive territories be made contingent upon some objectivemeasures of franchisee performance. Some of this is typically done in masterfranchise agreements: These contracts not only provide territorial guaran-tees to the franchisee, they also stipulate a development schedule within theterritory in question. Thus, the franchisor evaluates the franchisee’s perfor-mance using the number of outlets opened as the performance measure, andthe territorial guarantee is predicated on this number reaching specific tar-get values over time. The drawback, of course, is that these targets may beunrealistic and the master franchise agreement then fails.255 A more flexibleapproach would involve more regular assessment of the market and its po-tential. In any case, franchisors should state explicitly what they consider tobe reasonable sales and profit levels per outlet, and franchisees should knowthat new outlets will be added when outlet sales in the region go above these
254 See, for example, Mathewson and Winter (1994) for a model emphasizing the role ofexclusive territories in determining the starting point of future renegotiation processesin franchise relationships.
255 See Kalnins (2004) on the frequency of failure of master franchise agreements in in-ternational markets, a large failure rate he argues is due to development schedules thatare too aggressive.
P1: KSF0521772524c08.xml CB802/Blair 0 521 77252 4 April 30, 2005 13:3
226 Encroachment
levels.256 These types of safeguards for franchisors and franchisees go muchbeyond the simple grant of a territory, and more closely align with othertypes of practices that franchisors currently use to minimize tension overgeographic expansion. We now describe some of these alternatives.
8.3.2 Other Franchisor Practices
Franchisors can do a number of other things to mitigate the negative reactionsthat establishing new outlets in a franchisee’s perceived market area mightgenerate. First and foremost, they need to ensure that potential franchiseeshave the correct expectations when they purchase a unit. If franchisees are soldfranchises under vague promises of exclusivity and options to grow within thechain, then they will expect that these opportunities will be offered to them.If, on the other hand, franchisees know what to expect in terms of sales andprofits per unit, and it is made clear that the franchisor intends to continueto establish outlets and develop the market further when these unit saleslevels are achieved in current outlets, then there will be no surprises for thefranchisee whose sales are much above average when new outlets are openednearby.257 Moreover, the franchisor must draft a clear language contract, onethat sets out whether or not the franchisee has an exclusive territory and, ifso, just how it is defined.
In addition to candid disclosure of future plans and contract terms, somechains have found that instead of ex ante territorial protection, they canestablish a policy of offering new outlets to the existing franchisees whosestores are most affected by each new outlet, assuming that the franchisee hasperformed satisfactorily. As seen in the legal definition of encroachment inIowa (Iowa Code 2001), offering the outlet to the owner of the impacted unit isone way to prevent encroachment claims under that law. Empirically, whetheror not franchisors have an explicit policy to this effect, Kalnins and Lafontaine(2004) show that franchisees in large fast-food chains are much more likelyto become the owners of a new unit if they already own units nearby. Thiseffect is even stronger if they own units that share a market boundary withthe new unit. Of course, problems arise with these solutions when more thanone existing owner has units that are impacted by the new outlet or when theexisting franchisee is not performing well. Thus, one might still find somelevel of conflict arising with those franchisees that are not awarded the new
256 Of course, franchisors again will need to be wary of franchisees providing low effort tokeep their outlet sales below the level that will lead the franchisor to want more outlets.
257 Of course, this does not mean that the incumbent franchisee will be happy about thenewcomer, but at least he or she will not be surprised.

P1: KSF0521772524c08.xml CB802/Blair 0 521 77252 4 April 30, 2005 13:3
8.3 Industry Responses 227
unit. Nevertheless, such policies can go a long way toward resolving territorialissues surrounding the growth in new units.
Many other tools are available to franchisors that want to lessen the costsassociated with encroachment issues in their chain. First, franchisors can tryto develop markets in a more focused way, with each individual market devel-oped all at once, thereby eliminating the apparent encroachment associatedwith sequential development.258 In our earlier numerical example, this wouldinvolve establishing all 15 of the desired outlets on the island at once. If this isnot feasible for any reason, the franchisor can make it clear at the outset to thefirst few franchisees that this is the development plan and that the goal will beto establish the 15 locations quite rapidly. This strategy of rapid developmenthas the advantage of providing for the type of cluster marketing economiesmentioned earlier, thereby facilitating the establishment of the brand in themarket.259
Franchisors also can minimize encroachment conflict arising from the es-tablishment of new outlets over time as markets grow by involving existingfranchisees in the decision process, or providing market analyses and otherinformation supporting their actions. This strategy has the additional ad-vantage of allowing franchisees, who may be in a unique position to providevery useful local market intelligence, to propose amendments to the companyexpansion plans that may address their concerns while still allowing the chainto achieve its goals. McDonald’s and Dunkin’ Donuts, for example, both haveinstituted impact policies whereby they provide notice of new outlets to fran-chisees whose current units may be affected and conduct studies to establishhow large the impact is likely to be. Both firms have established criteria un-der which they may reconsider their plans to open new outlets based on theoutcome of such studies.
Franchisors can also address the franchisees’ legitimate impact concernsby offering some form of compensation to their franchisees. Compensationcan take the form of modifying (perhaps for a limited period) the terms ofthe agreement under which the owner of the impacted unit operates. For ex-ample, the royalty rate could be reduced. Alternatively, the franchisor couldprovide direct compensation as the current federal proposal requires.260 Both
258 On planning ahead for multiple outlets, see Achabal et al. (1982). For an extensionof the total market entry approach that recognizes the reality of opening delays, seeKaufmann, Donthu, and Brooks (2000).
259 In other words, the franchisor can pool more advertising dollars and benefit frommarketing and advertising economies of scale in each well-developed market.
260 This compensation need not exceed the actual adverse effect on profit, i.e., there neednot be a windfall for the franchisee as the proposed federal statute provides.
P1: KSF0521772524c08.xml CB802/Blair 0 521 77252 4 April 30, 2005 13:3
228 Encroachment
the McDonald’s and Dunkin’ Donuts impact policies mentioned above in-clude provisions involving potential fee reductions or direct franchisee com-pensation. Contrary to the proposed federal law, however, this should notbe done each time a franchisee’s sales are negatively affected by a new out-let’s entry. Indeed, most cases of “measurable” impact will arise from normalchain development processes over time.261 The high profits that franchiseescan earn in their first few years in business when they own the first units ina market should probably be viewed as compensation for bearing the higherrisk of being first, not as a permanent franchisee entitlement. Franchisees,of course, are apt to see this differently as they build these returns into theirhousehold budgets.
Finally, when the risk of encroachment conflict is too high, franchisors mayturn to large investors who develop whole regional markets or toward morecompany ownership of units in their system. As we saw in our illustrativeexample, a franchisee who would be given the right to the whole island wouldchoose to establish exactly the same number of outlets as the franchisor findsoptimal. Thus, the likelihood of encroachment conflict is much reduced whenfranchisors use area development agreements with large franchisee investorsinstead of allocating individual units to small owner operators. There is someevidence that a number of franchisors, including Quizno Subs and Applebee’s,are choosing this option; whether they do so to minimize encroachment orfor other reasons is not clear.262 Similarly, current evidence suggests thatunits in urban areas are more likely to be owned and operated by franchisorsdirectly (see Lafontaine and Slade, 1997 2001). This evidence is consistentwith the idea that decisions about which units should be owned or franchisedmay be made partially on the basis of where encroachment claims are mostlikely. Note, however, that if franchisors choose to operate outlets to preventencroachment claims and the associated penalties – actual or potential –this hardly benefits potential franchisees as the latter now face a reduced setof opportunities. The same conclusion applies for small franchisees whenfranchisors turn to large investors to whom they delegate the development ofcomplete markets as a solution to potential encroachment claims.
8.3.3 Legal and Legislative Treatment
There is currently no general franchise law at the federal level in the U.S. thataddresses the issue of encroachment. Over the last 20 years, however, there
261 However, see Kalnins (2004b) for evidence that “impact” due to new hotels is greaterwithin franchised than company-owned chains.
262 See Vogel (1996) and Prewitt (2003).

P1: KSF0521772524c08.xml CB802/Blair 0 521 77252 4 April 30, 2005 13:3
8.3 Industry Responses 229
have been regular federal proposals to regulate the franchise relationship,including encroachment. As of this writing, the proposed 1999 Small Busi-ness Franchise Act mentioned above was still under consideration, but hadnot left the Commercial and Administrative Law Subcommittee of the HouseJudiciary Committee. In July 2001, the FTC, the body that enforces the fed-eral franchising disclosure rules, and the General Accounting Office (GAO)released a report of the 4,512 complaints received by the FTC from 1993 to2000. The report indicated that only 6 percent of those complaints were aboutfranchising, as opposed to business opportunities, and the franchising com-plaints were about earning claims and failures to disclose. The lack of data onfranchise relationship problems prevented the FTC and GAO from assessingthe extent of these problems, but the FTC noted that it did not believe thatthe situation warranted developing a new rule to address post-contractualproblems in franchising.
There are both federal- and state-level special industry laws that governfranchise relationships in gasoline, automotive, liquor, and farm machinerydistribution. These laws may require that franchisees be given territorial ex-clusivity. Furthermore, a few states have franchise relationship laws, someaspects of which apply to territorial encroachment.263 As noted earlier, themost stringent anti-encroachment provision is found in the Iowa franchiserelationship law.
263 Besides Iowa, the states of Hawaii, Indiana, Minnesota, and Washington have franchiserelationship laws with anti-encroachment provisions. These provisions, however, aremuch less extensive than those in the Iowa statute. For example, the Hawaii, Minnesota,and Washington state laws simply reaffirm the territorial exclusivity contracted for inthe franchise agreement. Specifically, the Hawaiian law states:
[I]t shall be an unfair or deceptive act or practice or an unfair method of competitionfor a franchisor or subfranchisor to:
Establish a similar business or to grant a franchise for the establishment of a similarbusiness at a location within a geographical area specifically designated as the exclusiveterritory in a franchise previously granted to another franchisee in a currently effectiveagreement, except under the circumstances or conditions prescribed in such agreement.The fact that other franchisees or the franchisor may solicit business or sell goodsor services to people residing in such geographical territory shall not constitute theestablishment of a similar business within the exclusive territory.” (Haw. Rev. Stat. §482E-6[2])
The Indiana law (Ind. Code §§ 23–2–2.7–1(2) & 23–2–2.7–2[4]) prevents a franchisorfrom establishing a permanent company unit within “unreasonable proximity” of afranchisee-owned unit, but does not prevent the establishment of additional fran-chised units. Finally, Wisconsin’s Fair Dealership Law does not contain a specific anti-encroachment provision, but it prohibits a grantor of a dealership from changing thecompetitive circumstances of a dealer without good cause.
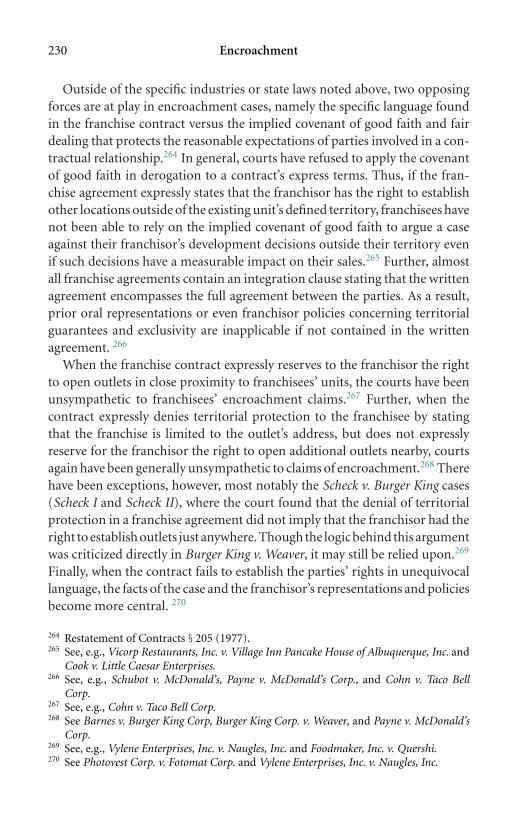
P1: KSF0521772524c08.xml CB802/Blair 0 521 77252 4 April 30, 2005 13:3
230 Encroachment
Outside of the specific industries or state laws noted above, two opposingforces are at play in encroachment cases, namely the specific language foundin the franchise contract versus the implied covenant of good faith and fairdealing that protects the reasonable expectations of parties involved in a con-tractual relationship.264 In general, courts have refused to apply the covenantof good faith in derogation to a contract’s express terms. Thus, if the fran-chise agreement expressly states that the franchisor has the right to establishother locations outside of the existing unit’s defined territory, franchisees havenot been able to rely on the implied covenant of good faith to argue a caseagainst their franchisor’s development decisions outside their territory evenif such decisions have a measurable impact on their sales.265 Further, almostall franchise agreements contain an integration clause stating that the writtenagreement encompasses the full agreement between the parties. As a result,prior oral representations or even franchisor policies concerning territorialguarantees and exclusivity are inapplicable if not contained in the writtenagreement. 266
When the franchise contract expressly reserves to the franchisor the rightto open outlets in close proximity to franchisees’ units, the courts have beenunsympathetic to franchisees’ encroachment claims.267 Further, when thecontract expressly denies territorial protection to the franchisee by statingthat the franchise is limited to the outlet’s address, but does not expresslyreserve for the franchisor the right to open additional outlets nearby, courtsagain have been generally unsympathetic to claims of encroachment.268 Therehave been exceptions, however, most notably the Scheck v. Burger King cases(Scheck I and Scheck II), where the court found that the denial of territorialprotection in a franchise agreement did not imply that the franchisor had theright to establish outlets just anywhere. Though the logic behind this argumentwas criticized directly in Burger King v. Weaver, it may still be relied upon.269
Finally, when the contract fails to establish the parties’ rights in unequivocallanguage, the facts of the case and the franchisor’s representations and policiesbecome more central. 270
264 Restatement of Contracts § 205 (1977).265 See, e.g., Vicorp Restaurants, Inc. v. Village Inn Pancake House of Albuquerque, Inc. and
Cook v. Little Caesar Enterprises.266 See, e.g., Schubot v. McDonald’s, Payne v. McDonald’s Corp., and Cohn v. Taco Bell
Corp.267 See, e.g., Cohn v. Taco Bell Corp.268 See Barnes v. Burger King Corp, Burger King Corp. v. Weaver, and Payne v. McDonald’s
Corp.269 See, e.g., Vylene Enterprises, Inc. v. Naugles, Inc. and Foodmaker, Inc. v. Quershi.270 See Photovest Corp. v. Fotomat Corp. and Vylene Enterprises, Inc. v. Naugles, Inc.

P1: KSF0521772524c08.xml CB802/Blair 0 521 77252 4 April 30, 2005 13:3
8.4 Non-Traditional Encroachment 231
8.4 Non-Traditional Encroachment
In its study of the largest 50 fast-food franchisors in the U.S., Frandata Corp.found that 26 offered exclusive territories. These 26, however, all reservedsome rights to themselves even within the franchisee’s territory. Most com-mon were franchisor rights to develop franchises under different trade names(18 of the 26 franchisors) and the right to develop institutional locations, suchas in stadiums, hospitals, airports, and so on (9 of 26 franchisors). Further,among the full set of 50 franchisors, 31 explicitly reserved the right to selltheir products through alternative channels.
These different rights that franchisors embed in their contracts make itclear that they feel a need to reserve for themselves the right to respond to newmarket opportunities or challenges, as they see fit. And indeed, a franchisedchain’s long-term survival and growth is intrinsically tied to the franchisor’smarket strategy and its capacity to adapt to changing circumstances. Butfranchisees may not benefit at all from the resulting changes and, if they do,they may not benefit equally. For example, when Popeye’s acquired Church’sFried Chicken, some Popeye’s franchisees sued their franchisor, America’sFavorite Chicken Co. (AFC), because the new strategy of the firm was tospecialize the two chains, Popeye’s for quality and Church’s for value. Theplaintiff Popeye’s franchisees were in markets where they believed a valuestrategy like that of Church’s would be more profitable. The court found forthe franchisor, however, as the terms of the contract were quite clear thatthe franchisor could run outlets under different marks in the franchisee’sterritory. Moreover, the court noted that the franchisor believed its strategywas best for the two chains, and the fact that “AFC’s marketing strategy forthe Popeye’s system had made [the franchisee] less competitive” in his marketdid not constitute bad faith.
More generally, claims of non-traditional encroachment will likely arisewhenever franchisors react to new market opportunities in ways that eitherdo not benefit, or even directly impinge, on their franchisees’ businesses.Examples have included franchisors using alternative channels such as su-permarkets or the Internet, or serving national accounts or business cus-tomers directly without resorting to franchisees, or establishing outlets innon-traditional settings, or, finally, operating competing brands obtainedthrough acquisition or internal development. In all cases, franchisees worryabout losing business to these alternatives while franchisors argue that the in-creased visibility of the brand brings additional customers and prevents entryby others in the same markets. When franchisors operate competing brands inthe same market, they rely primarily on arguments of efficiency and/or argue

P1: KSF0521772524c08.xml CB802/Blair 0 521 77252 4 April 30, 2005 13:3
232 Encroachment
that the offerings of the different concepts target different market segmentsand thus complement one another. But whether this turns out to be goodor bad for an individual outlet, or even the chain, will again depend on thespecific market situation and the way in which the franchisor organizes theseactivities.
The precedents established in legal disputes over geographic encroach-ment also apply, generally, to non-traditional encroachment. In particular,the courts have ruled that where a franchisor has expressly reserved the rightto distribute its product through alternative channels in the contract, theprovision is enforceable. For example, in the landmark Haagen-Dazs cases,franchisees sued after Pillsbury decided to start mass distribution of its icecream via supermarkets.271 But the franchise agreement provided that “theHaagen-Dazs trademark owner (i.e., Pillsbury) has the right and may dis-tribute products identified by the Haagen-Dazs trademarks through not onlyHaagen-Dazs shops but through any other distribution method which mayfrom time to time be established.” As a result, the court found in favor ofPillsbury. Similarly, in the case of AFC, described above, the court ruled forthe franchisor given that the franchise agreement explicitly reserved the rightof the franchisor to compete with its franchisees under different marks.272
However, in October 2002, the U.S. District Court for the District of Con-necticut ruled in favor of franchisees in a series of cases involving the CarvelCorporation’s supermarket distribution program, awarding franchisees morethan one million dollars in compensatory and punitive damages. The CarvelCorporation has appealed these decisions. It also has modified its franchiseagreements to make it very clear that franchisees are not granted any “pro-prietary or territorial rights or protections of any type” (see the appendix tothis chapter for the text of the original and modified contract, per Kanouse2000).
The advent of the Internet has raised a number of new opportunities forboth franchisors and franchisees. The effect of this new way of reaching cus-tomers in at least some segments of the retail and service industries, such astravel services and accounting services, is yet to be fully understood. Two re-cent arbitration decisions suggest that here again the language of the contractis paramount in determining the respective rights and duties of franchisorsand franchisees. In the Emporium Drug Mart Inc. v. Drug Emporium Inc. of
271 See Carlock v. Pillsbury Co. (1989) and Rosenberg v. Pillsbury Co. (1989).272 Clark v. America’s Favorite Chicken Co. For more on the issues raised by mergers or
acquisitions in the context of franchising, see Vines (1996).

P1: KSF0521772524c08.xml CB802/Blair 0 521 77252 4 April 30, 2005 13:3
8.5 Conclusion 233
Denton case, an arbitration panel decided that an online drugstore was in facta drugstore, and that its operations encroached on the exclusive territoriesgranted to franchisees in the franchise agreement. Similarly, an arbitrationpanel found that H&R Block franchisees were harmed by the company’s newInternet tax preparation activities and, given their contractual right to anexclusive territory, franchisees may have claims for damages against H&RBlock.273
As in the case of traditional encroachment, many franchisors also haveinstituted programs by which internet sales are made through local franchisee-owned shops or other mechanisms whereby franchisees share in the revenuesor profits thus generated. In fact, in the Drug Emporium case, the arbitrationpanel ordered the franchisor to direct customers to local stores instead ofshipping directly to customers living in franchisees’ exclusive territories.274
Above all, whether for internet sales or for other channels, the decisionsabove again point to the importance of explicit language covering all alterna-tive channels in franchise agreements so that both parties are clear as to whatis permitted and what is not.
8.5 Conclusion
The franchise contract confers certain rights on the franchisee for a period oftime. In the best of cases, these rights, and the limits upon them, are clearlyspelled out in the contract. When they are not, ambiguities and disputes arethe logical consequence.
Encroachment is one of these complex, emotional issues for franchisees.In terms of economic effect, encroachment amounts to increased intrabrand(as opposed to interbrand) competition. Such enhanced competition withina brand threatens the financial well being of the incumbent franchisees andthey complain. Some of these complaints resonate with legislators. In Iowaand several other states in the U.S., these complaints have resulted in legisla-tion that is intended to protect incumbent franchisees from such intrabrandcompetition. Currently, there is also federal legislation under considerationthat is intended to accomplish the same goal.
In this chapter, we have used a simple, stylized illustration to analyze thealleged problem of geographic encroachment. But our focus has not been
273 See the Goldstein Law Group (2003).274 Before the order was even implemented, Drug Emporium sold its Web site to Health-
Central.com. Shortly thereafter, it underwent a bankruptcy restructuring and was ac-quired by another drugstore chain.

P1: KSF0521772524c08.xml CB802/Blair 0 521 77252 4 April 30, 2005 13:3
234 Encroachment
limited to the incumbent franchisees. We have also examined the effect onfranchisors, would-be franchisees, and consumers. As one might suppose,the protectionist legislation confers benefits on the incumbent franchisees,but makes everyone else worse off: franchisors make less profit and would-befranchisees must look elsewhere to presumably less attractive business alter-natives. In our simple model, consumers are also worse off in that they haveless access to the franchisor’s product and thus consume less of it. Empiricalevidence indicates that consumers in reality pay higher prices and enjoy lessconvenience as a result of legislation that has been enacted to protect cardealers.
The sad thing about legislation of territorial protection is that it is largelyunnecessary. The legislation corresponds to governmental intervention inwhat is fundamentally a contractual relationship. The rights and the respon-sibilities of the franchisor and the franchisee are contract matters. Whendisputes arise, they can be resolved as any contract dispute is resolved. Weare mindful of the fact that resorting to litigation is very costly and somefranchisees may discover that justice is out of their financial reach. But theprotectionist legislation is not self-enforcing and, therefore, franchisees whofeel victimized still have to resort to the judicial system and bear the associatedcosts.
We also have examined various ways in which franchisors and their fran-chisees can avoid conflicts and misunderstandings. Importantly, many ofthese strategies focus on enhancing the flow of accurate information, whichresults in more realistic expectations on all sides. When everyone knows whatto expect upon entering a franchise relationship, and then at every stage dur-ing the contract, surprises and disappointments are less likely and conflict isthus minimized.
8.6 Appendix: Carvel Corporation’s Contract: Before and After
Having been sued by franchisees for encroachment when it developed itssupermarket strategy, the Carvel Corporation has substantially modified itsfranchise agreement to prevent further suits (Kanouse 2000). The agreementinvolved in the lawsuit read:
So long as Licensee complies with all of the terms of this Agreement, Carvelagrees not to establish or license another person to establish a Carvel Store on[name of street] for the sale of Carvel products, within one-quarter of a mile onsaid street in either direction from Carvel Store.
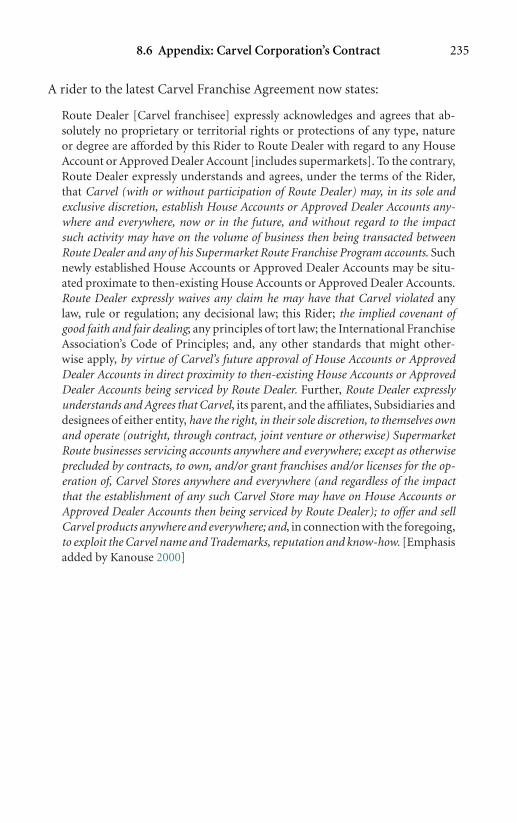
P1: KSF0521772524c08.xml CB802/Blair 0 521 77252 4 April 30, 2005 13:3
8.6 Appendix: Carvel Corporation’s Contract 235
A rider to the latest Carvel Franchise Agreement now states:
Route Dealer [Carvel franchisee] expressly acknowledges and agrees that ab-solutely no proprietary or territorial rights or protections of any type, natureor degree are afforded by this Rider to Route Dealer with regard to any HouseAccount or Approved Dealer Account [includes supermarkets]. To the contrary,Route Dealer expressly understands and agrees, under the terms of the Rider,that Carvel (with or without participation of Route Dealer) may, in its sole andexclusive discretion, establish House Accounts or Approved Dealer Accounts any-where and everywhere, now or in the future, and without regard to the impactsuch activity may have on the volume of business then being transacted betweenRoute Dealer and any of his Supermarket Route Franchise Program accounts. Suchnewly established House Accounts or Approved Dealer Accounts may be situ-ated proximate to then-existing House Accounts or Approved Dealer Accounts.Route Dealer expressly waives any claim he may have that Carvel violated anylaw, rule or regulation; any decisional law; this Rider; the implied covenant ofgood faith and fair dealing; any principles of tort law; the International FranchiseAssociation’s Code of Principles; and, any other standards that might other-wise apply, by virtue of Carvel’s future approval of House Accounts or ApprovedDealer Accounts in direct proximity to then-existing House Accounts or ApprovedDealer Accounts being serviced by Route Dealer. Further, Route Dealer expresslyunderstands and Agrees that Carvel, its parent, and the affiliates, Subsidiaries anddesignees of either entity, have the right, in their sole discretion, to themselves ownand operate (outright, through contract, joint venture or otherwise) SupermarketRoute businesses servicing accounts anywhere and everywhere; except as otherwiseprecluded by contracts, to own, and/or grant franchises and/or licenses for the op-eration of, Carvel Stores anywhere and everywhere (and regardless of the impactthat the establishment of any such Carvel Store may have on House Accounts orApproved Dealer Accounts then being serviced by Route Dealer); to offer and sellCarvel products anywhere and everywhere; and, in connection with the foregoing,to exploit the Carvel name and Trademarks, reputation and know-how. [Emphasisadded by Kanouse 2000]
P1: JZP/... P2: JZP/...0521772524c09.xml CB802/Blair 0 521 77252 4 April 29, 2005 21:46
9
Advertising and Promotion
9.1 Introduction
The benefits of joining an established franchised chain for a franchisee, andthus the reasons why franchisees are willing to pay fees to be part of a fran-chised chain, can be grouped into two broad categories: cost-reducing anddemand-enhancing benefits. The cost-reducing benefits include establishedsupply relations and economies of large-scale purchasing, comprehensiveand ongoing programs to develop efficient production processes, manage-ment training and consulting, and so on. Demand-enhancing benefits arisemostly from the brand and the products associated with it. In other words,when franchisees join a chain, they do so under the expectation that the brandthat they get to operate under will bring in customers who might otherwisenot have visited their store. A rare case of a McDonald’s franchisee who “losthis arches” illustrates how important the brand can be to franchisees: therestaurant in question was operated very similarly by the same individuals inthe same place after terminating its relationship with the McDonald’s system.Despite all that, its sales fell by 60 percent immediately. Sales continued to godown after the initial shock, and never again exceeded 35 percent of the levelthey had achieved as part of the McDonald’s system. The restaurant closedfor good some 12 to 18 months later.275
It should come as no surprise then that advertising, a main determinant ofbrand value, plays a central role in franchise relationships. In Chapter 3, wedocumented how most franchisors today require franchisees to contributesome specified proportion of their sales towards advertising. Advertising feesmost often range between 1 and 3 percent of total sales. Further contributions
275 See Atkins, D., (1990), Affidavit In the Matter of Canterbury et al. v. Commissioner ofInternal Revenue.
236

P1: JZP/... P2: JZP/...0521772524c09.xml CB802/Blair 0 521 77252 4 April 29, 2005 21:46
9.2 A Simple Model of Advertising as Information 237
to local advertising are sometimes added to the franchisees’ obligations in thisregard.
In this chapter, we first review briefly the role that advertising plays in gener-ating demand, focusing on consumers’ need for information about products,prices, and availability. We then describe how differing economies of scale inadvertising versus local production make it efficient for retail and service firmsto be organized as chains of physically separate outlets. Next, we describe thepublic-good nature of advertising in franchised chains, and discuss the settingof optimal advertising budgets in this context. We then move on to a moredetailed discussion of advertising requirements in franchised chains, followedby an examination of franchisor–franchisee conflict over advertising. We offera few concluding remarks in the last section of this chapter.
9.2 A Simple Model of Advertising as Information276
Advertising has many functions, but one of its principal functions is to provideinformation to consumers about product price and quality, store location,hours of operation, and so on.277 In this section, we present a simple modelof advertising as a source of information. This view of the information role ofbrands, and of the advertising expenditures that support these brands, accordsparticularly well with the oft-heard idea that mobile customers, in particular,value chains because they know what to expect when they frequent them.278
9.2.1 Advertising as Information: Some Fundamentals
There are two reasons why it is necessary to advertise continuously to makeconsumers aware of the firm’s existence, the quality of its products, and so on.First, the identity of buyers and sellers changes over time. Of particular interestto any one firm is the changing identity of its customer base. New customers
276 Much of the material in this section is drawn from Stigler (1961). This treatment relieson Blair and Kenny (1982).
277 Non-informative advertising is often viewed as an attempt by firms to alter consumers’preferences – see, notably, Dixit and Norman (1978). But see also Becker and Murphy(1993) for an analysis that treats non-informative advertising as a complement toadvertised products in stable meta-utility functions.
278 Brands also allow customers to punish firms that do not deliver what they claim todeliver. Because of this opportunity to punish brand holders by refusing to consumetheir product in the future, advertising investments become likely indicators of actualperformance. This role of brands also depends on their information content. For moreon this, see Klein and Leffler (1981).
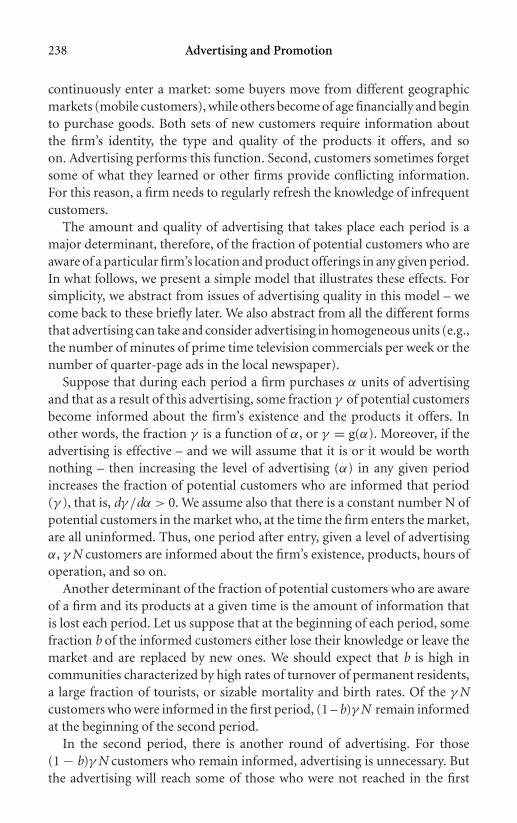
P1: JZP/... P2: JZP/...0521772524c09.xml CB802/Blair 0 521 77252 4 April 29, 2005 21:46
238 Advertising and Promotion
continuously enter a market: some buyers move from different geographicmarkets (mobile customers), while others become of age financially and beginto purchase goods. Both sets of new customers require information aboutthe firm’s identity, the type and quality of the products it offers, and soon. Advertising performs this function. Second, customers sometimes forgetsome of what they learned or other firms provide conflicting information.For this reason, a firm needs to regularly refresh the knowledge of infrequentcustomers.
The amount and quality of advertising that takes place each period is amajor determinant, therefore, of the fraction of potential customers who areaware of a particular firm’s location and product offerings in any given period.In what follows, we present a simple model that illustrates these effects. Forsimplicity, we abstract from issues of advertising quality in this model – wecome back to these briefly later. We also abstract from all the different formsthat advertising can take and consider advertising in homogeneous units (e.g.,the number of minutes of prime time television commercials per week or thenumber of quarter-page ads in the local newspaper).
Suppose that during each period a firm purchases α units of advertisingand that as a result of this advertising, some fraction γ of potential customersbecome informed about the firm’s existence and the products it offers. Inother words, the fraction γ is a function of α, or γ = g(α). Moreover, if theadvertising is effective – and we will assume that it is or it would be worthnothing – then increasing the level of advertising (α) in any given periodincreases the fraction of potential customers who are informed that period(γ ), that is, dγ /dα > 0. We assume also that there is a constant number N ofpotential customers in the market who, at the time the firm enters the market,are all uninformed. Thus, one period after entry, given a level of advertisingα, γ N customers are informed about the firm’s existence, products, hours ofoperation, and so on.
Another determinant of the fraction of potential customers who are awareof a firm and its products at a given time is the amount of information thatis lost each period. Let us suppose that at the beginning of each period, somefraction b of the informed customers either lose their knowledge or leave themarket and are replaced by new ones. We should expect that b is high incommunities characterized by high rates of turnover of permanent residents,a large fraction of tourists, or sizable mortality and birth rates. Of the γ Ncustomers who were informed in the first period, (1 – b)γ N remain informedat the beginning of the second period.
In the second period, there is another round of advertising. For those(1 − b)γ N customers who remain informed, advertising is unnecessary. Butthe advertising will reach some of those who were not reached in the first
P1: JZP/... P2: JZP/...0521772524c09.xml CB802/Blair 0 521 77252 4 April 29, 2005 21:46
9.2 A Simple Model of Advertising as Information 239
period, (1− γ )N, and those who had been informed but somehow becameuninformed, bγ N. Once again, advertising at a level α will reach a fraction γ
of these two groups. Thus, by the end of the second period, a fraction (λ) ofN will be aware of the firm’s offerings:
λN = (1 − b)γ N + γ [bγ N + (1 − γ )N]. (9.1)
Equation (9.1) may be simplified to yield
λN = γ N[1 + (1 − b)(1 − γ )].
Continuing this process over k periods, it can be shown that at the end of kperiods,
λk N = γ N[1 + (1 − b)(1 − γ ) + (1 − b)2(1 − γ )2 + . . .
+(1 − b)k−1(1 − γ )k−1]
potential customers are informed. This is a series with the property that as kapproaches infinity,
λ∞N = γ N
1 − (1 − γ )(1 − b). (9.2)
In other words, the number of informed buyers equals γ N in the first periodand increases in each successive period, approachingγ N/[1− (1−γ )(1−b)]in the limit.
An examination of equation (9.2) shows the relationship between the num-ber of informed buyers and both the effectiveness of the advertising in reachingcustomers, γ , and the retention rate, (1 − b). As one would expect, an increasein the retention rate of advertising knowledge (1 − b) results in an increasein the number of informed buyers in each period. We can see that as (1 − b)rises, the denominator in (9.2) falls, which increases the fraction of total cus-tomers who are informed.279 Similarly, for a given level of advertising α eachperiod, more consumers know about a firm’s existence at the end of everyperiod if the advertising reaches more people each time (i.e., when it is moreeffective). Thus, we see that an increase in γ leads to a rise in λ∞N.280 Thatis why firms are interested in influencing the retention rate (1 − b) and thecontact rate (γ ) of their advertising messages.
In the remainder of this section, we pursue our model of advertising asinformation by discussing how a monopolist, and then a firm in a morecompetitive environment, would set its advertising budget.
279 Analytically, the sign of ∂(λ∞N)/∂(1 − b) is positive.280 Analytically, the sign of ∂(λ∞N)/∂γ is positive.

P1: JZP/... P2: JZP/...0521772524c09.xml CB802/Blair 0 521 77252 4 April 29, 2005 21:46
240 Advertising and Promotion
9.2.2 Optimal Advertising: The Monopoly Solution
If advertising informs customers as per the discussion above, a monopolistwill set its price (P) and its quantity of advertising (α) to maximize profit.Since profit equals total revenue less total costs, including total productioncosts, C(Q), and expenditures on advertising, we may express the monopolist’sprofit as
π = P Q − C (Q) − Caα, (9.3)
where Q denotes the total quantity sold and Ca represents the cost of a unitof advertising (e.g., the cost of a minute of prime-time television, where wemaintain the assumption that advertising is homogeneous). We assume, againfor simplicity, that every potential customer who is aware of this monopolist’sexistence buys some quantity q from him.281 Thus, the total quantity sold isequal to the product of the number of customers who buy from the firm (λN)and the quantity purchased by each customer (q):
Q = λNq . (9.4)
By substituting equation (9.4) into equation (9.3), we get
π = P λNq − C (λNq) − Caα, (9.5)
an expression that shows the firm’s profit as a function of the number ofinformed buyers (λN), the quantity purchased by each customer (q), theproduct price (P), the costs of production C ( �), and the expenditure onadvertising (Caα).
In order to maximize profit, the firm will adjust its output and the amountof advertising until the profit can no longer be increased by changes in thesevariables, that is, until the first partial derivatives of π with respect to Q andto α are equal to zero:
∂π
∂Q=
(P + Q
d P
dQ
)− dC (Q)
dQ= 0 (9.6)
or M R − MC p = 0,
and∂π
∂α= P q N
dλ
dα− q N
dC (Q)
d Q
dλ
dα− Ca = 0 (9.7)
or P − MC p = Ca
q N(dλ/dα).
281 Alternatively, we could assume that some constant proportion of them buy – all resultswould go through in the same way except we would need to keep track of an extraparameter describing this proportion.For simplicity, we are considering a one-period model. Those who are informed byadvertising buy the monopolist’s product. Thus,λmeasures the advertising penetrationfor this period alone.

P1: JZP/... P2: JZP/...0521772524c09.xml CB802/Blair 0 521 77252 4 April 29, 2005 21:46
9.2 A Simple Model of Advertising as Information 241
Condition (9.6) is the usual profit maximization condition that output shouldbe expanded until marginal revenue equals the marginal cost of production.Condition (9.7) states that the monopolist should increase informative ad-vertising until the markup over production cost, P − MCp, equals the perunit cost of advertising, Ca, divided by the marginal impact on quantity solddue to increasing the amount of advertising.
9.2.3 Optimal Advertising Under Imperfect Competition
A slightly more complicated, but more interesting situation arises when manyfirms are selling close substitutes. For example, most retail markets con-tain many different gasoline stations selling different brands of gasoline aswell as many different hamburgers sold under the McDonald’s, Burger King,Wendy’s, and other trademarks. Changes in demand and supply conditionscontinually alter the equilibrium price. At any point in time, there will be adistribution of prices offered by the different sellers in a market. Consumerswill have to go from one firm to the other searching for the best deal: theirsearch is costly. One of the primary functions of advertising in that con-text is to induce consumers to visit a particular firm in their search for thebest deal.
To make this point more precise, let us assume that each consumer goesto several stores before deciding where to buy. Suppose also that, given whatall the other firms are doing, each firm i is able to increase the number ofpotential customers who canvass its store in any given period (δi) by increasingits advertising (αi), and that the manager of firm i can increase the fractionof those canvassers who ultimately buy from his store (Mi) by lowering hisprice. In other words, as consumers shop around but incur costs in doing so,they will stop searching and buy when they find a price that they believe isrelatively low. Hence, a lower price induces a high proportion of canvassersto stop searching and actually buy.282
The total revenue received by firm i equals
TRi = Pi q(Pi )δi Mi ,
where Pi is the price per unit, q(Pi) denotes the quantity bought by eachbuyer, which we assume depends on the firm’s price but not its advertising,δi represents the number of customers who canvass the store, and Mi is the
282 See Lewis (2003) for a model where consumers set their “reference” price based onprices observed during previous purchase occasions.
P1: JZP/... P2: JZP/...0521772524c09.xml CB802/Blair 0 521 77252 4 April 29, 2005 21:46
242 Advertising and Promotion
fraction of those canvassing the store who buy from it. The firm’s profit is
πi = Pi q(Pi )δi Mi − C (Q) − Caαi .
Where Q = q(pi )δi Mi . Holding fixed what all other firms are doing, max-imizing profit is accomplished by setting the appropriate price and level ofadvertising.
As in the monopoly case, advertising has its benefits and costs. The optimallevel of advertising occurs where the marginal benefit of selling one more unitthrough advertising equals the marginal cost of selling that unit. As before,the marginal benefit of selling one more unit through advertising equals thedifference between the price at which it is sold and the marginal cost ofgenerating the demand for, and of producing, this extra unit. Let us nowexamine the cost of generating the demand for this extra unit. By definition,the number of consumers who canvass a store rises by d(δi )/dαi when the levelof advertising is increased. Because only a fraction Mi of canvassers buy froma store and each buyer purchases q(Pi) units, a unit increase in advertisingbrings about an increase in sales of Mi q(Pi )(dδi/dαi ). But it costs Ca tobring this about. Accordingly, the cost of selling an additional unit throughadvertising equals Ca/[Mi q(dδi/dαi )]. In other words, profit is maximizedwhen
Pi − MC p = Ca
q Mi (dδi/dαi ), (9.8)
where for simplicity we write q(Pi) simply as q.We can illustrate the intuition behind condition (9.8) as follows. Suppose
that a Goodyear tire distributor sells a particular model for $100 per tire.The purchasing, inventory, and installation costs are $70 per tire. Based onexperience and marketing surveys, the distributor estimates that one minuteof local TV advertising, which costs $200, brings 10 new potential customersinto his store. His experience is that at $100 per tire, one-third of thosepotential customers on average will actually buy tires, and each of them willbuy four tires. Given these facts, we have Pi = $100, MCp = $70, Ca = $200,Mi = 1/3, q = 4, and dδi/dαi = 10. Thus, the distributor earns a $30 profit oneach tire sold: P − MCp = $100 − $70 = $30. The cost of selling an additionaltire through increased advertising is
Ca
q Mi (dδi/dαi )= $200
4(1/3)10= $15.
The distributor in this example should expand his advertising effort as thereis additional net profit to be earned: the benefit of selling one more unit, $30,is greater than the cost of the same (= $15).
P1: JZP/... P2: JZP/...0521772524c09.xml CB802/Blair 0 521 77252 4 April 29, 2005 21:46
9.2 A Simple Model of Advertising as Information 243
In our discussion above, we have not addressed competitors’ reactions tothe firm’s choice of advertising level. If competitors also all know that theycan get more customers to canvass their stores if they advertise, all of themwill do so. In equilibrium, the effect that a single store’s advertising has onthe number of new customers will be smaller than it would be if other storesdid not advertise, but the optimal amount of advertising by each store will belarger than under monopoly as each firm now has to counter the “businessstealing” effect of its competitor’s advertising. Any rents that might accrue tothe firms as a result of advertising are dissipated by competition.283
Similarly, we have not addressed yet the issue of pricing. To maximizeprofit, the manager must not only pick the correct level of advertising buthe must also choose the correct price. And the pricing decision, just like theadvertising decision, is more complicated when there are other firms sellingessentially the same product than when the firm is the only one selling aparticular product.
We have seen that the manager of a monopoly maximizes the firm’s profitby equating the increase in total revenue from selling one more unit to eachcustomer to the marginal cost of production. We will now derive a similarcondition for a seller competing with other sellers in a market characterizedby imperfect information.
At any given level of advertising, a firm is able to sell more of its productwhen it lowers its price. This is true for two reasons. As the price falls, eachcustomer may purchase more – that is, as we saw before, q is a function of Pi.A price decrease also causes a greater fraction of canvassers to purchase fromthis particular firm. Both of these effects are incorporated in the negativeslope of the demand curve facing the firm and so both will influence theprofit-maximizing price.
Holding advertising levels and prices of all other firms in the industry con-stant, the firm facing competition from sellers with slightly different productswill determine its optimal price from its profit function:
πi = Pi q(Pi )δi (αi , α−i )Mi (Pi ) − C (Q) − Caαi
where the notation δi (αi , α−i ) simply denotes the fact that the number ofcustomers canvassing the store is a function of this firm’s and all other firms’advertising levels. Holding these fixed, optimization requires that the firmchoose the price that causes the first partial derivative of profit with respect
283 Stigler (1968) explains that while non-price competition does not lead to price reduc-tions, it instead leads to the dissipation of non-competitive profits.
P1: JZP/... P2: JZP/...0521772524c09.xml CB802/Blair 0 521 77252 4 April 29, 2005 21:46
244 Advertising and Promotion
to its price to be equal to zero:
∂πi
∂Pi= δi
[Mi d(Pi q)
d Pi+ (Pi q)d Mi
d Pi
]− MC pδi
[Mi dq
d Pi+ qd Mi
d Pi
]= 0.
We can rearrange this condition as
MC p = Mi (d(Pi q)/d Pi ) + Pi q(d Mi/d Pi )
Mi (dq/d Pi ) + q(d Mi/d Pi ).
This expression can be further simplified. If we define the price elasticity ofindividual demand as
εq ,P = dq
d Pi· Pi
q,
and the elasticity of Mi with respect to price as
εM,P = −d Mi
d Pi· Pi
Mi,
we can write the profit maximization condition as
MC p = Pi
[1 − 1
εq ,P + εM,P
]. (9.9)
In this context, price deviates from marginal cost because informationis costly; that is, customers incur costs of searching for the best value. Ifinformation were free, all customers would buy from the firm offering thelowest price. In other words, the sum of the elasticities would be infiniteand condition (9.9) would require setting price equal to the marginal cost ofproduction, the standard competitive result.
9.3 The Effect of Scale Economies
In our discussion above, we have described how advertising can be used byfirms to provide information to customers: once they are aware of the firmand its products, customers will choose whether or not to canvass a store andwhether or not to purchase some amount q of the good. Advertising can, ofcourse, serve other roles, but the bottom line for firms is that it increases thedemand for their products. This, in turn, means that it is worth investingin advertising. In this section, we take it as given that advertising increasesdemand and focus on the cost of advertising as a factor that can influencehow firms are organized. Specifically, we explore how differences in the scaleeconomies associated with production or distribution versus advertising caninfluence the organizational form of the firm.

P1: JZP/... P2: JZP/...0521772524c09.xml CB802/Blair 0 521 77252 4 April 29, 2005 21:46
9.3 The Effect of Scale Economies 245
$/unit
Quantity0
Q Min ACP
ACP
ACA
QMin ACA
Figure 9-1: The effect of differing economies of scale in production and advertising.
When the economies of scale in advertising are much larger than theeconomies of scale in production and distribution, meaning that the firm sizerequired to exhaust economies of scale for advertising is much larger thanthat needed to minimize production costs, multi-establishment or chain or-ganization may be the solution. The chain organization can exploit relativelylarge-scale economies in advertising by combining the purchasing power ofthe different units in the chain, and promoting the chain at a national orregional level. At the same time, the individual establishments that are partof the chain can exhaust the scale economies in production and distributionat the local level.
Consider the illustration in Figure 9-1, which depicts the average cost ofadvertising per unit of output sold as ACA and the average cost of productionas ACP. In this example, we can see that the minimum-cost output level foradvertising is much larger than the minimum-cost output in production.Specifically, as drawn, the efficient size for advertising is about three timeslarger than the efficient size for production. As a result, a chain with at leastthree units would perform well: the chain can specialize the head office, orthe franchisor if it is franchised, in advertising and brand-building activitieswhile the local units, or franchisees, focus on the production and distributionactivities. In doing so, the chain efficiently exhausts all economies of scale inboth sets of activities.
The economic motivation for chain organization thus depends upon therelative scale economies in advertising and production. Products for which
P1: JZP/... P2: JZP/...0521772524c09.xml CB802/Blair 0 521 77252 4 April 29, 2005 21:46
246 Advertising and Promotion
the minimum cost levels of production are low yet brand recognition can behighly valuable, for example, retail and service activities, are good candidates.It is not surprising then that the fast-food industry, and other types of busi-nesses that must operate close to their geographically dispersed customers inorder to attract their patronage, such as home cleaning, car repairs, real estateservices, and the like, are organized as chains. In these cases, a good deal ofthe advertising is designed to make us aware of the chain’s existence and toremove uncertainty in the customer’s mind regarding product quality. This,in turn, explains the focus on consistency in most franchised chains (seeChapter 5). If products and implementation differed considerably acrossoutlets, there would be little information to provide to customers throughadvertising! With generally consistent implementation throughout thechain, customers have a good idea of what to expect when they walk into aMcDonald’s restaurant, a Holiday Inn motel, or an Ace Hardware store any-where in the country or even the world. Moreover, it would be much toocostly for an individual restaurant, hotel, or hardware store to organize a sim-ilar level of promotional effort on its own. Thus, it makes sense for the centralentity, or franchisor if the chain is franchised, to take on this burden. The localrestaurant, hotel and hardware store, on the other hand, can easily exhaustthe scale economies in producing and selling meals and hotel services, and inretailing hardware products locally.
In fact, exhausting economies of scale in branding and in purchasing havebeen main drivers behind the tendency to organize much of the retailing andservices sectors with large chains of individual units. Access to lower-costinputs, including advertising, historically has been, and remains to this day,an important part of the package that franchisors sell to potential conversionfranchisees. In other words, when franchisors like Best Western, or ReMax, orEmbers try to convince owners of existing businesses to join their chain, theystrongly emphasize the economies and demand-enhancing benefits associatedwith operating under a common, well-known brand.284
9.4 Advertising as a Public Good in Franchised Chains
System-wide advertising is common for chains of outlets. It is also commonspecifically in franchised systems: we have all seen national television ads forautomobiles, gasoline, fast-food restaurants, beer, accounting services, andhotels, to mention just a few. When a chain is organized as a single corporate
284 See, e.g., http://www.bestwestern.com/aboutus/memdev/main.asp, http://www.remax.com/join/advantages.shtml, and http://www.embersamerica.com/franchise.htm.

P1: JZP/... P2: JZP/...0521772524c09.xml CB802/Blair 0 521 77252 4 April 29, 2005 21:46
9.4 Advertising as a Public Good in Franchised Chains 247
entity operating all of its outlets directly, shareholders as a group both bearthe cost of, and receive the benefits from, advertising decisions. When a chainis franchised, however, many separate individual franchisees benefit from thesame advertising. In other words, advertising is a public good for the membersof the franchise system. It is both non-rival and nonexclusive, which are the twocentral characteristics of a public good.285 Being non-rival simply means thatall owners of all the units can benefit at no extra cost.286 When McDonald’splaces a national ad during the Olympics television coverage, the benefits toa franchisee or to a franchised unit in Florida are not reduced by the benefitsenjoyed by a franchisee or franchised unit in Michigan. Similarly, whateverpositive effect a Ford ad during the Super Bowl may have in New Jerseydoes not diminish the benefits for Ford dealers in Texas. Being nonexclusivemeans that no franchisee or franchised unit can be excluded specifically fromthe benefits of the advertising campaign. Since the campaign pertains to thefranchise system as a whole, all units and franchisees will benefit to one extentor another.
While advertising is a public good in a franchised chain, each franchiseeindividually has a demand for advertising that flows from its own efforts tomaximize the profits of its outlets. The individual franchisee’s optimal levelof advertising is the one that makes the cost to it of an extra unit of advertisingequal to the benefit:
Ca = Pi∂ Qi/∂αi ,
where Qi is the quantity sold in a franchisee’s outlet, and αi is the amount ofadvertising benefiting the outlet.287 These individual demands for advertising,of course, will vary across outlets and franchisees due to the unique economicand demographic characteristics of each market. Because the benefits to thefranchisees are not subject to rivalry, that is, the benefit to one franchiseedoes not reduce the benefits to any other franchisee, the marginal benefitschedules (i.e., the individual franchisee demands for advertising) shouldbe added vertically to obtain the system-wide demand. That is, the system-wide marginal benefit of an ad is the vertical sum of the individual marginalbenefits, where the summation is taken over all outlets. This effect, that thebenefit to the system is the sum of individual benefits, is separate from theissue of economies of scale discussed above, and is what makes big-ticket
285 See, e.g., Pindyck and Rubinfeld (2001) at pp. 644–649.286 This is not true of a private good; we cannot both wear the same T-shirt.287 Though franchisees often own more than one outlet, we equate franchisee and outlet
in what follows to simplify the discussion.

P1: JZP/... P2: JZP/...0521772524c09.xml CB802/Blair 0 521 77252 4 April 29, 2005 21:46
248 Advertising and Promotion
SCa
MB2
MB1
α1 α*
MB1 + MB2
Quantity of Ads
V1V2
$
Figure 9-2: The optimal number of ads in a chain of two outlets.
advertising economically feasible for large chains. Certainly, no McDonald’sfranchisee, Anheuser-Busch wholesale distributor, or Ford dealer would findit sensible to pay for an ad during the Super Bowl coverage because 15-secondtime slots cost $2 million. But the system as a whole may well find it bothaffordable and beneficial.
We illustrate these ideas with a stylized example in Figure 9-2 for twofranchisees. The cost of an ad is assumed constant and equal to Ca, reflectinga horizontal supply of advertising (that is, we are assuming away economiesof scale to emphasize the effect of additive marginal benefits). Franchisee1’s marginal benefit schedule is shown as MB1 while franchisee 2’s marginalbenefit schedule is MB2. The aggregate benefit is shown as the vertical sumMB1 + MB2. For this two-outlet system, the optimal number of ads is foundwhere
M B1 + M B2 = Ca .
In this simple example, the joint profit maximizing number of ads is α∗. Ontheir own, neither franchisee would buy α∗ ads because that is not individuallyoptimal: As Figure 9-2 reveals, franchisee 1 would have bought only α1 adsand franchisee 2 would have bought none. For the chain as a whole, however,even α1 is too small because MB1 + MB2 > Ca at α1. This means that furtheradvertising is desirable at that point.
As can also be seen in Figure 9-2, MB1> MB2 at α∗, or put differently, V1 >
V2. If franchisee 1 paid the value to him of this advertising, namely V1 per ad(for a total of V1 · α∗) and franchisee 2 paid V2 (for a total of V2 · α∗),
P1: JZP/... P2: JZP/...0521772524c09.xml CB802/Blair 0 521 77252 4 April 29, 2005 21:46
9.4 Advertising as a Public Good in Franchised Chains 249
these contributions would add up exactly to Caα∗ since by definition
V1 + V2 = Ca. Moreover, at a “price” per ad of V1, franchisee 1 would demandexactly α∗ ads. Similarly, if franchisee 2 paid a “price” per ad of V2, it woulddemand α∗ ads. But, because V1 > V2, it seems “unfair” or discriminatoryfor franchisee 1’s share of total expenditures to be greater than franchisee 2’s.This easily could cause some complaints.
An alternative is for each of the two franchisees to pay Ca/2. In this case,however, V1 > Ca/2 at α∗ and franchisee 1 would want to expand the numberof ads. At the same time, V2 < Ca/2 at α∗ and franchisee 2 would want fewerads along with a reduced proportion of its budget going toward advertising.Thus, a seemingly fair and nondiscriminatory payment scheme, that is split-ting the cost equally between the two franchisees, will leave both franchiseesdissatisfied with the level of advertising even though it is the profit maximizingquantity for the chain as a whole.288
Finally, another problem will be getting franchisees to reveal their demandsso that MB1 + MB2 can be calculated and thus the correct amount of advertis-ing potentially can be purchased. If franchisees are charged in proportion totheir stated demand, each franchisee has an incentive to free ride and say thatit does not value advertising, or, at the very least, say that it values it less than itactually does. The franchisor can solve this problem somewhat imperfectly byrequiring that franchisees contribute a certain fraction of their total revenue,no matter what their stated demands or preferences might be, into an adver-tising fund that the franchisor (e.g., Burger King) administers. Alternatively,the franchisor (e.g., McDonald’s) may require that each franchisee spend aminimum fraction of its total revenue on advertising. It will then make sensefor franchisees to spend these advertising dollars in an optimal way as theywill get more benefit that way for the same expenditure level. If we assumethat franchisees with higher sales on average value advertising more thanowners of smaller or lower sales outlets, an advertising requirement based onoutlet sales at least partially resolves the equity problem described above. Inother words, in this case, those franchisees that value advertising the most paya higher share of total advertising expenditures, yet the fees do not look so“unfair” since the same proportion of sales is required from all franchisees.289
288 It is only in the unlikely event that the franchisees have identical marginal benefitschedules that fair and nondiscriminatory contributions do not lead to dissatisfactionwith the quantity of advertising. Then, V1 + V2 = Ca and V1 = V2.
289 One might argue, however, that it is franchisees with low sales who might benefitmost from advertising, in which case an advertising contribution based on sales levelswould tax more heavily those who value the ads the least, contrary to what would beoptimal. See Dant and Berger (1996) who argue that the more established franchisees
P1: JZP/... P2: JZP/...0521772524c09.xml CB802/Blair 0 521 77252 4 April 29, 2005 21:46
250 Advertising and Promotion
9.5 Advertising in Franchised Chains in Practice
In Chapter 3, we noted that most franchisors today require that franchiseescontribute some proportion of their sales toward advertising. In Volume IIIof the Profile of Franchising, 634 (or 52 percent) of the 1,221 franchisorsthat provided advertising fee data required that franchisees pay a percentageof their sales toward advertising. The remaining franchisors either had norequirement (340, or 28 percent), or demanded contributions only to local orregional advertising funds (149, or 12 percent), or a flat fee (66, or 5 percentof them), or a per transaction fee (13, or 1 percent of the sample). Our datashow a similar tendency to use sales-based advertising fees at the end of oursample period.
Interestingly, the reliance on separate advertising fees was not so popularearlier on. In 1980, the majority of franchisors charged neither sales-based norfixed advertising fees (see Table 3-9 in Chapter 3). In part, this change seemsto reflect a form of contract evolution: whereas franchisors used to specifyroyalties only and use some of the funds thereby collected for advertisingpurposes, the majority of them now explicitly separate the royalty and adver-tising requirements. Brickley (1999) surmises that the increased reliance onseparate fees may be a response to a franchisor moral hazard problem in thatfranchisors may have an incentive to use funds for other purposes if they arenot slated specifically for advertising.290 And indeed, as he points out, somefranchise contracts specify that moneys collected via the advertising fee can-not be commingled with other funds. But authors such as Sen (1995), Stassenand Mittelstaedt (2002), and Lafontaine and Shaw (2005) have examined therelationship between advertising fees and actual advertising expenditures perAd $ Summary.291 They found only a weak, or no, correlation between thetwo. Of course, advertising outlays need not be contemporaneous to the col-lection of fees. These authors tried to account for this however, by looking atadvertising expenditures over long periods, between five and ten years. Otherreasons for the lack of correlation include the fact that some of the funds may
who already enjoy considerable local market reputation and patronage are most likelyto think that their franchisor advertises too much.
290 Brickley, however, mostly views these fees as a constraint on franchisee behavior. Heargues and finds empirically that the presence of separate advertising fees is relatedto the extent of sales externalities among outlets; that is, chains with more externalityproblems (more non-repeat business) must impose such requirement more often.
291 Ad $ Summary, published by LNA/Media Watch (now TNS Media Intelligence/CMR)reports the estimated expenditures on advertising in ten separate media by brand.The estimates are generated by measuring the amount of advertising per brand in thevarious media and using going rates to transform these measures into dollars spent.

P1: JZP/... P2: JZP/...0521772524c09.xml CB802/Blair 0 521 77252 4 April 29, 2005 21:46
9.5 Advertising in Franchised Chains in Practice 251
be spent on regional or local advertising or promotional efforts not capturedby the publishers of Ad $ Summary. Moreover, for many franchisors, espe-cially those with low or no fees, advertising outlays need not be limited bythe amount of fees collected specifically for this purpose. Thus, it may notbe surprising that there is little correlation between estimated outlays andpercentage fees. In other words, as we noted in Chapter 3, many franchisorstoday still may not draw a really clear distinction between royalty and otherrevenue and advertising-related funds.
We also saw in Chapter 3 that there is much variance in how franchisorsspecify their advertising requirement; how they divide it among national,regional, and local expenditures; and what the franchisor commits to exactly.Some franchisors establish an advertising fund while others do not. In its fran-chise contract, Bruegger’s Bagels, for example, requires that each
Franchisee shall contribute weekly to the advertising Fund established by Fran-chisor for the System two percent (2%) of the Gross Sales of the FranchisedBakery.. . .In addition to its contribution to the Fund, Franchisee shall spend monthlyfor local advertising and promotion two percent (2%) of the Gross Sales of theFranchised Bakery.. . .Franchisee acknowledges that the Fund and any earnings thereon will be usedto maximize general public recognition, acceptance, and patronage of BRUEG-GER’S Bakeries, and that Franchisor is not obligated, in administering the Fund,to make expenditures for Franchisee which are equivalent or proportional toFranchisee’s contribution, or to ensure that any particular franchisee benefitsdirectly or pro rata from expenditures by the Fund. Franchisee acknowledgesthat its failure to derive any such benefit will not serve as a basis for a reductionor elimination of its obligation to contribute to the Fund. (Bruegger’s BagelsNew Bakery Franchise Agreement, per its 2000 UFOC)
The language of this agreement makes it clear that the franchisee mustpay 2 percent of gross sales for national advertising and that it is up to thefranchisor to decide how best to expend these funds. By acknowledging theuncertain benefits to be derived from this advertising, each franchisee agreesthat he may be paying more than the advertising is worth to him. Basedon the plain language of the contract, the franchisee surrenders any rightto complain about the quality or geographic allocation of the franchisor’spromotional efforts.
McDonald’s, of course, also recognizes the value of advertising and de-mands that its franchisees spend a significant sum on this activity. In 1990,the McDonald’s franchise system spent approximately $80–90 million to
P1: JZP/... P2: JZP/...0521772524c09.xml CB802/Blair 0 521 77252 4 April 29, 2005 21:46
252 Advertising and Promotion
produce television and radio commercials and $245 million to purchase na-tional media time, mostly on network television.292 Advertising on the na-tional as well as the local level is organized by co-operatives. Each franchiseemember of the national cooperative must pledge the same contribution rate,1.65 percent of sales in 2003 as per McDonald’s disclosure document. Localcooperatives are formed by restaurant owners who join together in vari-ous geographical locations and decide on local promotions and advertisingcampaigns. In 1990, these cooperatives spent approximately $190 million onadvertising, most of which was spent on local television time. The franchisecontract simply stipulates that franchisees must spend at least 4 percent oftheir sales revenue in total on advertising:
McDonald’s employs both public relations and advertising specialists who for-mulate and carry out national and local advertising programs for the McDon-ald’s System. Franchisee shall use only advertising and promotional materialsand programs provided by McDonald’s or approved in advance, in writing, byMcDonald’s [. . . ] Franchisee shall expend during each calendar year for ad-vertising and promotion of the Restaurant to the general public an amountwhich is not less than four percent (4%) of Gross Sales [. . . ] for such year. Ex-penditures by Franchisee to national and regional cooperative advertising andpromotion of the McDonald’s System, or to a group of McDonald’s restaurantswhich includes the Restaurant, shall be a credit against the required minimumexpenditures for advertising and promotion to the general public. (McDonald’sFranchise Agreement, per McDonald’s UFOC, 2003)
McDonald’s thus controls the quality of the advertising and the minimumamount that each franchisee must spend. However, none of the advertisingmoneys are paid to McDonald’s corporation. Instead the funds are admin-istered directly by the advertising cooperatives and independently audited.The franchisee has the freedom to participate in these cooperative advertis-ing efforts with other franchisees, but cannot choose to expend less than the4 percent stated in his franchise agreement on advertising and promotion.In practice, however, franchisees who want to be considered for additionalunits or even contract renewal are expected to participate consistently in thenational and local cooperatives. Note that company-owned restaurants mayalso elect to be members of these cooperatives.
Stassen and Mittlestaedt (2002) report the advertising requirements im-posed in a few different restaurant franchise chains, as described in their 199910-K reports. They note that Wendy’s franchisees are required to contribute
292 See the June 5, 1993 testimony of David B. Green, McDonald’s Senior Vice Presidentfor Marketing, http://www.mcspotlight.org/people/witnesses/advertising/green.html.

P1: JZP/... P2: JZP/...0521772524c09.xml CB802/Blair 0 521 77252 4 April 29, 2005 21:46
9.6 Franchisor–Franchisee Conflict 253
2 percent of their sales to the “Wendy’s National Advertising Program Inc.”and another 2 percent for local and regional advertising (including, in manycases, cooperative advertising). Thus, like Bruegger’s Bagels, Wendy’s stipu-lates clearly how a franchisee’s total advertising expenditure is dedicated tonational versus regional or local advertising.
A number of franchisors also establish programs that allow them to sharewith franchisees some of the cost they incur for local or regional advertis-ing. Specifically, according to Dant and Berger (1996), almost 75 percent offranchisors in the auto products and services industry, and 86 percent of thefranchisors in the fast-food industry, engage in some form of cooperativeadvertising program with their franchisees.
Finally, franchisors leave themselves much leeway to make changes overtime in their contracts when it comes to advertising contributions. For exam-ple, Stassen and Mittlestaedt (2002) report that in its 10-K report, Wendy’sstates “the Company may increase the total advertising and promotions con-tribution to 5% . . . if such increase is approved by an affirmative vote rep-resenting 75% or more of all domestic Wendy’s restaurants.” At Applebee’s,though the contribution to the national advertising fund had been 1.5 percentthrough 1999, the 10-K report for that year stated that “the required contri-bution to the national advertising fund will increase to 2.1% of gross sales in2000, and may increase from 2.1% to a maximum of 2.5% in 2001. Beginningin 2002, the required contribution will be 2.5% of gross sales.” Further, “TheCompany can increase the combined amount of the advertising fee and theamount required to be spent on local advertising and promotional activitiesto a maximum of 5% of gross sales.” Finally, in 1997, Mail Boxes Etc. im-plemented a new ad hoc cooperative effort in which the franchisees matchedthe franchisor’s contribution. The focus of the effort was on local market-ing, which was being ignored by some franchisees.293 Of course, raising theamount that franchisees must devote to advertising at any point in time isapt to cause some conflict in a franchise system. In what follows, we examinethis and other sources of conflict relating to advertising in franchised chains.
9.6 Franchisor–Franchisee Conflict
When the franchisor selects the advertising message and determines its place-ment, as most franchisors do, the franchisee’s concern is with the marginalbenefit to his store. In that context, conflicts over advertising-related issuesbetween a franchisee and its franchisor can arise for several reasons.
293 See Tannenbaum (1997).

P1: JZP/... P2: JZP/...0521772524c09.xml CB802/Blair 0 521 77252 4 April 29, 2005 21:46
254 Advertising and Promotion
First, the franchisee may believe that the amount that the franchisor spendsor, more to the point, the amount that the franchisee is required to spendon advertising, is excessive. This belief is understandable, albeit perhaps un-founded, because the individual franchisee may not appreciate the benefitthat he derives from a Super Bowl ad on national television or ads in Timemagazine. Moreover, there is always the desire to be a free rider. To the ex-tent that everyone else advertises, a single franchisee could free ride on theefforts and expenditures of others – that is, not spend any effort or dollars onadvertising himself – and not suffer any appreciable loss in sales volume.
Second, the distribution of advertising nationally, regionally, and locallymay cause dissatisfaction in some quarters. That is, some franchisees may feelthat they have been shortchanged, that the advertising dollars of the systemare being disproportionately spent elsewhere so that insufficient amountsreach their own particular market.
Third, the franchisee may feel that the franchisor has simply not done agood job with the advertising that it has done. The complaint in this case isnot so much with the cost as it is with the effectiveness of the advertising.The franchisee thinks that he is not getting a sufficient “bang for the buck.”Franchisees of Benetton in Germany, for example, sued their franchisor in1996 alleging that its advertising campaign hurt their businesses.
Finally, some franchisees may object to the way in which the franchisoradministers the advertising fund. For example, they may believe or find thatadvertising moneys are spent on ads to recruit new franchisees instead ofbeing spent on growing the brand.
The recent Meineke case brought some of these issues into play.294 Meineke’sFranchise and Trademark Agreement (FTA) required its franchisees to con-tribute 10 percent of their weekly receipts to fund national and local advertis-ing. The money was paid into the Weekly Advertising Contribution (WAC)account that Meineke maintained and administered. The terms of the FTArequired Meineke to purchase and place advertising that promoted the goodsand services sold by the franchisees. Meineke reserved the right to makestrategic and creative choices in administering the WAC fund:
[A]ll decisions regarding whether to utilize national, regional, or local adver-tising, or some combination thereof, and regarding selection of the particularmedia and advertising content, shall be within the sole discretion of Meinekeand such agencies or others as it may appoint.
294 The following discussion relies on the appellate court decision, Broussard v. MeinekeDiscount Muffler Shops, Inc., 155 F. 3d 331 (4th Cir. 1998), and Killion and Schnell(1998).

P1: JZP/... P2: JZP/...0521772524c09.xml CB802/Blair 0 521 77252 4 April 29, 2005 21:46
9.6 Franchisor–Franchisee Conflict 255
Some of the franchisees objected to Meineke’s performance. According tothe Court of Appeals, Broussard testified that “some franchisees were grow-ing increasingly dissatisfied with the cost, amount and quality of Meineke’sadvertising.” Thus, the primary concern of the franchisees appeared to beMeineke’s allegedly poor advertising strategy. But the franchise agreementgave Meineke sole discretion over decisions on advertising strategy, whichforeclosed the franchisees from pursuing any legal action along these lines.The franchisees thus chose to sue their franchisor over something else, namelythe way in which Meineke administered the fund.
There was language in some of the franchise agreements that indicated thatMeineke would administer the WAC fund without any charge beyond thefranchisee’s initial license fee. At the same time, however, another provisionof the agreement suggested that some of the WAC funds could be spent onrelated expenses:
Meineke agrees that it will expend for media costs, commissions and fees,production costs, creative and other costs of such advertising, with respect toMeineke franchisees, an amount equal to the total of all sums collected from allfranchisees [in the WAC account].295
This language suggests that commissions and fees paid to those entities thatplace the advertising and other related costs are covered among the set ofpermissible expenses. Meineke disbursed some $32.2 million over the yearsin three categories of costs that caused the dispute. First, it spent some$1.1 million of WAC money to defend and settle a suit filed by its former ad-vertising agency. Second, Meineke established an in-house advertising agency,New Horizons, which paid about $14 million in commissions to outside ad-vertising agencies for placing advertising. It used WAC account funds to coverthese commissions. Finally, New Horizons collected $17.1 million in commis-sions on the advertising that it placed on behalf of the franchisees. These sumsalso came out of the WAC money.
The plaintiffs claimed that Meineke had no right to pay commissions toNew Horizons or to the outside agencies with WAC funds. Instead, the plain-tiffs argued that Meineke was supposed to absorb those costs out of the royaltypayments that franchisees paid. The franchisees contended that all WAC dol-lars were to be spent on the advertising itself. Meineke, of course, disagreed.As the circuit court of appeals observed: “This case is a study in the tensionthat can beset the franchisor-franchisee relationship.”
295 Id. at 335. The court is quoting Meineke’s Franchise and Trademark Agreement.

P1: JZP/... P2: JZP/...0521772524c09.xml CB802/Blair 0 521 77252 4 April 29, 2005 21:46
256 Advertising and Promotion
Whether the franchisees or Meineke was right, this case highlights theconflict that can result when the franchisor requires that it controls fullyand administers the advertising funds contributed by the franchisees. A gooddeal of the ambiguity can be cleared away by carefully worded contracts. Therancor over poor advertising effectiveness, however, cannot be alleviated inthis fashion; only a better performance will rectify that problem.
In addition to conflict relating to the amount or usage of advertising mon-eys, advertising can give rise to conflict if it is used by the franchisor to enticethe franchisee to participate in certain promotions or set its price at a certainlevel. For instance, suppose that a franchisor would like to see its franchiseecharge a price of $2.25 while the franchisee would prefer a more profitableprice of $2.75. Without actually getting into specific price controls, the fran-chisor may be able to publicize prices to consumers in ways that make it verydifficult for franchisees to charge more than the announced price. One ex-ample would be to simply include price information in an ad with fine printthat contains a disclaimer such as “only at participating dealers.” This leavesthe franchisee with the option of not participating but at the risk of losinggoodwill with his local customers. As a result, franchisees may be “forced,”albeit legally, into participating in a particular price promotion.
In the Seventh Circuit at least, it is permissible to go even further accordingto the decision in Jack Walters.296 Morton was a manufacturer of prefabri-cated buildings that it sold as kits to its franchised dealers. Jack Walters andother franchisees bought the kits from Morton and resold them as assembledbuildings to consumers. On occasion, Morton advertised special prices for itsbuildings. In addition to including the discounted retail price in its ad, Mor-ton listed the names of participating franchisees. In Jack Walters, Judge Posnerexplained that such price advertising by a franchisor was perfectly legal:
Walters concedes as it must that it is perfectly lawful for a manufacturer to ad-vertise his product to the ultimate consumer, and to mention in that advertisingthe retail price of the product – the only price the consumer is interested in.297
Judge Posner explained further that the legality of advertising retail pricesextends to the minimum steps necessary to make the advertising usefulto the franchisor. This includes reasonable measures to ensure that fran-chisees do not charge more than the advertised price.298 Judge Posner foundMorton’s threats of termination, offers of direct sales to retail customers, and
296 Jack Walters & Sons Corporation v. Morton Building, Inc. (1984).297 Id. at 707.298 Id. at 708.

P1: JZP/... P2: JZP/...0521772524c09.xml CB802/Blair 0 521 77252 4 April 29, 2005 21:46
9.7 Conclusion 257
other policing efforts to be reasonably necessary to make its price advertisingcredible.
Instead of using its ad directly to entice franchisees to charge a given price,a franchisor may also obtain the desired pricing behavior by conditioning thereimbursements stipulated in its cooperative advertising plan, that is, in itsoffer to share the cost of local advertising, on a franchisee’s advertising theproduct at the price that the franchisor wants.299 As long as the franchiseecan set the price on actual transactions at whatever level seems appropriateto the franchisee, there is little danger of antitrust liability.300
9.7 Conclusion
In this chapter, we have examined the role of advertising in franchised chains.Given the importance of the brand’s value to both franchisors and franchisees,it is not surprising that advertising plays a central role in the franchise rela-tionship. It is also not surprising then that it is the source of much disputeand conflict. We began by reviewing the information role of advertising andbrands as this view aligns well with the mobile society argument for the valueof chains in today’s society. We then described how economies of scale inadvertising increase the likelihood that firms will want to develop commonbranding and jointly advertise. The presence of economies of scale and thepublic good nature of advertising in the context of a common brand bothexplain why franchisors and franchisees often disagree not only about thetype of advertising, which is partially a matter of taste, but also about theamounts spent, the placement, the division of expenditures between fran-chisors and franchisees, and so on. But while there is much potential fordisputes, the judicial treatment has been rather straightforward. If the con-tract provides for full franchisor discretion as to how and when to spendthe advertising dollars collected from its franchisees, then franchisees havelittle legal recourse. If the franchisor has an obligation to maintain a separatefund and to report its usage to franchisees, then franchisees who believe thattheir franchisor has used advertising funds in inappropriate ways will be ableto air their grievances in court. Thus, litigation will resolve these types ofdisputes.
299 For a model of cooperative advertising for optimal system-wide returns, see Dant andBerger (1996).
300 In In re Nissan Antitrust Litigation (1979), the key was that the Nissan dealers werenot compelled to make sales at the advertised prices. Moreover, participation in theadvertising program was not mandatory.

P1: KaD0521772524c10.xml CB802/Blair 0 521 77252 4 April 29, 2005 21:54
10
Termination and Non-Renewal
10.1 Introduction
The vast majority of franchise contracts are of finite duration, but contractduration varies considerably across franchise chains: some contracts are asshort as 5 years while others are as long as 20 or 30 years. The contracts alsousually stipulate an option to renew and the duration of the potential renewalperiod(s). In their 1998 survey of franchise contracting practices, Frandataand the IFA found that 91 percent of franchise contracts included an option torenew. Moreover, most of the time, franchise agreements are indeed renewed.In a small number of cases, however, even franchisors who offer such anoption choose not to renew a specific contract. Further, franchisors sometimesterminate a franchisee’s existing contract within the contract period.
In this chapter, we first describe in more detail what we know about con-tract duration. We show in particular that franchise contracts are typicallyquite long-term. We also provide some information on termination and re-newal rates. We then examine the role of contract duration, termination, andnon-renewal in franchising, specifically the effect these have on franchisees’willingness to invest both capital and effort in their franchised unit.301 We alsodiscuss the issue of franchisee and franchisor opportunism and how these re-late to termination and non-renewal. Next, we examine how the common lawtreats the termination and non-renewal of franchise contracts in the UnitedStates, and then describe how several states within the United States furtherregulate termination and non-renewal in their franchise relationship laws.Finally, we review the economics behind various ways to calculate damages in
301 See Lutz (1995) for a model illustrating how outlet ownership provides incentives tofranchisees that go beyond pure current residual claims. This result follows becauseownership allows franchisees to capture the returns on the part of their effort thatincreases the future value of the outlet.
258
P1: KaD0521772524c10.xml CB802/Blair 0 521 77252 4 April 29, 2005 21:54
10.2 Franchise Contract Duration, Termination, and Renewal 259
cases involving wrongful termination. Note that while we use this particularsetting to discuss issues related to the calculation of damages, many of thepoints we make about calculated damages in this context apply generally tothe calculation of damages in cases involving other forms of contract breach.
10.2 Franchise Contract Duration, Termination, and Renewal:A Look at the Data
10.2.1 Contract Duration
In their 1998 survey of franchisors, Frandata and the IFA Educational Foun-dation found an average duration for franchise contracts of 10.3 years. Theyalso found that 91 percent of franchisors offer a renewal period, which lastedfor 8.2 years on average. Table 10-1 shows the mean duration of the initialcontract and its standard deviation across sectors in the first and last yearfor which we have duration information in our data, namely 1993 and 2001.This table shows that there is some important variation in the duration ofthese contracts across sectors. For example, the average contract length in thesit-down restaurant industry is 14 plus years, which is twice as long as theaverage contract duration in the real estate sector. Moreover, duration variesmore within some sectors than others, as indicated by the differences in thestandard deviation of contract duration across sectors. Thus, firms offer con-tracts of very variable length in the recreation sector: the standard deviationof contract duration in this industry is almost as large as the mean contractduration. For franchisors in the contractor and rental sectors, on the otherhand, the standard deviation is only 3 or 4 years around a mean durationof roughly 9 years. The data also suggest that there has not been any trendtoward shorter or longer contracts on average in franchising, nor within thevarious sectors, between 1993 and 2001. The only exception may be the Hoteland Motel sector. Finally, Table 10-1 includes information on the number offirms in our data in each of the two years covered in the table, and documentsthe low frequency with which franchisors choose to rely on an infinite or anindefinite contract duration.
It is important to realize that these average durations hide some interestingdiscrete patterns in the data. Specifically, contract duration varies mostly in5-year increments (see also Brickley et al. 2003 on this). In 2001, 20 percentof the franchisors in our data offer 5-year contracts, while 53 percent use10-year contracts, 7 percent offer 15-year contracts, and 14 percent use a 20-year contract. Thus, 94 percent of all franchise contracts offered in 2001 were ofone of these four possible durations. The corresponding total in 1993 is almost
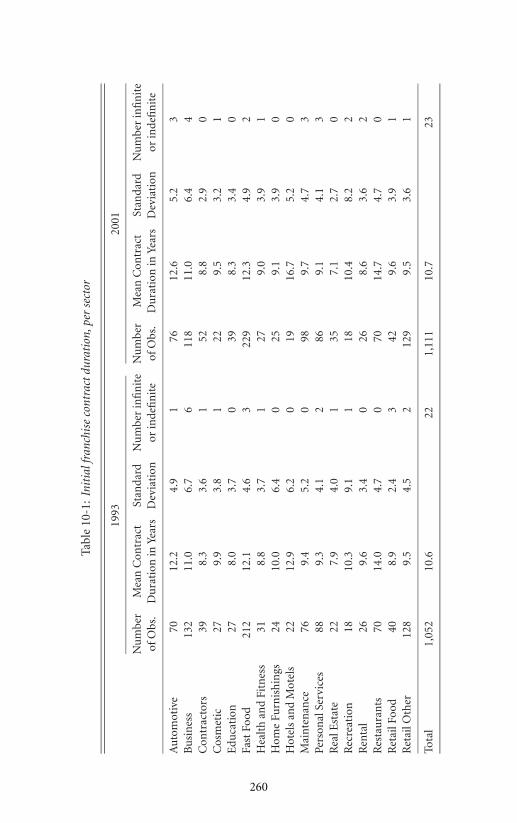
P1: KaD0521772524c10.xml CB802/Blair 0 521 77252 4 April 29, 2005 21:54
Tabl
e10
-1:
Init
ialf
ranc
hise
cont
ract
dura
tion
,per
sect
or
1993
2001
Nu
mbe
rM
ean
Con
trac
tSt
anda
rdN
um
ber
infi
nit
eN
um
ber
Mea
nC
ontr
act
Stan
dard
Nu
mbe
rin
fin
ite
ofO
bs.
Du
rati
onin
Year
sD
evia
tion
orin
defi
nit
eof
Obs
.D
ura
tion
inYe
ars
Dev
iati
onor
inde
fin
ite
Au
tom
otiv
e70
12.2
4.9
176
12.6
5.2
3B
usi
nes
s13
211
.06.
76
118
11.0
6.4
4C
ontr
acto
rs39
8.3
3.6
152
8.8
2.9
0C
osm
etic
279.
93.
81
229.
53.
21
Edu
cati
on27
8.0
3.7
039
8.3
3.4
0Fa
stFo
od21
212
.14.
63
229
12.3
4.9
2H
ealt
han
dFi
tnes
s31
8.8
3.7
127
9.0
3.9
1H
ome
Furn
ish
ings
2410
.06.
40
259.
13.
90
Hot
els
and
Mot
els
2212
.96.
20
1916
.75.
20
Mai
nte
nan
ce76
9.4
5.2
098
9.7
4.7
3Pe
rson
alSe
rvic
es88
9.3
4.1
286
9.1
4.1
3R
ealE
stat
e22
7.9
4.0
135
7.1
2.7
0R
ecre
atio
n18
10.3
9.1
118
10.4
8.2
2R
enta
l26
9.6
3.4
026
8.6
3.6
2R
esta
ura
nts
7014
.04.
70
7014
.74.
70
Ret
ailF
ood
408.
92.
43
429.
63.
91
Ret
ailO
ther
128
9.5
4.5
212
99.
53.
61
Tota
l1,
052
10.6
221,
111
10.7
23
260
P1: KaD0521772524c10.xml CB802/Blair 0 521 77252 4 April 29, 2005 21:54
10.2 Franchise Contract Duration, Termination, and Renewal 261
the same, at 93 percent, and the individual proportions are very similar as well.When we look at this from the perspective of franchised outlets, by weighingthe contract duration of each franchisor by the number of franchised unitsthey have, the discrete patterns remain. The 1,158 franchisors in our data in2001 operated 329,803 franchised units in total.302 Of these, 91 percent wereunder a 5-, 10-, 15-, or 20-year contract. The proportion of contracts of eachduration, however, were quite different. Specifically, the proportion of 20-yearcontracts is much higher, at 37 percent, while the others are all smaller: theproportions of 5-, 10-, and 15-year contracts are 13, 37, and 4 percent, re-spectively. In other words, the data imply that larger franchisors tend to offer20-year contracts much more frequently than average, while franchisors withfewer franchised outlets rely more on shorter-term contracts. Again, the samepatterns arise in the 1993 data.
Brickley et al. (2003) analyze the factors that affect the duration of ini-tial franchise contracts. Consistent with our comparison of duration at thefranchised unit level versus franchisor level, they find that larger chains andfranchisors with more years of experience tend to use longer-term contracts.Moreover, although firms rarely change the duration of their contracts, theauthors find a tendency toward longer-term contracts over time within firms.Finally, they show that contract duration is positively related to the amountof physical and human investment (weeks of training) that franchisees mustmake in the business. We discuss the importance of franchisee investment inmore detail in the next section.
Table 10-2 shows the duration of franchise contract renewals, that is, thenumber of years by which the initial contract period will be extended upon firstrenewal, on average per sector and, again, for 1993 and 2001. This table showsthat first renewals tend to be somewhat shorter, by a year or two on average,than initial contracts. But this is not true in all sectors, especially sectors whereinitial contracts are relatively short, such as contractors, cosmetics, and realestate franchisors.
In part, the lower average duration of renewals is due to the 7 percentof firms in our data that offer no renewals, as shown in Columns 4 and 8.303 But
302 This total represents the number of franchised units of these chains that year, nottheir total number of units. According to the USDOC (1988), in 1986, business-formatfranchised chains operated a total of 246,664 franchised units (see Chapter 4 of thisbook). Thus, while our data does not include all franchisors in 2001, it undoubtedlyincludes the vast majority of franchised outlets.
303 Note that we include in this set those few respondents that left the field blank whenasked “What is the term of the renewal period,” as well as those that answered NAor N/A as we presume that respondents that do not offer a renewal are the ones who

P1: KaD0521772524c10.xml CB802/Blair 0 521 77252 4 April 29, 2005 21:54
Tabl
e10
-2:
Ren
ewal
peri
od,p
erse
ctor
1993
2001
Nu
mbe
rM
ean
Ren
ewal
Stan
dard
Nu
mbe
rN
um
ber
Mea
nR
enew
alSt
anda
rdN
um
ber
ofO
bs.
Du
rati
onin
Year
sD
evia
tion
atze
ro∗
ofO
bs.
Du
rati
onin
Year
sD
evia
tion
atze
ro∗
Au
tom
otiv
e66
9.4
4.9
671
10.2
5.6
5B
usi
nes
s12
99.
76.
34
115
9.3
5.9
4C
ontr
acto
rs38
8.3
3.7
350
8.5
3.0
2C
osm
etic
249.
63.
33
218.
53.
72
Edu
cati
on25
8.8
4.5
137
8.2
2.8
2Fa
stFo
od18
69.
54.
121
206
9.4
4.2
23H
ealt
han
dFi
tnes
s30
7.6
2.6
226
6.8
2.5
3H
ome
Furn
ish
ings
249.
06.
40
258.
03.
31
Hot
els
and
Mot
els
188.
85.
74
109.
51.
69
Mai
nte
nan
ce72
8.2
6.4
498
8.5
4.7
0Pe
rson
alSe
rvic
es85
8.2
3.8
380
8.1
4.0
5R
ealE
stat
e21
7.6
4.1
135
6.4
3.2
0R
ecre
atio
n17
6.3
2.8
117
8.5
3.0
1R
enta
l23
8.0
3.3
326
7.2
2.9
0R
esta
ura
nts
6210
.24.
97
609.
75.
06
Ret
ailF
ood
368.
02.
84
378.
43.
56
Ret
ailO
ther
120
7.9
4.2
712
38.
44.
27
Tota
l97
68.
874
1,03
78.
876
∗T
hes
ein
clu
dea
few
actu
alze
ros
and
“non
e”as
wel
las
case
sw
her
eth
eda
tafi
eld
was
left
blan
kor
con
tain
edN
R(n
ore
spon
se),
NA
orN
/A.
262

P1: KaD0521772524c10.xml CB802/Blair 0 521 77252 4 April 29, 2005 21:54
10.2 Franchise Contract Duration, Termination, and Renewal 263
it also reflects a real duration difference between initial contracts and renewalsin most of the sectors. A full 36 percent of the franchisors in our 2001 dataoffer only a 5-year renewal, as compared to 20 percent of initial contractsbeing this short. Another 41 percent of franchisors offer a 10-year renewal,while only 5 and 6 percent, respectively, offer 15- and 20-year renewals. Thus,the whole distribution of duration for renewals is shifted downward relativeto what we find for initial contracts. The same is true if we examine therenewal durations from the perspective of franchised units as opposed tofranchised firms. Among the 329,083 franchised units of the 1,158 franchisorsin our data in 2001, we find no renewal clauses in 17 percent rather than only7 percent of the cases, while 25, 26, 2 and 19 percent have contracts with5-, 10-, 15- and 20-year renewals, respectively.
10.2.2 Renewal and Termination Rates
While most franchisors offer franchisees an opportunity to renew their con-tracts, what matters to franchisees is the likelihood that their contract indeedwill be renewed. This probability not only affects the profits they themselvescan expect to earn from their franchise, it also affects the resale value of theirfranchise. Although the USDOC (1988) does not report renewal and termi-nation rates in traditional franchising, it shows that renewal is the norm inbusiness-format franchising: of the 12,999 agreements up for renewal in 1986,12,073, or 93 percent, were renewed. Of the 926 that were not, 359 were caseswhere the franchisee did not want a new contract, 374 were cases of mu-tual agreement not to renew, and 193 were cases where franchisors refusedto renew. As for contract terminations, these are more common accordingto the same data source. Specifically, 3,075 agreements were terminated byfranchisors in 1986, while 3,914 were terminated by franchisees and another372 franchises were terminated by mutual agreement. These 7,361 termina-tions correspond to a 3 percent termination rate that year given that therewere 246,664 franchised outlets in operation in 1986 according to the samesource. The USDOC (1988) further documents that more than half of theterminations instigated by franchisors were due to franchisee non-paymentof fees or financial default. Finally, the same source indicates that franchisorsapproved all but 94 of the 4,202 requests for ownership transfers – bequests
would give such answers. This leads to an estimate of 93 percent of all franchisors inour data offering a renewal period, which is very close to the corresponding proportionin the Profile of Franchising (1998).

P1: KaD0521772524c10.xml CB802/Blair 0 521 77252 4 April 29, 2005 21:54
264 Termination and Non-Renewal
or sales of the franchise to new owners – that they received from franchiseesin 1986.
Williams (1996) used the Characteristics of Business Owners (CBO)database compiled by the U.S. Census Bureau to study termination rates.He found 1,001 franchise contracts with full-time owner involvement andat least one employee in 1987 in these data. In this sample, he observed atermination rate of 15.7 percent over a 4-year period, including termina-tions instigated by franchisees and franchisors. Consistent with the figuresfrom the USDOC on terminations and ownership transfers, Williams furtherfound that slightly more than 50 percent of the franchise contract termina-tions in his data were motivated by a desire, by the franchisor or franchisee,to transfer ownership to another franchisee. One-third of all contract ter-minations resulted in the outlet being closed. Finally, Williams showed thatthe types of outlets that were most subject to termination were those thatwere underperforming, suggesting that franchisors use termination to enforceperformance standards or eliminate poor locations. We return to this issuebelow.
In sum, franchise contracts usually are quite long-term, with a very hightendency for the relationship to continue beyond the original term. In whatfollows, we explain the long duration of franchise relationships based onthe franchisor’s need for its franchisees to invest both capital and effortin their outlet. We then examine the effect of contract renewal and possi-ble termination on franchisees’ incentives to invest, followed by a discussionof the role of franchisee and franchisor opportunism in determining termi-nation and non-renewal rates.
10.3 The Role of Duration, Termination, andNon-Renewal in Theory
10.3.1 Determinants of Contract Duration
Franchisors need franchisees to make significant investments of both timeand money (capital) in their businesses. But, of course, such investments areonly worth making if the franchisee can expect to earn some reasonable returnon these investments over a sufficiently long period of time. If it takes fiveyears, for example, to fully recoup one’s investment in a franchise, then nofranchisee should invest unless the relationship is expected to last for at leastfive years.
In general, the value of any asset on the market is given by the net presentvalue (NPV) of the returns one can expect to earn from it during its “workable”
P1: KaD0521772524c10.xml CB802/Blair 0 521 77252 4 April 29, 2005 21:54
10.3 Role of Duration, Termination, and Non-Renewal 265
life. In other words,
V =T∑
t=1
Rt
(1 + δ)t, (10.1)
where V stands for the value of the asset, Rt is the return from this asset at timet, δ is the interest (or discount) rate, and T is the workable life of the asset,that is, the amount of time until the asset is no longer worth anything. Theuncertainty of the returns and the attitude of the potential investor toward riskare captured via the discount rate, δ: More uncertain returns are discountedmore highly over time, and the more risk-averse the investor, the more hewill discount the future. Thus, both risk and risk aversion are captured in theNPV formula through higher discount rates.
Applying the formula above to the valuation of a franchise contract, wehave:
F =T∑
t=1
πt
(1 + δ)t+ S, (10.2)
where F is the present value of the contract or, put differently, the maximumamount of resources, including effort, capital and upfront fees, all of whichare evaluated in present value terms, that a franchisee should invest in totalin this business. In this formula, πt is the period t economic profit from thefranchise net of all payments to the franchisor but before compensating thefranchisee for his investment and effort, T is the duration of the contract, andS captures the salvage value of the physical and other assets that have not beenfully utilized within the contract period. In other words, S reflects the fact thatthe franchisee may still have valuable assets to sell at the end of the franchisecontract. The implication to be drawn from equation (10.2) then is that if thefranchisee invests exactly F in total in his franchise, and sells the assets for Sat the end of the contract term, he earns normal returns overall. Note thatour formulation assumes that S does not depend on T. In reality, the salvagevalue of the assets will be a function of T if the investment in such assets ismade upfront and allowed to depreciate over time. In many cases, however,the contracts require regular upgrades and reinvestments that maintain thevalue of the physical assets over time, making S independent of T.
Everything else the same, this formula shows that franchisees can afford toinvest more, that is F is larger, the longer the contract (the larger T is). It is alsotrue, however, that the incremental value of extending the contract,∂F/∂T, de-clines as T grows due to discounting over longer periods. For example, if π t =$20,000, changing T from 10 to 11 increases F by $20,000/(1 + δ)11 = $7,010

P1: KaD0521772524c10.xml CB802/Blair 0 521 77252 4 April 29, 2005 21:54
266 Termination and Non-Renewal
at a discount rate of 10 percent. If T were increased instead from 20 to 21,F would increase only by $20,000/(1 + δ)21 = $2,703 assuming the samediscount rate.
10.3.2 The Effect of Termination and Renewal
The possibility of contract renewal and within-contract termination compli-cates the calculations above somewhat. Now, the franchisee must assess theprobability of renewal and termination and embed these in his assessmentof the value of the franchise. Specifically, using ρ to represent the per-periodprobability of a contract termination, which we assume for simplicity to beconstant from period to period, and η to account for the probability of con-tract renewal,304 we have
F =T0∑
t=1
πt(1 − ρ)t
(1 + δ)t+ η
(T0+T1∑
t=T0+1
πt(1 − ρ)t
(1 + δ)t
)+ S, (10.3)
where T0 represents the duration of the original contract and T1 representsthe duration of the renewal. Although we do not make this explicit, note thatS may be affected not only by the period t, but also by whether or not thefranchise is being terminated since the franchisee may not be able to sell theassets at the same price, or at all, if he faces termination. Also, for simplicity, weassume that the contract can be renewed only once. Of course, as subsequentrenewals occur further in the future, the NPV of profits associated with suchrenewals becomes quite small. Finally, we have assumed no renewal fee. Ifassessed at the beginning of the renewal period, at time T0, such a fee, R,would reduce F by R/(1 + δ)T0 . Little is known about the use or level ofsuch fees in the U.S. but, according to Frazer (1998), they are common inAustralia. In the U.S., what is most important is that franchisors often requirethat franchisees reinvest significant amounts in their franchise at the time ofrenewal. The discounted value of these new investments should be subtractedfrom the present value of the profit stream in the formula above, or be includedin the definition of F.
Equation (10.3) shows that everything else constant, franchisees will bewilling to invest more in their franchise (1) the longer the original contract(i.e., the higher is T0); (2) the longer the renewal period, T1; (3) the higher
304 For purposes of this analysis, we are assuming that these probabilities are exogenous,independent of both franchisee and franchisor behavior. In fact, they are endogenousto some extent. From the franchisee’s perspective, however, it makes sense to treat themas exogenous since the future is uncertain and most franchisees are entering what, forthem, are uncharted waters.

P1: KaD0521772524c10.xml CB802/Blair 0 521 77252 4 April 29, 2005 21:54
10.3 Role of Duration, Termination, and Non-Renewal 267
the probability of renewal, η; and (4) the lower the per-period probabilityof termination, ρ. Conversely, the more franchisors want franchisees to in-vest, the more they will need to offer long-term contracts with high renewalprobability and a low likelihood of termination.305
Three other aspects of the franchising relationship related to durationwill intervene and affect the value of a franchise. First, the more restrictionsa franchisor imposes on a franchisee’s right to transfer (sell or bequeath)his franchise, the lower the price at which the franchisee is likely to sell hisfranchise or the lower its inheritance value, that is, the lower S is. This, inturn, will reduce the franchisee’s willingness to pay upfront and to investgenerally in the franchise.306 Second, non-compete clauses can restrict thefranchisee’s options geographically or the types of activities he or she canengage in after leaving the franchise or both. The presence of such clauses inthe contract decreases the value of the human capital that a franchisee canexpect to build through operating the franchise. This again will reduce thevalue of the franchise to the franchisee and his willingness to invest in it relativeto the case where no such restrictions are imposed. Finally, buy back clausesmay increase or decrease the value of the franchise. Those clauses that requirefranchisees to sell their business back to the franchisor upon request, likethose used recently by Ruby Tuesday, will reduce the value of the franchise. Incontrast, clauses that guarantee buy backs at a given price from the franchisorif the franchisee wants to sell – a type of clause also included in Ruby Tuesday’snew franchise contract – will increase the value of the franchise and thus thefranchisee’s willingness to pay or invest in it.307
Finally, in discussing the effect of renewal and termination rates above, wehave treated the probability of these events as though they are independent ofthe franchisee’s and the franchisor’s behavior. But franchisors decide to termi-nate or not renew contracts. As any possibility of termination or non-renewalreduces the franchisee’s incentives to invest in his franchise, why would fran-chisors ever choose to not renew or even terminate a contract in our scenario?The answer lies in the fact that outlet and franchisee performance vary acrossoutlets, and franchisors also may change their approach to particular markets.
305 Gasoline lessee dealers do not invest or own facilities but rather are “hired” to managea station whose assets belong to the oil company. Their contracts usually last only oneor a few years, renewable at will, which is consistent with the rule that franchisorsrequiring large franchisee investments need to use long-term contracts.
306 This includes the possibility that the franchisor may impose a transfer fee, that is, afee that a franchisee must pay to the franchisor when selling his franchise to anotherfranchisee, as Frazer (1998) indicates many franchisors in Australia do.
307 See Prewitt (1998).

P1: KaD0521772524c10.xml CB802/Blair 0 521 77252 4 April 29, 2005 21:54
268 Termination and Non-Renewal
Perhaps most important, franchisees may not always behave in ways thatare consistent with what the chain needs, at least from the franchisor’s per-spective, so franchisors may choose to not renew or terminate the con-tracts of such individuals to protect their brand and business format. Finally,some have proposed that termination and non-renewals occur because fran-chisors take advantage of franchisees, that is, they behave opportunistically.In what follows, we consider the relationship between franchisee, and thenfranchisor, opportunism and the termination or non-renewal of franchisecontracts.
10.3.3 Franchisee Opportunism
As should be clear from the discussion in many other parts of this book,franchisees who have purchased ownership and residual claimancy rights inthe profits generated by their own outlets may not always behave in waysthat are optimal from the franchisor’s perspective. What they own is differentfrom what the franchisor owns and cares about, and thus their objectives alsodiffer. The franchisee is focused on maximizing the profits of his outlet(s),as he should be, while the franchisor is focused on the profits of the overallchain, also as she should be. Those two objectives, while broadly consistent,are not the same, and they do not always imply the same desired behavior atthe outlet level. The issue, in essence, is one of externality that arises becauseof the common brand under which all outlets operate. This common brandmakes it possible for customers to punish the chain for the behavior of a singlefranchisee. A customer dissatisfied with the value of the goods or servicespurchased at one outlet can cease to purchase from all outlets under thesame brand. This means that pricing, quality, menu choices, cleanliness, staffdemeanor, and so on at each outlet affect not only the future purchases that acustomer will make at a given outlet, but also their decision to frequent otherunits in the same chain. Yet, the franchisee does not bear the cost of the reducedsales at all other outlets, and hence does not consider the cost of its decisionson these other outlet sales and profits. The consequence is a tendency for thefranchisee to under-invest in quality, charge higher prices than those that thechain finds optimal, offer products that local customers like even if this erodesthe value of the brand, and so on. All of these franchisee profit maximizationstrategies correspond to “misbehaviors” from the chain’s perspective givenits “raison d’etre,” which is to offer consumers a predictable, homogeneousproduct across a large number of geographically dispersed establishments.
To curb these behaviors, Rubin (1978) and Klein (1980, 1995) have arguedthat franchisors rely on self-enforcing contracts, namely contracts that give

P1: KaD0521772524c10.xml CB802/Blair 0 521 77252 4 April 29, 2005 21:54
10.3 Role of Duration, Termination, and Non-Renewal 269
incentives to parties to put forth effort by ensuring that they derive a benefitfrom the relationship, a benefit that is at risk if they do not behave as requested.Specifically, they suggest that franchise contracts leave some stream of ongo-ing rent that franchisees must forgo if they are caught “misbehaving.”308 Inother words, the rent plays the role of a hostage as per Williamson’s (1985)analysis. The incentives embedded in a franchise contract in this context stemfrom the combined effect of three elements: (1) the ongoing stream of rent,(2) the franchisor’s monitoring of the franchisee to assess whether the fran-chisee is “misbehaving” and, (3) the franchisor’s ability to terminate the fran-chise contract. Thus, termination rights, and non-renewal rights, are centralto the concept of self-enforcement. While other punishments are surely avail-able and used by franchisors, ultimately it is the threat of termination thatprevents franchisees from engaging in behavior that the franchisor does notapprove of.309 If franchisors cannot punish franchisees who “misbehave” byterminating their relationship with the chain, then controlling the behaviorof franchisees through self-enforcement becomes much less viable.
Klein (1980) notes that franchise contracts are one-sided, meaning thatthe terms impose many restrictions on franchisees and often subject themto termination at will by their franchisors. He argues that this one-sidednessarises because the contracts focus on giving incentives to franchisees only.The franchisor’s behavior in this setting is controlled already by her desireto maintain her reputation, a reputation that is put at risk if the franchisorbehaves opportunistically vis-a-vis her franchisees. The presumed higher costof finding franchisees once the franchisor is known to have behaved oppor-tunistically, and ultimately of operating the chain as a corporate entity –an option that the franchisor would have chosen from the outset if it weremore efficient than franchising – both prevent the franchisor from misap-propriating the assets of its franchisees. The result is that franchise contractsare one-sided as they explicitly constrain the behavior of franchisees but let
308 Readers familiar with efficiency-wage theory in labor economics will recognize thesimilarity with the theory of contractual self-enforcement. See, for example, Beckerand Stigler (1974) and Shapiro and Stiglitz (1984). Akerlof and Yellen (1986) providea collection of important contributions in this area.
309 Bradach (1998) at p. 35 notes that termination, or even the threat of termination, israrely used to control franchisee behavior. He interprets this as evidence that the self-enforcement mechanism does not play a central role in the management of franchiserelationships. But the theory is completely consistent with termination being a ratherrare event. Termination is the ultimate threat that prevents franchisees from behavingin ways that are really detrimental to the chain. If the mechanism works, franchiseebehavior remains within the bounds of what franchisors want and so no terminationneed occur.
P1: KaD0521772524c10.xml CB802/Blair 0 521 77252 4 April 29, 2005 21:54
270 Termination and Non-Renewal
reputation rather than contract terms govern the behavior of the franchisor.Klein (1995) further develops, clarifies, and refines these ideas.
Brickley, Dark and Weisbach (1991b) provide empirical support for theclaim that termination provisions play an important role in franchise rela-tionships. Specifically, they exploit variation in the existence and timing ofstate laws requiring good cause for termination of franchise contracts to showthat franchisors use franchising to a lesser degree in states where they facelaws that restrict their ability to terminate franchisees. This is true especiallyfor franchisors operating in industries with mostly transient customers as theconsumption decisions of such customers do not discipline franchisees thatfree-ride directly. They conclude that such franchisors rely on termination asa potential disciplining tool and, when this tool becomes more onerous touse, they modify the extent to which they rely on franchising itself. Brickley,Dark, and Weisbach also find evidence that the passage of a law requiring goodcause for termination in California in 1980 was associated with relatively largelosses for the shareholders of publicly traded franchisors with franchise op-erations in California. Based on these empirical results, the authors concludethat these laws have increased the cost of controlling outlet-level quality inthe franchised part of these chains.
Kaufmann and Lafontaine (1994), on the other hand, examine in detailthe profit and loss statements from typical McDonald’s outlets, and the resaleprices of a small set of such outlets. They conclude that McDonald’s leaves rentwith its franchisees, rent that the franchisees lose if they are found in violationof firm policy and are terminated.310 Moreover, McDonald’s does not requirefranchisees to pay upfront for the full amount of ex post rent. In other words,it allows franchisees to earn rent from an ex ante perspective. The authorsexplain this in part based on the type of franchisees that McDonald’s de-sires, namely individuals who will devote themselves to their role as owner-operators of their restaurant(s). The authors also note that the companyfurther reserves the right to decide which franchisees are granted expansionrights, that is, which franchisees are offered additional McDonald’s restau-rants, based on a franchisee’s degree of compliance with firm policies. Thus,these ex ante rents also serve an incentive role for current franchisees at Mc-Donald’s, encouraging those who aspire to expand their set of restaurants tocontinue to function within the bounds set by their franchise contract.311
310 See also Michael and Moore (1995) for a similar analysis showing evidence of rent atother chains.
311 See also Klein (1995) for an explanation for ex ante rent based on a legal environmentthat makes it difficult for franchisors to terminate franchise relationships if they demandlarge bonds upfront that they do not reimburse upon termination.
P1: KaD0521772524c10.xml CB802/Blair 0 521 77252 4 April 29, 2005 21:54
10.3 Role of Duration, Termination, and Non-Renewal 271
10.3.4 Franchisor Opportunism
Historically, franchisees have voiced concerns that franchisors may use con-tract termination and non-renewals to appropriate the units that are mostprofitable within the chain. In other words, franchisees complained thatthey do not reap the benefit of their hard work because once they makea market profitable, the franchisor behaves opportunistically and simplyterminates or does not renew their contract. The franchisor then presum-ably appropriates the profits of the outlet either by operating the outlet di-rectly, or by selling it to a new franchisee under a contract involving higherfees.
As noted earlier, Williams (1996) used the Census Bureau Characteristicsof Business Owners database to examine the reasons why franchisors termi-nate contracts with franchisees, ending the relationship within the term of thecontract. He found that one-third of all contract terminations resulted in theoutlet being closed, evidence that these were not the most profitable outlets.More generally, he found that the types of outlets that were most subject totermination were those that were underperforming, leading him to concludethat franchisors usually rely on termination to enforce performance stan-dards or eliminate poor locations (see also Chapter 5). The USDOC (1988)data moreover shows that franchisees as well as franchisors sometimes wantto terminate their franchise relationship. The most likely interpretation offranchisee terminations is that the franchisee either wants to change affilia-tion (most common in the hotel and motel industry), become independent,or close the business. As noted earlier, another 4,202 franchisees requestedpermission to sell their outlet (and franchisors granted those in 4,108 of these4,202 cases). Some of these franchisees most likely were not doing very well,but many of the transfers and terminations by franchisees also are due to achange in the life circumstances of a franchisee (such as retirement, movingon to other business endeavors, or sickness). Company buy-backs and al-lowing transfers are the main ways in which franchisors can accommodate afranchisee’s desire to move on to other things.312 Finally, while company buybacks of outlets do occur, they remain rather infrequent. According to theUSDOC (1988), franchisors bought back 827 units in 1986 out of 246,664franchised outlets in operation that year. At the same time, they converted1,726 units back to franchisee ownership.
Franchisors also buy back franchises simply because they are changingtheir strategy, moving toward a higher proportion of company units, or even
312 See, e.g., Shelton (1967).

P1: KaD0521772524c10.xml CB802/Blair 0 521 77252 4 April 29, 2005 21:54
272 Termination and Non-Renewal
getting out of franchising altogether. The USDOC (1988) data is informa-tive in this respect as well. It reports the number of franchisor failures anddepartures, where the latter are defined as franchisors that have decided to“discontinue franchising as a method of doing business.” Out of an estimatedtotal population of 2,177 franchisors in 1986:
A total of 104 franchisors operating 5423 outlets failed during 1987 [ . . . ] Thevolume of 1986 sales represented by the failed firms amounted to $1.7 billion,of which the franchisee-owned portion was $1.5 billion. [ . . . ] In addition, 80franchisors decided in 1987 to discontinue franchising as a method of doingbusiness; these companies operated 2104 units in 1986 with $932 million insales, of which 1519 outlets with $472 million in sales were franchisee-owned.(USDOC 1988: 12)
Franchisors who decide to discontinue franchising or move toward a greaterdegree of company ownership have the option of either buying backfranchisee-owned outlets or closing them down. Of course, buy backs willbe the preferred option for the franchisees. Thus, some companies are nowentering into franchising with a contract that not only allows the franchisor topurchase its franchisees, but also guarantees to franchisees that the companywill buy them back if they choose to sell.313 As noted by Williams (1996) andBrickley (2001), liberal termination and non-renewal rights, like buy-backclauses, provide franchisors with valuable call options on units in their chain.A call option gives its owner the right, but not the obligation, to purchasean asset at a fixed exercise price prior to the expiration date of the option.This option is valuable if the market value of the asset covered by the optionis higher than the exercise price at some time prior to the expiration of theoption – assuming it can be exercised at any time. While stock options are thebest-known types of options, options are available in many other contexts.Here, liberal non-renewal rights give franchisors the option to terminate thecontract of an existing franchisee at the end of the contract period. Liberaltermination rights provide an equivalent option within the term of the agree-ment. In either case, franchisors may exercise these rights simply becauseit is profitable for them to do so. This is the essence of a call option. Ofcourse, franchisees are quite correct when they point out that such behaviorby franchisors can reduce their ability to reap the rewards associated withtheir investment of time and money into the franchised business. Whetherit does so fundamentally depends on the relationship between the exerciseprice, that is, how much the franchisor has to pay for the business, and what
313 Prewitt (1998).
P1: KaD0521772524c10.xml CB802/Blair 0 521 77252 4 April 29, 2005 21:54
10.3 Role of Duration, Termination, and Non-Renewal 273
the franchisee could get otherwise if he continued to operate the businessor sold it on the market. In turn, whether the franchisor has the option toterminate or not renew the contract depends on the terms of the franchisecontract and applicable laws. To the extent that a franchisee worries that thefranchisor can appropriate the fruits of his labor through her termination andnon-renewal rights, the franchisee should not be willing to pay as much forthe franchise. And indeed, using data on the fees charged by a large numberof franchisors across a variety of industries, Brickley (2001) finds evidencethat franchisees pay more over the life of the contract for franchises sold byfranchisors whose termination and non-renewal rights are constrained by ap-plicable state law than they do for franchises where franchisors are not subjectto such restrictions.
Finally, while franchisor opportunism may be an issue in specific cases, itis unlikely to be the main explanation for franchisor termination and non-renewal decisions generally. First, if franchisors were systematically buyingback all profitable outlets, established chains likely would show a tendencytoward more company ownership over time. Yet we do not find that in thedata.314 Second, as discussed also in Chapter 8, to analyze the possibility offranchisor opportunism, it is important to consider what franchisors stand togain and lose if they mistreat their franchisees and repossess outlets. As notedby Klein (1980, 1995), franchisors presumably have opted for franchisingrather than corporate ownership as an organizational form because it is moreprofitable for them. This, in turn, has consequences relative to their incentivesto mistreat their franchisees.
Specifically, in the context of non-renewal and contract termination, fran-chisor opportunism would amount to a franchisor who terminates highlyprofitable franchisee-owned business with the purpose of appropriating thoseprofits. For this to be worth doing, it must be the case that the franchisor ap-propriates the outlet at a price that is much below the market value. If thefranchisor pays market value for the outlet, then the franchisee does not lose.If a below-market price is achieved using what was an ex ante agreed uponbuy-back price, we are back to the option scenario. If the franchisee agreedto this buy-back price at the outset, we would expect that he did so basedon his assessment of the likely value of the business at the time and that thishas all been priced into the contract. If the appropriation at below-marketprice is done by “unreasonably” withholding the right to transfer the fran-chise, presumably the franchisee can sue for contract breach. Moreover, assuch behavior becomes public knowledge, it will tarnish the reputation of
314 See Chapter 4 of this book and Lafontaine and Shaw (2005) for more on this.
P1: KaD0521772524c10.xml CB802/Blair 0 521 77252 4 April 29, 2005 21:54
274 Termination and Non-Renewal
the franchisor and thus increase the cost of recruiting new franchisees intothe franchise system. Thus, the chain’s future growth will be impacted. Also,to the extent that the chain may not be as efficient at running the outlets,which we presumed was the reason it initially chose to rely on franchising,profits for the units it buys back will be lower under corporate operation.If it buys back and then resells the outlet, it will only do better if the newfranchise contract contains higher fees, especially higher royalty rates as theserepresent the bulk of payments from franchisees. But as franchisors offerthe same contract terms to all franchisees at a point in time, this requi-res that the franchisor’s current contract contains higher royalty rates. Whilethis situation sometimes arises, the reality is that franchise contract termsand royalty rates in particular do not change much over time either.315 Thus,waiting for contract renewal – where renewals normally occur at the “thengoing rates,” which means under the terms offered to new franchisees – willoften be the better option. We conclude that in terms of non-renewals and ter-mination, as with other aspects of the contract, the benefits of “mistreating”franchisees is typically low, and the cost of doing so can be quite high.
Having said all this, it is important to recognize also that reputation effectsdo not discipline all franchisors to the same extent. Established franchisorsthat are no longer expanding may not need to offer an attractive businessproposition, though they still need to consider the effect of their behavioron remaining franchisees if they do not intend to buy back all outlets. Suchconsideration will tend to prevent them from mistreating franchisees. But ifthey are leaving markets altogether, or transforming their business into a fullycorporate entity, or rationalizing their networks after a merger, their incen-tives to minimize the cost this imposes on franchisees can be quite weak. Thisis therefore the type of situation where we expect to find established fran-chisors imposing damages on franchisees. As for new franchisors, those whowant to grow via franchising need to offer an attractive business propositionto potential franchisees. Thus, their desire to sell units in the future will curbany tendency to behave opportunistically. But there have been instances whereunscrupulous individuals simply sold a few franchises and collected the associ-ated fees, but made no effort to really develop viable franchised chains. If thereis no real desire to sell future outlets, there is nothing to prevent opportunis-tic behavior. Our discussion above, of course, presumes that the franchisoris “real” in that it at least plans to develop a franchise system if it has not yetstarted to do so. This requirement that the franchise be “real,” in turn, makesit clear how important it is for potential franchisees to thoroughly investigate
315 See Chapter 3 of this book and Lafontaine and Shaw (1999) for more on this.

P1: KaD0521772524c10.xml CB802/Blair 0 521 77252 4 April 29, 2005 21:54
10.4 Termination and Non-Renewal 275
different franchise opportunities and assess the franchisors’ prospects andincentives before committing to any particular business proposition.
10.4 Termination and Non-Renewal: Legal Considerations
Garner (2000; § 10.01) points out that “the most important change in the fran-chise relationship is its termination by the franchisor or its . . . non-renewal”at the end of its term. As a result, termination and non-renewal are apt tobe challenged by very unhappy franchisees. The rights and obligations of therespective parties in the U.S. are determined by the franchise contract, com-mon law rules, and individual state statutes. One thing is clear: if a franchisorcan convince a court that she had a good reason for terminating the franchiserelationship, she will be free to do so.316
Generally, the courts recognize that the franchisee is a “middleman” be-tween the franchisor and the ultimate customer. The franchisor must beallowed to determine how his goods and services are to be marketed. Whena franchisee deviates significantly from the prescribed method of distribu-tion, the franchisor must be able to replace the offending franchisee throughtermination or non-renewal.317 Absent this ability, the franchisor would losecontrol of the franchise system (see also Chapter 5 for the role of termina-tion in quality control). Garner points out that many courts further respectthe franchisor’s desire to make a change even if the resulting termination iswrongful. That is, the courts do not want to force the parties to continue do-ing business with one another. Accordingly, when the termination is deemedwrongful, the franchisee should not expect the court to order his or her rein-statement. Instead, the remedy will be an award of monetary damages.318 Inthis section, we briefly review the treatment of termination and non-renewal
316 See Love (1986), Chapter 16, for an account of the role that McDonald’s played inlegitimizing the use of termination and non-renewals to discipline franchisees. Thecase of McDonald’s Paris franchisee was particularly important in this regard. Lovenotes: “Indeed, the McDonald’s franchising cases established important legal prece-dents. Previously, court rulings on franchising described practices that were so unfairto franchisees that collectively they gave franchising a bad reputation. McDonald’scases had the very opposite effect. The courts essentially used them to define fran-chising practices that were equitable, and taken together they created a body of caselaw that gave franchising a degree of legitimacy it had never had before.” The authorfurther states “McDonald’s also succeeded in convincing courts of the fairness of itsrenewal policy. . . . Even more important, McDonald’s defended its right to terminatefranchisees for failing to meet its QSC [quality, service, cleanliness] standards” (407–408).
317 For a clear statement, see Amerada Hess Corporation v. Quinn (1976).318 See Garner (2000, § 10.05).

P1: KaD0521772524c10.xml CB802/Blair 0 521 77252 4 April 29, 2005 21:54
276 Termination and Non-Renewal
under common law and state franchise relationship laws. In the next sec-tion, we discuss how damages may be calculated in cases involving wrongfultermination.
10.4.1 Termination Under Common Law
In states that do not have a franchise relationship statute, common law rulesgovern such business relationships and dictate a franchisor’s right to terminateor not renew a franchise contract. The precise limits will vary from state tostate and, therefore, categorical generalizations are hazardous at best. Thereare, however, a few central tendencies that we briefly summarize in whatfollows.
First, if a franchise contract contains no provision for termination and hasno definite duration, the contract is terminable at will by the franchisor orthe franchisee. No notice need be given and no cause for the termination isrequired. As a result, most – if not all – franchise agreements contain someprovisions related to duration, termination, and non-renewal. These contrac-tual terms then explicitly limit the freedom of the parties. In particular, whenthe contract specifies the grounds for termination, courts will usually honorthe agreement and not substitute their judgment for that of the parties. Dis-putes can still arise over whether there has been behavior giving grounds fortermination, but the courts will then focus on assessing whether the behaviorhas occurred, not whether termination on these grounds is reasonable.
In reality, however, even contracts that are silent on duration and termi-nation are not completely terminable at will. The Uniform Commercial Code(UCC §2-309(2)) modifies the common law to some degree by imposing areasonable term when the contract is silent: “Where the contract provides forsuccessive performance but is indefinite in duration it is valid for a reason-able time but unless otherwise agreed may be terminated at any time by eitherparty.” Thus, an agreement that is silent on duration cannot be terminateduntil a reasonable time has elapsed. This, of course, is somewhat vague sincewhat is a reasonable time will vary from case to case. As described earlier,it makes economic sense, however, that a franchisee who pays a lump-sumfranchise fee and further invests in facilities, inventory, equipment, training,and the like surely does not expect to be terminated after a brief time. Oneway to define a reasonable duration is in terms of recoupment.
Garner (2000; §10.13) traces the recoupment rule to an 1894 case inMissouri.319 He explains that the recoupment rule “provides that when a
319 Glover v. Henderson (1894).

P1: KaD0521772524c10.xml CB802/Blair 0 521 77252 4 April 29, 2005 21:54
10.4 Termination and Non-Renewal 277
distributor, dealer or franchisee makes a substantial investment . . . , it isentitled to continue the relationship for a period of time sufficient to re-coup the investment in the absence of cause for termination.” For otherwiseterminable-at-will franchise agreements this rule imposes some reasonable-ness. After all, as we noted in the previous section, a franchisee would investneither a substantial sum nor substantial effort to develop a business if hedid not expect to be a franchisee long enough to recoup this investment.The legal rule, however, focuses on the franchisee’s financial investment only.Specifically, let I denote the franchisee’s financial investment in the franchise.According to the recoupment rule, the minimum term of the contract, T, isgiven by the following equation:
T∑t=1
Ct
(1 + δ)t− I = 0 (10.4)
where Ct is the franchisee’s cash flow in period t and δ again is the discountrate. The cash flow is the profit plus depreciation on the fixed assets (if any),and amortization of intangible assets (if any). Depreciation and amortizationare accounting “costs” that do not require actual expenditures and, therefore,provide cash that may be taken out of the business. Solving equation (10.4)for T provides a minimum term under the recoupment rule. Since I and Ct
vary across franchise opportunities, generalizations regarding the value of Tacross franchise companies or even across franchised units within a chain areproblematic.
While this rule imposes some minimum reasonable duration to the re-lationship, the calculation above will yield a value of T that is questionablefrom an economic perspective for a number of reasons. First, the net presentvalue (NPV) of the opportunity cost of the franchisee’s effort over time mustbe added to the investment figure to yield an estimate of total investment.Alternatively, the opportunity cost of the franchisee’s effort can be deductedfrom the estimation of cash flow each period. If a Subway franchisee, forexample, could earn $35,000/year putting the same effort level in an alter-native occupation, then that sum should be excluded from the measure ofcash flows because it is not part of the return on the investment.320 If thefranchisee pays himself some salary, which appears on his income statement,this amount will need to be adjusted up or down so that the total cost of
320 Of course, one could instead add the NPV of the opportunity cost of effort over theduration of the contract to the measure of franchisee total investment. This approach issomewhat more complicated, however, when one is estimating the reasonable duration.Thus, we describe the simpler method, which consists of removing the cost of thefranchisee’s effort in the calculation of cash flow each period.

P1: KaD0521772524c10.xml CB802/Blair 0 521 77252 4 April 29, 2005 21:54
278 Termination and Non-Renewal
the franchisee’s time is exactly his opportunity cost, namely $35,000. Second,in the event of termination prior to T, any sums that the franchisee may re-cover by selling equipment, land, or facilities (namely S in equations 10.2 and10.3) should be deducted from the award. Otherwise, the franchisee will beovercompensated. Third, there is the question of what should be included inI. For example, suppose a franchisee must move to a new location in orderto become a franchisee. Should the expenses associated with relocation beincluded in I ? Most likely, the answer to this question will be “yes,” that isunless the franchisee used the occasion of buying the franchise to relocate toa new place that he was already planning to move to. Similarly, the time spentin training to obtain the franchise should be included in the investment figureexcept for the portion of this training that is useful outside of the franchiserelationship.
Finally, under the common law, franchise termination may require goodcause even when the agreement is silent on this issue.321 There is variationacross jurisdictions and, therefore, broad generalizations are hazardous. Thejudicial instinct to require cause for termination is captured by a Utah court:“[I]t seems fair and reasonable to assume both parties entered into the arrange-ment in good faith, intending that if the service is performed in a satisfactorymanner, it will not be cancelled arbitrarily.”322 This reasoning has intuitiveappeal. Thus, many state courts will not permit termination of the franchisecontract if the franchisee has not breached the contract by failing to performits part of the bargain. There are, however, a wide array of suitable groundsfor termination. Garner (2000; §10:16) lists several:
. . . the failure of the franchisee to perform a substantial obligation of the agree-ment, either generally or with respect to agreed sales goals or quotas; failureto pay for products when payment was due; fraud; indictment or convictionof a crime relevant to the business; carrying a competitor’s products; failureto purchase and install required equipment; failure to pay taxes; underreport-ing income; drunkenness; falsification of financial information; and trademarkinfringement or product trademark disparagement.
10.4.2 Termination and Non-Renewal Under Dealer orFranchise Relation Statutes
Many individual states in the U.S. have statutes that regulate the relation-ship between franchisors and their franchisees. Further, at the federal level,
321 Garner (2000; §10:15) points out that courts seldom infer a requirement of cause whenagreements are oral because such agreements are inherently terminable at any time.
322 See Miller v. Western Men, Inc. (1968), quoted by Garner (2000; §10:16).

P1: KaD0521772524c10.xml CB802/Blair 0 521 77252 4 April 29, 2005 21:54
10.4 Termination and Non-Renewal 279
non-renewal of gasoline franchises without good cause is proscribed by thePetroleum Marketing Practices Act,323 and in most states, an automobilemanufacturer cannot refuse to renew a dealership contract.324 These statutesare usually designed to protect franchisees from opportunistic franchisors. Ac-cordingly, most of them require good cause for termination and non-renewal.For the most part, a good cause for termination is the franchisee’s failure tocomply substantially with the material terms of the franchise contract.325 Thisfailure alone may not be sufficient, however, as most statutes demand that anoffending franchisee be given an opportunity to cure its failure. Thus, a fran-chisee’s failure to follow the franchisor’s operating manual may be groundsfor termination, but the franchisee must be put on notice and given a chanceto adhere to the procedures and standards set out in the operations manual.Only after the opportunity to cure has been offered can a franchisor pursuetermination in cases where the failure persists.
In spite of the protectionist nature of state dealer relation statutes, thereare a host of failures that have been deemed good causes for termination ornon-renewals. Garner (2000; §10:20) mentions the following:
. . . failure to conform to quality standards; failure to maintain prescribed hoursof operation; noncompliance with warranty procedures; failure to provide ad-equate premises for operation of the business; refusal to comply with a system-wide requirement that the franchisee’s shop have a computer; and failure tomeet a customer’s request for delivery of a product, or failure to comply withpayment terms.
Franchisees are agents of their franchisors in distributing products or dis-pensing them in a business format developed by the franchisor. Recognizingthe fact that the franchisor must depend on its franchisees for its livelihood,franchisors also are entitled to demand financial stability and honesty. Ac-cordingly, franchisees also may be terminated for a variety of financial failuresincluding the following: late payment of fees or rent, deliberately underre-porting revenues to the franchisor, and failing to maintain a minimum networth.326
Failure to meet performance standards can also be adequate grounds fortermination. For example, a franchise contract may include a sales quota.
323 15 U.S.C. §2802.324 See, e.g., Ala. Code §8-20–5; Cal. Veh. Code §3060; Conn. Gen. Stat. §42-133v; Fla. State.
§320.64(1)(a); Ill. Rev. Stat. ch. 121 1/2¶ 754(d)(6); Mass. Gen. L. ch. 93B, §4(3)(e),§9; Tex. Rev. Civ. Stat. Ann. art. 4413(36) §5.02(3). For an analysis, see Smith (1982).
325 Garner (2000; §10:19)326 Id. Garner also points out that a franchisor can lose its right to terminate a franchisee
for late payment if it has ignored a pattern of late payments in the past.

P1: KaD0521772524c10.xml CB802/Blair 0 521 77252 4 April 29, 2005 21:54
280 Termination and Non-Renewal
Failure to meet a reasonable sales quota may be good cause for termination.This is particularly important when the franchisee has an exclusive territorybecause if he does not make the sales, there is no one else (including thefranchisor) who can make those sales. When the franchisor maintains a systemof exclusive territories, a franchisee who trans-ships product, that is, sellsoutside its assigned territory, may be terminated.327
10.5 Assessing Damages for Wrongful Termination328
Once a franchisee has been terminated, the breach cannot be repaired. In mostcases, a court will not order reinstatement of the franchisee as it is not fruitfulto force the parties to work together. Thus, the only remedy for wrongfultermination is an award of damages. There is some confusion regarding theproper measure of damages: “loss of goodwill,” “lost profits,” “going concernvalue,” and “reasonable market value” have all been mentioned as potentialcandidates. Ideally, the damage award should make the wrongfully terminatedfranchisee whole. In other words, it should put the franchisee in the economicposition that he would have occupied had the wrongful termination notoccurred. From this perspective, the proper measure of damages is the presentvalue of the expected future economic profits lost as a result of the wrongfultermination. As we shall see, much of the confusion surrounding the propermeasure of damages is simply a matter of semantics. In what follows, we usea simple hypothetical illustration to untangle the issues.
10.5.1 Measuring the Present Value of Lost Profits: An Illustration
Being something of an entrepreneur at heart, Fran considered several fran-chise opportunities before joining the fledgling Blair Burger franchise system.The most promising location available was in Gulf Harbour, Florida. Fransigned a 20-year franchise contract, uprooted her family from their com-fortable midwestern home, moved to Gulf Harbour, and invested $500,000in her franchise there. As the proud owner of a Blair Burger franchise, Franworked hard and prospered along with the franchise system as a whole. Bythe end of five years, Fran’s business was generating an annual accountingprofit of $140,000 and the future looked rosy. Fran estimated that the workshe performed as a franchisee was worth $60,000 per year. Given the levelof risk in the business, and what she knew about returns she could earn in
327 Id. This is necessary to protect other franchisees.328 Much of the following analysis relies on Blair (1988).

P1: KaD0521772524c10.xml CB802/Blair 0 521 77252 4 April 29, 2005 21:54
10.5 Assessing Damages for Wrongful Termination 281
alternative investments, she thought she should earn a 12 per cent rate of re-turn on the $500,000 she had invested in her franchise. So, she estimated thatshe was earning economic profits, or above normal returns, of $20,000 peryear. Then disaster struck: her franchise contract was wrongfully terminated.Knowing that she could never get her franchise back, Fran sued her franchisorfor damages.
Fran’s Blair Burger franchise was an income-generating asset, which wouldhave produced a stream of profits into the future. To put Fran back in the po-sition that she enjoyed before the wrongful termination, the damage awardshould be sufficient to replace the flow of income (economic profit plus acompetitive return on her investment) that she lost. Generally, a wrong-fully terminated franchisee is entitled to a lump-sum award equal to thepresent value of the lost stream of future income. If Fran receives suchan amount, she can invest it and use the principal and interest to replacethe stream of above normal profits that she would have earned “but for”the termination. In its simplest form, the damage award (D) can be ex-pressed as
D =τ∑
t=1
It/(1 + δ)t (10.5)
where It denotes income at time t, δ is the discount rate, and the summationis taken over the expected remaining term of the relationship, τ . Though thelogic of defining the damage award in this way is quite clear, each componentof the estimation may be hotly contested.329
10.5.1.1 Estimating Future Profits
Valuing the lost stream of income requires estimating the future profits thatwould have been earned but for the wrongful termination. These estimatesare bound to be challenged. There is an unavoidable element of uncertaintysurrounding any forecasting exercise, and the estimation of future profits is noexception. But as long as the underlying methodology for estimating the lostprofits is sound – economically and statistically – some degree of imprecisionwill be tolerated by the courts. In other words, although judges and juries maynot award damages on the basis of speculation or pure guesswork, they mayaward damages on the basis of fair and reasonable inference based on relevant
329 In addition to lost expected income, Fran could also ask for transition damages, namelyforgone wages and returns during a reasonable transition period, as these losses arealso due to the wrongful termination.
P1: KaD0521772524c10.xml CB802/Blair 0 521 77252 4 April 29, 2005 21:54
282 Termination and Non-Renewal
data. The fundamental reasoning behind this tolerance for imprecision isthat the franchisor, by her wrongful termination, created the necessity fordetermining damages in the first place. As the Supreme Court has observed,“[t]he most elementary conceptions of justice and public policy require thatthe wrongdoer shall bear the risk of uncertainty which his own wrong hascreated.”330 This does not mean that just anything goes, but it does meanthat objections about imprecision will “fall on deaf ears” provided that theestimates are based upon reasonable inferences drawn from the best evidenceavailable.331
In a case such as Fran’s, where the franchisee’s business is mature, there ex-ists an established financial track record. In that event, past profits are likely tobe the best evidence of what one reasonably could anticipate in the future.332
But past accounting profits do not provide an appropriate measure – theymust be adjusted downward to account for the fact that part of the accountingreturns are in fact compensation for the use of Fran’s time, time that she cannow use in another revenue-generating activity. As we discuss further below,the discounted value of the profits must also be adjusted downward to accountfor the value of the assets upon termination. Moreover, even once adjustedin these ways, past profits cannot be used without accounting for the possi-bility that future changes may undermine their reliability. For example, oneshould take into account the likely presence of new competitors, anticipatedgrowth in the market, inflationary changes in cost, and anything else that willinfluence profits. It may be sensible to calculate future profits under varioussets of assumptions regarding these variables (i.e., to do a sensitivity analysis).In this way, one will be able to see how robust any single estimate is and thejury will know how changes in those variables influence the magnitude of thedamage calculation.
Unlike Fran, if the franchisee’s business is not mature, that is, the wrongfultermination occurs early in the life of the business, then estimation of futureprofits cannot rely upon the fledgling franchisee’s past performance. Natu-rally, this makes the estimation of lost profits much more difficult. A court
330 Bigelow v. RKO Radio Pictures (1946).331 In some cases, lost profits are admittedly too speculative to be the basis for a damage
award, but are accepted anyway because the alternative would be to deny recovery to awronged party. See Areeda and Turner (1978; ¶ 344C).
332 Precisely how one uses the past profit performance depends upon the circumstances.It is preferable to use data from several years to establish a benchmark rather than justone year, which may not be typical. If the prior years indicate a pattern of growth,this fact may be useful for forecasting future performance. If one year is aberrationalfor identifiable reasons, this may provide an adequate justification for excluding it –whether it is particularly favorable or unfavorable is irrelevant.

P1: KaD0521772524c10.xml CB802/Blair 0 521 77252 4 April 29, 2005 21:54
10.5 Assessing Damages for Wrongful Termination 283
could decide that the available evidence is inadequate to sustain a damageestimate. If so, that would leave the wrongfully terminated franchisee with-out any compensation. This is not a satisfactory state of affairs as an estimateof zero clearly understates actual damages unless the business was expectedto never earn any profits, an unlikely scenario.333
The franchisee in this situation may discover a fruitful source of data inthe franchisor’s own business records. Specifically, the franchisor’s files maycontain data on the economic and demographic characteristics of each of itscompany-owned and/or franchisee-owned locations. Combining these datafor each location, one may estimate how the average location fares in themarketplace. This relationship can be used to estimate how the terminatedfranchisee would have fared, given the characteristics of its market, but forthe termination. In other words, the plaintiff would create something akinto a composite “yardstick” for estimation purposes.334 This would be ac-complished by using multiple regression analysis that employs actual data toestimate a relationship among several variables.335 In particular, if the fran-chisor has reasonably complete data on each of its locations, the franchiseecan explain variation in profit across locations by building a multiple regres-sion model and fitting it with the data characterizing the actual franchiselocations.
For example, one may specify outlet profit as a function of several ex-planatory variables: age of the outlet, number of competitors within the samegeographic market (e.g., a three-mile radius around the outlet), populationwithin the same geographic market, median household income, median ageof the population, the size of the outlet (if there is any variation in size),and whether the outlet is company-owned or franchised. This informationwould be collected for each of the franchisor’s outlets and used in a multipleregression analysis to determine the influence of each explanatory variableon the dependent variable (profit). The regression technique, in fact, pro-vides estimates of the influence that each explanatory variable has on profits.In that sense, one obtains an estimated relationship that permits reasonableinferences regarding an average performance on the part of the terminatedfranchisee.336
333 The franchisee still may sue for reasonable reliance expenditures, but these may be afar cry from the lost profits that it cannot prove with sufficient credibility.
334 On “yardstick” methods in antitrust damage calculations, see Blair and Kaserman,(1985: 78–82).
335 Excellent introductions to multiple regression techniques are provided by a number ofintroductory econometrics texts, including Kmenta (2d ed. 1986) and Kennedy (2003).
336 Of course, the franchisor will want to present testimony to show that the terminatedfranchisee would not have done as well as an “average” franchisee. The plaintiff will
P1: KaD0521772524c10.xml CB802/Blair 0 521 77252 4 April 29, 2005 21:54
284 Termination and Non-Renewal
The regression results also can be used to test the reasonableness of otherestimates of lost profit. For example, if one were to use the past performanceof the terminated franchisee to project future profits, these projections can becompared to those flowing from the regression model. If the two projectionsare not terribly dissimilar, then some useful information is provided. Onthe other hand, if the results are quite different, some reconciliation will benecessary. In either event, what magnitude of differences should raise concernsis a matter of judgment and, perhaps, some dispute as well.
Another measure of lost profits that courts have accepted at various times isone that relies explicitly on the so-called yardstick methodology. To implementthis approach, the wrongfully terminated franchisee must find a similarlysituated franchisee who has not been terminated. The profit of this franchiseeserves as a yardstick to measure the wrongfully terminated franchisee’s loss.Although the use of yardsticks to gauge the profit potential of a wrongfullyterminated franchisee is completely logical in principle, it is fraught withproblems in practice. It is one thing to say that a suitable yardstick should bea “similarly situated franchisee,” but it is quite another thing to actually findone. What one is searching for is a second franchised outlet that is as similar tothe terminated franchise outlet as possible. Ideally, the yardstick ought to be anidentical twin or a clone. Their ages should be the same as should the marketsin which they compete. The latter includes the identities of competitors in eachlocation, the economic and demographic characteristics of consumers withinthe relevant geographic market (e.g., per capita income, unemployment rate,educational attainment, female labor force participation, racial composition,and the like), the skills and abilities of the two franchisees, and any otherfactor that influences a franchisee’s success, such as consumer tastes. To theextent that any of these factors vary between the terminated franchisee and theproposed yardstick, some questions arise as to the reliability of the yardstick’sperformance as a basis for measuring damages. Resolution of this uncertaintyrequires the sort of regression analysis described above.
10.5.1.2 Discount (or Interest) Rate
In order to calculate correctly the present value of Fran’s lost profits, one mustselect the correct discount rate from a wide array of alternatives. Interest rateson loans, for example, vary according to the riskiness of the loan among otherthings. At one end of the spectrum are short-term government obligations
offer evidence to the contrary. Thus, multiple regression estimates are not immunefrom criticism and are also likely to be disputed.
P1: KaD0521772524c10.xml CB802/Blair 0 521 77252 4 April 29, 2005 21:54
10.5 Assessing Damages for Wrongful Termination 285
that carry very low interest rates because the loan commitment is of shortduration and because there is no meaningful default risk. At the other endof the spectrum are extremely risky ventures with significant prospects fordefault such as those that venture capitalists fund. There is, of course, a hostof options in between these extremes. Specific rates reflect the time valueof money and inflation risk as well as all of the risks inherent in businessgenerally.
We should not lose sight of the purpose behind the discounting. A lump-sum damage award is made to Fran so that she (in principle) can investthe award and thereby generate a flow of payments to replace the estimatedstream of profits. Accordingly, a long-term flow of profits should not bediscounted at a short-term interest rate. On the contrary, one should attemptto match the terms in order that the interest rate selected will incorporatethe appropriate expectations regarding inflation risk as well as the time valueof money. Depending upon how the profit stream was estimated, no furtheradjustment for risk may be necessary.
There are also tax consequences that come into play. Awards of lost profitsare taxed fully in the year they are received. Thus, the pre-tax flow of futureprofits should be discounted to provide a lump-sum payment that Fran canthen invest in order to replace the lost profits. If post-tax profits were usedin this calculation, the after-tax lump-sum amount would be too small tocompensate Fran fully.337
10.5.1.3 Duration
As a general proposition, economists view businesses as having indefinite lives.In the case of a franchised business, however, this may not be appropriate dueto specific contractual provisions. For example, Fran’s franchise agreementhad a 20-year life. When the contract has a specified term, the expiration dateof the contract may be used to define τ in the valuation formula. In particular,τ would equal the difference between 20 and the age of the contract upontermination, that is, the number of years left in the contract. In Fran’s case, τequals 15.
A wrongfully terminated franchisee may, however, look at the franchisor’sprevious behavior and applicable law relating to renewal as well. For franchisecontracts that specify a fixed term, it is of some interest to know whether
337 Of course, if the tax rate on the award is different from what the tax rate on Fran’sprofits would have been, or the tax rates do not apply to the full amounts in one caseor another, then other corrections will be needed.

P1: KaD0521772524c10.xml CB802/Blair 0 521 77252 4 April 29, 2005 21:54
286 Termination and Non-Renewal
the franchisor usually renews the contracts. If so, Fran may argue that thefranchisor’s usual practice should apply. Similarly, if the contract contains in-definite termination provisions, the franchisor may be bound by his pastpractices in this regard. In states with statutes that provide that a fran-chisor may not refuse to renew the franchise agreement without cause,338
or in industries to which such legislation applies,339 the duration of thelost future profits may extend well beyond the original term specified in thecontract.
One aspect of duration that tends to be ignored in these estimations is thepossibility of business mortality.340 Although there is some positive probabil-ity that the business would have failed in the future, many analysts disregardthis. In adopting this attitude, they implicitly assume that the probability offailure is zero. If the discount period is short enough, this may be an appro-priate assumption. In contrast, however, if the discount period is very long,this assumption may be wholly inappropriate. As we have seen in Chapter 2,franchising is not immune to business failure and this fact should be consid-ered. Once again, the franchisor’s own data may offer some useful evidence, atleast on outlet mortality rates. To the extent that some of its franchised outletshave failed in the past, these records can be used to estimate the probabil-ity of failure under various sets of circumstances. Of course, incorporatingthe possibility that the wrongfully terminated franchisee might have failed atsome point within the remaining contract period will reduce the estimate ofdamages sustained due to the wrongful termination.
10.5.2 Alternative Business Valuation Methods
A variety of business valuation methods are available and used in a numberof contexts. For the purposes of valuing the loss due to franchise termination,some of these alternatives are reasonable approximations of the present valueof lost economic profits and may be relied upon, albeit with some caution.To the extent that any method deviates from the present value of the losteconomic profits, that method is suspect from an economic perspective.
338 Cal. Bus. & Prof. Code §20025; Conn. Gen. Stat. §42-133f; Del. Code Ann. tit. 6,§2552; Haw. Rev. Stat. §482E-6(2)(H); Mich. Comp. Laws §445.1527 (D); Minn.Stat. §80C.14, subd. 4; Neb. Rev. Stat. §87-404; N.J. Rev. Stat. §56:10-5; Wis. Stat.§135.03.
339 As noted above, the non-renewal of gasoline franchises without good cause is proscribedby the federal Petroleum Marketing Practices Act while automobile manufacturerscannot refuse to renew a car dealership contract under most state laws.
340 This issue is explored with some care by Garrod and Miklius (1987).

P1: KaD0521772524c10.xml CB802/Blair 0 521 77252 4 April 29, 2005 21:54
10.5 Assessing Damages for Wrongful Termination 287
10.5.2.1 Capitalized Earnings
The concept of capitalized earnings is closest to the correct measure of dam-ages. There are three basic approaches to capitalizing earnings. First is theso-called discounted cash flow approach, which is equivalent to what was ex-plained as the present value of lost profits. While there may be some relativelyminor differences, the spirit of the approach is the same.
A variant of this is the income capitalization method. In this case, the fran-chisee’s net income for one year is calculated from the financial statements.Adjustments are made for non-cash items such as depreciation and amorti-zation, which are influenced by tax rules rather than economic value. Adjust-ments for the value of the franchisee’s time may also be necessary. Once thenet income is determined, it is capitalized by dividing by the expected rate ofreturn. For example, if a 20 percent return is expected and the net income forthe year in question was $20,000, then the value would be $20,000 .−. 0.20 =$100,000. In this case, the expected rate of return acts like the discount rate.For this approach to be reliable, the expected rate of return must be a goodapproximation of the appropriate discount rate. An implicit assumption ofthis approach is that the franchised outlet has an infinite life.341 This implicitassumption may or may not be correct depending upon the circumstances.
The third capitalization method relies on excess earnings as a measureof goodwill. In essence, this approach reduces the franchisee’s cash flow toaccount for opportunity costs, such as the required return on similar invest-ments, as well as economic depreciation of capital assets and amortization ofintangible assets. The net result is excess earnings, that is, earnings above thosenecessary to keep resources invested in this enterprise. This is precisely whateconomists call profits. The capitalized value of the excess earnings representsgoodwill. Properly computed, this approach could provide a reasonably goodapproximation to the franchised outlet’s value. Its major shortcoming is thatthe franchisee’s effort, which is clearly a cost, may not be accounted for prop-erly. Specifically, this method will yield a good estimate of the outlet’s valueonly if the franchisee includes for himself a salary commensurate with thecost of his time in the calculation of his cash flows.
10.5.2.2 Market Determined Values
There are two valuation methods that rely upon market data. First, the valueof a business can be established through stock market transactions, which
341 This follows from the mathematical fact that the geometric series, S = 11+i
+ 1(1+i)2 +
. . . + 1(1+i)t + . . ., converges to 1/i in the limit as t approaches infinity.

P1: KaD0521772524c10.xml CB802/Blair 0 521 77252 4 April 29, 2005 21:54
288 Termination and Non-Renewal
is referred to as the market cap. For a publicly traded company, this is afairly simple procedure. For each class of stock, one simply multiplies thestock market value by the number of shares outstanding. Generally, this willnot work for a franchise because franchised outlets typically are closely heldcorporations whose stocks are not publicly traded.342
A potentially fruitful approach resides in comparable sales. Similarly towhat is done in evaluating housing market values, an analyst would obtaininformation on the sales of comparable franchised outlets and use those valuesto estimate the value of the terminated franchise. The problem, of course,lies in identifying truly comparable sales. In most instances, the franchisor’srecords can be used to identify sales of franchisees. Using economic anddemographic data on the franchised outlets, one can identify the sales offairly comparable properties. The purchase prices of comparable outlets maybe quite reliable proxies for the market value of the terminated franchise.343 Ofcourse, if the terminated franchisee really were able to sell his franchise at a fullcomparable price, regardless of the wrongful termination, then the calculateddamages under this method would be zero. But this simply highlights thereality that a franchisee who can sell his franchise in the market does notincur losses but instead captures the expected returns from this asset in thesales process. The only remaining claims a franchisee could make for thewrongful termination under such a scenario, where the franchisee is able tosell his franchise at market value despite the termination, would be relatedto the cost of transitioning to a new job or business. We discuss the issue ofdamage mitigation in more detail in the next section.
10.5.3 The Mitigation of Lost Profits
As we have seen, wrongful termination of a franchise relationship usuallyresults in injury to the terminated franchisee in the form of lost profits. Theextent of this injury can be estimated according to the principles outlinedabove. Before awarding damages, however, the injury must be defined toreflect actual or potential mitigation. The purpose of a damage award isto return the wrongfully terminated franchisee to the financial position itwould have enjoyed had the wrongful termination not occurred. Generally,
342 There is also a conceptual problem with this method. Stock prices reflect the cost ofacquiring a minority interest in a company. They do not reflect the cost of acquiringa controlling interest in a company. Usually, this cost is much higher as can be seen inthe difference between a tender offer and a stock’s previous trading price.
343 See Kaufmann and Lafontaine (1994) for examples of analyses involving capitalizedprofits and comparable sales at McDonald’s.

P1: KaD0521772524c10.xml CB802/Blair 0 521 77252 4 April 29, 2005 21:54
10.5 Assessing Damages for Wrongful Termination 289
the franchisee has a duty to mitigate damages, that is, to reduce the adverseconsequences of a wrongful termination. Thus, the law may expect Fran toseek other employment rather than remain idle after her termination. Indoing so, the law is requiring again that the award only cover lost economicprofit; the effort of the franchisee after termination can be directed toward adifferent productive activity that will generate some level of compensation.To the extent that Fran’s damages are (or can be) mitigated, for example, bytaking on a new job, her award must take this into account or she will beovercompensated for the net injury suffered.
As another example of the need to recognize mitigating factors, considerthe fact that Fran may be entitled to remain at her Gulf Harbour location, andonly be required to surrender her identification as a Blair Burger franchisee.This is possible in many cases where the outlet does not have a distinctiveappearance – the former franchisee may only have to change its sign and anyother trade dress that identifies it as a Blair Burger franchisee. If the franchisecontract does not contain a non-compete clause, Fran may continue in thesame business, but as an independent rather than as a Blair Burger franchisee.To the extent that an independent earns less profit than a member of thefranchise system, Fran will suffer some injury. The extent of that injury isthe difference between the profit streams suitably discounted. In other words,the injury is equal to the impairment in the profits that Fran earns. If thedamage award fails to account for the fact that Fran can continue in businessas an independent, she will be overcompensated for any losses incurred as aresult of the wrongful termination.
As another example, Fran may be permitted to sell her franchised locationto someone else. As noted previously, in that case Fran should be able torecover most of the present value of the lost profits through the sale of herbusiness. To the extent that the sales price incompletely capitalizes the futureprofits because of the distress nature of the sale, there may be some differencebetween the going concern value of the business as a franchise and the marketvalue. This would be an appropriate measure of Fran’s injury.
As a last example, consider the case where the franchisor buys out theterminated franchisee. In this instance, when the location will be managedby the franchisor or sold to another franchisee, Fran will suffer a loss onlyto the extent that the purchase price again does not reflect the present valueof the future profits. If the price does reflect this value, then there has beenno injury suffered and no damages should be awarded to Fran even thoughthe termination was wrongful. No damage award is necessary because thefranchisor has paid the full value of the asset that has been taken away fromFran.

P1: KaD0521772524c10.xml CB802/Blair 0 521 77252 4 April 29, 2005 21:54
290 Termination and Non-Renewal
10.6 Conclusion
In this chapter, we have shown that franchise contracts are typically quitelong-term, and that franchise relationships usually extend beyond the termof the original contract. We also described available information on termi-nation, transfer, and non-renewal rates. We then outlined the importanceof contract duration and renewal in determining franchisees’ willingness toinvest both capital and effort in their franchised unit. We also discussed therole that contract termination plays in the private enforcement mechanismthat franchisors use to entice profit maximizing franchisees to work within theconfines of the business format. Moreover, we summarized how the law treatstermination and non-renewal of franchise contracts in the U.S. Franchise re-lationship laws enacted in a number of states are meant to protect franchiseesfrom franchisor opportunism. We have argued that while such opportunismcan arise in some cases, most cases of termination seem to reflect the fran-chisors’ need to enforce quality standards or a desire to exercise an option thatwas part of the initial contractual agreement. We also noted that the availableempirical evidence does not support the notion that termination is usuallya manifestation of franchisor opportunism: Franchisor opportunism wouldsuggest that franchisors would terminate those units that are performing well,but the evidence suggests instead that they terminate outlets whose perfor-mance is below average. Finally, we reviewed the economics behind damagescalculations in wrongful termination cases and pointed out that most of theprinciples described in this process would apply to damage calculations inmany other settings.
P1: KaD0521772524c11.xml CB802/Blair 0 521 77252 4 April 29, 2005 21:57
11
Concluding Remarks
11.1 Introduction
Franchising entails a symbiotic relationship between what are, in reality,legally independently owned businesses. Franchisees can only succeed whenthe system as a whole succeeds. At the same time, the franchisor’s profitsderive from the success of its franchisees. Their mutual interdependence is,therefore, readily apparent. But while the interests of franchisors and fran-chisees often coincide, it remains true that they are not entirely compatible.This, of course, gives rise to conflict.
Broadly conceived, there are two major sources of conflict between fran-chisors and franchisees. First, some franchisees are simply ill-suited to beingpart of a chain where uniformity is essential. These people are just too in-dependent. They want to modify the menu, select a different location, havedifferent hours of operation, and so on. Because franchise systems thrive onuniformity of quality, appearance, hours of operation, and the like, there is atension between the franchisor and some of its franchisees who chafe underthe franchisor’s insistence on compliance with the business model. There is noobvious way to resolve this problem except to note that those individuals whoseek significant independence should not invest in a franchise, and franchisorsalso need to develop franchise sales and franchisee selection procedures thatwill prevent the sale of franchises to such individuals. Not surprisingly, thefranchising trade and management consulting literatures discuss this problemat length.
The second major source of conflict is the one that we focus on in thisbook. It arises from the fact that the interests of franchisors and franchiseesare not perfectly aligned. Franchisors and franchisees alike are interested inmaximizing their own profits. Most franchise contracts, however, involve roy-alties on the basis of sales revenue. The literature often attributes conflict to
291
P1: KaD0521772524c11.xml CB802/Blair 0 521 77252 4 April 29, 2005 21:57
292 Concluding Remarks
the fact that the franchisor is interested in sales revenue maximization by thefranchisee while the franchisee is interested in its profits, not in sales rev-enue per se. While this can contribute to the misalignment of incentives, wehave noted on several occasions that even if the contract specified royaltieson franchisee profits rather than sales, most of the conflict between fran-chisors and franchisees would remain. In other words, even with profit-basedroyalties, franchisor and franchisee incentives would still not be aligned.344
As we saw, for example, in Chapters 5, 7 and 8, franchisors care about thesum of outlet outcomes (revenues or profits) while franchisees care aboutthe profit in their own unit(s). Externalities, or spillover effects, necessarilyarise among outlets that operate under a common brand. Such externali-ties imply that the whole is not simply the sum of its parts. In other words,because profits at a given location are influenced by the pricing and qual-ity decisions made in other units in the chain, the prices and quality lev-els that maximize profits in each outlet do not maximize overall profits inthe chain. This inevitably results in tension between the franchisor and itsfranchisees.
It is important to recognize that part of the problem with franchising,however, also arises from misconception as to what franchising is. Tradition-ally, franchisors have advertised franchises as opportunities for individualsto “be your own boss.” In reality, owning a franchise is not at all the sameas independent small business ownership. Franchisees buy the right to use atrademark in a particular location for a particular time period. The notionthat this right should be perpetual, fully transferable to one’s heirs, and soon, arises because of the tendency to view the franchise as a completely in-dependent business rather than as a contractual agreement. One does notexpect, upon signing a lease, for example, that the lease will necessarily berenewed under the same terms in perpetuity. The same should be true fora franchise. If franchisees come into franchising knowing that they are notbuying a business but rather are entering into a contractual agreement offixed duration, they will not feel betrayed when their franchisor makes fur-ther demands at the time of renewal or even does not renew their contract. Ofcourse, franchisees would not behave like business owners either, but ratherfocus on what is best for them to do knowing that their relationship with theirfranchisor is not a permanent one. And franchisors would need to take this
344 Writing contracts that base royalties on franchisee profit rather than revenues mustnot work well as there are few of them. See Chapter 3 for a detailed look at contractterms, and Chapter 4 for some discussion.

P1: KaD0521772524c11.xml CB802/Blair 0 521 77252 4 April 29, 2005 21:57
11.2 A Summary 293
into account in designing their contracts and choosing clauses on territorialprotection, duration, transfers, and so on.
Our goal in this book then was to do two main things. First, we wantedto describe franchising: what it is and how it works exactly. We did thisthroughout the book by relying on an extensive data set on the character-istics and contracting practices of U.S. based franchisors over time. We alsorelied on other sources whenever possible, and reviewed the main theoreticalframeworks from economics that help us shed light on this form of businessrelationship and organization. Second, we wanted to describe and develop abetter understanding of the main sources of conflict between franchisors andfranchisees. Chapters 5 through 10 were dedicated to this endeavor. In eachof these, we discuss what is the fundamental source of the conflict, presentinformation concerning the contractual and management practices that giverise to or try to address this source of conflict, and finally summarize howthe legal disputes in each area have been treated by the U.S. court system.Our hope is that those involved in franchising or related activities will findthat our description puts into perspective certain aspects of this relationship,while scholars with an interest in franchising, whether they be economistslike us or not, will find here enough details about this organizational formto foster further research on franchising and organization of the firm moregenerally. With this in mind, in what follows we summarize some of the mainconclusions from our analyses.
11.2 A Summary
The first four chapters of this book were devoted to a description of franchisingusing our data and other sources, and to a discussion of the economic theoriesthat help us understand the nature of the franchise relationship. We startedin Chapter 1 by defining franchising, tracing some of the milestones in thehistory of franchising in the United States and elsewhere, and showing itscurrent importance in the U.S. economy. We noted that in order to reachgeographically dispersed consumers, firms in the retail and service industrieshave established networks of local outlets. They do this because large chainsbenefit from greater access to economies of scale in marketing and often canobtain supplies at lower prices. A firm that has developed efficient retail orinventory processes is better able to capitalize on these if it spreads the costsof these activities across numerous markets and the globe. Once it is clearthat a firm will benefit from establishing a large number of geographicallydispersed outlets, the next question that arises is how best to organize the
P1: KaD0521772524c11.xml CB802/Blair 0 521 77252 4 April 29, 2005 21:57
294 Concluding Remarks
firm’s relationship with these outlets. Franchising is one mode of organizationthat a large subset of these firms has adopted. In those cases, the franchisormaintains ownership over the trade name and marks and, in the case ofbusiness-format franchising, develops a complete “recipe” to run each outlet.It then licenses the right to operate under the central trade name and businessformat in a given market for a certain period of time to individuals or smallfirms in exchange for various fees. The ownership stake of the franchisee incurrent and future profits leads him to put significant effort into the outlet.At the same time, the ongoing fees he pays to the franchisor ensure thatthe latter has incentives to maintain the value of the brand by, among otherthings, screening and monitoring franchisees and keeping abreast of markettrends.
In Chapter 2, we reviewed a series of myths about franchising. Contraryto popular belief, we showed that franchising is not a low-risk form of busi-ness enterprise, for franchisors or franchisees. We also discussed exaggeratedclaims of growth in franchising, and showed that while franchising is an im-portant part of the U.S. economy, it has not grown at the exponential ratesoften advertised. Finally, we discussed the size distribution of franchisors,showing that while most franchisees are associated with large networks, mostfranchisors are in fact relatively small businesses themselves. We also showedthat contrary to received wisdom, franchisees are not always small “mom andpop” businesses.
In Chapter 3, we described in some detail the fees charged by franchisors,namely franchise fees, royalty rates, and advertising fees, showing that there issignificant variation in these fees across firms and industry sectors. In Chap-ter 4, we reviewed the extent of dual distribution in franchised chains, thatis, the tendency for these firms to operate some units directly and franchiseothers. We showed that there is also much variation in the extent of com-pany ownership across franchising firms, and sought to explain this partly bydiscussing the equivalence of various forms of vertical restraints, and partlyby introducing the type of incentive issues that the economics literature hasrelied upon to explain both the level of fees and the extent of dual distributionin franchised chains.
Next, we examined a number of situations where incentive incompatibility“rears its ugly head” in the franchise relationship. In Chapter 5, we focusedon product quality issues. Quality must be as uniform as possible acrossall franchisees within a chain: McDonald’s wants its Big Mac in Atlanta totaste just like one sold in San Francisco. A mobile customer base expects anddemands such uniformity. But each individual franchisee can earn additionalprofit by reducing its quality and thereby reducing its costs. A franchisor
P1: KaD0521772524c11.xml CB802/Blair 0 521 77252 4 April 29, 2005 21:57
11.2 A Summary 295
cannot condone such behavior because it damages the entire system. Wesaw that quality control mechanisms in franchising appear to work since theempirical evidence indicates little quality variation between company-ownedand franchised locations.
For a variety of reasons, including quality control, franchisors occasionallyrequire that their franchisees buy a variety of inputs from the franchisor orits designated supplier. If franchisees perceive that they are paying a premiumfor those tied inputs, they will naturally complain since their profits willbe lower. We discussed in Chapter 6 how the resultant conflict may lead toantitrust challenges under U.S. law. We also noted, however, that these havebeen unsuccessful generally because franchisors have been deemed to haveinsufficient market power to endanger competition.
As we saw in Chapter 7, in some instances a franchisor may want to limitthe franchisee’s pricing discretion. In particular, a franchisor may wish to im-pose maximum resale prices to prevent a successive monopoly problem frommaterializing or to internalize the effect of each outlet’s price on the deci-sions that consumers make to frequent other outlets in the chain. The eco-nomic rationale is straightforward: by holding down the retail price, thefranchisees’ sales will be larger, which benefits the franchisor. Prior to theU.S. Supreme Court’s decision in Khan, which overruled Albrecht, such ver-tical price controls were illegal per se under Section 1 of the Sherman Act.Now, however, maximum price controls will be evaluated under the rule ofreason and almost surely will be deemed permissible. These resale price con-trols will be a source of conflict as the franchisor earns more profit while thefranchisee earns less. In this case, our sympathies lie with the franchisor be-cause those price controls confer a decided benefit on consumers in the formof lower prices. Interestingly, even though particular franchisees may resentthe price controls, franchising as a business organization is promoted by thisnew outlook on maximum price controls because it reduces the likelihoodthat franchisors will turn to the alternative of complete vertical ownershipintegration.
In Chapter 8, we discussed how, as franchise chains mature and/or pop-ulation patterns shift, incumbent franchisees may face what they perceive asencroachment. The incumbent franchisee considers a certain territory as hisand does not expect to face any competition from intrabrand rivals, that is,from other franchisees or company units from the same chain in this perceivedterritory. Thus, the incumbent franchisee characterizes the establishment ofa new franchised or company-owned unit as encroaching on his market. Toa large extent, this is understandable. If the newcomer is close enough tocause a noticeable loss of sales for the incumbent, profits will fall and the

P1: KaD0521772524c11.xml CB802/Blair 0 521 77252 4 April 29, 2005 21:57
296 Concluding Remarks
incumbent franchisee will be unhappy. In many cases, the encroached uponfranchisee believes or argues that this is the product of franchisor oppor-tunism. In fact, franchisees have sought legislation that limits the franchisor’sability to open new outlets “too close” to existing outlets. Through a simpleexample, we have shown, however, that the consequences of protectionistlegislation are predictable: the incumbent franchisees benefit at the expenseof everyone else. The franchisor earns less profit, would-be franchisees aredenied entry, and consumers pay more. In our view, conflict, and the needfor protectionist legislation, can be reduced by providing complete informa-tion to franchisees before they sign their contracts. This should alter theirexpectations and make clear to them that each may face more intra-brandcompetition in the future. When the competition arrives, incumbents willnot be happy about the resulting reduction in profitability, but they will notfeel betrayed by their franchisor.
The terms of most franchise contracts require the franchisee to help payfor advertising. There is no doubt that franchisees recognize the value of ad-vertising as well as other forms of promotion. There is also no doubt that theyrecognize their obligation under the franchise agreement to help pay for it.The conflict that we focus on in Chapter 9 arises when franchisees object to theeffectiveness of the advertising – the message, the frequency, the placement,and so on. When the franchisee believes that he or she is not getting enoughbang for the buck, complaints surface. If the franchisor continues to place adsas it sees fit, conflict develops and, in some instances, erupts into legal chal-lenges. For the most part, the judicial results are predictable. If the franchiseagreement provides the franchisor with full discretion regarding the expen-diture of the advertising funds, the complaints of the franchisees will fall ondeaf ears. It is only when the contract imposes an obligation on the franchisorto involve the franchisees in some way that the disgruntled franchisees willbe heard. Again, it is clear that this sort of conflict can be minimized throughongoing communication. This is not to say that the franchisor should ab-dicate its prerogatives, but keeping franchisees informed about promotionalstrategies will be useful. In most cases, the franchisor will know better whatis in the system’s best interest, but individual franchisees are understandablyconcerned primarily with their own markets. Disagreements are unavoidable,but the consequences may be reduced through better explanations of currentand future plans.
Finally, in Chapter 10, we described issues surrounding contract dura-tion, termination, and non-renewals. Many franchisees view their franchiseas their property. The longer the contract, the more permanent the rela-tionship would appear to be. As a result, termination during the term of

P1: KaD0521772524c11.xml CB802/Blair 0 521 77252 4 April 29, 2005 21:57
11.3 International Franchising 297
the contract or nonrenewal at the end of a contract will be a wrenchingexperience for the franchisee. In many cases, this is the ultimate conflict.But termination and contract duration provisions play a useful role in thefranchisor–franchisee relationship. A franchisor’s ability to terminate or notrenew a franchisee provides an important threat that may be used to compela franchisee’s adherence to the terms of the franchise agreement or, moreimportantly, to the spirit of the franchise agreement. For example, whenopportunities arise that might lead a franchisee to reduce quality at hislocation(s), the threat of termination may serve as a powerful deterrent. As inother areas of the relationship, franchisees suspect that termination or non-renewal results from franchisor opportunism. The data, however, do not sup-port this suspicion in general. Termination usually involves poorly perform-ing units rather than the superior locations that a franchisor might want toreclaim.
11.3 International Franchising
In our description of franchising practices, we have discussed what we knowabout franchising outside the U.S. whenever possible. We have not examinedinternational franchising separately in this book, however, for two main rea-sons. First, the legal environment can vary significantly across countries. Asa result, it is difficult, if not impossible, to draw general conclusions regard-ing how contract law, distribution law, and antitrust (or competition) policyinteract and affect franchising around the globe. Of course, dealing with thelegal treatment of franchising in a large number of countries in any level ofdetail is not only beyond our capabilities, it would also turn this book into agargantuan series of treatises.345 Second, and most important in our view, theeconomic forces at work in franchise relationships do not respect geo-politicalboundaries. In other words, the need for cooperation and the conflicts thatwe have examined between franchisors and franchisees arise, say, in Europe,China, Australia, and Japan, just as they do in the United States. The availableinformation on franchising contracting outside the U.S. generally confirmsour view that economic outcomes and issues in the international arena aresimilar to those found in the U.S. Still, much more work needs to be done ifwe are to truly understand how and why franchising works in various juris-dictions. Our hope is that the economic analyses herein will provide fertileground and hence foster some of that work.
345 However, see Mendelsohn (2003).
P1: KaD0521772524c11.xml CB802/Blair 0 521 77252 4 April 29, 2005 21:57
298 Concluding Remarks
11.4 The Future
Despite the sources of conflict that we have identified throughout this book,franchising has withstood the test of time. From its modest beginnings inthe late 1800s, in industries such as soft-drink bottling, car dealerships, andbeauty salons, through the franchising boom of the 1950s in the U.S. – mostof which occurred in the fast-food and in the hotel and motel industries –franchising has proven to be an efficient method of doing business in a largenumber of industries. Similarly, research on this organizational form hasprovided new insights not only about what works for franchising, but alsoabout other forms of inter- and intra-firm contracting and organization ofthe firm issues generally. We believe that there is much more research to do inthe fertile field of franchising to refine the answers to some of the questionsraised in this book, but also to address new questions and phenomena arisingin the field.
For one thing, franchising is not just one form of organization – a vast arrayof forms coexist within the franchising arena, from the simplest licensed dis-tributorship to complete turn-key operations, from systems providing littlesupport to those with completely detailed and regularly updated guidelines.McDonald’s can be viewed as an example of a franchisor providing a completeturn-key package, as the original Harper system also did. Other franchisorsare much less strict in terms of details and control: Dairy Queen, for example,for a long time had a very different reputation from McDonald’s. Accordingto Brown (1981), Dairy Queen’s management “permitted an excess of freeenterprise. The 19 (sic) year patent rights to D.Q., the trademark on the for-mula and territorial franchises were sold to operators who were left to developtheir own regional stores. There was no strong centralized management toensure standardized menus or similar buildings.” In the last few years, thefounders of the Great Harvest Bread Company have embraced the conceptof what they call a “freedom franchise,” a franchise that by design gives fran-chisees much freedom in running their business.346 The company even allowsits franchisees to choose the products they want to sell, thereby going againstthe notion that product offerings need to be standardized for franchisingsuccess. The philosophy of franchisors with respect to their focus on directoperations versus franchising, territorial exclusivity, input controls, and soon also varies tremendously across systems. This is not surprising really. Afterall, franchising is used in a variety of business sectors, and some practices aremore suited to particular types of businesses than to others. Moreover, to this
346 See McMakin (2001).

P1: KaD0521772524c11.xml CB802/Blair 0 521 77252 4 April 29, 2005 21:57
11.4 The Future 299
day the majority of franchisors are private companies where the personalityof the founder or of the founding team, and their “tastes,” can affect how thebusiness is organized and its inner workings.
Experimentation also is part and parcel of the evolution of any mode oforganization, and franchising is no exception. As a business organization,franchising is evolving over time. Presumably, what works well is retainedand refined and what does not work well is discarded. As franchising changesin form, substance, scope, and character, new issues develop that demandanalysis.
For example, franchisors in recent times have developed contracting prac-tices allowing them to combine brands under a single roof.347 Co-branding,as this is called, allows for more efficient usage of real estate resources andbetter spreading of other overhead costs; in other words, it makes furthereconomies of scope possible. Though early experiments with co-brandinghave been fairly positive, just how the brands – especially if not owned bythe same franchisor – should share the costs and benefits thereby generatedis as yet to be determined. In other words, while a handful of franchisors aremoving ahead with these types of agreements, there are no clear templatesyet as to how these relationships should or will be organized.
Another important trend in franchising is reflected in the increased relianceon highly capitalized and experienced franchisees under area developmentagreements. In some sense, this represents a return toward what was fairlystandard practice in the early days of franchising. According to Love (1986),many fast-food franchisors sold large territories to developers at the time RayKroc decided to orient his effort toward owner operators only. The successof the McDonald’s system then led others to focus on small owner operators.But now the new area developers usually take on the task of opening numer-ous outlets in large territories on a very tight schedule. When successful, thisstrategy allows a franchisor to expand geographically very rapidly.348 Thisincreased tendency to rely on large area developers has two important impli-cations. First, franchising may no longer be so available to operators wantingto start and develop a small business. Second, this new breed of franchiseesoften will rival their franchisors in experience and even in financial strength.Vogel (1996) gives an example:
The background of Church’s Chicken area developer Ben Feinswog, as is typicalof area developers, isn’t the grease pit. Feinswog, whose Miami-based Restaurant
347 See Young et al. (1997) and Justis and Judd (1998), Ch. 7.348 But see Kalnius (2004a) on the low success rate of international master franchise
arrangements.

P1: KaD0521772524c11.xml CB802/Blair 0 521 77252 4 April 29, 2005 21:57
300 Concluding Remarks
Development Corp. employs 350 at its 16 Church’s in Broward and Dade coun-ties, worked for Johnson & Johnson and Citicorp in fields such as informationmanagement and systems planning. Before getting into franchising, he was inbanking. He started with the Hardee’s system and now is in Church’s thanks inpart to financing that Church’s provided.
The presence of such developers in any franchise system will inevitably alterthe nature of the franchisor–franchisee relationship as well as the relationshipamong franchisees.349
Finally, the legal landscape not only varies across jurisdictions but it alsoconstantly evolves over time. In the U.S., new state and federal legislation canalter the rights and responsibilities of franchisors and franchisees. Similarly,judicial decisions can cause significant changes in the relationship. Thus, asdescribed in Chapter 6, the strategy initially adopted by Chicken Delight, toearn income not by charging a royalty but instead by requiring franchiseesto purchase inputs exclusively from the franchisor, was found in violation ofU.S. antitrust laws. As a result of this decision, business-format franchisorsgenerally moved away from input purchase requirements toward approvedsupplier clauses and toward adopting approaches where the franchisor is avail-able as a potential, but not required, source of supplies. This same decisionalso implied that business-format franchisors would move toward franchisefees and royalties on sales as their main sources of income. Similarly, as notedin Chapter 8, disputes over territorial rights in the quick-service restaurantsector and in hotel chains have led many of the firms in these industries to in-clude much more detailed territorial definitions in their contracts. They havealso led franchisors to develop more systematic review processes for new sitesand to develop policies for allocating new units to owners of nearby outlets,thereby resolving at least part of the conflict. In industries where encroach-ment through alternative channels has been more problematic, a number offranchisors have worked on ways to channel part of the sales or profits tothe local franchisee. Others have opted to stay out of the alternative chan-nels. In all cases, the franchise contract and hence the franchisor–franchiseerelationship has been modified accordingly.
11.5 Conclusion
As mentioned above, our goal in this book has been to provide a thoroughdescription of franchising as an organizational form and economic phe-nomenon. We have used a unique data set and other sources to quantify,
349 See also Maddocks (2001) on this issue.
P1: KaD0521772524c11.xml CB802/Blair 0 521 77252 4 April 29, 2005 21:57
11.5 Conclusion 301
as much as possible, various aspects of the franchise relationship, and wehave analyzed in detail sources of friction in this relationship. Our hope isthat this work will prove useful to many different types of readers, includingthose involved in franchising or related activities, as well as those who teachor study related subjects, and researchers interested generally in how firmsorganize various activities.

P1: KaD0521772524c11.xml CB802/Blair 0 521 77252 4 April 29, 2005 21:57
302

P1: KaD0521772524bib.xml CB802/Blair 0 521 77252 4 April 30, 2005 16:18
Articles, Books, and Other Publications
Achabal, Dale D., Wilpen L. Gorr, and Vijay Mahajan. 1982. MULTILOC: A MultipleStore Location Decision Model. Journal of Retailing 58 (Summer):5–25.
Ackerberg, Daniel A. and Maristella Botticini. 2002. Endogenous Matching andthe Empirical Determinants of Contractual Form. Journal of Political Economy110:564–591.
Agrawal, Deepak and Rajiv Lal. 1995. Contractual Arrangements in Franchising: AnEmpirical Investigation. Journal of Marketing Research 32:213–221.
Akerlof, George A. 1970. The Market For ‘Lemons’: Quality Uncertainty and theMarket Mechanism. Quarterly Journal of Economics 84:488–500.
Akerlof, George A. and Janet L. Yellen. 1986. Efficiency Wage Models of the LaborMarket. New York: Cambridge University Press.
Alchian, Armen A. and Harold Demsetz. 1972. Production, Information Costs, andEconomic Organization. American Economic Review 62:777–795.
Allen, Douglas W. and Dean Lueck. 1992. Contract Choice in Modern Agriculture:Cropshare versus Cash Rent. Journal of Law and Economics 35:397–426.
Allen, Douglas W. and Dean Lueck. 1995. Risk Preferences and the Economics ofContracts. American Economic Review 85:447–451.
American Heritage Dictionary of the English Language, Fourth Edition. 2000. Boston:Houghton Mifflin Company.
Anderson, Erin and David C. Schmittlein. 1984. Integration of the Sales Force: AnEmpirical Examination. RAND Journal of Economics 15:385–395.
Anderson, Erin and Richard L. Oliver.1987. Perspectives on Behavior-Based versusOutcome-Based Salesforce-Control Systems. Journal of Marketing 51:76–88.
Areeda, Phillip. 1991. Antitrust Law, vol. IX. Boston: Little, Brown.Areeda, Phillip and Herbert Hovenkamp. 1993. Antitrust Law (Supp.), at ¶340.3 and
¶1640. Boston: Little, Brown.Areeda, Phillip and Donald Turner. 1978. Antitrust Law, vol. II. Boston: Little, Brown.Arthur Andersen & Co. 1995. Worldwide Franchising Statistics: A Study of Worldwide
Franchise Associations.Athey, Susan and Scott Stern. 1998. An Empirical Framework for Testing Theories
about Complementarities in Organizational Design. NBER Working Paper 6600.
303
P1: KaD0521772524bib.xml CB802/Blair 0 521 77252 4 April 30, 2005 16:18
304 Articles, Books, and Other Publications
Atkins, D. 1990. Affidavit in the Matter of Canterbury et al. v. Commissioner of InternalRevenue, 160 Tax Decisions and Rulings K-2 (U.S. Tax Ct. 1992).
Azevedo, Paulo Furquim and Vivian Lara Dos Santos Silva. 2001. Contractual MixAnalysis in the Brazilian Franchising. Mimeo. Sao Carlos, Brazil: Federal Universityof Sao Carlos, Spain.
Azoulay, Pierre and Scott Shane. 2001. Entrepreneurs, Contracts, and the Failure ofYoung Firms. Management Science 47:337–358.
Bai, Chong-en and Zhigang Tao. 2000. Contract Mix in Franchising. Journal of Eco-nomics & Management Strategy 9(1):85–113.
Barkoff, Rupert M. and W. Michael Garner. 1994a. Encroachment: Franchising’sEnigma. Franchise Update (2nd quarter):7–10.
Barkoff, Rupert M. and W. Michael Garner. 1994b. Encroachment: The Thorn inEvery Successful Franchisor’s Side. Annual Forum on Franchising. American BarAssociation.
Barron, John M. and John R. Umbeck. 1984. The Effects of Different ContractualArrangements: The Case of Retail Gasoline. Journal of Law and Economics 27:313–328.
Bassuk, Howard. 2000. Never Mind Encroachment, We Need More Franchisees!Brave New World or Brazen New World . . . It’s Hard to Know. ExploreBiz.net(http://explorebiz.net/articles/hb21.html).
Bates, Timothy. 1995a. A Comparison of Franchise and Independent Small BusinessSurvival Rates. Small Business Economics 7(5):377–388.
Bates, Timothy. 1995b. Analysis of Survival Rates Among Franchise and IndependentSmall Business Startups. Journal of Small Business Management 33(2):25–36.
Bates, Timothy. 1998. Survival Patterns Among Newcomers to Franchising. Journalof Business Venturing 13:113–130.
Baye, Michael R., Keith J.Crocker, and Jiandong Ju. 1996. Divisionalization, Franchis-ing, and Divestiture Incentives in Oligopoly. American Economic Review 86:223–236.
Beales, Howard and Timothy J. Muris. 1995. The Foundation of Franchise Regulation:Issues and Evidence. Journal of Corporate Finance: Contracting, Governance andOrganization 2:157–197.
Becker, Gary S. and Murphy. 1993. A Simple Theory of Advertising as a Good or Bad.The Quarterly Journal of Economics 108: 941–964.
Becker, Gary S. and George J. Stigler. 1974. Law Enforcement, Malfeasance, andCompensation of Enforcers. Journal of Legal Studies 3:1–20.
Beheler, R. L. 1991. Control in Various Organizational Forms: An Empirical Studyof Company-Owned and Franchisee-Owned Units’ Health Inspections. In J. R.Nevin, ed., Fifth Annual Proceedings of the Society of Franchising.
Bercovitz, Janet E. L. 1998a. An Analysis of Contractual Provisions in Business-Format Franchise Agreements. Mimeo, Durham, NC: Fuqua School of Business,Duke University.
Bercovitz, Janet E. L. 1998b. Franchising vs. Company Ownership. Mimeo, Durham,NC: Fuqua School of Business, Duke University.

P1: KaD0521772524bib.xml CB802/Blair 0 521 77252 4 April 30, 2005 16:18
Articles, Books, and Other Publications 305
Bhattacharyya, Sugato and Francine Lafontaine. 1995. Double-Sided Moral Hazardand the Nature of Share Contracts. RAND Journal of Economics 26:761–781.
Birkeland, Peter M. 2002. Franchising Dreams. Chicago: University of Chicago Press.Blair, Roger D. 1988. Measuring Damages for Lost Profits in Franchise Termination
Cases. Franchise Law Journal 8 (Fall):3–6, 23–27.Blair, Roger D. and Amanda K. Esquibel. 1996. Maximum Resale Price Restraints in
Franchising. Antitrust Law Journal 65:157–180.Blair, Roger D. and J. M. Fesmire. 1986. Maximum Price Fixing and the Goals of
Antitrust. Syracuse Law Review 37:43.Blair, Roger D. and Jeffrey L. Harrison. 1989. Rethinking Antitrust Injury. Vanderbilt
Law Review 42:1559–1573.Blair, Roger D. and Jill Boylston Herndon. 1996. Restraints of Trade by Durable Good
Producers. Review of Industrial Organization 11:339–353.Blair, Roger D. and Jill Boylston Herndon. 1999. The Misapplication of Kodak in
Franchise Tying Suits. Journal of Business Venturing 14:397–415.Blair, Roger D. and David L. Kaserman. 1978. Vertical Integration, Tying, and
Antitrust Policy. American Economic Review 68:397–402.Blair, Roger D. and David L. Kaserman. 1980. Vertical Control with Variable
Proportions: Ownership Integration and Contractual Equivalents. Southern Eco-nomic Journal 47:1118–1128.
Blair, Roger D. and David L. Kaserman. 1981. The Albrecht Rule and ConsumerWelfare: An Economic Analysis. University of Florida Law Review 33:461.
Blair, Roger D. and David L. Kaserman. 1982. Optimal Franchising. Southern Eco-nomic Journal 494–504.
Blair, Roger D. and David L. Kaserman. 1983. Law and Economics of Vertical Integrationand Control. Orlando, FL: Academic Press, Inc.
Blair, Roger D. and David L. Kaserman. 1985 Antitrust Economics. Homewood, IL:Richard D. Irwin Publishing.
Blair, Roger D. and David L. Kaserman. 1994. A Note on Incentive Incompatibilityunder Franchising. Review of Industrial Organization 9:323–330.
Blair, Roger D. and Lawrence W. Kenny. 1982. Microeconomics for Managerial DecisionMaking. New York: McGraw-Hill.
Blair, Roger D. and Francine Lafontaine. 1999. Will Khan Foster or HinderFranchising? An Economic Analysis of Maximum Resale Price Maintenance. Jour-nal of Public Policy in Marketing 18:25–36.
Blair, Roger D. and Gordon L. Lang. 1991. Albrecht After ARCO; Maximum ResalePrice Fixing Moves Toward the Rule of Reason. Vanderbilt Law Review 44:1007–1039.
Blair, Roger D. and John E. Lopatka. 1998. Albrecht Overruled – At Last. AntitrustLaw Journal 66:537–566.
Bond, Robert E. Various years. Bond’s Franchise Guide. Oakland, CA: Source BookPublications.
Bond, Robert E. Various years. The Source Book of Franchise Opportunities. RichardD. Irwin Publishing.

P1: KaD0521772524bib.xml CB802/Blair 0 521 77252 4 April 30, 2005 16:18
306 Articles, Books, and Other Publications
Bradach, Jeffrey L. 1995. Chains Within Chains: The Role of Multi-Unit Franchisees.Journal of Marketing Channels 4:65–81.
Bradach, Jeffrey L. 1997. Using the Plural Form in the Management of RestaurantChains. Administrative Science Quarterly 42:276–303.
Bradach, Jeffrey L. 1998. Franchise Organizations. Boston: Harvard Business SchoolPress.
Bradach, Jeffrey L. and Patrick J. Kaufmann. 1988. “Franchisee or IndependentBusinessperson: Some Observations on the Decision Process.” In Research atthe Marketing/Entrepreneurship Interface, G. E. Hills and W. Laforge, eds. 38–48.Chicago: University of Illinois at Chicago.
Brickley, James A. 1999. Incentive Conflicts and Contracting: Evidence from Fran-chising. Journal of Law and Economics 42:745–774.
Brickley, James A. 2001. Evidence of Life-Cycle Pricing in Franchise Contracts. Mimeo.Rochester, NY: Simon School of Business, University of Rochester.
Brickley, James A. 2002. Royalty Rates and Franchise Fees in Share Contracts: Evidencefrom Franchising. Journal of Law, Economics, and Organization. 18:511–535.
Brickley, James A., Sanjog Misra, and R. Lawrence Van Horn. 2003. Contract Duration:Evidence from Franchise Contracts. Mimeo. Rochester, NY: Simon School of Busi-ness, University of Rochester.
Brickley, James A. and Frederick H.Dark. 1987. The Choice of Organizational Form:The Case of Franchising. Journal of Financial Economics 18:401–420.
Brickley, James A., Frederick H.Dark, and Michael S.Weisbach. 1991a. An AgencyPerspective on Franchising. Financial Management 20:27–35.
Brickley, James A., Frederick H.Dark, and Michael S.Weisbach. 1991b. The EconomicEffects of Franchise Termination Laws. Journal of Law and Economics 34:101–132.
Brown, H. 1971. Franchising – A Fiduciary Relationship. Texas Law Review 49:650–675.
Brown, Paul R. 1981. Mom-and-Pop Don’t Read Memos. Forbes September 28:94–96.Bureau of Economic Analysis, National Economic Accounts (http://www.bea.doc.
gov/bea/dn1.htm).Bureau of Labor Statistics, U.S. Department of Labor, Consumer Price Index, All
Urban Consumers – CPI-U, U.S. City Average, All Items (ftp://ftp.bls.gov/pub/special.requests/cpi/cpiai.txt).
Burnstein, M. L. 1960. The Economics of Tie-In Sales. Review of Economics andStatistics 42:68–73.
Carlton, Dennis W. and Jeffrey M. Perloff. 2000. Modern Industrial Organization.Addison Wesley, 3rd edition.
Carmichael, H. Lorne. 1983. The Agent-Agent’s Problem: Payment by Relative Output.Journal of Labor Economics 1:50–65.
Carney, Mick and Eric Gedajlovic. 1991. Vertical Integration in Franchise Systems:Agency Theory and Resource Explanations. Strategic Management Journal 12:607–629.
Caves, Richard E. and William F. Murphy. 1976. Franchising: Firms, Markets, andIntangible Assets. Southern Economic Journal 42:572–586.
Coase, Ronald H. 1937. The Nature of the Firm. Economica 4:386–405.
P1: KaD0521772524bib.xml CB802/Blair 0 521 77252 4 April 30, 2005 16:18
Articles, Books, and Other Publications 307
Coase, Ronald H. 1972. Durability and Monopoly. Journal of Law and Economics15:143–149.
Cohen, Jane and Ryan Fehlig. 2001. Encroachment: The Hannibal Lecter of Franchis-ing. St. Louis Bar Journal (March).
Cohn, Stuart R. 1998. Deception Condoned: Pre-Contract Misrepresentations andthe Parole Evidence Rule, in Francine Lafontaine, ed., Twelfth Annual Proceedingsof the International Society of Franchising.
Coughlan, Anne T. 1985. Competition and Cooperation in Marketing ChannelChoice: Theory and Application. Marketing Science 4:110–129.
Dant, Rajiv P. and Paul D. Berger. 1996. Modeling Cooperative Advertising Decisionsin Franchising. The Journal of the Operational Research Society 47:1120–1136.
Dant, Rajiv P., Patrick J.Kaufmann, and Audhesh K.Paswan. 1992. Ownership Redi-rection in Franchised Channels. Journal of Public Policy and Marketing 11:33–44.
David B. Green, McDonald’s Senior Vice President for Marketing, 1993 testimony,http://www.mcspotlight.org/people/witnesses/advertising/green.html.
David McKinnon. Chairman and CEO, Service Brands International. 2002. Paneldiscussion, Entrepalooza 2002, University of Michigan Business School.
Dicke, Thomas S. 1992. Franchising in the America: The Development of a BusinessMethod, 1840–1980. Chapel Hill, NC: University of North Carolina Press.
Dienelt, John F. 1998. Fourth Circuit Reverses $390 Million Meineke Judgment. TheFranchise Lawyer, 1–3.
Dixit, Avinash K. and Victor Norman. 1978. Advertising and Welfare, Bell Journal ofEconomics 9:1–11.
Dnes, Antony W. 1992a. Franchising: A Case-Study Approach. Aldershot, England:Ashgate Publishing Ltd.
Dnes, Antony W. 1992b. ‘Unfair’ Contractual Practices and Hostages in FranchiseContracts. Journal of Institutional and Theoretical Economics 148:484–504.
Dnes, Antony W. 1993. A Case Study Analysis of Franchise Contracts. Journal of LegalStudies 22:367–393.
Dnes, Antony W. 1996. The Economic Analysis of Franchise Contracts. Journal ofInstitutional and Theoretical Economics 152:297–324.
Dnes, Anthony and Nuno Garoupa. 2005. Externality and Organizational Choice inFranchising.Journal of Economics and Business forthcoming.
Doctor’s Associate “Subway Franchise Agreement.” Uniform Franchise OfferingCircular, 2002.
Dorfman, Robert and Peter O. Steiner. 1954. Optimal Advertising and Optimal Qual-ity. American Economics Review 44:826–836.
Easterbrook, F. 1981. Maximum Price Fixing. University of Chicago Law Review 48:886.Eaton, B. Curtis and Richard G. Lipsey. 1979. The Theory of Market Pre-emption:
The Persistence of Excess Capacity and Monopoly in Growing Spatial Markets.Economica 46:149–158.
Eaton, Richard. 1980. State Regulation of Franchise and Dealership Terminations: AnOverview. Antitrust Law Journal 49:1331–1350.
Eckard, E. W. Jr. 1985. The Effects of State Automobile Dealer Entry Regulation onNew Car Prices. Economic Inquiry 24:226.

P1: KaD0521772524bib.xml CB802/Blair 0 521 77252 4 April 30, 2005 16:18
308 Articles, Books, and Other Publications
Elango, B. and V. H. Fried. 1997. Franchising Research: A Literature Review andSynthesis. Journal of Small Business Management 35:68–82.
Engel, Eduardo MRA, Ronald D. Fisher, and Alexander Galetovic. 2001. Least-Present-Value-of-Revenue Auctions and Highway Franchising. Journal of Political Economy109:993–1020.
Entrepreneur. Franchise 500. Various years.Eswaran, Mukesh and Ashok Kotwal. 1985. A Theory of Contractual Structure in
Agriculture. American Economic Review 75:352–367.European Commission. 2002. Competition Policy in Europe: The Competition Rules for
Supply and Distribution Agreements. Luxembourg: Office for Official Publicationsof the European Communities.
Federation Francaise de la Franchise. 2003. Toute la Franchise: Les Textes, les Chiffres,les Reseaux. Paris: Federation Francaise de la Franchise.
Fieldstone, Ronald R. 1998. Franchise Encroachment Law. Franchise Law Journal(Winter).
Flaherty, Julie. 2001. By the Book: Individuality vs. Franchising. New York Times(Feb. 17).
Flohr, Eckhard. 2000. Franchise Law – The Concrete Effects of the New EuropeanRegulation on Contract Design and Contract Practice in Franchising. Dusseldorf.http://www.cgla.org/canada/documents/franchlaw.htm.
Franchise Annual. Various Years. Lewiston NY: Info Franchise News Inc.Franchise Times. 1996. Growth Forecast for 1996. Vol. 2 no. 2 p. 3 Chicago, IL: Crain
Communications Inc.Franchise Times. Various Years. Monitor 200. Roseville, MN: Franchise Times Corpo-
ration.Frazer, Lorelle. 1998. Motivations for Franchisors to Use Flat Continuing Franchise
Fees. The Journal of Consumer Marketing 15:587–596.Frazer, Lorelle. 2001. Why Franchisors Discontinue Franchising but Continue Oper-
ating. International Small Business Journal 19:29–38.Gagne, Robert, Simon Pierre Sigue, and Georges Zaccour. 1998. Droit d’Entree et Taux
de Redevance dans les Franchises d’Exploitation au Quebec. L’Actualite Economique74:651–668.
Gallini, Nancy T. and Nancy A.Lutz. 1992. Dual Distribution and Royalty Fees inFranchising. Journal of Law, Economics, & Organization 8:471–501.
Gal-Or, Esther. 1991. Optimal Franchising in Oligopolistic Markets with UncertainDemand. International Journal of Industrial Organization 9:343–364.
Gal-Or, Esther. 1995. Maintaining Quality Standards in Franchise Chains. Manage-ment Science 41:1774–1792.
Garner, W. Michael. 2002. Franchise and Distribution Law and Practice. ThompsonWest.
Garrod, Peter and Walter Miklius. 1987. Accounting for Mortality of Business Firmsin the Estimation of Lost Profits. Mimeo.
Gertner, Robert H. and Robert S. Stillman. 2001. Vertical Integration and InternetStrategies in the Apparel Industry. Journal of Industrial Economics 49:417–440.

P1: KaD0521772524bib.xml CB802/Blair 0 521 77252 4 April 30, 2005 16:18
Articles, Books, and Other Publications 309
Gibson, Richard. 1998. McDonald’s Problems in Kitchen Don’t Dim the Lure ofFranchises. Wall Street Journal, June 3:A1.
Ghosh, Avijit and C. Samuel Craig. 1991. FRANSYS: A Franchise Distribution Loca-tion Model. Journal of Retailing 67:466–495.
Goldberg, Jeffrey D. 1983. A Transaction Costs Analysis of Franchising withEmpirical Applications to the Restaurant Industry. Ph.D. Dissertation, Universityof Pennsylvania.
Goldstein Law Group. 2003. Arbitration Panel Finds That Block Franchisees Harmedby Block’s Internet Tax Preparation Activities May Have Claims for DamagesAgainst Block. Goldstein Law Group Press Release, January 16. www.goldlawgroup.com/release/pr011603.html.
Graddy, Kathryn. 1997. Do Fast-Food Chains Price Discriminate on the Race andIncome Characteristics of an Area. Journal of Business and Economic Statistics15:391–401.
Greenhut, M. L. and H.Ohta. 1979. Vertical Integration of Successive Oligopolies.American Economic Review 69:137–141.
Grimes, Warren S. 1996. When Do Franchisors Have Market Power? Antitrust Reme-dies For Franchisor Opportunism. Antitrust Law Journal 65:105–155.
Grossman, Sanford J. and Oliver D. Hart. 1986. The Costs and Benefits of Ownership:A Theory of Vertical and Lateral Integration. Journal of Political Economy 94:691–719.
Gupta, Srabana and Richard Romano. 1998. Monitoring the Principal with MultipleAgents. RAND Journal of Economics 29:427–442.
Hadfield, Gillian K. 1990. Problematic Relations: Franchising and the Law of Incom-plete Contracts. Stanford Law Review 42:927–992.
Hadfield, Gillian K. 1991. Credible Spatial Preemption Through Franchising. RANDJournal of Economics 22:531–543.
Harman, Kathryn Lea. 1998. Comment, The Good Faith Gamble in FranchiseAgreements: Does Your Implied Covenant Trump My Express Term? CumberlandLaw Review 28:473.
Hellriegel, John E. Sr. and William Slater Vincent. 2000. The Encroachment Hand-book: The Problem, the History, the Solution, in Audhesh K. Paswan, ed., FourteenthAnnual Proceedings of the International Society of Franchising.
Holmberg, C. and K. Boe Morgan. 1996. The Franchise Failure Continuum in AnnDugan, ed., Tenth Annual Proceedings of the Society of Franchising.
Holmstrom, Bengt. 1979. Moral Hazard and Observability. Bell Journal of Economics10:74–91.
Holmstrom, Bengt. 1982. Moral Hazard in Teams. Bell Journal of Economics 13:324–340.
Holmstrom, Bengt and Paul Milgrom. 1987. Aggregation and Linearity in the Provi-sion of Intertemporal Incentives. Econometrica 55:303–328.
Holmstrom, Bengt and Paul Milgrom 1991. Multitask Principal-Agent Analyses: In-centive Contracts, Asset Ownership, and Job Design. Journal of Law, Economics,and Organization 7:24–51.
P1: KaD0521772524bib.xml CB802/Blair 0 521 77252 4 April 30, 2005 16:18
310 Articles, Books, and Other Publications
Holmstrom, Bengt and Paul Milgrom. 1994. The Firm as an Incentive System. Amer-ican Economic Review 84:972–991.
Hotelling, Harold. 1929. Stability in Competition. Economic Journal 39:41–57.Hovenkamp, Herbert. 1999. Federal Antitrust Policy: The Law of Competition and Its
Practice St. Paul, MN: West Publishing Group.Hoy, Frank and John Stanworth, Eds. 2002. Franchising: An International Perspective.
London: Routledge.Hunt, Shelby D. 1972. The Socioeconomic Consequences of the Franchise System of
Distribution. Journal of Marketing 36:32–38.Hunt, Shelby D. 1973. The Trend Toward Company-Operated Units in Franchise
Chains. Journal of Retailing 49:3–12.Hunt, Shelby D. and John R. Nevin. 1974. Power in a Channel of Distribution: Sources
and Consequences. Journal of Marketing Research 11:186–193.Hunt, Shelby D. and John R. Nevin. 1975. Tying Agreements in Franchising. Journal
of Marketing 39:20–26.IFA. Various years. Franchise Opportunities Guide. Washington, DC: IFA.IFA Educational Foundation. 2002. Multi Unit Owner Study. Washington, DC: IFA.IFA Educational Foundation and Arthur Andersen. 1992. Franchising in the Economy,
1989–1992. Washington, DC: IFA.IFA Educational Foundation and Frandata Corp. 1998–2000. The Profile of Franchis-
ing, Volumes I, II and III. Washington, DC: IFA.IFA Educational Foundation and Price Waterhouse Coopers 2004. Economic Impact
of Franchised Businesses.John, George and Barton A. Weitz. 1988. Forward Integration into Distribution:
An Empirical Test of Transaction Cost Analysis. Journal of Law, Economics, andOrganization 4:337–355.
Johnson, Tim. 1998. Revitalization of the Mom & Pop’s. Franchise Times 5(2)(February):16–17.
Joskow, Paul. 1988. Asset Specificity and the Structure of Vertical Relationships:Empirical Evidence. Journal of Law, Economics, and Organization 4:95–117.
Justis, Robert T. and Richard J. Judd. 1998. Franchising. Houston, TX: DamePublications.
Kalnins, Arturs. 2003. Hamburger Prices and Spatial Econometrics. Journal ofEconomics and Management Strategy 12:591–616.
Kalnins, Arturs. 2004a. Development Commitments, Overestimation and Ven-ture Performance: Evidence from International Master Franchising ContractAnnouncements. Mimeo, Marshall School of Business, University of SouthernCalifornia.
Kalnins, Arturs. 2004b. An Empirical Analysis of Territorial Encroachment withinFranchised and Company-owned Branded Chains. Marketing Science 23:476–489.
Kalnins, Arturs and Francine Lafontaine. 2004. Multi-Unit Ownership in Franchising:Evidence from the Fast-Food Industry in Texas. RAND Journal of Economics, 35:
Kanouse, K. 2000. Collective Negotiation of Franchise Agreements. http://www.kanouse.com/collneg.htm.

P1: KaD0521772524bib.xml CB802/Blair 0 521 77252 4 April 30, 2005 16:18
Articles, Books, and Other Publications 311
Katz, Michael L. 1989. Vertical Contractual Relations. In R. Schmalensee and R. Willig,eds., Handbook of Industrial Organization. New York: Elsevier Science Publishers.
Kaufmann, David J. 1992. An Introduction to Franchising and Franchise Law. InFranchising 1992, Business and Legal Issues, Commercial Law and Practice CourseHandbook Series, no. 603, Practicing Law Institute, New York, NY.
Kaufmann, Patrick J. and Rajiv P.Dant. 1996. Multi-Unit Franchising: Growth andManagement Issues. Journal of Business Venturing 11:343–358.
Kaufmann, Patrick J. and Rajiv P.Dant. 2001. The Pricing of Franchise Rights. Journalof Retailing 77:537–545.
Kaufmann, Patrick J., Naveen Donthu, and Charles M. Brooks. 2000. Multi-UnitRetail Site Selection Processes: Incorporating Opening Delays and UnidentifiedCompetition. Journal of Retailing 76(1):113–127.
Kaufmann, Patrick J. and Sevgin Eroglu. 1998. Standardization and Adaptation inBusiness Format Franchising. Journal of Business Venturing 14:69–95.
Kaufmann, Patrick J. and Sang Hyeon Kim. 1995. Master Franchising and SystemGrowth Rates. Journal of Marketing Channels 4:49–64.
Kaufmann, Patrick J. and Francine Lafontaine. 1994. Costs of Control: The Sourceof Economic Rents for McDonald’s Franchisees. Journal of Law and Economics37:417–454.
Kaufmann, Patrick J. and V. Kasturi Rangan. 1990. A Model for Managing SystemConflict During Franchising Expansion. Journal of Retailing 66:155–173.
Kaufmann, Patrick J. and John Stanworth. 1995. The Decision to Purchase a Franchise:A Study of Prospective Franchisees. Journal of Small Business Management 33:22–33.
Kehoe, Michael R. 1996. Franchising, Agency Problems, and the Cost of Capital.Applied Economics 28:1485–1493.
Kennedy, Peter. 2003. A Guide to Econometrics fifth edition. Cambridge, MA: MITPress.
Killion, William and Brian B. Schnell. 1997. Franchisors as Fiduciaries in HandlingMarketing Dollars: Whose Money Is It Anyway? Franchise Law Journal 17:37,52–60.
Kirby, D. A. and A. Watson. 1999. Franchising as a Strategy for Growth: The Case ofthe Construction Industry. In Stanworth J. and D. Purdy, eds., Thirteenth AnnualProceedings of the International Society of Franchising.
Klein, Benjamin.1980. Transaction Cost Determinants of ‘Unfair’ ContractualArrangements. American Economic Review 70:356–362.
Klein, Benjamin. 1995. The Economics of Franchise Contracts. Journal of CorporateFinance 2:9–37.
Klein, Benjamin. 1999. Market Power in Franchise Cases in the Wake of Kodak:Applying Post Contract Hold-Up Analysis to Vertical Relationships. Antitrust LawJournal 67:283–326.
Klein, Benjamin, Robert G. Crawford, and Armen A. Alchian. 1978. Vertical Integra-tion, Appropriable Rents, and the Competitive Contracting Process. Journal of Lawand Economics 21:297–326.
P1: KaD0521772524bib.xml CB802/Blair 0 521 77252 4 April 30, 2005 16:18
312 Articles, Books, and Other Publications
Klein, Benjamin and Keith Leffler. 1981. The Role of Market Forces in AssuringContractual Performance. Journal of Political Economy 89:615–641.
Klein, Benjamin and Kevin M. Murphy. 1988. Vertical Restraints as Contract Enforce-ment Mechanisms. Journal of Law and Economics 31:265–297.
Klein, Benjamin and Lester F. Saft. 1985. The Law and Economics of Franchise TyingContracts. Journal of Law and Economics 28:345–361.
Kmenta, Jan. 1986. Elements of Econometrics (2nd ed.). New York: Macmillan.Knight, Frank. 1921. Risk, Uncertainty, and Profit. Chicago: Houghton Mifflin.Knox, D. M. 1958. The Development of the Tied House System in London. Oxford
Economic Papers 10:66–83.Knight, Russell M. 1986. Franchising from the Franchisor and Franchisee Points of
View. Journal of Small Business Management 24:8–15.Kolton, Jeffrey E. 1992. The FranData Franchise Termination Report. Info Franchise
Newsletter (August).Krattenmaker, Thomas G., Robert H. Lande, and Steven C. Salop. 1987. Monopoly
Power and Market Power in Antitrust Law. Georgetown Law Journal 76:241–269.
Kroc, Ray. 1977. Grinding It Out: The Making of McDonald’s. New York: St. Martin’sPress.
Krueger, Alan B. 1991. Ownership, Agency and Wages: An Examination of the FastFood Industry. Quarterly Journal of Economics 106:75–101.
Lafontaine, Francine. 1992a. Agency Theory and Franchising: Some Empirical Results.RAND Journal of Economics 23:263–283.
Lafontaine, Francine. 1992b. How and Why do Franchisors do What They do: ASurvey Report. In P. J. Kaufmann, ed., Sixth Annual Proceedings of the Society ofFranchising.
Lafontaine, Francine. 1993. Contractual Arrangements as Signaling Devices: Ev-idence from Franchising. Journal of Law, Economics, and Organization 9:256–289.
Lafontaine, Francine. 1995a. A Critical Look at Data Sources in Franchising. Journalof Marketing Channels 4:5–25.
Lafontaine, Francine. 1995b. “Pricing Decisions in Franchised Chains: A Look at theFast-Food Industry.” NBER Working Paper #5247.
Lafontaine, Francine. 1999. Franchising vs. Corporate Ownership: The Effect on PriceDispersion. Journal of Business Venturing 14:17–34.
Lafontaine, Francine and Sugato Bhattacharyya. 1995. The Role of Risk in Franchising.Journal of Corporate Finance 2:39–74.
Lafontaine, Francine and Patrick J. Kaufmann. 1994. The Evolution of OwnershipPatterns in Franchise Systems. Journal of Retailing 70:97–113.
Lafontaine, Francine and Joanne Oxley. 2004. International Franchising Practicesin Mexico: Do Franchisors Customize their Contracts? Journal of Economics andManagement Strategy 13:95–124.
Lafontaine, Francine and Emmanuel Raynaud. 2002. Residual Claims and SelfEnforcement as Incentive Mechanisms in Franchise Contracts: Substitute orComplements. In The Economics of Contracts: Theory and Applications, Eric

P1: KaD0521772524bib.xml CB802/Blair 0 521 77252 4 April 30, 2005 16:18
Articles, Books, and Other Publications 313
Brousseau and Jean Michel Glachant, Eds. Cambridge: Cambridge UniversityPress.
Lafontaine, Francine and Kathryn L.Shaw. 1998. Franchising Growth and FranchisorEntry and Exit in the U.S. Market: Myth and Reality. Journal of Business Venturing13:95–112.
Lafontaine, Francine and Kathryn L. Shaw. 1999. The Dynamics of FranchiseContracting: Evidence from Panel Data. Journal of Political Economy 107:1041–1080.
Lafontaine, Francine and Kathryn L.Shaw. Forthcoming. Targetting ManagerialControl: Evidence from Franchising.RAND Journal of Economics.
Lafontaine, Francine and Margaret E. Slade. 1996. Retail Contracting and CostlyMonitoring: Theory and Evidence. European Economic Review 40:923–932.
Lafontaine, Francine and Margaret E. Slade. 1997. Retail Contracting: Theory andPractice. Journal of Industrial Economics 45:1–25.
Lafontaine, Francine and Margaret E. Slade. 2001. Incentive Contracting and theFranchise Decision. In K. Chatterjee and W. Samuelson, Eds. Game Theory andBusiness Applications of Game Theory, Boston, MA: Kluwer Academic Press.
Lal, Rajiv 1990. Improving Channel Coordination through Franchising. MarketingScience 9:299–318.
Landes, William and Richard Posner. 1981. Market Power in Antitrust Cases. HarvardLaw Review 94:937–996.
Lazear, Edward P. 2000. Performance Pay and Productivity. American Economic Review90:1346–1361.
Lerner, Abba. 1934. The Concept of Monopoly and the Measurement of MonopolyPower. Review of Economic Studies 1:157–175.
Lewin, Shira. 1998. Autonomy, Contractibility, and the Franchise Relationship.Mimeo, University of Cambridge.
Lewis, Matt. 2003. Asymmetric Price Adjustment and Consumer Search: An Exam-ination of the Retail Gasoline Market. Mimeo. University of California, Berkeley,Dept. of Economics.
Lillis, Charles M., Chem L. Narayan, and John L. Gilman. 1976. Competitive Advan-tage Variation Over the Life Cycle of a Franchise. Journal of Marketing 40:77–80.
LNA/Media Watch, Various Years, Ad $ Summary, New York: Competitive MediaReporting (CMR).
Love, John F. 1986. McDonald’s: Behind the Arches. New York: Bantam Books, Inc.Lowell, H. B. 1991. Multiple-Unit Franchising: The Key to Rapid System Growth, Brown-
stein Zeidman and Schomer, Washington, D.C.Lutz, Nancy A. 1995. Ownership Rights and Incentives in Franchising. Journal of
Corporate Finance 2:103–130.Luxenberg, Stan. 1985. Roadside Empires: How the Chains Franchised America. New
York: Penguin Books.Lyons, Bruce R. 1996. Empirical Relevance of Efficient Contract Theory: Inter-Firm
Contracts. Oxford Review of Economic Policy 12:27–52.Machlup, Fritz and Martha Taber. 1960. Bilateral Monopoly, Successive Monopoly,
and Vertical Integration. Economica 27:101–119.

P1: KaD0521772524bib.xml CB802/Blair 0 521 77252 4 April 30, 2005 16:18
314 Articles, Books, and Other Publications
Maddocks, Tom. 2001. Buying in Bulk. Entrepreneur (September).Makar, Scott. 1988. In Defense of Franchisors: The Law and Economics of Franchise
Quality Assurance Mechanisms. Villanova Law Review 33:721–766.Maness, Robert. 1996. Incomplete Contracts and the Choice Between Vertical Inte-
gration and Franchising. Journal of Economic Behavior and Organization 31:101–115.
Martin, Robert E. 1988. Franchising and Risk Management. American Economic Re-view 78:954–968.
Marvel, Howard. 1995. Tying, Franchising, and Gasoline Service Stations. Journal ofCorporate Finance 2:199–225.
Marx, Thomas G. 1985. The Development of the Franchise Distribution System inthe U.S. Automobile Industry. Business History Review 59:465–474.
Masten, Scott E. 1998. Contractual Choice. Encyclopaedia of Law & Economics. B.Boukaert and G. De Geest, Eds., Edward Elgar Publishing.
Mathewson, Frank and Ralph Winter. 1985. The Economics of Franchise Contracts.Journal of Law and Economics 28:503–526.
Mathewson, Frank and Ralph Winter. 1994. Territorial Restrictions in Franchise Con-tracts. Economic Inquiry 32:181–192.
Mazzeo, Michael J. 2002. Product Choice and Oligopoly Market Structure. RANDJournal of Economics 33:1–22.
Mazzeo, Michael, J. 2004. Retail Contracting and Organizational Form: Alternativesto Chain Affiliation in the Motel Industry. Journal of Economics and ManagementStrategy 13:599–616.
McAfee, R. Preston and Marius Schwartz. 1994. Opportunism in Multilateral VerticalContracting: Nondiscrimination, Exclusivity, and Uniformity. American EconomicReview 84:210–230.
McDonald’s Corporation. 2003. Franchise Agreement. Uniform Franchise OfferingCircular.
McMakin, Tom. 2001. Bread and Butter. New York: St. Martin’s Press.Mendelsohn, Martin, ed. 2003. International Encyclopaedia of Franchising Law.
Richmond: Richmond Law & Tax.Michael, Steven C. 1999. Do Franchised Chains Advertise Enough? Journal of Retailing
75:461–478.Michael, Steven C. 2000a. The Effect of Organizational Form on Quality: The Case
of Franchising. Journal of Economic Behavior & Organization 43:295–318.Michael, Steven. C. 2000b. The Extent, Motivation, and Effect of Tying in Franchise
Contracts. Managerial and Decision Economics 21:191–201.Michael, Steven C. and Hollie J. Moore. 1995. Returns to Franchising. Journal of
Corporate Finance 2:133–156.Milgrom, Paul and John Roberts. 1992. Economics, Organization and Management.
Englewoods Cliffs, NJ: Prentice-Hall.Minkler, Alanson. 1990. An Empirical Analysis of a Firm’s Decision to Franchise.
Economics Letters 34:77–82.Minkler, Alanson and Timothy A. Park. 1994. Asset Specificity and Vertical Integra-
tion. Review of Industrial Organization 9:409–423.
P1: KaD0521772524bib.xml CB802/Blair 0 521 77252 4 April 30, 2005 16:18
Articles, Books, and Other Publications 315
Muris, Timothy J., David T. Scheffman, and Pablo T. Spiller. 1992. Strategy andTransaction Costs: The Organization of Distribution in the Carbonated Soft DrinkIndustry. Journal of Economics & Management Strategy 1:83–128.
Murphy, Lee H. 2000. Close Quarters Irk Franchisees. Crain’s Chicago Business23(25).
Naisbitt Group, The. 1989. The Future of Franchising- Looking 25 Years Ahead to theYear 2010. Washington, DC: International Franchise Association.
Noll, Roger G. and Andrew Zimbalist. 1997. Sports, Jobs, and Taxes: The EconomicImpact of Sports Teams and Stadiums. Washington, DC: Brookings Institution Press.
Noren, D. L. 1990. The Economics of the Golden Arches: A Case Study of theMcDonald’s System. The American Economist 34:60–64.
Norton, Seth W. 1988. An Empirical Look at Franchising as an Organizational Form.Journal of Business 61:197–217.
O’Donnell, Thomas. 1984. No Entrepreneurs Need Apply. Forbes 134(13):124–130.Oxenfeldt, Alfred R. and Anthony O. Kelly. 1969. Will Successful Franchise Systems
Ultimately Become Wholly-Owned Chains? Journal of Retailing 44:69–87.Ozanne, Urban B. and Shelby D. Hunt. 1971. The Economic Effect of Franchising.
Washington, DC: GPO Select Committee on Small Business (U.S. Senate, 92ndCongress).
Pashigian, B. Peter. 1961. The Distribution of Automobiles: An Economic Analysis of theFranchising System. Englewoods Cliffs, NJ: Prentice-Hall.
Pashigian, B. Peter and Eric D. Gould. 1998. Internalizing Externalities: The Pricingof Space in Shopping Malls. Journal of Law and Economics 41:115–142.
Penard, Thierry, Emmanuel Raynaud, and Stephane Saussier. 2003. Dual Distributionand Royalty Rates in Franchised Chains: An Empirical Exploration Using FrenchData. Journal of Marketing Channels 10:5–31.
Perrigot, Rozenn. 2004. Le choix des reseaux de points de vente: Une approche parl’ecologie des populations et les analyses de survie. These doctorale, Universite deRennes 1, France.
Pindyck, Robert S. and Daniel Rubinfield. 2001. Microeconomics, 5th ed. Upper SaddleRiver, NJ: Prentice-Hall.
Pitegoff, Thomas M. 1989. Franchise Relationship Laws: A Minefield for Franchisors.Business Law 45:289.
Plitt, Jane R. 2000. Martha Mathilda Harper and the American Dream. New York:Syracuse University Press.
Prager, Robin A. 1990. Firm Behavior in Franchise Monopoly Markets. RAND Journalof Economics 21:211–225.
Prendergast, Canice. 2002. The Tenuous Trade-Off Between Risk and Incentives.Journal of Political Economy 110:1071–1102.
Prewitt, Milford. 1998. Ruby Tuesday Franchise Plan Offers Buy-Back Guarantee.Nation’s Restaurant News 32(9):10, 130.
Prewitt, Milford. 2003. Encroachment ‘Battlefield’ Now More Peaceful. Nation’sRestaurant News 37:1, 43+.
Purdy, D., J. Stanworth, and M. Hatcliffe. 1996. Franchising in Figures. Lloyds BankPlc/IFRC Franchising in Britain Report 1(2).

P1: KaD0521772524bib.xml CB802/Blair 0 521 77252 4 April 30, 2005 16:18
316 Articles, Books, and Other Publications
Rao, Ram C. and Shubashri Srinivasan. 1995. Why are Royalty Rates Higher in Service-Type Franchises. Journal of Economics & Management Strategy 4:7–31.
Reid, Joseph D. Jr. 1973. Sharecropping as an Understandable Market Response: ThePost-Bellum South. Journal of Economic History 33:106–130.
Rey, Patrick and Joseph E. Stiglitz. 1995. The Role of Exclusive Territories in Producers’Competition. RAND Journal of Economics 26:431–451.
Rey, Patrick and Jean Tirole. A Primer on Foreclosure. Handbook of Industrial Orga-nization. Forthcoming.
Romano, Richard E. 1994. Double Moral Hazard and Resale Price Maintenance.RAND Journal of Economics 25:455–466.
Rubin, Paul. 1978. The Theory of the Firm and the Structure of the Franchise Contract.Journal of Law and Economics 21:223–233.
Rysman, Marc. 2001. How Many Franchises in a Market? International Journal ofIndustrial Organization, 519–542.
Salvaneschi, Luigi. 1996. Location, Location, Location: How to Select the Best Site forYour Business. Portland, OR: Psi Successful Business Library, Oasis Press.
Sass, Tim R. and David S. Saurman. 1993. Mandated Exclusive Territories and Eco-nomic Efficiency: An Empirical Analysis of the Malt-Beverage Industry. Journal ofLaw and Economics 36:153.
Sass, Tim R. and David S. Saurman. 1996. Efficiency Effects of Exclusive Territories:Evidence from the Indiana Beer Market. Economic Inquiry 34:597.
Sasser, W. Earl and Samuel H. Pettway. 1974. Case of Big Mac’s Pay Plans. HarvardBusiness Review 52:30–46, 156–158.
Schmalensee, Richard. 1982. Product Differentiation Advantages of PioneeringBrands. American Economic Review 72:349.
Schmidt, Torsten. 1994. An Analysis of Intrabrand Competition in the FranchiseIndustry. Review of Industrial Organization 9:293–310.
Scott, Frank A. 1995. Franchising vs. Company Ownership as a Decision Variable ofthe Firm. Review of Industrial Organization 10:69–81.
Seaton, Jonathan S. 2003. An Analysis of UK Franchise Contracting 1989–1999. Man-agerial and Decision Economics 24:25–34.
Seid, Michael H. 1988. Letter. The Info Franchise Newsletter. 12(9):2–3.Seltz, David D. 1981. The Complete Handbook of Franchising. New York: Addison-
Wesley Publishing Co.Sen, Kabir C. 1993. The Use of Initial Fees and Royalties in Business Format Fran-
chising. Managerial and Decision Economics 14:175–190.Sen, Kabir C. 1995. Advertising Fees in the Franchised Channel. Journal of Marketing
Channels 4(1–2):83–101.Shane, Scott A. 1996. Hybrid Organizational Arrangements and Their Implications for
Firm Growth and Survival: A Study of New Franchisors. Academy of ManagementJournal 39:216–234.
Shane, Scott A. 2001. Organizational Incentives and Organizational Mortality. Orga-nization Science 12:136–160.
Shapiro, Carl and Joseph E. Stiglitz. 1984. Equilibrium Unemployment as a WorkerDiscipline Device. American Economic Review 74:433–444.

P1: KaD0521772524bib.xml CB802/Blair 0 521 77252 4 April 30, 2005 16:18
Articles, Books, and Other Publications 317
Shelton, John P. 1967. Allocative Efficiency vs. ‘X-Efficiency’: Comment. AmericanEconomic Review 57:1252–1258.
Shepard, Andrea. 1993. Contractual Form, Retail Price, and Asset Characteristics.RAND Journal of Economics 24:58–77.
Silberman, Alan H. 1996. The Myth of Franchise ‘Market Power.’ Antitrust Law Journal65:181–221.
Silvester, T., J. Stanworth, D. Purdy, and M. Hatcliffe. 1996. Secrets of Success. LloydsBank Plc/IFRC Franchising in Britain Report : 1(3).
Slade, Margaret E. 1996. Multitask Agency and Contract Choice: An Empirical As-sessment. International Economic Review 37:465–486.
Slade, Margaret E. 1998a. Beer and the Tie: Did Divestiture of Brewer-Owned PublicHouses Lead to Higher Beer Prices? Economic Journal 108:1–38.
Slade, Margaret E. 1998b. Strategic Motives for Vertical Separation: Evidence fromRetail Gasoline. Journal of Law, Economics, & Organization 14:84–113.
Smith II, Richard L. 1982. Franchise Regulation: An Economic Analysis of State Re-strictions on Automobile Distribution. Journal of Law and Economics 25:125–157.
Spengler, Joseph J. 1950. Vertical Integration and Antitrust Policy. Journal of PoliticalEconomy 58:347–352.
Stanworth, John. 1977. A Study of Franchising in Britain: A Research Report. London:Social Science Research Council.
Stanworth, John. 1996. Dispelling the Myths Surrounding Franchise Failure Rates –Some Recent Evidence from Britain. Franchising Research: An International Journal1:25–28.
Stanworth, John and James Curran. 1999. Colas, Burgers, Shakes and Shirkers: To-wards a Sociological Model of Franchising in the Market Economy. Journal ofBusiness Venturing 14:323–344.
Stanworth, John and Patrick J. Kaufmann. 1996. Similarities and Differences in UKand U.S. Franchise Research Data: Towards a Dynamic Model of Franchisee Moti-vation. International Small Business Journal 14:57–70.
Stanworth, John, David Purdy, and Stuart Price. 1997. Franchise Growth and Failurein the USA and the UK: A Troubled Dreamworld Revisited. Franchising Research:An International Journal 2:75–94.
Stanworth, John, David Purdy, Stuart Price, and Nicos Zafiris. 1998. Franchise VersusConventional Small Business Failure Rates in the U.S. and UK: More Similaritiesthan Differences. International Small Business Journal 16:56–69.
Stassen, Robert and R. A. Mittelstaedt. 1991. A Successive Monopolies Examinationof Conflict in Franchise Channels. In John Nevin, Ed. Fifth Annual Proceedings ofthe Society of Franchising.
Stassen, Robert E. and Robert A. Mittelstaedt. 1995. Territory Encroachment in Ma-turing Franchise Systems. Journal of Marketing Channels 4:27–48.
Stassen, Robert E. and Robert A. Mittelstaedt. 2002. Do Franchise Systems AdvertiseEnough? U.S. Restaurant Expenditures and Performance 1989 to 1998. Journal ofMarketing Channels 10(2):3–18.
Stigler, George J. 1961. The Economics of Information. Journal of Political Economy69:213–225.

P1: KaD0521772524bib.xml CB802/Blair 0 521 77252 4 April 30, 2005 16:18
318 Articles, Books, and Other Publications
Stigler, George J. 1968a. Economies of Scale. Journal of Law and Economics 1:54–71.Stigler, George J. 1968b. Price and Nonprice Competition. Journal of Political Economy
72:149–154.Stiglitz, Joseph E. 1974. Incentives and Risk-Sharing in Sharecropping. Review of
Economic Studies 41:219–255.Tannenbaum, Jeffrey A. 1997. Franchisors Push Local Marketing Efforts by Fran-
chisees. Wall Street Journal (April 1):B2.Tannenbaum, Jeffrey A. and Stephanie N. Mehta. 1997. Bias at Single Store Can Taint
Franchise Chain’s Image. Wall Street Journal (March 6):B2.Terry, Andrew. 2001. The E-Business Challenge to Franchising, in Lorelle Frazer Ed.,
Fifteenth Annual Proceedings of the International Society of Franchising.Trutko, James, John Trutko, and Andrew Kostecka. 1993. Franchising’s Growing Role in
the U.S. Economy, 1975–2000. U.S. Department of Commerce, National TechnicalInformation Service, Springfield VA.
Thomadsen, Raphael. 2005. The Effect of Ownership Structure on Prices in Geo-graphically Differentiated Industries. RAND Journal of Economics, forthcoming.
Thompson, R. Steve. 1994. The Franchise Life Cycle and the Penrose Effect. Journalof Economic Behavior and Organization 24:207–218.
United States General Accounting Office. 2001. Federal Trade Commission Enforcementof the Franchise Rule. Washington, DC: GAO 01–776.
U.S. Census Bureau. Various years. Annual Survey of Manufacturers.U.S. Census Bureau. Monthly Retail Trade Survey.U.S. Census Bureau. 1992 Characteristics of Business Owners Survey.U.S. Census Bureau. Various years. Historical Retail Trade Services.U.S. Department of Commerce (USDOC). Various years. Franchise Opportunities
Handbook, compiled by Andrew Kostecka. Washington, DC.U.S. Department of Commerce (USDOC). Various years. Franchising in the Economy,
prepared by Andrew Kostecka. Washington, DC.Udell, G. 1972. Anatomy of a Franchise Contract. Cornell Hotel and Restaurant
Administration Quarterly 13:13–21.Vernon, John and Daniel Graham. 1971. Profitability of Monopolization by Vertical
Integration. Journal of Political Economy 79:924–925.Vincent, William S. 1998. Encroachment: Franchising’s Nightmare (Neutralizing the
Black Widow Spider). In Francine Lafontaine Ed. Twelfth Annual Proceedings of theInternational Society of Franchising.
Vines, Leonard D. 1996. Mergers & Acquisitions of Franchise Companies. Chicago:American Bar Association.
Vogel, Mike. 1996. Little Guy Needn’t Apply. Miami Daily Business Review Aug. 9,71(44).
Walkup, Carolyn. 2001. Embers Sparks ‘Individuality’: New Franchisees May KeepOld Names. Nations Restaurant News (March 13).
Warren-Boulton, Frederick R. 1974. Vertical Control with Variable Proportions. Jour-nal of Political Economy 82:783–802.
Warren-Boulton, Frederick R. 1978. Vertical Control of Markets: Business and LaborPractices. Cambridge, MA: Ballinger Publishing Co.
P1: KaD0521772524bib.xml CB802/Blair 0 521 77252 4 April 30, 2005 16:18
Articles, Books, and Other Publications 319
Wheaton, William C. 2000. Percentage Rent in Retail Leasing: The Alignment ofLandlord-Tenant Interests. Real Estate Economics 28:185–204.
Whinston, Michael D. 1990. Tying, Foreclosure and Exclusion. American EconomicReview 80:837–859.
Williams, Darrell L. 1996a. “Franchise Contract Termination: Is there Evidence ofFranchisor Abuse?” In Ann Dugan Ed., Tenth Annual Proceedings of the InternationalSociety of Franchising.
Williams, Darrell L. 1996b. Incomplete Contracting and Ex-Post Opportunism: Evi-dence from Franchise Contract Terminations. Mimeo. UCLA, Dept. of Economics.
Williams, Darrell. 1999. Why do Entrepreneurs Become Franchisees? An EmpiricalAnalysis of Organizational Choice. Journal of Business Venturing 14:103–124.
Williamson, Oliver E. 1971. The Vertical Integration of Production: Market FailureConsiderations. American Economic Review 61:112–123.
Williamson, Oliver E. 1979. Transaction Cost Economics: The Governance of Con-tractual Relations. Journal of Law and Economics 22:233–262.
Williamson, Oliver E. 1983. Credible Commitments: Using Hostages to SupportExchange. American Economic Review 73:519–540.
Williamson, Oliver E. 1985. The Economic Institutions of Capitalism. New York: FreePress.
Wimmer, Bradley S. and John E. Garen. 1997. Moral Hazard, Asset Specificity, ImplicitBonding, and Compensation: The Case of Franchising. Economic Inquiry 35:544–554.
Windsperger, Josef. 2002. The Dual Structure of Franchising Firms, in Joyce Young,ed., 16th Annual Proceedings of the International Society of Franchising.
Young, Joyce, Audhesh K. Paswan, John M. Buch, Lori Ashby, 1997. Fast-Food Fran-chises and Supercenters: A Tale of Two Alliances and Beyond. In Mark Spriggs (ed.)Proceedings of the 11th Annual International Society of Franchising Conference.
Zarco, R. and J. Dienelt, 1994. Point Counterpoint. Franchise Update (2nd quarter):22–25.
Zeidman, Philip F. 1989. Survey of Foreign Laws and Regulations Affecting InternationalFranchising. Chicago: American Bar Association.
Zellner, Richard E., Dale D. Achabal, and Laurence A. Brown. 1980. Market Penetra-tion and Locational Conflict in Franchise Systems. Decision Sciences 11:58–90.
Zupan, Mark A. 1989a. Cable Franchise Renewals: Do Incumbent Firms BehaveOpportunistically? RAND Journal of Economics 20:473–482.
Zupan, Mark A. 1989b. The Efficacy of Franchise Bidding Schemes in the Case of CableTelevision: Some Systematic Evidence. Journal of Law and Economics 32:401–456.

P1: KaD0521772524bib.xml CB802/Blair 0 521 77252 4 April 30, 2005 16:18
320

P1: KaD0521772524ccs.xml CB802/Blair 0 521 77252 4 April 30, 2005 14:19
Cases, Codes, and Statutes
Ala. Code § 8-20-5.Albrecht v. Herald Company, 390 U.S. 145 (1968).Amerada Hess Corporation v. Quinn, 143 N.J. Super 237, 362 A 2d 1258 (Law Div.
1976).Arthur Wishart Act, Ontario, Canada.Atlantic Richfield Co. v. USA Petroleum Co., 495 U.S. 328 (1990).Barnes v. Burger King Corp., 932 F. Supp. 1420, 1437–38 SD FLA (1996).Bigelow v. RKO Radio Pictures, 327 U.S. 251, 265 (1946).Broussard v. Meineke Discount Muffler Shops, Inc., 155 F.3d 331 (4th Cir. 1998).Broussard v. Meineke Discount Muffler Shops, Inc., 958 F. Supp. 1087 (W.D.N.C. 1997).Burger King Corp. v. CR Weaver, 169 F.3d 1310 (11th Cir. 1999).Business Electronics Corp. v. Sharp Electronics Corp, 485 U.S. 717 (1988).Cal. Bus. & Prof. Code § 20025.Cal. Veh. Code § 3060.Camp Creek Hospitality Inns, Inc. v. Sheraton Franchise Corp., 139 F.3d 1396 (11th Cir.
1998).Canterbury, Charles D. et al. v. Commissioner of Internal Revenue (1992), Tax Decisions
and Rulings, no. 160, Washington D.C., The Bureau of National Affairs, Inc.,K2–K24.
Caribe BMW, Inc. v. Bayerische Motoren Werke Aktiengesellschaft, 19 F.3d 745 (1st Cir.1994).
Carlock v. Pillsbury Co., 719 F. Supp. 791 (D. Minn. 1989).Clark v. America’s Favorite Chicken Co., 110 F.3d 295 (5th Cir. 1997).Clayton Act, 15 U.S.C. §§ 12–27.Cohn v. Taco Bell Corp, WL 13771 (N.D. Ill. 1994).Collins v. International Dairy Queen, 1997 WL 627504 (M.D. Ga. Oct. 1997).Collins v. International Dairy Queen, 939 F. Supp. 875 (M.D. Ga. 1996).Conn. Gen. Stat. § 42–133f.Conn. Gen. Stat. § 42–133v.Continental T.V. v. GTE Sylvania, Inc., 433 U.S. 36 (1977).Cook v. Little Caesar Enterprises, Inc., 972 F. Supp. 400, 409 (E.D. Mich. 1997).
321
P1: KaD0521772524ccs.xml CB802/Blair 0 521 77252 4 April 30, 2005 14:19
322 Cases, Codes, and Statutes
Curry v. Steve’s Franchise Co., 1985–2, CCH Trade Cases, par. 66877.Del. Code Ann. tit. 6, § 2552.Domed Stadium Hotel, Inc. v. Holiday Inns, Inc., 732 F. 2d 480 (5th Cir. 1984).Dr. Miles Medical Co. v. John D. Park & Sons Co., 220 U.S. 373 (1911).Eastman Kodak Company v. Image Technical Service, 504 U.S. 451 (1992).EEC Block Exemption for Vertical Restraints.Emporium Drug Mart Inc. v. Drug Emporium Inc. of Denton, No. 71 114 00126 00
(Am. Arbitration Assoc., Dallas, Texas, Sept. 2, 2000).Far Horizons Pty Ltd v. McDonald’s Australia Ltd, VSC 310 (August 18, 2000).Federal Trade Commission. 1979. Disclosure Requirements and Prohibitions Concern-
ing Franchising and Business Opportunity Ventures, 16 CFR § 436.1 et seq.Federal Trade Commission v. Sinclair Refining Co., 261 U.S. 463 (1923).Fla. State. § 320.64(1)(a).Foodmaker, Inc. v. Quershi, Bus. Franchise Guide (CCH) ¶11780 (Cal. Super. Ct.,
Dec. 1, 1999).Fortner Enterprises v. United States Steel Corporation, 394 U.S. 495 (1969).Franchising Code of Conduct, 1998, Commonwealth of Australia.Glover v. Henderson, 120 Mo 367, 25 SW 175 (1894).Haw. Rev. Stat. § 482E-6(2)(H).Haw. Rev. Stat. § 482E-6(2).Ill. Rev. Stat. ch. 121 1/2¶754(d)(6).Indiana Code §§ 23-2-2.7–1(2) & 23-2-2.7–2(4).Iowa Code 2001 Supplement, Section 537A.10.Iowa Code 523H, 1995 & 1992.Jack Walters and Sons Corporation v. Morton Building, Inc., 737 F. 2d 698 (7th Cir.),
cert. denied, 469 U.S. 1018 (1984).Jefferson Parish Hospital District No. 2 v. Hyde, 104 S.Ct. 1551 (1984).Kentucky Fried Chicken Corporation v. Diversified Packaging Corporation, 549 F. 2d
368 (1977).Kiefer-Stewart Co. v. Joseph E. Seagram & Sons, 340 U.S. 211 (1951).Krehl v. Baskin-Robbins Ice Cream Company, 664 F. 2d 1348 (9th Cir. 1982).Kypta v. McDonald’s Corporation, 671 F. 2d 1282 (11th Cir. 1982).Little Caesar Enterprises, Inc. v. Smith, 34 F. Supp. 2d 459 (E.D. Mich. 1998).Mass. Gen. L. ch. 93B, § 4(3)(e), § 9.Metrix Warehouse, Inc. v. Daimler Benz, 828 F. 2d 1033 (4th Cir. 1987).Mich. Comp. Laws § 445.1527 (D).Miller v. Western Men, Inc., 20 Utah 2d 352, 437 P.2d 892 (1968).Minn. Stat. § 80C.14, subd. 4.Monsanto Co. v. Spray-Rite Service Corp., 465 U.S. 752 (1984).N.J. Rev. Stat. § 56:10–5.Neb. Rev. Stat. § 87–404.In re Nissan Antitrust Litigation, 577 F. 2d 910 (5th Cir. 1978), cert. denied, 439 U.S.
1072 (1979).Northern Pacific Railway v. United States, 356 U.S. 1 (1958).Payne v. McDonald’s Corp., 957 F. Supp. 749, 754–60 (D. Md. 1997).

P1: KaD0521772524ccs.xml CB802/Blair 0 521 77252 4 April 30, 2005 14:19
Cases, Codes, and Statutes 323
Petroleum Marketing Practices Act.Phillips v. Crown Central Petroleum Corp., 395 F. Supp. 435 (E.D. Mich. 1975).Photovest Corp. v. Fotomat Corp., 606 F.2d 704 (7th Cir. 1979), cert. denied, 445 U.S.
917 (1980).Principe v. McDonald’s Corporation, 631 F. 2d 303 (1980).Queen City Pizza, Inc. v. Domino’s Pizza, Inc., 124 F.3d 430, reh’g denied, 129 F.3d 724
(3d Cir. 1997).Queen City Pizza, Inc. v. Domino’s Pizza, Inc., 922 F. Supp. 1055 (E.D. Pa. 1996).Robinson Patman Act, 15 U.S.C. § 13.Redd v. Shell Oil Co., 524 F. 2d 1054 (10th Cir. 1975).Restatement of Contracts § 205 (1977).Rosenberg v. Pillsbury Co., 718 F. Supp. 1146 (S.D.N.Y. 1989).Scheck v. Burger King Corp., 756 F. Supp. 543 (S.D. Fla. 1991) (“Scheck I”).Scheck v. Burger King Corp., 798 F. Supp. 692, 696 (S.D. Fla. 1992) (“Scheck II”).Schubot v. McDonald’s. Corp., 963 F.2d 385 (11th Cir. 1992).Sherman Antitrust Act, 15 U.S.C. §§ 1–11.Siegal v. Chicken Delight, 448 F. 2d 43 (9th Cir. 1971).Small Business Franchise Act (1999).State Oil Co. v. Khan, US Sup. CT, No. 96–871.Subsolutions, Inc. v. Doctor’s Associates, Inc. 62 F. Supp. 2d 616 (D. Conn. 1999).Tex. Rev. Civ. Stat. Ann. art. 4413(36) § 5.02(3).Uniform Commercial Code (UCC § 2–309[2]).United States Steel Corporation v. Fortner Enterprises, 429 U.S. 610 (1977).United States v. Socony-Vacuum Oil Co., 310 U.S. 150 (1940).USA Petroleum Co. v. Atlantic Richfield Co., 13 F. 3d 1276 (9th Cir. 1994).Vicorp Restaurants, Inc. v. Village Inn Pancake House of Albuquerque, Inc., Bus. Fran-
chise Guide (CCH) ¶10994 (D.N. Mex. 1996).Vylene Enterprises, Inc. v. Naugles, Inc., 90 F. 3d 1472 (9th Cir. 1996).Wilson v. Mobil Oil Corporation, 940 F. Supp. 944 (E.D. La. 1996).Wilson v. Mobil Oil Corporation, 984 F. Supp. 450 (E.D. La. 1997).Wis. Stat. § 135.03.Wisconsin Fair Dealership Law.

P1: KaD0521772524ccs.xml CB802/Blair 0 521 77252 4 April 30, 2005 14:19
324
P1: KsF0521772524ind.xml CB802/Blair 0 521 77252 4 April 30, 2005 15:48
Index
accountants 167Ackerberg, D. A. 112Ad $ Summary 250advertising 8, 13, 296
in business-format franchising 8Broussard v. Meineke Discount Muffler
Shops, Inc. 254, 255conflict with 253contracts flexible with 253cooperative 253economies of scale in production and
244, 245as enticement/promotion 256free-riding and 249as information 237Jack Walters & Sons Corporation v.
Morton Building, Inc. 256McDonald’s 252monopoly solution 240non-informative 237pooling of 227profit maximization through 240as public good, in franchised chains 246system-wide and national 246, 247, 251under imperfect competition 241vertical benefit of 247
advertising fees 69, 188, 236ability to change 69advertising expenditures v. 250, 254change in 71, 74distribution of, in sectors 71, 73distribution of, in sectors and royalty
71, 75–78, 79–81dividing up, per category 251
fixed 69, 80, 250for local advertising 69initial franchise fee v. royalty rates and
80–81McDonald’s 251royalty rates v. 71, 250sales percentage for 69, 71, 72, 75, 78,
249, 250sales percentage for, and royalty rates 76variation in 69, 70–71
Agate, S. 130agency model 109
basic 112double-sided moral hazard 112, 115standard incentive-cum-insurance 112
agency theory 107–108contract uniformity and 112–113franchise contracting and 111risk-averse franchisee and 107–108, 109
Akerlof, G. A. 162Albrecht v. Herald Company 175, 178, 179,
180, 181, 196, 197alternative business valuation methods
286Amerada Hess Corporation v. Quinn 275anticompetitive consequences 180antitrust laws 105, 131, 134, 142, 153, 176,
177, 180competitive evil 197injury 180Kahn, horizontal agreements and 196relief 197
Applebee’s 253arbitration clauses, mandatory 79
325
P1: KsF0521772524ind.xml CB802/Blair 0 521 77252 4 April 30, 2005 15:48
326 Index
area development agreements 51, 52, 299Arthur Wishart Act 5Atlantic Richfield Co. v. USA Petroleum Co
179Australia 44, 266, 267
business changes after franchising in 44franchising contracts of 81
Austria 116automotive sector 15, 16, 17, 18, 23, 26,
27, 28, 71, 75, 222, 286Azevedo, P. F. 116Azoulay, P. 224
Baskin-Robbins. See Krehl v.Baskin-Robbins Ice Cream Company
Bassuk, H. 203Bates, T. 42, 43, 44Beales. H. 159, 167Becker, G. S. 237Berger, P. D. 249, 253Bhattacharyya, S. 51, 55, 56, 63, 70, 111,
112, 113Blair, R. D. 94, 175block exemption 176, 196Boe Morgan, K. 45Bond, R. 27, 32, 33, 39, 42, 47, 51, 158Bond’s Franchise Guide 11, 13, 31, 32, 37,
51, 140, 158Botticini, M. 112Bradach, J. L. 51, 111, 117, 125, 128, 136,
158, 269branding 121
common 121, 122brands 1, 237, 246
name value 115Brazil 116breach of contract 164, 273Brickley, J. A. 106, 136, 261, 270, 272Broussard v. Meineke Discount Muffler
Shops, Inc. 254, 255Brown, P. R. 298Bruegger’s Bagels 251Burger King 7, 9Burger King v. Weaver 230business mortality 286business stealing 243business valuation methods 286business-format franchising 6; See
franchising contracts
advertising fund with 8establishments/employment in 9, 10foreign growth rate in 32–33franchise contract in 54growth faster for 8growth, GDP and 21, 22, 23, 26, 29, 30,
31, 33–34history of 6input purchase requirements, tying and
103, 105, 144–145, 152lump-sum franchise fees and 96–97, 98number of 31, 32output royalty with 101renewals for 263sales percentage for 6, 9, 10sectoral distribution of 13–14, 16, 17sectoral distribution of new 17successive monopoly agrument,
maximum resale price restraints and188
traditional franchising v. 8buy back
clauses 267company 271, 272–273
California 270call option 219, 272, 273Canada 12capitalized earnings 287Carlock v. Pillsbury Co. 232Carmichael, H. L. 111Carvel Corporation 232, 234Caves, R. E. 7, 118Census 27, 43Characteristics of Business Owners (CBO)
43, 264, 271Chicken Delight. See Siegel v. Chicken
Delightchoice of law 79Church’s Fried Chicken 231Clark v. America’s Favorite Chicken Co.
232Coase, R. H. 216cobranding 299Coca-Cola 6Cohon, G. 127Collins v. International Dairy Queen 152,
155common law, termination under 276

P1: KsF0521772524ind.xml CB802/Blair 0 521 77252 4 April 30, 2005 15:48
Index 327
competition 157, 202, 208, 295encroachment and 208franchisors, for franchisees 158horizontal agreement among 177intrabrand v. interbrand 233optimal advertising under imperfect
241other franchisors as 219pre-contract and post-contract, tying
and 157conditional sales 148. See also tyingconflict in franchising 2
franchisee independence and 291imperfect incentive alignment and
291–292construction sector 15, 16, 17, 18, 59consumer welfare 187–188
encroachment protection costly for206, 211–212
monopoly not favorable for 210Continental T.V. v. GTE Sylvania Inc.
211–212, 222contract. See franchising contractconversion franchise 56, 120cooperatives 7cost comparisons, tying contracts and 159cost-of-effort function 113costs 161. See also marginal costs
information 162–164life-cycle 160, 166opportunity 277sunk 220switching 161–162
customers 117consistency for 117–118, 122franchisor, close stores and benefit to
211–212
Dairy Queen 298. See also Collins v.International Dairy Queen
Dant, R. P. 49, 80, 249, 253Dark, F. H. 106, 136, 270Dayan, R. 127dealer relation laws 278demand externalities 189
sales based royalties and 198Dicke, T. S. 4disclosure 55, 162–163, 166–167discount/interest rate 284
Dixit, A. W. 237Dnes, A. W. 8, 128Domino’s Pizza 154. See also Queen City
Pizza, Inc., v. Domino’s Pizza Inc.Dondanville, B. 175Dos Santos Silva, V. L. 116double marginalization 183downstream production process 169dual distribution. See also vertical
integrationdecisions 114extent of, U.S. 83–90non-U.S. 83, 116
Dunkin Donut 228durables 162
Eastman Kodak Company v. ImageTechnical Services 132, 142, 143,150–151, 154, 155, 156, 157, 160,161–162
Eckart, E. W. 212economies, of scale 244
in production and advertising 245education sector 15, 17, 18, 65, 75,
223EEC Block Exemption for Vertical
Restraints 5Emporium Drug Mart Inc. v. Drug
Emporium Inc. of Denton 232encroachment 202
alternative distribution as 232area development agreement reducing
228company ownership of units reducing
228compensation to franchisees facing
227competitive benchmark for 208Continental T.V. v. GTE Sylvania Inc.
211–212, 222court cases 231–232customer benefit and 211–212different forms of 202–203eliminating recourse from, when
limited effect 205exclusive territory and 210, 216, 222,
223franchise contract v. good faith and fair
dealing and 230
P1: KsF0521772524ind.xml CB802/Blair 0 521 77252 4 April 30, 2005 15:48
328 Index
encroachment (cont.)franchise contract, close proximity of
units and 230franchisees’ optimal configuration and
210franchisees’ optimal configuration
revisted and 212geographic 203geographic/traditional, defined 204industry response to 222internet as 232–233intrabrand v. interbrand competition
and 233involving franchisees in decision
process 227legal and legislative treatment of 228,
234local nature of geographic 204market conditions influence on
219–222market coverage and traditional 204market development influence on 206,
212, 213–214, 227, 228market strategy, opportunities and 231negative/positive impact from 202–204non-traditional 231optimal store configuration under
monoply and 209other franchisor practices influencing
226penalty/benefit from 206reasonable expectations of franchisee
and 226reserved rights in exclusive territories
and 231sale maximization and 214Scheck I and Scheck II 230target sales levels per outlet and 213territorial conflict pinpointed with 206unreasonable proximity 205vertical restraints and 211–212
England 6. See also Great BritainEntrepreneur 11, 35, 37entrepreneur, local 2entry and exit, 20, 36, 52
capital requirements in 41consolidations influence on 38entry for 80’s in 36–37entry in 90s for 37
entry v. exit in 39exit data collection in 35, 37–39exit in 80s for 39exit in 90s for 39failure v. exit in 35, 38, 41–42, 43–46Great Britain’s exit rate in 40–41risk with 34turnover rates in 43
European Commission 176, 196. See alsoEEC
ex post rent 120–121exercise price 272
failure 53. See also entry and exitbenefits v. 45–46blue-chip franchise 42definition of 45encroachment, opportunism and 217master franchise agreement 225misconceptions about 42performance standards 279risk and 44small independent v. franchise 43,
44–45yearly v. multi-year rates of 42
fair dealing 230Far Horizons Pty Ltd v. McDonald’s
Australia Ltd 206Federal Trade Commission (FTC) 4, 68,
162, 229Fortner Enterprises v. United States Steel
Corporation 143France 81, 116
franchising contracts in 81franchise 2
foreign definition of 4–5meaning of 3–4
franchise agreement 3–4Franchise Annual 31, 37franchise bidding 4franchise fee 51, 54, 107, 218
distribution of, 2001 58distribution of, across sectors 59–60evolution of 60formulaic 55high initial lump-sum 165–166initial lump-sum 56low-cost 57, 59, 60lump-sum 95, 97, 109
P1: KsF0521772524ind.xml CB802/Blair 0 521 77252 4 April 30, 2005 15:48
Index 329
median 57, 59reduced 51, 78royalty and advertising rates v. 80–81small overall value of 59uniform 54variation of 56–57, 59
franchise relationship law 204, 229, 278Franchise Times 21, 34, 109franchisee 4
agency theory and risk-averse 107, 109as middleman 275churning by franchisor 214, 216–218control over 124–125cost reducing benefits for 236demand-enhancing benefits for 236failing of 194–195first in market 220franchisees influence other 190franchisor exiting influence on 44franchisor, conflict with advertising 253higher-powered incentives for 114, 116independence of 291market power of 100–101, 102, 103,
104, 105, 121, 156net operating revenue of 159opportunism, and termination/renewal
268opportunities evaluated by 166optimal configuration for, and
encroachment 210optimal configuration for, and
encroachment revisited 212payment to franchisor by 4post-contractual exploitation of 163potential franchisees, correct
expectations, as 226pricing more aggressive, in same chain
stores 219–220right to transfer/sell by 267security of, with exclusivity 224termination desired by 271termination of 127, 128, 134–135uncertainty for 163, 166underperforming 271
franchising 298experimentation within 299future of 298highly capitalized, area development
agreements and 299
legal landscape of 300various forms of 298
franchising contracts 2advertising and 69, 253breach of 164, 273Bruegger’s Bagels 251Carvel Corporation 234choice of contract type v. terms in 114clarity needed in 221performance clause in 126close proximity of units, encroachment
and 230cross-border uniformity in 54, 55disclosure rules, uniformity and 55duration of 259, 285duration of, and investment 264duration of, per secto 260expected franchisee performance in
119–121failure of master 225franchise fees in 56–57good faith and fair dealing v. 230integration clause of 230no ownership with 221non-monetary clauses in 79non-U.S. 81one-sided 269–270performance clause in 134renewals in 261royalty rates in 62self-enforcing 268silent, and reasonable term 276substantially comply with material
terms of 279terminable at will 276uniformity of 54, 113uniformity, fairness and 55uniformity’s advantage in 55uniformity’s disadvantage in 55
Franchising in the Economy 6, 9, 27, 33, 35,45
franchisor 4business records of 283capital requirements 41churning of franchisee by 214, 216–218close stores, benefit to consumers and
211–212competition for franchisees with other
158

P1: KsF0521772524ind.xml CB802/Blair 0 521 77252 4 April 30, 2005 15:48
330 Index
franchisor (cont.)control exerted by 4database on 11, 31disclosure rules for 4–5ex post power of 164exiting/failing 20high-value 115investment of franchisees desired by
221lump-sum franchise fees and
opportunism 98new 16–18, 44number of 11, 12, 13, 14opportunism 166, 197opportunism, and maximum resale
price restraints 194opportunism, and sales maximization
and encroachmentopportunism, and termination 271pre-contract opportunism of 163quality control, franchisee differences
and 135reputation of 273–274revenue sharing and 111small 20, 46, 47staying power of 39target sales per outlet by 213–214turnover of 13, 43vertical integration for 19
Frandata Corp. 43, 45, 62, 224Frazer, L. 38, 44, 81, 99, 266freedom franchise 298free-riding 136, 165, 249, 270future, of franchising 298
Gagne, R. 81Garner, W. M. 79, 275, 276, 278gasoline industry 23, 26, 28, 241, 286GDP (Gross Domestic Product) 8
business-format franchising, growthand 21, 22, 30, 31, 33–34
franchising sales as percent of 25growth, traditional franchising and 21,
22, 26, 27, 28real 24sales, growth rate and 21
General Accounting Office (GAO) 229General Motors Corporation 6Gibson, R. 167, 175
good faith 230goodwill 118, 192, 287Graddy, K. 174Graham, D. 104, 142Great Britain 34. See also England; UK
benefits of franchising in 46consolidation of franchising in 34exit rate in 40–41franchising contracts of 81
Great Harvest Company 298Grimes, W. S. 163growth rate 20
business-format franchising, GDP and21, 22, 23, 26, 29, 30, 31, 33–34
difficulty in assessing information on27
exaggerated 21, 23–26, 34foreign 29, 32–33GDP, sales and 21international 83traditional franchising, GDP and 21,
27, 28traditional franchising, sales and 26
Gupta, S. 111
H&R Block. 233Haagen Dazs 232Hadfield, G. K. 194Harper, Martha Mathilda 6Hatcliffe, M. 34health and fitness sector 71, 75, 140Herald Company 178Hoban, D. 128Holmberg, C. 45horizontal agreements 196hostage 135hotels and motels sector 91, 120, 136–137,
223, 259human capital 46Hunt, S. D. 46, 175, 194
incentives 107contractual efforts to resolve problems
of 125franchisees, development of brand and
221higher-powered 114, 116incompatibility, of product quality 126input purchase requirements and 131

P1: KsF0521772524ind.xml CB802/Blair 0 521 77252 4 April 30, 2005 15:48
Index 331
once contract signed by franchisee 215specific performance clauses and 126vertical integration and 132–133
income capitalization 287independent service organizations (ISOs)
150Indiana 229input purchase requirements 80, 295. See
also tying contractscosts of control 133legality issues with 131–132, 134problems with 105quality control with 131, 140–142tying and 103under perfect competition downstream
104interest rate 284International Dairy Queen 155International Franchise Association (IFA)
42, 43, 45, 62, 222international franchising 297. See also
Great Britain; growth rateinternet 232–233Iowa 204, 226, 229
Jack Walters & Sons Corporation v. MortonBuilding, Inc. 256
Jefferson Parish Hospital District No. 2 v.Hyde 143
Kahn. See State Oil Company v. KahnKalnins, A. 49, 52, 121, 174, 195, 219, 225,
226Kanouse, K. 234Kaserman, D. L. 94, 175Katz, M. L. 133Kaufmann, P. J. 49, 50, 51, 80, 81, 97, 129,
158, 162, 213, 217, 270Kelly, A. O. 217Kentucky Fried Chicken Corporation v.
Diversified Packaging Corporation153
Kiefer-Stewart v. Joseph E. Seagram & Sons177
Kim, S. H. 51Klein, B. 8, 97, 118, 135, 165, 216, 237,
268, 270, 273Kodak. See Eastman Kodak Company v.
Image Technical Services
Kolton, J. 43, 44Kostecka 41Krehl v. Baskin-Robbins Ice Cream
Company 131, 147–148, 152Kroc, R. 126, 130, 175, 224, 299Krueger, A. B. 216Kruse, N. 117Kypta v. McDonald’s Corporation
165
Lafontaine, F. 27, 37, 39, 40, 41, 49, 50, 51,52, 54, 55, 56, 62, 63, 70, 79, 80, 81,90, 91, 97, 111, 112, 113, 115, 116,129, 133, 137, 162, 174, 195, 213, 217,226, 250, 270
Lal, R. 111Landes, W. 150Leffler, K. 237legality 105
price setting issues with 105termination issues with 106tying, input purchase requirements and
105, 131–132, 134, 143, 144Lerner, A. 150liquor sector 222Little Caesar Enterprises v. Smith 155–156lock-in 156, 160, 164, 166
information cost with 162–164post-contractual power in 160–161switching costs and 161
Love, J. F. 224, 275, 299lump-sum franchise fees 95
agency theory, risk-averse franchiseeand 109
business-format franchising and 96economically equivalent to vertical
integration 97effect of 96franchisor and opportunism with 98full present value of future profit v. 97predictions unrealibility and 98problems with 97–98
Lutz, N. A. 217, 258
Mail Boxes Etc. 253maintenance and cleaning sectors 15, 16,
17, 18, 65, 75, 91managers 133, 217, 243
stability issues of 133–134
P1: KsF0521772524ind.xml CB802/Blair 0 521 77252 4 April 30, 2005 15:48
332 Index
Maness, R. 110marginal cost 97, 184, 185, 242, 244marginal revenue 184, 185marginalization, double 183, 186Maris Distributing Company v.
Anheuser-Busch, Inc. 155market cap 288market power 149
aftermarket 156competition, pre-contract v.
post-contract 157cost comparisons and 159definition of 149, 157downstream (successive) 183of franchisees 156intellectual property basis of 156lock-in argument with 160post-contractual power with 160–161relevant market for 151single-brand 154tying contracts, after Kodak and
identifying 156upstream 183
markup 66, 78, 80, 98, 188lock-in argument and 160
master franchise agreement 225master franchising 51Mathewson, F. 98maximum resale price restraints 175–176,
186, 295Albrecht forerunners of 177Albrecht v. Herald Company 178, 181Atlantic Richfield Co. v. USA Petroleum
Co 179consumer welfare with 187–188demand externalities in 189economic analysis of 182franchisor opportunism with 194Kiefer-Stewart v. Joseph E. Seagram &
Sons 177legal history of 177minimum resale price fixing v. 178profit with 186, 187prohibition of 181public policy implications of Khan with
196State Oil Company v. Khan 180, 295successive monopoly agrument for
business-format franchising and 188
successive monopoly agrument fortraditional franchising and 182
United States v. Socony-Vacuum 177Mazzeo, M. J. 112McAfee, R. P. 55, 98, 216McCormick Harvesting Machine
Company 5, 227encroachment policies of 227
McDonald’s 7, 9, 20, 44, 49, 97, 117, 162advertising 251, 252company-owned 83early exclusivity lost at 224Far Horizons Pty Ltd v. McDonald’s
Australia Ltd 206incentive mechanism of 50locally owned 174loss of arches of 236price dispersion at 174–175Principe v. McDonald’s Corporation
145product specifications for 130profits, franchisee and 213profits, penalties and 129quality control for 126, 127rent, termination and 270store lease of 146termination, discipline and 275turn-key package of 298
Mehta, S. N. 118Meineke. See Broussard v. Meineke Discount
Muffler Shops, IncMetzger, W. E. 6Mexico 54Michael, S. C. 81, 140, 165mini chains 49minimum resale price fixing 178minimum resale price maintenance 175misconceptions, of franchising 20, 52, 53,
292–293, 294Mittelstaedt, R. A. 194, 250, 252, 253Mobil 153. See also Wilson v. Mobil Oil
Corporationmom-and-pop ventures 20, 49monopoly 150
consumers worst off with 210contract terms 216downstream 196integrated 168, 169, 186legal v. economic 150
P1: KsF0521772524ind.xml CB802/Blair 0 521 77252 4 April 30, 2005 15:48
Index 333
maximum resale price restraints,business-format franchise andsuccessive 188
optimal advertising and 240optimal store configuration under 209power 164, 172production monopolist and separate
distribution 186successive 182traditional franchising, maximum
resale price restraints and successive182
Moore, H. J. 81multiple regression analysis 283–284multi-unit franchising 20, 45, 53
area development agreement 51–52incentive mechanism with 50number of 49sequential acquisition of franchised
units with 50single-units v. 49–50, 51size of 49–50
Muris, T. J. 159, 167Murphy 237Murphy, L. H. 223Murphy, W. F. 7, 118
Nissan Antitrust Litigation 257non-compete clauses 267non-food retailing 9non-monetary contract clauses 79non-renewal. See terminationnon-repeat customer industries 52Norman, V. 237Northern Pacific Railway v. United States
143
one-stop shopping 156operations manual 127–128opportunism 163
franchisee, and termination/renewal268
franchisor 194, 197franchisor, and sales maximization and
encroachment 214franchisor, and termination 271Khan and post-contractual 196post-contractual 164, 168pre-contract 163
opportunistic behavior 133, 135outlet 258, 293. See also store; vertical
integrationfuture value of 258local 293profit 283(sales) quotas 106, 110
output royalty 101–102problems with 103under perfect competition downstream
102ownership 211, 294
asset, of franchisee v. manager 217franchising less appealing than
211ownership integration 133–134, 273Oxenfeldt, A. R. 217Oxley, J. 54, 55Ozanne, U. B. 175, 194
Penard, T. 81, 116per se illegality 143, 144, 175, 177, 179personal services 60. See also service
businessesPicchietti, R. 130Popeye’s 231Posner, R. 150price buyers 130price setting 105pricing 163. See also maximum resale
price restraints; vertical pricecontrols
ceilings 193depressing 177dispersion 174equilibrium 241franchisee more aggressive, in same
chain stores 219–220franchisee v. company-owned 195life-cycle 163setting, equal to marginal cost 244wholesale 185
Principe v. McDonald’s Corporation 145,148, 149, 157
Principe, F. 145product distribution franchise system
147–148product specifications 129, 130, 134products, separate 145
P1: KsF0521772524ind.xml CB802/Blair 0 521 77252 4 April 30, 2005 15:48
334 Index
Profile of Franchising 43, 59, 62, 66, 71, 250profit 81, 94
above-normal 208advertising and maximization of 241discounted value of 282downstream 81, 94franchisee 162franchisee share of 213franchisee v. company-owned store 216franchisor, from franchisee 190function 170future 281, 285maximizing 243, 244maximizing behavior 118, 183, 184,
191maximum resale price restraints for
186, 187minimum required 208projections 166sales maximization v. maximization of
214–215sales v. 194
Promotion. See advertisingProuvost, Jean 7public good 246Purdy, D. 34
quality control 117, 294advertising, product quality and 246company and franchised units
differences in 135contractual efforts to resolve incentive
problems with 125control over franchisee in 124–125,
127–128cost of 122customer consistency for 117–118, 122input purchase requirements and tying
131, 134, 140–142lower quality product hurting 119,
124operations manual for 127–128ownership integration, managers and
133–134penalties for noncompliance with
128–129product specifications for 129, 130,
134
profit-maximizing behavior influenceon 118–119, 124
QSC victory for 127specific performance clause for 126,
134tolerance for minor deviations in
128–129uniformity for 117, 119–121, 126vertical externalities model of 121vertical integration and 132
quantity forcing 106Queen City Pizza, Inc., v. Domino’s Pizza,
Inc. 154, 157, 158, 160–161
Rao, R. C. 63, 65Raynaud, E. 81, 116real estate law 204recoupment 276–278relative performance contracts 111renewal 258
business-format franchising 263contract duration determinants for
264decision for 267–268effect of, and termination 266fee 56franchisee opportunism and 268investment greater, greater probabilty of
267option for 258period, per sector 262termination rates and 263
rent 215ex ante 270ex post 270McDonald’s, termination and 270ongoing 135, 165–166quasi 215
rental contracts 221resale price controls 105, 106. See also
maximum resale price restraintsresellers 179restaurant sector 9, 15, 16, 17, 18, 49, 71,
224fast-food chains 136, 224, 226, 231fast-food firms, sales percentage royalty
and 66fast-food tying in 140fast-food, price controls and 174
P1: KsF0521772524ind.xml CB802/Blair 0 521 77252 4 April 30, 2005 15:48
Index 335
multi-unit 49, 50quality control in 136–137sit-down 59, 91, 120
retailing 2, 9, 15, 17, 75, 140, 224high receipts in franchising by 8, 26high royalty rates in 65low royalty rates in 63, 65
revenue sharing 111Reynolds, G. 118right-censoring problem 37risk 35
franchising v. independent start-up 34,44
Robinson-Patman Act 55Romano, R. 111Rosenberg v. Pillsbury Co. 232royalties 3, 7, 8, 13, 51, 62, 165, 188. See
also sales revenue royaltyadvertising fees v. 71, 250distribution of, in sectors 64, 65, 66, 75distribution of, in sectors and
advertising 71, 75–80fixed fees for 66, 67–68, 80flat dollar 62high 59, 63, 65initial franchise fee v. advertising fees
and 80–81low 63, 65no 62output 101, 102periodic lump-sum royalty 98sales percentage 62–63, 65–67, 75, 100,
107, 188, 189, 190sales revenue 99tying contracts v. 31uniform rate of 54variations in 63–65
Rubin, P. 110, 111, 268
Saft, L. F. 165sales 9
business-format franchising 9business-format v. traditional frachising
6, 9, 10conditional 148franchisor opportunism, encroachment
and maximization of 214GDP and 21per unit 26
profit maximization v. maximization of214
profits v. 194retail 8, 9, 26target, per outlet 213–214
sales commission plans 148sales revenue royalties 100
agency theory, risk-averse franchiseeand 15, 17, 107–108, 110, 112
demand externalities and 198franchisee profit extracted from 99market power of franchisee and
100–101under perfect competition downstream
100problems with 101profit-based fees v. 110
same-unit growth 23Saussier, S. 81, 116Scheck I and Scheck II 230Schmidt, T. 188Schwartz, M. 55, 98, 216Seaton, J. 81security deposit 146Seid, M. H. 33Seltz, D. D. 41Sen, K. C. 80, 250service businesses 2, 9, 16, 18, 63, 65, 71,
75, 140, 223high royalty rates in 65
Shane, S. 37, 38, 40, 224Shaw, K. L. 37, 39, 40, 41, 79, 80, 90, 91,
115, 116, 133, 137, 217, 250Shelton, J. P. 216Shepard, A. 105Sherman Act 134, 143, 166, 177Siegel v. Chicken Delight 66, 145, 148, 165Silberman, A. H. 149Singer Company 5–6size, of franchisors 20, 47, 53
large 46, 47small 46, 47
Slade, M. E. 112, 195Small Business Franchise Act of 1999 205,
229Smith, R. L. 206, 212SpeeDee 153Spengler, J. J. 182Srinivasan, S. 63, 65

P1: KsF0521772524ind.xml CB802/Blair 0 521 77252 4 April 30, 2005 15:48
336 Index
Stanworth, J. 34, 41, 46, 158start-ups, franchise 45Stassen, R. E. 194, 250, 252, 253State Oil Company v. Khan 175, 176, 180,
196, 197subfranchising agreements 51Subsolutions, Inc. v. Doctor’s Associates, Inc.
132, 143Subway 127, 130, 132sunk costs 220supplier-reseller 182switching costs 154Sylvania. See Continental T.V. v. GTE
Sylvania Inc.
Tannenbaum, J. A. 118termination 127, 129, 134–135, 219,
296alternative business valuation methods
for 286business mortality 286buy-backs with 271, 272–273call option and 272capitalized earnings and 287common law for 276contract duration and 259, 285contract terminable at will and 276damages assessed for wrongful 280decision for 267–268effect of, and renewals 266franchise or dealer relation statutes for
278franchisee desiring 271franchisee opportunism and 268franchisor opportunism and 271franchisor’s mistreatment of franchisee
and 273–275franchisor’s reasons for 271future profits estimation with 281,
285good cause for 278, 279goodwill calculation in 287legal considerations of 275lost profit, mitigation for 288lost profits, present value of 280, 285market determined values for 287monetary damages for 275performance standards for 279provisions of, and state laws 270
rare use of 269recoupment from 276–278renewal and rates of 263state law constraints on 273tax consequences of award from 285wrongful 275, 280, 282
territories, exclusive 210, 216, 222by sector 222–224contingent on performance 225–226encroachment in 224flexibility v. 224frequency of 222reserved rights of franchisors in 231security from 224
Terry, A. 206Texas 52Thomadsen, R. 121, 174, 195, 220trade name 4trademark 4
common 122in distribution franchise system 147market power based on 156as separate product and tying 145
traditional franchising 5business-format franchising v. 8decrease in 23–26growth, GDP and 21, 22, 26, 27, 28history of 5–6input purchase requirements and 105profit of franchisor in 54successive monopoly, maximum resale
price restaints and 182tying, distribution and 144
transfer fee 267transfer right 267Trutko 41turnover rates 12–13, 43tying contracts 139. See also input
purchase requirements legalityof aftermarket products 151, 156, 164alternative suppliers approval and 153,
154, 164antitrust treatment of 142for business-format franchises 152cases after Kodak 152Collins v. International Dairy Queen
152, 155competitiom, pre-contract v.
post-contract 157

P1: KsF0521772524ind.xml CB802/Blair 0 521 77252 4 April 30, 2005 15:48
Index 337
contractually explicit tying after Kodakand 153–154
cost comparisons and 159de facto 148de facto tying 154definition of 139Eastman Kodak Company v. Image
Technical Services 150, 152, 160,161–162
explicit conditioning with 148, 163franchisee opportunities evaluated and
166for generic supplies 145, 148implicit conditioning in 149, 164implicit, after Kodak 154incomplete specifications and 155information costs with 162Krehl v. Baskin-Robbins Ice Cream
Company 147–148, 152Little Caesar Enterprises v. Smith
155–156lock-in agrument and 156, 160mandatory purchase requirements
frequency with 139, 141market power identified, after Kodak
156market power, tying good and 149per se illegality with 143, 144post-contractual opportunism and
164Principe v. McDonald’s Corporation 145,
148for product distribution franchise
system 147proof of conditional sales in 148proof of separate products in 145purpose of 140–142Queen City Pizza, Inc., v. Domino’s
Pizza, Inc., 154, 157, 160–161royalty payments v. 165Siegel v. Chicken Delight 145, 148switching costs and 161system agrument for 146, 148, 157in traditional franchising 144tying product market defined in cases of
152vertical integration and 168Wilson v. Mobil Oil Corporation 148,
153, 154, 156, 161
U.S. Federal Trade Commission 148Udell, G. 66Uniform Commercial Code 98, 276Uniform Franchise Offering Circular 162uniform product 117uniformity 55United States Steel Corporation v. Fortner
Enterprises 143United States v. Socony-Vacuum 177Utah 278
value meals 175Vernon, J. 104, 142vertical integration 82, 147
company-owned outlet variation insectors 91, 93
company-owned outlets developed andmanaged 90–91
company-owned outlets proportion86–90, 92, 115
contractual equivalents of 94dual distribution 83–90dual distribution dynamics 90–91dual distribution, sales and employees
in 83, 85managers and 133–134outlet numbers, franchised and
company-owned and 83, 86price reduction, increase profits and
186profit from 94quality control and 132–133total sales, establishments in 83, 84,
87–90tying contracts and 168vertically integrated outcome 95
Vertical Price Controls 174. See alsomaximum resale price restraints,resale price controls
Albrecht v. Herald Company 175, 178,181
block exemption for 176, 196State Oil Company v. Khan 175, 180
vertical restraints 94Continental T.V., Inc. v. GTE Sylvania,
Inc. 211–212input purchase requirements and tying
103lump-sum franchise fees 95

P1: KsF0521772524ind.xml CB802/Blair 0 521 77252 4 April 30, 2005 15:48
338 Index
vertical restraints (cont.)output (sales) quotas 106output royalties 101resale price control 105sales revenue royalties 99
Vogel, M. 299
Warren-Boulton, F. R. 104Weisbach, M. S. 106, 270Wendy’s 252, 253Williams, D. 46, 264, 271, 272
Williams, D. L. 135Williamson, O. E. 135Wilson v. Mobil Oil Corporation 148,
153–154, 161, 163, 166Windsperger, J. 116Winter, R. 98Wisconsin 229
yardstick methodology 283, 284
Zeidman, P. F. 79