theguitar - weebly
TRANSCRIPT

fVCC
THEGUITAR
lHEGUITAR
fVCCA. A. Strassenburg, State University of New York at Stony Brook
Bill G. Aldridge, Florissant Valley Community CollegeGary S. Waldman, Florissant Valley Community College
Bill G. Aldridge, Project Director
NEW YORKST. LOUIS
DAllASSAN FRANCISCO
AUCKLANDDUSSELDORF
JOHANNESBURGKUALA LUMPUR
LONDONMEXICO
MONTREALNEW DELHI
PANAMAPARIS
sAO PAULOSINGAPORE
SYDNEYTOKYO
TORONTO

The Physics of Technology modules were produced by the Tech Physics Project, which wasfunded by grants from the National Science Foundation. The work was coordinated by theAmerican Institute of Physics. In the early planning stages, the Tech Physics Project receiveda small grant for exploratory work from the Exxon Educational Foundation.
The modules were coordinated, edited, and printed copy produced by the staff at IndianaState University at Terre Haute. The staff involved in the project included:
Philip DiLavoreJulius Sigler •.•Mary Lu McFallB. W. BarricklowStacy Garrett .•Elsie Green ...Donald Emmons
· . . . . . . . . . . •Editor· . . . . . . Rewrite Editor· Copy and Layout Editor
•. illustrator· ..•... Compositor· Compositor·Technical Proofreader
In the early days of the Tech Physics Project A. A. Strassenburg, then Director of the AlPOffice of Education, coordinated the module quality-control and advisory functions of theNational Steering Committee. In 1972 Philip DiLavore became Project Coordinator and alsoassumed the responsibilities of editing and producing the final page copy for the modules.
The National Steering Committee appointed by the American Institute of Physics has playedan important role in the development and review of these modules. Members of thiscommittee are:
J. David Gavenda, Chairman, University of Texas, AustinD. Murray Alexander, DeAnza CollegeLewis Fibel, Virginia Polytechnic Institute & State UniversityKenneth Ford, University of Massachusetts, BostonJames Heinselman, Los Angeles City CollegeAlan Holden, Bell Telephone LabsGeorge Kesler, Engineering ConsultantTheodore Pohrte, Dallas County Community College DistrictCharles Shoup, Cabot CorporationLouis Wertman, New York City Community College
This module was produced through the efforts of a number of people in addition to theprincipal authors. Laboratory experiments were developed with the assistance of DonaldMowery and Arthur Noxon. Illustrations were prepared by Robert Day, Daniel Rothwell,and Susan Snider. John Yoder, III, coordinated art work, and he also prepared the Instruc-tor's Manual. Reviews were provided by members of the Physics of Technology SteeringCommittee and participants in the NSF Chautauqua Program. Finally, Wendy Chytka typedthe various module drafts, coordinated preliminary publication efforts, and acted as a liaisonperson with the Terre Haute Production Center where final copy was being produced. To allof these persons, we are indebted.
Copyright © 1975 by Florissant Valley Community College. All rights reserved. Printed inthe United States of America. No part of this publication may be reproduced, stored in aretrieval system, or transmitted, in any form or by any means, electronic, mechanical,photocopying, recording, or otherwise, without the prior written permission of thepublisher.
Except for the rights to material reserved by others, the publisher and copyright ownerhereby grant permission to domestic persons of the United States and Canada for use of thiswork without charge in the English language in the United States and Canada after January1,1982. For conditions of use and permission to use materials contained herein for foreignpublication or publications in other than the English language, apply to the AmericanInstitute of Physics, 335 East 45th Street, New York, N.Y. 10017.

Section A . . . . . .What Guitars DoExperiment A-I. The Guitar and Its SoundsSummary of the Results of Experiment A-IVibrations .Transverse and Longitudinal PulsesVibrational Coupling ..Loudness and Amplitude . . . . . .Frequency and Pitch .Experiment A-2. Harmonics and Modes of OscillationSummary of the Results of Experiment A-2Node to Node Distances andFrequencies of Oscillation .The Quality of Sound and Patterns of VibrationThe Shape of the. Sound Board and theLocation of the BridgeSummary ...
22389
· 10· 12· 12.13· IS· 18
.20
.20
· 21· 21
Section B ., . . . .Qualitative Observations Suggest Quantitative ExperimentsExperiment B-1. The String Equation .Discussion of Experiment B-1 .....Loudness, Amplitude, and FrequencyFrequency Response of the GuitarExperiment B-2. Loudness and ResonanceDiscussion of Experiment B-2 .,Sound Intensity and DecibelsHearing Response .Intensity Level in PhonsSummary ...
.24
.24
.25
.29
.30· 31.32.36.36.41.43.44
Section C .. . . . .Traveling Waves on a String.Experiment C-I. Transverse Pulses on a Spring .Discussion of Experiment C-l .Traveling Waves on the Sound Board .Mixtures of Harmonics .Longitudinal Sound Waves in AirHarmony and Musical Scales . . .
.48
.48
.49· 51.58.58· 61.62

Experiment C-2. Guitar Scales .Summary . . . . . . . . . . . . . . . . . . . . . . . . . .
Work SheetsExperiment A-IExperiment A-2Experiment B-1Experiment B-2Experiment C-lExperiment C-2
. .67
.. 69
· 71· 73· 75· 77
...................................... 79· ............•......................... 81

The Guitar
In this module you will use a guitar tolearn about vibrations of objects, the natureof sound, principles of wave motion, and thephysical basis of music. Many of the conceptsand principles presented also apply in someway to other musical instruments and tonon-musical sounds. The concepts and prin-ciples can even be used to describe completelydifferent things, such as water waves and light.
There are no special prerequisites for thismodule. It is assumed that you know how tomeasure length and mass in the metric systemof units, given the proper equipment.
The following goals state what youshould be able to do after you have com-pleted this section of the module. These goalsmust be studied carefully as you proceedthrough the module and as you prepare forthe post-test. The example which follows eachgoal is a test item which fits the goal. Whenyou can correctly respond to any item likethe one given, you will know that you havemet that goal. Answers to the items appearimmediately following these goals.
1. Goal: Understand how the details ofguitar construction and how it is playedaffect its loudness, pitch, and quality.
Item: Plucking the lowest string of aguitar six or seven inches from the bridgeproduces a sound of a certain pitch andquality. Using the same guitar, howcould you produce a sound with thesame pitch but a more hollow quality?
ity and how the elasticity of a materialaffects its vibrations.
Item: Arrange the following objects inorder of increasing elasticity: a strip ofpaper, a wooden tongue depressor, athin, flat strip of steel.
3. Goal: Understand what is meant by thefundamental and its harmonics, and howthese can be produced in a string fixed atboth ends.
Item: How can you produce a guitarstring vibration consisting primarily ofthe fourth harmonic? Draw the patternof vibration for the fourth harmonic.
4. Goal: Know how the pitch and qualityof sound are related to string vibrations.
Item: A guitar string is plucked in anormal way and produces sound with acertain pitch. How can you raise thepitch by one octave without pluckingthe string again?
Answers to Items AccompanyingPrevious Goals
1. Pluck the same string exactly at itsmidpoint.
3. Pluck the string at the normal position,then touch it lightly at a point one-fourth of its length from either end.

Guitars are used to change vibrations ofa taut string into sound. Ancient Egyptianand Hittite carvings show guitar-type instru-ments being made and played as far back as3000 years ago. One might imagine a mantoying with the variations of his bow-string"twang" as the beginning of stringed instru-ments. By a combination of circumstance andintuition, craftsmen and players over genera-tions have developed the sound board, thefingerboard, more strings, a body, and soundholes in a variety of stringed instruments. Ourword "guitar" is much like the old Spanishword guitarra, which possibly was derivedfrom the 250o-year-old Sanskrit chhatur-tar,meaning "four strings."
The guitar of today is similar to the oldSpanish guitar with six strings and an "hour-glass" body. This type of guitar, shown inFigure 1, is one of the most popular ofinstruments. It is estimated that in the U.S.alone, there are I 5 to 20 million guitarowners.
To become more familiar with thisinstrument, do Experiment A-I.
SOUNDHOLE
TUNINGPEG

This experiment requires the use of atuned guitar, a guitar pitch pipe, a tin-can-and-wire telephone, and a long brass spring.
Directions to guide your initial study ofthe guitar are contained in the followingparagraphs. Each time you come to a num-bered question, write an answer based onyour observations on the work sheets pro-vided at the end of the module. (The guitarstrings are numbered beginning with thesmallest diameter, which is the ftrst or high-Estring, and going to the sixth string. Thecommon tuning of the guitar, starting fromthe first string, is E', B, G, D, AA, EE.)
E I
B 2G 3o 4
AA 5
EE 6
Remove the largest diameter string (thelow-E or sixth string) from your guitar.Stretch it tightly across your thumbs asshown in Figure 3 and pluck it with yourlittle ftnger. Notice that the "twang" is notvery loud.
PLUCK HERE\l'~
You might think that the sound hole ofa guitar picks up this quiet sound andamplifies it. You can check this assumptionby plucking the taut string while holding it
just over the sound hole. Be careful not totouch the guitar.
I. Is the sound louder? Does it sounddifferent? If so, how?
As you pluck the tightly held string, feelthe vibrations of your thumbs and hands. Thevibrating string causes a twang, but a soundalso emanates from your vibrating thumb.With your thumb about a centimeter awayfrom your ear, listen to the vibration. Com-pare the sound of the vibrating string and thesound of your vibrating thumb. By lightlytouching your thumb to your ear you canhear its vibrations more loudly.
2. Describe the sounds caused by the vi-brating string and your vibrating thumb.How do these sounds differ?
You have just seen that a vibrating stringcreates sound in two ways: I. directly,which is the "twang" of the string, and2. indirectly, by vibrating whatever is con-nected to its ends. Either way, a vibratingobject causes sound. Walk around the lab andlook for a variety of objects with flat surfacessuch as a table, the floor, a wall, a window, adoor, a desk, the chalkboard, a cardboardbox, etc. Hold the string taut and press itunder one thumb against such a surface, as inFigure 4. Pluck the string. Do this for severalsurfaces.
3. What kind of surface best "sounds out"the vibrations you feel in your hand?
Using the same procedure, sound outdifferent places on the guitar.
4. Which spot on the guitar do you find isbest for producing the loudest sounds?
Sound coming from a vibrating surfaceconnected to a string may remind you of thestring-and-tin-can telephone which childrenoften make. It consists of a wire stretchedtightly between the bottoms of two tin cans.Each can has an open end into which you canspeak and listen.
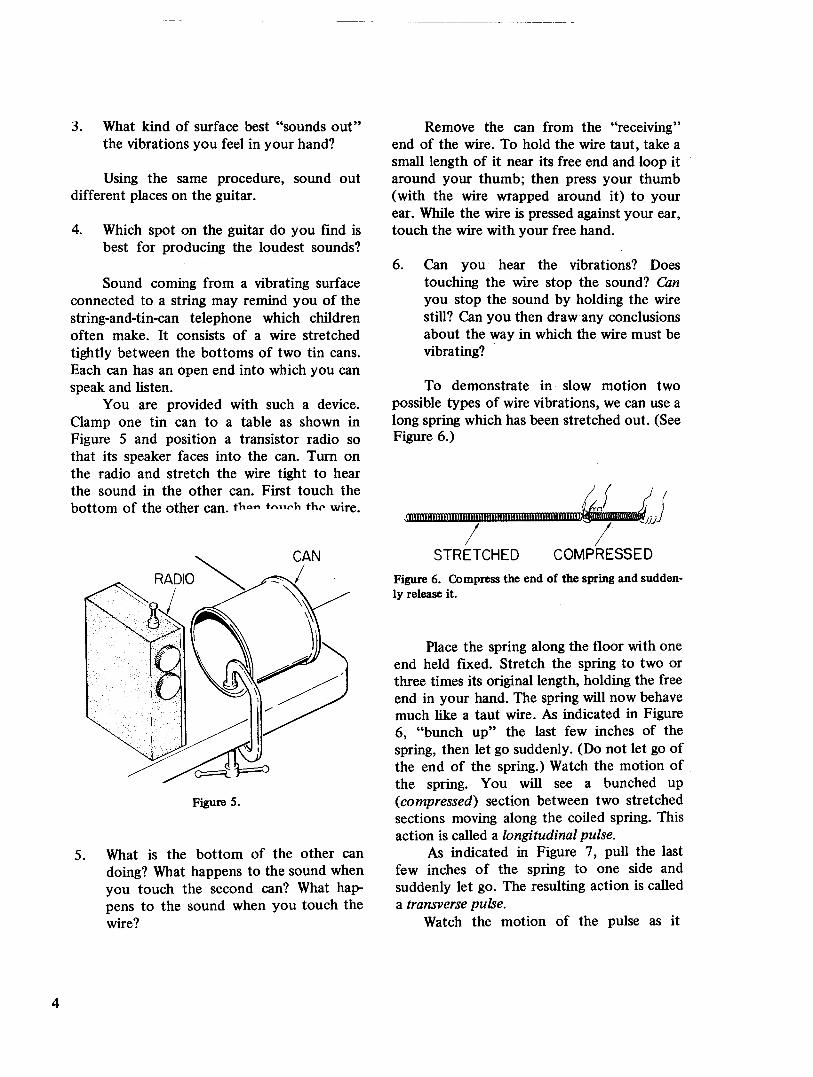
You are provided with such a device.Clamp one tin can to a table as shown inFigure 5 and position a transistor radio sothat its speaker faces into the can. Turn onthe radio and stretch the wire tight to hearthe sound in the other can. First touch thebottom of the other can. th•••.•tnllf'h thf' wire.
5. What is the bottom of the other candoing? What happens to the sound whenyou touch the second can? What hap-pens to the sound when you touch thewire?
Remove the can from the "receiving"end of the wire. To hold the wire taut, take asmall length of it near its free end and loop itaround your thumb; then press your thumb(with the wire wrapped around it) to yourear. While the wire is pressed against your ear,touch the wire with your free hand.
6. Can you hear the vibrations? Doestouching the wire stop the sound? Canyou stop the sound by holding the wirestill? Can you then draw any conclusionsabout the way in which the wire must bevibrating?
To demonstrate in slow motion twopossible types of wire vibrations, we can use along spring which has been stretched out. (SeeFigure 6.)
'1IIIIIII!lIIIInl!lIlll11l11l"II!1I!I""IIIt1I1UI!IIIl/!JuIJJmJ1T11lT1l~jj
/ /STRETCHED COMPRESSEDFigure 6. Compress the end of the spring and sudden-ly release it.
Place the spring along the floor with oneend held fixed. Stretch the spring to two orthree timesits original length, holding the freeend in your hand. The spring will now behavemuch like a taut wire. As indicated in Figure6, "bunch up" the last few inches of thespring, then let go suddenly. (Do not let go ofthe end of the spring.) Watch the motion ofthe spring. You will see a bunched up(compressed) section between two stretchedsections moving along the coiled spring. Thisaction is called a longitudinal pulse.
As indicated in Figure 7, pull the lastfew inches of the spring to one side andsuddenly let go. The resulting action is calleda transverse pulse.
Watch the motion of the pulse as it

STRETCHED\
Figure 7. Pull the spring to one side near the end andsuddently release it.
moves along the spring, hits the fixed end,and comes back to your hand.
Repeat this procedure a few times forboth types of pulses, paying attention to thefeeling in your hand when the pulse comesback and hits it. When a pulse hits the fixedend of the spring and comes back, we say thatthe pulse is reflected at that end. You candetect the reflected pulse best if you do notlet your hand touch the floor. To try acombination pulse, compress the last fewinches of the spring and simultaneously drawthe spring to one side, as shown in Figure 8,then let go.
~COMPRESSED
STRETCHED\
You have seen (and felt) that the ends ofa taut wire can vibrate with a side-to-sidemotion like that of a transverse pulse. Thevibration of the bottom of the tin can impliesthat a taut wire also vibrates with a to-and-fromotion like that of the longitudinal pulse onthe spring. You also found that the guitarbridge, where the vibrating strings are con-nected, is the best place on the guitar tosound out transverse vibrations.
Re-install the sixth string on the guitar.Following the instructions provided with yourguitar, tune the string. Then raise the sixth
string above the others by sliding a pencilunder it, but over the others somewhere nearthe nut. At or near its midpoint, carefullypluck the string so that transverse vibrationsare moving up and down (perpendicular tothe sound board). Pluck the string by holdingit between your thumb and forefinger, pullingit up, and letting it go. You can determine ifthe string is vibrating correctly by sightingwith your eye. Compare the loudness of thesound you hear to the loudness heard whenthe string is plucked so that its transversevibrations are parallel to the sound board.Repeat this observation several times to besure your results are dependable.
7. Which direction of vibration producesthe louder sound? What can you con-clude about the way vibrations are trans-ferred to the guitar bridge and soundboard? For either direction of vibration,how would you pluck the string if youwanted to produce an especially loudsound? Were you careful not to let thisway of changing the loudness influenceyour comparison of the sounds fromstrings vibrating in two different direc-tions?
When you installed the sixth string, youprobably noticed that its sound changed as thestring was tightened. Let us now find out howthe sounds of guitar strings are affected bytightening the strings or shortening them.
Remove the pencil and hold the guitar sothat you can pluck the guitar strings. Pluckthe six guitar strings, one at a time. A freelyvibrating guitar string is referred to as an openstring.
Pitch is a word we use to differentiatemusical tones. Wesay that one musical tone ishigher or lower in pitch than another. Or, thetwo tones may have the same pitch. Forexample, a woman's voice usually has a higherpitch than a man's. The pitch produced byplucking guitar strings becomes higher fromlargest string to the smallest string.

Pluck anyone of the six strings andlisten to its pitch. Shorten the portion of astring by pressing it with your finger so thatthe string is held firmly against the first fretbelow the nut. Now pluck the string again.Continue to shorten the string one fret at atime, pluck the string, and listen to the pitch.
8. Does the pitch go up or down as thestring is shortened? Does the same resulthold for all strings?
Pluck one of the strings with a guitarpick at a point over or near the sound hole.We call this sound rich or full. Next pluck thesame string near the bridge. The sound pro-duced is called tinny. Finally, pluck the samestring exactly at its middle. (The midpoint ishalfway between where the string crosses thenut and where it crosses the bridge.) Thissound is called hollow. Pluck the string ateach of these positions in succession. Can youdistinguish between these different sounds?Rich, tinny, and holloware examples ofwords used to describe the quality of sound.
Have your lab partner pluck anotherstring to produce one of these three kinds ofsounds. Turn your back. Ask him to pluck thestring in different places until you can correct-ly identify where he is plucking it each time.
Pluck a string near the sound hole with aguitar pick and with your finger or thumb.
9. How is the quality (rich, tinny, hollow)of the sound affected by using a pick?
Strum the fifth string with the soundhole open, and again when it is covered withan index card. You may want to cover anduncover the sound hole a few times while oneof the strums is soun.ding.
10. Describe any difference you hear in tonequality.
With the hole covered, pluck the stringat the place that would ordinarily result in arich sound. Then uncover the hole and pluckthe string so as to produce first a tinny soundand then a hollow sound.
11. Does covering the hole cause the soundproduced by a normal strum to changefrom rich to either tinny or hollow?
Pluck each of the other guitar stringsnear the sound hole, while covering anduncovering the hole.
12. Does the open sound hole emphasize anyparticular open string sounds more thanothers? If so, which strings are moststrongly emphasized?
Pluck a string near the sound hole so asto produce transverse vibrations that areparallel to the surface of the guitar finger-board. Then pluck the string to producevibrations that are perpendicular to the finger-board.
13. Is there any difference in the quality ofthese two sounds?
Let us now see how the tension (tight-ness) and diameter of a guitar string affect itspitch. Pluck the string which has the lowestpitch. By turning the tuning peg to which it isattached, increase the tension on the stringand pluck it again.
14. What effect does increasing the tensionof a string have on its pitch?
Following the instructions provided withyour guitar, tune each of the strings.
At the midpoint of the strings, tape aruler under the strings for use as a scale, asshown in Figure 9. Cut a small rubber bandso that you can loop a single strand around astring. Slip the rubber strand around the firststring above the ruler and grasp both looseends between your thumb and forefinger.You can now displace the string from itsnormal position by pulling along the ruler onthe rubber strand, and you can measure thedisplacement by sighting down on the ruler.
Use the rubber band to displace themidpoint of each string a fixed amount (say~ in). Measure the length of the stretchedrubber strand when it is holding a string in

J RULER -----n-----------n-----=======R=======o----- ~ ~
~ ~----------------------T--- -- -------- - --------- -j-~ QUARTER-INCH I
DISPLACEMENT
this displaced position. You can do this bytaking the reading on the ruler where you areholding the open ends of the rubber band andsubtracting it from the reading on the ruler atthe place where the rubber band pulls on theguitar string. This length is a measure of theforce required to hold the string in itsdisplaced position, and this force increaseswith the tension in the string. Thus bycomparing the lengths of the stretched rubberstrands required to hold the various tunedstrings in equally displaced positions, you cancompare the tensions in the six tuned guitarstrings.
I~I
LENGTH OFSTRETCHEDRUBBER BAND
15. How do the tensions compare? Are theyabout the same or quite different?
Since the notes produced by pluckingguitar strings of equal length have differentpitches even when the string tensions areapproximately equal, something about thestrings themselves must affect the pitch.
16. What difference is there between anytwo of the six strings? How does thisfactor seem to affect pitch?
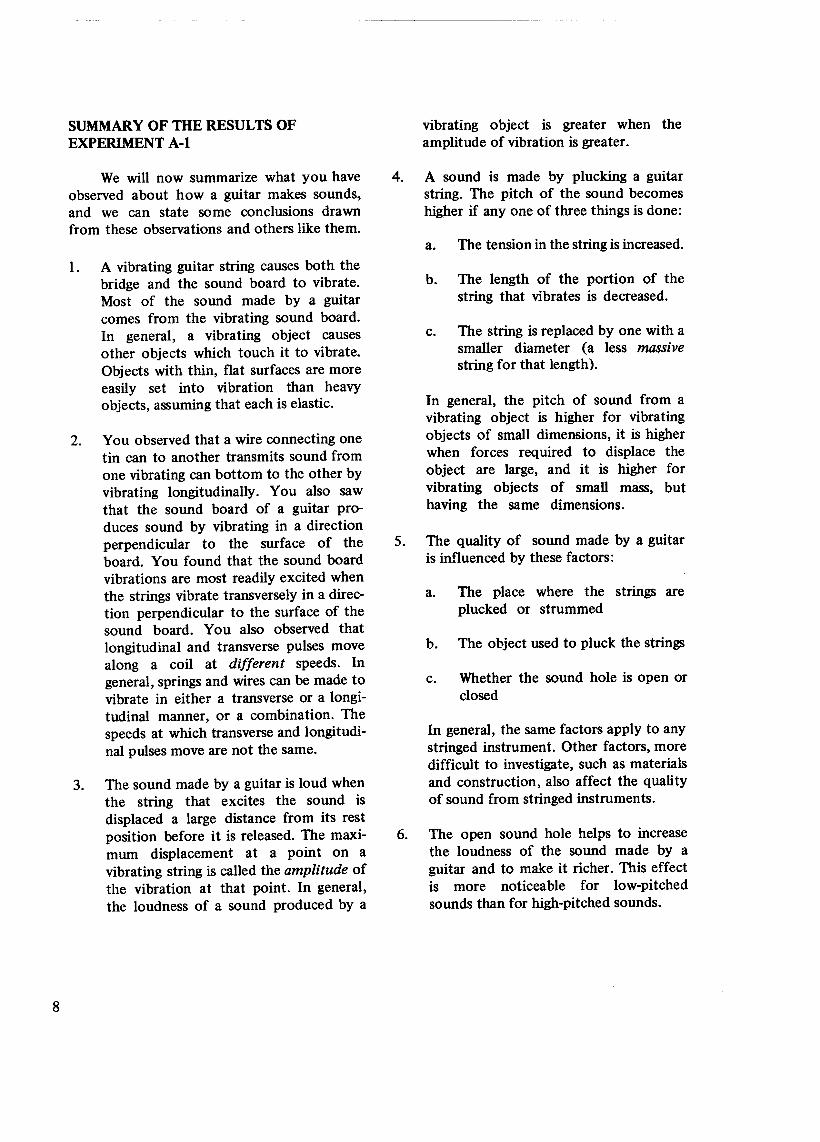
SUMMARY OF THE RESULTS OFEXPERIMENT A-I
We will now summarize what you haveobserved about how a guitar makes sounds,and we can state some conclusions drawnfrom these observations and others like them.
1. A vibrating guitar string causes both thebridge and the sound board to vibrate.Most of the sound made by a guitarcomes from the vibrating sound board.In general, a vibrating object causesother objects which touch it to vibrate.Objects with thin, flat surfaces are moreeasily set into vibration than heavyobjects, assuming that each is elastic.
2. You observed that a wire connecting onetin can to another transmits sound fromone vibrating can bottom to the other byvibrating longitudinally. You also sawthat the sound board of a guitar pro-duces sound by vibrating in a directionperpendicular to the surface of theboard. You found that the sound boardvibrations are most readily excited whenthe strings vibrate transversely in a direc-tion perpendicular to the surface of thesound board. You also observed thatlongitudinal and transverse pulses movealong a coil at different speeds. Ingeneral, springs and wires can be made tovibrate in either a transverse or a longi-tudinal manner, or a combination. Thespeeds at which transverse and longitudi-nal pulses move are not the same.
3. The sound made by a guitar is loud whenthe string that excites the sound isdisplaced a large distance from its restposition before it is released. The maxi-mum displacement at a point on avibrating string is called the amplitude ofthe vibration at that point. In general,the loudness of a sound produced by a
vibrating object is greater when theamplitude of vibration is greater.
4. A sound is made by plucking a guitarstring. The pitch of the sound becomeshigher if anyone of three things is done:
b. The length of the portion of thestring that vibrates is decreased.
c. The string is replaced by one with asmaller diameter (a less m~sivestring for that length).
In general, the pitch of sound from avibrating object is higher for vibratingobjects of small dimensions, it is higherwhen forces required to displace theobject are large, and it is higher forvibrating objects of small mass, buthaving the same dimensions.
5. The quality of sound made by a guitaris influenced by these factors:
a. The place where the strings areplucked or strummed
c. Whether the sound hole is open orclosed
In general, the same factors apply to anystringed instrument. Other factors, moredifficult to investigate, such as materialsand construction, also affect the qualityof sound from stringed instruments.
6. The open sound hole helps to increasethe loudness of the sound made by aguitar and to make it richer. This effectis more noticeable for low-pitchedsounds than for high-pitched sounds.

What causes an object to vibrate?A tuned guitar string that has not been
plucked is at rest. The string is under tension.Every piece of the string is being pulled byadjacent parts of the string. A particular piecedoes not move because the pulls exerted byits neighbors are equal in magnitude andopposite in direction (see Figure 10). Theresult is that any piece of the string feels nonet force.
FLEFT\-
ISMALL PIECE OF STRING
UNDER TENSION
If you grasp a piece of string and pull itaway from its rest position, neighboringpieces of string are pulled aside also, but notas far. As shown in Figure 11, the twoneighboring pieces of string now try to pullthe piece you are holding toward its originalrest position. The two forces are calledrestoring forces because they tend to restorethe string to its original position.
When you let go, the restoring forcesshown in Figure 11 cause the string to moveback toward its rest position. The forcesexerted by each side no longer cancel eachother. Instead they act together to pull thestring back toward its rest position.
( ..~~_. ,t.1 -.~-j :Y~~
~~-------- ---
IORIGINAL POSITION
The harder a string is pulled initially, thegreater is the displacement of the string. Thegreater the initial displacement, the greaterare the restoring forces; therefore, when it isreleased, the string will be moving faster whenit reaches its original rest position (called theequilibrium position).
Because the string is moving when itreaches the equilibrium position, it moves onpast. As soon as the piece of string youplucked has moved past the equilibrium posi-tion, its adjacent parts begin to pull it backtoward the equilibrium position as shown inFigure 12. The restoring forces, reversed indirection compared to those shown in Figure11, slow the string down and bring it to restwith a displacement opposite to its initialdisplacement. Then it moves again toward theequilibrium position. These processes repeatover and over, resulting in the back-and-forthmotion that we call vibration.
Question 1. Suppose that you suspend aweight on the end of a vertically held spring.When the weight is displaced downward andreleased, it will vibrate up and down. Describethis vibration in terms of restoring forces.
Question 2. Describe how restoring forcesproduce vibrations in some other physicalsituations: the bottom of the tin can in the"telephone" we discussed earlier, a rulerclamped to the edge of a table, and a tine of atuning fork.
How does a vibrating string cause otherthings near it to vibrate? If the string weretied down at its ends to immovable supportpoints, then only the string would vibrate andlittle sound would result. Suppose insteadthat one end of the string is attached to a
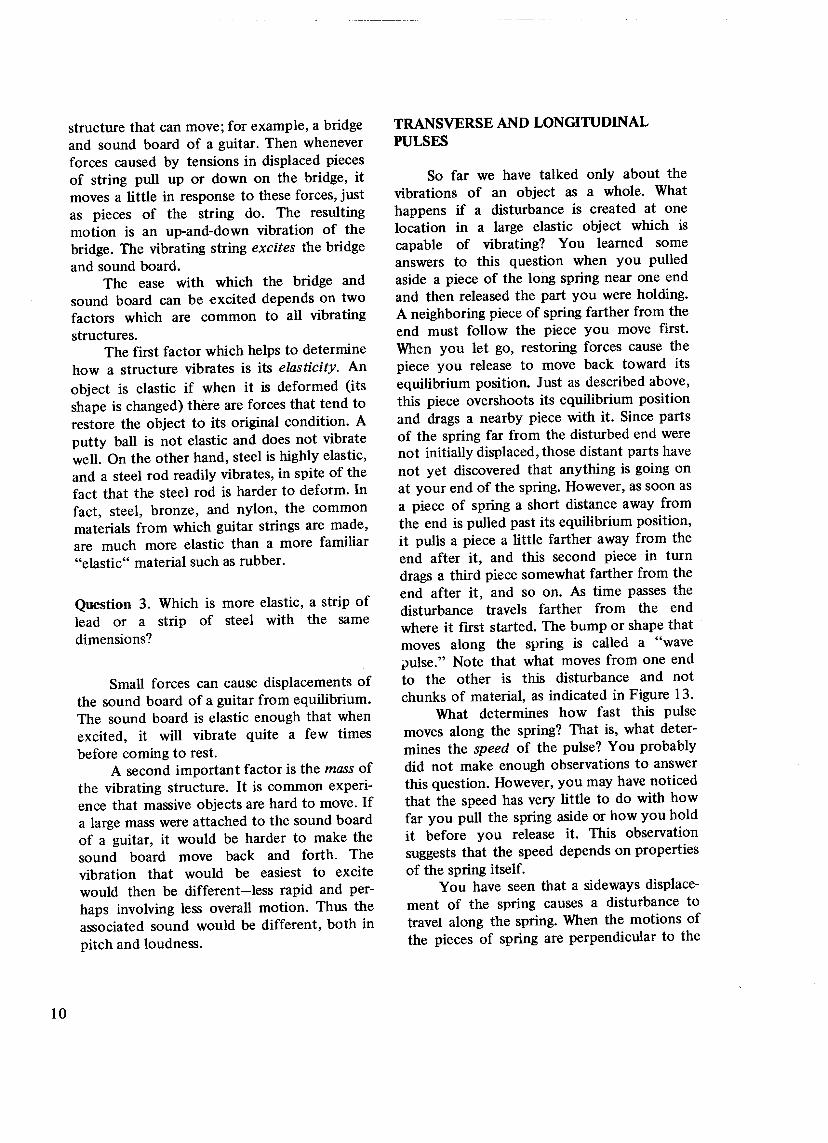
structure that can move; for example, a bridgeand sound board of a guitar. Then wheneverforces caused by tensions in displaced piecesof string pull up or down on the bridge, itmoves a little in response to these forces, justas pieces of the string do. The resultingmotion is an up-and-down vibration of thebridge. The vibrating string excites the bridgeand sound board.
The ease with which the bridge andsound board can be excited depends on twofactors which are common to all vibratingstructures.
The first factor which helps to determinehow a structure vibrates is its elasticity. Anobject is elastic if when it is deformed (itsshape is changed) there are forces that tend torestore the object to its original condition. Aputty ball is not elastic and does not vibratewell. On the other hand, steel is highly elastic,and a steel rod readily vibrates, in spite of thefact that the steel rod is harder to deform. Infact, steel, bronze, and nylon, the commonmaterials from which guitar strings are made,are much more elastic than a more familiar"elastic" material such as rubber.
Question 3. Which is more elastic, a strip oflead or a strip of steel with the samedimensions?
Small forces can cause displacements ofthe sound board of a guitar from equilibrium.The sound board is elastic enough that whenexcited, it will vibrate quite a few timesbefore coming to rest.
A second important factor is the mass ofthe vibrating structure. It is common experi-ence that massiveobjects are hard to move. Ifa large mass were attached to the sound boardof a guitar, it would be harder to make thesound board move back and forth. Thevibration that would be easiest to excitewould then be different-less rapid and per-haps involving less overall motion. Thus theassociated sound would be different, both inpitch and loudness.
TRANSVERSE AND LONGITUDINALPULSES
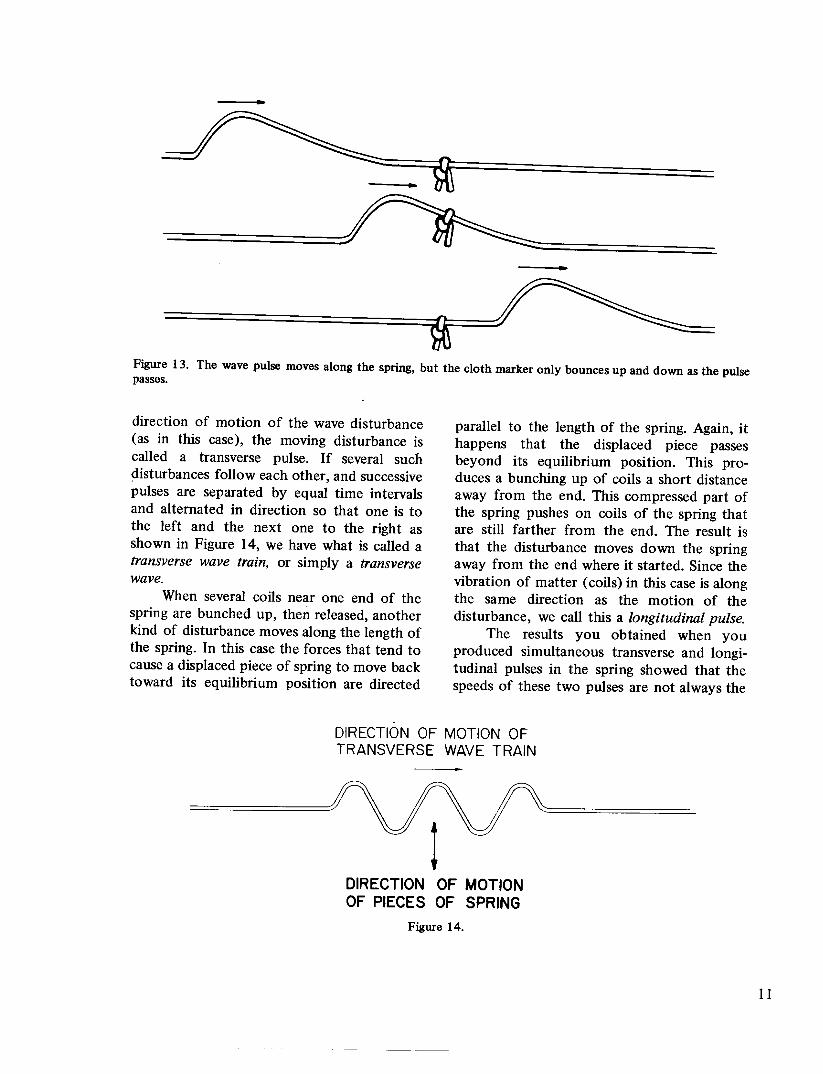
So far we have talked only about thevibrations of an object as a whole. Whathappens if a disturbance is created at onelocation in a large elastic object which iscapable of vibrating? You learned someanswers to this question when you pulledaside a piece of the long spring near one endand then released the part you were holding.A neighboringpiece of spring farther from theend must follow the piece you move first.When you let go, restoring forces cause thepiece you release to move back toward itsequilibrium position. Just as described above,this piece overshoots its equilibrium positionand drags a nearby piece with it. Since partsof the spring far from the disturbed end werenot initially displaced,those distant parts havenot yet discovered that anything is going onat your end of the spring. However, as soon asa piece of spring a short distance away fromthe end is pulled past its equilibrium position,it pulls a piece a little farther away from theend after it, and this second piece in turndrags a third piece somewhat farther from theend after it, and so on. As time passes thedisturbance travels farther from the endwhere it first started. The bump or shape thatmoves along the spring is called a "wavejJulse." Note that what moves from one endto the other is this disturbance and notchunks of material, as indicated in Figure 13.
What determines how fast this pulsemoves along the spring? That is, what deter-mines the speed of the pulse? You probablydid not make enough observations to answerthis question. However,you may have noticedthat the speed has very little to do with howfar you pull the spring aside or how you holdit before you release it. This observationsuggests that the speed depends on propertiesof the spring itself.
You have seen that a sideways displace-ment of the spring causes a disturbance totravel along the spring. When the motions ofthe pieces of spring are perpendicular to the
~--.~-~=
-:::====.==========~-~
=====================~=~
Figure 13. The wave pulse moves along the spring, but the cloth marker only bounces up and down as the pulsepasses.
direction of motion of the wave disturbance(as in this case), the moving disturbance iscalled a transverse pulse. If several suchdisturbances follow each other, and successivepulses are separated by equal time intervalsand alternated in direction so that one is tothe left and the next one to the right asshown in Figure 14, we have what is called atransverse wave train, or simply a transversewave.
When several coils near one end of thespring are bunched up, then released, anotherkind of disturbance moves along the length ofthe spring. In this case the forces that tend tocause a displaced piece of spring to move backtoward its equilibrium position are directed
parallel to the length of the spring. Again, ithappens that the displaced piece passesbeyond its equilibrium position. This pro-duces a bunching up of coils a short distanceaway from the end. This compressed part ofthe spring pushes on coils of the spring thatare still farther from the end. The result isthat the disturbance moves down the springaway from the end where it started. Since thevibration of matter (coils) in this case is alongthe same direction as the motion of thedisturbance, we call this a longitudinal pulse.
The results you obtained when youproduced simultaneous transverse and longi-tudinal pulses in the spring showed that thespeeds of these two pulses are not always the
DIRECTION OF MOTION OFTRANSVERSE WAVE TRAIN
~--
DIRECTION OF MOTIONOF PIECES OF SPRING

same, even when they occur in the samespring.
Question 4. We have not tried to find outwhat properties of the spring the speeds ofthe longitudinal and transverse pulses dependon. How can we conclude that the two speedsmust depend to some degree on differentproperties of the spring?
As in the case of transverse pulses, it ispossible to produce a sequence of longitudinalpulses that would be referred to as a longitud-inal wave train.
Question S. Roughly sketch the appearanceof a longitudinal wave train, as it wouldappear moving along a spring like the one youused in Experiment A-I.
When one vibrating structure excitesanother, we say there is vibrational couplingbetween them. If the material of the secondstructure vibrates weakly, even though thefirst medium vibrates strongly, we say thatthe coupling is weak. Whether the coupling isweak or strong depends on the direction ofvibration of the original wave.
For example, the sound board of a guitaris sufficiently elastic only in the directionperpendicular to its surface. We cannot excitevibration of the sound board by coupling thebridge to a guitar string that is vibrating onlyin the longitudinal direction. You also notedthat the coupling was better for a transversevibration in a direction perpendicular to thesurface of the sound board than for a trans-verse vibration parallel to that surface, thoughthe latter did produce some sound. Much ofthis sound resulted from unavoidable vibra-tions of the string in a perpendicular directionrather than from vibrations of the bridge in adirection parallel to the surface of the soundboard.
How is the vibration of the sound boardcoupled to your eardrum? Air itself vibrates
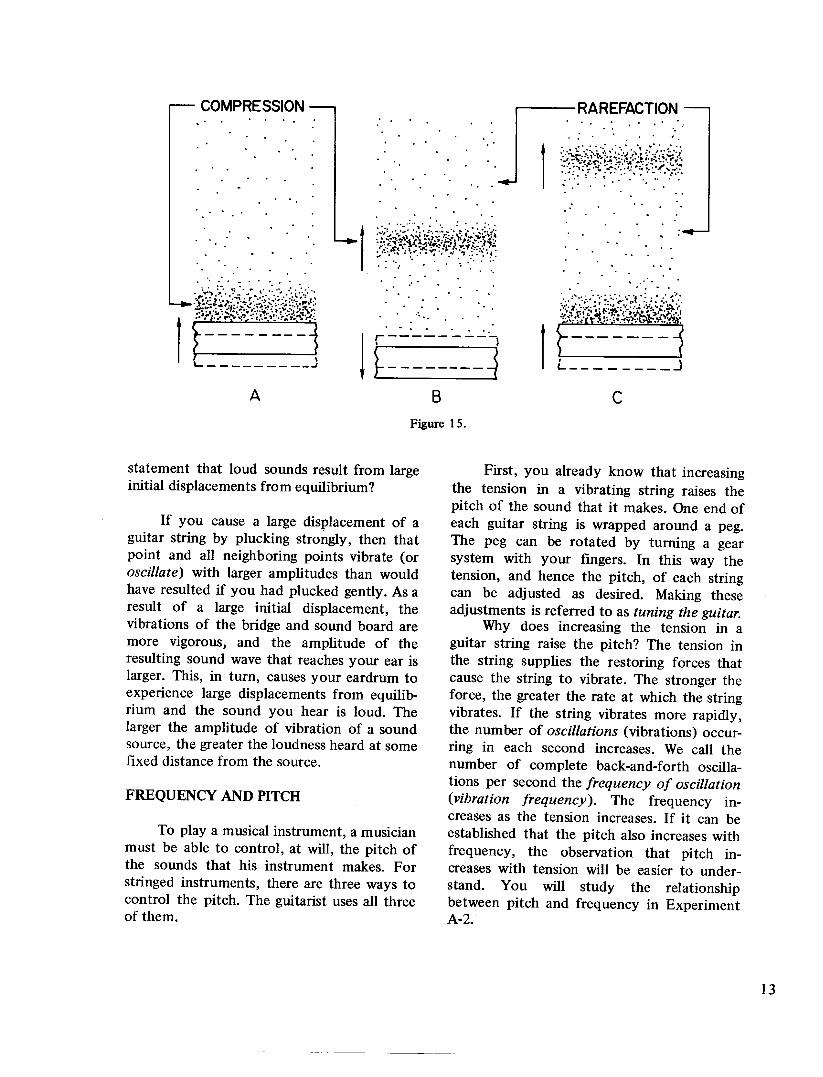
and this vibration produces the sensation wedescribe as "hearing." The sound board iscoupled to the air near it. Whenever thesound board moves up, it compresses the airnear it as indicated in Figure 15A. (This effectis similar to that in which you bunched upsome coils of the long spring in ExperimentA-I.) This region of compressed air (called acompression) then moves away from thesound board.
When the sound board moves down, thepressure of the air nearby is reduced, asindicated in Figure 15B. This region of lowerpressure is called a rarefaction. When nearbyair rushes in to fill this rarefied region, a pulseof rarefaction moves away from the soundboard. As shown in Figure 15C, a successionof alternate compressions and rarefactionsconstitutes a longitudinal wave train, called asound wave, that moves away from the soundboard in all directions. When these longitudi-nal waves reach an eardrum, the alternatingpulses of higher and lower air pressure causethe eardrum to vibrate just as the bottom ofthe tin can was caused to vibrate by the wavepulses in the wire. The eardrum is thuscoupled to the vibrations that occurred at thesound board at a somewhat earlier time.
Question 6. Using a sketch, describe howcompressions and rarefactions of air movinglongitudinally from your mouth to the insideof a tin-can telephone make the tin canbottom vibrate.
If your eardrum does not vibrate, youhear no sound. If the amplitude of eardrumvibration is small, that is, if the eardrummoves only a small distance away from itsequilibrium, or rest position, the sound youhear is "soft," or quiet. If the ,displacementsof the eardrum from equilibrium are larger,then the sound heard is louder.
Question 7. What evidence can you cite fromyour own experience which supports the
statement that loud sounds result from largeinitial displacements from equilibrium?
If you cause a large displacement of aguitar string by plucking strongly, then thatpoint and all neighboring points vibrate (oroscillate) with larger amplitudes than wouldhave resulted if you had plucked gently. As aresult of a large initial displacement, thevibrations of the bridge and sound board aremore vigorous, and the amplitude of theresulting sound wave that reaches your ear islarger. This, in turn, causes your eardrum toexperience large displacements from equilib-rium and the sound you hear is loud. Thelarger the amplitude of vibration of a soundsource, the greater the loudness heard at somefixed distance from the source.
To playa musical instrument, a musicianmust be able to control, at will, the pitch ofthe sounds that his instrument makes. Forstringed instruments, there are three ways tocontrol the pitch. The guitarist uses all threeof them.
First, you already know that increasingthe tension in a vibrating string raises thepitch of the sound that it makes. One end ofeach guitar string is wrapped around a peg.The peg can be rotated by turning a gearsystem with your fingers. In this way thetension, and hence the pitch, of each stringcan be adjusted as desired. Making theseadjustments is referred to as tuning the guitar.
Why does increasing the tension in aguitar string raise the pitch? The tension inthe string supplies the restoring forces thatcause the string to vibrate. The stronger theforce, the greater the rate at which the stringvibrates. If the string vibrates more rapidly,the number of oscillations (vibrations) occur-ring in each second increases. We call thenumber of complete back-and-forth oscilla-tions per second the frequency of oscillation(vibration frequency). The frequency in-creases as the tension increases. If it can beestablished that the pitch also increases withfrequency, the observation that pitch in-creases with tension will be easier to under-stand. You will study the relationshipbetween pitch and frequency in ExperimentA-2.

Another factor that determines the pitchis the mass of the string. Massivestrings makelower-pitched sounds than less massivestringsof the same length under the same tension.This fact is used to help the guitarist makesounds with different pitches. The six stringson a guitar have the same lengths, butdifferent thicknesses, and therefore differentmasses. When the guitar is tuned, all thestrings are under approximately the same ten-sion. The six strings, when plucked, makesounds that have six different pitches. Thesedifferences result from the different massesofthe strings.
Why does a massive string make a lower-pitched sound than a less massive string? It ismore difficult to speed up an object withlarge mass than one with small mass. It seemsreasonable that a given restoring force causesa massive string to vibrate less rapidly (withlower frequency) than a less massive string.Again, you might suspect that pitch is relatedto frequency of oscillation.
If there were no other way to change thepitch of the sound made by a guitar string, aguitarist could only play songs composed ofsix particular notes. In fact, on instrumentslike a piano, each string produces only onenote. However, there is a third way toincrease the pitch of a guitar string. This isdone by shortening the part of the string thatvibrates. Why does a shorter string produce ahigher pitch? You might be tempted toanswer that this is just another example of themass effect that we discussed earlier. That is,you might say that since a short piece of agiven kind of string has less mass than a longpiece, the short piece is easier to move. Butthis is not the correct answer. If you were tocompare two strings of the same mass butdifferent lengths, the shorter one would stillmake a sound with a higher pitch. Why does ashorter string produce a higher pitch? Thefollowing experiment will help you answerthis question.
String musicians use a particular aspectof string vibrations called harmonics. In thisexperiment you will learn how to produceharmonics in a vibrating string. You will alsoobserve these same harmonics in a long spring.
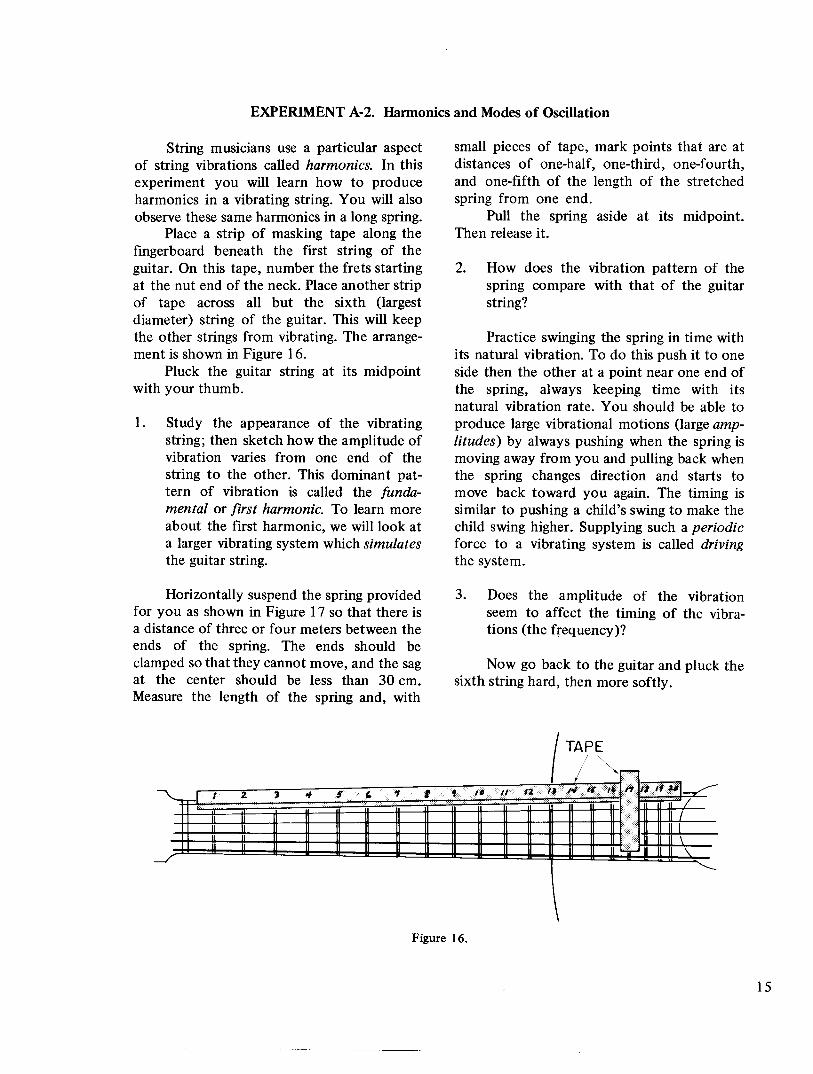
Place a strip of masking tape along thefingerboard beneath the first string of theguitar. On this tape, number the frets startingat the nut end of the neck. Place another stripof tape across all but the sixth (largestdiameter) string of the guitar. This will keepthe other strings from vibrating. The arrange-ment is shown in Figure 16.
Pluck the guitar string at its midpointwith your thumb.
1. Study the appearance of the vibratingstring; then sketch how the amplitude ofvibration varies from one end of thestring to the other. This dominant pat-tern of vibration is called the funda-mental or first harmonic. To learn moreabout the first harmonic, we will look ata larger vibrating system which simulatesthe guitar string.
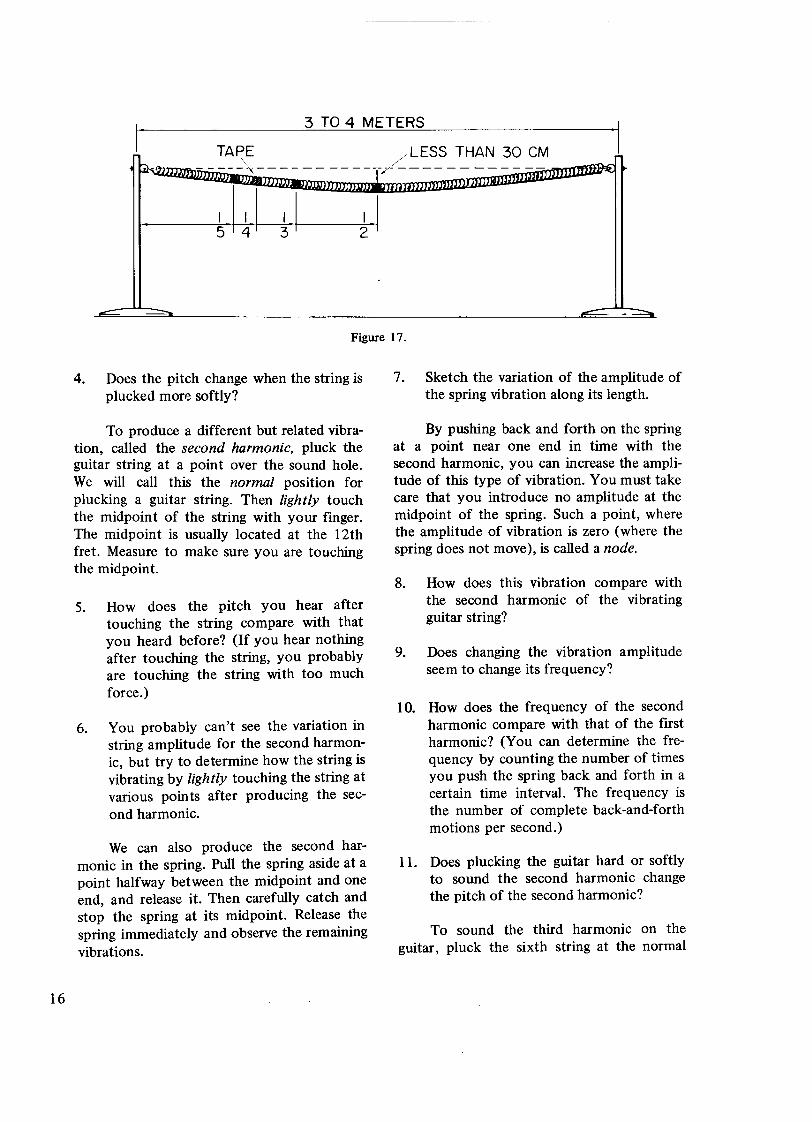
Horizontally suspend the spring providedfor you as shown in Figure 17 so that there isa distance of three or four meters between theends of the spring. The ends should beclamped so that they cannot move, and the sagat the center should be less than 30 em.Measure the length of the spring and, with
small pieces of tape, mark points that are atdistances of one-half, one-third, one-fourth,and one-fifth of the length of the stretchedspring from one end.
Pull the spring aside at its midpoint.Then release it.
2. How does the vibration pattern of thespring compare with that of the guitarstring?
Practice swinging the spring in time withits natural vibration. To do this push it to oneside then the other at a point near one end ofthe spring, always keeping time with itsnatural vibration rate. You should be able toproduce large vibrational motions (large amp-litudes) by always pushing when the spring ismoving away from you and pulling back whenthe spring changes direction and starts tomove back toward you again. The timing issimilar to pushing a child's swing to make thechild swing higher. Supplying such a periodicforce to a vibrating system is called drivingthe system.
3. Does the amplitude of the vibrationseem to affect the timing of the vibra-tions (the frequency)?
Now go back to the guitar and pluck thesixth string hard, then more softly.
TAPE~
3 TO 4 METERS
LESS THAN 30 eMb_.~ -\ -~ ~
I I I I I5 4 3[ 2
~ =.. ~ ---
4. Does the pitch change when the string isplucked more softly?
To produce a different but related vibra-tion, called the second harmonic, pluck theguitar string at a point over the sound hole.We will call this the normal position forplucking a guitar string. Then lightly touchthe midpoint of the string with your finger.The midpoint is usually located at the 12thfret. Measure to make sure you are touchingthe midpoint.
5. How does the pitch you hear aftertouching the string compare with thatyou heard before? (If you hear nothingafter touching the string, you probablyare touching the string with too muchforce.)
6. You probably can't see the variation instring amplitude for the second harmon-ic, but try to determine how the string isvibrating by lightly touching the string atvarious points after producing the sec-ond harmonic.
We can also produce the second har-monic in the spring. Pull the spring aside at apoint halfway between the midpoint and oneend, and release it. Then carefully catch andstop the spring at its midpoint. Release thespring immediately and observe the remainingvibrations.
7. Sketch the variation of the amplitude ofthe spring vibration along its length.
By pushing back and forth on the springat a point near one end in time with thesecond harmonic, you can increase the ampli-tude of this type of vibration. You must takecare that you introduce no amplitude at themidpoint of the spring. Such a point, wherethe amplitude of vibration is zero (where thespring does not move), is called a node.
8. How does this vibration compare withthe second harmonic of the vibratingguitar string?
9. Does changing the vibration amplitudeseem to change its frequency?
10. How does the frequency of the secondharmonic compare with that of the firstharmonic? (You can determine the fre-quency by counting the number of timesyou push the spring back and forth in acertain time interval. The frequency isthe number of complete back-and-forthmotions per second.)
11. Does plucking the guitar hard or softlyto sound the second harmonic changethe pitch of the second harmonic?
To sound the third harmonic on theguitar, pluck the sixth string at the normal

position, then lightly touch the string at apoint one-third the length of the string fromthe nut. This point is at the seventh fret.
12. How does this pitch compare with thatof the ftrst and second harmonics?
13. Can you produce this same pitch bytouching a point one-third the lengthfrom the bridge end of the string?
As before, use the spring to more clearlyobserve the third harmonic. Pull the springaside and release it. Stop its motion at a pointone-third its length from either end. Releasethe spring and observe the resulting vibra-tions.
14. Sketch how the amplitude of the vibra-tion varies along the length of the spring.
Drive the spring near its end as you havedone for the other two harmonics to producea large-amplitude third harmonic. Now ob-serve the two nodes between the ends of thespring. Whereare they?
15. How does the frequency of this thirdharmonic compare with those of the firstand second?
To produce the fourth harmonic, wherewill you have to touch it after plucking? Tryit and see if it works. (You may have to pluckthe string at a point nearer the bridge to hearthe fourth harmonic.)
16. How does the pitch of the fourth har-monic compare with those of the otherharmonics?
17. The fourth harmonic can be producedby touching the string at a differentpoint. Where is this point? Try it to seeif it works.
While the fourth harmonic is sounding,touch the midpoint of the string.
18. Can you still hear the fourth harmonic?Try the same thing with the thirdharmonic.
To produce the fourth harmonic in thespring, pull it aside near one end and stop it atthe correct point. (Where is this point?) Re-lease the spring and observe its vibrations.
19. Sketch how the amplitude of the vibra-tion varies along the length of the spring.
20. How do the frequencies of the fourharmonics compare?
Produce the ftfth harmonic in the guitarstring.
21. How does the resulting pitch comparewith the pitch of the other harmonics?
22. Can you produce the fifth harmonic bytouching points that are two-ftfths,three-ftfths, or four-ftfths the length ofthe string from the nut?
Drive this fifth harmonic to large ampli-tude as you have done before.
24. How does the frequency of this vibrationcompare with that of the previousharmonic?
25. How would you produce the sixth,seventh, or any other harmonic in theguitar string?
26. Do you think the position at which thestring is plucked affects the number ofharmonics generated and their ampli-tudes?
Try producing the second harmonic afterplucking the string at various points.

27. Did you pluck at any points and findthat you could not produce the secondharmonic? If so, where were thesepoints?
Try producing the third harmonic afterplucking at various points.
28. Did you pluck at any points and findthat you could not produce the thirdharmonic? If so, where were thesepoints?
SUMMARY OF THE RESULTSOF EXPERIMENT A-2
You have observed the appearance of aguitar string sounding its lowest-pitchedsound. A multi-exposure photograph of thestring made at very short time intervals mightlook like Figure 18, with each line being adifferent position of the string. We call theresulting tone the fundamental or first har-monic. This is also the pattern of transversevibrations in a spring when it is vibrating at itslowest possible frequency.
ANTI NODENODE • NODE
~-=--~When a guitar string vibrates so as to
produce the pattern shown in Figure 19, thepitch of sound emitted raises to an octaveabove the fundamental. We call this higherpitch the second harmonic. When a springvibrates in this pattern, its frequency ofvibration is two times its lowest (funda-mental) frequency. Thus, a one-octave in-crease occurs when the frequency of vibrationis doubled.
We call a point where no vibrationoccurs a node. The points of maximumvibration amplitude are called antinodes.
Question 8. Where are nodes located in thestring vibration shown in Figure 19? Whereare the antinodes located? How many of eachare there?
Question 9. If Figures 18 and 19 refer to thesame guitar string, how does the distancebetween nodes in Figure 18 compare with thedistance between nodes in Figure 19? How dothe frequencies compare?
Whenever the pattern of vibration on aguitar string changes in such a way as to addanother antinode, and thus another node, thepitch of the sound becomes higher. When aspring vibrates in a pattern that has threeantinodes, the frequency of vibration is threetimes as great as the lowest possible fre-quency. We would conclude that a guitarstring does the same thing.
Question 10. A string vibrates in a patternwhich has seven antinodes. Sketch a multi-exposure "photograph" of this pattern. Howmuch higher is the frequency of this oscilla-tion than when the string vibrates at itsfundamental? How many nodes are there?
The pitch of a sound is determined bythe frequency of the vibration that produces
. the sound. Also, there is a relationship be-tween the frequency of vibration of a stringand the distance between nodes. When thedistance between nodes is halved, the fre-quency is doubled.
When a guitar string is plucked at thenormal position, or at almost any randomlychosen point, many harmonics are produced.However, a harmonic that corresponds to a

pattern of vibration with a node at theexcitation point cannot be produced. For ex-ample, you cannot produce the second har-monic by plucking the string at its midpoint.
The quality of sound from a guitar varieswith the point at which the string is plucked.This suggests that the quality of a sound isrelated to the harmonic content of the sound.That is, whether you hear a rich sound or a
tinny sound depends on the number ofharmonics present and the amplitude of each.In music theory, the word "harmonic" refersto a tone made up of all of the complexvibrations which are left after a string isplucked and then touched at some point. Inphysics, "harmonic" refers to a single simplevibration. You will study this aspect ofharmonics more carefully later in the module.

NODE-TQ-NODEDISTANCESANDFREQUENCIES OF OSCILLATION
Experiment A-2 provided evidence that adifferent frequency is associated with eachsimple pattern of vibration. You saw thesimilarity between the pattern on a guitarstring that had been plucked at its midpointand a long spring vibrating so that only itsends are nodes. When the guitar string isplucked at some other point, such as thenormal position, almost the same basic pat-tern of vibration is visible. However, if thestring is plucked at its normal position andthen touched at the midpoint, vibration con-tinues but the pattern changes to that assoc-iated with the second harmonic (Figure 19).The pitch increases abruptly when this changetakes place. The new pitch is described bymusicians as being one octave higher.
When the long spring is vibrating and it isthen held at its midpoint so as to force themidpoint to become a node, the two halves ofthe spring may continue to vibrate in apattern that looks much like that shown inFigure 19. The frequency of this new patternis double the previous one. The conclusion isthat spring (and string) patterns with moreantinodes vibrate at higher frequencies andthe strings produce sounds of higher pitches.
You also noted that for each higherharmonic, one more node is added and, for agiven harmonic, the nodes are always equaldistances apart. Why are these patterns pos-sible and why do we not observe moreirregular patterns? Also, why does the fre-quency increase when the node-to-node dis-tance decreases? These are questions we willseek to answer in later sections of thismodule.
Finally, you observed that the particularmixture of harmonics excited by plucking astring depends on the details of how the stringis plucked. Can we predict the mixture thatwill result from any particular position ·of thestring just before it is released? We cannotgive a complete answer to this question now,but we will come back to it later in themodule. However, some aspects of the situa-tion are clear. If you want to produce the
second harmonic, or the fourth harmonic, orany even-numbered harmonic, you must notcause the midpoint to move, because themidpoint is a node for even harmonics. If youwant to produce the third harmonic, youmust be sure that the points one-third of thelength away from each end are at rest, etc.
mE QUALITY OF SOUNDANDPATTERNS OF VIBRATION
Associated with each pattern of vibra-tion of a string-or any vibrating structure-isa particular pitch. Depending on how thevibration is started, the overall pattern may becomplex in the sense that it includes amixture of simple patterns (harmonics). Whenthis occurs, the pitch that the human earrecognizes is the pitch associated with thelowest harmonic that is present to a signifi-cant degree. However, the quality of thesound is determined by the particular har-monics present, depending both on the num-ber of harmonics that are included and on theamplitudes of these harmonics.
Why does strumming the guitar at differ-ent places produce sounds of differentquality? It is because the particular mixtureof patterns present in a vibrating stringdepends on how the vibration is produced.Also, the difference in harmonic contentaccounts for the different sounds producedby different instruments when playing thesame tones.
Question 11. What harmonics are no t pro-duced when a string is strummed at a pointone-quarter of the way from one fixed end?
If the presence and absence of harmonicsdetermine the quality of a sound, why does anote stimulated by a pick sound differentfrom the same note stimulated by pluckingwith your fingers? The shape of the stringwhen it is first released after being displaceddetermines the amplitudes of the variousharmonics that are present. The shape of astring that is pushed aside by a rounded fingeris different than the shape of a string that ispushed aside by a point pick.

You have seen that the qualities of thesounds made by a guitar when the sound holeis closed and when it is open are different, atleast for low-pitched sounds. What does thesound hole have to do with the vibrationpatterns of the guitar? A vibrating structurecauses other structures with which it iscoupled to vibrate. The air inside the body ofthe guitar is caused to vibrate by the soundboard and, in turn, helps the sound board tovibrate. However, the simple vibration pat-terns for one structure (like a guitar string)may be quite different from those for anearby structure (like a sound board) forcedto vibrate at the same frequency. When thisoccurs, vibrations in the ftrst structure do notexcite large-amplitude vibrations in the sec-'ond structure.
It is the job of a guitar designer to makesure that all the principal structures-thestrings, the sound board, and the air in thesound box-vibrate at the same frequencies.While this goal is partially achieved in everyguitar, perfect matching at all frequencies isnot possible. For example, the air inside thebody of the guitar vibrates more easily at lowfrequencies than at high frequencies. Thus thequality of low-pitched sounds is influenced toa greater degree by the vibrations of the air inthe sound box. When the sound hole is closed,the coupling of vibrations of air inside thesound box to the air outside is destroyed. Themixture of patterns producing the sound isaltered, and the quality of the sound changes.
THE SHAPEOF THE SOUNDBOARDAND THE LOCATIONOF THE BRIDGE
Wehave already mentioned the influenceof the size of a vibrating structure on thepitch of the sound it produces. We alsodiscussed the influence of the method ofexciting a vibration on the mixture of simplepatterns of vibration that are stimulated andhence on the quality of the sound. Since thesound board is the guitar structure that iscoupled most strongly to the air, which in turntransmits sound vibrations to our eardrums, itis important to understand what the soundboard does.
The sound board, like every elastic struc-ture, is capable of vibrating. A particularsound board vibrates in various patterns thatare determined by its shape and construction.As for strings, there are nodes in thesepatterns. However, instead of nodes at singlepoints, as in the string, there are nodal linesand/or points along which there is no oscilla-tion. For example, the outer edge of thesound board is not very free to oscillate. So itforms a nodal line.
A particular structure vibrates easilyonly at certain frequencies that are deter-mined by the size and shape of the structure.You may then wonder how the sound board,which does not change its size, can amplify allthe different pitches produced by the strings.(These pitches vary from string to string andchange as the vibrating length of each string ischanged.) Any elastic structure can be forcedto vibrate at any frequency. This is true forfrequencies different from those at which itvibrates when abruptly excited (for example,by being plucked) and left to vibrate natur-ally. However, the amplitudes of forced vibra-tionsare very small at frequencies that aregreatly different from the "natural" frequen-cies of the structure. The sound board mustbe stimulated at vibration frequencies that arenot greatly different from those at which itwould vibrate naturally.
The location of the bridge is chosen sothat the vibrations of the strings are mosteasily transmitted to the sound board.
In this section you have learned thatsound is produced by the vibration of mate-rial objects. In a guitar, the ultimate source ofthe sound is the vibrating string. The stringtransmits its transverse vibrations through thebridge to the sound board, which transfers thesound to the air.
The larger the amplitude of vibration,the louder is the sound produced. The pitchof the sound from an open guitar stringdepends on the length of the string, thetension in the string, and the mass per unitlength of the string. The pitch may be

increased by making the string shorter, byincreasing the tension, or by decreasing themass per unit length. The quality of the guitarsound (rich, hollow, tinny, etc.) depends onhow the string is set into vibration.
You learned that when an object isdisplaced from equilibrium, restoring forces inthe material cause vibrations by producing anovershoot as the object returns. Any objectwith restoring forces is said to be elastic or tohave elasticity. Also required for vibration isflexibility, which is the ability to bend ordistort. An object can be elastic without beingvery flexible or flexible without being veryelastic, but both properties are required forease of vibration. The sound board of a guitaris elastic and flexible, so that it is easily setinto vibration by the string to produce longi-tudinal waves in the air which your earsdetect as sound.
You have seen that a string fixed at bothends vibrates in various basic patterns. Thesepatterns are characterized by nodes (pointswhere the string is not moving) and antinodes(points where the string is moving the most).The simplest such pattern, with a node ateach end and an antinode at the center only,
is called the fundamental. Basicpatterns withmore nodes and antinodes (still always with anode at each end) are called harmonics, andthey are numbered. The harmonic number isthe same as the number of antinodes present.Several such basic patte-rns, or harmonics, areusually present at the same time, givingrise toa more complex vibration. This is usually thecase on a guitar string. A harmonic may beremoved from a complex vibration on a stringby touching the string lightly at the positionof an antinode of that harmonic.
The fundamental has the lowest fre-quency of vibration for a particular string.Each harmonic has a vibration frequency thatis an integral multiple of the fundamental.The frequency of the second harmonic istwice that of the fundamental. (In musicallanguage, the pitch is defined to be one octavehigher.) The third harmonic is three times thefundamental frequency, etc.
Finally, you saw that the pitch of thesound from a guitar string is determined bythe lowest frequency present (the funda-mental if it hasn't been removed). The pro-portions of the various harmonics that arepresent determine the quality of the sound.

The following goals state what youshould be able to do after you have com-pleted this section of the module. These goalsshould be studied carefully as you proceedthrough the module and as you prepare forthe post-test. The example which follows eachgoal is a test item which fits the goal. Whenyou can correctly respond to any item likethe one given, you will know that you havemet that goal. Answers appear immediatelyfollowing these goals.
1. Goal: Know the mathematical relation-ship between fundamental frequency ofa vibrating string and tension, length,and mass.
Item: If you start with a tuned guitarstring and then turn the tuning peg untilthe tension is tripled, by what factordoes the fundamental frequency change?
2. Goal: Know the definitions of powerand intensity.
Item: A sound wave enters a squarewindow 1.5 m on a side, with a power of
-23 X lOW spread evenly over the sur-face. What is the sound intensity at thewindow?
3. Goal: Understand the concept of inten-sity level.
Item: The background noise in a roomhas an intensity level of 20 dB. If thatnoise level doubles in intensity, what isthe new intensity level?
4. Goal: Understand the whole-populationhearing ability curves (Figure 27).
Item: If "normal" hearing is defined bythe bottom curve in Figure 27, whatpercent of the population has impaired(worse than normal) hearing?
5. Goal: Understand the concept of loud-ness level.
Item: What intensity level of sound isrequired at 200 Hz to produce a loud-ness level of 30 phons?
Answers to Items AccompanyingPrevious Goals

QUAUTATIVE OBSERVATIONS SUGGESTQUANTITATIVE EXPERIMENTS
In Section A you made observations of aguitar and other vibrating objects. In this wayyou discovered many things about guitarbehavior. For example, the frequencies ofoscillation of the strings determine the pitchesof the sounds made by a guitar. Thesefrequencies can be increased by increasing thetension in the strings, by decreasing the massof the strings, or by decreasing the length ofthe strings. While these statements contain asubstantial amount of useful information,they are qualitative in nature. You did notdiscover in Section A how much frequencychanges for measured changes in string ten-sion, mass, and length. You can gain moreinsight into guitar behavior, and the operationof other vibrating systems as well, by per-forming quantitative experiments in order todiscover the mathematical relationship amongall the factors that influence frequency.
Then the first goal is to find an equationrelating frequency (j), tension (T), mass (m),and length (L) of a string; the string equation.Your earlier experiments were useful becausethey helped you to identify the importantfactors, or variables. However, you were nottrying to measure things quantitatively at thattime. You did not worry about the values ofthe variables, or how much they changedfrom one observation to another. You evenallowed several variables to change simulta-neously. That is, you did not attempt tocontrol the variables.
Now is the time to be more careful andmore systematic. In this experiment you can
change anyone of the three quantities (ten-sion, mass, and length) without changing theother two. We call such quantities which canbe varied independently of each other inde-pendent variables. Since the string frequencydepends on the values of the independentvariables, we call it a dependent variable.
If we want to know how one of theseindependent variables affects the dependentvariable, we must study its effect indepen-dently of the other two. For example, tolearn how tension affects frequency, one doesexperiments in which the tension is varied andthe corresponding changes in frequency aremeasured, while the string mass and the stringlength are not allowed to change.
This means that to determine completelythe string equation, one must perform threedifferent experiments. In each case, it isnecessary to measure the values of the inde-pendent variables that don't change, severaldifferent values of the independent variablethat do change, and the frequency thatcorresponds to each of these values. This isthen a controlled, quantitative experiment.The result will be an empirical equation, anequation determined by experiment. Later wewill try to develop a theory for string vibra-tions. This theory will describe the fairlycomplex behavior of the vibrating string interms of basic concepts that underlie manyother complex situations as well. From thistheory we may be able to derive a theoreticalequation that relates the independent anddependent variables. If our theory is success-ful, the empirical equation and the theoreticalequation will agree.
You should now do Experiment B-1.

In this experiment you will determinehow the pitch, or fundamental frequency, ofa vibrating string varies with the length, mass,and tension of the string. You will find worksheets for this experiment at the end of themodule.
Start with a tuned guitar and a calibratedaudio oscillator. (An audio oscillator is anelectronic device that produces electric wavetrains at any desired frequency over the rangethat includes audible sound. When the outputof the oscillator is connected to a speaker,you can hear a pure tone. That is, you hear asingle frequency with no harmonics.) Pluckthe midpoint of the sixth (low-E) string of theguitar and change the frequency of theoscillator tone until the pitches of bothsounds are the same. You must determinewhen they are the same by ear. An averageperson can match pure tones to those pro-duced on a guitar with an accuracy of betterthan 0.3%. However, it is particularly difficultto tune a tone which is rich in harmoniccontent to a pure tone. Thus, be sure to pluckthe midpoint of the string, so as to emphasizethe first harmonic.I. Read the frequency of the audio oscilla-
tor when you think the match in pitches.is best. Record this frequency in the firstcolumn of Table 1. (The unit of fre-quency is called the hertz [Hz]; onehertz equals one oscillation per second.One kilohertz [kHz] equals 1000 Hz.)
Now, the fIrst part of this experiment isto determine the dependence of frequency onmass per unit length of the string. To do soyou will hold the tension and the vibratinglength constant.
Remove the end of the string from itstuning peg and attach it to the spring scale asshown in Figure 20. Hold the guitar in placeby using straps and clamps as shown. Put thestring under tension by pulling on the scaleand pluck the string at the midpoint of thepart that vibrates. Make certain the string ispulled downward over the nut of the guitar.This insures that the vibrating length of stringis the same as before (from the bridge to thenut). Pull on the string until its frequencyagain matches the oscillator frequency.
2. The reading of the spring scale is thetension in the string. Record the tension(in newtons, N) necessary to producethis oscillation frequency at the top ofTable 1.
3. Remove the string from the guitar. Mea-sure and record its mass and total lengthin columns 2 and 3 of Table I. Expressthe mass in kilograms (kg) and the lengthin meters (m).
4. Divide the string mass by its length tocalculate the mass per unit length, andrecord this result in column 4 of Table I.
SPRINGSCALE
~- r·...
5. Measure the distance from the nut to theplace where the string rests on thebridge. This is the length of the part ofthe string which is vibrating. Record thisvalue L at the top of Table 1.
6. Multiply the length L by the value ofmass per unit length from column 4 andrecord the resulting mass m in column 5of Table 1. This is the mass of thatportion of the string which vibrates.
Remove the next (fifth) string from itstuning peg and attach it to the spring scale.Pull on the scale until you have the sametension as for the sixth string. Again be surethat the string is pulled tight against the nut.(You will recall that the tension is about thesame for each string of a tuned guitar.) Matchthe oscillator frequency to that of the string.
7. Record the oscillator (string) frequencyin Table 1.
8. Remove the string and measure andrecord its mass and total length.
9. Calculate the mass per unit length. Re-cord this value in Table 1.
10. Calculate the mass m that vibrates usingthe value of L from step 5 and the massper unit length from step 9.
Repeat this procedure for each of theremaining strings, keeping the tension thesame in each case.
You now have data for the relationshipof frequency to mass, with length and tensionheld constant. In the next section of theexperiment you will keep the string mass andlength constant and vary the tension.
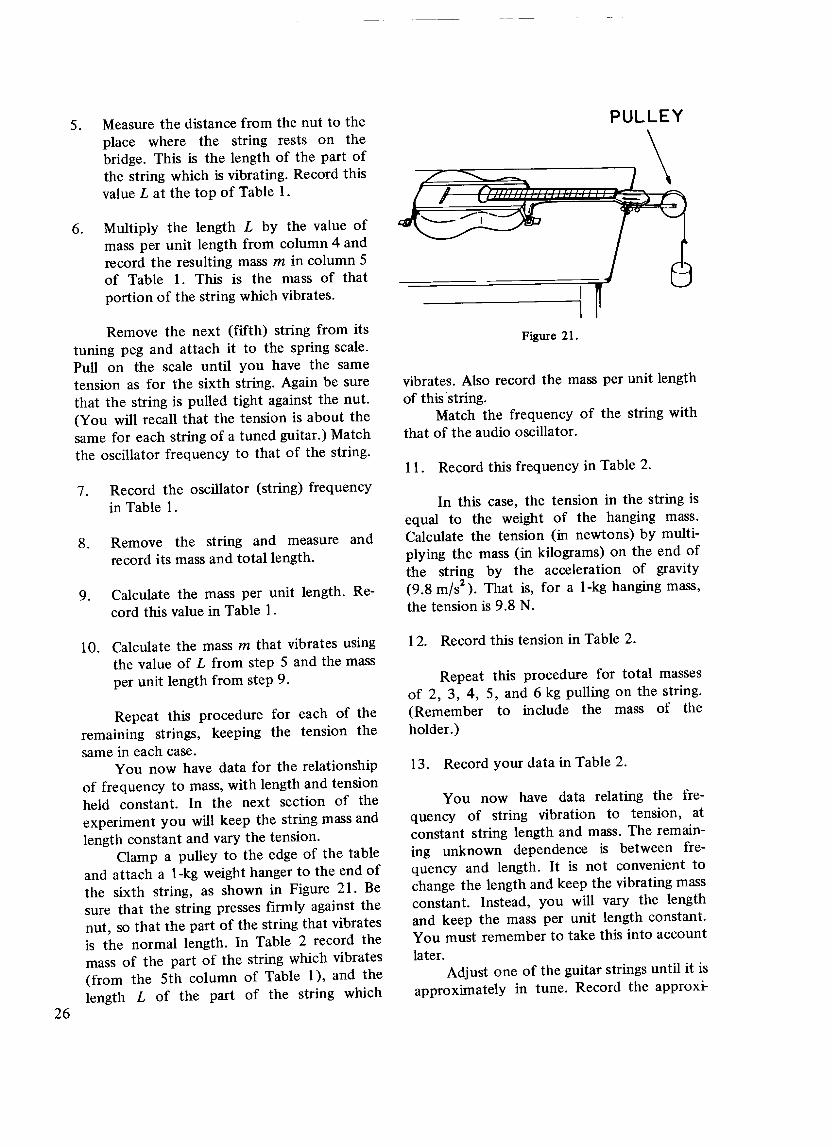
Clamp a pulley to the edge of the tableand attach a I-kg weight hanger to the end ofthe sixth string, as shown in Figure 21. Besure that the string presses firmly against thenut, so that the part of the string that vibratesis the normal length. In Table 2 record themass of the part of the string which vibrates(from the 5th column of Table 1), and thelength L of the part of the string which
PULLEY
\
vibrates. Also record the mass per unit lengthof this string.
Match the frequency of the string withthat of the audio oscillator.
In this case, the tension in the string isequal to the weight of the hanging mass.Calculate the tension (in newtons) by multi-plying the mass (in kilograms) on the end ofthe string by the acceleration of gravity(9.8 m/s2
). That is, for a I-kg hanging mass,the tension is 9.8 N.
Repeat this procedure for total massesof 2, 3, 4, 5, and 6 kg pulling on the string.(Remember to include the mass of theholder.)
You now have data relating the fre-quency of string vibration to tension, atconstant string length and mass. The remain-ing unknown dependence is between fre-quency and length. It is not convenient tochange the length and keep the vibrating massconstant. Instead, you will vary the lengthand keep the mass per unit length constant.You must remember to take this into accountlater.
Adjust one of the guitar strings until it isapproximately in tune. Record the approxi-
mate string tension and the mass per unitlength at the top of Table 3. Match thefrequency of the oscillator to that of thestring.
To change the length of the vibratingstring, place the special clamp you have beenprovided (called a capo) on the neck so thatthe string is held tightly against the first fret.The capo should be placed close to the fret onthe side nearer the nut. The new vibratinglength is from the bridge to the first fret.
15. For the capo positioned near five differ-ent frets, measure and record, in Table3, the fundamental frequency of vibra-tion and the vibrating length of thestring.
To analyze the data, we will look at therelationship of frequency to only one of theindependent variables-mass, tension, orlength-at a time. Because you really heldmass per unit length, not mass, constant inthe third part of the experiment, and becauseof the relationship between mass and mass perunit length, you can regard mass per unitlength, tension, and length as the threeindependent variables.
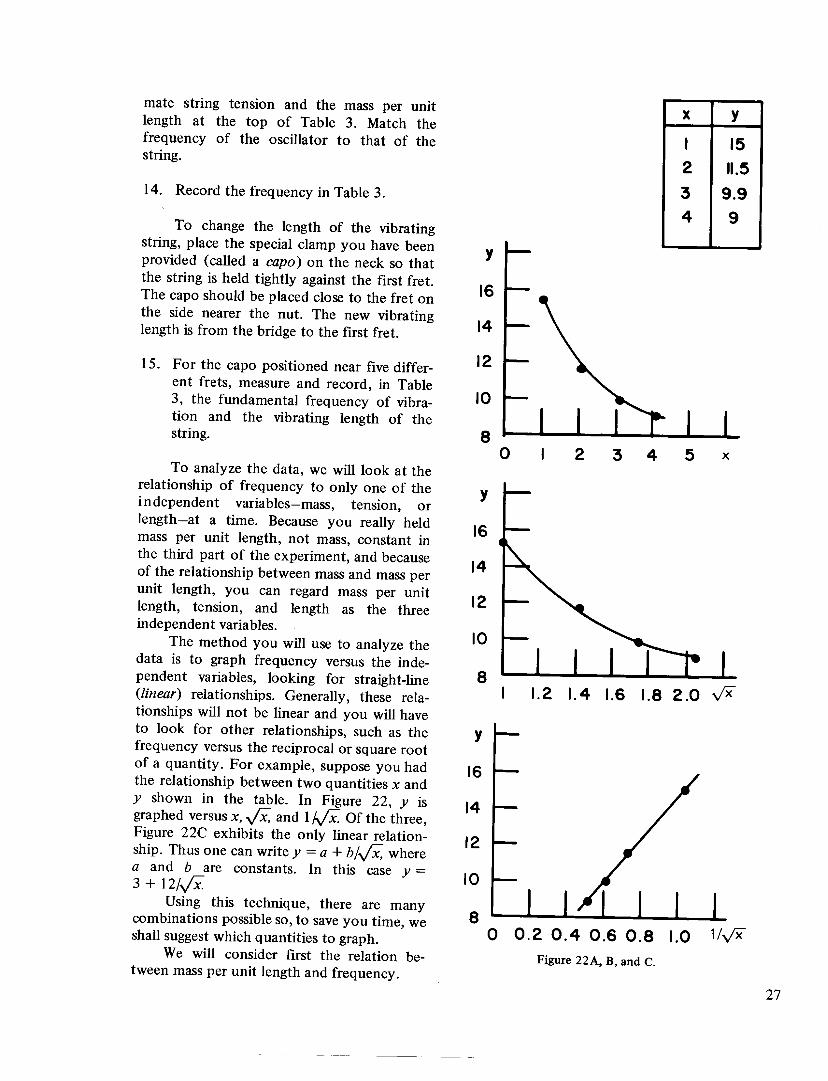
The method you will use to analyze thedata is to graph frequency versus the inde-pendent variables, looking for straight-line(linear) relationships. Generally, these rela-tionships will not be linear and you will haveto look for other relationships, such as thefrequency versus the reciprocal or square rootof a quantity. For example, suppose you hadthe relationship between two quantities x andy shown in the table. In Figure 22, y isgraphed versus x, .JX, and 1;.JX. Of the three,Figure 22C exhibits the only linear relation-ship. Thus one can write y = a + b/.JX, wherea and b are constants. In this case y =3 + 12/fi.
Using this technique, there are manycombinations possible so, to save you time, weshall suggest which quantities to graph.
We will consider first the relation be-tween mass per unit length and frequency.
x y
I 152 11.53 9.94 9
y
16141210
80 2 3 4 5 x
y
16141210
8 1.8 2.0 yx1.2 1.4 1.6
y
16141210
80 0.2 0.4 0.6 0.8 1.0 1/yx
Figure 22A, B, and c.
27
Examine the frequency and mass/length(miL) columns of Table 1. Does the frequencyincrease as miL increases? If so, you mightsuspect a direct proportion as the relation-ship. If the frequency increases as miL de-creases, you might suspect an inverse propor-tion as the relationship.
16. Does the frequency increase or decreaseas the mass per unit length increases?
Plot a graph of frequency if) on thevertical axis versus the reciprocal of mass/length (1 -;-mass/length) on the horizontalaxis.
17. Does this graph appear to be a straightline?
Plot a graph of frequency on the verticalaxis and the reciprocalof"'/mIL, 1/.../mIL, onthe horizontal axis.
18. Which of your two graphs is most nearlya straight line?
19. From the linear graph, write an equationwhich summarizes the relationship be-tween frequency if) and mass per unitlength (miL).
Now examine the frequency and tensioncolumns in Table 2. Plot a graph of frequencyon the vertical axis versus tension on thehorizontal axis.
20. Does the frequency increase or decreaseas tension increases? Does this graphappear to be a straight line?
Plot a graph of frequency on the verticalaxis and the square root of tension (.jT) onthe horizontal axis.
21. Which of these two graphs is most nearlya straight line?
22. From the linear graph, write an equationwhich summarizes the relationship be-tween frequency and tension.
Now examine Table 3. Plot a graph offrequency on the vertical axis and length onthe horizontal axis.
23. Does the frequency increase or decreaseas the length increases?
Plot a graph of frequency on the verticalaxis and the reciprocal of length on thehorizontal axis.
25. Do you think some other relationshipwould be more nearly linear? If so, tryit.
26. From the appropriate graph, write anequation which summarizes the relation-ship between frequency and length.
27. You now have relationships betweenfrequency and mass per unit length,frequency and tension, and frequencyand length. Try to express one relation-ship involving frequency, mass per unitlength, tension, and length, and thereforeone equation relating f, miL, T, and L.

You discovered in Experiment A-I thatthe more massive strings on the guitar pro-duce lower-pitched sounds, and in Experi-ment A-2 that low-pitched sounds are pro-duced when the frequency of oscillation islow. You were probably not surprised whenExperiment B-1 revealed that the frequencyof the sound produced by the various stringson a guitar decreases as the mass of thevibrating string increases. Since it is moreconvenient to keep mass per unit lengthconstant instead of mass, we regard mass perunit length as the independent variable. Thatpresents no problem so long as the length ofthe vibrating string is kept constant. You againsaw that frequency decreases when mass perunit length.increases.
What about your results? The fact thatthe graph of frequency and the reciprocal ofthe square root of the mass per unit length isa straight line through the origin means thatthe frequency is proportional to the recipro-cal square root of mass per unit length. Sayingit another way, frequency is inversely propor-tional to the square root of the mass per unitlength when the tension and string length areconstant. This proportionality relationshipcan be written in equation form as follows:
Af= Jrn/L
The proportionality constant A is the slope ofthe straight-line graph of f versus l/Jrn/L.The value of A may depend on anything heldconstant during measurements of frequencyand mass per unit length. Thus A mightdepend on the tension in the string and onthe length of the vibrating string.
You discovered in Experiment A-I thatthe pitch (and hence the frequency) of aguitar sound increases as the tension in thevibrating string increases. Your graph of fre-quency and the square root of the tensionindicates that the frequency is proportional tothe square root of the tension when the massand length of the vibrating string are constant.Mathematically, this result can be expressedas follows:
The constant B is equal to the slope of yourgraph of f versus.jf. It might depend onanything held constant in this part of theexperiment (the mass and/or the length).
Finally, you noted that when youshorten the length of a vibrating string itspitch, and hence its frequency of vibration,increases. If the tension and mass per unitlength are constant, you found that thefrequency is inversely proportional to thelength. This can be expressed as follows:
f= CL
The constant C is the slope of your graph of fversus L. It might depend on anything heldconstant during this part of the experiment(tension and mass per unit length).
Now we are faced with an interestingand difficult problem. We must find a singleequation that is consistent with Equations(1), (2), and (3), and thus expresses correctlyall of your experimental results. You at-tempted to solve this problem when youanswered the last item of the experiment. Themathematics needed to find such an equationin a rigorous and logical way are beyond thescope of this module. Wewill instead state theequation and show that it works. The correctequation is
where K is a constant.Let's compare Equation (4) with the
previous equations to see if it satisfies all therequirements.
Substituting the right-hand side of Equa-tion (1) for fin Equation (4), we get
Multiplying both sides of this equation byJrn/L, we have

KA =-.jfL
This means that A is constant so long astension and length are constant. It also meansthat the slope of the graph of frequency andmass per unit length is larger for larger valuesof the constant and tension. The slope issmaller for larger constant lengths.
By similar algebraic steps, you can findthat
K~B = L.j (~ii)
C= K/<;L)Problem 1. By carrying out the necessaryalgebraic steps, show that Equations (6) and(7) are correct.
In each case we see that the constant ofproportionality depends on the independentvariables that were held constant during theappropriate part of the experiment. Theconstant K can be calculated from anyone ofthe Equations (5), (6), or (7). If you calculateK from more than one of these equations,you can check the consistency of variousparts of the experiment.
Problem 2. Go back to the data of Experi-ment B-1 and use it to calculate values of Kfor each of Equations (5), (6), and (7). Howdo these values of K compare with eachother?
We can now rewrite Equation (4) in asimpler form which may be easier to under-stand:
f= Kj,TmL
If the tension is increased, it increases therestoring forces that pull pieces of the stringback and forth. This in turn causes the string
to vibrate more rapidly. From Equation (8)you now know how much the frequencyincreases with increasing tension.
If the mass of the vibrating string islarge, the string vibrates more slowly. Nowyou know how much the frequency decreaseswith increasing string mass.
The closer together the nodes of a simplevibration pattern are, the higher is the fre-quency of oscillation of the antinodes be-tween the nodes. You observed this directlyin Experiment A-2. Now you know quantita-tively how frequency varies as the length ofthe vibrating string changes. But we have notyet explained why this happens.
Question 12. When you tighten a string on aguitar, which of the variables T, m, and L doyou change? When you hold a string against afret, which variablesdo you change?
Problem 3. Suppose that you decide to re-place steel guitar strings with nylon strings ona particular guitar. The strings are to be tunedto the usual frequencies. If the mass per unitlength of each nylon string is one-fourth thatof the corresponding steel string, must thetension in the nylon strings be greater orsmaller? By what factor must the tension bechanged?
LOUDNESS, AMPLITUDE, ANDFREQUENCY
By now you should understand how theguitar produces sound. The guitar strings, thesound board, and the air in the sound boxvibrate. The air outside the sound box is, inturn, set into vibration. This sound is trans-mitted through the air to the ear in the formof sound waves. But what happens at the ear?We do not wish to delve deeply into theworkings of this amazingly sensitive andcomplex organ. We shall just note that thesound wave travels through the ear canal tothe eardrum, causing it to vibrate with thesame frequency as the sound wave. Thisvibration is passed on to the small bones inthe middle ear and eventually to the fluid and
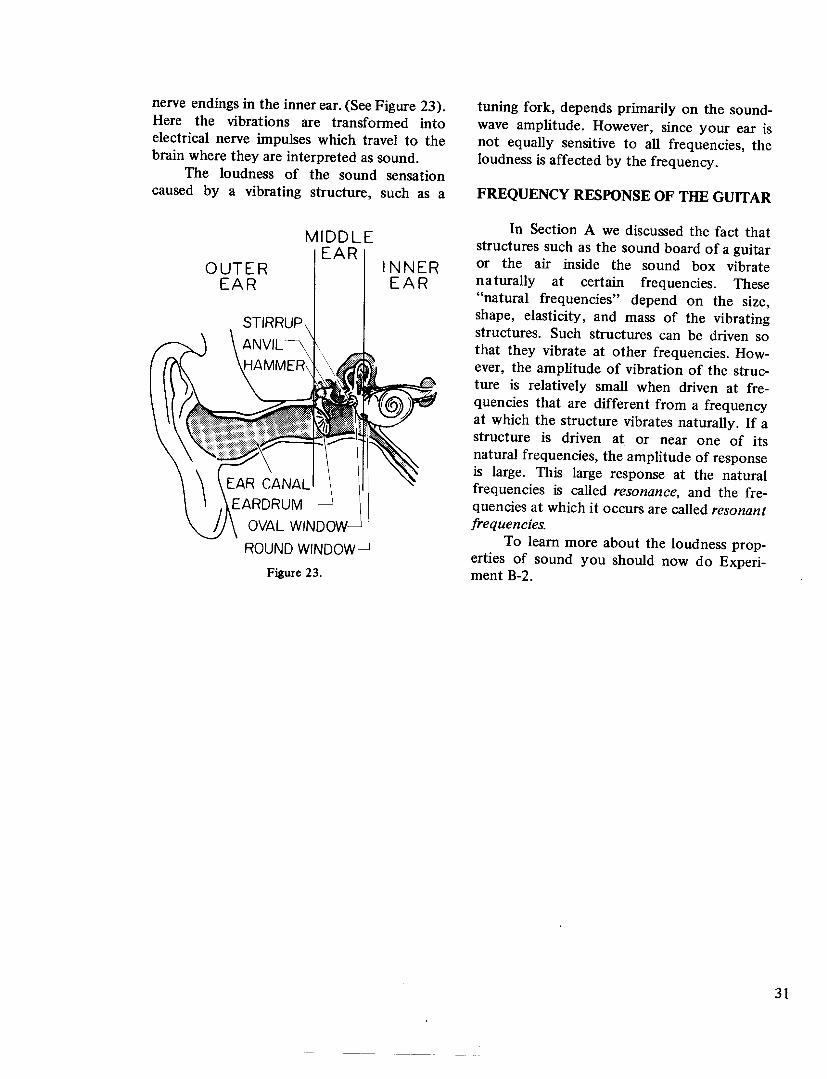
nerve endings in the inner ear. (SeeFigure 23).Here the vibrations are transformed intoelectrical nerve impulses which travel to thebrain where they are interpreted as sound.
The loudness of the sound sensationcaused by a vibrating structure, such as a
OUTEREAR
MIDDLEEARINNEREAR
EAR CANALEARDRUM
OVAL WINDOWROUND WINDOW
tuning fork, depends primarily on the sound-wave amplitude. However, since your ear isnot equally sensitive to all frequencies, theloudness is affected by the frequency.
In Section A we discussed the fact thatstructures such as the sound board of a guitaror the air inside the sound box vibratena turally at certain frequencies. These"natural frequencies" depend on the size,shape, elasticity, and mass of the vibratingstructures. Such structures can be driven sothat they vibrate at other frequencies. How-ever, the amplitude of vibration of the struc-ture is relatively small when driven at fre-quencies that are different from a frequencyat which the structure vibrates naturally. If astructure is driven at or near one of itsnatural frequencies, the amplitude of responseis large. This large response at the naturalfrequencies is called resonance, and the fre-quencies at which it occurs are called resonantfrequencies.
To learn more about the loudness prop-erties of sound you should now do Experi-ment B-2.

For this part of the experiment you areprovided with an audio oscillator connectedto a speaker. The audio oscillator will providetones with frequencies you can vary over awide range, including most of the audiblerange. You can also adjust the amplitude (andtherefore the loudness) of the tones.
You can "see" the tones by using amicrophone, which converts the sound wavesinto an electrical signal. The electrical signalfrom the microphone may be fed into anoscilloscope and displayed on the oscilloscopescreen. The frequency of the wave on theoscilloscope screen is the same as that of thesound wave, and the amplitude is propor-tional to the sound-wave amplitude. Thisarrangement is shown in Figure 24.
Turn on the system and change thefrequency of the audio oscillator slowly fromits lowest frequency to 20 kHz while listeningto the speaker. This operation is called afrequency sweep. Maintain a fixed positionnear the microphone as you listen to thefrequency sweep.
1. How does the pitch of the sound changeas the oscillator frequency increases?
The actual tones you hear during thesweep are affected by the properties of thespeaker and the oscillator, as well as by thecharacteristics of your own hearing.
Now sweep slowly from the lowestfrequency available to your upper limit. Holdthe amplitude as constant as you can bylooking at the oscilloscope screen and usingthe amplitude control on the audio oscillator.
2. When listening to a constant-amplitudewave, what frequency sounds the loud-est? Sweep through the frequenciesseveral times, and estimate your error inthis observation.
Set the oscillator at 500 Hz. Slowlyincrease the amplitude of the sound waveandlisten.
3. Does the loudness depend on sound-wave amplitude at this single frequency?Does the same effect hold for otherfrequencies? How does the pitch dependon sound-waveamplitude?
Set the oscillator to 3 kHz. Connectone terminal of a decade resistor to one of theterminals of the oscillator. Then to the otherend of the resistor, connect one terminal of apush-button switch. Finally, connect theother terminal of the switch to the otherterminal of the oscillator. With this arrange-ment you can change the amplitude of thesignal, and thus the intensity of sound enter-ing your ear, by pushing the button of theswitch. This is because some of the electricalenergy of the oscillator is consumed in thedecade resistor. You can get different ampli-tudes just by adjusting the decade resistance.Although this is a crude method of attenuat-ing the signal, over the range of amplitudesused, there will be no damage either to the

oscillator or to the resistor. Also, there will beno appreciable distortion.
Set the decade resistor at 1 ohm andturn on the oscillator. Open and close theswitch. (It is best to have someone elseopening and closing the switch while you donot watch.) Set the amplitude as low aspossible, but still loud enough that you canclearly hear the tones. Again, be sure that youremain at the same position near the micro-phone as you listen to the tones.
4. Can you detect a difference in loudnesswhen the switch is opened· and closed?
While the switch is being alternatelyopened and closed, adjust the decade resistoruntil you can just detect a difference inloudness; that is, to the point where, if youincrease the resistance further, you no longercan hear any difference in loudness.
5. Record the amplitudes from the oscillo-scope for the open and closed positionsof the switch. (We assume that theamplitude of the input signal to thespeaker is proportional to the amplitudeof the sound which you hear.)
6. Square each of the two values of ampli-tude, and record these as measures ofintensity. The intensity, defined as theenergy carried by the wave per unit areaper unit time, is proportional to thesquare of the amplitude.
To check the results of step 5, you maywant to start with the highest decade resis-tance, where you cannot hear a loudnessdifference, and, as the switch is opened andclosed, adjust the resistance down until youcan first hear a difference in loudness.
Next set the amplitude of the oscillatorto a high value where the tone is loud butnot uncomfortable or too loud for others inthe room.
7. Repeat steps 4 to 6 for this loudersound.
8. How does the intensity difference re-quired for the smallest perceptible in-crease in loudness for the low-levelsound at 3 kHz compare with the differ-ence of intensities required for thelouder sound at the same frequency?
9. How does the intensity ratio for thelow-level sounds compare with the ratiofor the louder sounds?
10. Set the oscillator to 400 Hz and repeatsteps 4, 5, and 6. (Remember to set theinitial amplitude to the lowest settingwhereyou can still hear clearly the tones.)
11. How does the intensity difference re-quired for the smallest perceptible in-
. crease in loudness for 3 kHz comparewith the intensity difference at 400 Hz?
12. How does the ratio of the two intensitiesat 3 kHz compare with the ratio at400 Hz?
The equipment needed is a tuned guitar,an audio oscillator, a small speaker, and anintensity-level meter (called a decibel or dBmeter; decibels will be defined later in thissection of the module).
Set the guitar, neck up and face out, in asoft chair or on other material capable ofabsorbing stray sound. Place the speakerabout six inches away from the sound holeand aimed at the hole. Connect the audiooscillator to the speaker. Hold the dB meterabout two or three feet away from the guitaras shown in Figure 25.
Now turn on the oscillator and vary thefrequency of its output, starting at low valuesand sweepingslowly across the entire range ofhearing. Observe the readings of the dB meteras you make this sweep.
A frequency which sounds louder thanothers, and for which the dB meter reading isa maximum value, is called a resonance or aresonant frequency.
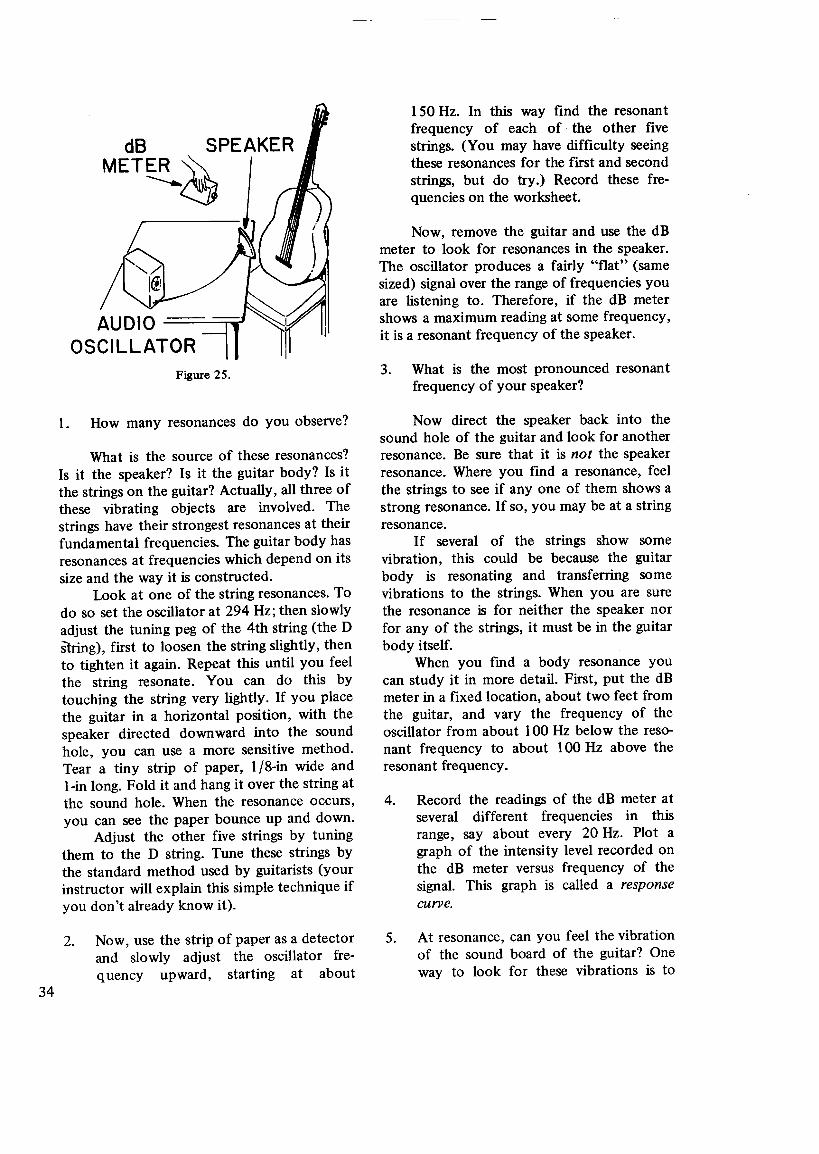
dB SPEAKER
MET~ j
What is the source of these resonances?Is it the speaker? Is it the guitar body? Is itthe strings on the guitar? Actually, all three ofthese vibrating objects are involved. Thestrings have their strongest resonances at theirfundamental frequencies. The guitar body hasresonances at frequencies which depend on itssize and the way it is constructed.
Look at one of the string resonances. Todo so set the oscillator at 294 Hz; then slowlyadjust the tuning peg of the 4th string (the DString), first to loosen the string slightly, thento tighten it again. Repeat this until you feelthe string resonate. You can do this bytouching the string very lightly. If you placethe guitar in a horizontal position, with thespeaker directed downward into the soundhole, you can use a more sensitive method.Tear a tiny strip of paper, 1/8-in wide andI-in long. Fold it and hang it over the string atthe sound hole. When the resonance occurs,you can see the paper bounce up and down.
Adjust the other five strings by tuningthem to the D string. Tune these strings bythe standard method used by guitarists (yourinstructor will explain this simple technique ifyou don't already know it).
2. Now, use the strip of paper as a detectorand slowly adjust the oscillator fre-quency upward, starting at about
150 Hz. In this way find the resonantfrequency of each of the other fivestrings. (You may have difficulty seeingthese resonances for the first and secondstrings, but do try.) Record these fre-quencies on the worksheet.
Now, remove the guitar and use the dBmeter to look for resonances in the speaker.The oscillator produces a fairly "flat" (samesized) signalover the range of frequencies youare listening to. Therefore, if the dB metershows a maximum reading at some frequency,it is a resonant frequency of the speaker.
3. What is the most pronounced resonantfrequency of your speaker?
Now direct the speaker back into thesound hole of the guitar and look for anotherresonance. Be sure that it is not the speakerresonance. Where you find a resonance, feelthe strings to see if anyone of them shows astrong resonance. If so, you may be at a stringresonance.
If several of the strings show somevibration, this could be because the guitarbody is resonating and transferring somevibrations to the strings. When you are surethe resonance is for neither the speaker norfor any of the strings, it must be in the guitarbody itself.
When you find a body resonance youcan study it in more detail. First, put the dBmeter in a fixed location, about two feet fromthe guitar, and vary the frequency of theoscillator from about 100 Hz below the reso-nant frequency to about 100 Hz above theresonant frequency.
4. Record the readings of the dB meter atseveral different frequencies in thisrange, say about every 20 Hz. Plot agraph of the intensity level recorded onthe dB meter versus frequency of thesignal. This graph is called a responsecurve.
5. At resonance, can you feel the vibrationof the sound board of the guitar? Oneway to look for these vibrations is to
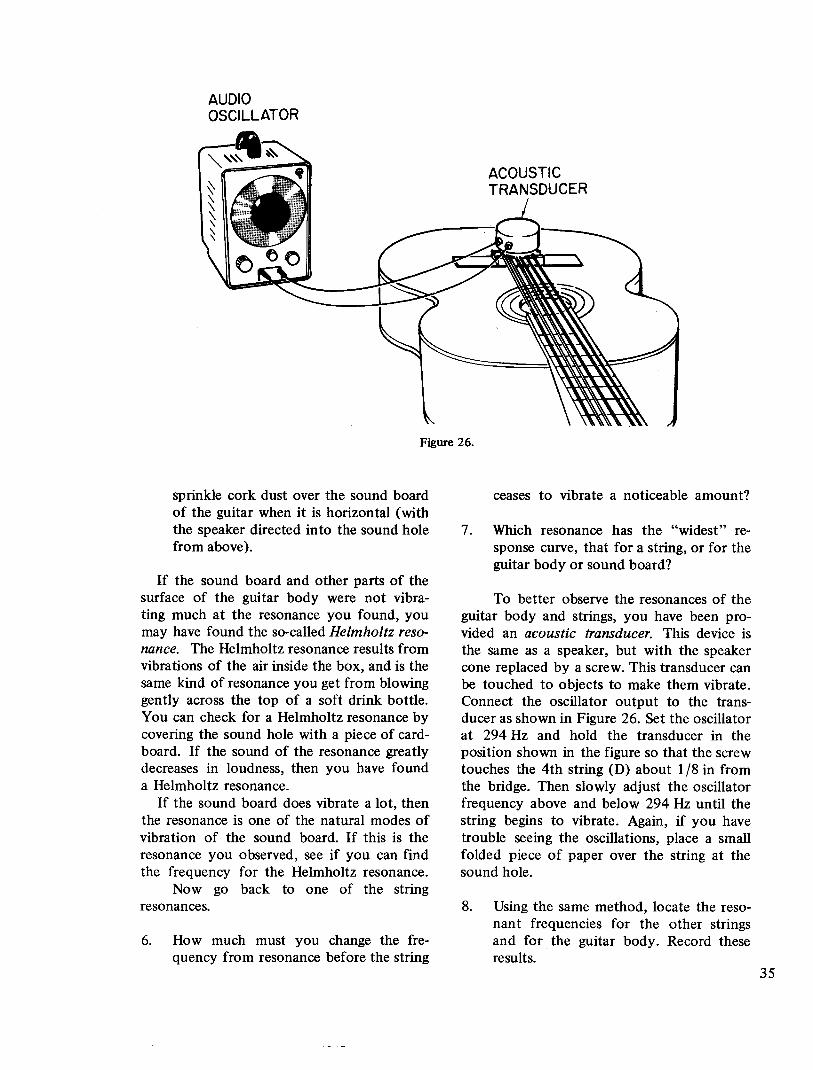
sprinkle cork dust over the sound boardof the guitar when it is horizontal (withthe speaker directed into the sound holefrom above).
If the sound board and other parts of thesurface of the guitar body were not vibra-ting much at the resonance you found, youmay have found the so-calledHelmholtz reso-nance. The Helmholtz resonance results fromvibrations of the air inside the box, and is thesame kind of resonance you get from blowinggently across the top of a soft drink bottle.You can check for a Helmholtz resonance bycovering the sound hole with a piece of card-board. If the sound of the resonance greatlydecreases in loudness, then you have founda Helmholtz resonance.
If the sound board does vibrate a lot, thenthe resonance is one of the natural modes ofvibration of the sound board. If this is theresonance you observed, see if you can findthe frequency for the Helmholtz resonance.
Now go back to one of the stringresonances.
6. How much must you change the fre-quency from resonance before the string
ACOUSTICTRANSDUCER
7. Which resonance has the "widest" re-sponse curve, that for a string, or for theguitar body or sound board?
To better observe the resonances of theguitar body and strings, you have been pro-vided an acoustic transducer. This device isthe same as a speaker, but with the speakercone replaced by a screw. This transducer canbe touched to objects to make them vibrate.Connect the oscillator output to the trans-ducer as shown in Figure 26. Set the oscillatorat 294 Hz and hold the transducer in theposition shown in the figure so that the screwtouches the 4th string (D) about 1/8 in fromthe bridge. Then slowly adjust the oscillatorfrequency above and below 294 Hz until thestring begins to vibrate. Again, if you havetrouble seeing the oscillations, place a smallfolded piece of paper over the string at thesound hole.
8. Using the same method, locate the reso-nant frequencies for the other stringsand for the guitar body. Record theseresults.

In Experiment B-2 you observed that,for a single frequency, increasing the ampli-tude of the sound wave increases the loudnessof the sound. Sound waves of the sameamplitude but of different frequencies pro-duce different sensations of loudness. Fre-quencies between 3 kHz and 4 kHz generallysound the loudest for a given amplitude, andfrequencies below 20 Hz or above 15 kHz to20 kHz are not audible at all. This last factmeans that the typical human ear is respon-sive to sound-wave frequencies between 20 Hzand 20 kHz at best. It is most sensitive tofrequencies around 3.5 kHz.
Question 13. It is possible for you to callyour dog with a whistle that is inaudible tohumans. How can this be true? Make youranswer in terms of concepts such as frequencyand sensitivity.
In Part II of Experiment B-2, you foundresonance for which there was little vibrationof the sound board. This particular resonanceis called the Helmholtz resonance, and it isnamed for a nineteenth century Germanscientist. The Helmholtz resonance involvespressure oscillations throughout the soundbox at a frequency determined by the proper-ties of the air within the sound box. This kindof resonance also causes the musical soundyou hear when you blow across the mouth ofan empty bottle. You detected other reso-nances. These resonances are associated withsound-board vibrations.
Most of the sound coming from a guitaris caused by vibrations of the wooden soundboard and the air in the sound box. Thesevibrations are excited by the vibrating strings.Since the guitarist controls the frequencies ofthe vibrating strings, a sound of any desiredpitch can be obtained. However, the intensityof this sound would be small if the stringvibrations were not coupled to the bridge, andthus in turn to the sound board and the aircavity. The response of these structures islarge at certain resonant frequencies. Fortu-nately there are several of these resonant
frequencies and the response curve for eachresonant frequency is so wide that sounds atall string frequencies are amplified to someextent.
You have observed how the loudness ofsound depends upon frequency and ampli-tude. Let us now consider in more detail howloudness is measured. When a sound wavestrikes your ear, pressure variations cause theeardrum to vibrate. This disturbance producessignals that are transmitted to your brain andinterpreted as sound. The ear is an extremelysensitive detector of sound. For soft sounds,the eardrum may move through a totaldistance (amplitude) smaller than the diam-
f· (1 -10eter 0 a smgle atom 0 m) and stilldetect the sound. The total change in pressureassociated with such a sound may be only oneten-billionth (10-10
) of atmospheric pressure.If the eye could respond to an amount oflight energy equal to the smallest amount ofsound energy audible to the ear, one could see50 W of visible light from 3000 miles away.(This would require about a 500-Wbulb, sinceonly about 10% of the radiation from a lightbulb is visible.) On the other hand, the earalso responds to sounds a trillion (101
2) timesmore powerful than the minimum audiblesound.
Question 14. a. When you nod your head,the slight altitude change produces a pressure
-10change of about 10 that of atmosphericpressure. If the ear is so sensitive to changes inpressure, why do you not hear a tone whenyou nod your head up and down rapidly?
b. If a meter stick which is tightlyclamped to a table top so that most of itslength protrudes over the edge is set intovibration, you do not hear the vibrations. But,if it is clamped with just a short lengthprotruding over the table edge, the vibrationsare clearly audible. Why?
Starting with the plucking of the guitarstring, and in all other instances of sound

production that you have observed, the "size"or amplitude of the disturbance is somehowrelated to the sensation of loudness. It turnsout that the relation is more subtle than onemight first guess. For example, doubling theamplitude does not give twice the initialloudness. We shall now see what measures ofloudness are appropriate and useful.
The frequency of a sound wave is used asa measure of pitch. The amplitude of a soundwave is related to its loudness, but amplitudealone is not a convenient measure of loudness.The energy carried by the wave is propor-tional to the square of the amplitude, buteven this is not a convenient measure ofloudness. To make things more complicated,the human ear does not respond linearly tothe wave energy; a wave carrying twice asmuch energy does not sound twice as loud.The energy carried by a wave is measured bythe quantity called intensity 1The intensityis defined as the amount of energy whichpasses through a unit of area (perpendicularto the direction of propagation of the wave)in one second of time. Thus if a total amountof energy E passes through an area A in a timeinterval tJ.t*, we define the energy per unitarea per unit time by
E/=--
tJ.t-A(Defmition of Intensity)
Energy delivered per unit time is calledpower. You are familiar with some commonunits of power in such uses as a 4D-watt lightbulb or a 30D-horsepower engine. Mathemat-ically, we can write
P = EltJ.t(Definition of Power)
Intensity has units of watts per square meter(W/m2
).
*The Greek letter delta (tJ.) is often used to indicatea change or difference in a quantity. Here it indicatesan elapsed time interval.
Example Problem. In normal conversation,the sound at your ear has an intensity of
-7 / 2about lOW m . If the area of the eardrum-5 2is 5 X 10 m, what sound power (energy
per unit time) passes into the ear?
Solution. Given in the problem are
/ = 10-7 W/m2
The equation / = PIA must be rearranged inorder to solve for the power. If both sides ofthat equation are multiplied by A, we obtain
P=/A
Substituting the given values into this equa-tion,
Performing the power of ten multiplicationand gathering units,
Question 15. If the power of sound enteringyour ear during normal conversation is
-125 X lOW, why would you need a stereosystem amplifier rated at lOW to 100 W?
Problem 4. The light from a lOD-Wlight bulbhas an intensity of 0.4 W/m2 at a distance of4 m from the bulb. If the pupil of your eyehas an area about equal to the area of the
-5 2eardrum (5 X 10m ) and is located 4 maway from the bulb, how much power isreceived in your eye from this light source?
Problem 5. Traffic on a busy city streetcreates a sound intensity of 10-4 W/m2
• If thed h -5 2ear rum as an area of 5 X 10 m, what
power impinges on the eardrum?

The human ear can distinguish betweentwo frequencies that differ by as little as 0.3%in the range from 500 Hz to 4 kHz and muchless than this for musical tones made up ofharmonics. For example, at 1000 Hz, thefrequency must increase to about 1003 Hzbefore your ear can detect a change. At3000 Hz, the frequency must increase toabout 3009 Hz for your ear to detect thechange. The ear does' not detect a fixeddifference of frequencies but, instead, detectsa change given approximately by the ratios ofthe two frequencies. That is,
where fl is the original frequency and f2 isthe value of frequency just enough higherthan fl that your ear can perceive a pitchchange under ideal conditions.
As you observed in Part I of ExperimentB-2, the ear responds to loudness in a similarway. Suppose you are listening to a I-kHztone and the intensity at your ear is 1.62 X
-7 2lOW /m . In order to hear a change inloudness, the intensity at your ear must. -7 2mcrease to about 1.80 X 10 W/m. Thesetwo intensities have a difference of (1.80 X
-7 -7 210 - 1.62 X 10 ) W/m . One might expectthat increasing the intensity by another0.18 X 10-7 W/m2 would again give a detec-table change in ioudness. But in fact itdoesn't! The intensity must be increased from
-7 -7 21.80 X 10 to 2.00 X 10 W/m, a differ--7 2ence of 0.20 X lOW /m , to be noticeable.
However, the ratios 1.80/1.62 and 2.00/1.80are both equal to 1.11. Your ear does notdetect a fixed difference of intensities. In-stead, it detects an intensity change given byfixed ratios of the two intensities. That is,
where II is the original intensity and 12 is thevalue of intensity just enough greater than 11that your ear perceives a change in loudness.
As you probably found in ExperimentB-2, the ratio from one intensity to the next
perceptible intensity is not exactly 1.11.Indeed, this ratio may change considerablyfor different frequencies, and for differentlevels of loudness. In an acousticallabora tory,the ratio 1.11 can be obtained for a ratherwide range of frequencies and loudness levels.However, for the ordinary person listening ina room, the ratio may be closer to 1.25.
At very low and very high sound levels,and for frequencies which are at the extremesof what people can hear, the ratios forperceptible changes in loudness are greatlydifferent from the usual range of 1.11 to1.25. For example, at 35 Hz, a barely audiblefrequency, the ratio is about 8. For a veryloud tone at 1000 Hz, the ratio is about 1.06.For a barely audible tone at 1000 Hz, theratio is 2.
Since the ratios are not really veryconstant, you may well ask why the ratio"law" is significant. The important thing torealize is that the differences in sound intens-ities for perceptible changes vary enormously,while the ratios of these same intensities arenearly constant. This means that a ratio ismore nearly correct (instead of a difference)in describing how our ears respond to intens-ity changes. For example, at 1000 Hz, abarely audible tone must have an intensity
-12 / 2difference of about 3 X lOW m to beperceptible. For a loud tone at that samefre~uency, the difference must be 6 X10- W/m2
• The latter difference is some200 million times greater than the intensitydifference required for a barely audible tone.Whereas, the ratio for one case is only 3 timeslarger than that for the other.
In other words, before your ear candetect a loudness change, the intensity ofsound must increase by between 11% and25%. This physiological response to sound isone example of the way your senses respondto all stimuli. For example, you respond in asimilar way to pressure differences on your
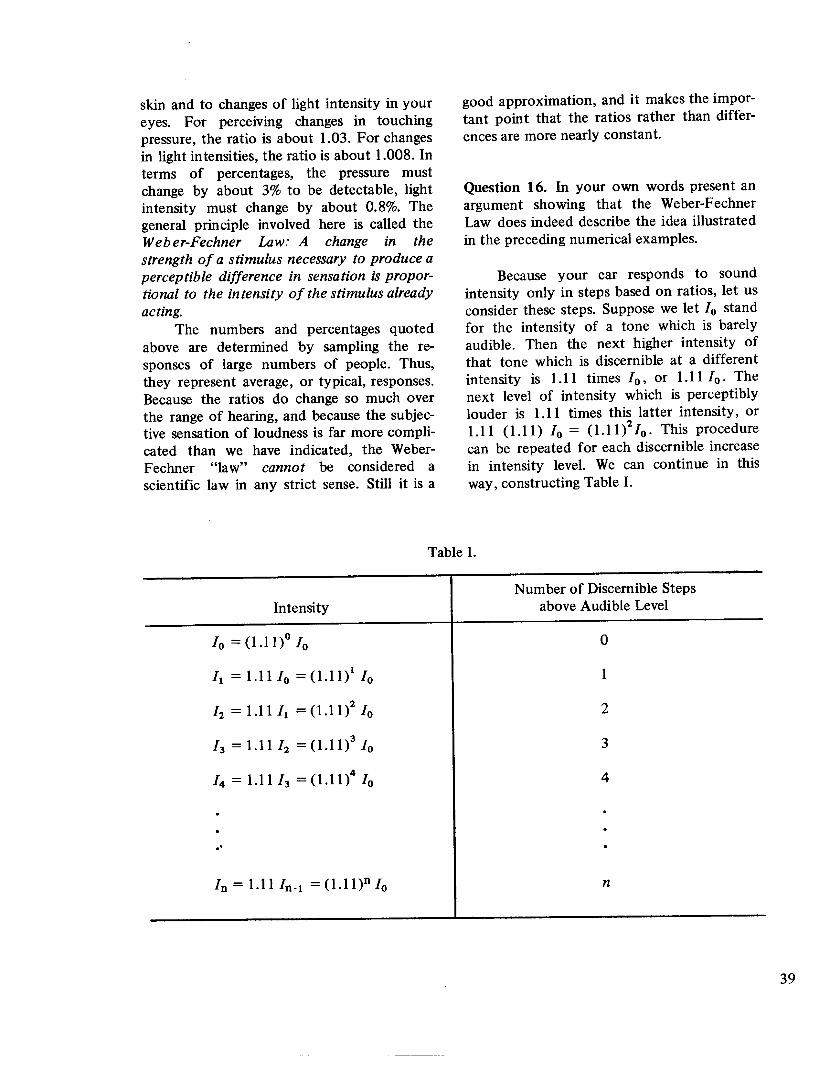
skin and to changes of light intensity in youreyes. For perceiving changes in touchingpressure, the ratio is about 1.03. For changesin light intensities, the ratio is about 1.008. Interms of percentages, the pressure mustchange by about 3% to be detectable, lightintensity must change by about 0.8%. Thegeneral principle involved here is called theWeber-Fechner Law: A change in thestrength of a stimulus necessary to produce aperceptible difference in sensation is propor-tional to the intensity of the stimulus alreadyacting.
The numbers and percentages quotedabove are determined by sampling the re-sponses of large numbers of people. Thus,they represent average, or typical, responses.Because the ratios do change so much overthe range of hearing, and because the subjec-tive sensation of loudness is far more compli-cated than we have indicated, the Weber-Fechner "law" cannot be considered ascientific law in any strict sense. Still it is a
good approximation, and it makes the impor-tant point that the ratios rather than differ-ences are more nearly constant.
Question 16. In your own words present anargument showing that the Weber-FechnerLaw does indeed describe the idea illustratedin the preceding numerical examples.
Because your ear responds to soundintensity only in steps based on ratios, let usconsider these steps. Suppose we let /0 standfor the intensity of a tone which is barelyaudible. Then the next higher intensity ofthat tone which is discernible at a differentintensity is 1.11 times /0' or 1.11 /0' Thenext level of intensity which is perceptiblylouder is 1.11 times this latter intensity, or1.11 (1.11) /0 = (1.11)2/0, This procedurecan be repeated for each discernible increasein intensity level. We can continue in thisway, constructing Table I.
Number of Discernible Stepsabove Audible Level
/0 = 0.11)0 /0
/1 = 1.11 /0 = (1.11)1 /0

Problem 6. Fill in Table I for the cases of fiveand six discernible steps above audible level.
The important thing about this table isthat, for a given number of discernible stepsabove the audible level, the intensity is givenby an expression which contains the stepnumber as an exponent. For example,
for step number 4. Expressed as a ratio, wehave
If we take the logarithm of each side of thisequation, we get
where all the logarithms are to the base 10.Solving for n, we get
In = log l.ll log (In/Io)
These step numbers are "equally spaced" asfar as our ability to detect loudness changesfor a particular frequency tone is concerned.These step numbers vary with the logarithmof the intensity ratio, and not with the ratioitself. For this reason, we say that our ears"respond logarithmically" rather than direct-ly to changes of sound intensity.
In technical work it is conventional touse a unit of intensity level which is differentin size from the discernible step level our earsperceive. This unit, called the bel, is named
after Alexander Graham Bell. The intensitylevel (I L. ) in bels is given by
IL. = log (1/10) (14)(Definition of sound intensity
level in bels)
From Equations (13) and (14), the number ofdiscernible intensity steps between the twogiven levels, 10 and I, is related to IL. by theexpression
Thus, there are about 22 discernibleintensity steps in one bel. One bel is thereforea very large unit (like using pounds whenounces would be more appropriate). A smallerunit is much more convenient. This morecommonly used unit is one-tenth of a bel andis called a decibel (dB). There are 10 dB in1 bel:
If a decibel is one-tenth the size of a bel,the decibel is about the size of 2.2 discernibleintensity steps, or
The number of discernible steps ofsound level is not an exact number. There isconsiderable variation according to frequency,loudness, and the individual. The ratio 1.11 isonly approximate, so that the constants inEquations (12), (13), (15), and (17) are onlyapproximate. It is the approximately loga-rithmic response of our sense of hearingwhich is important. Thus, Equations (14) and(16), which are exact definitions, servescientific purposes, whereas the less exactequations based on the approximate, experi-mentally determined ratio 1.11 merely serveto help us understand why we use a loga-rithmic form for intensity level. To provide acommon base or reference level relative towhich intensities are measured, the numericalvalue 10-12 W/m2 is chosen as the minimumaudible sound intensity. Thus
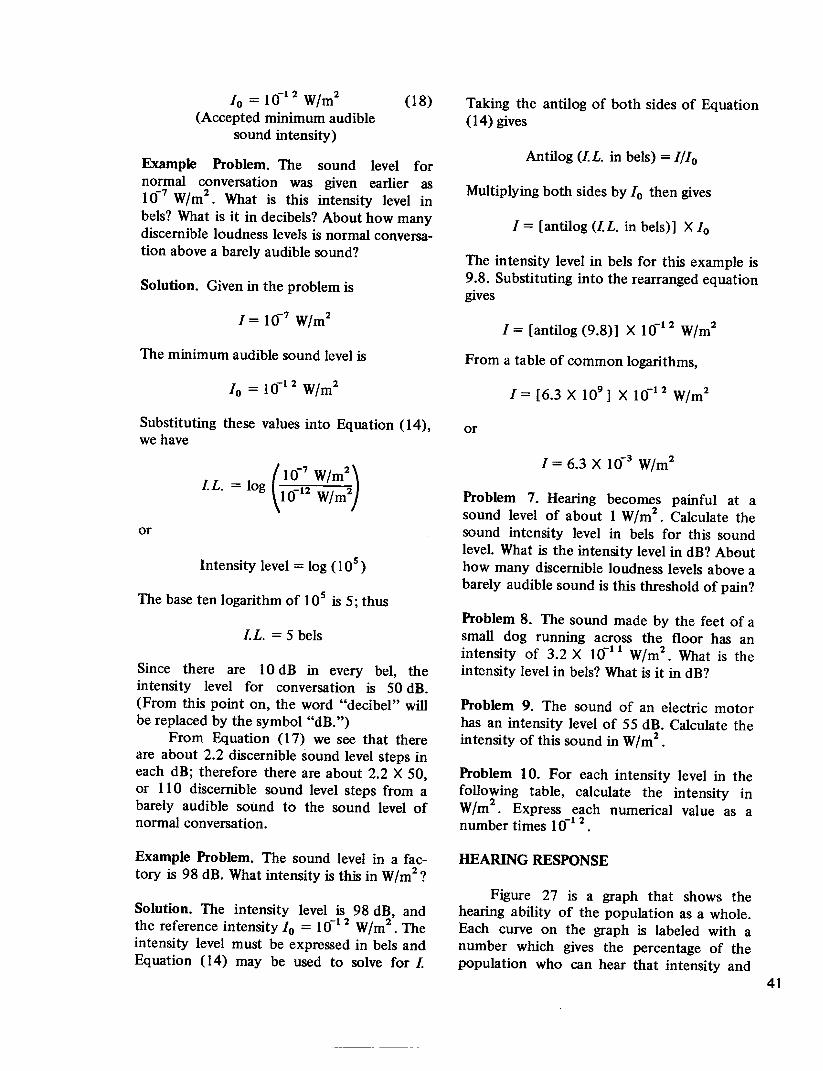
/0 = 10-12 W/m2
(Accepted minimum audiblesound intensity)
Example Problem. The sound level fornormal conversation was given earlier as10-7 W/m2
• What is this intensity level inbels? What is it in decibels? About how manydiscernible loudness levels is normal conversa-tion above a barely audible sound?
Substituting these values into Equation (14),wehave
(
10-7 w/m2j
IL. = log -12 I 210 W m
Since there are 10 dB in every bel, theintensity level for conversation is 50 dB.(From this point on, the word "decibel" willbe replaced by the symbol "dB.")
From Equation (17) we see that thereare about 2.2 discernible sound level steps ineach dB; therefore there are about 2.2 X 50,or 110 discernible sound level steps from abarely audible sound to the sound level ofnormal conversation.
Example Problem. The sound level in a fac-tory is 98 dB. What intensity is this in W/m2?
Solution. The intensity level is 98 dB, andthe reference intensity /0 = 10-1
2 W1m2• The
intensity level must be expressed in bels andEquation (14) may be used to solve for I
Taking the antilog of both sides of Equation(14) gives
The intensity level in bels for this example is9.8. Substituting into the rearranged equationgives
Problem 7. Hearing becomes painful at asound level of about 1 W/m2
• Calculate thesound intensity level in bels for this soundlevel. What is the intensity level in dB? Abouthow many discernible loudness levels above abarely audible sound is this threshold of pain?
Problem 8. The sound made by the feet of asmall dog running across the floor has anintensity of 3.2 X 10⁻¹¹ W/m2
• What is theintensity level in bels? What is it in dB?
Problem 9. The sound of an electric motorhas an intensity level of 55 dB. Calculate theintensity of this sound in W/m2
•
Problem 10. For each intensity level in thefollowing table, calculate the intensity inW/m2
• Express each numerical value as anumber times 10-1
2 •
Figure 27 is a graph that shows thehearing ability of the population as a whole.Each curve on the graph is labeled with anumber which gives the percentage of thepopulation who can hear that intensity and

120 r - -.-. I(f) I.....J
W,OO Ico ,tj \Q,SO \
\.....J \
W \~ 60.....J
>-1-40(f)ZWI- 20Z
o 0 00o 0 00¢ to ooQ
o 000o 000o 000¢~ <.D er:i 6

frequency. The top curve (called the thres-hold of feeling curve) is the highest intensityperceived as sound. Higher intensities areperceived as pain. The bottom (1%) curve isusually taken as "normal" hearing. It isassumed that, if 1% of the population heartones at these intensities, that is "normal"hearing. The other 99% of the population, forone reason or another, has lost this hearingability. Even for the 1% curve, the thresholdis not 0 dB at all frequencies. For example, at200 Hz the intensity level must be 20 dBbefore the sound is perceived by those withnormal hearing. The 50% curve is indicative of"average" hearing, because half the popula-tion hears better and half hears worse. Notethat "average" hearing is not "normal": at200 Hz the intensity level must be about35 dB before 50% of the population hears it.
Question 17. What frequency sound is heardby the largest number of people at a level of10 dB? About what fraction of the popula-tion can hear it?
Question 18. What fraction of the populationcan hear 100 Hz at 20 dB? At 60 dB?
Question 19. Between about 1300 Hz and5000 Hz, the 1% curve in Figure 27 is belowO. What does this mean? Can it be correct?Explain your answer carefully.
Figure 27 indicates that the ear is notequally sensitive to all frequencies. Althoughthe decibel scale corresponds roughly to thesensation of loudness at a single frequency, itcannot be used to compare the relativeloudness of two sounds at different fre-quencies. For the latter purpose a new scaleof loudness, in units called phons, is used.This scale of loudness is based on hearingresponse at a frequency of 1000 Hz. Theloudness level (in phons) of any tone isdefined as the intensity level (in decibels) of aI-kHz tone of equal loudness. Thus, a tone offrequency 1 kHz and intensity level 40 dB hasa loudness level of 40 phons. The loudness of
"~otherfrequencies is'deteimibeo' by ,:e-x.peri-
ments. While one cannot accurately judgechanges in loudness, one can tell when twosounds are equally loud. In the experiments,people were asked to judge when sounds ofdifferent frequencies were as loud as a I-kHzsound. In this way, curves of equal loudnesswere generated for various loudness levels.The results are summarized in Figure 28,where each equal-loudness curve is labeled byits phon value. The phon has only limitedusefulness. It is actually used to arrive atanother measure of loudness, the subjectiveloudness expressed in sones. We will notconsider sones in this module.
Example Problem. What is the loudness levelin phons of a 10Q-Hztone at an intensity levelof 60 dB?
Solution. Since loudness is a subjective quan-tity, and the data has been presented here inthe form of a graph, the solution is obtainedby referring to Figure 28. The intersection ofthe frequency (horizontal) axis with theintensity-level (vertical) axis is read in rela-tionship to the loudness curves (labeled inphons). In this example the 10Q-Hz lineintersects the 60-dB intensity level line at apoint about halfway between the 30- and 40-phon curves. The loudness is then about 35phons.
Example Problem. What intensity level musta 1Q-kHztone have in order to sound just asloud as a I-kHz tone with an intensity level of40 dB?
Solution. Weknow that the loudness level forthe I-kHz sound is 40 phons. Wethen refer tothe graph of Figure 28 and follow the40-phon curve until it intersects the 1Q-kHzline. This intersection corresponds to anintensity level which may be read on thevertical axis. In this case that intersectioncorresponds to an intensity level of about52 dB.
Problem 11. What is the loudness level inphons of a 40Q-Hz tone at an intensity level
fdf12<NB?

130
120
fli I 10..JW 100CDW 90Q. 80
..J 70W> 60W..J 50>-I- 40
(/) 30ZW 20I-Z 10
o-10
20 40 60 100 200 400 600 1,000 2,000 4,000
- FEELING ~120--- ~v
~110 '/ /'
~ ..•...... ./V-./~I- --..--- ./V-~- 90 -
~ I-- -- ./ V .-/.::-- 80 -~ ~ :::::-:---- 70
"""""'-- "../ V ././ -"'"
~ ::::: .......~ ~ 60 "-- V/ v
~.-'" .•....•. ~"~ 50 - V ~.••.... .••.... -- / -"- "~
"'-.... ...•..•....• ""'-- V V /-- •.... 40 ./
""-...~~.............. ---- .....V /..•.... 30
'" ~.............. -•....- V /' /,•......... 20 /
~.......•••..
10- V /' .- /•......... --""'- -0- V -i-""'"
..•.... --'" /.....•..•.. i'........l /I I I I I I I I I I
Problem 12. What intensity level must a4Q-Hz tone have in order to sound just as loudas a I-kHz tone with an intensity level of60 dB?
Question 20. Is there any frequency otherthan 1 kHz at which a sound with an intensitylevel of 40 dB has a loudness of 40 phons? Ifso, at what frequency does this occur?
In this section you have discovered theempirical relationship between the funda-mental frequency f of a string and propertiesof the string, the tension T, mass m, andlength L. This relation can be written as
f= KVT/mL
where K is a constant of proportionality .You have also found that the frequencies
to which the human ear responds range fromabout 20 Hz to 20 kHz, with the best re-sponse falling between 3 and 4 kHz. Two
amplitudes such that the ratio of their squaresis a constant, regardless of what amplitudeyou begin with. Saying this differently, theratio of intensities is constant.
The sound of a guitar depends on theresonances between the oscillations of thestring and the possible oscillations of the airinside the guitar box or those of the soundboard.
You learned definitions of sound-waveintensity and level. Intensity / is givenby
where P is the power carried by the soundwave and A is the area over which that poweris spread. Intensity level I.L. is defined interms of intensity / and the minimum aud-ible intensity (arbitrarily chosen as /0 =10-12 W/m2
):
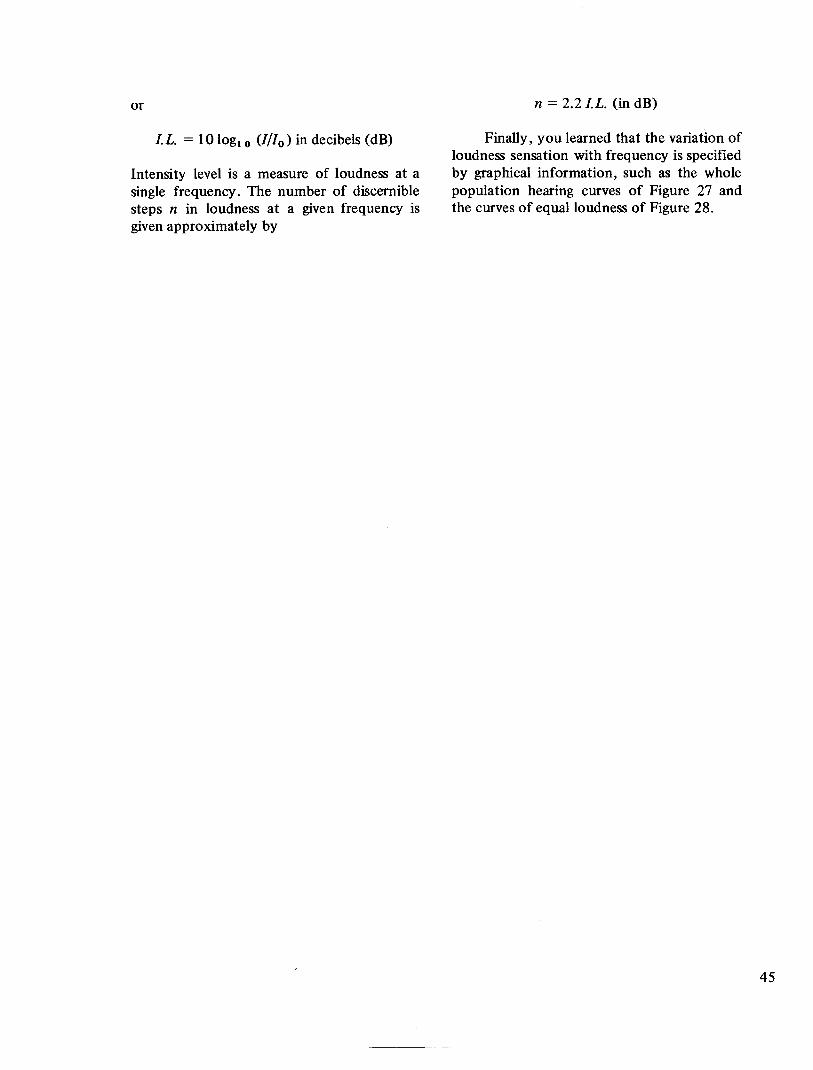
Intensity level is a measure of loudness at asingle frequency. The number of discerniblesteps n in loudness at a given frequency isgivenapproximately by
Finally, you learned that the variation ofloudness sensation with frequency is specifiedby graphical information, such as the wholepopulation hearing curves of Figure 27 andthe curves of equal loudness of Figure 28.

The following goals state what youshould be able to do after you have com-pleted this section of the module. These goalsshould be studied carefully as you proceedthrough the module and as you prepare forthe post-test. The example which follows eachgoal is a test item which fits the goal. Whenyou can correctly respond to any item likethe one given, you will know that you havemet that goal. Answers appear immediatelyfollowing these goals.
1. Goal: Understand how the superposi-tion of two traveling waves produces astanding wave.
Item: Sketch the resultant standingwave between B and C at the instant thetwo traveling waves are as shown inFigure 29.
2. Goal: Know the relationship betweenthe speed, wavelength, and frequency ofa wave.
Item: If the speed of sound in air is340 mIs, what is the wavelength of a440-Hz tone?
3. Goal: Know the general formula for thefrequencies of the normal modes ofoscillation of a string which is fixed atboth ends.
Item: What is the frequency of the thirdharmonic of a string 40 cm long whosemass is 20 g and which is under 64 N oftension?
4. Goal: Understand how the superposi-tion of harmonics on a string producesany particular standing wave.
Item: A guitar string is plucked at one-fourth the distance from bridge to nut.What harmonics are missing? Is thesecond harmonic very small in amplitudecompared to the fundamental or not?(Use sketches to decide, if necessary.)
5. Goal: Understand the physical basis ofmusical intervals, consonance, and dis-sonance.
Item: The three notes immediatelyabove E are F, G, and A. Which of thethree form consonant intervals with Eand what are the intervals?
Answers to Items AccompanyingPrevious Goals
1. See Figure 30. Less than the full maxi-mum displacement.

4. 4th, 8th, 12th, etc. missing.The ampli-tude of the second harmonic will berelatively large compared to its ampli-
tude when the string is plucked at otherpoints.
5. G is consonant, forming a minor third; Ais consonant, forming a fourth; F is notconsonant.

You have discovered that some patternsof vibration on a guitar string have simpleproperties. Each pattern has nodes at bothends, where the string cannot move. Thesimplest pattern has amplitudes of oscillationthat increase gradually from the ends to amaximum, called an antinode, at the mid-point. Other simple patterns are similar,except that additional nodes and antinodesappear. On strings, the nodes are alwaysequally spaced. Associated with each patternis frequency given by an equation that youdiscovered empirically in Experiment B-1:
f= K/TmL
where T is the tension in the string, m and Lare the mass and length of the portion thatvibrates, and K is a constant that can bedetermined by measurement.
Why does the string behave this way?Can we propose a set of simple ideas aboutwhat goes on when the string vibrates suchthat the string equation above becomes anecessary result? Such a set of ideas is called amodel or, if it encompasses a wide range of
phenomena, a theory. If the equation derivedfrom the theory agrees with the equation thatwas determined from experiment, then weregard the theory as tentatively correct. Agood theory can also be used to predict theresults of experiments not yet performed. Ifthe results of these new experiments agreewith the theoretical predictions, we gain moreconfidence in the theory. If they do not, wemay either discard the theory and replace itwith a new one, or modify it so that itpredicts correctly the results of all the experi-ments we know about. Note that there is a bigdifference between facts and empirical rela-tionships on the one hand, and models andtheoretical equations on the other. Theformer are not matters of opinion and theyare not subject to change, except for refine-ments that result from reductions in theerrors of measurement. The latter are crea-tions of human minds, and they must bemodified whenever new evidence indicatesthat they are inconsistent with the facts.
What we now seek is a theory fromwhich we can deduce the string equation as anecessary consequence. Experiment C-l willhelp to suggest a suitable model for thebehavior of vibrating strings.

The equipment needed is a long springand a timer. You have already observed thatthere is similarity in the patterns of transversevibrations on stretched springs and on guitarstrings. Since the patterns on the spring areeasier to see and the frequencies produced arelower, it requires less equipment to makemeasurements using a spring.
Stretch the spring between two pointson a smooth floor; keep these endpoints fixedduring the measurements described below. Inthis way, the spring will be similar to a guitarstring fixed at each end. Near one fixed endpull a piece of the spring to one side andrelease it. Watch the pulse travel back andforth along the spring. Count the number ofsuch traversals that you can follow clearly.Now repeat this procedure, but use a stop-watch to measure the time it takes for thepulse to complete as many trips back andforth as you can easily observe. (On a guitarstring, a pulse like this moves much too fastto observe and time with a stopwatch.)
1. What is the time required for one com-plete round trip of the pulse? (A roundtrip is the motion of the pulse from itsstarting point down to the far end, backto the near end, and back to its startingpoint.)
With the spring raised up off the floor,push the spring gently to and fro sidewaysnear one end so as to excite the simplestpattern of vibration. That is, the pattern is theone with nodes on the ends and an antinodeat the midpoint. This situation is the same aswhen a guitar string vibrates at its funda-mental frequency. When this pattern is wellestablished, measure the time it takes tocomplete some predetermined number ofcomplete oscillations. (A complete oscillationis the motion of the spring from a maximumdisplacement on one side to a maximumdisplacement on the other, then back to itsoriginal position.)
2. What is the time required for one com-plete oscillation? This time is called oneperiod of oscillation, or more simply,one period.
3. What is the frequency of oscillation?How is the frequency related to oneperiod?
4. How does the time required for a pulseto travel to the end of the spring andback compare with the time found inQuestion 2 for one complete oscillation?
Now with the spring back on the floor,create a single transverse pulse and watch ittravel back and forth along the spring.
5. Describe how the shape of the pulsechanges as it travels along. Would yousay that shape change is rapid or slow?
6. Describe any change in amplitude (maxi-mum displacement) that occurs as thepulse travels along. Would you say thatthe amplitude change during one tripdown the spring is large or small?
a. Is the pulse displacement on thesame side of the spring as beforereflection or on the opposite side?If the reflected pulse is on the sameside, we say it is reflected in thesame phase as the incident pulse. Ifit is on the opposite side, we say itis inverted relative to the incidentpulse.
b. Is the shape of the pulse muchdifferent from its original shape?
Now create a pulse with a small ampli-tude by striking the spring lightly with theedge of your hand near one end (a gentle

karate chop). Time the back-and-forth motionas you did earlier. Next create a larger ampli-tude pulse of similar shape by striking thespring harder at the same place. Again timethe back-and-forth motion.
8. Is the time required for one completeround trip nearly the same or quitedifferent for two pulses of differentamplitude?
Now create a broader pulse by quicklymoving the end of the spring to one side,holding it there briefly, then moving itquickly back to its initial position. Measurethe time it takes the pulse to complete around trip.
9. Is the time required for one completeround trip nearly the same for a broadpulse as for a narrow one?
For the next part of the experiment, youwill need the cooperation of at least twoother persons. One person should count ca-dence and at the signal, GO, the other twoshould introduce pulses at opposite ends ofthe spring. The two pulses should be as similaras possible, and on the same side of thespring, as shown in Figure 31. This will takesome practice. Watch what happens in theregion where the two pulses overlap briefly.Also try to follow one of the pulses after itemerges from this overlap region. (If thingshappen so fast that you can't follow them,reduce the tension in the spring and the pulseswill travel more slowly.)
10. Is the maximum displacement in theoverlap region greater than, equal to, orless than the amplitude of either one ofthe original pulses? Do you think it is
greater than, equal to, or less than thesum of the amplitudes of the two origi-nal pulses?
11. Mter a pulse emerges from the overlapregion, is it essentially the same as orcompletely different than it was beforeit entered the overlap region?
Now repeat the previous observation,but with one important difference: one origi-nal pulse should be on one side of the spring,and the other pulse should be on the otherside of the spring. This situation is shown inFigure 32. We say that the displacement onone side is positive and the displacement onthe other side is negative.
12. When the centers of the two pulses reachthe midpoint of the spring, is the dis-placement of the midpoint greater than,equal to, or less than the amplitude ofeither original pulse? Do you think thisdisplacement is greater than, equal to, orless than the difference between theamplitudes of the two original pulses?
13. Do the pulses that emerge from theoverlap region look similar to those thatenter?

You saw in this experiment that a pulsemoves along the spring without changing itsshape appreciably. The amplitude decreases,but the decrease is not very big during onetrip down the spring. Therefore, you canfollow the pulse during a few trips back andforth. The time it takes for a complete roundtrip of a pulse is nearly constant; thus thevelocity of the pulse does not depend muchon the amplitude or the breadth of the pulse.
After a positive pulse reflects from oneend, it comes back as a negative pulse and,similarly, a negative pulse is reflected as apositive pulse. That is, the direction of thedisplacement of the pulse is reversed uponreflection. However, the reflected pulse hasthe same general shape as the original pulse.
When two positive pulses overlap, theycombine to produce a displacement that islarger than the amplitude of either originalpulse. When one positive and one negativepulse overlap, they combine so that theyalmost cancel each other. It is consistent withyour observations to say that at each pointalong the spring, the actual displacement isthe sum of the individual displacements whichthe two pulses would cause separately at thatmoment. This statement is called the law ofsuperposition for displacements. The pulsesemerge from the region of overlap largelyunchanged in size and shape.
Finally, you probably observed that thetime it takes for a pulse to make onecomplete round trip along the spring is thesame as the time for one complete oscillationof the vibration pattern corresponding to thefirst harmonic. All these observations suggesta model for the way simple patterns ofvibration-called standing waves-result fromthe superposition of waves that travel backand forth along the spring. This same modelapplies to guitar strings.
Consider the wave train traveling to theright pictured in Figure 33a. For the timebeing, forget about the fact that the spring isonly of length L and is tied down at the ends.Imagine for the moment that the spring ismuch longer.
Figure 33b shows how another wavetrain would appear if it were moving in adirection opposite to that shown in Figure33a. Now imagine that these two waves arepresent simultaneously in the region betweenpoints Band C. This is the region where thereal spring exists. Applying the principle ofsuperposition, we conclude that the springshould appear at that instant as shown inFigure 33c. The displacements at both ends(points Band C, where the spring is tieddown) are zero, and in the middle thedisplacement is twice that of either wave byitself.
A wave train like those shown in Figure33 is a set of identical wave shapes, or cycles,which repeat themselves along the wave train.The length of one of these identical waveshapes is called the wavelength of the wave.As you can see in Figure 34, one wavelength,represented by the symbol A. (lambda), is thedistance from crest to crest. The wavelength isalso the distance from any point on one cycleof the wave to the corresponding* point onthe next cycle.
Question 21. Using the definition of wave-length, explain why the distance from A to Cin Figure 33a is one wavelength, and why thedistance from B to C is one-half wavelength.
When the crests (or troughs) of twowaves occur at the same place at a given time,as in Figure 33, we say that the waves are inphase.
Now consider how the two wavestravel-ing in opposite directions would appear aftereach wave had traveled one-quarter of awavelength farther than shown in Figure 33.Point A in Figure 35a shows the wavemovingto the right after it has moved ~ A. further tothe right. In Figure 35b, the wave is movingto the left after it has moved ~ A. further tothe left.
We again imagine that these two waves
*Given a point on the wave, a corresponding point onthe next cycle would be the next point on the wavewhere the slope has the same value and the amplitudehas the same value.
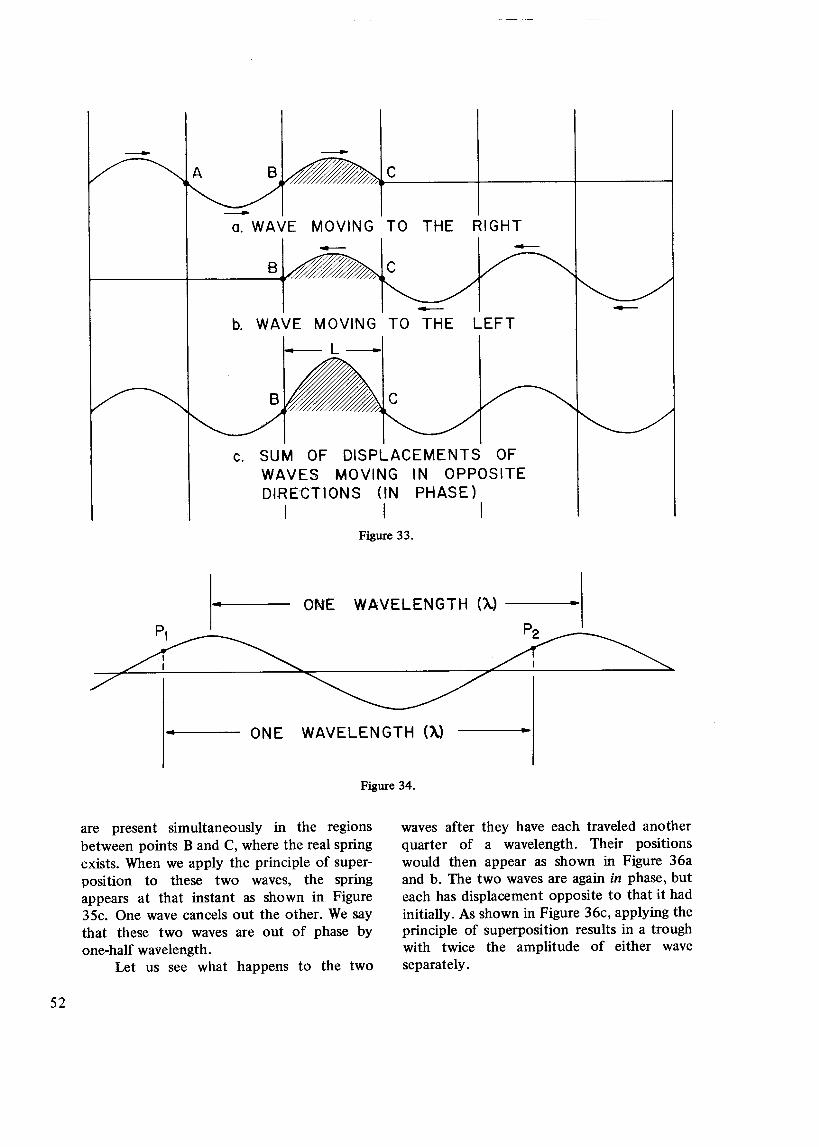
c. SUM OF DISPLACEMENTS OFWAVES MOVING IN OPPOSITED~RECT10NS (IN PHASE)
I I I
are present simultaneously in the regionsbetween points Band C, where the real springexists. When we apply the principle of super-position to these two waves, the springappears at that instant as shown in Figure35c. One wave cancels out the other. We saythat these two waves are out of phase byone-half wavelength.
Let us see what happens to the two
waves after they have each traveled anotherquarter of a wavelength. Their positionswould then appear as shown in Figure 36aand b. The two waves are again in phase, buteach has displacement opposite to that it hadinitially. As shown in Figure 36c, applying theprinciple of superposition results in a troughwith twice the amplitude of either waveseparately.

c. SUM OF DISPLACEMENTS OFWAVES MOVING IN OPPOSITEDIRECTIONS (OUT OF PHASE BYONE HALF WAVELENGTH)
Problem 13. Sketch the two waves, onemoving to the right, and the other to the lefta. after each wavehas moved ~ A. farther thanshown in Figure 36, and b. after each wavehas moved Y2 A. farther than shown in Figure36.
Question 22. Study the superposition thatresults between points B and C for Figures 33,35, 36, and the two sketches you made inProblem 13. Regard the region between B andC as the location of the real spring. What isthat part of the spring between B and C doingduring this sequence? Are points Band Cnodes, as the end points of the spring mustbe, during the time that the two imaginarywavesare moving through each other?
Two wavesmovingin opposite directionson a long spring can, by the principle ofsuperposition, be added algebraically. Thesuperpositions described above reveal that
two wave trains traveling in opposite direc-tions can combine to produce a pattern on acoiled spring or a guitar string that includesnodes and antinodes at specific locationsalong the spring or string, just as we observedthem on an actual vibrating spring. Thesepatterns of vibration are referred to as stand-ing waves. The two original moving wavetrains are called traveling waves.
What are the implications of our infer-ence that two oppositely directed but other-wise identical traveling waves are equivalentto a standing wave? If this inference is to beplausible, then it must be that the wavetraveling in one direction is the excited wave.The wave traveling in the other direction canthen only be the result of reflecting from theend of the spring or guitar string. Is this thecase? Look at Figures 33a and 33b. The wavetraveling to the right (shown in Figure 33a) ifit had not encountered the tied down end atC, would have produced a negative displace-

c. SUM OF DISPLACEMENTS OFWAVES MOVING IN OPPOSITEDIRECTIONS (IN PHASE)
I I
ment a half wavelength to the right of C. Fora reflection, we know that such a pulse hasits displacement reversed at C and is sent backto the left. This positive pulse traveling to theleft is exactly what is drawn in Figure 32b. Asa result of reflections at Band C, the pulsesshown in Figures 33a and 33b exist simulta-neously in the region between Band C.
You found in Experiment C-I that thetime it takes for a pulse to make onecomplete round trip along a spring (or guitarstring) is the same as the time for onecomplete oscillation of the vibration patterncorresponding to the first harmonic. You havealso just seen that with our model of twowaves traveling through each other to formstanding waves, each wave travels one wave-length during the time that the standing wavemakes one complete oscillation. Thus, theperiod of the oscillation of the spring is thesame as the time it takes for one of thesewaves to move a distance of one wavelengthalong the spring.
The model we have created to accountfor the fundamental vibration pattern of aspring (or guitar string) gives results which arein agreement with experiments you haveconducted only if the wavelength of thewaves traveling back and forth on the spring isexactly twice the distance between the fixedends of the spring:
X=2L(1st Harmonic)
According to our model, a guitar stringvibration is in its fundamental mode wheneverwe have produced waves for which the wave-length is given by
where L is the distance between the fixedends of the guitar string (the distance fromthe bridge to the nut).

From observations made in ExperimentC-l, and from the model of two travelingwaves, we conclude that a traveling wavemoves along a guitar string a distance of onewavelength in a time of one period ofoscillation of the string. Because distancetraveled is related to speed and time by theequation
we can write an equation for the speed (v) ofa wave on the guitar string:
where T is the period of oscillation. Thisequation can be rewritten as
Question 23. Suppose that a guitar string hasa period of 0.01 s per oscillation. What is thevalue of the quantity 1fT, and what does thisquantity represent?
In Question 23, the quantity 1/T is whatwe have called the frequency f of oscillation.In general, the frequency is related to theperiod by the equation
Replacing l/T in Equation (20) by ffrom Equation (21), we have the importantrelationship:
Question 24. According to Equation (22),what happens to the wavelength if we keepthe oscillation frequency fixed, but increasethe speed of the wave in the string? Whathappens to the frequency of oscillation if wedecrease the wave speed, but keep the wave-length unchanged? In a given medium (wherethe wave speed is fixed) what happens to the
wavelength if we go to a higher frequency ofoscillation?
Setting the right sides of each of theseequations for A equal to each other, we have
Multiplying both sides of this equation by fand dividing by 2 L, we get
vf= 2L
(Ist Harmonic)
Equation (23) is a theoretical equation,based upon our model, for the frequency ofoscillation of a string of length 1. The nextstep is to compare this theoretical equationwith the equation determined empirically inExperiment B-1:
f=KjTmL
The equations don't look much alike, dothey? However, the theoretical equation con-tains the wave velocity v, and until wediscover how v depends on properties of thestring such as T, m, and L, we cannot expectthe two equations to be identical.
We have called attention to the fact thatany displaced portion of the string returnsto equilibrium more rapidly as the tensionincreases. You observed in an experimentthat when the tension of a coiled spring wasincreased, the wave speed increased. Also thewave speed is lower for more massive springsthan for lighter springs. (By "massive" wemean the mass per unit length.)
Your experience with waves on springs

and strings, along with the model we havedeveloped, provides a qualitative relationshipbetween tension, mass, length, and wavespeed. It is possible to derive a quantitativerelationship between these variables which isconsistent with what you expect qualitatively,using Newton's laws of motion. We will notcarry out the derivations here but will simplyassert the result without proof. *
v = jm~L =fl (25)
Now eliminating v between equations 23 and25, we obtain
If we use the subscript 1 on 1to designate thefirst harmonic, this equation becomes
The theoretical equation (26) and our experi-mental equation (24) are identical, if we putK = 1/2. Is this value consistent with yourresults of Experiment B-1?
It looks as though we may have a goodtheory, but there are still questions that needto be answered. The theory predicts the firstharmonic standing-wave patterns correctly,but what about higher modes? Figure 37shows traveling waves with one-half the wave-length of those shown in Figures 33, 35, and36. Notice that we have possible nodes atpoints B and C, and another midway betweenthese points.
Problem 14. Sketch the appearance of thetwo traveling waves of Figure 37 and theirsuperposition as they would appear at thetime when each traveling wave has moved~ A farther. Sketch them again when theyhave moved another ~ A.
*For a derivation see, for example, Sears & Zemansky,University Physics, Addison-Wesley Publishing Co.
Question 25. From Figure 37 and the resultsof Problem 14, what can you conclude aboutthe locations of nodes and antinodes frompoint B to point C?
The pattern of nodes and antinodesproduced by these two traveling waves isidentical to the second harmonic you saw onthe coiled spring and on the guitar string.How fast would waves with this wavelengthtravel on the string? You showed in Experi-ment C-l that the speed of a pulse does notdepend on either the amplitude or thebreadth of the pulse. Equation (25) thusholds regardless of the wavelength. However,for the waves shown in Figure 37, one wholewavelength fits into the length L. Taking thisto be the pattern for the second harmonic,the condition for the second harmonicbecomes
2 (A2 /2) = L(2nd Harmonic)
v1=-A
is still valid, replacing A by L, and using thesubscript 2 to designate the second harmonic,
V12 =-L
(2nd Harmonic)
Finally, replacing the speed v by its valuegivenin Equation (25), we have
12 = IIJ;;i(2nd Harmonic)

--L-
- - - - C
- - - -o. WAVE MOVING TO THE RIGHT
-- - --B //,~- -
b. WAVE MOVING TO THE LEFT--L-
c. SUM OF DISPLACEMENTS OFWAVES MOVING IN OPPOSITEDIRECTIONS (IN PHASE)
I I
These results agree with observationsmade during Experiment A-2: the frequencyof the second harmonic is twice the frequencyof the first harmonic.
If we consider the case of two travelingwaves, each with one-third the wavelength ofthose we first discussed in Figure 32, we findthat this situation produces a pattern identicalto the third harmonic we observed in thespring, with three antinodes. The conditionfor the third harmonic standing wave is thatthree half-wavelengths fit exactly into thedistance L between end points. As an equa-tion, this condition is:
Using the same method, we find thecondition for the standing wave correspond-ing to the fourth harmonic to be
Instead of writing a different equationfor each condition, we may summarize theseequations, and those for all the higher-orderharmonics, into one equation. To do this wenotice that the order number N of theharmonics (1st, 2nd, 3rd, etc.) is the numberof half-wavelengths which must fit into thedistance L between end points. As an equa-tion, this condition becomes
Problem 15. For a certain guitar, it is 66 cmfrom the nut to the bridge along a guitarstring. The fundamental frequency of thisstring is 220 Hz. What is the frequency of thestring when there are nodes spaced 22 cmapart? What is the wavelength of the travelingwaves on this string which give rise to thismode of oscillation?
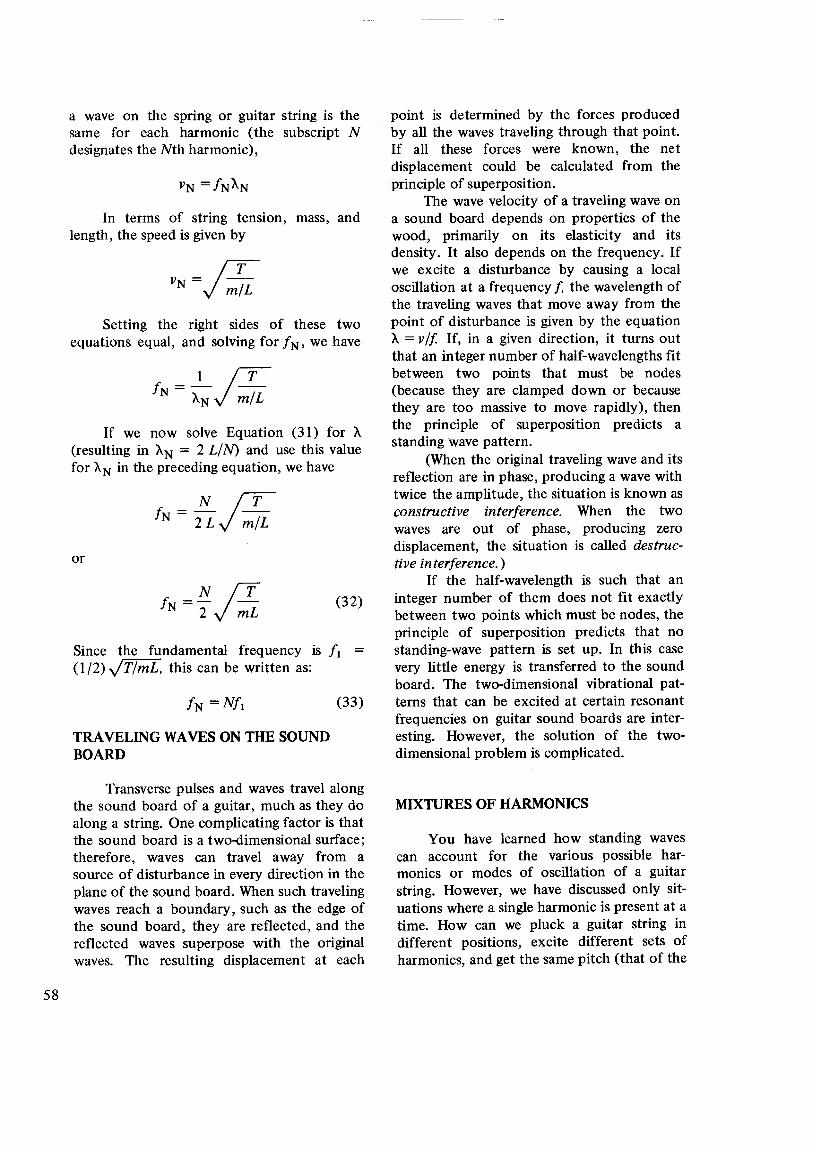
a wave on the spring or guitar string is thesame for each harmonic (the subscript Ndesignates the Nth harmonic),
In terms of string tension, mass, andlength, the speed is given by
Setting the right sides of these twoequations equal, and solving for fN' we have
If we now solve Equation (31) for A(resulting in AN = 2 LIN) and use this valuefor ANin the preceding equation, we have
f=NjTN 2 mL
Since the fundamental frequency is fl =(1/2) .jTlmL, this can be written as:
TRA YEUNG WAYES ON mE SOUNDBOARD
Transverse pulses and waves travel alongthe sound board of a guitar, much as they doalong a string. One complicating factor is thatthe sound board is a two-dimensional surface;therefore, waves can travel away from asource of disturbance in every direction in theplane of the sound board. When such travelingwaves reach a boundary, such as the edge ofthe sound board, they are reflected, and thereflected waves superpose with the originalwaves. The resulting displacement at each
point is determined by the forces producedby all the waves traveling through that point.If all these forces were known, the netdisplacement could be calculated from theprinciple of superposition.
The wave velocity of a traveling wave ona sound board depends on properties of thewood, primarily on its elasticity and itsdensity. It also depends on the frequency. Ifwe excite a disturbance by causing a localoscillation at a frequency f, the wavelength ofthe traveling waves that move away from thepoint of disturbance is given by the equationA = vIf If, in a given direction, it turns outthat an integer number of half-wavelengths fitbetween two points that must be nodes(because they are clamped down or becausethey are too massive to move rapidly), thenthe principle of superposition predicts astanding wave pattern.
(When the original traveling wave and itsreflection are in phase, producing a wave withtwice the amplitude, the situation is known asconstructive interference. When the twowaves are out of phase, producing zerodisplacement, the situation is called destruc-tive interference.)
If the half-wavelength is such that aninteger number of them does not fit exactlybetween two points which must be nodes, theprinciple of superposition predicts that nostanding-wave pattern is set up. In this casevery little energy is transferred to the soundboard. The two-dimensional vibrational pat-terns that can be excited at certain resonantfrequencies on guitar sound boards are inter-esting. However, the solution of the two-dimensional problem is complicated.
You have learned how standing wavescan account for the various possible har-monics or modes of oscillation of a guitarstring. However, we have discussed only sit-uations where a single harmonic is present at atime. How can we pluck a guitar string indifferent positions, excite different sets ofharmonics, and get the same pitch (that of the

fundamental) but tones of different quality?Also, how does the pitch change suddenlywhen a vibrating string is touched at a certainpoint along its length?
It turns out that a plucked string givesseveral frequencies of sound at the sametime: the fundamental and several harmonics.Does this fact mean that the string is vibratingwith several frequencies at once? As a matterof fact, the string can vibrate with anynumber of the permissible standing-wave fre-quencies at the same time. Each possiblestanding wave is called a mode of oscillation.It is unusual for a plucked string to vibratewith just one of the simple wave shapes wehave studied so far. A string plucked with asharp point like a fingernail or guitar pickmight, at different times, have the shapesshown in Figure 38.
At A, the string is at its initial displace-ment. At B, part of the disturbance hasmoved to the right, while the other part hasmoved to the left. In C, D, and E both
disturbances are moving to the left. In F thedisturbances are moving toward each other,and in G they are together. For each of theseshapes of the guitar string, there is a set ofharmonics (standing waves on the string),each with a different amplitude. The algebraicsum of these amplitudes gives the string shapeat that instant. The nodes of each harmonicare in the usual positions on the string. But asthe antinodes from the different harmonicsvibrate at their various frequencies, the sumof all harmonics is the displacement shown inFigure 38, moving back and forth along thestring. It is surprising that the sum of standingwaves is a shape which is moving, but this isthe case.
A simpler example will further illustratethis remarkable property of string oscillations.Figure 39 shows the shape of a guitar stringplucked exactly at its midpoint by a sharppick. The displacement is exaggerated to showthe shape of the string.
STRING PLUCKEDAT MIDPOINT
The harmonics which add together tomake this shape are shown in Figure 40. Theamplitudes are drawn to scale.
Notice that the second, fourth, and sixthharmonics are missing. Higher odd-numberedharmonics, such as the ninth and eleventh, arepresent, but their amplitudes are small enoughto ignore.
Problem 16. By measuring the displacementsof the standing waves shown in Figure 40from one fixed end to the other, sketch thealgebraic sum of the first and third harmonics.How does the shape of this resulting wave
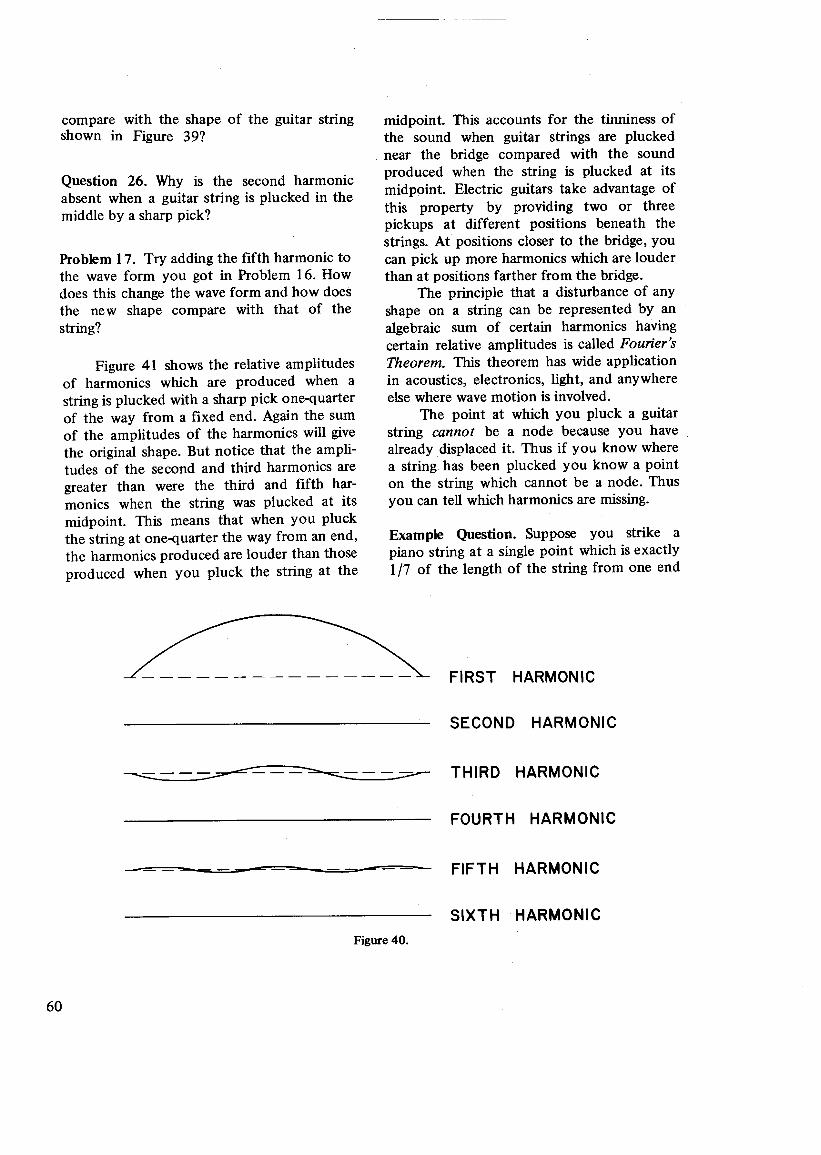
compare with the shape of the guitar stringshown in Figure 39?
Question 26. Why is the second harmonicabsent when a guitar string is plucked in themiddle by a sharp pick?
Problem 17. Try adding the fifth harmonic tothe wave form you got in Problem 16. Howdoes this change the wave form and how doesthe new shape compare with that of thestring?
Figure 41 shows the relative amplitudesof harmonics which are produced when astring is plucked with a sharp pick one-quarterof the way from a fixed end. Again the sumof the amplitudes of the harmonics will givethe original shape. But notice that the ampli-tudes of the second and third harmonics aregreater than were the third and fifth har-monics when the string was plucked at itsmidpoint. This means that when you pluckthe string at one-quarter the way from an end,the harmonics produced are louder than thoseproduced when you pluck the string at the
midpoint. This accounts for the tinniness ofthe sound when guitar strings are pluckednear the bridge compared with the soundproduced when the string is plucked at itsmidpoint. Electric guitars take advantage ofthis property by providing two or threepickups at different positions beneath thestrings. At positions closer to the bridge, youcan pick up more harmonics which are louderthan at positions farther from the bridge.
The principle that a disturbance of anyshape on a string can be represented by analgebraic sum of certain harmonics havingcertain relative amplitudes is called Fourier'sTheorem. This theorem has wide applicationin acoustics, electronics, light, and anywhereelse where wavemotion is involved.
The point at which you pluck a guitarstring cannot be a node because you havealready displaced it. Thus if you know wherea string has been plucked you know a pointon the string which cannot be a node. Thusyou can tell which harmonics are missing.
Example Question. Suppose you strike apiano string at a single point which is exactly1/7 of the length of the string from one end

STRING PLUCKED1/4 FROM AN END
of the string. What string modes would youexpect to be missing from the vibration ofthis string?
At 1/7 of the way from one end of thepiano string there cannot be a node. If therewere a node at this position, there would be 7antinodes between the fixed ends of thestring. Thus the 7th harmonic would bepresent if a node existed 1/7 of the way fromone end. Because the string is struck at thispoint, a node. cannot exist there, and the 7thharmonic must be missing. Since the 14th,21st, and all other multiples of 7 also wouldhave a node at this position, these harmonicsmust also be missing.
Question 27. A guitar string is plucked 11 cmfrom the bridge. If the distance along thestring from the bridge to the nut is 66 cm,what harmonics are missing? If the funda-mental frequency of the string is 167 Hz (lowE), what frequencies (called overtones) are
mlSsmg from the harmonics of the string?What are some of the overtones which arepresent?
Air has elasticity and mass, and thus itcan conduct sound waves. If the air isconfined, as in the sound box of a guitar,traveling waves can reflect and, by super-position, produce standing-wave resonances.However, there is an important differencebetween sound waves in air and the waves wehave discussed thus far. Sound waves in air arelongitudinal, not transverse. This means thatthe oscillations of air particles are in the samedirection as the direction of travel of thewave. Air molecules that are displaced side-ways do not experience restoring forces thatpull them back, and thus no transverse oscilla-tions occur in air. However, air is elastic. Ifyou compress a container of air, the pressureon the air inside pushes outward; if you
expand the container of air, the pressureinside decreases and the larger pressure out-side pushes inward. Thus air can vibratelongitudinally.
(Another difference between vibrationsin air columns and vibrations on strings resultsfrom differences in the conditions at the ends.These are sometimes called boundary condi-tions. )
A string is normally tied down at bothends, so the ends are nodes. A tube containingair, such as an organ pipe, can be either openor closed at the ends. It is easy to see that awave pulse is reflected by a closed end. Airmoves toward the closed end but cannotmove past the end. Thus the pressure at theend increases until the forces in the directionopposite to the original motion slow downthe advancing particles, cause them to stop,and then push them back away from the end.At a closed end, air particles don't move, sothe closed end is a node for the motion ofparticles. The particles near the end have theirdirection of motion reversed, and the re-flected pulse has a displacement opposite tothat of the original pulse. If one thinks of asound wave as an oscillation in pressure,instead of as an oscillation in the motion ofparticles (it is, of course, both), then a closedend is a place where pressure oscillations aremaximum; that is, an antinode.
The velocity of sound in air at sea level isbetween 330 mls and 340 m/s; it increaseswith temperature. At a fixed temperature,sound waves of all frequencies travel at thesame speed. This speed is not too differentfrom the speed of transverse wavesin a guitarsound board. This means that the air in thesound box can have standing waves whichresonate at frequencies that are in the samegeneral range as the resonant frequencies ofthe sound board, since both vibrating struc-tures have the same dimensions. Instrumentdesigners over many years, have learned, bytrial and error, to produce instruments forwhich the elasticity and thickness of thewood and the construction of the instrumentare such that sound board, strings, and the airin the sound box have overlapping resonances.
Why is a guitar designed to produce theparticular musical tones that it does? Moregenerally, why is any musical instrumentdesigned to produce the particular tones thatit does? In the broadest sense, the answer tothese questions depends on the answer to amore basic question. Why do certain combina-tions and sequences of frequencies soundpleasing to the ears, while other combinationsand sequences are perceived as unpleasant?Two or more tones which, in combination,sound pleasant and in some way "final" tothe ear are said to be consonant. On the otherhand, a combination of tones which is un-pleasant in the sense that it suggests un-relieved tension and a feeling of incomplete-ness is said to be dissonant. Consonance anddissonance are difficult to describe verbally,but every musician knows the difference. It isquite possible that the accepted standards ofconsonance and dissonance in music are in theprocess of changing.
Learning and experience play an impor-tant role in whether combinations of notessound consonant or dissonant. However, fortrained musicians raised in Western cultures,frequencies which are most consonant witheach other are found to be in the ratio ofsmall whole numbers. The smaller the num-bers, the better the consonance; for example,tones whose fundamental frequencies are inthe ratio of 3:2 are consonant. A musicalinterval is thus defined as the ratio of twofrequencies, rather than the difference. Thisdiscovery of a connection between integerratios and consonance was first made by theancient Greeks, using tones from stretchedstrings. (They actually used ratios of stringlengths, which they could measure, ratherthan frequencies, which they couldn't.)
Table III shows integer ratios (musicalintervals) of frequencies, arranged in orderfrom the integer ratio containing the smallestnumber to the integer ratio containing thelargest number. The name shown next to eachratio is the musical name of the intervalbetween the two notes. The intervals are

arranged in order of increasing dissonance.That is, a minor sixth (8: 5) sounds moredissonant than a minor third (6:5).
The actual frequencies used in musichave varied with time and place, but once astandard tone is fixed in frequency, the ratiosof Table III fix the frequencies of notes whichare consonant with the first.
Ratio ofFrequencies
UnisonOctaveFifthFourthMajor SecondMajor SixthMinor ThirdMinor SixthSecond
1: 12: 13:24:35:45:36:58:59:8
Question 28. Two notes form an octave and afifth, respectively, with a given note. Whatinterval do these notes form with each other?
By a 1939 international agreement, thefrequency of the note A above middle C isfixed at 440 Hz. This choice, along with theintervals, gives rise to the diatonic scale shownin Table IV. Each frequency of the scale isconsonant either with middle C or with a noteconsonant with middle C. For example G isconsonant with C (ratio of 3: 2), but D is not.However, G and D are consonant (ratio of4:3).
Problem 18. Find the interval which eachnote in the diatonic scale forms with middleC. Which of these are most consonant? Whichare least consonant?
Many theories have tried to explain whytones whose fundamental frequencies are in
264 Hz297330352396440495528
the ratio of small whole numbers sound"right" together while others don't. Thetheory based on beat frequencies betweenovertones, due to Hermann L. F. von Helm-holtz (1821-1894), has been fairly success-ful, but it probably is not strictly correct.
Beat frequencies are the low frequenciesthat you hear as you bring two frequenciescloser and closer together. The beat frequencybetween two frequencies, fl and f2, is theirdifference,
For example, the beat frequency between a340-Hz tone and a 320-Hz tone is 20 Hz. Whencomparing two tones, one says that the toneshave the same pitch if the beat frequency isvery small or zero. (You can hear a beatfrequency by doing the following: slightlydetune the sixth string of a guitar so that thepitch produced while pressing it at the fifthfret is slightly different than the open-stringpitch of the fifth string (A). Then, holdingdown the sixth string at the fifth fret andleaving the fifth string open, strongly pluckboth strings simultaneously. The alternatelyloud and soft sound you hear is the beatfrequency. Experiment with changing thebeat frequency.)
In Helmholtz' view, dissonance is due torapid beats between the overtones of musicalsounds. When two tones have fundamentalfrequencies in the ratio of small integers,many of their harmonics coincide. They do

not produce so many distracting beats and donot sound dissonant. For example, consider Dand C of the diatonic scale, which are in theratio 9:8. When these notes are sounded ontwo different guitar strings, the fundamentalsdiffer by 33 Hz, which is in the harshestregion of beat frequencies. D is in the scale,not because of any consonance with C, butrather, as we have already pointed out,because G forms a perfect fourth (ratio of4:3) with D, and G in turn forms a perfectfifth (ratio of 3:2) with C.
A more pertinent example might be twostrings with fundamental frequencies of380 Hz and 264 Hz. These frequencies are inthe ratio of 95: 66. A ratio of 99: 66 would bea fifth. Why do these two strings sounddissonant? The fundamentals are far enoughapart so that they don't produce a noticeablebeat. However, the second harmonic of380 Hz (2 X 380 = 760 Hz) and the thirdharmonic of 264 Hz (3 X 264 = 792 Hz) pro-duce a beat frequency of 792 - 760 = 32 Hz,which does produce a sensation of dissonance.In contrast, every second harmonic of G(which forms a perfect fifth with C) coincidesexactly with every third harmonic of C, asindicated in Table V. When the harmonics dodiffer, it is always by a multiple of 132. Thusthere are no harmonics which give beats at afrequency of less than 132Hz, and this doesnot sound dissonant.
(You should realize that, as we havealready hinted, consonance and dissonance, aswell as the structure of musical scales, arestrongly influenced by culture. These intervalsand scales have evolved at least partiallybecause of what has been considered inWestern culture to be music. In Orientalcultures, very different [more complex]scales have developed, and different ideas ofdissonance and consonance are held.)
A guitar tuned to produce the fre-quencies on the diatonic scale is said to betuned in just intonation. The open strings of aguitar tuned to the diatonic scale would havenotes corresponding to frequencies listed inTable VI (notes in octaves below middle Careindicated by multiple letters, while those inoctaves above are written with primes). Thesenotes are in the diatonic scale of C, but they
Table V. Comparison of the HarmonicsofC and G
fl = 264 Hzf2 = 528 Hzf3 = 792 Hzf4 = 1056 Hzfs = 1320 Hzf6 = 1584 Hz
f2' =: 792 Hz
f/ = 1188 Hz
f4' = 1584 Hz
EE 165AA 220D 297G 396B 495E' 660
are spread through two octaves in order togive an appropriate range. The other notes areobtained by stopping the strings at frets.
When notes whose frequencies are re-lated to one another by certain simple ratiosare played at the same time on a piano, theysound harmonious. One set of three notes iscalled the tonic chord of the key of C major.It consists of three white piano keys, C, E,and G. These notes have fundamental fre-quencies of 264 Hz, 330 Hz, and 396 Hz,which are in the proportion 4:5:6. On apiano, two keys that are one octave apart areseparated by eleven other keys. If the pianowere tuned to produce perfect harmonies incertain chords, such as those for the key of Cmajor, the frequency ratio between two adja-cent keys would vary from pair to pair alongthe keyboard. This would make the pianosound fine for songs written so as to empha-size those particular chords (for example, inthe key of C and F), but not so harmonious ifother chord structures are emphasized (as in asong written in the key of D sharp).

Another problem is that pianos fre-quently accompany other instruments, and ifinstruments using some other system are tosound harmonious when played together withthe piano, some compromise must be made.For example, a violin can play the notes forany chord, since the length of string vibratingcan be varied continuously. However, a pianohas only a fixed number of notes, as does astringed instrument with frets, like a guitar.The simplest compromise, and one that hasbeen adopted by virtually all musicians in theWestern world, is to make the frequency ratiobetween every two adjacent notes the same. Ascale constructed this way is called an equallytempered scale. Since there are twelve differ-ent notes per octave, there are twelve ratiosbetween the notes in one octave. If theseratios are all equal to each other, as requiredfor an even-tempered scale, we can representthe constant ratio with the symbol R. Know-ledge of the frequency of the beginning notein an octave allows us to find the frequencyof the next note by multiplying by R. Thus if10 is the frequency of the beginning note,10 . R is the frequency of the first note abovethe beginning note of the octave. The fre-quency of the second note above is found bymultiplying the frequency of the first note bythe ratio R. Thus the second note frequencyis
In a similar way, the frequency of the thirdnote above the beginning note is
By repeated calculations like these, we findthat the 12th note above the beginning notehas a frequency givenby
If we now form the ratio of the frequency ofthe 12th note to that of the beginning note,we have
But this ratio reduces to just Rl2. You
already know that the frequency ratio of the12th note to that of the beginning note mustbe 2 to 1 (which has a value of 2), since thenotes are an octave apart. Therefore
This equation can be solved by takingthe 12th root of both sides, with the resultthat
R=~
A nine-place electronic calculator gives,12M"for V 2, the value 1.059463094. Thus, as a
sufficiently precise approximation,
To build a scale using this ratio, we mustagree on the frequency of one note. Byagreement that note is called concert A, and isalways set at 440 Hz. Table VII shows thefrequencies of the thirteen notes from middleC to C' an octave higher. The frequencies ofnotes in the. equally tempered octave areslightly lower than the frequencies of the cor-responding notes on the diatonic scale des-cribed earlier, but the differences are less than1% and cannot be detected by most humans.Note also that the frequency ratio between Gand C, for example, which was 3 to 2 or1.500 for the diatonic scale, comes out to be1.498 for the equally tempered scale. Ratioslike this one are close enough to ratios of smallintegers that their notes still sound consonant.
Problem 19. Calculate the ratio between fre-quencies of E and F and between those of Band C' on the diatonic scale shown in TableIV. How do these ratios compare? Why can'tthis ratio be used between each of the twelvenotes in an octave on the piano?
In a symphony orchestra, most musi-cians tune their instruments so that theyconform to the oboe. You have undoubtedlyheard this take place while an orchestra iswarming up. For stringed instruments, all thatis required is that the fundamental of each

C (white key)C# (black key)D (white key)D# (black key)E (white key)F (white key)F# (black key)G (white key)G# (black key)A (white key)A# (black key)B (white key)C (white key)
261.6277.2293.7311.1329.6349.2370.0392.0415.3440.0466.2493.9523.3
open (unshortened) string should have thesame pitch as the corresponding note on theoboe. Experienced musicians then knowwhere to put their fingers in order to produceany other desired note. However, the frets ona guitar provide a fixed number of places(frets) to put your fingers, which constitute a
scale. It is not necessarily true, however, thatthe notes of this scale correspond in aone-to-one way with the notes on a piano.The guitar builder may have chosen a differ-ent scheme, or perhaps simply failed toachieve fret positions that would produce theintended sequence. If the guitar were tuned sothat each open string note had the samefrequency as the corresponding key on apiano tuned to the equally tempered scale,the open string guitar frequencies would beas follows:
EE 164.8AA 220.0D 293.7G 392.0B 493.9E' 659.3
In Experiment C-2, you will have an oppor-tunity to find out for yourself what scale hasbeen used on the guitar.

All you need to do this experiment is aguitar and a good meter stick. Measure thedistance between the bridge and each fret.Number the frets, starting with 1 for the fretnearest the nut. Fill in the blanks on TableVIII. The column of distances represents thedata from this experiment. Assume that the Astring of the guitar is tuned to 220 Hz. This isthe frequency of the fundamental of the tonemade by this string when it is not touched, orstopped, anywhere. Other entries in thiscolumn can be calculated from Equation (3):
f= CL
Since fo = C/Lo, where Lo is the full lengthof the string, iN = (Lo/LN)io, where N = 1,2,3, ...
1. Is the scale on your guitar an equallytempered scale? That is, are all the ratiosin the last column equal or nearly equal?
2. Are any or all of these ratios equal ornearly equal to the ratio between thefrequencies of two adjacent piano keys(1.0595)?
3. Could you play the note A one octavehigher by stopping the A string at a fret?Which fret? At what distance along thestring is this fret located?
4. How many notes are there to an octave?That is, how many frets are there be-tween the nut and the midpoint, count-ing the one at the midpoint?
5. Is there a fret at the node closest to thenut for the third-harmonic vibration?For the fourth-harmonic vibration? Forthe ninth-harmonic vibration? If so,which frets are these?
6. Based on your data, would you predictthat the tones made in the followingways are one octave apart?
a. Hold the A string down at fret 1and strum the string at its mid-point.
b. Hold the A string at fret 13, andstrum the midpoint of the remain-ing string (toward the bridge).
Test your prediction by holding the Astring down at the two frets described inQuestion 6 and comparing the sounds.
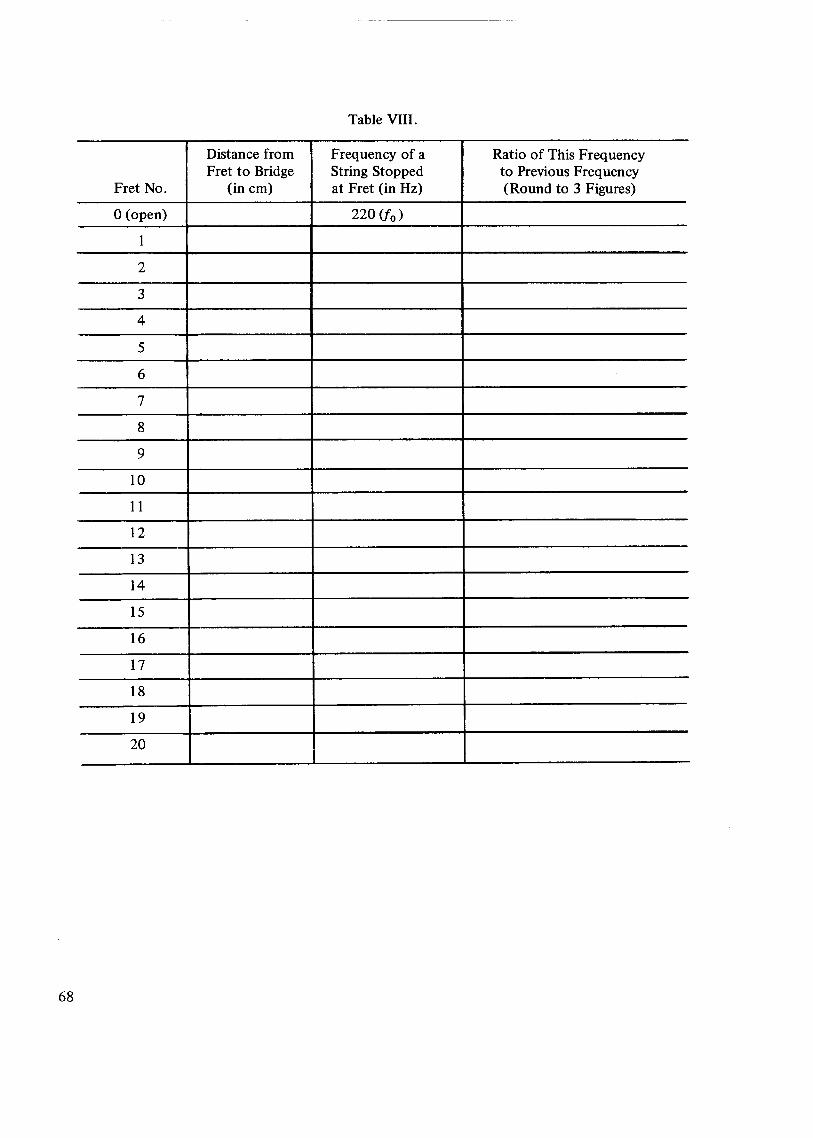
Distance from Frequency of a Ratio of This FrequencyFret to Bridge String Stopped to Previous Frequency
Fret No. (in cm) at Fret (in Hz) (Round to 3 Figures)
o (open) 220 (fo)
1
2
3
4
5
6
7
8
9
10
11
12
13
14
15
16
17
18
19
20
The six different open strings of theguitar produce six different pitches. Thethicker strings produce lower frequenciesbecause their mass per unit length is greater.To tune the guitar to the proper frequencythe tension of the strings is changed by usingthe tuning pegs. Increasing the tension in-creases the pitch. The relative proportions ofthe sound-wave harmonics are determined bythe material of the strings, the natural fre-quencies of the sound board and cavity, andthe method of plucking. These variablesaccount for the differences in sound qualityobtainable.
When playing the guitar, the effectivelengths of the strings are altered by holdingthem down against frets, which changes theirfundamental frequencies.
In this section you have learned a theorythat two wavestraveling in opposite directionscan superimpose to produce standing waves.The condition required for standing wavesonstrings fixed at both ends is
where N is an integer, XN is wavelength, and Lis the length of the string. This equation saysthat if you can fit N half-wavelengths in alength L, you will have standing waves.
Using this theory, we could derive anequation which accounts for the string equa-tion determined empirically in Section B:
t=Kj. !mL
You also learned that mixtures of har-monics are present on a vibrating stringbecause these harmonics must add up to givethe shape of the string at any given time. Thiseffect accounts for the different amplitudesof harmonics for different positions at whicha string is plucked, and for the different waysit is plucked (with thumb or pick).
Each mode of vibration receives a certainamount of energy when a string is plucked,and each mode has its own life history,independent of the others. Some string modesdie out more quickly than others, and sometransmit their energy more readily to the airthrough the bridge and guitar body, but noenergy is exchanged between modes. Eachstring may be thought of as a number ofindependent oscillating systems, each with itsown separate single frequency.
Finally, you learned that harmony wasrelated to ratios of fundamental frequenciesof tones, and that musical scales could beconstructed to produce harmonics. Youfound that the guitar is constructed to pro-duce an equally tempered scale the same as apiano tuned to that note.

Work SheetEXPERIMENT A-I


Work SheetEXPERIMENT A-2


Work SheetEXPERIMENT B-1
Frequency Total Total Mass (kg) VibratingString (Hz) Mass (kg) Length (m) Length (m) Mass (kg)
lowE
A
D
G
B
high E
11-13. 14-15.
Table 2. Table 3.
m= kg L= m T= N miL = kg/m
miL = kg/m
Frequency (Hz) Tension (N)
1 kg
2 kg
3 kg
4kg
5 kg
6kg
Work SheetEXPERIMENT B-2
2. fEE (Hz) = _fAA (Hz) = - _fG (Hz)= _
fB (Hz) = ----fE' (Hz) = ----


Work SheetEXPERIMENT C-l


Work SheetEXPERIMENT C-2
