thematic investing - nyupages.stern.nyu.edu/~ekerschn/pdfs/readingsemk/asian affluence.pdf ·...
TRANSCRIPT
ANALYST CERTIFICATION AND REQUIRED DISCLOSURES BEGIN ON PAGE 21 1
αβ
UBS Investment Research Thematic Investing
Asian Affluence
Favorable demographics, rising incomes Fastest growing age group in Asia is people aged 35-59. Not only are these peak earning years, but Asian incomes are growing rapidly too.
Changing attitudes Demographic trends and rising incomes have significant implications for Asian attitudes. Many Asians today have grown up in an environment where traditional attributes of austerity and frugality have much less significance than they did for prior generations.
Six key changes 1) An urban orientation; 2) An emerging middle class; 3) Spending and saving; 4) Working women; 5) More, and smaller, households; 6) Time off/more travel.
Manufacturers and retailers respond to Asian Affluence Quality Products—Opening of markets to foreign competitors has stimulated Asian companies to improve product quality, often to “world class” levels. "Brand fervency"—Asian consumers are increasingly brand conscious. Formalization of retailing—Increasing urbanization is key to growth of large retailers.
20 June 2003
www.ubs.com/investmentresearch
Edward Kerschner, CFA [email protected]
+1-212-713 2448
Michael Geraghty [email protected]
+1-212-713 2581
Michael Gilmore [email protected]
+65-6836 5912
Ian McLennan [email protected]
+852 2971 6371
James Spence [email protected]
+852 2971 7102
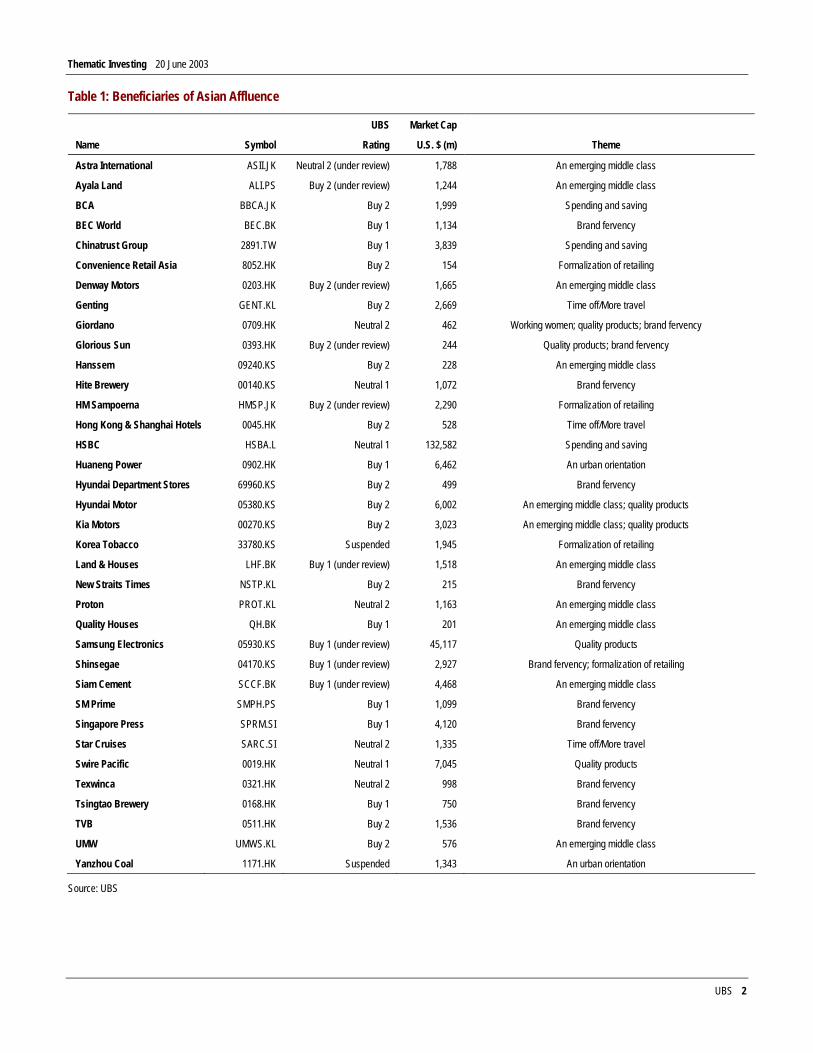
Chart 1: Asian Population Change 2000 – 2010, by Age Group (Millions)
Chart 2: Asian Real Per Capita GDP In U.S. $
-40
-20
0
20
40
60
0- 4
5
- 9
10-1
4
15-1
9
20-2
4
25-2
9
30-3
4
35-3
9
40-4
4
45-4
9
50-5
4
55-5
9
60-6
4
65-6
9
70-7
4
75-7
9
8
0500
1,0001,5002,0002,5003,000
1990 1995 2000 2005 2010
Source: U.S. Census Bureau – International Database Source: Global Insight, Inc
Global Strategy Research Global
-
Investment Strategy
Thematic Investing 20 June 2003
UBS 2
Table 1: Beneficiaries of Asian Affluence
UBS Market Cap
Name Symbol Rating U.S. $ (m) Theme
Astra International ASII.JK Neutral 2 (under review) 1,788 An emerging middle class
Ayala Land ALI.PS Buy 2 (under review) 1,244 An emerging middle class
BCA BBCA.JK Buy 2 1,999 Spending and saving
BEC World BEC.BK Buy 1 1,134 Brand fervency
Chinatrust Group 2891.TW Buy 1 3,839 Spending and saving
Convenience Retail Asia 8052.HK Buy 2 154 Formalization of retailing
Denway Motors 0203.HK Buy 2 (under review) 1,665 An emerging middle class
Genting GENT.KL Buy 2 2,669 Time off/More travel
Giordano 0709.HK Neutral 2 462 Working women; quality products; brand fervency
Glorious Sun 0393.HK Buy 2 (under review) 244 Quality products; brand fervency
Hanssem 09240.KS Buy 2 228 An emerging middle class
Hite Brewery 00140.KS Neutral 1 1,072 Brand fervency
HM Sampoerna HMSP.JK Buy 2 (under review) 2,290 Formalization of retailing
Hong Kong & Shanghai Hotels 0045.HK Buy 2 528 Time off/More travel
HSBC HSBA.L Neutral 1 132,582 Spending and saving
Huaneng Power 0902.HK Buy 1 6,462 An urban orientation
Hyundai Department Stores 69960.KS Buy 2 499 Brand fervency
Hyundai Motor 05380.KS Buy 2 6,002 An emerging middle class; quality products
Kia Motors 00270.KS Buy 2 3,023 An emerging middle class; quality products
Korea Tobacco 33780.KS Suspended 1,945 Formalization of retailing
Land & Houses LHF.BK Buy 1 (under review) 1,518 An emerging middle class
New Straits Times NSTP.KL Buy 2 215 Brand fervency
Proton PROT.KL Neutral 2 1,163 An emerging middle class
Quality Houses QH.BK Buy 1 201 An emerging middle class
Samsung Electronics 05930.KS Buy 1 (under review) 45,117 Quality products
Shinsegae 04170.KS Buy 1 (under review) 2,927 Brand fervency; formalization of retailing
Siam Cement SCCF.BK Buy 1 (under review) 4,468 An emerging middle class
SM Prime SMPH.PS Buy 1 1,099 Brand fervency
Singapore Press SPRM.SI Buy 1 4,120 Brand fervency
Star Cruises SARC.SI Neutral 2 1,335 Time off/More travel
Swire Pacific 0019.HK Neutral 1 7,045 Quality products
Texwinca 0321.HK Neutral 2 998 Brand fervency
Tsingtao Brewery 0168.HK Buy 1 750 Brand fervency
TVB 0511.HK Buy 2 1,536 Brand fervency
UMW UMWS.KL Buy 2 576 An emerging middle class
Yanzhou Coal 1171.HK Suspended 1,343 An urban orientation
Source: UBS
Thematic Investing 20 June 2003
UBS 3
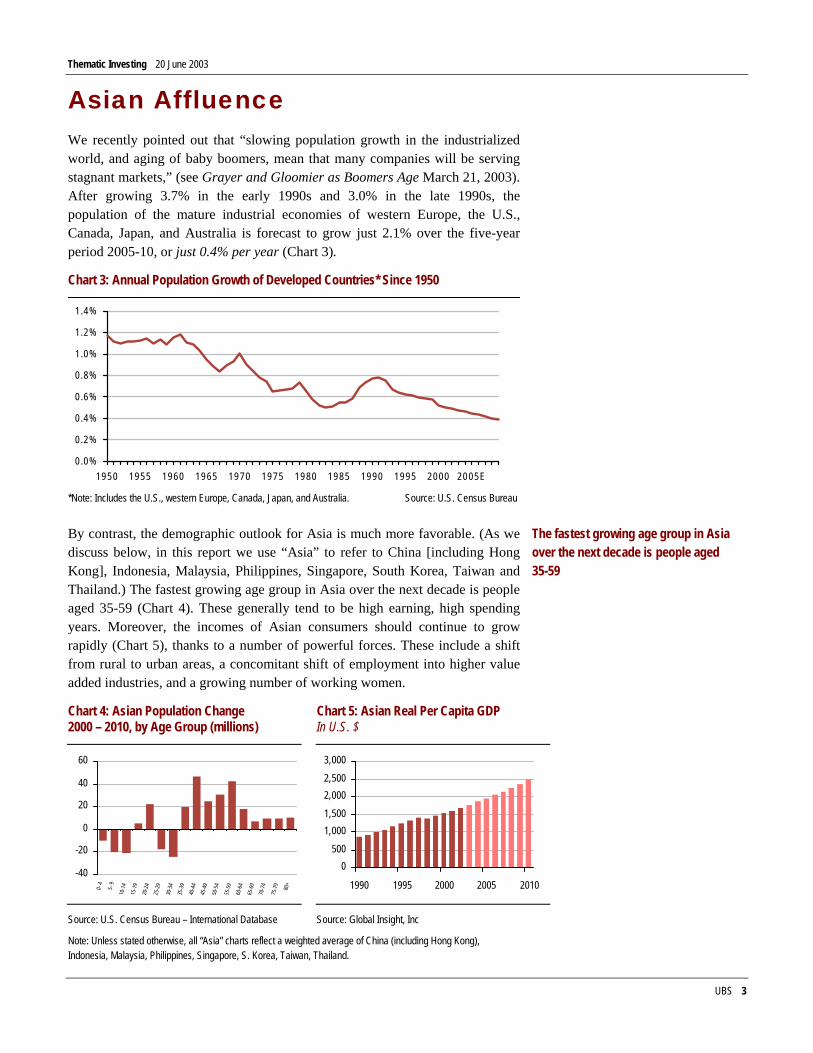
Asian Affluence We recently pointed out that “slowing population growth in the industrialized world, and aging of baby boomers, mean that many companies will be serving stagnant markets,” (see Grayer and Gloomier as Boomers Age March 21, 2003). After growing 3.7% in the early 1990s and 3.0% in the late 1990s, the population of the mature industrial economies of western Europe, the U.S., Canada, Japan, and Australia is forecast to grow just 2.1% over the five-year period 2005-10, or just 0.4% per year (Chart 3).
Chart 3: Annual Population Growth of Developed Countries* Since 1950
0.0%
0.2%
0.4%
0.6%
0.8%
1.0%
1.2%
1.4%
1950 1955 1960 1965 1970 1975 1980 1985 1990 1995 2000 2005E
*Note: Includes the U.S., western Europe, Canada, Japan, and Australia. Source: U.S. Census Bureau
By contrast, the demographic outlook for Asia is much more favorable. (As we discuss below, in this report we use “Asia” to refer to China [including Hong Kong], Indonesia, Malaysia, Philippines, Singapore, South Korea, Taiwan and Thailand.) The fastest growing age group in Asia over the next decade is people aged 35-59 (Chart 4). These generally tend to be high earning, high spending years. Moreover, the incomes of Asian consumers should continue to grow rapidly (Chart 5), thanks to a number of powerful forces. These include a shift from rural to urban areas, a concomitant shift of employment into higher value added industries, and a growing number of working women.
Chart 4: Asian Population Change 2000 – 2010, by Age Group (millions)
Chart 5: Asian Real Per Capita GDP In U.S. $
-40
-20
0
20
40
60
0- 4
5
- 9
10-1
4
15-1
9
20-2
4
25-2
9
30-3
4
35-3
9
40-4
4
45-4
9
50-5
4
55-5
9
60-6
4
65-6
9
70-7
4
75-7
9
80+
0500
1,0001,5002,0002,5003,000
1990 1995 2000 2005 2010
Source: U.S. Census Bureau – International Database Source: Global Insight, Inc
Note: Unless stated otherwise, all “Asia” charts reflect a weighted average of China (including Hong Kong), Indonesia, Malaysia, Philippines, Singapore, S. Korea, Taiwan, Thailand.
The fastest growing age group in Asia over the next decade is people aged 35-59
Thematic Investing 20 June 2003
UBS 4
Although these trends are driving growth in most segments of the Asian consumer sector, they are also spurring the emergence of a new consumer segment—the “mass affluent.” While the emergence of this mass affluent segment is partly a result of favorable demographics and rising incomes, lifestyle and behavioral changes are also playing a key role. Specifically, many Asians today have grown up in an environment where the traditional attributes of austerity and frugality have much less significance than they did for prior generations.
Note that we are focusing on the eight Asian countries listed above, because they each share the attractive characteristics of favorable demographics and rising per capita GDP. We are excluding Japan because of that country’s unfavorable demographics and difficult economic environment. And while India and Pakistan are technically part of Asia, we are excluding those countries because many of the forces driving Asian Affluence (e.g. a shift to higher value added industries, a growing number of working women) are not as prevalent in those countries.
It’s important, however, to acknowledge two key factors:
ν The eight countries we focus on are not at the same stage of urbanization or economic development.
ν The countries also have different cultural characteristics.
That said, as we discuss below, there are several trends that generally hold true across the region, so that it is plausible to discuss the broad theme of Asian Affluence.
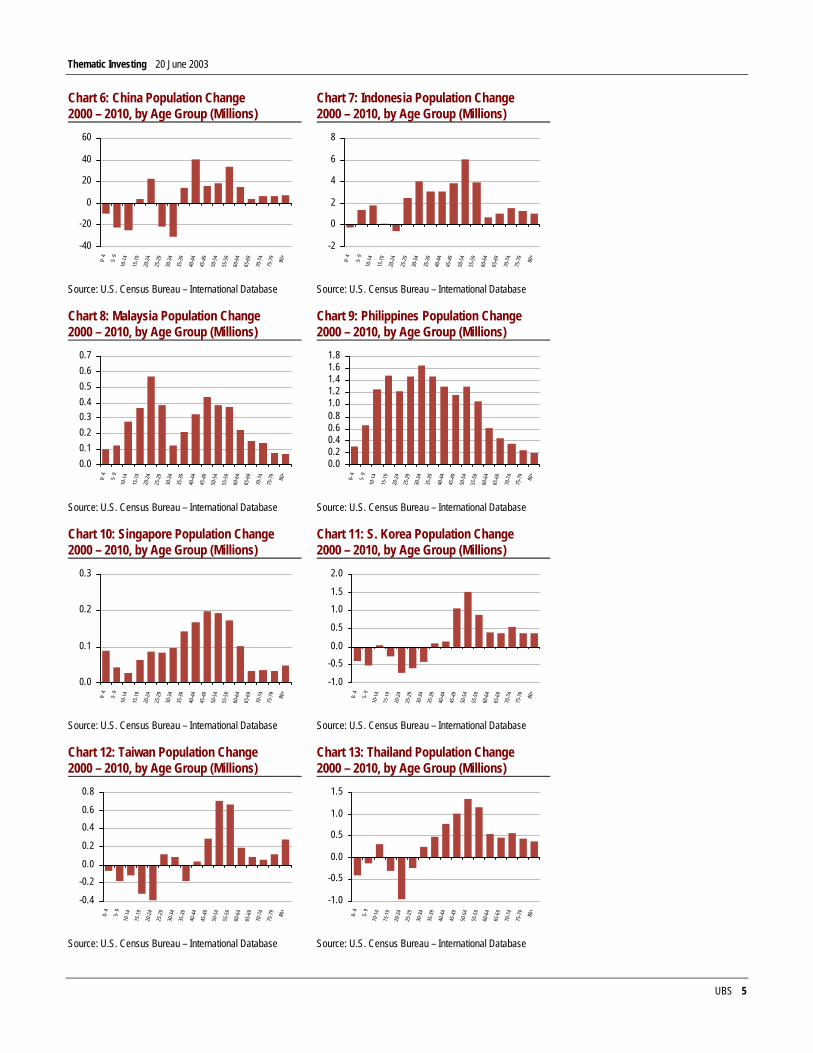
Favorable Demographics, Rising Incomes The region made up of these eight Asian countries likely has the best demographic profile in the world today. As Chart 4 illustrates, the fastest growing age group in Asia over the next decade is people in the highly productive 35-59 age group. Importantly, Chart 6 through Chart 13 illustrate that this age group is growing rapidly in most countries in the region, so that it is not just the most populous country (i.e., China) that is driving these demographic trends.
Lifestyle and behavioral changes are playing a key role in the emergence of a mass affluent segment
Thematic Investing 20 June 2003
UBS 5
Chart 6: China Population Change 2000 – 2010, by Age Group (Millions)
Chart 7: Indonesia Population Change 2000 – 2010, by Age Group (Millions)
-40
-20
0
20
40
60
0- 4
5
- 9
10-1
4
15-1
9
20-2
4
25-2
9
30-3
4
35-3
9
40-4
4
45-4
9
50-5
4
55-5
9
60-6
4
65-6
9
70-7
4
75-7
9
80+
-2
0
2
4
6
8
0- 4
5
- 9
10-1
4
15-1
9
20-2
4
25-2
9
30-3
4
35-3
9
40-4
4
45-4
9
50-5
4
55-5
9
60-6
4
65-6
9
70-7
4
75-7
9
80+
Source: U.S. Census Bureau – International Database Source: U.S. Census Bureau – International Database
Chart 8: Malaysia Population Change 2000 – 2010, by Age Group (Millions)
Chart 9: Philippines Population Change 2000 – 2010, by Age Group (Millions)
0.00.10.20.30.40.50.60.7
0- 4
5
- 9
10-1
4
15-1
9
20-2
4
25-2
9
30-3
4
35-3
9
40-4
4
45-4
9
50-5
4
55-5
9
60-6
4
65-6
9
70-7
4
75-7
9
80+
0.00.20.40.60.81.01.21.41.61.8
0- 4
5
- 9
10-1
4
15-1
9
20-2
4
25-2
9
30-3
4
35-3
9
40-4
4
45-4
9
50-5
4
55-5
9
60-6
4
65-6
9
70-7
4
75-7
9
80+
Source: U.S. Census Bureau – International Database Source: U.S. Census Bureau – International Database
Chart 10: Singapore Population Change 2000 – 2010, by Age Group (Millions)
Chart 11: S. Korea Population Change 2000 – 2010, by Age Group (Millions)
0.0
0.1
0.2
0.3
0- 4
5
- 9
10-1
4
15-1
9
20-2
4
25-2
9
30-3
4
35-3
9
40-4
4
45-4
9
50-5
4
55-5
9
60-6
4
65-6
9
70-7
4
75-7
9
80+
-1.0
-0.50.0
0.5
1.01.5
2.0
0- 4
5
- 9
10-1
4
15-1
9
20-2
4
25-2
9
30-3
4
35-3
9
40-4
4
45-4
9
50-5
4
55-5
9
60-6
4
65-6
9
70-7
4
75-7
9
80+
Source: U.S. Census Bureau – International Database Source: U.S. Census Bureau – International Database
Chart 12: Taiwan Population Change 2000 – 2010, by Age Group (Millions)
Chart 13: Thailand Population Change 2000 – 2010, by Age Group (Millions)
-0.4
-0.20.0
0.2
0.40.6
0.8
0- 4
5
- 9
10-1
4
15-1
9
20-2
4
25-2
9
30-3
4
35-3
9
40-4
4
45-4
9
50-5
4
55-5
9
60-6
4
65-6
9
70-7
4
75-7
9
80+
-1.0
-0.5
0.0
0.5
1.0
1.5
0- 4
5
- 9
10-1
4
15-1
9
20-2
4
25-2
9
30-3
4
35-3
9
40-4
4
45-4
9
50-5
4
55-5
9
60-6
4
65-6
9
70-7
4
75-7
9
80+
Source: U.S. Census Bureau – International Database Source: U.S. Census Bureau – International Database
Thematic Investing 20 June 2003
UBS 6
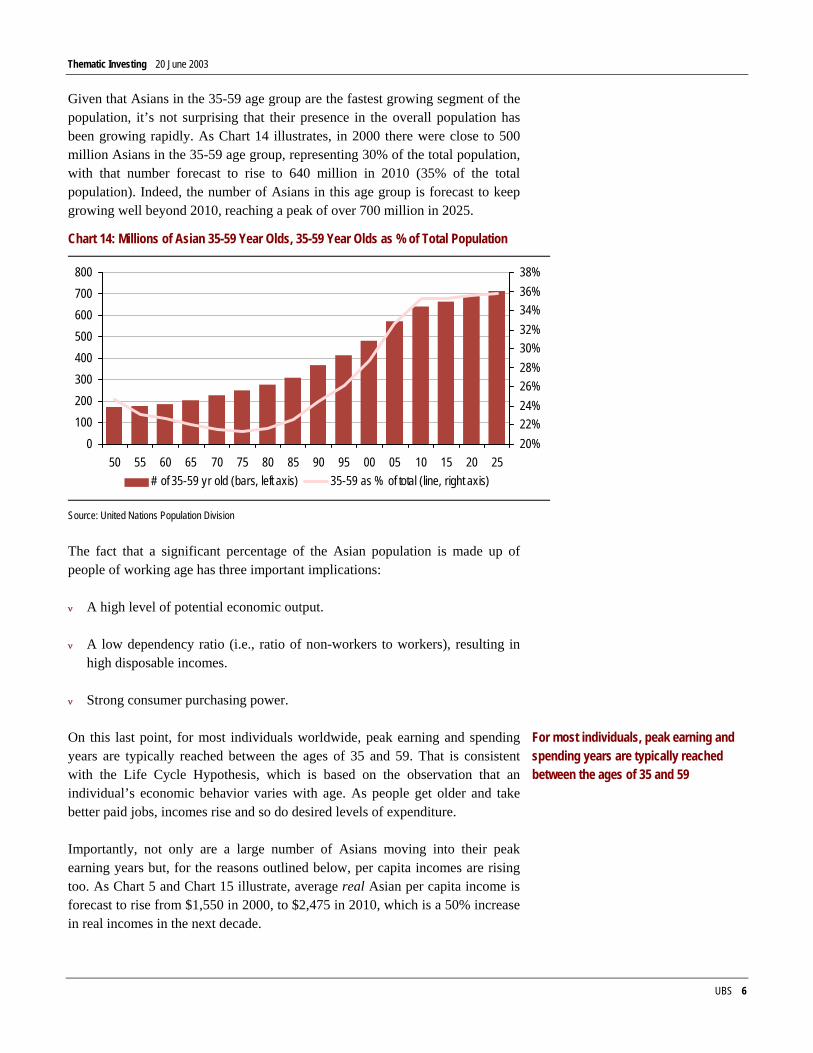
Given that Asians in the 35-59 age group are the fastest growing segment of the population, it’s not surprising that their presence in the overall population has been growing rapidly. As Chart 14 illustrates, in 2000 there were close to 500 million Asians in the 35-59 age group, representing 30% of the total population, with that number forecast to rise to 640 million in 2010 (35% of the total population). Indeed, the number of Asians in this age group is forecast to keep growing well beyond 2010, reaching a peak of over 700 million in 2025.
Chart 14: Millions of Asian 35-59 Year Olds, 35-59 Year Olds as % of Total Population
0100200300400500600700800
50 55 60 65 70 75 80 85 90 95 00 05 10 15 20 2520%22%24%26%28%30%32%34%36%38%
# of 35-59 yr old (bars, left axis) 35-59 as % of total (line, right axis)
Source: United Nations Population Division
The fact that a significant percentage of the Asian population is made up of people of working age has three important implications:
ν A high level of potential economic output.
ν A low dependency ratio (i.e., ratio of non-workers to workers), resulting in high disposable incomes.
ν Strong consumer purchasing power.
On this last point, for most individuals worldwide, peak earning and spending years are typically reached between the ages of 35 and 59. That is consistent with the Life Cycle Hypothesis, which is based on the observation that an individual’s economic behavior varies with age. As people get older and take better paid jobs, incomes rise and so do desired levels of expenditure.
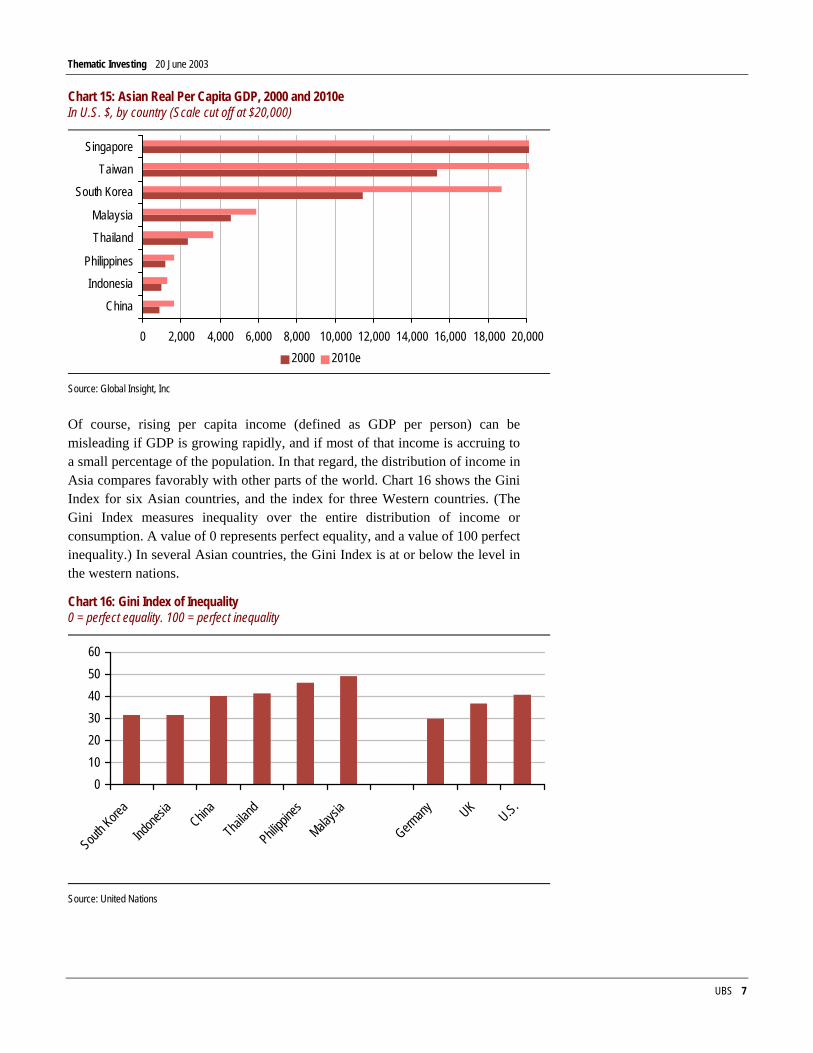
Importantly, not only are a large number of Asians moving into their peak earning years but, for the reasons outlined below, per capita incomes are rising too. As Chart 5 and Chart 15 illustrate, average real Asian per capita income is forecast to rise from $1,550 in 2000, to $2,475 in 2010, which is a 50% increase in real incomes in the next decade.
For most individuals, peak earning and spending years are typically reached between the ages of 35 and 59
Thematic Investing 20 June 2003
UBS 7
Chart 15: Asian Real Per Capita GDP, 2000 and 2010e In U.S. $, by country (Scale cut off at $20,000)
0 2,000 4,000 6,000 8,000 10,000 12,000 14,000 16,000 18,000 20,000
China
Indonesia
Philippines
Thailand
Malaysia
South Korea
Taiwan
Singapore
2000 2010e
Source: Global Insight, Inc
Of course, rising per capita income (defined as GDP per person) can be misleading if GDP is growing rapidly, and if most of that income is accruing to a small percentage of the population. In that regard, the distribution of income in Asia compares favorably with other parts of the world. Chart 16 shows the Gini Index for six Asian countries, and the index for three Western countries. (The Gini Index measures inequality over the entire distribution of income or consumption. A value of 0 represents perfect equality, and a value of 100 perfect inequality.) In several Asian countries, the Gini Index is at or below the level in the western nations.
Chart 16: Gini Index of Inequality 0 = perfect equality. 100 = perfect inequality
0102030405060
South K
orea
Indone
siaChin
a
Thailan
d
Philippi
nes
Malaysi
a
Germany UK
U.S.
Source: United Nations
Thematic Investing 20 June 2003
UBS 8
A Post Crisis Rebound in Income Growth As Chart 14 illustrates, the economically important 35-59 age group has been growing steadily as a percentage of the total population since the 1990s. What’s significant today is that over the next decade the number of Asians in that economically important age group will reach one-in-three of the total population at the same time that per capita incomes continue to grow rapidly.
Not surprisingly, the Asian economic crisis of 1997-98 took a toll on Asian incomes, with average real per capita income dropping from $1,395 in 1997 to $1,380 in 1998 (Chart 5). Since the end of the crisis, however, income growth has rebounded strongly thanks, in large part, to four key factors.
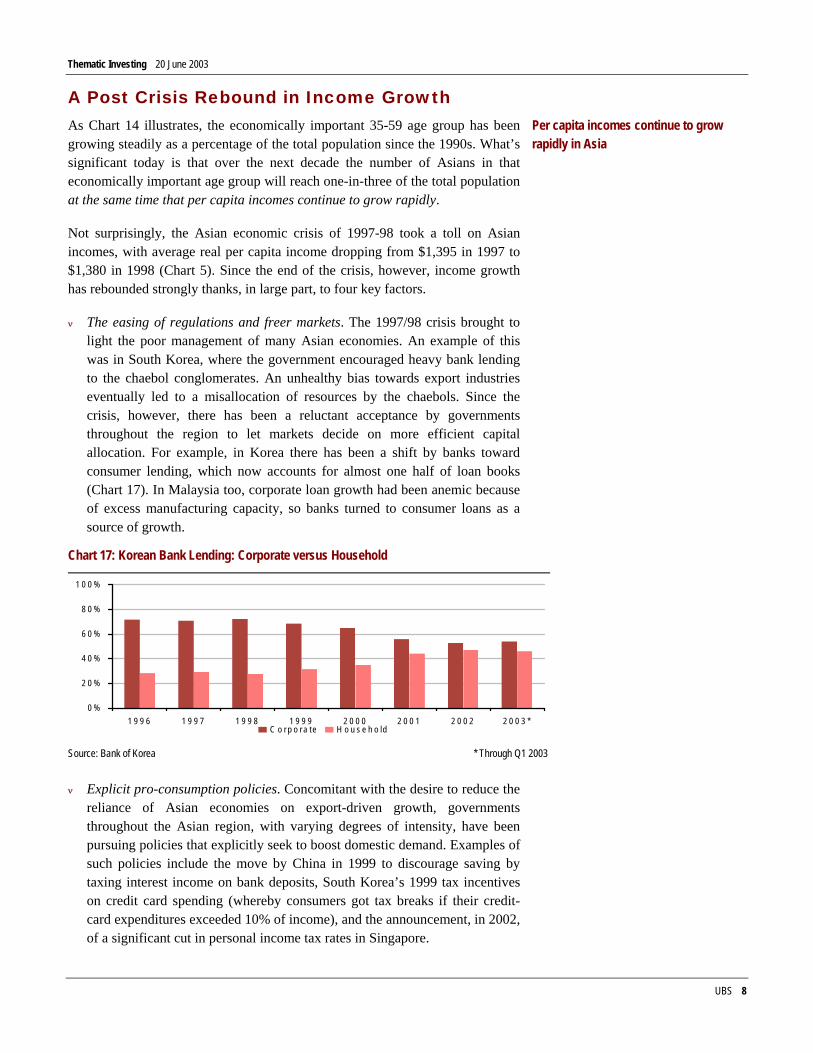
ν The easing of regulations and freer markets. The 1997/98 crisis brought to light the poor management of many Asian economies. An example of this was in South Korea, where the government encouraged heavy bank lending to the chaebol conglomerates. An unhealthy bias towards export industries eventually led to a misallocation of resources by the chaebols. Since the crisis, however, there has been a reluctant acceptance by governments throughout the region to let markets decide on more efficient capital allocation. For example, in Korea there has been a shift by banks toward consumer lending, which now accounts for almost one half of loan books (Chart 17). In Malaysia too, corporate loan growth had been anemic because of excess manufacturing capacity, so banks turned to consumer loans as a source of growth.
Chart 17: Korean Bank Lending: Corporate versus Household
0 %
2 0 %
4 0 %
6 0 %
8 0 %
1 0 0 %
1 9 9 6 1 9 9 7 1 9 9 8 1 9 9 9 2 0 0 0 2 0 0 1 2 0 0 2 2 0 0 3 *C o r p o r a te H o u s e h o ld
Source: Bank of Korea * Through Q1 2003
ν Explicit pro-consumption policies. Concomitant with the desire to reduce the reliance of Asian economies on export-driven growth, governments throughout the Asian region, with varying degrees of intensity, have been pursuing policies that explicitly seek to boost domestic demand. Examples of such policies include the move by China in 1999 to discourage saving by taxing interest income on bank deposits, South Korea’s 1999 tax incentives on credit card spending (whereby consumers got tax breaks if their credit-card expenditures exceeded 10% of income), and the announcement, in 2002, of a significant cut in personal income tax rates in Singapore.
Per capita incomes continue to grow rapidly in Asia
Thematic Investing 20 June 2003
UBS 9
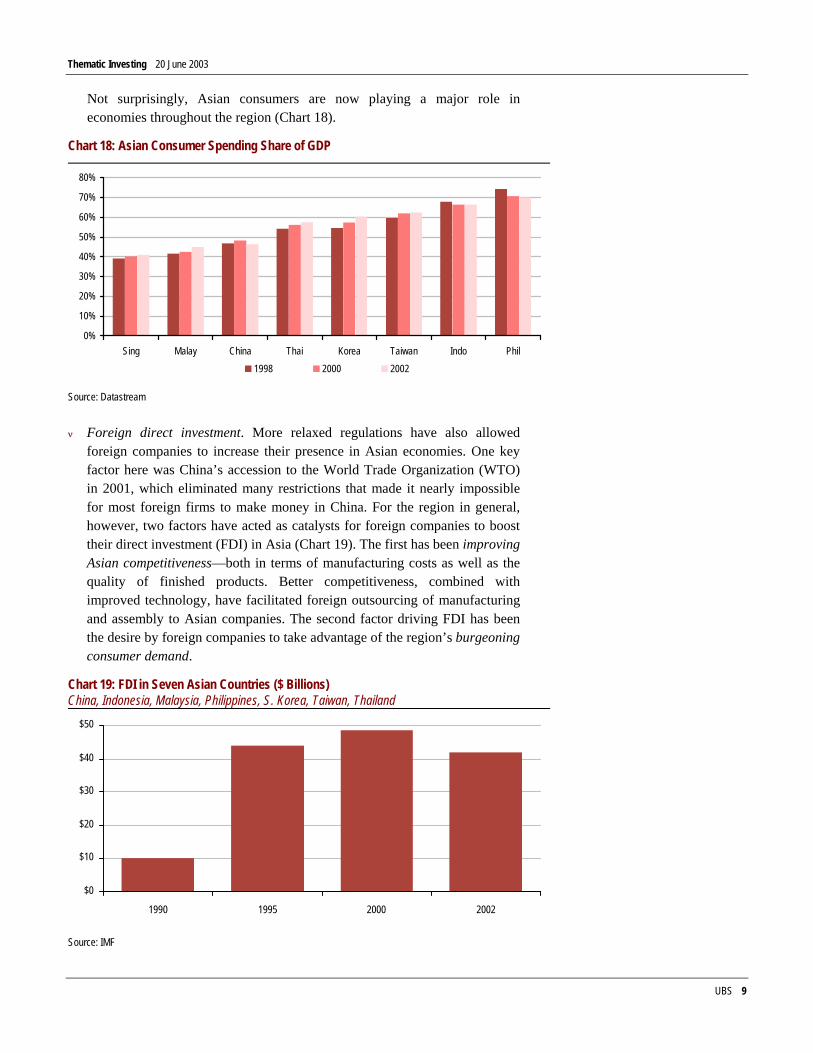
Not surprisingly, Asian consumers are now playing a major role in economies throughout the region (Chart 18).
Chart 18: Asian Consumer Spending Share of GDP
0%
10%
20%
30%
40%
50%
60%
70%
80%
Sing Malay China Thai Korea Taiwan Indo Phil1998 2000 2002
Source: Datastream
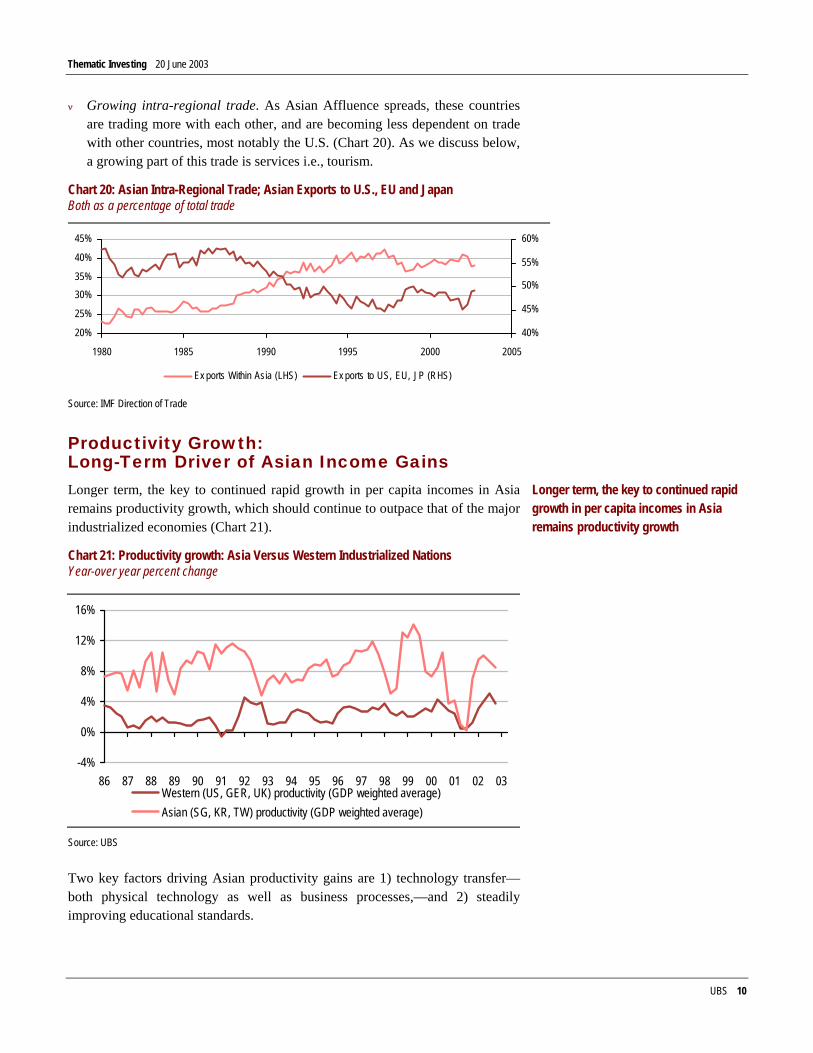
ν Foreign direct investment. More relaxed regulations have also allowed foreign companies to increase their presence in Asian economies. One key factor here was China’s accession to the World Trade Organization (WTO) in 2001, which eliminated many restrictions that made it nearly impossible for most foreign firms to make money in China. For the region in general, however, two factors have acted as catalysts for foreign companies to boost their direct investment (FDI) in Asia (Chart 19). The first has been improving Asian competitiveness—both in terms of manufacturing costs as well as the quality of finished products. Better competitiveness, combined with improved technology, have facilitated foreign outsourcing of manufacturing and assembly to Asian companies. The second factor driving FDI has been the desire by foreign companies to take advantage of the region’s burgeoning consumer demand.
Chart 19: FDI in Seven Asian Countries ($ Billions) China, Indonesia, Malaysia, Philippines, S. Korea, Taiwan, Thailand
$0
$10
$20
$30
$40
$50
1990 1995 2000 2002
Source: IMF
Thematic Investing 20 June 2003
UBS 10
ν Growing intra-regional trade. As Asian Affluence spreads, these countries are trading more with each other, and are becoming less dependent on trade with other countries, most notably the U.S. (Chart 20). As we discuss below, a growing part of this trade is services i.e., tourism.
Chart 20: Asian Intra-Regional Trade; Asian Exports to U.S., EU and Japan Both as a percentage of total trade
20%
25%
30%35%
40%
45%
1980 1985 1990 1995 2000 2005
40%
45%
50%
55%
60%
Ex ports Within Asia (LHS) Ex ports to US, EU, JP (RHS)
Source: IMF Direction of Trade
Productivity Growth: Long-Term Driver of Asian Income Gains Longer term, the key to continued rapid growth in per capita incomes in Asia remains productivity growth, which should continue to outpace that of the major industrialized economies (Chart 21).
Chart 21: Productivity growth: Asia Versus Western Industrialized Nations Year-over year percent change
-4%
0%
4%
8%
12%
16%
86 87 88 89 90 91 92 93 94 95 96 97 98 99 00 01 02 03Western (US, GER, UK) productivity (GDP weighted average)Asian (SG, KR, TW) productivity (GDP weighted average)
Source: UBS
Two key factors driving Asian productivity gains are 1) technology transfer—both physical technology as well as business processes,—and 2) steadily improving educational standards.
Longer term, the key to continued rapid growth in per capita incomes in Asia remains productivity growth
Thematic Investing 20 June 2003
UBS 11
Technology Transfer While the risks of early adoption of new technologies tend to be taken by richer countries, Asian economies are typically slow to embrace new technologies. Once they do, however, adoption rates are typically high relative to prevailing income and productivity levels.
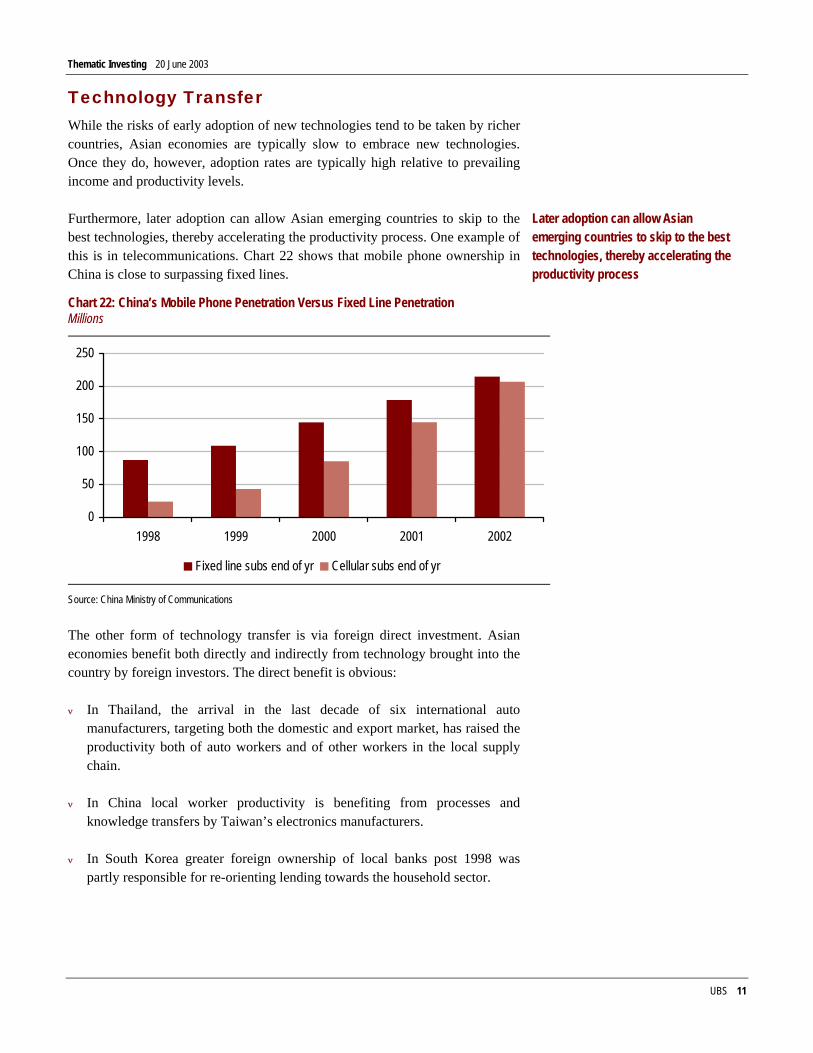
Furthermore, later adoption can allow Asian emerging countries to skip to the best technologies, thereby accelerating the productivity process. One example of this is in telecommunications. Chart 22 shows that mobile phone ownership in China is close to surpassing fixed lines.
Chart 22: China’s Mobile Phone Penetration Versus Fixed Line Penetration Millions
0
50
100
150
200
250
1998 1999 2000 2001 2002
Fixed line subs end of yr Cellular subs end of yr
Source: China Ministry of Communications
The other form of technology transfer is via foreign direct investment. Asian economies benefit both directly and indirectly from technology brought into the country by foreign investors. The direct benefit is obvious:
ν In Thailand, the arrival in the last decade of six international auto manufacturers, targeting both the domestic and export market, has raised the productivity both of auto workers and of other workers in the local supply chain.
ν In China local worker productivity is benefiting from processes and knowledge transfers by Taiwan’s electronics manufacturers.
ν In South Korea greater foreign ownership of local banks post 1998 was partly responsible for re-orienting lending towards the household sector.
Later adoption can allow Asian emerging countries to skip to the best technologies, thereby accelerating the productivity process
Thematic Investing 20 June 2003
UBS 12
Indirect benefits from foreign investment can come via competitive pressures. Thus, the entry of foreign retailers—such as Wal-Mart, Carrefour and Tesco—into several Asian markets has forced local competitors such as Big C, Shinsegae, and Park N Shop to raise the standards of their operations. (We discuss the “formalization of retailing” in Asia at length later in this report.)
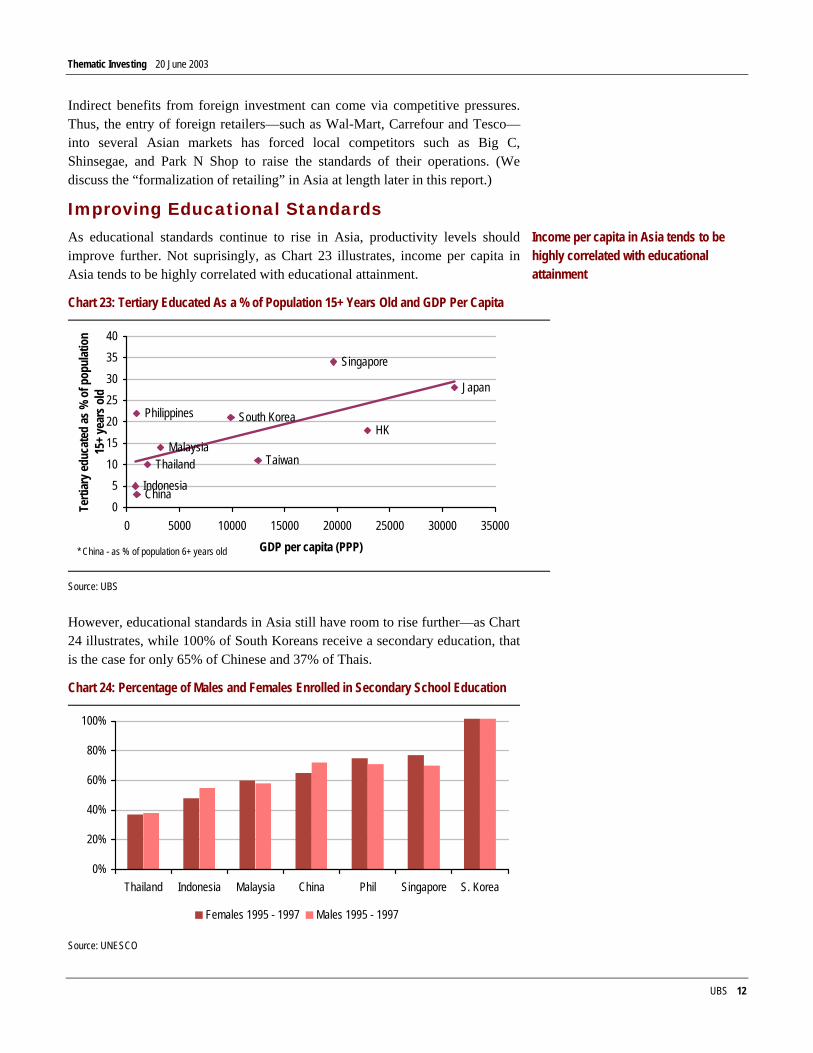
Improving Educational Standards As educational standards continue to rise in Asia, productivity levels should improve further. Not suprisingly, as Chart 23 illustrates, income per capita in Asia tends to be highly correlated with educational attainment.
Chart 23: Tertiary Educated As a % of Population 15+ Years Old and GDP Per Capita
China
HK
Indonesia
Malaysia
Philippines
Singapore
South Korea
TaiwanThailand
Japan
05
10152025303540
0 5000 10000 15000 20000 25000 30000 35000GDP per capita (PPP)
Terti
ary e
duca
ted
as %
of p
opul
atio
n 15
+ ye
ars o
ld
* China - as % of population 6+ years old
Source: UBS
However, educational standards in Asia still have room to rise further—as Chart 24 illustrates, while 100% of South Koreans receive a secondary education, that is the case for only 65% of Chinese and 37% of Thais.
Chart 24: Percentage of Males and Females Enrolled in Secondary School Education
0%
20%
40%
60%
80%
100%
Thailand Indonesia Malaysia China Phil Singapore S. Korea
Females 1995 - 1997 Males 1995 - 1997
Source: UNESCO
Income per capita in Asia tends to be highly correlated with educational attainment
Thematic Investing 20 June 2003
UBS 13
Changing Asian Attitudes As we noted above, while the emergence of a mass affluent segment of Asian consumers is partly the result of favorable demographics and rising incomes, attitudinal changes are also playing a key role. Specifically, the oldest members of the 35-59 age group in Asia were born just before the end of the second World War, while the youngest members of this group were born just as the Vietnam war was getting underway (and well after the Korean war ended). So most of the people in this age group have no memory of the key events that influenced an older generation of Asians.
That older generation, which lived most of their lives in an environment of uncertainty and austerity, is steadily becoming less important, particularly in the important realm of politics. The obvious example of this is China where, in 2002, the 76 year-old President Jiang Zemin handed over the leadership reins to a younger generation, many of whom are in their 50s. This is the so-called “fourth generation” of leaders (after Chairman Mao, Deng Xiaoping and Jiang Zemin).
Consequently, many young Asians today have grown up in an environment where the traditional Asian attributes of austerity, frugality, and saving have much less significance than they did for prior generations. As Chart 5 illustrates, despite the severe economic impact of the 1997-98 crisis, Asian incomes and living standards rose steadily for most of the 1990s (as well as the 1980s). The attitudinal changes associated with rising incomes and a healthy economic environment are manifesting themselves in a number of different ways, and are creating a wide-range of opportunities for companies to benefit from the emerging mass affluent segment.
As part of this most recent research, UBS utilized the expertise of Yankelovich, which has been conducting comprehensive surveys about consumers’ preferences, habits, and lifestyles for over 30 years. Yankelovich's Asian data are collected under the supervision of NFO Trendbox B.V., a part of NFO Worldgroup, one of the most respected names in consumer research, and a subsidiary of The Interpublic Group.
The most recent data reflect surveys conducted during the fourth quarter of 2001 and the fourth quarter of 2002 among over 15,000 Asian consumers primarily based in urban areas of the eight countries listed at the start of this report. Major findings are discussed throughout the report.
Many young Asians today have grown up in an environment where the traditional Asian attributes of austerity, frugality, and saving have much less significance than they did for prior generations
The most recent data reflect surveys of over 15,000 Asian consumers
Thematic Investing 20 June 2003
UBS 14
Our research into Asian Affluence has uncovered six key themes, which we discuss in detail below:
ν An urban orientation
ν An emerging middle class
ν Spending and saving
ν Working women
ν More, and smaller, households
ν Time off/more travel
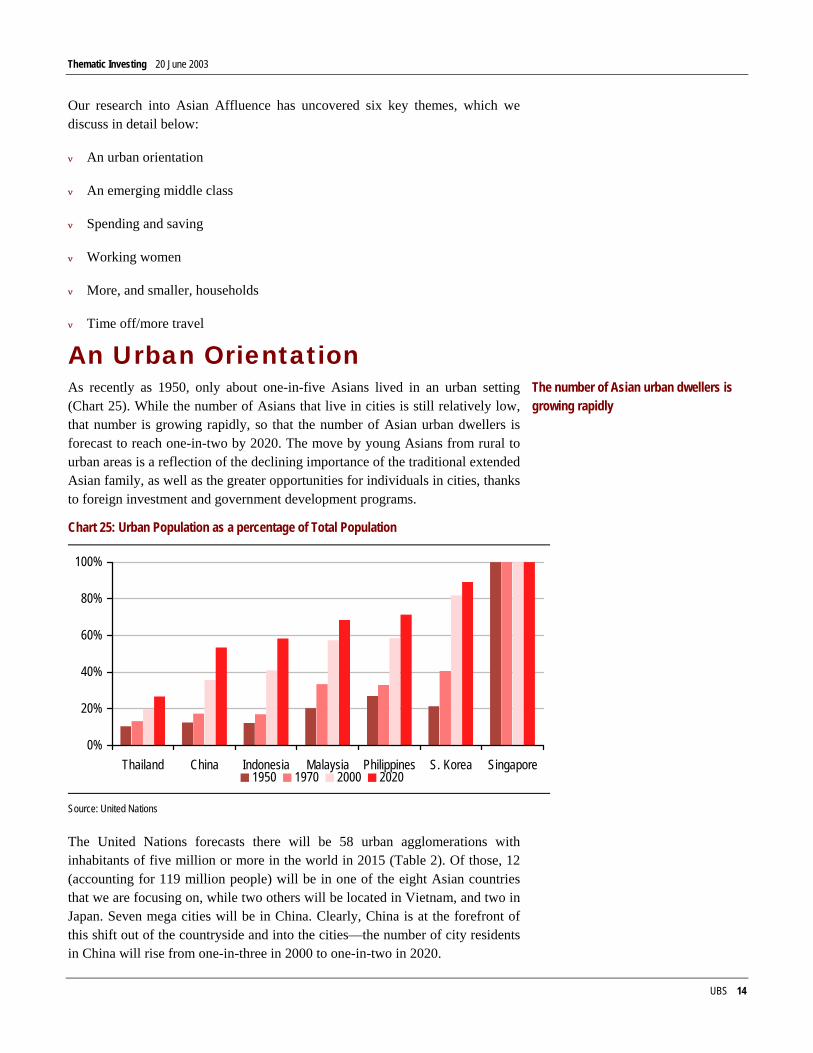
An Urban Orientation As recently as 1950, only about one-in-five Asians lived in an urban setting (Chart 25). While the number of Asians that live in cities is still relatively low, that number is growing rapidly, so that the number of Asian urban dwellers is forecast to reach one-in-two by 2020. The move by young Asians from rural to urban areas is a reflection of the declining importance of the traditional extended Asian family, as well as the greater opportunities for individuals in cities, thanks to foreign investment and government development programs.
Chart 25: Urban Population as a percentage of Total Population
0%
20%
40%
60%
80%
100%
Thailand China Indonesia Malaysia Philippines S. Korea Singapore1950 1970 2000 2020
Source: United Nations
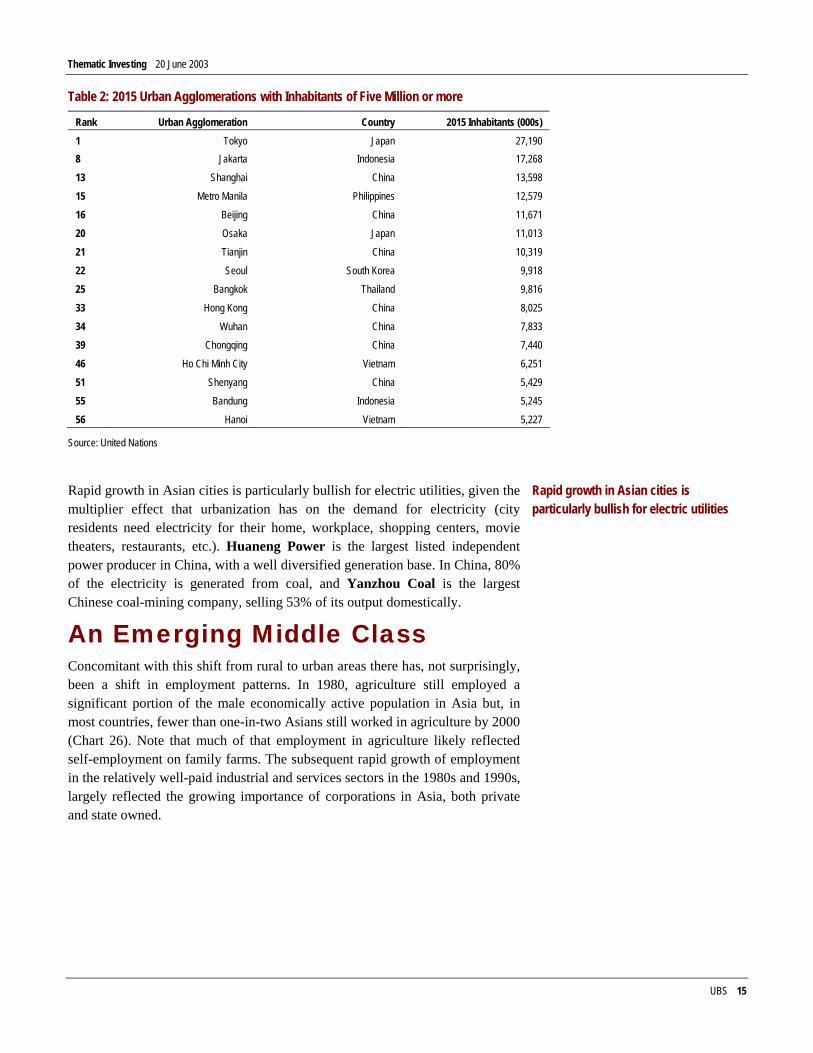
The United Nations forecasts there will be 58 urban agglomerations with inhabitants of five million or more in the world in 2015 (Table 2). Of those, 12 (accounting for 119 million people) will be in one of the eight Asian countries that we are focusing on, while two others will be located in Vietnam, and two in Japan. Seven mega cities will be in China. Clearly, China is at the forefront of this shift out of the countryside and into the cities—the number of city residents in China will rise from one-in-three in 2000 to one-in-two in 2020.
The number of Asian urban dwellers is growing rapidly
Thematic Investing 20 June 2003
UBS 15
Table 2: 2015 Urban Agglomerations with Inhabitants of Five Million or more
Rank Urban Agglomeration Country 2015 Inhabitants (000s) 1 Tokyo Japan 27,190 8 Jakarta Indonesia 17,268
13 Shanghai China 13,598
15 Metro Manila Philippines 12,579
16 Beijing China 11,671
20 Osaka Japan 11,013
21 Tianjin China 10,319
22 Seoul South Korea 9,918
25 Bangkok Thailand 9,816
33 Hong Kong China 8,025
34 Wuhan China 7,833
39 Chongqing China 7,440
46 Ho Chi Minh City Vietnam 6,251
51 Shenyang China 5,429
55 Bandung Indonesia 5,245
56 Hanoi Vietnam 5,227
Source: United Nations
Rapid growth in Asian cities is particularly bullish for electric utilities, given the multiplier effect that urbanization has on the demand for electricity (city residents need electricity for their home, workplace, shopping centers, movie theaters, restaurants, etc.). Huaneng Power is the largest listed independent power producer in China, with a well diversified generation base. In China, 80% of the electricity is generated from coal, and Yanzhou Coal is the largest Chinese coal-mining company, selling 53% of its output domestically.
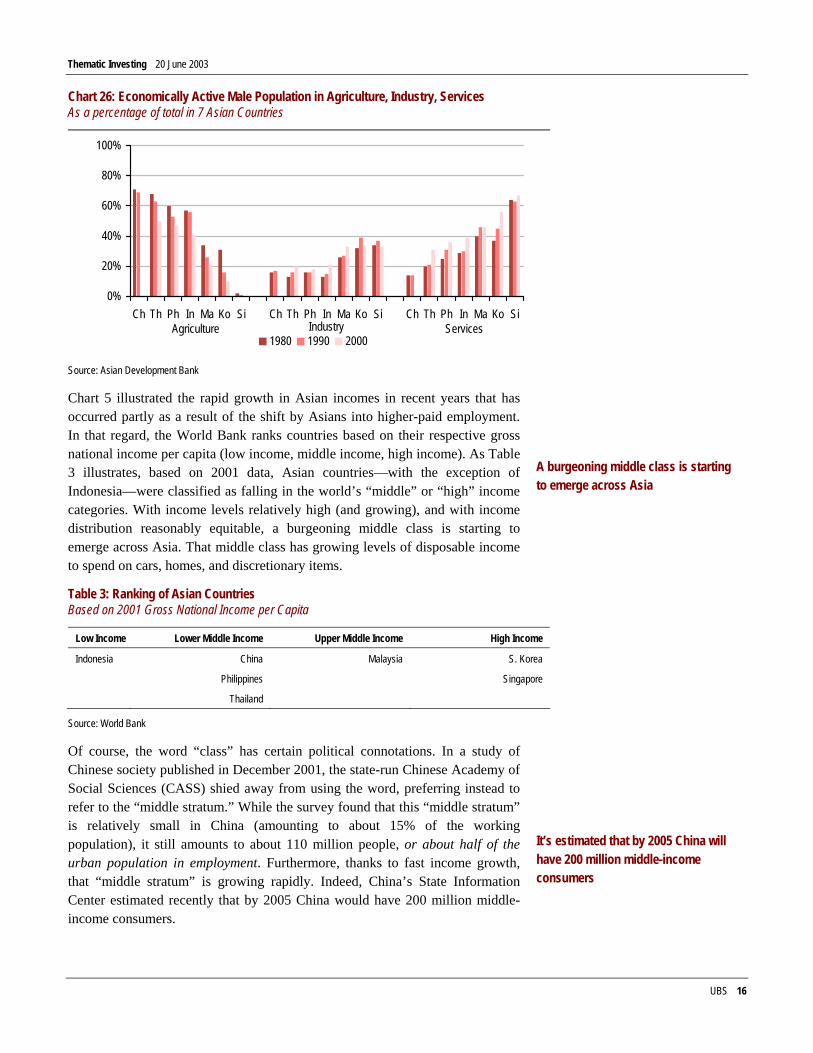
An Emerging Middle Class Concomitant with this shift from rural to urban areas there has, not surprisingly, been a shift in employment patterns. In 1980, agriculture still employed a significant portion of the male economically active population in Asia but, in most countries, fewer than one-in-two Asians still worked in agriculture by 2000 (Chart 26). Note that much of that employment in agriculture likely reflected self-employment on family farms. The subsequent rapid growth of employment in the relatively well-paid industrial and services sectors in the 1980s and 1990s, largely reflected the growing importance of corporations in Asia, both private and state owned.
Rapid growth in Asian cities is particularly bullish for electric utilities
Thematic Investing 20 June 2003
UBS 16
Chart 26: Economically Active Male Population in Agriculture, Industry, Services As a percentage of total in 7 Asian Countries
0%
20%
40%
60%
80%
100%
Ch Th Ph In Ma Ko Si Ch Th Ph In Ma Ko Si Ch Th Ph In Ma Ko Si
1980 1990 2000Agriculture Industry Services
Source: Asian Development Bank
Chart 5 illustrated the rapid growth in Asian incomes in recent years that has occurred partly as a result of the shift by Asians into higher-paid employment. In that regard, the World Bank ranks countries based on their respective gross national income per capita (low income, middle income, high income). As Table 3 illustrates, based on 2001 data, Asian countries—with the exception of Indonesia—were classified as falling in the world’s “middle” or “high” income categories. With income levels relatively high (and growing), and with income distribution reasonably equitable, a burgeoning middle class is starting to emerge across Asia. That middle class has growing levels of disposable income to spend on cars, homes, and discretionary items.
Table 3: Ranking of Asian Countries Based on 2001 Gross National Income per Capita
Low Income Lower Middle Income Upper Middle Income High Income
Indonesia China Malaysia S. Korea
Philippines Singapore
Thailand
Source: World Bank
Of course, the word “class” has certain political connotations. In a study of Chinese society published in December 2001, the state-run Chinese Academy of Social Sciences (CASS) shied away from using the word, preferring instead to refer to the “middle stratum.” While the survey found that this “middle stratum” is relatively small in China (amounting to about 15% of the working population), it still amounts to about 110 million people, or about half of the urban population in employment. Furthermore, thanks to fast income growth, that “middle stratum” is growing rapidly. Indeed, China’s State Information Center estimated recently that by 2005 China would have 200 million middle-income consumers.
A burgeoning middle class is starting to emerge across Asia
It’s estimated that by 2005 China will have 200 million middle-income consumers
Thematic Investing 20 June 2003
UBS 17
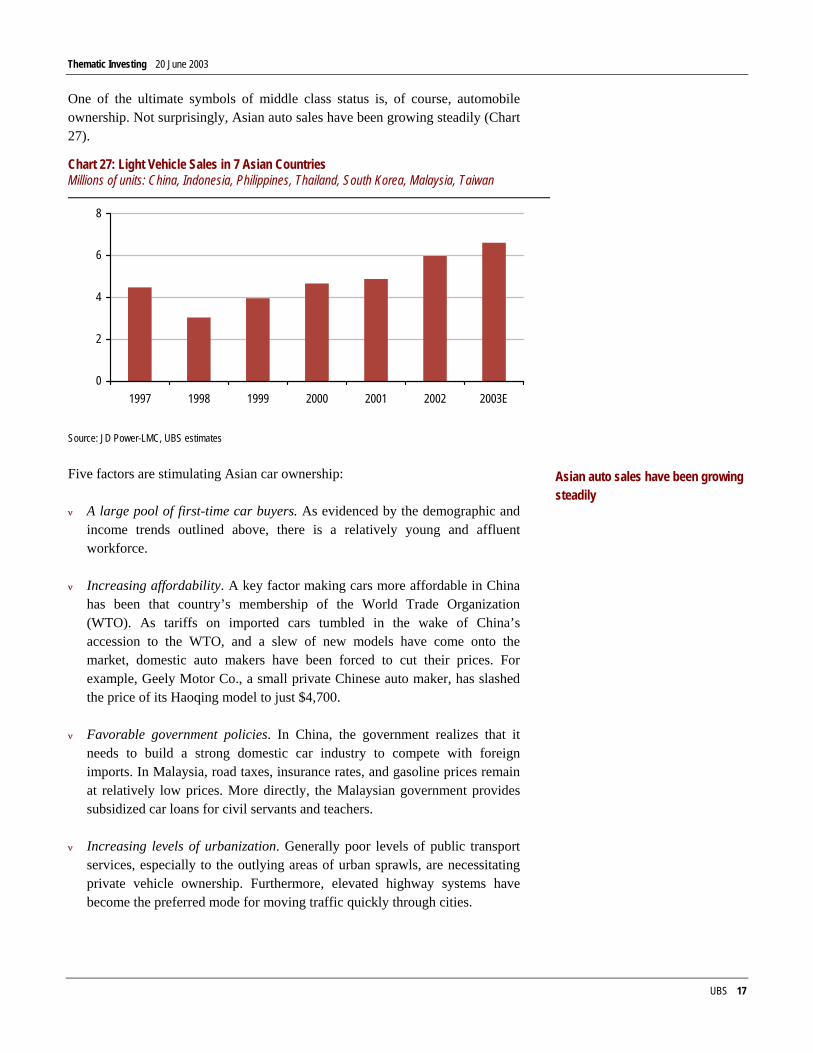
One of the ultimate symbols of middle class status is, of course, automobile ownership. Not surprisingly, Asian auto sales have been growing steadily (Chart 27).
Chart 27: Light Vehicle Sales in 7 Asian Countries Millions of units: China, Indonesia, Philippines, Thailand, South Korea, Malaysia, Taiwan
0
2
4
6
8
1997 1998 1999 2000 2001 2002 2003E
Source: JD Power-LMC, UBS estimates
Five factors are stimulating Asian car ownership:
ν A large pool of first-time car buyers. As evidenced by the demographic and income trends outlined above, there is a relatively young and affluent workforce.
ν Increasing affordability. A key factor making cars more affordable in China has been that country’s membership of the World Trade Organization (WTO). As tariffs on imported cars tumbled in the wake of China’s accession to the WTO, and a slew of new models have come onto the market, domestic auto makers have been forced to cut their prices. For example, Geely Motor Co., a small private Chinese auto maker, has slashed the price of its Haoqing model to just $4,700.
ν Favorable government policies. In China, the government realizes that it needs to build a strong domestic car industry to compete with foreign imports. In Malaysia, road taxes, insurance rates, and gasoline prices remain at relatively low prices. More directly, the Malaysian government provides subsidized car loans for civil servants and teachers.
ν Increasing levels of urbanization. Generally poor levels of public transport services, especially to the outlying areas of urban sprawls, are necessitating private vehicle ownership. Furthermore, elevated highway systems have become the preferred mode for moving traffic quickly through cities.
Asian auto sales have been growing steadily
Thematic Investing 20 June 2003
UBS 18
ν An expanding network of well-developed roads. China's highway system has formed a basic national network. The expressway network is 30,000 kilometers long and is expanding by 3,000 kilometers every year. Malaysia too possesses a well-developed road network totalling 66,465 kilometers (in 2000) which is expected to expand further with the government’s continued efforts to stimulate the economy. The government has allocated $1.3 billion for the development of new roads, and $2.3 billion for the upgrading of existing roads.
The highest growth rates in the Asian auto sector are likely to remain in the small-to-medium sized entry level saloon market. In that regard, well positioned manufacturers in the region include Proton and UMW (Malaysia), Astra International (Indonesia), Denway Motors (China), and Kia Motors and Hyundai Motor (South Korea).
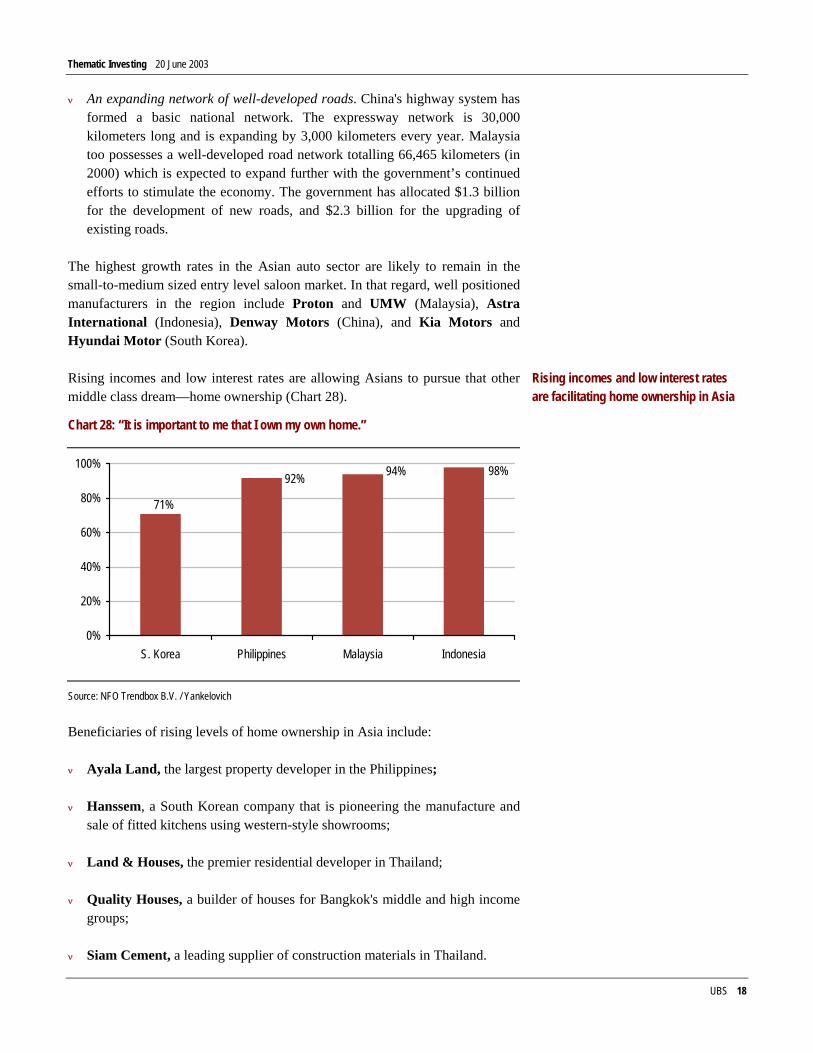
Rising incomes and low interest rates are allowing Asians to pursue that other middle class dream—home ownership (Chart 28).
Chart 28: “It is important to me that I own my own home.”
98%94%92%
71%
0%
20%
40%
60%
80%
100%
S. Korea Philippines Malaysia Indonesia
Source: NFO Trendbox B.V. / Yankelovich
Beneficiaries of rising levels of home ownership in Asia include:
ν Ayala Land, the largest property developer in the Philippines;
ν Hanssem, a South Korean company that is pioneering the manufacture and sale of fitted kitchens using western-style showrooms;
ν Land & Houses, the premier residential developer in Thailand;
ν Quality Houses, a builder of houses for Bangkok's middle and high income groups;
ν Siam Cement, a leading supplier of construction materials in Thailand.
Rising incomes and low interest rates are facilitating home ownership in Asia
Thematic Investing 20 June 2003
UBS 19
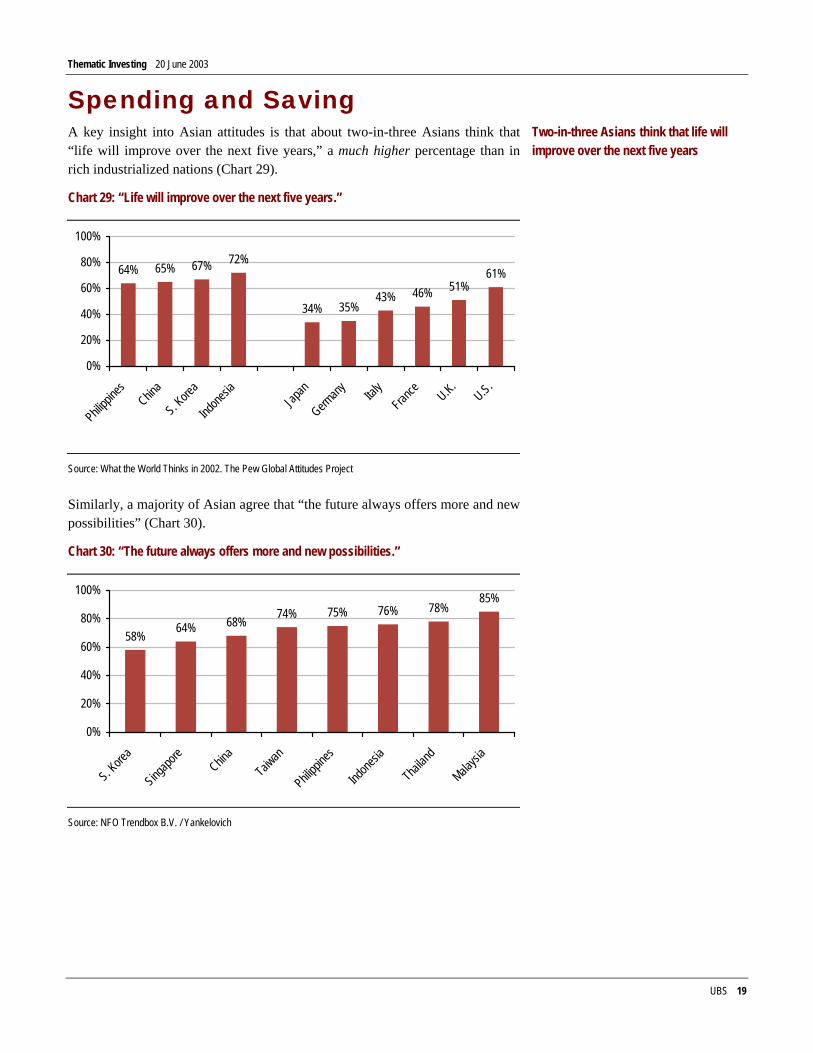
Spending and Saving A key insight into Asian attitudes is that about two-in-three Asians think that “life will improve over the next five years,” a much higher percentage than in rich industrialized nations (Chart 29).
Chart 29: “Life will improve over the next five years.”
64% 65% 67% 72%
34% 35%43% 46% 51%
61%
0%
20%
40%
60%
80%
100%
Philippi
nes China
S. Kore
a
Indone
siaJap
an
Germany Ital
yFran
ce U.K.U.S.
Source: What the World Thinks in 2002. The Pew Global Attitudes Project
Similarly, a majority of Asian agree that “the future always offers more and new possibilities” (Chart 30).
Chart 30: “The future always offers more and new possibilities.”
58% 64% 68% 74% 75% 76% 78%85%
0%
20%
40%
60%
80%
100%
S. Kore
a
Singapo
reChin
aTaiw
an
Philippi
nes
Indone
sia
Thailan
d
Malaysi
a
Source: NFO Trendbox B.V. / Yankelovich
Two-in-three Asians think that life will improve over the next five years
Thematic Investing 20 June 2003
UBS 20
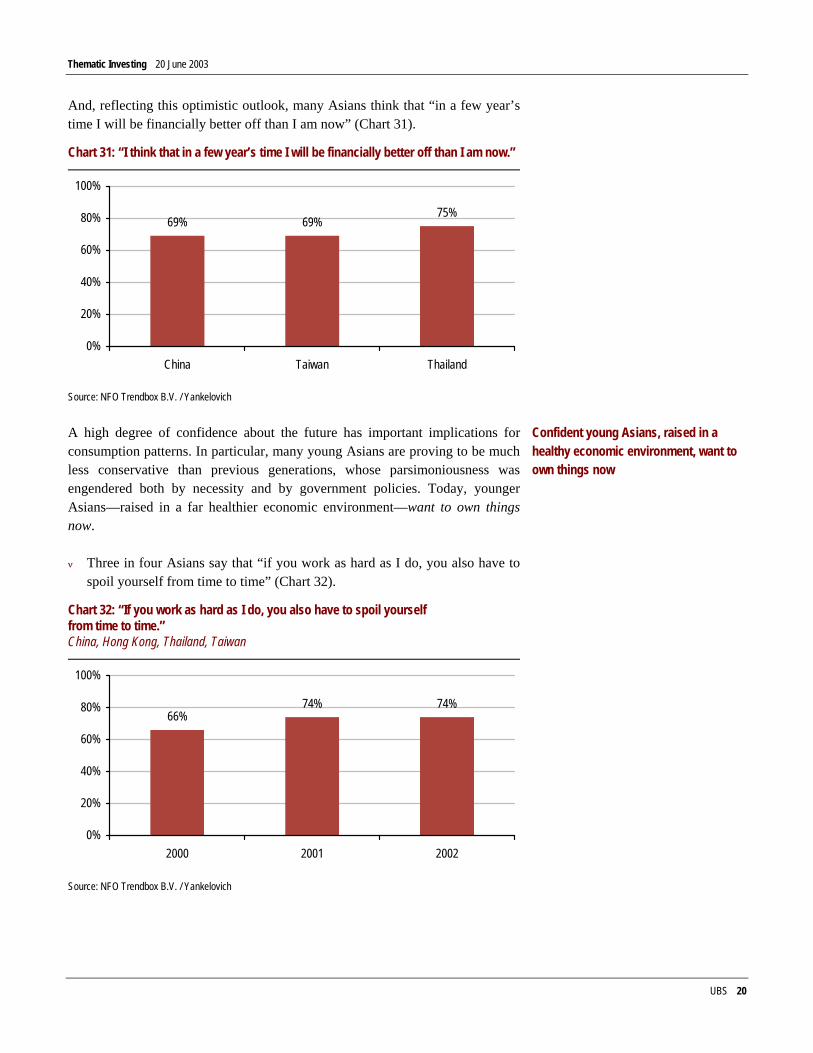
And, reflecting this optimistic outlook, many Asians think that “in a few year’s time I will be financially better off than I am now” (Chart 31).
Chart 31: “I think that in a few year’s time I will be financially better off than I am now.”
69% 69%75%
0%
20%
40%
60%
80%
100%
China Taiwan Thailand
Source: NFO Trendbox B.V. / Yankelovich
A high degree of confidence about the future has important implications for consumption patterns. In particular, many young Asians are proving to be much less conservative than previous generations, whose parsimoniousness was engendered both by necessity and by government policies. Today, younger Asians—raised in a far healthier economic environment—want to own things now.
ν Three in four Asians say that “if you work as hard as I do, you also have to spoil yourself from time to time” (Chart 32).
Chart 32: “If you work as hard as I do, you also have to spoil yourself from time to time.” China, Hong Kong, Thailand, Taiwan
66%74% 74%
0%
20%
40%
60%
80%
100%
2000 2001 2002
Source: NFO Trendbox B.V. / Yankelovich
Confident young Asians, raised in a healthy economic environment, want to own things now
Thematic Investing 20 June 2003
UBS 21
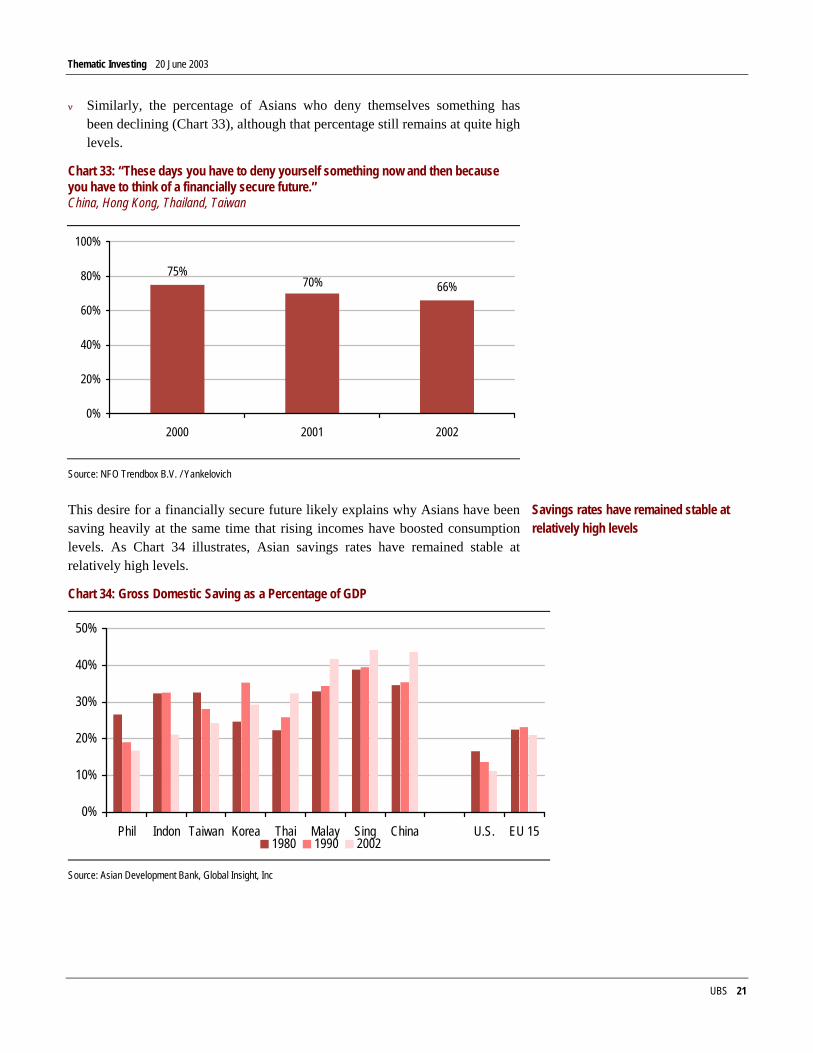
ν Similarly, the percentage of Asians who deny themselves something has been declining (Chart 33), although that percentage still remains at quite high levels.
Chart 33: “These days you have to deny yourself something now and then because you have to think of a financially secure future.” China, Hong Kong, Thailand, Taiwan
75%66%70%
0%
20%
40%
60%
80%
100%
2000 2001 2002
Source: NFO Trendbox B.V. / Yankelovich
This desire for a financially secure future likely explains why Asians have been saving heavily at the same time that rising incomes have boosted consumption levels. As Chart 34 illustrates, Asian savings rates have remained stable at relatively high levels.
Chart 34: Gross Domestic Saving as a Percentage of GDP
0%
10%
20%
30%
40%
50%
Phil Indon Taiwan Korea Thai Malay Sing China U.S. EU 151980 1990 2002
Source: Asian Development Bank, Global Insight, Inc
Savings rates have remained stable at relatively high levels
Thematic Investing 20 June 2003
UBS 22
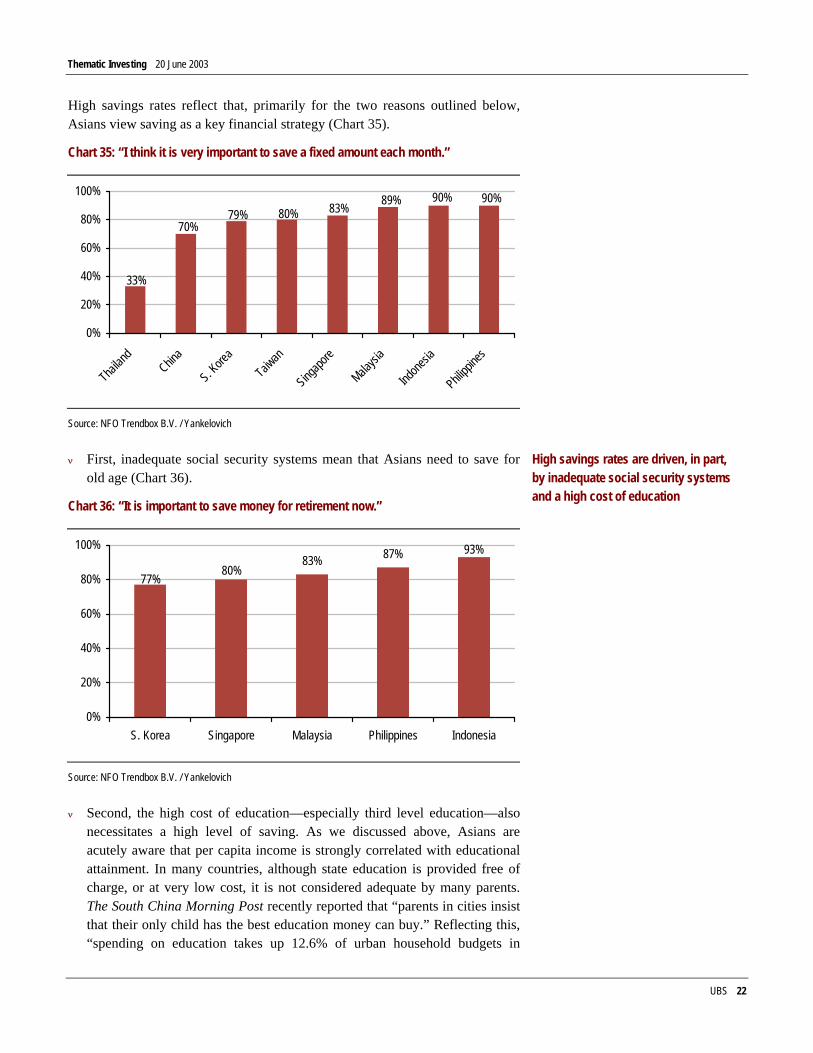
High savings rates reflect that, primarily for the two reasons outlined below, Asians view saving as a key financial strategy (Chart 35).
Chart 35: “I think it is very important to save a fixed amount each month.”
90%90%89%83%80%79%70%
33%
0%
20%
40%
60%
80%
100%
Thailan
dChin
a
S. Kore
aTaiw
an
Singapo
re
Malaysi
a
Indone
sia
Philippi
nes
Source: NFO Trendbox B.V. / Yankelovich
ν First, inadequate social security systems mean that Asians need to save for old age (Chart 36).
Chart 36: “It is important to save money for retirement now.”
93%87%83%80%
77%
0%
20%
40%
60%
80%
100%
S. Korea Singapore Malaysia Philippines Indonesia
Source: NFO Trendbox B.V. / Yankelovich
ν Second, the high cost of education—especially third level education—also necessitates a high level of saving. As we discussed above, Asians are acutely aware that per capita income is strongly correlated with educational attainment. In many countries, although state education is provided free of charge, or at very low cost, it is not considered adequate by many parents. The South China Morning Post recently reported that “parents in cities insist that their only child has the best education money can buy.” Reflecting this, “spending on education takes up 12.6% of urban household budgets in
High savings rates are driven, in part, by inadequate social security systems and a high cost of education
Thematic Investing 20 June 2003
UBS 23
China, second only to food” according to the Post. And Singapore’s trade minister recently observed that “the demand for higher education among the growing middle class in Asia will increase faster than the gross domestic product growth rate, much of which will have to be provided by the private sector because the state sector cannot grow fast enough.”
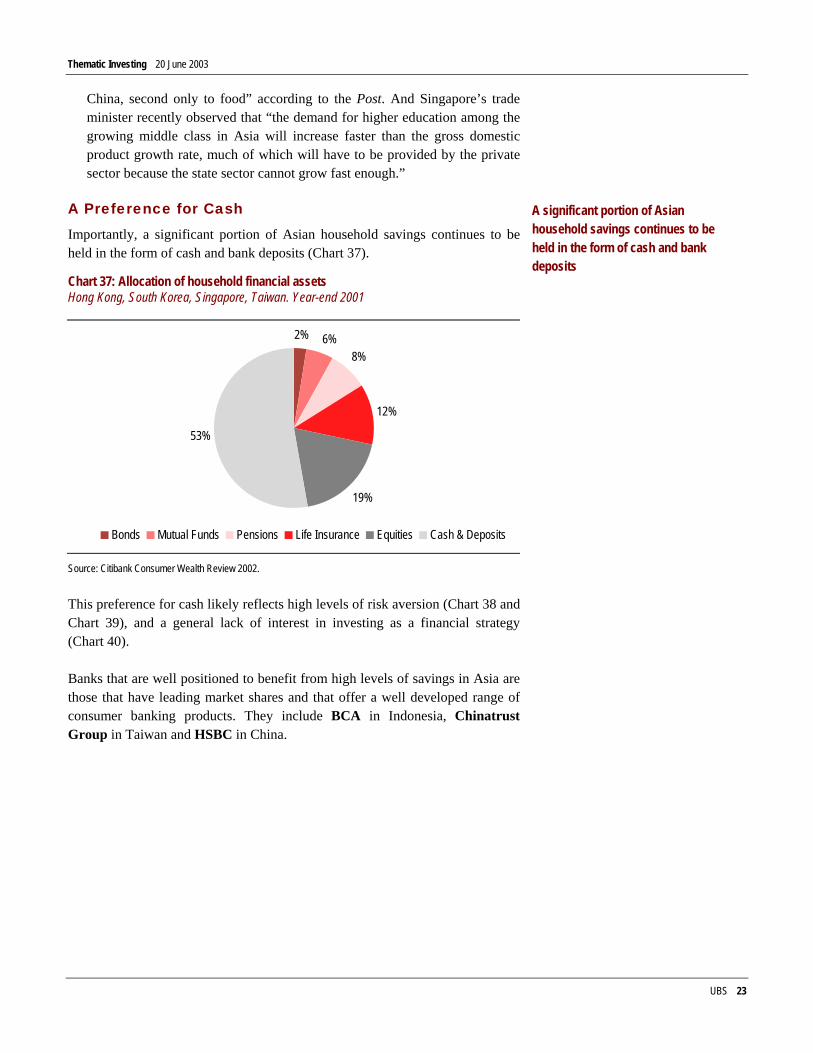
A Preference for Cash Importantly, a significant portion of Asian household savings continues to be held in the form of cash and bank deposits (Chart 37).
Chart 37: Allocation of household financial assets Hong Kong, South Korea, Singapore, Taiwan. Year-end 2001
2% 6%8%
12%
19%
53%
Bonds Mutual Funds Pensions Life Insurance Equities Cash & Deposits
Source: Citibank Consumer Wealth Review 2002.
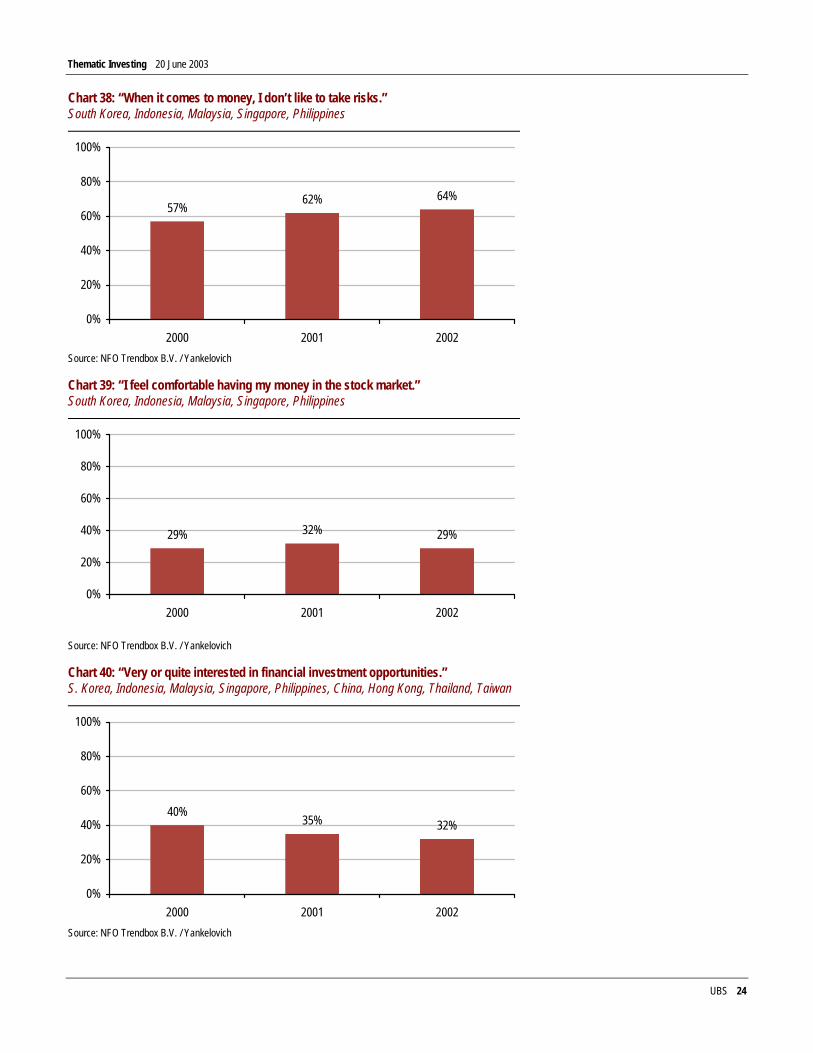
This preference for cash likely reflects high levels of risk aversion (Chart 38 and Chart 39), and a general lack of interest in investing as a financial strategy (Chart 40).
Banks that are well positioned to benefit from high levels of savings in Asia are those that have leading market shares and that offer a well developed range of consumer banking products. They include BCA in Indonesia, Chinatrust Group in Taiwan and HSBC in China.
A significant portion of Asian household savings continues to be held in the form of cash and bank deposits
Thematic Investing 20 June 2003
UBS 24
Chart 38: “When it comes to money, I don’t like to take risks.” South Korea, Indonesia, Malaysia, Singapore, Philippines
57% 62% 64%
0%
20%
40%
60%
80%
100%
2000 2001 2002Source: NFO Trendbox B.V. / Yankelovich
Chart 39: “I feel comfortable having my money in the stock market.” South Korea, Indonesia, Malaysia, Singapore, Philippines
29% 32% 29%
0%
20%
40%
60%
80%
100%
2000 2001 2002
Source: NFO Trendbox B.V. / Yankelovich
Chart 40: “Very or quite interested in financial investment opportunities.” S. Korea, Indonesia, Malaysia, Singapore, Philippines, China, Hong Kong, Thailand, Taiwan
40% 35% 32%
0%
20%
40%
60%
80%
100%
2000 2001 2002Source: NFO Trendbox B.V. / Yankelovich
Thematic Investing 20 June 2003
UBS 25
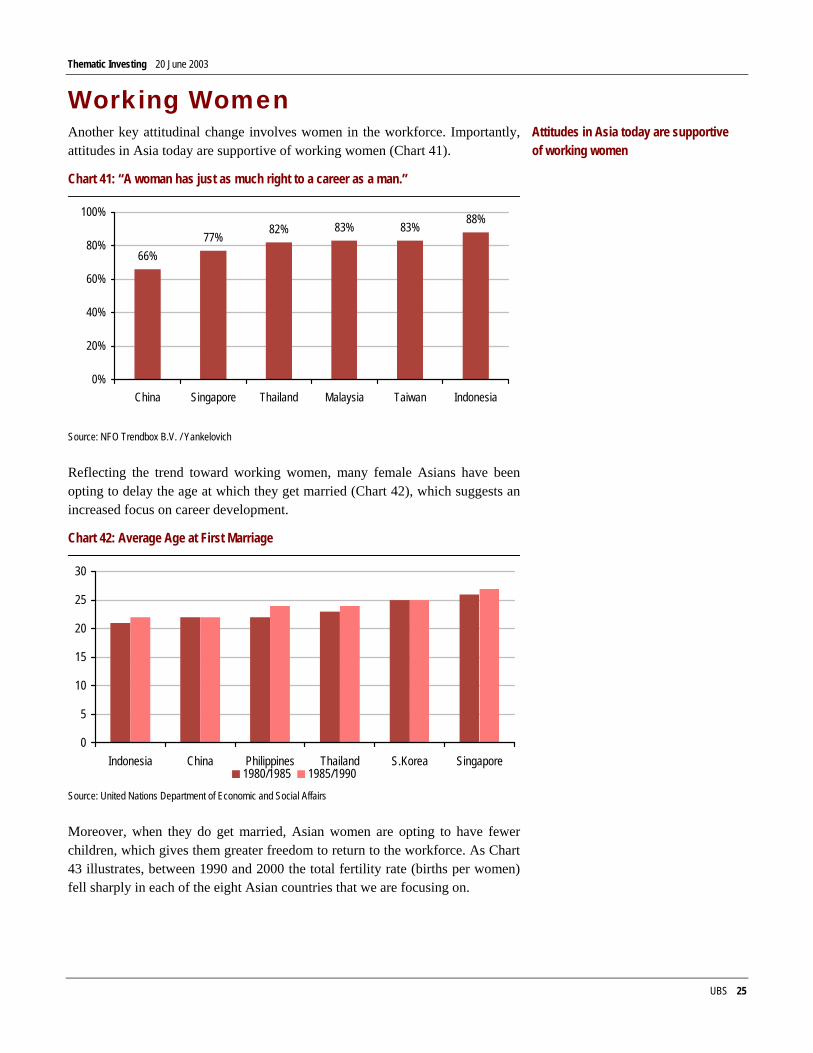
Working Women Another key attitudinal change involves women in the workforce. Importantly, attitudes in Asia today are supportive of working women (Chart 41).
Chart 41: “A woman has just as much right to a career as a man.”
66%77% 82% 83% 83% 88%
0%
20%
40%
60%
80%
100%
China Singapore Thailand Malaysia Taiwan Indonesia
Source: NFO Trendbox B.V. / Yankelovich
Reflecting the trend toward working women, many female Asians have been opting to delay the age at which they get married (Chart 42), which suggests an increased focus on career development.
Chart 42: Average Age at First Marriage
0
5
10
15
20
25
30
Indonesia China Philippines Thailand S.Korea Singapore1980/1985 1985/1990
Source: United Nations Department of Economic and Social Affairs
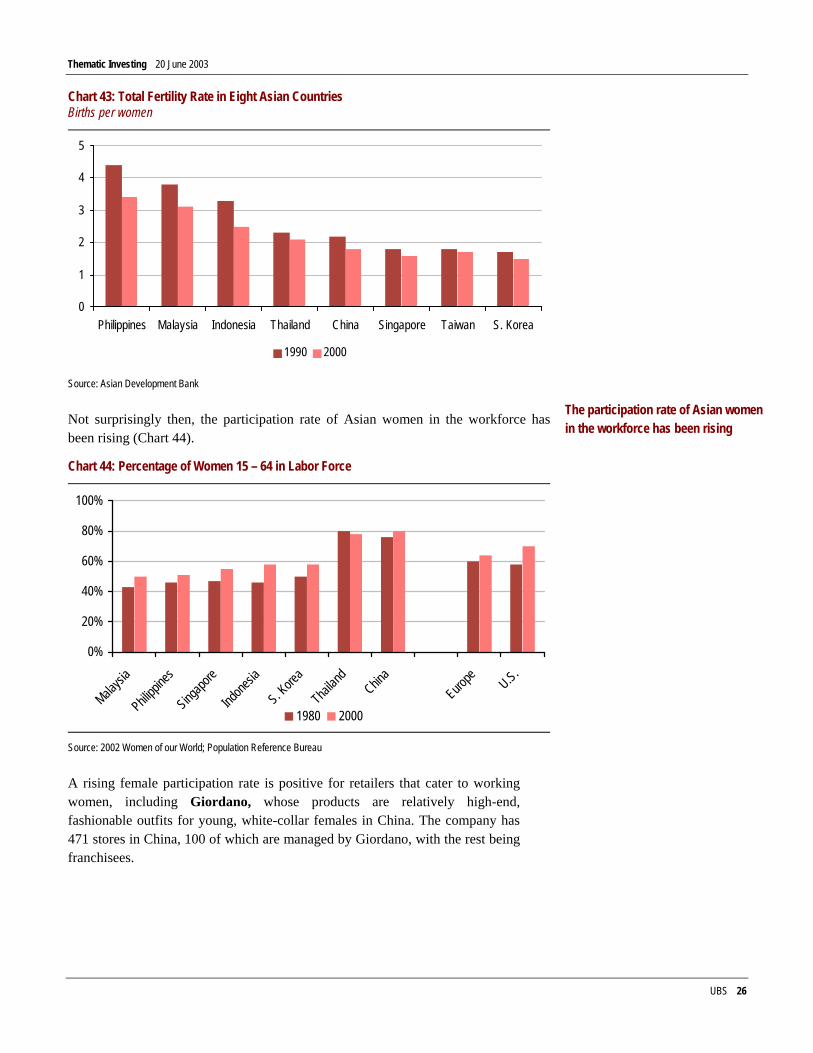
Moreover, when they do get married, Asian women are opting to have fewer children, which gives them greater freedom to return to the workforce. As Chart 43 illustrates, between 1990 and 2000 the total fertility rate (births per women) fell sharply in each of the eight Asian countries that we are focusing on.
Attitudes in Asia today are supportive of working women
Thematic Investing 20 June 2003
UBS 26
Chart 43: Total Fertility Rate in Eight Asian Countries Births per women
0
1
2
3
4
5
Philippines Malaysia Indonesia Thailand China Singapore Taiwan S. Korea
1990 2000
Source: Asian Development Bank
Not surprisingly then, the participation rate of Asian women in the workforce hasbeen rising (Chart 44).
Chart 44: Percentage of Women 15 – 64 in Labor Force
0%
20%
40%
60%
80%
100%
Malaysi
a
Philippi
nes
Singapo
re
Indone
sia
S. Kore
a
Thailan
dChin
aEuro
pe U.S.
1980 2000
Source: 2002 Women of our World; Population Reference Bureau
A rising female participation rate is positive for retailers that cater to working women, including Giordano, whose products are relatively high-end, fashionable outfits for young, white-collar females in China. The company has 471 stores in China, 100 of which are managed by Giordano, with the rest being franchisees.
The participation rate of Asian women in the workforce has been rising
Thematic Investing 20 June 2003
UBS 27
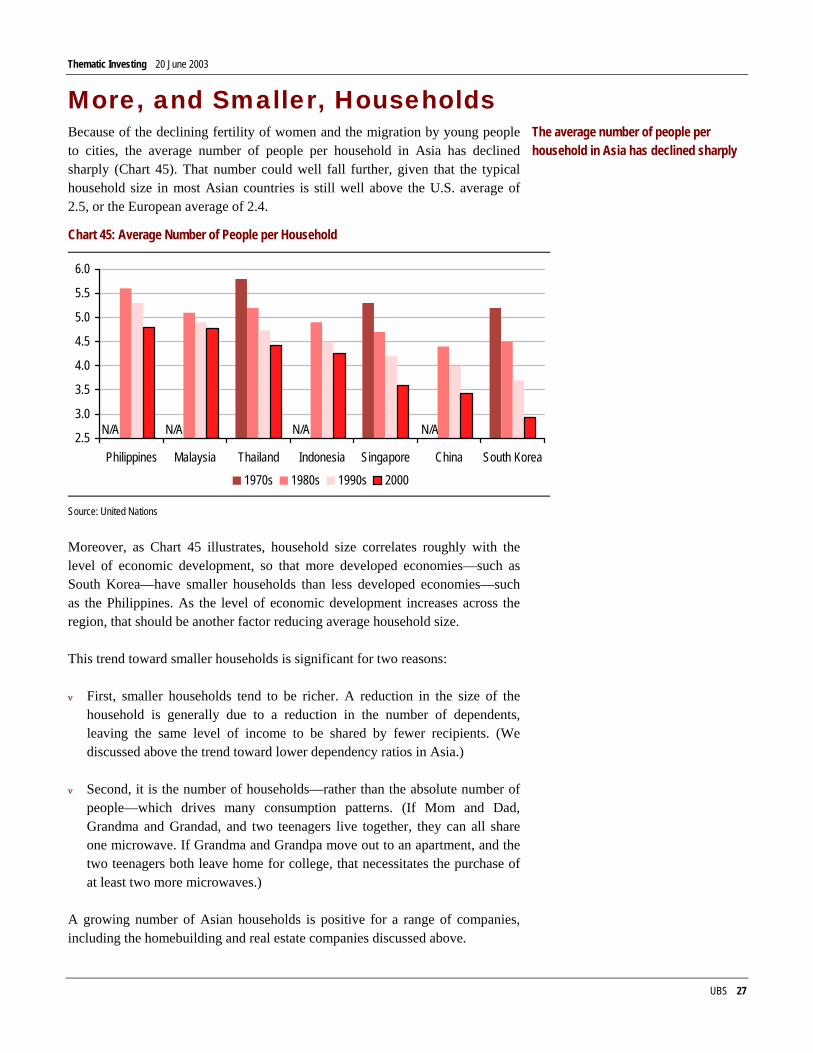
More, and Smaller, Households Because of the declining fertility of women and the migration by young people to cities, the average number of people per household in Asia has declined sharply (Chart 45). That number could well fall further, given that the typical household size in most Asian countries is still well above the U.S. average of 2.5, or the European average of 2.4.
Chart 45: Average Number of People per Household
2.5
3.0
3.5
4.0
4.5
5.0
5.5
6.0
Philippines Malaysia Thailand Indonesia Singapore China South Korea
1970s 1980s 1990s 2000
N/A N/AN/A N/A
Source: United Nations
Moreover, as Chart 45 illustrates, household size correlates roughly with the level of economic development, so that more developed economies—such as South Korea—have smaller households than less developed economies—such as the Philippines. As the level of economic development increases across the region, that should be another factor reducing average household size.
This trend toward smaller households is significant for two reasons:
ν First, smaller households tend to be richer. A reduction in the size of the household is generally due to a reduction in the number of dependents, leaving the same level of income to be shared by fewer recipients. (We discussed above the trend toward lower dependency ratios in Asia.)
ν Second, it is the number of households—rather than the absolute number of people—which drives many consumption patterns. (If Mom and Dad, Grandma and Grandad, and two teenagers live together, they can all share one microwave. If Grandma and Grandpa move out to an apartment, and the two teenagers both leave home for college, that necessitates the purchase of at least two more microwaves.)
A growing number of Asian households is positive for a range of companies, including the homebuilding and real estate companies discussed above.
The average number of people per household in Asia has declined sharply
Thematic Investing 20 June 2003
UBS 28
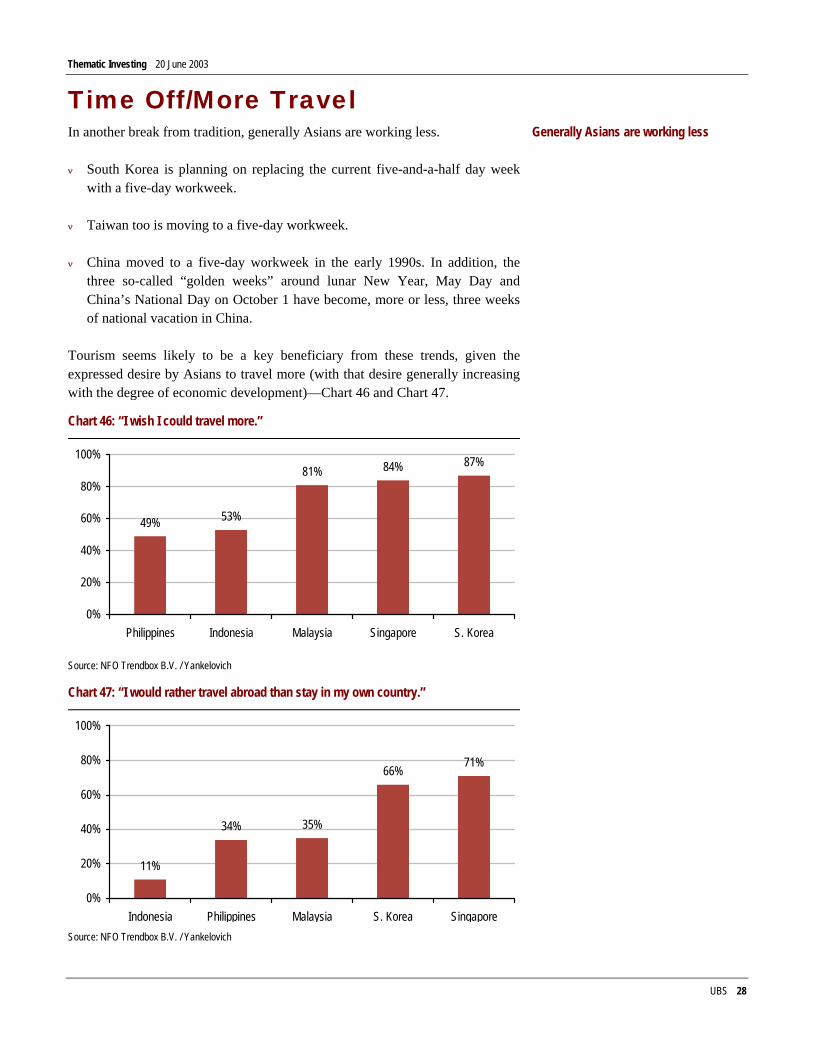
Time Off/More Travel In another break from tradition, generally Asians are working less.
ν South Korea is planning on replacing the current five-and-a-half day week with a five-day workweek.
ν Taiwan too is moving to a five-day workweek.
ν China moved to a five-day workweek in the early 1990s. In addition, the three so-called “golden weeks” around lunar New Year, May Day and China’s National Day on October 1 have become, more or less, three weeks of national vacation in China.
Tourism seems likely to be a key beneficiary from these trends, given the expressed desire by Asians to travel more (with that desire generally increasing with the degree of economic development)—Chart 46 and Chart 47.
Chart 46: “I wish I could travel more.”
49% 53%
81% 84% 87%
0%
20%
40%
60%
80%
100%
Philippines Indonesia Malaysia Singapore S. Korea
Source: NFO Trendbox B.V. / Yankelovich
Chart 47: “I would rather travel abroad than stay in my own country.”
11%
34% 35%
66%71%
0%
20%
40%
60%
80%
100%
Indonesia Philippines Malaysia S. Korea SingaporeSource: NFO Trendbox B.V. / Yankelovich
Generally Asians are working less
Thematic Investing 20 June 2003
UBS 29
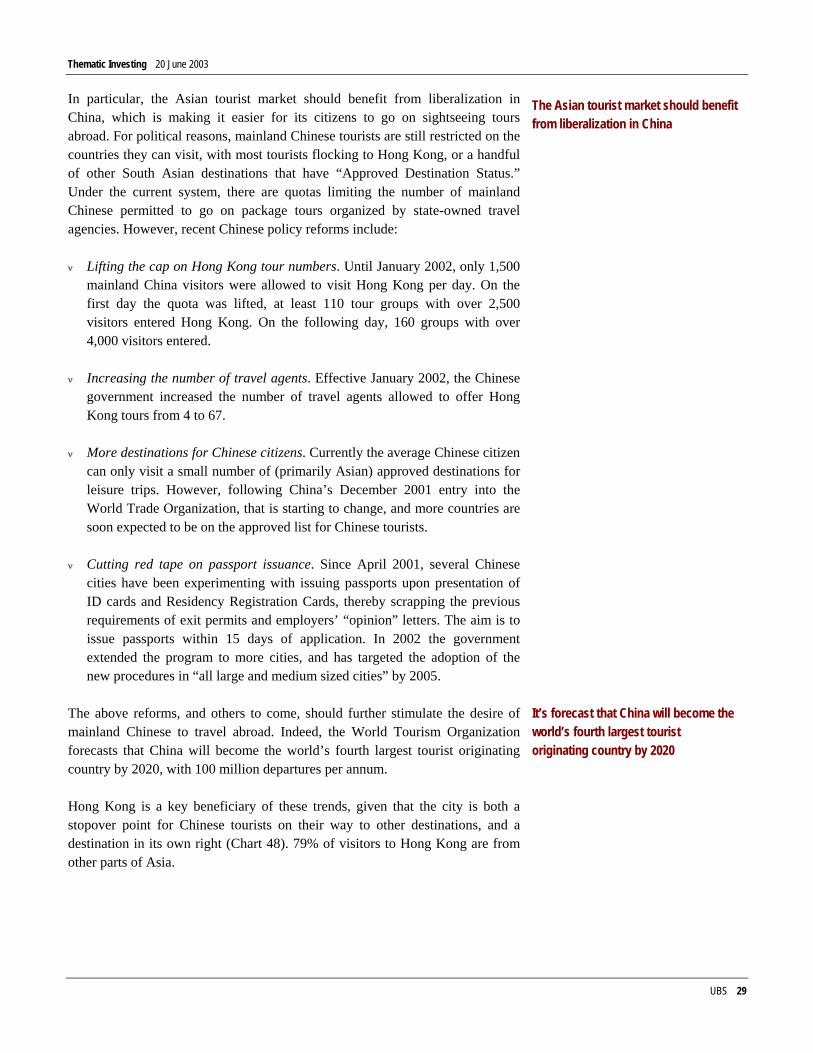
In particular, the Asian tourist market should benefit from liberalization in China, which is making it easier for its citizens to go on sightseeing tours abroad. For political reasons, mainland Chinese tourists are still restricted on the countries they can visit, with most tourists flocking to Hong Kong, or a handful of other South Asian destinations that have “Approved Destination Status.” Under the current system, there are quotas limiting the number of mainland Chinese permitted to go on package tours organized by state-owned travel agencies. However, recent Chinese policy reforms include:
ν Lifting the cap on Hong Kong tour numbers. Until January 2002, only 1,500 mainland China visitors were allowed to visit Hong Kong per day. On the first day the quota was lifted, at least 110 tour groups with over 2,500 visitors entered Hong Kong. On the following day, 160 groups with over 4,000 visitors entered.
ν Increasing the number of travel agents. Effective January 2002, the Chinese government increased the number of travel agents allowed to offer Hong Kong tours from 4 to 67.
ν More destinations for Chinese citizens. Currently the average Chinese citizen can only visit a small number of (primarily Asian) approved destinations for leisure trips. However, following China’s December 2001 entry into the World Trade Organization, that is starting to change, and more countries are soon expected to be on the approved list for Chinese tourists.
ν Cutting red tape on passport issuance. Since April 2001, several Chinese cities have been experimenting with issuing passports upon presentation of ID cards and Residency Registration Cards, thereby scrapping the previous requirements of exit permits and employers’ “opinion” letters. The aim is to issue passports within 15 days of application. In 2002 the government extended the program to more cities, and has targeted the adoption of the new procedures in “all large and medium sized cities” by 2005.
The above reforms, and others to come, should further stimulate the desire of mainland Chinese to travel abroad. Indeed, the World Tourism Organization forecasts that China will become the world’s fourth largest tourist originating country by 2020, with 100 million departures per annum.
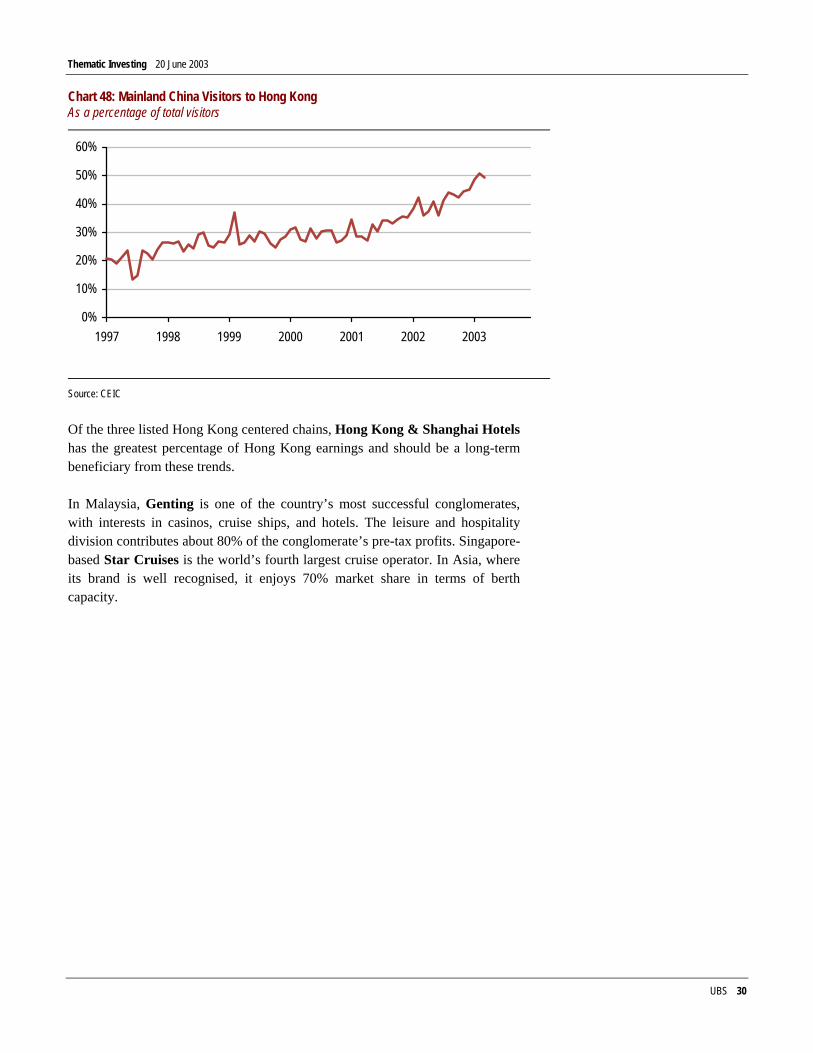
Hong Kong is a key beneficiary of these trends, given that the city is both a stopover point for Chinese tourists on their way to other destinations, and a destination in its own right (Chart 48). 79% of visitors to Hong Kong are from other parts of Asia.
The Asian tourist market should benefit from liberalization in China
It’s forecast that China will become the world’s fourth largest tourist originating country by 2020
Thematic Investing 20 June 2003
UBS 30
Chart 48: Mainland China Visitors to Hong Kong As a percentage of total visitors
0%
10%
20%
30%
40%
50%
60%
1997 1998 1999 2000 2001 2002 2003
Source: CEIC
Of the three listed Hong Kong centered chains, Hong Kong & Shanghai Hotels has the greatest percentage of Hong Kong earnings and should be a long-term beneficiary from these trends.
In Malaysia, Genting is one of the country’s most successful conglomerates, with interests in casinos, cruise ships, and hotels. The leisure and hospitality division contributes about 80% of the conglomerate’s pre-tax profits. Singapore-based Star Cruises is the world’s fourth largest cruise operator. In Asia, where its brand is well recognised, it enjoys 70% market share in terms of berth capacity.
Thematic Investing 20 June 2003
UBS 31
Responding to Asian Affluence In the sections above we discussed the changes in consumer attitudes associated with Asian Affluence. Not surprisingly, manufacturers and retailers have been responding to these attitudinal changes, both in terms of the products they offer and in the way those products are sold. As we discuss below, three key changes involve 1) the quality of products that Asian consumers can buy, 2) the brand image of those products and 3) the increasing formalization of retailing across Asia.
Quality Products According to official Chinese reports carried by Xinhua (the news agency) and People’s Daily (the newspaper) imitation products, ranging from fake alcohol to garments and even medicine, have become a serious problem in China. The Pharmaceuticals Research and Manufacturers of America estimates that more than half of some pharmaceuticals sold in China are fake.
With the rise in the number of consumer complaints—and, in some cases, litigation-about fake products, many Chinese general retailers (i.e., non-specialized) have started to distance themselves from the products they carry. Specifically, these retailers
ν Rarely stock products that carry the retailer’s brand;
ν Do not usually advertise, and do not make a significant effort to create brand equity;
ν Rent retail counters and even whole floors to suppliers on a long-term basis.
This, however, creates a vicious circle: the less Chinese retailers are willing to do to ensure the quality of the merchandise they carry, the less influence they have over their suppliers, who then have little incentive to supply quality products. In overseas markets, retailers generally make an effort to create brand equity by selecting the best quality products for their customers. In Western countries, a sticker or label carrying the retailer’s name conveys certain quality assurances, but Chinese retailers are, in general, avoiding this crucial role.
It is for this reason that the (still limited number of) specialty retailers in China have an advantage. Unlike general retailers, which sell thousands of different products, specialist stores focus on just one or two product lines, and deal with just a few manufacturers and suppliers. This makes it easier for them to control product quality, making some of them (including Giordano, mentioned above, and Glorious Sun, a manufacturer/retailer of apparel) confident enough to put the store’s stamp of approval on a product.
Imitation products have become a serious problem in China
Thematic Investing 20 June 2003
UBS 32
Not surprisingly, the mainland Chinese tourists who are flocking to Hong Kong in growing numbers (Chart 48), are spending heavily on the wide range of high quality goods that are available there. In 2001, the average American tourist spent HK$5,232 in Hong Kong, with 60% of that spent on accommodation and the remaining 40% mostly on food. By contrast, the average mainland Chinese tourist spent HK$5,169 in Hong Kong, with just 40% spent on accommodation and food and fully 60% on shopping (i.e., consumer electronics and fashion).
It is estimated that, in 2002, spending by mainland tourists accounted for 17% of total retail sales in Hong Kong. While the direct or indirect revenue consequences to Hong Kong retailers and retail landlords are as yet modest, long term beneficiaries that stand to benefit from this trend include Giordano in the retail sector, and landlords such as Swire Pacific (retail leases account for 14% of revenue).
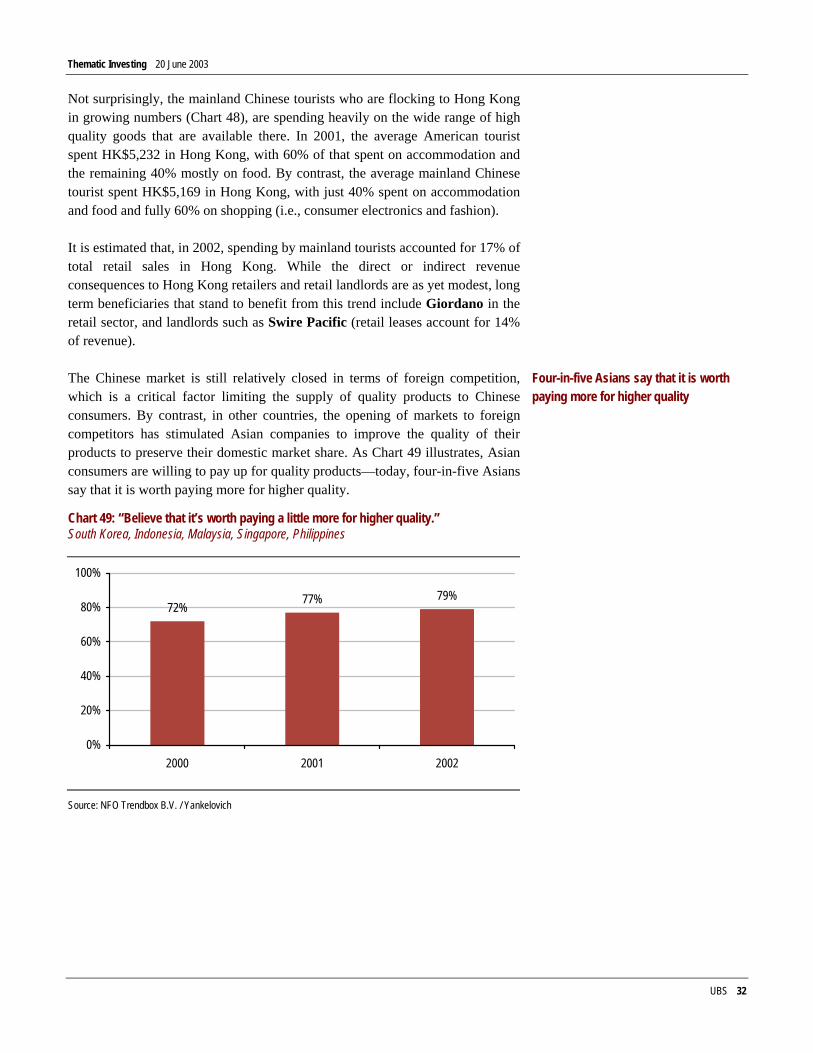
The Chinese market is still relatively closed in terms of foreign competition, which is a critical factor limiting the supply of quality products to Chinese consumers. By contrast, in other countries, the opening of markets to foreign competitors has stimulated Asian companies to improve the quality of their products to preserve their domestic market share. As Chart 49 illustrates, Asian consumers are willing to pay up for quality products—today, four-in-five Asians say that it is worth paying more for higher quality.
Chart 49: “Believe that it’s worth paying a little more for higher quality.” South Korea, Indonesia, Malaysia, Singapore, Philippines
72% 77% 79%
0%
20%
40%
60%
80%
100%
2000 2001 2002
Source: NFO Trendbox B.V. / Yankelovich
Four-in-five Asians say that it is worth paying more for higher quality
Thematic Investing 20 June 2003
UBS 33
In several instances, the quality of those Asian products is now so high, that they compete head-to-head with the world’s top brands in global markets.
ν Samsung Electronics. According to Interbrand, one of the world's leading branding consultancies, Samsung increased its brand equity by 22% in 2001 and 30% in 2002. This was the second-highest growth rate globally in 2001, and the highest in 2002. Strong brand recognition thanks, in large part, to high quality products has contributed to Samsung’s high ASPs (average selling prices) and high margins for products such as handsets, DVDs, ultra-thin laptops, and PDAs.
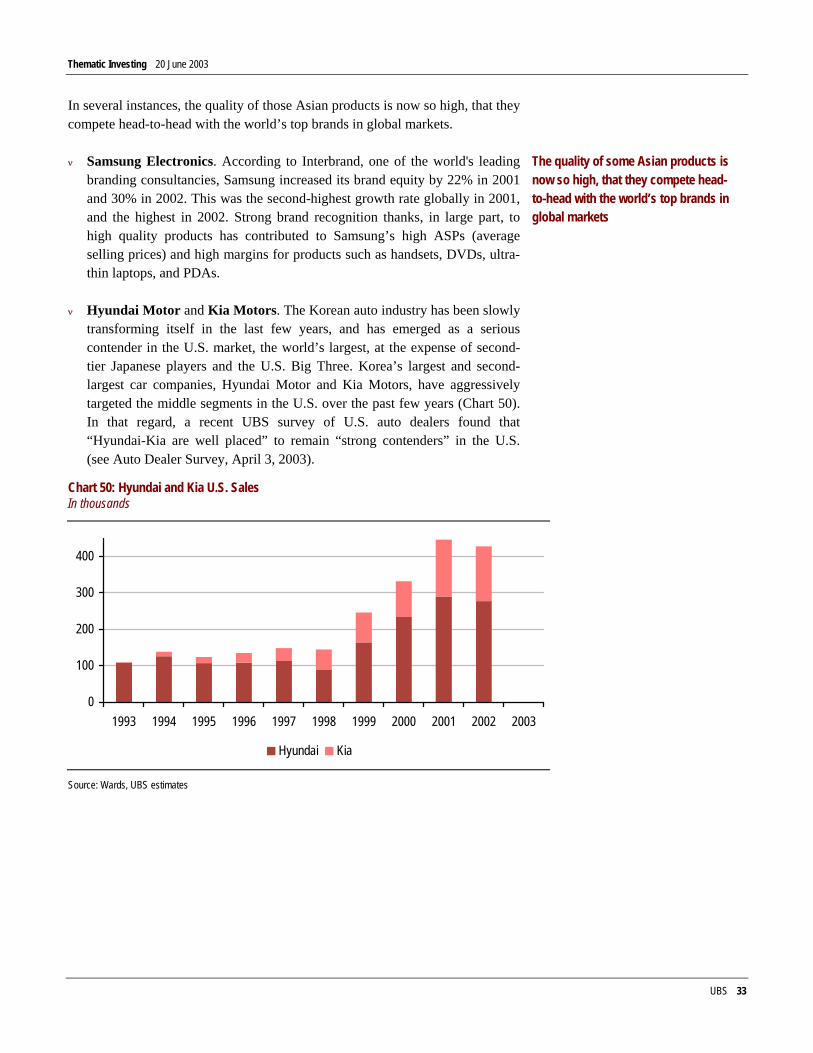
ν Hyundai Motor and Kia Motors. The Korean auto industry has been slowly transforming itself in the last few years, and has emerged as a serious contender in the U.S. market, the world’s largest, at the expense of second-tier Japanese players and the U.S. Big Three. Korea’s largest and second-largest car companies, Hyundai Motor and Kia Motors, have aggressively targeted the middle segments in the U.S. over the past few years (Chart 50). In that regard, a recent UBS survey of U.S. auto dealers found that “Hyundai-Kia are well placed” to remain “strong contenders” in the U.S. (see Auto Dealer Survey, April 3, 2003).
Chart 50: Hyundai and Kia U.S. Sales In thousands
0
100
200
300
400
1993 1994 1995 1996 1997 1998 1999 2000 2001 2002 2003
Hyundai Kia
Source: Wards, UBS estimates
The quality of some Asian products is now so high, that they compete head-to-head with the world’s top brands in global markets
Thematic Investing 20 June 2003
UBS 34
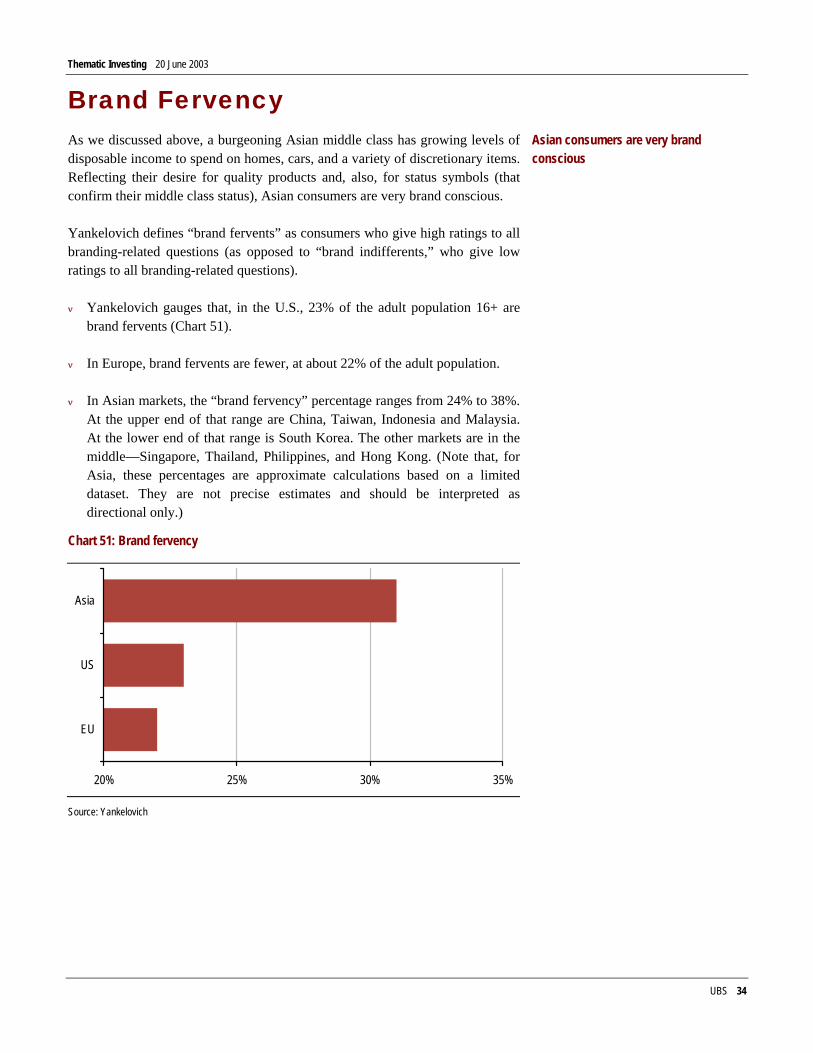
Brand Fervency As we discussed above, a burgeoning Asian middle class has growing levels of disposable income to spend on homes, cars, and a variety of discretionary items. Reflecting their desire for quality products and, also, for status symbols (that confirm their middle class status), Asian consumers are very brand conscious.
Yankelovich defines “brand fervents” as consumers who give high ratings to all branding-related questions (as opposed to “brand indifferents,” who give low ratings to all branding-related questions).
ν Yankelovich gauges that, in the U.S., 23% of the adult population 16+ are brand fervents (Chart 51).
ν In Europe, brand fervents are fewer, at about 22% of the adult population.
ν In Asian markets, the “brand fervency” percentage ranges from 24% to 38%. At the upper end of that range are China, Taiwan, Indonesia and Malaysia. At the lower end of that range is South Korea. The other markets are in the middle—Singapore, Thailand, Philippines, and Hong Kong. (Note that, for Asia, these percentages are approximate calculations based on a limited dataset. They are not precise estimates and should be interpreted as directional only.)
Chart 51: Brand fervency
20% 25% 30% 35%
EU
US
Asia
Source: Yankelovich
Asian consumers are very brand conscious
Thematic Investing 20 June 2003
UBS 35
Growing brand awareness is positive for a range of companies including:
ν Media companies. The leading players in most of Asia’s media markets enjoy commanding market shares, positioning them strongly to benefit from burgeoning ad spending. This is true for print media—New Straits Times (Malaysia) and Singapore Press (Singapore)—and broadcast media—BEC World (Thailand), and TVB (Hong Kong).
ν Retailers. One of the best ways to play burgeoning demand for luxury brands is via the retail outlets they are sold in. In Korea, the largest discount retailer, Shinsegae, still generates roughly one third of its sales in high-end department stores. Hyundai Department Stores is more of a pure play on luxury brands, with many high-end Western labels (Gucci, Prada) represented on its sales floors. In the Philippines, SM Prime develops and operates the country’s premium shopping malls.
ν Brand owners. In addition to Giordano and Glorious Sun mentioned above, another retail brand owner is Texwinca, which targets the urban Chinese market for mid-end casual wear clothing using its main Baleno brand, as well as two newly launched brands, Samuel & Kevin and IP Zone. In the area of “fast moving consumer goods” (FMCG), beer manufacturers across the region enjoy strong brand identities—they include Hite Brewery in Korea and Tsingtao Brewery in China.
Formalization of Retailing: From Mom and Pop to Multinationals In many Asian countries, mom and pop operations still have the lions share of retail sales, although the Asian retail landscape is slowly being changed by the combination of three factors:
ν Rising affluence, which is increasing overall spending power, as well as changing spending patterns.
ν Increasing urbanization. This is key to the growth of large retailers, whose operations are only viable in large cities.
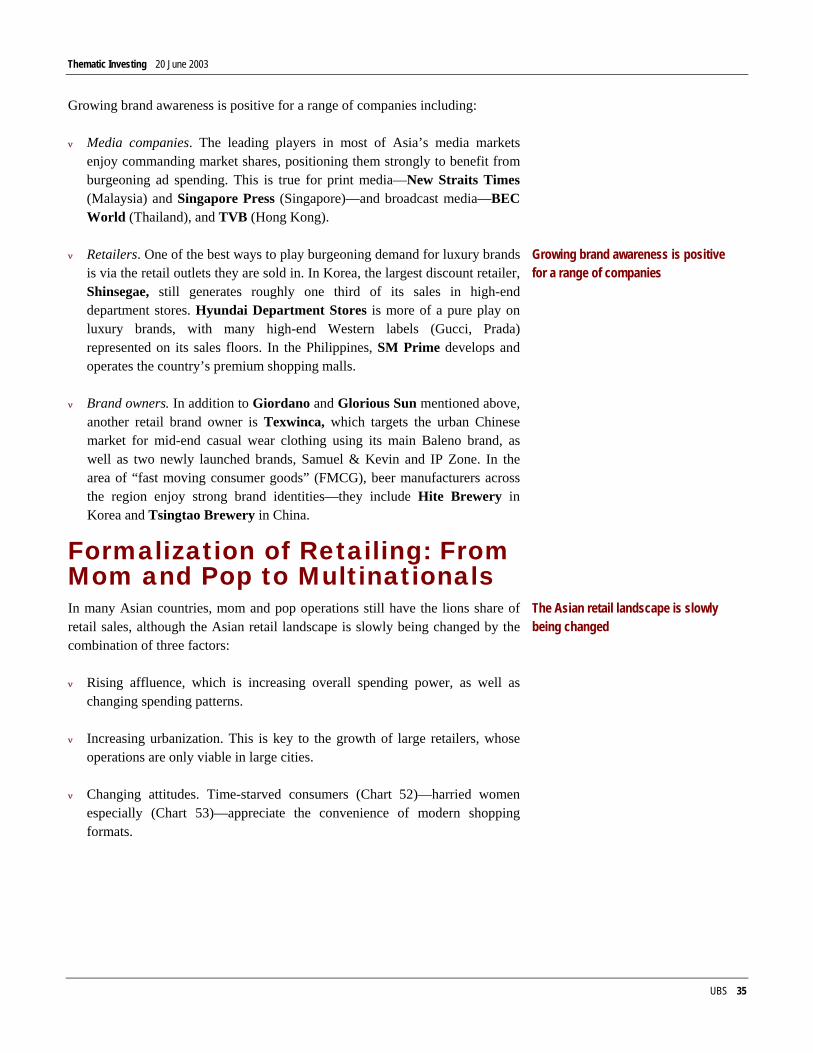
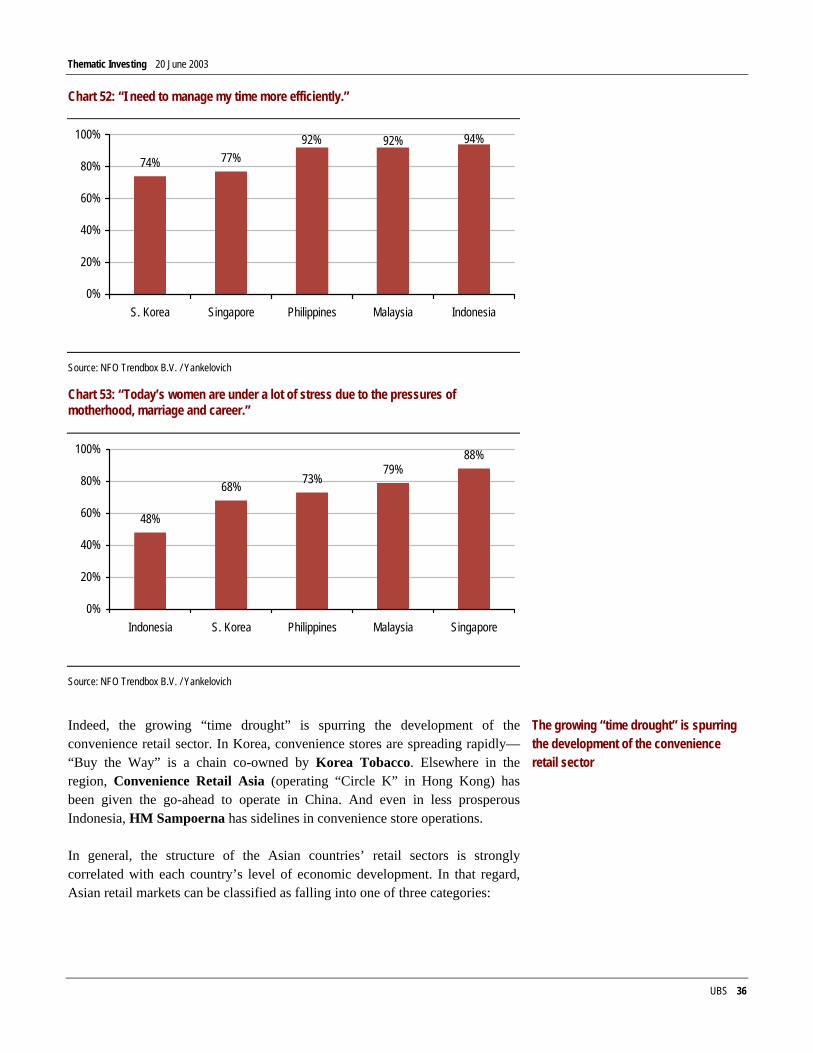
ν Changing attitudes. Time-starved consumers (Chart 52)—harried women especially (Chart 53)—appreciate the convenience of modern shopping formats.
Growing brand awareness is positive for a range of companies
The Asian retail landscape is slowly being changed
Thematic Investing 20 June 2003
UBS 36
Chart 52: “I need to manage my time more efficiently.”
74% 77%94%92%92%
0%
20%
40%
60%
80%
100%
S. Korea Singapore Philippines Malaysia Indonesia
Source: NFO Trendbox B.V. / Yankelovich
Chart 53: “Today’s women are under a lot of stress due to the pressures of motherhood, marriage and career.”
48%
68% 73%79%
88%
0%
20%
40%
60%
80%
100%
Indonesia S. Korea Philippines Malaysia Singapore
Source: NFO Trendbox B.V. / Yankelovich
Indeed, the growing “time drought” is spurring the development of the convenience retail sector. In Korea, convenience stores are spreading rapidly—“Buy the Way” is a chain co-owned by Korea Tobacco. Elsewhere in the region, Convenience Retail Asia (operating “Circle K” in Hong Kong) has been given the go-ahead to operate in China. And even in less prosperous Indonesia, HM Sampoerna has sidelines in convenience store operations.
In general, the structure of the Asian countries’ retail sectors is strongly correlated with each country’s level of economic development. In that regard, Asian retail markets can be classified as falling into one of three categories:
The growing “time drought” is spurring the development of the convenience retail sector
Thematic Investing 20 June 2003
UBS 37
ν A fragmented market, with no real concentration of power (e.g., China).
ν A strong/growing multinational presence (e.g., Malaysia, Thailand). In Malaysia, companies such as Carrefour (France), Royal Ahold (Netherlands) and Jusco (Japan) pioneered the concept of hypermarkets, modern supermarkets and department stores. Local companies (sometimes in partnership with foreign companies) followed their lead and established competing retail formats. In Thailand, the split between multinationals and local companies is much more one sided. The top three foreign players control almost 40% of the Thai market—Tesco Lotus, a unit of Britain's biggest supermarket chain, has 31% of the Thai market, while Big C, part of France's Casino group, has 24%, and France’s Carrefour has 14%.
ν A number of big retailers, both domestic and multinational (e.g., Korea). In Korea, there has been rapid growth of large discount stores since the government began to liberalize restrictions on the opening of such stores in 1996. (Discount stores in Korea have a product mix of 50% food and beverages, and 50% apparel and household goods.) The number of discount stores has grown from less than 10 in 1994 to around 250 today, because of the aggressive expansion plans of three or four major players, including Shinsegae (the market leader in the segment via its E-Mart grocery chain), Carrefour and Tesco.
ν Analyst Certification
Each research analyst primarily responsible for the content of this research report, in whole or in part, certifies that with respect to each security or issuer that the analyst covered in this report: (1) all of the views expressed accurately reflect his or her personal views about those securities or issuers; and (2) no part of his or her compensation was, is, or will be, directly or indirectly, related to the specific recommendations or views expressed by that research analyst in the research report.
Thematic Investing 20 June 2003
UBS 38
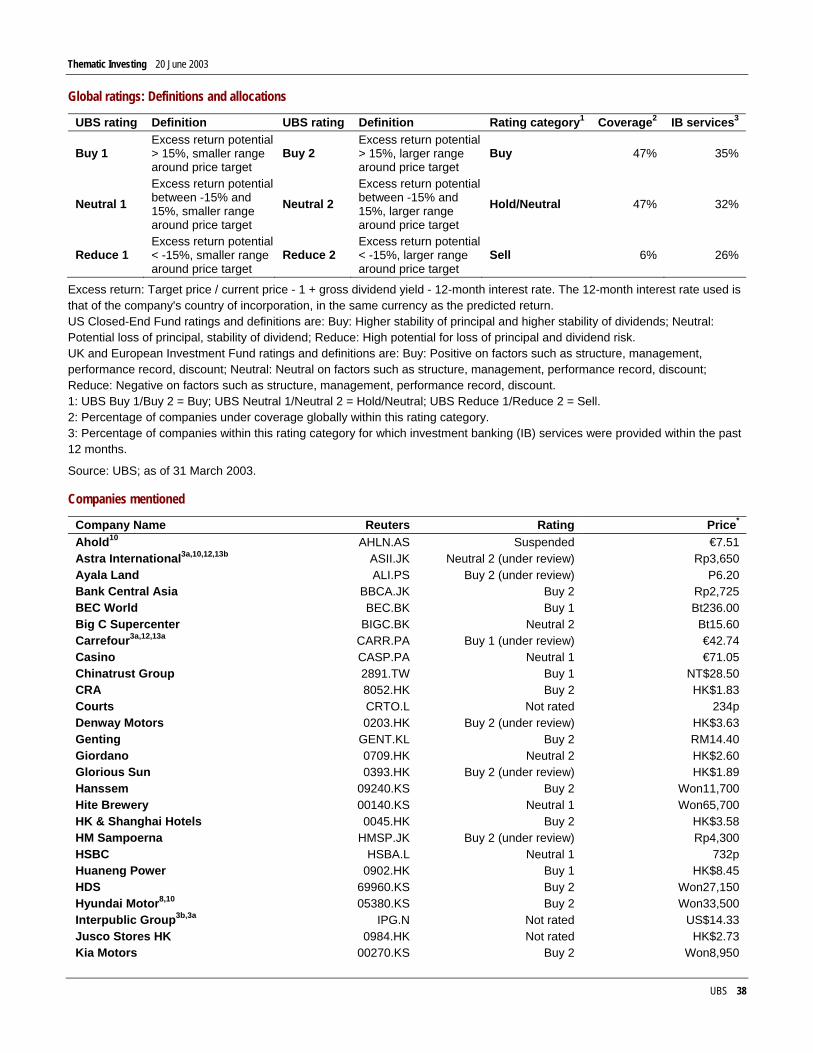
Global ratings: Definitions and allocations
UBS rating Definition UBS rating Definition Rating category1 Coverage2 IB services3
Buy 1 Excess return potential > 15%, smaller range around price target
Buy 2 Excess return potential > 15%, larger range around price target
Buy 47% 35%
Neutral 1 Excess return potential between -15% and 15%, smaller range around price target
Neutral 2 Excess return potential between -15% and 15%, larger range around price target
Hold/Neutral 47% 32%
Reduce 1 Excess return potential < -15%, smaller range around price target
Reduce 2 Excess return potential < -15%, larger range around price target
Sell 6% 26%
Excess return: Target price / current price - 1 + gross dividend yield - 12-month interest rate. The 12-month interest rate used is that of the company's country of incorporation, in the same currency as the predicted return. US Closed-End Fund ratings and definitions are: Buy: Higher stability of principal and higher stability of dividends; Neutral: Potential loss of principal, stability of dividend; Reduce: High potential for loss of principal and dividend risk. UK and European Investment Fund ratings and definitions are: Buy: Positive on factors such as structure, management, performance record, discount; Neutral: Neutral on factors such as structure, management, performance record, discount; Reduce: Negative on factors such as structure, management, performance record, discount. 1: UBS Buy 1/Buy 2 = Buy; UBS Neutral 1/Neutral 2 = Hold/Neutral; UBS Reduce 1/Reduce 2 = Sell. 2: Percentage of companies under coverage globally within this rating category. 3: Percentage of companies within this rating category for which investment banking (IB) services were provided within the past 12 months.
Source: UBS; as of 31 March 2003.
Companies mentioned
Company Name Reuters Rating Price* Ahold10 AHLN.AS Suspended €7.51 Astra International3a,10,12,13b ASII.JK Neutral 2 (under review) Rp3,650 Ayala Land ALI.PS Buy 2 (under review) P6.20 Bank Central Asia BBCA.JK Buy 2 Rp2,725 BEC World BEC.BK Buy 1 Bt236.00 Big C Supercenter BIGC.BK Neutral 2 Bt15.60 Carrefour3a,12,13a CARR.PA Buy 1 (under review) €42.74 Casino CASP.PA Neutral 1 €71.05 Chinatrust Group 2891.TW Buy 1 NT$28.50 CRA 8052.HK Buy 2 HK$1.83 Courts CRTO.L Not rated 234p Denway Motors 0203.HK Buy 2 (under review) HK$3.63 Genting GENT.KL Buy 2 RM14.40 Giordano 0709.HK Neutral 2 HK$2.60 Glorious Sun 0393.HK Buy 2 (under review) HK$1.89 Hanssem 09240.KS Buy 2 Won11,700 Hite Brewery 00140.KS Neutral 1 Won65,700 HK & Shanghai Hotels 0045.HK Buy 2 HK$3.58 HM Sampoerna HMSP.JK Buy 2 (under review) Rp4,300 HSBC HSBA.L Neutral 1 732p Huaneng Power 0902.HK Buy 1 HK$8.45 HDS 69960.KS Buy 2 Won27,150 Hyundai Motor8,10 05380.KS Buy 2 Won33,500 Interpublic Group3b,3a IPG.N Not rated US$14.33 Jusco Stores HK 0984.HK Not rated HK$2.73 Kia Motors 00270.KS Buy 2 Won8,950
Thematic Investing 20 June 2003
UBS 39
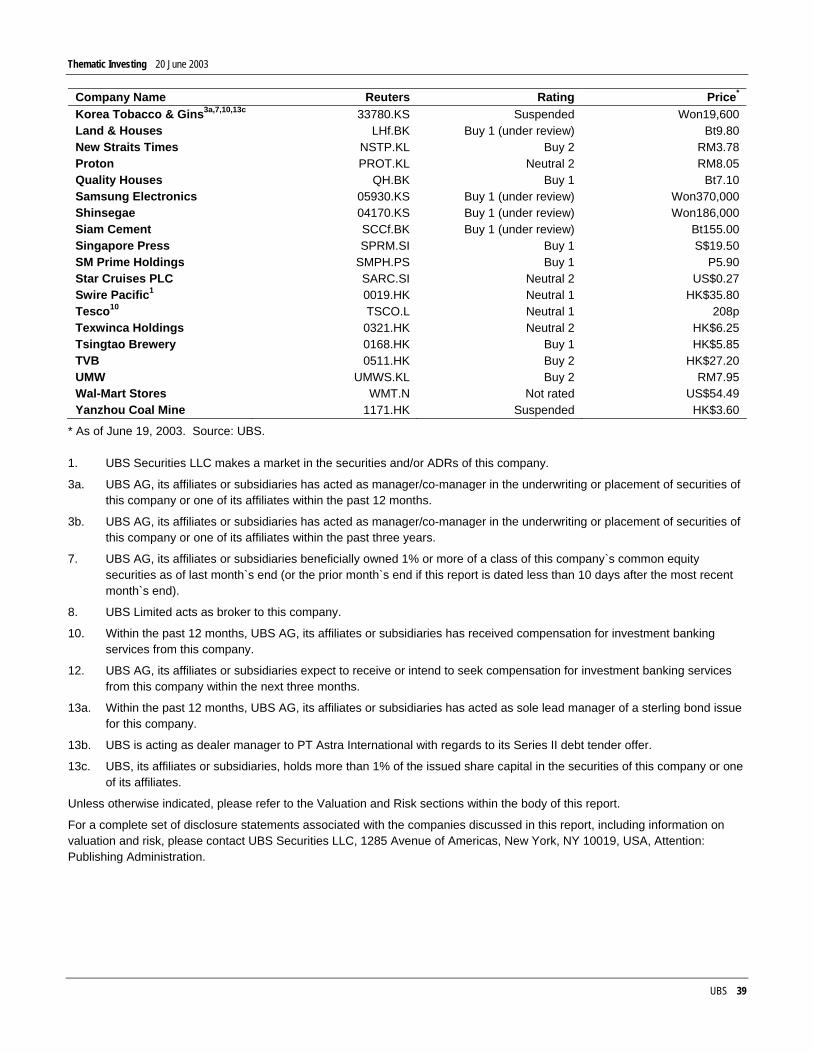
Company Name Reuters Rating Price* Korea Tobacco & Gins3a,7,10,13c 33780.KS Suspended Won19,600 Land & Houses LHf.BK Buy 1 (under review) Bt9.80 New Straits Times NSTP.KL Buy 2 RM3.78 Proton PROT.KL Neutral 2 RM8.05 Quality Houses QH.BK Buy 1 Bt7.10 Samsung Electronics 05930.KS Buy 1 (under review) Won370,000 Shinsegae 04170.KS Buy 1 (under review) Won186,000 Siam Cement SCCf.BK Buy 1 (under review) Bt155.00 Singapore Press SPRM.SI Buy 1 S$19.50 SM Prime Holdings SMPH.PS Buy 1 P5.90 Star Cruises PLC SARC.SI Neutral 2 US$0.27 Swire Pacific1 0019.HK Neutral 1 HK$35.80 Tesco10 TSCO.L Neutral 1 208p Texwinca Holdings 0321.HK Neutral 2 HK$6.25 Tsingtao Brewery 0168.HK Buy 1 HK$5.85 TVB 0511.HK Buy 2 HK$27.20 UMW UMWS.KL Buy 2 RM7.95 Wal-Mart Stores WMT.N Not rated US$54.49 Yanzhou Coal Mine 1171.HK Suspended HK$3.60
* As of June 19, 2003. Source: UBS.
1. UBS Securities LLC makes a market in the securities and/or ADRs of this company.
3a. UBS AG, its affiliates or subsidiaries has acted as manager/co-manager in the underwriting or placement of securities of this company or one of its affiliates within the past 12 months.
3b. UBS AG, its affiliates or subsidiaries has acted as manager/co-manager in the underwriting or placement of securities of this company or one of its affiliates within the past three years.
7. UBS AG, its affiliates or subsidiaries beneficially owned 1% or more of a class of this company`s common equity securities as of last month`s end (or the prior month`s end if this report is dated less than 10 days after the most recent month`s end).
8. UBS Limited acts as broker to this company.
10. Within the past 12 months, UBS AG, its affiliates or subsidiaries has received compensation for investment banking services from this company.
12. UBS AG, its affiliates or subsidiaries expect to receive or intend to seek compensation for investment banking services from this company within the next three months.
13a. Within the past 12 months, UBS AG, its affiliates or subsidiaries has acted as sole lead manager of a sterling bond issue for this company.
13b. UBS is acting as dealer manager to PT Astra International with regards to its Series II debt tender offer.
13c. UBS, its affiliates or subsidiaries, holds more than 1% of the issued share capital in the securities of this company or one of its affiliates.
Unless otherwise indicated, please refer to the Valuation and Risk sections within the body of this report.
For a complete set of disclosure statements associated with the companies discussed in this report, including information on valuation and risk, please contact UBS Securities LLC, 1285 Avenue of Americas, New York, NY 10019, USA, Attention: Publishing Administration.
Thematic Investing 20 June 2003
UBS 40
This report was produced by: UBS Securities LLC Head office: UBS Limited, 1 Finsbury Avenue, London, EC2M 2PP, UK Phone: +44-20-7567 8000 Local office: UBS Securities LLC, 1285 Avenue of the Americas, New York, NY 10019 Phone: +1-212-713 2000 This report has been prepared by UBS AG or an affiliate thereof ("UBS"). In certain countries UBS AG is referred to as UBS SA. This report is for distribution only under such circumstances as may be permitted by applicable law. It has no regard to the specific investment objectives, financial situation or particular needs of any specific recipient. It is published solely for informational purposes and is not to be construed as a solicitation or an offer to buy or sell any securities or related financial instruments. No representation or warranty, either express or implied, is provided in relation to the accuracy, completeness or reliability of the information contained herein, except with respect to information concerning UBS AG, its subsidiaries and affiliates, nor is it intended to be a complete statement or summary of the securities, markets or developments referred to in the report. The report should not be regarded by recipients as a substitute for the exercise of their own judgement. Any opinions expressed in this report are subject to change without notice and may differ or be contrary to opinions expressed by other business areas or groups of UBS as a result of using different assumptions and criteria. UBS is under no obligation to update or keep current the information contained herein. UBS, its directors, officers and employees (excluding the US broker-dealer unless specifically disclosed under required disclosures) or clients may have or have had interests or long or short positions in the securities or other financial instruments referred to herein, and may at any time make purchases and/or sales in them as principal or agent. UBS (excluding the US broker-dealer unless specifically disclosed under Required Disclosures) may act or have acted as market-maker in the securities or other financial instruments discussed in this report. Furthermore, UBS may have or have had a relationship with or may provide or has provided investment banking, capital markets and/or other financial services to the relevant companies. Employees of UBS may serve or have served as officers or directors of the relevant companies. UBS may rely on information barriers, such as "Chinese Walls," to control the flow of information contained in one or more areas within UBS, into other areas, units, groups or affiliates of UBS. The securities described herein may not be eligible for sale in all jurisdictions or to certain categories of investors. Options, derivative products and futures are not suitable for all investors, and trading in these instruments is considered risky. Past performance is not necessarily indicative of future results. Foreign currency rates of exchange may adversely affect the value, price or income of any security or related instrument mentioned in this report. For investment advice, trade execution or other enquiries, clients should contact their local sales representative. Neither UBS nor any of its affiliates, nor any of UBS' or any of its affiliates, directors, employees or agents accepts any liability for any loss or damage arising out of the use of all or any part of this report. Additional information will be made available upon request. United Kingdom and rest of Europe: Except as otherwise specified herein, this material is communicated by UBS Limited, a subsidiary of UBS AG, to persons who are market counterparties or intermediate customers (as detailed in the FSA Rules) and is only available to such persons. The information contained herein does not apply to, and should not be relied upon by, private customers. Switzerland: Distributed by UBS AG to persons who are institutional investors only. Italy: Should persons receiving this research in Italy require additional information or wish to effect transactions in the relevant securities, they should contact Giubergia UBS SIM SpA, an associate of UBS SA, in Milan. South Africa: UBS Securities South Africa (Pty) Limited (incorporating J.D. Anderson & Co.) is a member of the JSE Securities Exchange SA. United States: Distributed to US persons by either UBS Securities LLC or by UBS Financial Services Inc., subsidiaries of UBS AG; or by a group, subsidiary or affiliate of UBS AG that is not registered as a US broker-dealer (a "non-US affiliate"), to major US institutional investors only. UBS Securities LLC or UBS Financial Services Inc. accepts responsibility for the content of a report prepared by another non-US affiliate when distributed to US persons by UBS Securities LLC or UBS Financial Services Inc. All transactions by a US person in the securities mentioned in this report must be effected through UBS Securities LLC or UBS Financial Services Inc., and not through a non-US affiliate. Canada: Distributed by UBS Securities Canada Inc., a subsidiary of UBS AG and a member of the principal Canadian stock exchanges & CIPF. A statement of its financial condition and a list of its directors and senior officers will be provided upon request. Hong Kong: Distributed by UBS Securities Asia Limited. Singapore: Distributed by UBS Securities Singapore Pte. Ltd. Japan: Distributed by UBS Securities Japan Ltd to institutional investors only. Australia: Distributed by UBS Capital Markets Australia Ltd and UBS Securities Australia Ltd licensed securities dealers. New Zealand: Distributed by UBS New Zealand Ltd ©2003 UBS. All rights reserved. This report may not be reproduced or redistributed, in whole or in part, without the written permission of UBS and UBS accepts no liability whatsoever for the actions of third parties in this respect.
αβ