theme back to business - credit suisse
TRANSCRIPT
DISCLOSURE APPENDIX AT THE BACK OF THIS REPORT CONTAINS IMPORTANT DISCLOSURES, ANALYST CERTIFICATIONS, LEGAL ENTITY DISCLOSURE AND THE STATUS OF NON-US ANALYSTS. US Disclosure: Credit Suisse does and seeks to do business with companies covered in its research reports. As a result, investors should be aware that the Firm may have a conflict of interest that could affect the objectivity of this report. Investors should consider this report as only a single factor in making their investment decision.
13 July 2017 Asia Pacific/India Equity Research
Multi Industry
Tata Group The Credit Suisse Connections Series leverages our
exceptional breadth of macro and micro research to deliver
incisive cross-sector and cross-border thematic insights for
our clients.
Research Analysts
Anantha Narayan
91 22 6777 3730
Nitin Jain
91 22 6777 3851
Arnab Mitra
91 22 6777 3806
Ashish Gupta
91 22 6777 3895
Badrinath S.
91 22 6777 3698
Jatin Chawla
91 22 6777 3719
Lokesh Garg
91 22 6777 3743
Ravi Shankar
91 22 6777 3869
Sunil Tirumalai
91 22 6777 3714
THEME
Back to business
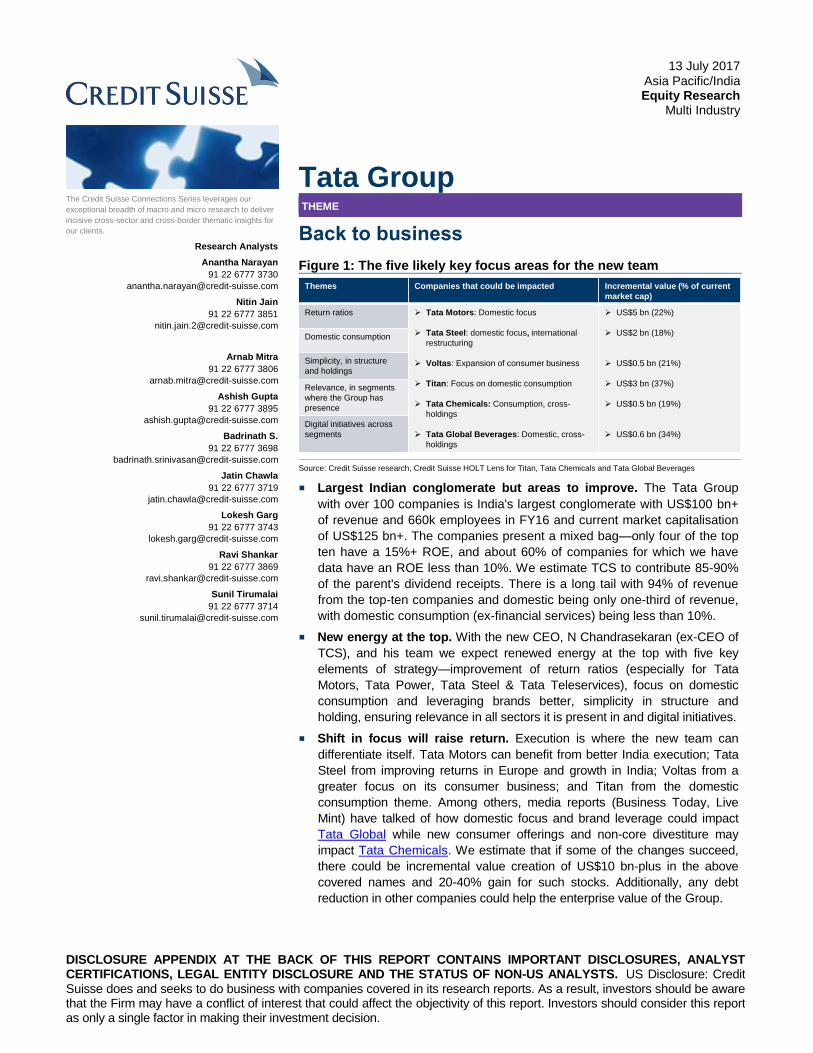
Figure 1: The five likely key focus areas for the new team
Source: Credit Suisse research, Credit Suisse HOLT Lens for Titan, Tata Chemicals and Tata Global Beverages
■ Largest Indian conglomerate but areas to improve. The Tata Group
with over 100 companies is India's largest conglomerate with US$100 bn+
of revenue and 660k employees in FY16 and current market capitalisation
of US$125 bn+. The companies present a mixed bag—only four of the top
ten have a 15%+ ROE, and about 60% of companies for which we have
data have an ROE less than 10%. We estimate TCS to contribute 85-90%
of the parent's dividend receipts. There is a long tail with 94% of revenue
from the top-ten companies and domestic being only one-third of revenue,
with domestic consumption (ex-financial services) being less than 10%.
■ New energy at the top. With the new CEO, N Chandrasekaran (ex-CEO of
TCS), and his team we expect renewed energy at the top with five key
elements of strategy—improvement of return ratios (especially for Tata
Motors, Tata Power, Tata Steel & Tata Teleservices), focus on domestic
consumption and leveraging brands better, simplicity in structure and
holding, ensuring relevance in all sectors it is present in and digital initiatives.
■ Shift in focus will raise return. Execution is where the new team can
differentiate itself. Tata Motors can benefit from better India execution; Tata
Steel from improving returns in Europe and growth in India; Voltas from a
greater focus on its consumer business; and Titan from the domestic
consumption theme. Among others, media reports (Business Today, Live
Mint) have talked of how domestic focus and brand leverage could impact
Tata Global while new consumer offerings and non-core divestiture may
impact Tata Chemicals. We estimate that if some of the changes succeed,
there could be incremental value creation of US$10 bn-plus in the above
covered names and 20-40% gain for such stocks. Additionally, any debt
reduction in other companies could help the enterprise value of the Group.
Themes Companies that could be impacted Incremental value (% of current
market cap)
Return ratios Tata Motors: Domestic focus
Tata Steel: domestic focus, international
restructuring
Voltas: Expansion of consumer business
Titan: Focus on domestic consumption
Tata Chemicals: Consumption, cross-
holdings
Tata Global Beverages: Domestic, cross-
holdings
US$5 bn (22%)
US$2 bn (18%)
US$0.5 bn (21%)
US$3 bn (37%)
US$0.5 bn (19%)
US$0.6 bn (34%)
Domestic consumption
Simplicity, in structure
and holdings
Relevance, in segments
where the Group has
presence
Digital initiatives across
segments
13 July 2017
Tata Group 2
Focus charts
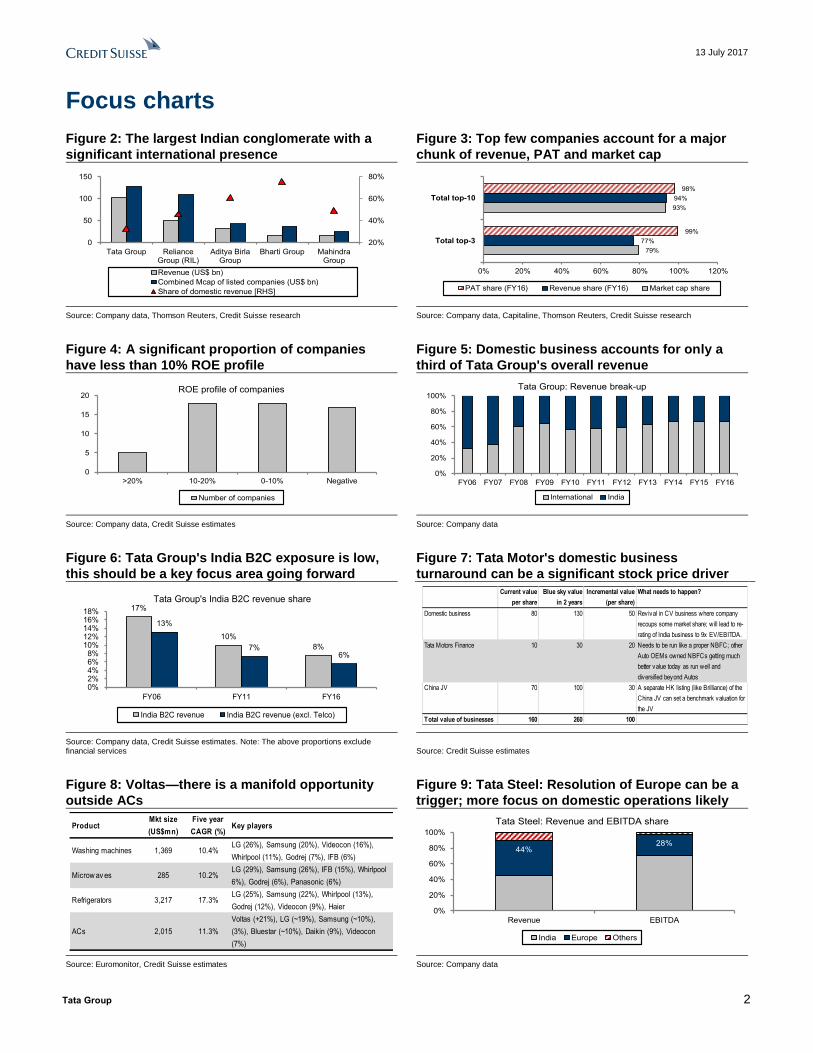
Figure 2: The largest Indian conglomerate with a
significant international presence
Figure 3: Top few companies account for a major
chunk of revenue, PAT and market cap
Source: Company data, Thomson Reuters, Credit Suisse research Source: Company data, Capitaline, Thomson Reuters, Credit Suisse research
Figure 4: A significant proportion of companies
have less than 10% ROE profile
Figure 5: Domestic business accounts for only a
third of Tata Group's overall revenue
Source: Company data, Credit Suisse estimates Source: Company data
Figure 6: Tata Group's India B2C exposure is low,
this should be a key focus area going forward
Figure 7: Tata Motor's domestic business
turnaround can be a significant stock price driver
Source: Company data, Credit Suisse estimates. Note: The above proportions exclude financial services
Source: Credit Suisse estimates
Figure 8: Voltas—there is a manifold opportunity
outside ACs
Figure 9: Tata Steel: Resolution of Europe can be a
trigger; more focus on domestic operations likely
Source: Euromonitor, Credit Suisse estimates Source: Company data
20%
40%
60%
80%
0
50
100
150
Tata Group RelianceGroup (RIL)
Aditya BirlaGroup
Bharti Group MahindraGroup
Revenue (US$ bn)
Combined Mcap of listed companies (US$ bn)
Share of domestic revenue [RHS]
79%
93%
77%
94%
99%
98%
0% 20% 40% 60% 80% 100% 120%
Total top-3
Total top-10
PAT share (FY16) Revenue share (FY16) Market cap share
0
5
10
15
20
>20% 10-20% 0-10% Negative
ROE profile of companies
Number of companies
0%
20%
40%
60%
80%
100%
FY06 FY07 FY08 FY09 FY10 FY11 FY12 FY13 FY14 FY15 FY16
Tata Group: Revenue break-up
International India
17%
10%
8%
13%
7%6%
0%2%4%6%8%
10%12%14%16%18%
FY06 FY11 FY16
Tata Group's India B2C revenue share
India B2C revenue India B2C revenue (excl. Telco)
Current value
per share
Blue sky value
in 2 years
Incremental value
(per share)
What needs to happen?
Domestic business 80 130 50 Revival in CV business where company
recoups some market share; will lead to re-
rating of India business to 9x EV/EBITDA.
Tata Motors Finance 10 30 20 Needs to be run like a proper NBFC; other
Auto OEMs owned NBFCs getting much
better value today as run well and
diversified beyond Autos
China JV 70 100 30 A separate HK listing (like Brilliance) of the
China JV can set a benchmark valuation for
the JV
Total value of businesses 160 260 100
ProductMkt size
(US$mn)
Five year
CAGR (%)Key players
Washing machines 1,369 10.4%LG (26%), Samsung (20%), Videocon (16%),
Whirlpool (11%), Godrej (7%), IFB (6%)
Microw av es 285 10.2%LG (29%), Samsung (26%), IFB (15%), Whirlpool
6%), Godrej (6%), Panasonic (6%)
Refrigerators 3,217 17.3%LG (25%), Samsung (22%), Whirlpool (13%),
Godrej (12%), Videocon (9%), Haier
ACs 2,015 11.3%
Voltas (+21%), LG (~19%), Samsung (~10%),
(3%), Bluestar (~10%), Daikin (9%), Videocon
(7%)
44%28%
0%
20%
40%
60%
80%
100%
Revenue EBITDA
Tata Steel: Revenue and EBITDA share
India Europe Others

13 July 2017
Tata Group 3
Back to business
Largest Indian conglomerate but areas to improve Started in 1868, the Tata Group is India's largest conglomerate—FY16 revenue was over
US$100 bn, headcount over 660k and current market capitalisation is over US$125 bn. It
has about 100 operating companies.
As is to be expected in such a large conglomerate, there are many areas for improvement.
Only four companies in the top ten—TCS, Tata Motors, Voltas and Titan—have an ROE in
excess of 15%. ROE is less than 10% for about 60%+ of the companies for which we have
data. TCS is the single largest source of cash for the Group—it contributed 65% of Group
PAT and we estimate that its dividends accounted for 85-90% of the total inflow to the
parent. There is a long tail of companies as well—the top-ten companies (including
subsidiaries) account for 92% of the Group's revenue and 98% of PAT. Domestic B2C, a
strong growth area, contributes less than 10% of revenue (ex-financials).
The Group market capitalisation has been nearly flat over the last year, up 11% over three
years, underperforming the Indian market. Large companies—TCS, Tata Motors and Tata
Steel—have underperformed for over three years as have some smaller ones.
New energy at the top N Chandrasekaran (Chandra) took over as Chairman in January 2017 after a few months
of turmoil following his predecessor's dismissal. He is the first Chairman from outside the
shareholding families and has a stellar track record of leading TCS for seven years. He,
with his new team, can provide renewed energy at the top, in our view.
Based on our understanding of the Group, individual companies, and comments made in the
press (Business Standard, etc), we believe new management's strategy will hinge on five
key objectives: (1) Improvement of return ratios, especially for larger companies; (2) Focus
on domestic consumption. This would likely be for consumer businesses (Global, Chemicals,
Voltas) and financial services (Capital, insurance); (3) Simplification of the structure and
holding, including consolidating similar businesses in different entities and simplification of
intra-group holdings; (4) Relevance—the Group has sub-optimal presence in some large
segments such as financial services, retail/consumer and aviation. It would either want to
scale up or exit some of these. It also has presence in small segments through companies
whose sizes are not significant; and (5) Given the Group's presence in technology and
Chandra's background, it may step up its digital initiatives across its various businesses.
Shift in focus will raise returns Given the above broad themes, we believe companies such as Tata Motors, Tata Steel,
Voltas and Titan could benefit. Tata Chemicals and Tata Global Beverages could also be
impacted by the above strategy. Tata Motors could gain from better execution in the
domestic business, Tata Steel from better returns in the European operations. Voltas can
leverage its consumer brand for new consumer products (outside AC and air coolers), and
demerger of its projects business can also make it a pure consumer play. Titan may
benefit from the Group's focus on domestic consumption. Among others, media reports
(Business Today, Live Mint) have talked of how domestic focus and brand leverage may
impact Tata Global while new consumer offerings and non-core divestiture may impact
Tata Chemicals. Tata Power and Tata Teleservices had combined debt of US$14 bn.
We estimate that if some of the changes succeed, there could be incremental value
creation of US$10 bn-plus in the above covered names and between 20% and 40% for
individual covered stocks. Additionally, any debt reduction in other companies could help
the enterprise value of the Group.
We rate Tata Motors, Tata Steel, Titan, Voltas OUTPERFORM; we are NEUTRAL on TCS.
US$100 bn revenue in FY16, 660k employees, about 100 companies, US$125 bn market cap
Only four of the top ten have a 15%+ ROE,
~60% of companies for which we have data
have ROE <10%
New management at the top can bring renewed energy
We believe management will have
five key objectives
Tata Motors, Tata Steel, Voltas and Titan are likely gainers in our
coverage universe

13 July 2017
Tata Group 4
Table of contents
Focus charts 2
Back to business 3
Largest Indian conglomerate but areas to improve .................................................. 3
New energy at the top .............................................................................................. 3
Shift in focus will raise returns .................................................................................. 3
Largest Indian conglomerate but areas to improve 6
The largest Indian conglomerate with a high global exposure ................................. 6
Delving deeper into the Group's financials ............................................................. 10
Tata Group underperformed the market in the last one and three years, led by TCS
and Tata Motors ..................................................................................................... 17
Renewed energy at the top 19
Five key mantras .................................................................................................... 19
#1 Focus on the big guns ....................................................................................... 20
TCS: Little to be done ............................................................................................. 20
Tata Steel: Focus on India, addressing the pension issue .................................... 23
Tata Motors: India needs to be fixed ...................................................................... 26
Tata Power: Mundra power plant has weighed on profitability .............................. 30
Tata Teleservices: Challenges in the telecom industry .......................................... 32
#2 Domestic business and B2C may garner higher investment share .................. 34
#3 Some strong consumer brands can be leveraged better .................................. 35
#4 Some important segments need to scale up ..................................................... 37
#5 Restructuring of Group companies and their divisions can add value .............. 42
#6 Simplification of the cross-holding structure ...................................................... 44
#7 Sub-scale operations: Are they really needed? ................................................ 45
#8 Divestments may be value accretive for few companies .................................. 46
#9 Selective M&A approach in some businesses .................................................. 47
#10 Culture ............................................................................................................. 48
Shift in focus will raise returns 49
Tata Motors: Domestic business turnaround can offer upside ............................... 49
Tata Steel: The European business turnaround can improve returns significantly 50
Voltas: Consumer business expansion, demerger of projects can make Voltas a
good consumer play ............................................................................................... 51
Scenario analysis based on HOLT ......................................................................... 52
Overall Group financials likely to improve over the next two years ........................ 53
Tata Motors Ltd. (TAMO.BO) 54

13 July 2017
Tata Group 5
Tata Steel Ltd (TISC.BO / TATA IN) 56
Titan Company Ltd (TITN.BO) 58
Voltas (VOLT.BO / VOLT IN) 60
Tata Consultancy Services (TCS.BO / TCS IN) 62
Tata Power (NOT COVERED) 64
Tata Communications (NOT COVERED) 65
Tata Chemicals (NOT COVERED) 66
Indian Hotels (NOT COVERED) 67
Tata Global Beverages (NOT COVERED) 68
Trent Ltd (NOT COVERED) 69
Tata AIA Life Insurance (Not Listed) 70
Appendix: HOLT Analysis 71
13 July 2017
Tata Group 6
Largest Indian conglomerate but areas to improve Started in 1868, the Tata Group had a total revenue of over US$100 bn in FY16 and an
employee base of over 660,000, with presence in several sectors of the Indian economy.
While the Group has close to 100 operating companies (including subsidiaries), the top-
ten and top-20 companies (by revenue, including subsidiaries) of the Group account for
94% and 99% of Group revenue, 98% and 99% of Group PAT and 94% and 99% of the
Group's gross fixed assets (excluding goodwill and intangibles), respectively.
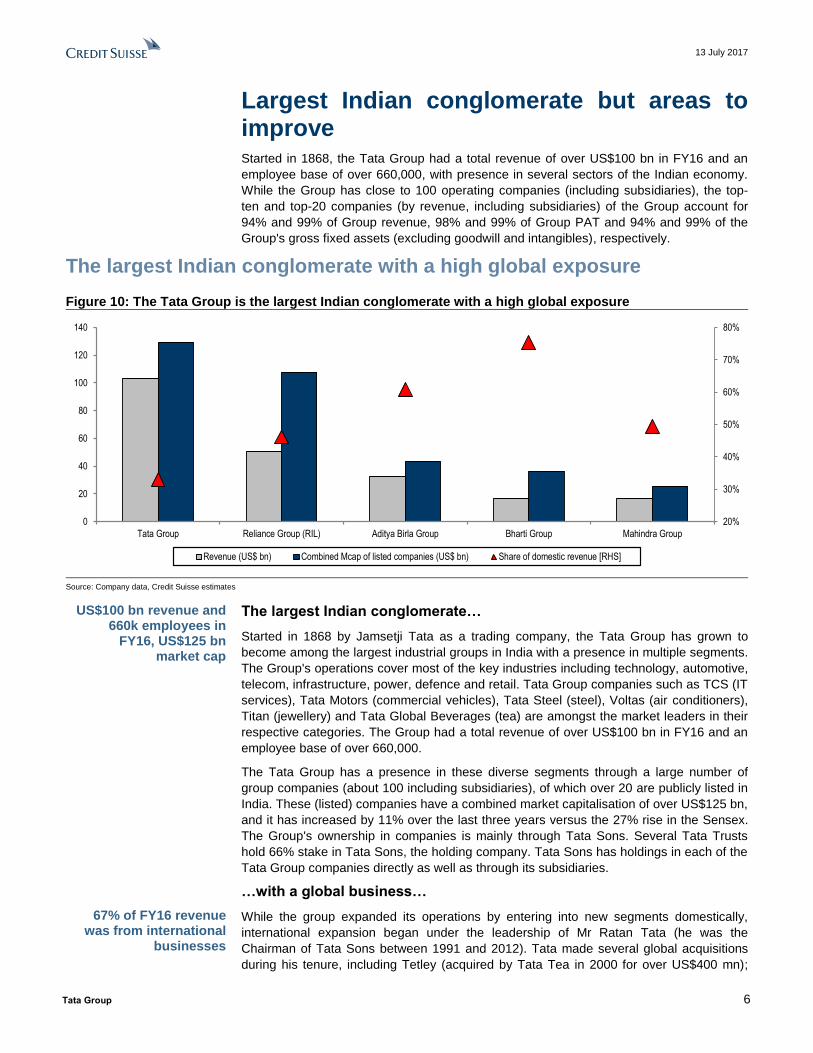
The largest Indian conglomerate with a high global exposure
Figure 10: The Tata Group is the largest Indian conglomerate with a high global exposure
Source: Company data, Credit Suisse estimates
The largest Indian conglomerate…
Started in 1868 by Jamsetji Tata as a trading company, the Tata Group has grown to
become among the largest industrial groups in India with a presence in multiple segments.
The Group's operations cover most of the key industries including technology, automotive,
telecom, infrastructure, power, defence and retail. Tata Group companies such as TCS (IT
services), Tata Motors (commercial vehicles), Tata Steel (steel), Voltas (air conditioners),
Titan (jewellery) and Tata Global Beverages (tea) are amongst the market leaders in their
respective categories. The Group had a total revenue of over US$100 bn in FY16 and an
employee base of over 660,000.
The Tata Group has a presence in these diverse segments through a large number of
group companies (about 100 including subsidiaries), of which over 20 are publicly listed in
India. These (listed) companies have a combined market capitalisation of over US$125 bn,
and it has increased by 11% over the last three years versus the 27% rise in the Sensex.
The Group's ownership in companies is mainly through Tata Sons. Several Tata Trusts
hold 66% stake in Tata Sons, the holding company. Tata Sons has holdings in each of the
Tata Group companies directly as well as through its subsidiaries.
…with a global business…
While the group expanded its operations by entering into new segments domestically,
international expansion began under the leadership of Mr Ratan Tata (he was the
Chairman of Tata Sons between 1991 and 2012). Tata made several global acquisitions
during his tenure, including Tetley (acquired by Tata Tea in 2000 for over US$400 mn);
20%
30%
40%
50%
60%
70%
80%
0
20
40
60
80
100
120
140
Tata Group Reliance Group (RIL) Aditya Birla Group Bharti Group Mahindra Group
Revenue (US$ bn) Combined Mcap of listed companies (US$ bn) Share of domestic revenue [RHS]
US$100 bn revenue and 660k employees in
FY16, US$125 bn market cap
67% of FY16 revenue was from international
businesses

13 July 2017
Tata Group 7
Glaceau (30% stake acquired by Tata Tea in 2006 for over US$670 mn, though sold later);
Corus (acquired by Tata Steel in 2006 for over US$8 bn); and Jaguar Land Rover
(acquired in 2008 for about US$2.3 bn). Besides these, the IT services business, TCS,
was growing at a brisk pace, further expanding the Tata Group's global revenue base.
About 67% of the Group's revenue came from international businesses in FY16.
…and significant focus on corporate social responsibility
The Group has had a significant focus on ethics and corporate social responsibility (CSR)
since the very beginning. For example, Tata Steel introduced eight-hour working days well
before it became a statutory requirement in most of the Western world, and it also started
the provident fund scheme in 1920, much before the government regulations came (in
1952). Many of the companies in the group continue to be perceived as better places to
work by employees.
A professional leader for the first time at the helm
Historically, the Tata Group has been led by family members of the owners of Tata Sons
(66% owned by Tata Trusts and 18% owned by Shapoorji Pallonji). The first five Chairmen
were from the Tata family (Mr. Jamsetji Tata, followed by Mr. Dorab Tata, Mr. Saklatwala,
Mr. JRD Tata and Mr. Ratan Tata), and the last Chairman (Mr. Cyrus Mistry) was from the
Shapoorji Pallonji family. Mr. N Chandrasekaran (appointed as the Chairman effective
January 2017) is the first professional Chairman of the Group and has a distinguished
track record of leading the most valuable (by market capitalisation) company of the group
(TCS) for seven years.
Figure 11: Tata Group—overview of companies in the manufacturing domain
Source: Company data, MCA, Capitaline,Thomson Reuters, Credit Suisse
Auto
Others
Steel
Auto
Didn't include
Others
Others
Steel
Steel
Didn't include
Didn't include
Steel
Didn't include
Steel
Steel
Steel
Manufacturing
Auto and auto components Steel and Steel products Others
Tata Pigments(100% subsidiary of Tata Steel)
Pigments, paintsRev (FY16): Rs 1.1 bnPAT (FY16): Rs 0.1 bn
Net debt (FY16): Rs -0.1 bnROE (FY16): 15%
Tata MotorsPassenger & commercial vehicles
Mcap : US$ 20,183 mnRev (FY17): Rs 2,745 bnPAT (FY17): Rs 102 bn
Net debt (FY17): Rs 425 bnROE (FY17): 15%
Jaguar Land Rover(100% subsidiary of Tata Motors)
Passanger vehiclesRev (FY17): Rs 2.1 tn
PAT (FY17): Rs 105 bn
Net debt (FY17): Rs -170 bnROE (FY17): NA
Tata Daewoo Comm Vehicle(100% subsidiary of Tata Motors)
M&HCV, S KoreaRev: Rs 48 bnPAT: Rs 3 bn
Net debt: NAROE: 15%
Tata Autocomps Limited(26%, Tata Motors)Auto components
Rev (FY16): Rs 8.3 bnPAT (FY16): Rs 0.1 bn
Net debt (FY16): Rs -2.9 bnROE (FY16): 2%
Tata Cummins(50% JV, Tata Motors)
Auto componentsRev (FY15): Rs 25 bnPAT (FY15): Rs 0.5 bn
Net debt (FY15): Rs 3.5 bnROE (FY15): 7%
Tata Metaliks (50% subs of Tata
Steel)Pig and ductile iron pipes
Mcap: US$ 285 mnRev (FY17): Rs 14 bn
PAT (FY17): Rs 1.2 bnNet debt (FY17): Rs 3.1 bn
ROE (FY17): 58% *
Tata SteelDiversified steel producer
Mcap: US$ 7,680 mnRev (FY17): Rs 1,174 bn
PAT (FY17): Rs 38 bn
Net debt (FY17): Rs 724 bnROE (FY17): 9%
Indian Steel and Wire Products
(95% subsidiary of Tata Steel)Wire and steel roll
Rev: Rs 2.3 bn
PAT: Rs 0.1 bnNet debt: Rs 0.2 bn
ROE: 10%
Tata Sponge Iron (55% subsidiary of Tata Steel)
Sponge ironMcap: US$ 197 mn
Rev (FY17): Rs 6.2 bn
PAT (FY17): Rs 0.6 bnNet debt (FY17): Rs -5.7 bn
ROE (FY17): 7%
TRL Krosaki Refractories(27%, Tata Steel)
RefractoriesRev (FY16): Rs 9.9 bnPAT (FY16): Rs 0.0 bn
Net debt (FY16): Rs 1.8 bnROE (FY16): 1%
Tinplate Company of India(75% subsidiary of Tata Steel)
TinplateRev (FY16): Rs 8.3 bnPAT (FY16): Rs 0.7 bn
Net debt (FY16): Rs -0.1 bnROE (FY16): 13%
JAMIPOL(40%, Tata Steel)
De-sulphurising compounds for steel
Rev (FY16): Rs 2.6 bn
PAT (FY16): Rs 0.2 bnNet debt (FY16): Rs -0.5 bn
ROE (FY16): 19%
Tata BlueScope Steel(50% JV, Tata Steel)
Coated steelRev (FY16): Rs 15.1 bnPAT (FY16): Rs 0.3 bn
Net debt (FY16): Rs 8.2 bnROE (FY16): 12%
Jamshedpur Continuous Annealing and Processing
(JV, Tata Steel)Annealed products
Rev (FY16): Rs 1.9 bn
PAT (FY16): Rs -2.2 bnNet debt (FY16): Rs 15.6 bn
ROE (FY16): NA
Rallis IndiaAgro chemical
Mcap (FY17): US$ 748 mnRev (FY17): Rs 17.8 bn
PAT (FY17): Rs 3 bn
Net debt (FY17): Rs -1.9 bnROE (FY17): 30%
Tata ChemicalsChemicals, pulses, saltMcap: US$ 2,442 mn
Rev (FY17): Rs 133 bnPAT (FY17): Rs 9.9 bn
Net debt (FY17): Rs 32.2 bnROE (FY17): 14%
Tata Hitachi Construction(40%, Tata Motors)Heavy equipments
Rev (FY16): Rs 22.5 bnPAT (FY16): Rs -3.4 bn
Net debt (FY16): Rs 8 bnROE (FY16): NA
Tata Petrodyne(100%, Tata Sons)
Upstream oil and gasRev (FY15): Rs 1.1 bnPAT (FY15): Rs 0.5 bn
Net debt (FY15): Rs -2.9 bnROE (FY15): 14%
Advinus Therapeutic(Tata Group)
Contract research - pharmaRev (FY16): Rs 1.6 bnPAT (FY15): Rs 0.1 bn
Net debt (FY15): Rs 3.2 bnROE: NA
Tata Ceramics(57%, Tata Power)
TablewareRev (FY15): Rs 0.5 bnPAT (FY15): Rs 0 bn
Net debt (FY15): Rs 0.1 bnROE: NA
Tayo Rolls (55% subs of Tata
Steel)Cast anf forged steel rolls
Mcap: US$ 10 mnRev (FY16): Rs 1.3 bn
PAT (FY16): Rs -1.6 bnNet debt (FY16): Rs 1.2 bn
ROE : NA
N Chandrasekaran is the first "professional" Chairman of the Group

13 July 2017
Tata Group 8
Figure 12: Tata Group—overview of companies in IT, telecom and services domains
Note: ^ Taken from FY17 BSE filing * Business Standard. Source: Company data, MCA, Capitaline,Thomson Reuters, Credit Suisse research
Figure 13: Tata Group—overview of companies in power, engineering and defence domains
Source: Company data, MCA, Capitaline,Thomson Reuters, Credit Suisse research
Not included
Revenue
PBT
IT, telecom and services
Other servicesIT/Engg services/BPO/consulting Telecom and allied
Tata International(Tata Sons and Industries)
TradingRev (FY16): Rs 130.5 bnPAT (FY16): Rs -0.5 bn
Net debt (FY16): Rs 18.4 bnROE (FY16): NA
Tata Elxsi Engineering services, VFX
Mcap: US$ 744 mnRev (FY17): Rs 12.3 bnPAT (FY17): Rs 1.7 bn
Net debt (FY17): Rs -2.5 bnROE (FY17): 37%
Tata Consultancy ServicesDiversified IT servicesMcap: US$ 73,018 mn
Rev (FY17): Rs 1,180 bnPAT (FY17): Rs 263 bn
Net debt (FY17): Rs -495 bnROE (FY17): 33%
Tata Business SupportServices
(100% subsidiary of Tata Sons)BPO
Rev (FY15): Rs 6 bn
PAT (FY15): Rs 0.2 bnNet debt (FY15): Rs 0.6 bn
ROE (FY15): 15%
Tata Strategic Management(Tata Industries)
Management consultingRev: NAPAT: NA
Net debt: NAROE: NA
Tata Technologies(72% subsidiary of Tata Motors)
Engineering servicesRev (FY16): Rs 10.8 bnPAT (FY16): Rs 2.2 bn
Net debt (FY16): Rs -0.5 bnROE (FY16): 37%
Indian HotelsHotels
Mcap (FY17): US$ 1,959 mnRev (FY17): Rs 40 bn
PAT (FY17): Rs -0.6 bn
Net debt (FY17): Rs 24.7 bnROE (FY17): NA
Taj Air(Associate, Tata Sons)
Aircraft charterRev (FY15): Rs 0.7 bnPAT (FY15): Rs -0.2 bn
Net debt (FY15): Rs -0.7 bnROE (FY15): NA
TKM Global Logistics(100% subsidiary, Tata Steel)
Logistics and supply chainRev (FY15): Rs 0.6 bnPAT (FY15): Rs 0.0 bn
Net debt (FY15): Rs 0.0 bnROE (FY15): 4%
Tata Interactive Learning(Division of Tata Industries)
Interactive learningRev: NAPAT: NA
Net debt: NAROE: NA
Tata Class Edge(Division of Tata Industries)
Smart classRev: NAPAT: NA
Net debt: NAROE: NA
Tata Teleservices Maharashtra(63%, collectively held by several
Tata Group companies)Mcap: US$ 195 mn
Rev (FY17): Rs 27 bn
PAT (FY17): Rs -24 bnNet debt (FY17): Rs 136 bn ^
ROE (FY17): NA
Tata Teleservices(59%, collectively held by several
Tata Group companies)Telecom
Rev (FY16): Rs 143 bn
PAT (FY16): Rs -30 bnNet debt (FY16): Rs 336 bn
ROE (FY16): NA
Tata CommunicationsTelecom solutions and network
servicesMcap: US$ 3,330 mn
Rev (FY17): Rs 176 bn
PAT (FY17): Rs -7.7 bnNet debt (FY17): Rs 66 bn
ROE (FY17): NA
NelcoVSAT, security, managed services
Mcap: US$ 29 mnRev (FY17): Rs 1.4 bnPAT (FY17): Rs 0.1 bn
Net debt (FY17): Rs 0.6 bnROE (FY17): 33%
Tata SIA Airlines (Vistara)(51% JV, Tata Industries)
AirlineRev (FY16): Rs.7.1 bn*PAT (FY16): Rs.-4 bn*
Net debt: NAROE: NA
mjunction services50% subsidiary of Tata Steel
B2B ecommerce for steelRev : Rs.1.3 bnPAT : Rs.0.3 bn
Net debt : Rs.-1.6 bnROE: 19%
Air Asia(40% JV, Tata Industries)
AirlineRev (CY16): Rs.8.3 bn
PBT (CY16): Rs.-1.4 bn
Net debt: NAROE: NA
Tata SkyJV, Tata Sons
D2H television servicesRev (FY16): Rs 44.7 bnPAT (FY16): Rs 0.8 bn
Net debt (FY16): Rs 20.8 bnROE (FY16): NA
Housing/others
Power, engineering, defense, others
Power Engineering/infra Defence
Tata Advanced Materials(100% subsidiary of Tata Sons)
Advanced composites and armoured products
Rev (FY16): Rs 1.3 bn
PAT (FY16): Rs -0.3 bnNet debt (FY16): Rs 1.3 bn
ROE (FY16): NA
Tata PowerIntegrated power company
Mcap: US$ 3,261 mnRev (FY17): Rs 279 bnPAT (FY17): Rs 14 bn
Net debt (FY17): Rs 468 bnROE (FY17): 11%
Tata Advanced Systems(100% subsidiary of Tata Sons)
National security and defenceRev (FY16): Rs 5.7 bnPAT (FY16): Rs 0.2 bn
Net debt (FY16): Rs 0.3 bnROE (FY16): 5%
Tata Power Trading100% subsidiary of Tata Power
Power tradingRev (FY16): Rs 59.4 bnPAT (FY16): Rs 0.2 bn
Net debt (FY16): NAROE (FY16): NA
TAL Manufacturing Solutions100% subsidiary of Tata Motors
DefenceRev (FY16): Rs 2.1 bnPAT (FY16): Rs -0.1 bn
Net debt (FY16): Rs 0.8 bnROE (FY16): NA
Powerlinks TransmissionJV, Tata Power
Power transmissionRev: Rs 2.3
PAT: 1.1
Net debt: 1.6ROE (FY16): 20%
Tata Realty and Infrastructure100% subsidiary of Tata SonsReal estate and infrastructure
Rev (FY16): Rs 0.6 bnPAT (FY16): Rs -0.1 bn
Net debt (FY16): Rs 7.8 bnROE (FY16): NA
Tata Industrial Services100% subsidiary of Tata Industries
Programme management for defence and aerospace
Rev: NA
PAT: NANet debt: NA
ROE: NA
Tata Power Solar100% subsidiary of Tata Power
Solar energyRev (FY16): Rs 14.9 bnPAT (FY16): Rs -0.3 bn
Net debt (FY16): NAROE (FY16): NA
Tata ProjectsTata Sons
InfrastructureRev (FY16): Rs 42.3 bnPAT (FY16): Rs 0.7 bn
Net debt (FY16): Rs 4.0 bnROE (FY16): 7%
Tata Consulting Engineers100% subsidiary of Tata Sons
Project engineeringRev (FY16): Rs 5.0 bnPAT (FY16): Rs 0.1 bn
Net debt (FY16): Rs 0.6 bnROE (FY16): 3%
TRFMaterial handling equipments
Mcap: US$ 40 mnRev (FY17): Rs 10.1 bnPAT (FY17): Rs -0.2 bn
Net debt (FY17): Rs 4.3 bnROE (FY17): NA
JUSCO(100% Subsidiary of Tata Sons)
Urban infrastructureRev: Rs NA
PAT: NA
Net debt: NAROE: NA
Tata Housing Development100% subsidiary of Tata Sons
HousingRev (FY15): Rs 5.8 bnPAT (FY15): Rs 0.2 bn
Net debt (FY16): Rs 17.3 bnROE (FY16): 1%
VoltasAC, engineering solutions
Mcap: US$ 2,532 mnRev (FY17): Rs 60.4 bnPAT (FY17): Rs 5.0 bn
Net debt (FY17): Rs -3.6 bnROE (FY17): 17%

13 July 2017
Tata Group 9
Figure 14: Tata Group—overview of companies in retail and financial services domains
Source: Company data, MCA, Capitaline,Thomson Reuters, Credit Suisse research
Figure 15: Tata Group—holding structure of the key companies
* Investing vehicle for the four Tata Group Companies as its principals viz. Tata Sons, Tata Power, Tata Iron & Steel Company and Tata Industries. Tata Power has 30% stake in Panatone Finvest. Source: BSE, Company data, Credit Suisse research
Retail, consumer, financial services
Financial servicesRetail/consumer
Tata Capital(Subsidiary of Tata Sons)
Diversified financial servicesRev (FY16): Rs 21.8 bnPAT (FY16): Rs 4.1 bn
Net debt (FY16): Rs 333 bnROE (FY16): 8%
Trent Fashion retail chainMcap: US$ 744 mn
Rev (FY17): Rs 18.3 bnPAT (FY17): Rs 0.8 bn
Net debt (FY17): Rs 1.6 bnROE (FY17): 6%
Titan CompanyWatches, jewellery
Mcap: US$ 7,185 mnRev (FY17): Rs 131 bnPAT (FY17): Rs 7 bn
Net debt (FY17): Rs -12 bnROE (FY17): 18%
Tata Coffee (57% sub of Tata
Global Beverages)Coffee producer and exporter
Mcap: US$ 376 mnRev (FY17): Rs 16 bn
PAT (FY17): Rs 1.5 bnNet debt (FY17): Rs 6.2 bn
ROE (FY17): 15%
Tata Investment Corporation (TICL)
Investment companyMcap (FY17): US$ 605 mn
Rev (FY17): Rs 2.5 bn
PAT (FY17): Rs 1.9 bnNet debt (FY17): Rs 24.7 bn
ROE (FY17): 8%
Tata AIG General Insurance(JV, Tata Sons)
General insurance ventureRev (FY16): Rs 2.7 bnPAT (FY16): Rs 0.2 bn
Net debt (FY16): Rs -39 bnROE (FY16): 2%
Infiniti retail100% subsidiary of Tata Sons
Electronics retailRev (FY16): Rs 29.2 bnPAT (FY16): Rs -2 bn
Net debt (FY16): Rs 4.4 bnROE (FY16): NA
Tata Asset Management(68% Tata Sons, 32% TICL)
Asset managementRev (FY16) : Rs 1.4 bnPAT (FY16): Rs 0.1 bn
Net debt (FY16): Rs 0.0 bnROE (FY16): 0%
Tata AIA Life Insurance(JV, Tata Sons)
Life insuarance ventureRev (FY16): Rs 2.7 bnPAT (FY16): Rs 0.6 bn
Net debt (FY16): Rs -20 bnROE (FY16): 3%
Tata Global BeveragesNon alchoholic beverages
Mcap: US$ 1,532 mnRev (FY17): Rs 68 bnPAT (FY17): Rs 3.9 bn
Net debt (FY17): Rs 0.3 bnROE (FY17): 6%
Tata Unistore (Tata CliQ)Unit of Tata IndustriesE-commerce platform
Rev: Rs NAPAT: NA
Net debt: NAROE: NA
Casa DécorJV, Tata Group
Luxury furnishingRev (FY16): Rs 0.1 bnPAT (FY16): Rs -0.1 bn
Net debt (FY16): Rs 0.1 bnROE (FY16): NA
Tata Motor Finance(100% Subsidiary of Tata Motors)
Vehicle financingRev (FY16): Rs 12.9 bnPAT (FY16): Rs 1.0 bn
Net debt (FY16): Rs 130 bnROE (FY16): 3%
31.6
Tata Sons Tata Industries
Promoter entities
Tata Trusts66%
Shapoorji Pallonji: ~18%
Tata Steel
Tata Motors
Tata
Communication
Tata Elxsi
Tata Tele
Tata Tele
(Maharashtra)
Tata Global
Beverages
Tata Coffee
Titan
Trent
Rallis
Tata Chemical
Tata Power
Voltas
Indian Hotel
TCS
Nelco
Tata Investment
Corp
73.3% 68.1%
26.6%
3% 2.4%42.2%
19.4%
4.4%
6%
50%
23.5%
4.4%7.1%
57.5%
30%
31.6%
0.4%
0.4%2.5%
0.5%
31%
1.5%
48.6%
27.7%
4.6%
20.8%
1.6%
2%
28%
1.4%
Tata Trusts: 8%
14%
4.7%Panatone
Finv est: 30% *
19.6%
7%
36.5%
36.2%5.5%
9.3%
7%
NTT Docomo: 26.5%

13 July 2017
Tata Group 10
Delving deeper into the Group's financials
The Tata Group companies are a mixed bag. While the Tata Group has close to 100
operating companies (including subsidiaries), a few of them account for a major part of the
Group's revenue, PAT and market cap. For example, the top-ten and top-20 companies
(by revenue and including subsidiaries) account for 94% and 99% of Group revenue, 98%
and 99% of Group PAT and 94% and 99% of the Group's gross fixed assets (excluding
goodwill and intangibles), respectively. Tata Steel, Tata Motors, Tata Power and Tata
Teleservices are the most significant contributors to the Group's net debt, and together,
accounted for over 90% of the Group's net debt (as per our estimates) in FY16. TCS
accounts for 85-90% of the total dividend received by the parent. About 60% of the
companies for which we have data have a ROE of less than 10%. There is a long tail of
companies within the Group which are quite small.
Financial health check of key companies
TCS has been a consistent performer for the Group—profits have been growing
consistently, cash generation has been decent and it is the most significant source of cash
for the Group (we estimate that dividends from TCS would have accounted for 85-90% of
the total dividend inflow for the Tata Group in FY16). TCS' ROE contracted over FY15-17,
but it was partly because of the cash accumulation in the balance sheet.
Tata Steel's revenue declined by Rs113 bn over FY15-17, but despite that, its profits have
increased by Rs37 bn. Net debt/EBITDA has come down from 8.8x in FY16 to 4.3x in
FY17. While it has generated positive free cash for two consecutive years, the cash
generation has been insufficient to meet the finance cost. ROE has improved, but it still
remains at single-digit levels (9% in FY17).
Tata Motors' revenue has grown over FY15-17 (incremental revenue of Rs92 bn), but
profits have declined in both FY16 and FY17 (Rs59 bn decline over FY15-17). Net
debt/EBITDA is comfortable at 1.4x. While Tata Motors' free cash generation has been
slightly volatile over the last three years (FY14-16), its free cash generation over the last
three years (on a cumulative basis) has been higher than the cumulative finance cost.
ROE has been declining—it has come down from 23% in FY15 to about 15% in FY17.
Tata Power had a Rs21 bn revenue increase over FY15-17 and its profits increased by
Rs12 bn. However, net debt/EBITDA remains high at 8x in FY17 (increased from 5x in
FY16). It has shown a consistent improvement in free cash generation, and in FY16, its
free cash flow was higher than the finance cost. ROE has been improving, but it is still at
the mid-single digit level.
Highly leveraged companies and the cash guzzlers
Companies such as Tata Tele, Tata Tele Maharashtra, Tata Housing and Tata
International have high leverage, with a very high net debt/EBITDA—11x (FY16), 21x
(FY17, 13x in FY16), 63x (FY16), and 43x (FY16), respectively. Tata Tele Maharashtra's
leverage increased significantly in FY17. Companies such as Tata Housing, Infiniti Retail
(Croma) and Trent have been consistently generating negative free cash flows based on
historical data. Tata International and Tata Projects' cash flows showed an improving trend
over FY14-16; however, they were still generating negative free cash in FY16.
A long tail
There are several companies in the Group that are very small in the context of Tata
Group's overall size. Tata Petrodyne and Tata Realty Infrastructure have high asset
intensity and low profitability based on FY16 financials. Similarly, Tata Pigments, Tata
Ceramics, Tata Décor and Tata UniStore (e-commerce) are small players in the industry
they operate in based on reported revenue in FY16.
About 60% of the companies for which we have data have an ROE of less than 10%

13 July 2017
Tata Group 11
Concentration with a few companies
While the Tata Group has close to 100 operating companies, including subsidiaries, a
handful account for a large proportion of the aggregate revenue, PAT and market
capitalisation. For example, the three largest companies of the Group—TCS, Tata Motors
and Tata Steel account for 56%, 16% and 7% of the Group market cap, 17%/43%/17% of
the Group revenue and 63%/34%/2% of the Group PAT, respectively. Together, these
three companies account for 79% of the Group market capitalisation, 77% of the Group
revenue and 100% of the Group PAT (some of the other companies are loss making). If
we go down a level further, the top-ten companies (by revenue and inclusive of
subsidiaries) account for 93% of the Group’s market capitalisation, 94% of its revenue and
98% of PAT.
Figure 16: High level of concentration
Source: Company data, MCA, Capitaline, Credit Suisse research
Improvement in profitability for Tata Steel, consistent performance for TCS, deterioration for Tata Motors
Among the top companies of the Tata Group, there has been divergence in revenue and
PAT performance over the last two years. For example, while Tata Motors has grown its
revenue over FY15-17 (incremental revenue of over Rs92 bn), the profits have declined
for both FY16 and FY17 (Rs59 bn decline over FY15-17). On the other hand, Tata Steel
1%
6%
2%
3%
3%
6%
57%
16%
1%
2%
2%
2%
2%
3%
5%
17%
17%
43%
0%
2%
0%
-8%
2%
1%
2%
2%
63%
34%
-20% -10% 0% 10% 20% 30% 40% 50% 60% 70%
Tata Global Beverages
Titan Company
Tata International
Tata Teleservices
Tata Chemicals
Tata communications
Tata Power
Tata Steel
TCS
Tata Motors
PAT share (FY16) Revenue share (FY16) Market cap share
79%
93%
77%
94%
99%
98%
0% 20% 40% 60% 80% 100% 120%
Total top-3
Total top-10
PAT share (FY16) Revenue share (FY16) Market cap share
TCS, Tata Motors, Tata Steel contribute 77% of
the Group's revenue and 79% of market cap

13 July 2017
Tata Group 12
had a net revenue decline of Rs113 bn over FY15-17, but despite that, its profits have
increased by Rs37 bn. For Tata Power, revenue increased by Rs21 bn and the profits
improved by Rs13 bn over FY15-17.
TCS has been a consistent performer for the Group—its revenue has increased by over
Rs230 bn over FY15-17 and PAT has increased by Rs66 bn. Tata Communications made
losses in FY17 (Rs8 bn) from close to break-even in FY15. Tata Tele's revenue declined
by Rs9 bn and losses increased by Rs11 bn over FY15-17.
Figure 17: Change in the revenue and profits of the key companies over the last two years
Note: For FY16 change, we have considered the IGAAP numbers, while for FY17 changes, we have used Ind AS numbers. Used IFRS numbers for TCS. Source: Company data, Credit Suisse research
Net debt/EBITDA stable-to-improving for Tata Steel and Tata Motors
Tata Steel, Tata Motors, Tata Power and Tata Teleservices are the most significant
companies in terms of net debt, and the first three have accounted for over 90% of the
Group's net debt (as per reported numbers) in the past. For Tata Steel and Tata Motors,
the leverage (net debt/EBITDA) was at a comfortable level (4.3x and 1.4x, respectively, in
FY17), and indeed, it has come down from 8.8x in FY16 to 4.3x in FY17 for Tata Steel.
Tata Power, on the other hand, has witnessed an increase in leverage (it increased from
5x in FY16 to 8x in FY17). Tata Power accounts for 16-20% of the Group's net debt.
Companies such as Tata Tele, Tata Tele Maharashtra, Tata Housing and Tata
International have high leverage, with significantly higher net debt/EBITDA—11x (FY16),
21x (FY17, 13x in FY16), 63x (FY16), and 43x (FY16), respectively.
-300 -200 -100 0 100 200 300
TCS
Tata Motors
Tata Power
Titan Company
Voltas
Indian Hotels
Tata Communications
Tata Tele
Tata Chemicals
Tata Steel
Change in revenue (Rs bn)
FY15-17 FY17 FY16
-60 -40 -20 0 20 40 60 80
TCS
Tata Steel
Tata Power
Indian Hotels
Tata Chemicals
Voltas
Titan Company
Tata Tele
Tata Communications
Tata Motors
Change in PAT (Rs bn)
FY15-17 FY17 FY16

13 July 2017
Tata Group 13
Figure 18: Net debt to EBITDA stable-to-improving for Tata Steel and Tata Motors
Source: Company data, Credit Suisse research
Only four companies of the top-ten have a 15%+ ROE
Only four companies out of the top-ten companies have ROE in excess of 15%—these are
TCS (33% in FY17), Tata Motors (15%), Voltas (17%) and Titan (18%). While Tata Power
(>10%, adjusting for one-off charges) and Tata Steel (9%) have shown some improvement
in FY17, their ROE remains low. Indian Hotels and Tata Global Beverages' ROE stands at
-2% and 6%, respectively.
Among the companies that have witnessed the most significant improvement are Rallis
India and Nelco, as per reported numbers. Rallis' ROE improved from 21% in FY15 to
30% in FY17 and Nelco's from low single-digit levels to over 30% in FY17—besides
operational improvement, this was also helped by higher other income to some extent and
absence of losses from the discontinued operations, as per the reported financials.
Companies such as TCS, Tata Motors, Trent, Titan, Tata Elxsi and the insurance units
(Tata AIA and Tata AIG) witnessed a contraction in ROE. Tata Motors' ROE came down
from 23% in FY15 to 15% in FY17, and Titan's ROE contracted from 29% in FY15 to 18%
in FY17. For TCS, cash accumulation may have been one key reason.
0
10
20
30
40
50
60
70
0
100
200
300
400
500
600
700
800
Tata Steel Tata Motors Tata Power Tata Tele Tatacommunications
Tata Tele(Maharashtra)
Tata Chemicals Indian Hotels Tata Housing TataInternational
Net debt (FY16, Rs bn) Net debt (FY17, Rs bn) Net debt/EBITDA (FY16), RHS Net debt/EBITDA (FY17), RHS

13 July 2017
Tata Group 14
Figure 19: Several companies with sub-optimal ROEs
Source: Company data, Credit Suisse research
TCS remains the cash cow, cash generation improved in Tata Steel
In terms of free cash generation, TCS, being an extremely profitable company and an
asset light business, continues to be the cash cow for the Tata Group—its free cash flow
has been increasing over the last three years. Tata Power has shown a consistent
improvement in free cash generation, and in FY16, its free cash flow was higher than its
finance cost.
Tata Steel too has generated positive free cash for two consecutive years, but it has been
insufficient to meet the finance cost. Similarly, Tata Teleservices generates positive free
cash flow; however, it has not been sufficient to pay its finance costs in the past.
While Tata Motors' free cash generation has been slightly volatile over the last three years
(FY14-16), its free cash generation over the last three years (on a cumulative basis) has
been higher than the cumulative finance cost.
Companies such as Tata Housing, Infiniti Retail (Croma) and Trent have been consistently
generating negative free cash. Tata International and Tata Projects' cash flow showed an
improving trend over FY14-16; however, they were still generating negative free cash in
FY16 and also had a relatively higher leverage (and a correspondingly higher finance
cost).
18%
18%
-20% -10% 0% 10% 20% 30% 40% 50%
Tata Elxsi
TCS
Nelco
Rallis India
Titan Company
Voltas
Tata Motors
Tata Coffee
Tata Chemicals
Tata Steel
Tata Projects
Tata Capital
Tata Sponge Iron
Tata AutoComps
Tata Power
Trent
Tata AIA Life Insurance
Tata AIG General Insurance
Tata Global Beverages
Tata Housing
Tata International
Indian Hotels
Listed companies
Total group
FY17 FY16 FY15

13 July 2017
Tata Group 15
Figure 20: Top-five free cash generating companies in the Tata Group
Rs bn Free cash flow Finance cost
FY14 FY15 FY16 FY17 FY14 FY15 FY16 FY17
TCS 124 181 189 250 0 0 0 0
Tata Motors 92 36 65 47 49 49 42
Tata Power 21 25 58 34 37 32 31
Tata Teleservices 15 29 35 35 30 33
Tata Chemicals 16 7 10 6 5 5 4
Tata Steel -33 -16 5 25 43 48 41 52
Source: Company data, Credit Suisse research
Figure 21: Companies with weak cash generation profile
Rs bn Free cash flow Finance cost
FY14 FY15 FY16 FY17 FY14 FY15 FY16 FY17
Tata International -11.4 -2.6 -0.1 NA 1.6 1.8 2.1 NA
Tata Projects -1.7 -1.4 -0.4 NA 0.4 0.8 1.0 NA
Trent -1.8 -1.7 -0.5 0.3 0.1 0.1 0.4 0.3
Tata Global Beverages 2.2 2.4 -0.5 NA 0.9 0.8 1.2 NA
Infiniti Retail -0.3 -0.2 -0.7 NA 0.5 0.5 0.5 NA
Tata Housing -5.1 -10.7 NA 0.4 0.4 0.6 NA
Source: Company data, Credit Suisse research
■ TCS remains the single largest source of cash for the Group. TCS remains the
single largest source of dividend for the Tata Group—TCS had over 65% share in the
Group's aggregate PAT in FY16, Tata Group has the largest ownership in TCS (73%)
and the average payout historically has been above 40%. Our estimates suggest that
dividends from TCS would have accounted for 85-90% of the total dividend inflow for
Tata Group (from the Group companies, including the cross holdings of the Group
companies) in FY16.
All the other larger companies (Tata Steel, Tata Motors, Tata Power) are capital
intensive and are generating free cash that is either lower than the finance costs or not
significantly higher than it, there is little scope of any significant increase in dividend for
these companies in the near term, although this will be one focus area for new
management. Other companies are much smaller in size, and any increase in dividend
payout there would not change things meaningfully for the Group.
■ Further scope to increase the payout. The last five years' average dividend payout
for TCS has been 42% (excluding dividend tax), and including the recent buy-back of
Rs160 bn, the average payout ratio has been 58%. IT services companies have
accumulated significant cash in their balance sheet and there is an increasing
shareholder demand for a higher dividend payout. With a decent cash generation (PAT
to FCF conversion of over 80%) and over US$4.5 bn of cash in its books as on March
2017 (adjusting for the buyback), there is enough scope to increase the payout, and
this is being actively considered by the Board.
We estimate TCS accounts for 85-90% of
the total dividend inflow for the Group

13 July 2017
Tata Group 16
Figure 22: TCS' payout (dividend and buy back) history
Note: There was a special dividend paid in FY15. Source: Company data, Credit Suisse research.
A long list of tail companies lacking scale and strategic synergies
There are several companies in the Group that are very small in the context of Tata
Group's overall size and also lack scale to be a significant player in the industry they
operate in. For example, companies such as Tata Petrodyne and Tata Realty
Infrastructure have high asset intensity and low profitability based on FY16 financials (Tata
Realty made a net loss of Rs60 mn in FY16, with gross assets of close to Rs19 bn).
Similarly, Tata Pigments, Tata Ceramics (tableware), Tata Décor (luxury furnishing) and
Tata UniStore (e-commerce) are smaller players in the industry they operate based on
FY16 revenue.
31% 33%
79%
35% 35%
96%
42%
58%
0%
20%
40%
60%
80%
100%
120%
FY13 FY14 FY15 FY16 FY17 (exclbuyback)
FY17 (inclbuyback)
5 year average(excl the recent
buyback)
5 year average(incl the recent
buyback)
Payout (excluding dividend tax)

13 July 2017
Tata Group 17
Figure 23: Non top-ten companies (in terms of revenue, FY16 financials)*
Companies Segment/sector Revenue PAT Net debt Gross fixed assets ^
Voltas Air conditioners, engineering solutions 57.5 3.87 -5.8 5.2
Tata Sky D2H television 44.7 0.77 20.8 75.5
Tata Projects Infrastructure 42.4 0.67 4.3 5.7
Indian Hotels Hotels 40.2 -2.31 40.0 99.4
Tata Teleservices (Maharashtra) Telecom 29.7 -3.58 100.0 53.2
Infiniti Retail (Croma) Electronics retail 29.2 -1.97 4.4 1.3
Tata Capital Diversified financial services 21.8 4.05 331.5 1.5
Tata AutoComps Auto components 21.2 0.52 -2.2 5.3
Rallis India Agro chemicals 16.3 1.43 0.6 4.3
Trent Fashion retail chain 15.9 0.55 0.5 10.1
Tata Coffee Coffee producer and exporter 15.5 0.83 7.9 8.1
Tata Metaliks Pig and ductile iron pipes 13.0 1.23 2.1 5.7
TRF Material handling equipment 11.2 -0.36 5.1 2.2
Tata Housing Housing 10.9 -0.04 39.3 0.5
Tata Technologies Engineering services 10.8 2.23 -0.5 4.6
Tata Elxsi Engineering services 10.8 1.55 -1.8 2.1
Tata Sponge Iron Sponge iron 6.3 0.32 -5.4 4.0
Tata Business Support Services BPO 6.0^^ 0.19^^ 0.6^^ 2.1^^
Tata AIA Life Insurance Life insurance venture 2.7 0.64 -20.0 NA
Nelco VSAT, security and allied services 2.0 0.01 0.3 1.1
Tata Advanced Systems National security and defence 1.7 0.07 0.3 3.5
Advinus Therapeutics Contract research – pharma 1.6 0.07^^ 3.2^^ 1.7^^
Tata Asset Management Asset management 1.4 0.06 0.0 0.3
Roots Corporation Budget hotel (Ginger) 1.4 -0.11 0.9 4.0
mjunction services B2B E-commerce for steel 1.3 0.28 -1.6 1.2
Tata Advanced Materials Advanced composites and armoured products 1.3 -0.32 1.3 2.2
Tata Petrodyne Upstream oil and gas 1.1^^ 0.47^^ -2.9^^ 6.8^^
Tata Pigments Pigments, paints 1.1 0.06 -0.1 0.3
TKM Global Logistics Logistics and supply chain 0.6 0.03 0.0 0.1
Tata Realty and Infrastructure Real estate and infrastructure 0.6 -0.06 10.8 18.8
Tata Ceramics Tableware 0.5^^ 0.00^^ 0.1^^ 0.1^^
Tata AIG General Insurance General insurance 0.4 0.20 -39.3 2.4
Casa Décor Luxury furnishing 0.1 -0.06 0.1 0.0
Tata UniStore E-commerce platform (Tata CliQ) 0.0^^ -0.04^^ -0.5^^ NA
Top-10 as % of total 94% 98% 77% 94%
Top-20 as % of total 99% 99% 100% 99%
* Considered independent companies and subsidiaries/JVs/associates with a different business model than the parent. ^ excluding goodwill and intangibles. ^^ FY15 financials as FY16 financials were not available. Source: Company data, Capitaline, MCA, Credit Suisse research
Tata Group underperformed the market in the last
one and three years, led by TCS and Tata Motors
Overall, the aggregate market cap of the listed Tata Group companies has been flattish in
the last one year and up 11% over the last three vs 17% and 27% increase in the broader
market index, the Sensex. The top two companies of the Group—TCS (56% of the Group
market cap) and Tata Motors (16%)—have had a subdued performance over the last one
and three years. TCS' market cap is down 4% over the last one year and up just 1% over
the last three years. Tata Motors, on the other hand, is down 5% and up 9% over the last
one and three years, respectively. Tata Steel's (7% of the market cap) has done well in the
last one year (up 63%).

13 July 2017
Tata Group 18
Tata Metaliks (0.2% of the Group market cap), Tata Elxsi (0.6%), Voltas (2%), Trent (1%),
and Tata Communication (2.3%) have been the top performers over the last three years,
with their market cap up 994%, 192%, 155%, 103%, and 91%, respectively. Tata Tele
(Maharashtra) and Tata Power have seen the most market cap erosion over the last three
years (down 24% and 18%, respectively).
Figure 24: Tata Group companies—market cap movements
Market cap composition Change in market cap
Current 1 yr back 3 yrs back 1 year 3 years
TCS 56.3% 61.0% 61.7% -4% 1%
Tata Motors 16.1% 17.6% 16.3% -5% 9%
Tata Steel 6.5% 4.2% 6.5% 63% 12%
Titan Company 5.7% 4.5% 3.9% 31% 61%
Tata Power 2.7% 2.5% 3.7% 14% -18%
Tata Communications 2.3% 1.7% 1.3% 37% 91%
Voltas 1.9% 1.3% 0.8% 49% 155%
Tata Chemicals 2.0% 1.4% 1.1% 43% 100%
Indian Hotels 1.5% 1.6% 1.0% -4% 61%
Tata Global Beverages 1.3% 1.1% 1.2% 31% 18%
Trent 1.0% 0.7% 0.5% 37% 103%
Rallis India 0.6% 0.5% 0.5% 20% 20%
Tata Elxsi 0.6% 0.7% 0.2% 1% 192%
Tata Investment Corporation 0.5% 0.4% 0.4% 49% 45%
Tata Coffee 0.3% 0.3% 0.2% 27% 59%
Tata Metaliks 0.2% 0.1% 0.0% 111% 994%
Tata Tele (Maharashtra) 0.2% 0.2% 0.3% 6% -34%
Tata Sponge Iron 0.2% 0.1% 0.1% 35% 36%
Nelco 0.0% 0.0% 0.02% 6% 83%
TRF 0.0% 0.0% 0.0% -31% -12%
Tata Group aggregate 4% 11%
Sensex 17% 27%
Source: Thomson Reuters

13 July 2017
Tata Group 19
Renewed energy at the top The Tata Group constitutes one of the oldest, largest and most respected business groups
in India. While many of its group companies have done well over the years, there is
potential for some to improve. The track record of individual companies relative to peers
has also been mixed.
More recently, there was turmoil at the top level of the Group when the previous
Chairman, Cyrus Mistry, was ousted. After a search for a new Chairperson, N
Chandrasekaran (Chandra) was zeroed in on. He is an insider, having spent about 30
years at TCS and leading TCS since 2009. He took over as Chairman of Tata Sons in
January 2017 and has appointed some key personnel in various corporate functions.
Chandra has had a stellar track record at TCS and has led the company to a pole position
among its peers. We are optimistic that some of the relatively problematic areas for the
Tata Group can be solved in the next few years. Some of the recent developments (some
of these are likely to have been initiated by previous management) include:
■ Tata Steel signed a definitive agreement in February to sell its UK specialty steels
business to Liberty House Group for £100 mn.
■ TCS announced a Rs160 bn buy back (about US$2.5 bn), of which Tata Sons obtained
over Rs100 bn (about US$1.5 bn).
■ Tata Steel sold its stake in Tata Motors to Tata Sons for US$586 mn in June.
■ There have been cost cuts and organisational restructuring at Tata Motors.
■ Tata Sons has agreed to support the arbitration award to DoCoMo in relation to Tata
Teleservices.
■ There have been some management changes, such as Rakesh Sarna (CEO of Indian
Hotels), and the head of CV operations at Tata Motors, both have resigned due to
personal reasons, as indicated by the Group.
Five key mantras
Based on our understanding of the Group and the individual companies, and comments
made in the press, we believe new management's strategy will hinge on the following five
key objectives:
■ Improvement of return ratios, with focus on the "big guns". As mentioned earlier,
only four companies out of the top-ten companies have ROE in excess of 15%. The
main focus will be on the larger companies such as Tata Motors, Tata Power, Tata
Steel, and Tata Teleservices.
■ Domestic consumption. While international expansion was a big focus area until
2008, we believe that domestic consumption will be an important focus area for the
Group, going forward. Some of the important areas would include the consumer
business (Tata Global, parts of Tata Chemicals, Voltas) and financial services (Tata
Capital, insurance).
■ Simplicity in structure and holding. The Group consists of multiple companies that
operate, either fully or partially, in the same segments. There is a possibility of
consolidating some of these operations. Also, there are various intra-group holdings
and these can be simplified and consolidated at the Tata Sons level. This process may
also allow individual companies access to some funding, as long as the parent can
fund it, e.g., Tata Steel's recent sale of its stake in Tata Motors to the parent.

13 July 2017
Tata Group 20
■ Relevance. While the Group's presence in some segments is dominant, its presence in
others is not relevant. It also has sub-optimal presence in some large segments of the
economy such as financial services and retail/consumer (including e-commerce). It is
possible that the Group may either exit businesses where it is too small or consolidate,
wherever possible, to increase scale.
■ Digital initiatives across segments. Given the Group's presence in the technology
industry through TCS and others, Chandra's background and the increasing
implementation of digital initiatives by corporations, the Group may step up its digital
initiatives across its various businesses.
While quite a few of these objectives would have been in place even before the new team
took over, execution of this strategy will be key.
The following sections discuss various potential strategic imperatives within the above five
broader segments.
#1 Focus on the big guns
As discussed in the previous section, a handful of companies account for a significant
portion of the value (in terms of market capitalisation), revenue and debt. Some of the key
companies are—TCS, Tata Motors, Tata Steel, Tata Power and Tata Teleservices. Fixing
some of the key issues of these companies can essentially enhance the Group's value
significantly.
TCS: Little to be done
TCS has been the star performer for the Tata Group over the last several years. Its
absolute performance, both fundamental as well as in terms of market capitalisation has
been stellar, as has its performance relative to its peer group (despite being the largest
player among the peers by a margin). However, this performance has stagnated over the
last one year or so—the revenue growth has moderated from 15% levels, a couple of
years back to high single-digit in FY17. Margins are relatively resilient though (in the target
band of 26-28%) and remain at the industry leading levels.
Figure 25: TCS has outperformed the Sensex over
the last five years; stagnation in performance over
the last one year or so
Figure 26: Historically, TCS has grown ahead of the
industry, growth has suffered in the last few
quarters for TCS as well as the industry
Source: Thomson Reuters Source: Company data, Credit Suisse estimates
0
50
100
150
200
250
Jun-12 Dec-12 Jun-13 Dec-13 Jun-14 Dec-14 Jun-15 Dec-15 Jun-16 Dec-16
Prices indexed tto Jun-12
TCS Sensex
0%
2%
4%
6%
8%
10%
12%
14%
16%
18%
20%
Sep-12 Mar-13 Sep-13 Mar-14 Sep-14 Mar-15 Sep-15 Mar-16 Sep-16 Mar-17
Revenue growth (LTM, YoY, cc, organic)
TCS Top-5 Indian IT firms
Not all of these will be new strategies—
however, execution will be key

13 July 2017
Tata Group 21
Structural and cyclical factors behind recent slowdown in growth
The relatively slower growth over the last two years has been on account of some
structural and cyclical factors. On the structural front, commoditisation of traditional
services and cannibalisation of revenue on account of the cloud and automation have hurt.
Expectations of newer digital services making up for the shortfall have not played out fully
yet. Also, TCS' current scale will make it difficult to mirror the high growth rates of the past.
On the cyclical front, cautious spending by customers on new initiatives and the deferment
of discretionary projects have not helped. The sluggish performance of market
capitalisation over the last two years has been on account of a significant P/E derating.
Figure 27: The industry is going through several structural challenges
Source: Company data, Credit Suisse research
Things can potentially improve going forward
While the scale will inhibit high growth numbers, we expect some gradual improvement in
some of the structural issues, mainly in the ability of newer digital services in filling up the
shortfall caused by the deflation in legacy work.
Cyclical factors too can improve, and we expect some improvement in the next few
quarters, driven especially by financial services clients. With this, we believe growth can
pick up over the next two years from the level in FY17 but is unlikely to get back to the
15%+ levels. P/E could expand if growth rates pick up although it is unlikely, in our view, to
reach the high levels of the last five years.
1980 1990 2000 2010 2020
Y2K
Dotcom enabling
Consulting, testing, engg svcs
Package implementation
Infra management
Domain Knowledge
Consulting
Fixed price
Platforms
Automation
Mainframes
Client Server
Internet (Web)
ERP
Application development and maintenance
Digital, end-to-end engg services, platforms based offerings
Coding, T&M project management skills
Design, business consulting, AI, DevOps/Agile, outcome based
Cloud (as-a-service), IoT, mobilecomputing, Open Source
Capability additions
Technology additions
Services additions

13 July 2017
Tata Group 22
Figure 28: After a derating over the last couple of years (and rerating of the broader market), TCS now
trades at a discount to Sensex
Source: Company data, Credit Suisse estimates
What can the Group do for TCS?
In our view, there is little the Group can do for TCS at this point. TCS has been making
investments in newer digital areas over the last many years, and we believe that it will be
well positioned to capitalise on any pick-up in digital spending by clients. Given its track
record over the last many years, we have no reason to believe that TCS will not be
positioned at the forefront of digital services as well.
TCS has largely relied on organic investments and partnerships with start-ups for
emerging technologies so far. Its larger peers, like Accenture, have been aggressively
investing in developing digital capabilities through acquisitions, and have been successful
in building a leadership in digital. While the broad philosophy of TCS’ management is likely
to continue, we believe this is one area which may require a relook by management.
On the cyclical side, like its peers, it will just have to wait for an improvement. On the P/E
front, the only thing the Group can do, in our view, is to have high and consistent dividend
payouts/buy back. While TCS' payout has been reasonably high, it has been lumpy. There
is scope to enhance the average payout and to make it more consistent, given the cash
pile and free cash flow.
-20%
-10%
0%
10%
20%
30%
40%
50%
60%
70%
80%
10
12
14
16
18
20
22
24
Jun-12 Sep-12 Dec-12 Mar-13 Jun-13 Sep-13 Dec-13 Mar-14 Jun-14 Sep-14 Dec-14 Mar-15 Jun-15 Sep-15 Dec-15 Mar-16 Jun-16 Sep-16 Dec-16 Mar-17
12 month forward P/E
TCS' premium/discount to Sensex [RHS] TCS Sensex

13 July 2017
Tata Group 23
Figure 29: Unlike Accenture and IBM, Indian IT firms
have accumulated significant cash in the balance
sheet over the years
Figure 30: TCS' average payout has been 40%+ over
the last five years (58%, including the recent buy
back); scope to increase this further
* Including buyback. Source: Company data, Credit Suisse estimates. * Including buyback. Source: Company data, Credit Suisse estimates.
Tata Steel: Focus on India, addressing the pension
issue
Tata Steel is one of the leading steel companies globally and the second largest steel
company in India in terms of volumes. The company had consolidated revenue of Rs1.2 tn
in FY17—about 45% of this was contributed by the India business, while the international
operations account for the rest (Europe operations, including Corus, have a predominant
share in the international business, Southeast Asia accounts for the rest). In terms of
EBITDA, India's share is about 70%.
Figure 31: Europe accounts for close to 45% of revenue but has a below 30% EBITDA share (FY17)
Note: Under IndAS. Source: Company data, Credit Suisse estimates.
-20%
0%
20%
40%
60%
80%
100%
120% Application of cash flow generated over FY08-17
Net capex Dividend/Buy-back Acquisitions Cash accumulation
31% 33%
79%
35% 35%
96%
42%
58%
0%
10%
20%
30%
40%
50%
60%
70%
80%
90%
100%
FY13 FY14 FY15 FY16 FY17 FY17* 5 yearaverage
5 yearaverage*
Payout (excluding dividend tax)
India46%
Europe44%
Others10%
Tata Steel: Revenue breakup
India70%
Europe28%
Others2%
Tata Steel: EBITDA breakup
International business is 55% of revenue and
30% of EBITDA

13 July 2017
Tata Group 24
Decent progress on the India business, Europe business is still under restructuring
FY17 was a decent year for Tata Steel. Its India business picked up sharply in FY17—
volume growth at 15% was the best in the last six years, and EBITDA/t also improved from
depressed levels of US$105/t to US$150/t. In the European business, volumes were down
30% in FY17 but EBITDA/t improved from -US$17/t to +US$67/t.
Several drivers behind the domestic business' recovery
Tata Steel's domestic business was helped by a higher volume growth, better pricing (the
ASP increased by over 6% during the year) and resulting improvement in profitability
(EBITDA/t was up 45% during the year). The performance of Indian subsidiaries—Tata
Metaliks, Tinplate and Tata Sponge Iron—also improved.
The commencement of production at the Kalinganagar plant (in May 2016) brought close
to US$4 bn of investment to fruition, with about 3 MT of capacity. Tata Steel's profitability
in the last 6-7 quarters had also been impacted by the high cost of purchased iron ore
(captive production was disrupted due to mine closures at Joda, Noamundi and
Khondbond). With the mines back in production and most of the expensive iron ore
already consumed, iron ore cost fell sharply.
The MIP (Minimum Import Price) also helped the domestic business. Tata Steel benefitted
due to its relatively better positioning.
Europe business is still under restructuring
Tata Steel's European business has two parts—Netherlands and the UK. While the former
has historically done well, the latter has been a drag on the company's operations. Tata
Steel sold a part of the UK business (specialty steel) for £100 mn and has also
implemented a transformation programme to improve the performance of the remainder of
the European business.
The imposition of anti-dumping duty by EU on hot-rolled and heavy plates imported from
China could have helped margins to some extent in 2H17. Falling GBP (against USD) was
also a tailwind for the UK business.
Figure 32: Tata Steel's India volume growth was the
best in FY17 in the last six years, and EBITDA/t also
improved from depressed levels
Figure 33: Although volumes were down at Tata
Steel Europe, EBITDA/t improved from the
depressed levels
Source: Company data, Credit Suisse research Source: Company data, Credit Suisse research
-50
50
150
250
350
450
550
-2%
0%
2%
4%
6%
8%
10%
12%
14%
16%
18%
20%
FY08 FY09 FY10 FY11 FY12 FY13 FY14 FY15 FY16 FY17
Tata Steel (India)
Volume growth EBITDA/ton (US$) [RHS]
-110
-60
-10
40
90
-35%
-25%
-15%
-5%
5%
15%
25%
35%
FY08 FY09 FY10 FY11 FY12 FY13 FY14 FY15 FY16 FY17
Tata Steel Europe
Volume growth EBITDA/ton (US$) [RHS]
+15% volume growth in domestic, 30% decline
in international in FY17
Kalinganagar capacity, resumption of iron ore mines and MIP helped
The UK business has been a drag

13 July 2017
Tata Group 25
Figure 34: EU turnaround—progress in the last two years
Date Development
Jul-2015 SPH (NL pension scheme) re-classified as defined contribution
Jul-2015 Specialty and bar business to refocus on high-value markets (aerospace)
Aug-2015 Mothballed hot strip mill at Llanwern, Newport
Oct-2015 Mothballed plate mills at Scunthorpe, Dalzell and Clydebridge
Oct-2015 Closed two coke ovens at Scunthorpe
Dec-2015 Entered into discussions with Greybull Capital LLP for Longs business
Jan-2016 Further restructuring announcements incl. redundancies in UK
Apr-2016 Sale agreement signed with Greybull
Apr-2016 UK government announced support package for potential buyers of TSUK
Apr-2016 Sold Clydebridge and Dalzell plate mills in Scotland to Scottish government
May-2016 The UK government issued a public consultation paper outlining possible regulatory support to facilitate changes in BSPS
May-2016 Longs business sale completed (to Greybull)
Feb-2017 Definitive agreement with Liberty House Group for the sale of its UK Specialty Steel business.
Source: Company data, Credit Suisse estimates
Positive cash generation and improving debt coverage
After several years of consistent negative free cash flow generation, Tata Steel has
generated positive free cash flow for the last two years—FY16 free cash generation was
marginally positive and was Rs25 bn in FY17. Net debt coverage has improved too. Net
debt has been stable for the last four years, and with improved profitability, the net
debt/EBITDA has come down to the levels of ~4x. The recent sale of stake in Tata Motors
for close to US$590 mn has further reduced this ratio.
Figure 35: After several years of consistent negative
free cash flow generation, Tata Steel has generated
positive free cash flow in FY17 (marginally positive
in FY16)
Figure 36: Net debt is stable for the last four years,
and with improved profitability, net debt/EBITDA is
back to the historical levels ++++ ++++++ +++++
+++++ +++
Source: Company data, Credit Suisse estimates Source: Company data, Credit Suisse estimates
What can be improved?
The domestic business has done well in the last one year and that may remain a key focus
area for the Group, in our view. The European business (the UK in particular) on the other
hand is still operating at sub-optimal levels—a speedy resolution of the UK pension issue
will be important. Also, there have been talks of a strategic JV with ThyssenKrupp.
Elimination of cross holdings can help in debt reduction.
-200
-150
-100
-50
0
50
100
150
200
FY08 FY09 FY10 FY11 FY12 FY13 FY14 FY15 FY16 FY17
Tata Steel - Consolidated (Rs bn)
CFO Capex FCF
0.0
2.0
4.0
6.0
8.0
10.0
12.0
0
100
200
300
400
500
600
700
800
FY08 FY09 FY10 FY11 FY12 FY13 FY14 FY15 FY16 FY17
Net debt (Rs bn) Net debt to equity [RHS]
Net debt to EBITDA [RHS]
FY17 FCF was the best in seven years, net
debt/EBITDA back to 4x

13 July 2017
Tata Group 26
Nothing much to be done in the India business but it will be the key segment
Tata Steel's India business is already operating at a reasonably high utilisation. Also much
of the input requirements are met in-house through captive operations. Hence, there is
little scope for further efficiency gains in the India business. Any improvement in EBITDA/t
will largely depend on an increase in realisation (steel prices).
The European business has scope for improvement
Tata Steel's strategy on turning around the European portfolio hinges upon: (1) resolution
of the UK pension issue, (2) the sale of peripheral businesses (several of them have been
already sold), and (3) a broader strategic JV with ThyssenKrupp. The UK assets have
already been largely written down, and hence, there is little risk of a big impairment in the
future.
The company has already moved its active employees in the UK from a defined benefit
pension plan to a defined contribution plan. Additionally, steps to de-link the pension fund
from the scheme sponsor are separately under way. Tata Steel has obtained "in-principle
approval" from the UK pension regulator for a Regulated Apportionment Arrangement. It
will pay £550 mn alongside a 33% stake in Tata Steel UK to close the existing pension
scheme. It will, however, sponsor a closed de-risked new pension scheme to be offered as
a voluntary option to the existing members. That may pave the way for an eventual JV with
ThyssenKrupp, and possibly help the business become self-sufficient.
Tata Motors: India needs to be fixed
Tata Motors originally started operations as a commercial vehicle company (it started as a
locomotive manufacturer in 1945 and ventured into commercial manufacturing in 1954),
and built the passenger vehicle business much later (in the 1990s). Tata Motors has been
the market leader in the commercial vehicles segment in India, and is still trying to build a
prominent positioning in the passenger vehicles segment.
It made a few large acquisitions to expand international operations. In 2004, it acquired
Daewoo's South Korea-based truck manufacturing unit (named as Tata Daewoo) for over
US$100 mn. In 2008, it made a much bigger acquisition of Jaguar Land Rover for a
consideration of US$2.3 bn. These businesses have done well for the company.
India needs to be fixed
Given the long history of the India business and the strong Tata brand in India, the
contribution of this business to the overall value of Tata Motors is very low. For example,
the India business contributes just Rs80 of the CS target price of Rs630 for Tata Motors,
or just 13%. The contribution of Tata Motors to the overall value has also been coming
down over time.
Any significant improvement in
profitability will depend on steel prices
Pension resolution should pave the way
for it to be self-sufficient
Contribution of India to analysts' target price is
very low

13 July 2017
Tata Group 27
Figure 37: The domestic business accounts for only a small chunk of Tata Motor's fair value
Source: Credit Suisse estimates
Market share loss in commercial vehicles
While Tata is the largest player in this segment (49% market share in the M&H CV
segment and 38% in the LCV segment), it has been losing market share to Ashok Leyland
and Eicher over the last few years. Furthermore, the market itself has been relatively
muted recently and this makes the situation even more challenging.
The main issue here, in our view, is that an improvement in managing this business is
required. Initiatives can be on the channel strengthening side and also on the cost side.
Figure 38: Tata Motors is the largest player in the
M&H CV market + + +++ ++++ ++++ ++++ ++++
+++
Figure 39: However, its market share is being
challenged by players such as Ashok Leyland and
Eicher
Source: Company data, Credit Suisse estimates Source: Company data, Credit Suisse estimates
Passenger vehicles: Brand perception needs to be changed
Historically, Tata Motors has not had much success in the passenger vehicles segment
after the launch of its flagship products, Indica and Indigo. Slower product refresh, and
relatively weaker brand perception and dealer network have been the key reasons for Tata
Motors’ weaker positioning in this segment.
0
100
200
300
400
500
600
700
JLR Domestic Business China JV Subsidiaries Net debt Fair value (12 monthsforward)
Tata Motors - SOTP valuation (Rs/share)
Tata Motors49%
Ashok Leyland 34%
Eicher Motors12%
Mahindra Navistar
3%Swaraj Mazda
2%
M&H CVs: 2017 market share (by volumes)
30%
35%
40%
45%
50%
55%
60%
65%
70%
2002 2004 2006 2008 2010 2012 2014 2016
Tata Motor's share in the commercial vehicles segment
M&HCV share LCV share
Recent launches have seen some traction,
however

13 July 2017
Tata Group 28
Recent launches such as Tiago and Hexa have witnessed decent traction, however, and
the company needs to build on this with new product launches consistently.
There have also been newspaper reports (Economic Times) that Tata Motors and
Volkswagen may explore a partnership. If this happens, Tata Motor's PV capacity
utilisation may improve and help margins.
Figure 40: Tata Motors is the fourth largest player in
the passenger vehicles segment
Figure 41: After declines over the last several years,
the market share stabilised in 2017
Source: Company data Source: Company data
Margins should be the management's priority
The domestic business' margins have been subdued for Tata Motors for the last several
years. Given Tata Motors' domestic business includes both commercial vehicles (CVs)
and passenger vehicles (PVs), we compare the margins with both Maruti (a leading PV
player) and Ashok Leyland (a leading CV player). For the last three years, Tata Motors'
margins have significantly lagged the margins of these two companies.
Management has already taken some initiatives in this regards. It has made the
organisation leaner and has also optimised headcount. Furthermore, the recent initiatives
on advanced modular platform (AMP) development for passenger vehicles can achieve
higher cost efficiencies (through economies of scale) and faster time-to- market.
Figure 42: Tata Motor's domestic margins have been subdued for the last
several years
Source: Company data
Maruti Suzuki47%
Hyundai17%
Mahindra & Mahindra Ltd.
8%
Tata Motors
6%
Honda SIEL5%
Toyota5%
Renault4%
Ford3%
Others5%
Passenger Vehicles: 2017 market share (by volume)
0%
2%
4%
6%
8%
10%
12%
14%
16%
18%
2002 2004 2006 2008 2010 2012 2014 2016
Tata Motor's share in the passenger vehicles segment
-4%
-2%
0%
2%
4%
6%
8%
10%
12%
14%
16%
18%
FY09 FY10 FY11 FY12 FY13 FY14 FY15 FY16 FY17
EBITDA margin
Tata Motors - standalone Maruti Ashok Leyland
It has lagged its peers but recent initiatives
could help
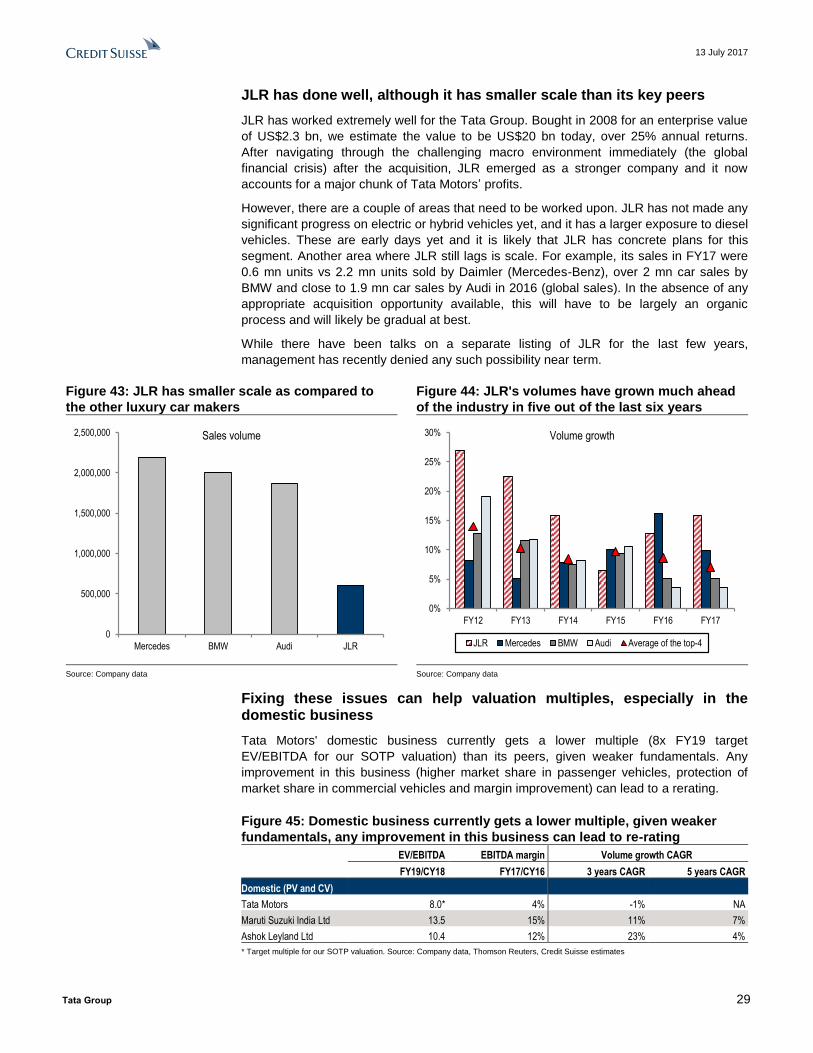
13 July 2017
Tata Group 29
JLR has done well, although it has smaller scale than its key peers
JLR has worked extremely well for the Tata Group. Bought in 2008 for an enterprise value
of US$2.3 bn, we estimate the value to be US$20 bn today, over 25% annual returns.
After navigating through the challenging macro environment immediately (the global
financial crisis) after the acquisition, JLR emerged as a stronger company and it now
accounts for a major chunk of Tata Motors’ profits.
However, there are a couple of areas that need to be worked upon. JLR has not made any
significant progress on electric or hybrid vehicles yet, and it has a larger exposure to diesel
vehicles. These are early days yet and it is likely that JLR has concrete plans for this
segment. Another area where JLR still lags is scale. For example, its sales in FY17 were
0.6 mn units vs 2.2 mn units sold by Daimler (Mercedes-Benz), over 2 mn car sales by
BMW and close to 1.9 mn car sales by Audi in 2016 (global sales). In the absence of any
appropriate acquisition opportunity available, this will have to be largely an organic
process and will likely be gradual at best.
While there have been talks on a separate listing of JLR for the last few years,
management has recently denied any such possibility near term.
Figure 43: JLR has smaller scale as compared to
the other luxury car makers
Figure 44: JLR's volumes have grown much ahead
of the industry in five out of the last six years
Source: Company data Source: Company data
Fixing these issues can help valuation multiples, especially in the domestic business
Tata Motors' domestic business currently gets a lower multiple (8x FY19 target
EV/EBITDA for our SOTP valuation) than its peers, given weaker fundamentals. Any
improvement in this business (higher market share in passenger vehicles, protection of
market share in commercial vehicles and margin improvement) can lead to a rerating.
Figure 45: Domestic business currently gets a lower multiple, given weaker
fundamentals, any improvement in this business can lead to re-rating
EV/EBITDA EBITDA margin Volume growth CAGR
FY19/CY18 FY17/CY16 3 years CAGR 5 years CAGR
Domestic (PV and CV)
Tata Motors 8.0* 4% -1% NA
Maruti Suzuki India Ltd 13.5 15% 11% 7%
Ashok Leyland Ltd 10.4 12% 23% 4%
* Target multiple for our SOTP valuation. Source: Company data, Thomson Reuters, Credit Suisse estimates
0
500,000
1,000,000
1,500,000
2,000,000
2,500,000
Mercedes BMW Audi JLR
Sales volume
0%
5%
10%
15%
20%
25%
30%
FY12 FY13 FY14 FY15 FY16 FY17
Volume growth
JLR Mercedes BMW Audi Average of the top-4

13 July 2017
Tata Group 30
Tata Power: Mundra power plant has weighed on
profitability
Tata Power is an integrated power company with presence in power generation (over
10,000 MW generation capacity), transmission (Mumbai and Bhutan-North India), and
distribution (Mumbai and Delhi). While a major proportion of the operations are in India,
the company has focused on the international market for growth in recent years (660 MW).
Also, the company has expanded its renewable portfolio through an acquisition (Welspun
Energy's renewable assets, acquired in June 2016 for about Rs100 bn). The current
renewable generation capacity is about 2 GW. Close to 60% of the revenue and 45% of
the EBITDA comes from business with regulated assured returns.
The company has set a target of making 30-40% of its generation capacity non-fossil-
based. Accordingly, over the last 5-6 years, it has not set up any new coal-based power
generation facilities.
ROE is above 10%; further increase in net debt
Over the last five years, Tata Power's revenue and EBITDA have grown at 1% and 4%
CAGR, respectively (inclusive of Welspun's renewable assets acquisition). While there has
been some improvement in the ROE over the last couple of years, it is still slightly above
10%. Post the acquisition of Welspun's renewable assets business, net debt has
increased to Rs468 bn, while PAT margin is only 5%—net debt to equity was 3.5x in
FY17. FCF generation improved in FY16, sufficient to take care of the finance cost.
Just to make a simple comparison, NTPC (another large Indian power utility company) had
ROE of over 10% in FY17 (more consistent over the years than Tata Power) and net debt
to equity of slightly above 1x (much lower than that of Tata Power).
Figure 46: Some improvement in ROE over the last
couple of years+++++ ++++++ ++++++ +++++ +++++
Figure 47: Post the Welspun acquisition, net debt
has spiked but FCF generation improved in FY16,
sufficient to take care of the finance cost
Note: PAT margin and ROE calculated on normalised PAT (after excluding the exceptional items). Source: Company data.
Source: Company data.
The Group has sought to exit the Mundra power plant
Tata Power won the 4,000 MW UMPP (ultra mega power plant) Mundra project through a
bidding process in 2006, with a price quote of Rs2.26 per kWh. To make the project viable,
it intended to feed the plant with coal procured from mines owned by the company in
Indonesia. The total investment outlay on this project was close to Rs180 bn—with over
Rs60 bn equity investment and over Rs100 bn debt funding.
-5%
0%
5%
10%
15%
20%
25%
30%
FY13 FY14 FY15 FY16 FY17
EBITDA margin PAT margin ROE
0
50
100
150
200
250
300
350
400
450
500
-20
-10
0
10
20
30
40
50
60
70
FY13 FY14 FY15 FY16 FY17
In Rs bn
Finance cost FCF PAT Net debt [RHS]
Revenue and EBITDA have grown at 1% and
4% CAGR over the last five years
Tariff renegotiation or exit are the two options
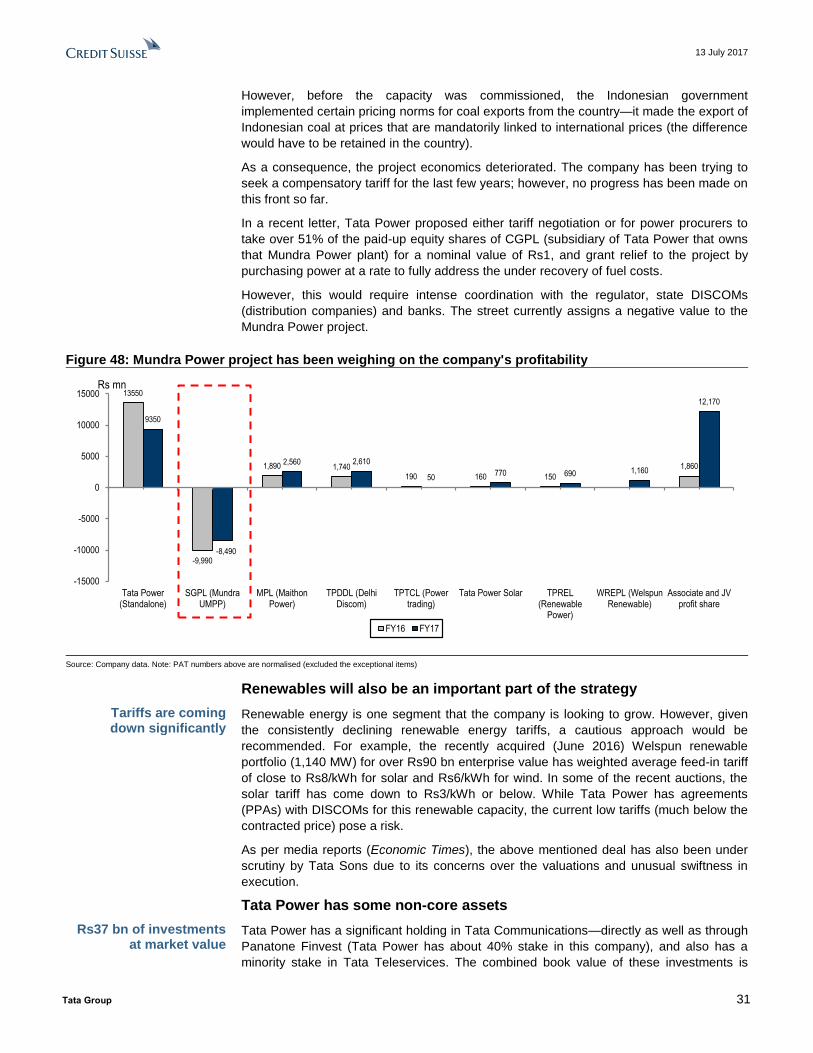
13 July 2017
Tata Group 31
However, before the capacity was commissioned, the Indonesian government
implemented certain pricing norms for coal exports from the country—it made the export of
Indonesian coal at prices that are mandatorily linked to international prices (the difference
would have to be retained in the country).
As a consequence, the project economics deteriorated. The company has been trying to
seek a compensatory tariff for the last few years; however, no progress has been made on
this front so far.
In a recent letter, Tata Power proposed either tariff negotiation or for power procurers to
take over 51% of the paid-up equity shares of CGPL (subsidiary of Tata Power that owns
that Mundra Power plant) for a nominal value of Rs1, and grant relief to the project by
purchasing power at a rate to fully address the under recovery of fuel costs.
However, this would require intense coordination with the regulator, state DISCOMs
(distribution companies) and banks. The street currently assigns a negative value to the
Mundra Power project.
Figure 48: Mundra Power project has been weighing on the company's profitability
Source: Company data. Note: PAT numbers above are normalised (excluded the exceptional items)
Renewables will also be an important part of the strategy
Renewable energy is one segment that the company is looking to grow. However, given
the consistently declining renewable energy tariffs, a cautious approach would be
recommended. For example, the recently acquired (June 2016) Welspun renewable
portfolio (1,140 MW) for over Rs90 bn enterprise value has weighted average feed-in tariff
of close to Rs8/kWh for solar and Rs6/kWh for wind. In some of the recent auctions, the
solar tariff has come down to Rs3/kWh or below. While Tata Power has agreements
(PPAs) with DISCOMs for this renewable capacity, the current low tariffs (much below the
contracted price) pose a risk.
As per media reports (Economic Times), the above mentioned deal has also been under
scrutiny by Tata Sons due to its concerns over the valuations and unusual swiftness in
execution.
Tata Power has some non-core assets
Tata Power has a significant holding in Tata Communications—directly as well as through
Panatone Finvest (Tata Power has about 40% stake in this company), and also has a
minority stake in Tata Teleservices. The combined book value of these investments is
13550
-9,990
1,890 1,740190 160 150
1,860
9350
-8,490
2,560 2,610
50770 690 1,160
12,170
-15000
-10000
-5000
0
5000
10000
15000
Tata Power(Standalone)
SGPL (MundraUMPP)
MPL (MaithonPower)
TPDDL (DelhiDiscom)
TPTCL (Powertrading)
Tata Power Solar TPREL(Renewable
Power)
WREPL (WelspunRenewable)
Associate and JVprofit share
Rs mn
FY16 FY17
Tariffs are coming down significantly
Rs37 bn of investments at market value

13 July 2017
Tata Group 32
Rs20 bn and the market value (using the current market price for the quoted investments)
is over Rs37 bn. At market value, these investments constitute 17% of Tata Power's
market cap; FY17 net debt of Rs468 bn.
Tata Teleservices: Challenges in the telecom
industry
Tata-NTT DoCoMo issue seems behind us now
Tata Teleservices was incorporated in 1996, and was one of the pioneers in India in
CDMA technology. It acquired Hughes Tele.com in 2002 and this acquired company was
renamed as Tata Teleservices (Maharashtra). The Tata Group formed a 74:26 joint
venture with NTT DoCoMo in 2008. Tata DoCoMo launched its GSM services in 2009.
NTT DoCoMo had a put option of sorts in the event of missed performance targets—the
Tata group had to find a buyer at a fair market price or pay half the original amount,
whichever was higher. The JV had done badly relative to its peers, racked up losses and
had no buyers. The deal between the Tata group and NTT DoCoMo to buy back the
shares ran into trouble with the Central bank (new regulations prevented any form of put
options at the time of investment) and the latter took the issue to the London Court of
International Arbitration. Finally, after Chandra took over, Tata Sons resolved the dispute
and agreed to pay the price as dictated by initial agreement. The Delhi High Court
approved this settlement in April 2017.
Three dominant players gaining share—before Jio's entry; market structure changing rapidly since Jio’s entry
Historically, India has been a competitive telecom market with the No.1 player never
crossing 34%+ revenue market share due to the presence of 10-12 players at all times.
The earlier regulatory policy of a low entry cost (Rs16.5 bn/US$250 mn for nationwide
spectrum) ensured high competition. However, over the years, auction-based spectrum
allocations where bigger players bid aggressively and forced cancellation of
administratively allocated spectrum in 2012 have resulted in market shares consolidating
with the top-three operators: Bharti, Vodafone and Idea.
However, with Jio’s entry by launching free services for first seven months, incumbents
started witnessing a sharp contraction in all financial and operating parameters with ARPU
compressing 19-22%, data and voice pricing compressing by 45% and 24-27%,
respectively, from the June-2016 quarter levels for Bharti and Idea. This resulted in a
significant loss of revenue for the industry. Indeed, Bharti’s India mobile revenues declined
by 6% YoY in 2H17, while in the case of Idea it was 9%.
Tata Sons will pay as per the agreement and
the Delhi High Court has approved it

13 July 2017
Tata Group 33
Figure 49: Over the years, revenue market shares
have been consolidating with the top-three players
Figure 50: Revenues for the industry declined by 7%
YoY in 2H17
Source: TRAI Source: TRAI
Even after Jio announced the commencement of paid services from April 2017, the price
points are significantly lower than that of the incumbents, putting further pressure on them.
This intense competition has resulted in rapid consolidation in the sector, with even the
number two and three operator (Vodafone-Idea) announcing their decision to merge.
However, even after this consolidation, we see industry continuing to see high competition
in the near term, with Jio likely to prioritise market share over near-term profitability. So
now, from a previous cozy equilibrium where we had Bharti at the top, Vodafone not trying
to dislodge Bharti from the top and Idea being at number three, we have three equally
capable operators vying for the top spot (Bharti, Jio and Idea+Vodafone). Thus, scale both
in terms of revenue and spectrum market share, balance sheet strength will be critical to
be able to compete in such a market.
Tata Tele has 7% spectrum market share and FY17 leverage of about 18x.
Figure 51: With its 7% spectrum market
share…++++++++++++++++++++++++++++++++++++
Figure 52: … Rs20.5 bn EBITDA and about 18x
leverage, Tata Tele compares unfavourably to peers
Source: TRAI, DoT, Company data Note: Tata Tele numbers refers to summation TTML and TTSL Source: Company data, Credit Suisse estimates
0%
20%
40%
60%
80%
100%
Dec
-06
Dec
-07
Dec
-08
Dec
-09
Dec
-10
Dec
-11
Dec
-12
Dec
-13
Dec
-14
Dec
-15
Dec
-16
Mar
-17
Bharti Vodafone Idea RCOM
BSNL/MTNL TTSL Aircel BPL
HFCL S Tel Uninor Videocon
Etisalat Sistema Shyam Jio
-
100,000
200,000
300,000
400,000
500,000
600,000
Sep-06 Mar-08 Sep-09 Mar-11 Sep-12 Mar-14 Sep-15 Mar-17
Launch of free services by Jio
Bharti21%
RJio17%
BSNL/MTNL14%
Vodafone14%
Idea13%
Tata Tele7%
Aircel6%
Others4%
RCOM4%
Revenue wtd avg spectrum market share after Oct-16 auctions
-
2
4
6
8
10
12
14
16
18
20
-
200,000
400,000
600,000
800,000
1,000,000
1,200,000
Bharti (consol) Idea Tata Tele
FY17 EBITDA (LHS) FY17 Net debt (LHS) FY17 Net debt/EBITDA (RHS)

13 July 2017
Tata Group 34
What next?
Tata Teleservices has an enterprise and consumer wireless business. The pressure
discussed above relates to the latter. Tata Teleservices' losses and debt have been
increasing. The way we see it, there are three ways forward:
■ Business as usual: This may not be a viable option given increasing competition in
the sector in the form of Jio.
■ Sell-off spectrum assets and wind down the business: Similar to how Telenor
exited its India operations by selling off the spectrum assets to Bharti, and then
deciding to shut down the remaining business, Tata Tele could evaluate selling off its
spectrum assets which, could yield some value based on the last auction prices.
■ Combine with larger peers: Another option for Tata Tele would be to merge with a
larger player—either the RCOM + Aircel combined entity or with Bharti/Jio/Idea +
Vodafone. However, even here we highlight that the major value for the business
would comprise of spectrum, with negligible value ascribed to its 45 mn subscribers
(this is a high churn market, some of Tata customers have CDMA handsets) and its
network. Recent newspaper reports (Economic Times) suggest the possibility of a
combination of Airtel Tata Teleservices, Tata Communications and Tata Sky. If this is
true, it would present the Tata Group with a complete or partial exit from the consumer
wireless business.
#2 Domestic business and B2C may garner higher
investment share
Historically, a major chunk of Tata Group's investments has been in the international and
B2B nature of businesses. For example, over the last five years, Tata Motors, Tata Steel,
Tata Power and Tata Communication have accounted for close to 87% of the Group's total
investments (net capex + acquisitions, net of disposals). The investments in Tata Steel
have come down significantly over the last five years, given the disposals in some of the
problematic international assets. Tata Motors, on the other hand, has witnessed a major
increase in investments during the last five years. Note that, most of the growth for Tata
Motors is in the international business, and hence, the investments are also directed
towards that part of the business (Jaguar Land Rover). Investments have also come down
in Tata Power. Historically, higher investments in the international heavy businesses also
reflect in the revenue profile of the Tata Group, which is international heavy (two-third of
Tata Group's combined revenue).
Incrementally, we believe, there should be higher investments towards the domestic and
B2C businesses, given a large addressable market, faster growth and a scope to leverage
the Tata brand. Companies that cover this area would include Tata Global, Tata Chemical,
financial services, including Tata Capital and the insurance arms, Indian Hotels and the
retail operations. There has been some increase in investments in businesses such as
Voltas (the recent JV), Titan (new launches), Tata Chemicals (more focus on the core and
value accretive businesses), and Trent (store expansion). Additionally, the Group may also
invest in relatively new ventures such as e-commerce (at the Group level), although
cautiously. TCS' dividend/buy back payouts would be the main source of funding for such
investments at the Group level for now, accompanied by possible small divestments.
Three options: continue, combine with
another player, exit

13 July 2017
Tata Group 35
Figure 53: Domestic and B2C businesses have had a very small share of the Group's total investments over
the years
Note: The above calculation is based on the investments by the 13 major companies of the Tata Group mentioned in the side box. Source: Company data, Credit Suisse research
Figure 54: International business dominated in the past
Source: Company data
#3 Some strong consumer brands can be leveraged
better
Tata Group companies have built very strong consumer brands in some of the businesses,
besides being an overall respected and well-known brand across the country. For
example, Tata Salt is a household name across India. Similarly, Voltas is a very strong
brand in the AC market and Tata Tea also has a very prominent brand recall. In Titan,
Tanishq is the largest and most trusted jewellery brand, and Fastrack is evolving as a
decent youth brand (in the mid-segment). However, Tata Motors (passenger vehicles) is
one consumer brand where the brand positioning is not as strong.
-10%
10%
30%
50%
70%
90%
110%
FY06 FY07 FY08 FY09 FY10 FY11 FY12 FY13 FY14 FY15 FY16
Tata Group - Investment break-up by major companies (capex+acquisitions)
Voltas
Trent
Tata Global Beverages
Titan
Tata Tele
Tata Tele (Mah)
Tata Chemicals
Tata Sky
TCS
Tata Communications
Tata Power
Tata Steel
Tata Motors
139
93
4
2
1
1
1
1
0
-1.2
-4.4
-8.3
-8.7
-33
0 100 200
Tata Motors
Tata Comm.
Tata Tele
Tata Tele (Mah)
Voltas
Titan
Tata Chemicals
Trent
Tata Sky
Tata Global…
TCS
Tata Power
Tata Steel
Total
Change in investments (FY14-16)
Rs bn
32% 38% 61% 65% 57% 58% 59% 63% 67% 67% 67%0%
10%
20%
30%
40%
50%
60%
70%
80%
90%
100%
FY06 FY07 FY08 FY09 FY10 FY11 FY12 FY13 FY14 FY15 FY16
Tata Group: Revenue break-up
International India
Globalisation of the Group through two large acquisitions - Corus and JLR
Businesses such as TCS and JLR have done well

13 July 2017
Tata Group 36
The Tata Group's consumer presence is low, in our view, and we believe it can leverage
these strong brands (and also the large distribution network) to propel its consumer
presence.
Figure 55: Tata Group's consumer presence is
low….
Figure 56: Titan is the largest consumer company in
the Group
Note: The above proportions exclude financial services Source: Company data, Credit Suisse research
Source: Company data, Credit Suisse research
Some initiatives are already under way
Some of these initiatives are already in place. For example, Voltas has recently signed a
JV with Turkey's Arcelik to offer consumer durable products in India, using Arcelik's
technology and leveraging the Voltas brand. In Titan, Tanishq has recently entered the
wedding jewellery segment (it was a missing piece of the overall portfolio earlier), has
acquired Caratlane (a jewellery ecommerce company) and has also been experimenting
with an apparel store in Bangalore (branded Taneira). Tata Chemicals launched a new
brand for its food portfolio—Sampann in 2015. Tata Global Beverages has also ventured
into the packaged water segment (including flavoured water), and Tata Coffee (subsidiary
of Tata Global Beverages) is now selling branded coffee through the Starbucks chain (JV
of Tata Global Beverages).
Ample opportunity to further leverage the brands
There is enough scope for each of these consumer companies to further expand their
product portfolios. Of the companies we cover, Voltas can further increase its product
portfolio by adding new categories in home and kitchen appliance segments (JV with
Arcelik will be operational towards the end of the year). Media reports (Business Today)
suggest that Tata Global Beverages can leverage the Tata brand and its existing
distribution network to launch new adjacent categories (the company has also been
contemplating to venture into the dairy segment, but there has been no progress so far, as
per Economic Times). Tata Chemicals also has plans to increase its consumer presence
(source: Live Mint). Titan can also tap the apparel segment (a large addressable market)
and introduce products in imitation jewellery.
17%
10%
8%
13%
7%
6%
0%
2%
4%
6%
8%
10%
12%
14%
16%
18%
FY06 FY11 FY16
Tata Group's India B2C revenue share
India B2C revenue India B2C revenue (excl. Telco)0%
10%
20%
30%
40%
50%
60%
70%
80%
90%
100%
FY06 FY11 FY16
Tata Group: India B2C portfolio (excl. Telcos)
Casa Décor
Infiniti Retail
Indian Hotels
Titan
Tata Chemicals
Tata Sky
Tata Global Beverages
Voltas
Trent
Tata Motors
Voltas' JV with Arcelik and Titan's wedding
jewellery segment are examples

13 July 2017
Tata Group 37
Figure 57: Tata Group companies have scope to leverage their brands better
Company Current presence in B2C segments Other segments that could be targeted
Voltas Air conditioners
Air coolers
Water coolers
Refrigerators*
Washing machines*
Microwaves*
Other consumer and home appliances
Tata Global Beverages Tea
Coffee
Packaged water
Flavoured water
Health drinks
Dairy and dairy products, etc.
Tata Chemicals Salt
Pulses
Gram flour
Water purifiers
Spices
Nutritional products
Grocery is a large market in India, and offers significant opportunities. Few examples:
Wheat flour
Rice
Other grain
Titan Jewellery
Watches
Eye wear
Men and women’s accessories
perfumes
Apparel
Imitation jewellery, etc.
* JV announced with Arcelik. Source: Company data, Credit Suisse research
#4 Some important segments need to scale up
While the Tata Group has a prominent presence in many of the large sectors in the Indian
economy, it is sub-scale in some of them. Prominent among the large Indian sectors
where the Tata Group has a sub-scale presence include retail/consumer, financial
services, e-commerce, healthcare and defence. Each of these segments hold immense
opportunities to scale-up.
Scope to scale-up retail
Retail is a large market in India. The overall retail market size is estimated to be over
US$650 bn and of this only a small fraction (8-10%) is organised (source: Technopak,
BCG). Apparel and footwear, which are about 10% of the overall retail market, are
expected to grow at a rate faster than the overall retail market, and the organised market
may grow at an even faster rate, given the low penetration.
Only a few companies have managed to run their retail business profitably, and Trent
(Westside) is one of them. Overall, Trent Limited has a market cap of US$1.2 bn and this
has increased by 185% and 92% over the last five and three years, respectively. The
Westside business has done well for the company.
Westside is smaller in scale compared to some of the other fashion retail chains. For
example, Westside’s revenue of Rs16.4 bn is much lower than that of Shoppers Stop
(Rs49 bn), Future Lifestyle and Fashions (Rs.38.8 bn) and Pantaloons (Rs.25.5 bn). Of
these peers, Pantaloons may be most relevant in terms of store formats—Westside had
107 stores as at March 2017 vs around 200 stores of Pantaloons. Given better profitability
(helped by a large proportion of its own brands) and significant growth opportunity, we
believe there is potential to scale-up this business.
Smaller than other fashion retail chains but more profitable

13 July 2017
Tata Group 38
Figure 58: Westside is relatively smaller than other fashion retail chains, but has a much better margin
profile
Source: Company data
Minor presence in grocery /departmental stores and is loss making
While the Tata Group has presence in grocery/departmental stores through Star Bazaar
(part of Trent Limited), it is very small at the moment—42 stores under Star Daily, Star
Market and Star Hyper brands. Competitors such as Big Bazaar and D-Mart are much
larger with 235 and 131 stores, respectively. This segment had a revenue of Rs8.9 bn and
an EBITDA loss of Rs167 mn in FY17. While the opportunity is larger in this segment,
Trent is yet to achieve profitability.
Financial services: Presence across segments, but small scale in most of them; lending business has a reasonable scale to grow
The Tata Group has presence in multiple segments of the financial services industry,
including insurance (Tata AIA Life Insurance and Tata AIG General Insurance), retail and
corporate lending (Tata Capital and Tata Motor Finance), broking and investment banking
(Tata Capital) and asset management (Tata Asset Management).
The Tata group lacks scale in most of the categories; however, the lending business is an
exception (carried through Tata Capital). Tata Capital’s book size is comparable to several
of its diversified financial peers such as L&T Finance, Edelweiss, IIFL and Reliance
Capital. This is a fast growing segment for the market, and Tata Capital’s existing platform
offers an opportunity to scale-up.
Potential for Tata AIA
Tata AIA has been selling products through IndusInd Bank and Citibank. In October 2016,
it entered into an agreement with HDFC Bank to sell its policies and recently has tied up
with Axis Bank as well. It has also tied up with DBS Bank, which will offer products through
its digital channel. With an increasing number of bancassurance partners, its share of
bancassurance has increased from 16% in FY15 to 49% in FY16.
0%
2%
4%
6%
8%
10%
12%
14%
16%
18%
20%
0
10,000
20,000
30,000
40,000
50,000
60,000
Shoppers Stop Central+BrandFactory
Pantaloons Westside
Revenue (Rs mn)
FY16 FY17 Growth [RHS]
0%
2%
4%
6%
8%
10%
12%
0
500
1,000
1,500
2,000
2,500
3,000
3,500
4,000
Shoppers Stop Central+BrandFactory
Pantaloons Westside
EBITDA (Rs mn)
FY16 FY17 Margin FY16 [RHS] Margin FY17 [RHS]

13 July 2017
Tata Group 39
Figure 59: Tata Group’s portfolio of assets in the financial services segment
Company Segment Parameter Value (Rs bn) Competitors Comments on Tata's positioning
Tata AIA Life Insurance Life Insurance Gross written premium 25 LIC, ICICI, SBI Life, HDFC, Bajaj
Allianz
Close to Rs.3.6 tn industry size.
Tata AIG General Insurance General Insurance Gross written premium 21 New India, United India, National
Insurance, Oriental Insurance, ICICI
Lombard
Close to Rs.950 bn industry size.
Tata Motor Finance
(subsidiary of Tata Motors)
Captive Auto Finance Loans 187 All major banks Currently finances only Tata vehicles.
Tata Asset Management Fund Management AUM 417 ICICI Pru MF, HDFC MF, Birla Sun
Life, Reliance MF, SBI MF
The Mutual Fund industry in India
has AUM of Rs.19 tn.
Tata Capital Diversified Financials
- Retail lending Including home, car,
personal, consumer and
business loans
Book size 228 IIFL, Motilal Oswal, Edelweiss
Capital, JM Financial, L&T Finance,
Reliance Capital
These six firms have book size of
close to Rs.750 bn and growing at a
fast pace.
- Corporate lending Book size 191 IIFL, Edelweiss Capital, JM
Financial, L&T Finance, Reliance
Capital
These five firms have book size of
close to Rs.830 bn and growing at a
fast pace.
Source: Company data, Credit Suisse research
E-commerce
Tata CLiQ is Tata Group's flagship e-commerce initiative and is run under Tata Unistore. It
is a horizontal e-commerce platform selling goods such as electronics, apparel and
footwear and was launched in 2016.
Tata Industries has seeded three businesses in the broad Internet/digital area—Tata CliQ,
a digital healthcare platform and TataiQ which is focused on analytics. Of these, Tata CliQ
is the e-commerce venture and was started about a year ago. The initial plan was to have
an omni-channel branded marketplace.
The Indian e-commerce market has become increasingly consolidated over the last two
years—the larger companies have used their scale and access to funds to build up key
areas of operations including customer experience, seller relationships, logistics and
technology. Based on industry sources, we estimate Flipkart and Amazon have increased
their combined market share from 50-60% two years back to over 80% today. As per
newspaper reports (Economic Times), Flipkart is looking to acquire Snapdeal which used
to be a strong #3 player at one point of time.
While there may be room for niche or vertical-focused players, we believe it is probably too
late for a new horizontal player to enter the market as the cash burn can be significant in
the first few years, if the new player hopes to capture any reasonable market share. And
even then, success is not guaranteed. Also, some of the key individuals that were involved
with this initiative initially are no longer a part of the Tata Group, post the change in the
Chairman.
Tata CLiQ appears to be following a somewhat different model. In Tata CliQ, the sellers
are curated and brands can have an online store—these include non-Tata brands as well.
It is somewhat similar to the T-Mall model. It started with apparel, electronics and
footwear. The number of sellers will be small and significantly lower as compared to the
larger horizontal e-commerce players.
It also plans to leverage the Group's physical retail infrastructure for delivery. It claims that
about 50% of orders were fulfilled by about 100 stores. Tata Unistore runs CliQ and Tata
Industries and Trent (a retail arm of the Group) have stakes in this.
Seller curation, online stores for brands and the Group's physical
infra are differentiators for Tata CLiQ

13 July 2017
Tata Group 40
Figure 60: The GMV has started growing again in
2017; based on the trends so far, GMV may increase
to about US$15 bn in 2017
Figure 61: India’s GMV mix is gradually shifting
from traditional electronics and books to new
categories such as fashion, FMCG etc. (2016)
Source: IAMAI, Euromonitor, Credit Suisse estimates Note: The up and down arrows next to the categories reflect the expected change in their share in the medium-term. Source: Credit Suisse estimates.
Defence: A promising market; Tata Group’s offerings are dispersed across multiple units
Tata Group has a presence in the defence segment through multiple entities. Some of the
notable ones are:
■ Tata Advanced Systems (TASL): A 100% subsidiary of Tata Sons, it is a systems
integrator for defence-related delivery to the Indian security forces, with partnerships
with leading defence players such as Sikorsky Aircraft, Lockheed Martin and Israel
Aircraft Industries. For example, it operates a part manufacturing facility for aircraft and
helicopters in a joint venture with Sikorsky. It is also involved in the command and
control systems for India's missile programmes.
■ Tata Motors: Tata Motors has offerings in logistics and has also been adding
capabilities in combat and combat support (offered through the 100% subsidiary TAL
Manufacturing Solutions). It has supplied over 150,000 vehicles to the military and
para-military forces.
■ Tata Power Strategic Engineering Division: It is a prime contractor and has
participated in projects such as launcher systems, missile development programme,
nuclear submarine control centre.
■ Tata Advanced Materials: A subsidiary of Tata Industries, it has offerings for
aerospace, defence and industrials—it offers composite materials for space and
industrial applications, structural components, engine components, and personal and
vehicle armour.
■ Tata Industrial Services: It also offers supply chain and programme management
services for aerospace and defence players.
Besides these, companies such as TCS, Tata Elxsi and Tata Technologies also participate
in defence work. Even Titan has a small presence in this segment—it performs precision
engineering work for international players.
With the 'Make in India' initiative of the government and the focus on defence (as per IHS
Markit, India was among the top-five spenders on defence in 2016), we believe this should
be one large area in the future. The Group had expected a revenue of Rs26 bn in FY16 as
per newspaper reports (Business Standard). Although small in the overall scheme of
things, the government expects this to be a large opportunity for the Indian companies
(source: Economic Times, Business Standard).
11-12 bn
14.5-15.5 bn
0
2,000
4,000
6,000
8,000
10,000
12,000
14,000
16,000
2010 2011 2012 2013 2014 2015 2016E 2017
India e-tailing GMV (US$ mn)
Electronics and accessories
Apparel
Other fashion
Home furnishing Books
Others (incl. FMCG)
Current GMV mix
Small in the scheme of things (Rs26 bn
revenue in FY16) but promising
13 July 2017
Tata Group 41
Healthcare: No significant presence
Healthcare is another large segment of the Indian economy, and Tata Group has a very
small presence through two entities—Advinus Therapeutic and Tata Health. Advinus
Therapeutic is a contract research firm with revenue of Rs1.8 bn in FY16. This business
has been in existence for over ten years, but has not gained much scale. As per media
articles (Economic Times), Advinus laid off 50 people from its Pune office to improve
profitability.
In 2015, Tata Group forayed into digital healthcare, with Tata Health, with services ranging
from electronic medical records, e-solutions for practice management, remote monitoring
etc. This business is still in its initial stages, and we believe it would not have any
significant revenue at the moment.
In addition, the Group is involved in the healthcare sector through Tata Trust.
Aviation: Two ventures; gradual progress in a competitive market
The Tata Group has its presence in the aviation sector through its two joint ventures—
Vistara (joint venture with Singapore Airlines, with the Group owning 51%) and AirAsia
India (JV with AirAsia Berhad, 40% owned by the Tata Group). Both the airlines have a
relatively small market share (3.2%/3.1% in Jan/May 2017), but have made some
progress in the last couple of years (Vistara’s traffic share was 0.8% in Jan-May 2015,
while Air Asia’s share was 1.2% during the same period). The AirAsia venture was meant
to obtain a presence in the low-cost carrier market in India while in the case of Vistara, the
Tata Group has a majority stake and has international ambitions. The regulations to fly
international were recently diluted. There was a "5/20" rule earlier—operational for five
years and a fleet of at least 20 airplanes—which has now been diluted and the five-year
clause has been removed.
The market is competitive, and being marginal players, profit generation would be difficult.
As per media reports (Business Standard), Vistara generated a revenue of Rs7.1 bn in
FY16 and a net loss of Rs4 bn. Air Asia had a revenue of Rs8.3 bn in CY16 and loss
before tax of Rs1.4 bn.
Given these are relatively late entrants in the market, making losses due to the smaller
scale and expanding their fleet, they would require investments by the Tata Group and
their JV partners in the medium term.
Also, Air India is up for sale, and as per media articles (Business Standard), Tata Group
could be one of the bidders. The Tata Group used to own Air India decades ago, before it
was privatised in 1953. While on the one hand, Air India has attractive assets in terms of
its fleet and landing rights in many international airports, it is saddled with a large amount
of debt, high headcount and posts large operational losses on the other. Acquiring Air
India will be fraught with challenges. Interglobe Aviation (Indigo) has already evinced its
interest in participating in the Air India divestment programme—it would ideally like to own
just the international operations and plans to run that business as a low-cost one, similar
to Indigo's own domestic business. Indigo has significant market share in the domestic
market and has an excellent track record in running a profitable low-cost business. In our
view, the Tata Group's decision regarding Air India will depend on the eventual form of
divestment that the government chooses, and these are early days yet.
Very small market share currently through
Vistara and AirAsia
Will the Tata Group be interested in Air India?
It will be fraught with challenges

13 July 2017
Tata Group 42
#5 Restructuring of Group companies and their
divisions can add value
Voltas: A pure AC + consumer durable business could have more value
Being the market leader, Voltas has a strong brand in the air-conditioner category. The
recent venture into other consumer durable segments (JV with Arcelik for co-branded
consumer durable products) broadens its consumer portfolio. The company's Electro-
Mechanical Projects division (44% of revenue and 14% of the segmental EBIT) has
completely different business dynamics—it is more cyclical in nature, is spread across
multiple segments (rural electrification, water treatment, HVAC) and is also exposed to the
international markets (the Middle East).
We believe the demerger of the Electro-Mechanical Projects division can make Voltas
largely a consumer business. The Tata Group does similar EPC business through different
entities—the most significant of them being Tata Projects (engaged in EPC and industrial
infrastructure projects). The combination of these two entities can create a business with
scale (US$1 bn revenue), while at the same time help Voltas evolve as a pure-consumer
facing company. A pure consumer-facing company can also command a higher value, in
our view.
Figure 62: Demerger of the Projects division can make Voltas largely a 'AC+consumer durable' business;
Projects division can be merged with Tata Projects to create a US$1 bn revenue entity
Source: Company data, Credit Suisse research
Defence offerings spread across the group; would consolidation help?
Tata Group's defence portfolio is spread across different group companies. For example,
Tata Advanced Systems and Tata Advanced Materials are 100% subsidiaries of Tata
Sons, and Tata Industrial Services is a 100% subsidiary of Tata Industries. Tata Power
also has defence offerings through its Strategic Engineering Division (SED). Besides
these, several other group companies such as Tata Motors, TCS, Tata Technologies, Tata
Elxsi and Nelco have defence offerings.
We believe consolidating most of the defence related offerings together can bring greater
focus on this segment and that holds great potential. For companies such as Tata Motors,
TCS, Tata Technologies, Nelco and Tata Elxsi, the defence offerings are more integrated
with their core business—hence, separating them out would not make much strategic
sense. On the other hand, Tata Advanced Systems, Tata Advanced Materials and Tata
Industrial Services are independent entities with defence being their core business
(ownership and operational restrictions related to government procurement will need to be
studied though). Tata Power's SED also has a largely independent operation with a
separate plant at Bengaluru.
Tata Projects
EPC, Industrial Infra ProjectsRev (FY16): Rs 42.3 bnPAT (FY16): Rs 0.7 bn
Net debt (FY16): Rs 4.0 bnROE (FY16): 7%
Voltas
Electro-mechanical projects
EPC, electro-mechanical projectsRev (FY17): Rs 26.7 bnEBIT (FY17): Rs 0.8 bn
Tata Power
Tata Steel
Tata Chemicals
Tata Sons Tata Motors
48%
11%
10%
7% 7%
7%
Unitary Cooling Products
Comfort and commercial useRev (FY17): Rs 30.5 bnEBIT (FY17): Rs 4.4 bn
Consumer Durable*
Refrigerators, Washing Machines, Microwave
Rev (FY17): NA
EBIT (FY17): NA
Engineering Products and
ServicesTextile & Mining/Construction
Equipments
Rev (FY17): Rs 3.3 bnEBIT (FY17): Rs 1 bn
Projects business (EPC,
industrial, electo-mechanical projects)
AC + Consumer Durable
Business
Voltas' divisions
Combining the project business with that of
other group companies will give it scale and
make Voltas a consumer play
There are three or four relatively large entities
in defence currently

13 July 2017
Tata Group 43
Figure 63: Defence offerings spread across the group; could they be brought together to build scale?
Source: Company data, Credit Suisse research
Tata Elxsi and Tata Technologies' business complement each other, combination can create a well-sized engineering service business
Engineering services is one of the fastest growing segments in the IT services industry,
and the Tata Group has a presence in this segment through three entities—TCS, Tata
Technologies and Tata Elxsi. While TCS has just a 5% exposure to engineering services,
in absolute terms, it is close to a US$850 mn business. Tata Tech and Tata Elxsi are niche
players in the engineering services. Tata Tech is largely in the automotive segment and
also has some presence in the aerospace segment. Tata Elxsi also has the largest
exposure to the automotive segment (about 50% of its revenue), followed by broadcasting
(25% of revenue).
While individually, these businesses are doing well, a combined operation could offer
some synergies (source: Business Line). We believe TCS will not like to exit its
engineering services business. Tata Elxsi currently trades at a higher multiple than TCS as
per consensus estimates.
Warburg Pincus has recently picked up a 43% stake in Tata Technologies from Tata
Motors and Tata Capital—this may preclude any near-term consolidation involving the
company.
Figure 64: Tata Elxsi and Tata Technologies' business complement each other,
their combination could create a leading engineering service business
* L&T Technology Services ^ FY16 revenue Source: Company data
Tata Advanced Systems
Systems Integrator for defence related delivery
Rev (FY16): Rs 1.7 bn
PAT (FY16): Rs 0.1 bnNet debt (FY16): Rs 0.3 bn
ROE (FY16): 2%
Tata Advanced Materials
Composite materials for aerospace, defence and
industrials
Rev (FY16): Rs 1.3 bnPAT (FY16): Rs -0.3 bn
Net debt (FY16): Rs 1.3 bn
ROE (FY16): NA
Tata Industrial Services
Supply chain and program management
Rev (FY16): NA
PAT (FY16): NANet debt (FY16): NA
ROE (FY16): NA
Tata Power - Strategic
Engineering DivisionSystems Integrator for defence
equipments and solutions
Rev (FY16): Rs 5.5 bnPAT (FY16): NA
Net debt (FY16): NA
ROE (FY16): NA
Tata Sons Tata Industries
100% 100%
Tata Power
DivisionTata Motors Tata Technologies
TCS Nelco
Tata Elxsi
Other Tata Group companies with defence offerings
186
418
604
857
1,303
553484
385
261
0
200
400
600
800
1,000
1,200
1,400
Tata Elxsi Tata Tech TataElxsi+TataTata Tech
TCS HCL Tech Wipro LTTSL* QuestGlobal ^
Cyient
Engg svcs revenue (US$ mn, FY17)

13 July 2017
Tata Group 44
Financial services
As discussed earlier, Tata Group has its presence in financing through Tata Motor Finance
(captive arm of Tata Motors, with no outside business) and Tata Capital (diversified
financial services subsidiary of Tata Sons). If combined, these two entities will have a loan
book size of over Rs600 bn, that could be large enough to unlock value through a public
listing. However, Tata Motor Finance has so far been run as a captive arm of Tata Motors
(indirectly to push Tata Motors' sales), and making this company independent may not
help Tata Motors.
#6 Simplification of the cross-holding structure
There is a fair amount of cross-company holdings within the Tata Group companies and in
some cases, they also have cross-holdings in promoter entities (Tata Sons and Tata
Industries). We believe unlocking and monetising these investments can be helpful for the
companies as well as add value for investors.
■ The money realised from the cross-holdings in the Group companies can be used to
repay the existing debt of companies. This would be particularly relevant for companies
such as Tata Power that have a higher leverage.
■ This could add value for investors as well. Currently, any investment in Tata Power
also gives exposure to the telecom business (through its investments in Tata Tele and
Tata Communications) as well as the overall Group (given its cross-holdings in Tata
Sons and Tata Industries). Once Tata Sons simplifies the holding structure, anyone
investing in Tata Power will get an exposure to the Power business only. This is also
the case in other companies such as Tata Chemicals, Tata Global Beverages and Tata
Steel.
The process has already begun with Tata Steel selling its stake in Tata Motors for US$590
mn—Tata Sons bought this stake. Similar cross-holding elimination (of non-core cross
holdings) could require a further US$1.5-2 bn fund infusion by Tata Sons into the Group
companies.
Among the Group companies, Tata Chemicals, Tata Power and Tata Global Beverages
have the most significant exposure to other Group companies (shareholding), in
terms of value of investment as % of market cap (26%, 16% and 9%, respectively).
Figure 65: Tata Chemicals and Tata Power have significant holdings in other Tata Group companies
Rs bn Value of
investments in
listed Tata Group
cos. [A]
Book value of
investments in
unlisted Tata
Group cos. [B]
Total value of
investments in
Tata companies
[C]
Mkt cap
[D]
[C] as % of [D] Book value of
investments
Market value vs
book value
Tata Chemicals 41.6 1.8 43.4 165 26% 9 399%
Tata Power 28.6 7.0 35.6 221 16% 20 77%
Tata Communications 0.0 9.3 9.3 191 5% 9 0%
Tata Steel 4.3 4.4 8.7 538 2% 7 28%
Tata Global Beverages 7.4 1.2 8.5 99 9% 2 365%
Tata Motors 2.5 2.9 5.4 1,261 0% 5 1%
Voltas 0.1 0.3 0.4 155 0% 0 44%
Tata Coffee 0.1 0.0 0.1 27 0% 0 144%
Titan 0.0 0.0 0.0 473 0% 0 178%
TCS 0.0 0.0 0.0 4,465 0% 0 NA Note: 1. Did not include the investments in the subsidiary companies with related business operations (Tayo Rolls, Tinplate, Tata Metaliks and Tata Sponge Iron for Tata Steel, and Tata Coffee for Tata Global Beverages). 2. For the unlisted Tata Group companies, we have just considered the book value (net of impairment) Source: Company data, Thomson Reuters
While Tata Motor Finance and Tata
Capital can have a large book, combined, the former helps Tata
Motor sales

13 July 2017
Tata Group 45
#7 Sub-scale operations: Are they really needed?
Regardless of the size of the company, it occupies some of the management bandwidth—
every company's Board is chaired by Tata Sons or another Group company's senior
leaders. However, while some of the companies may be small and making losses today,
the investment may be justified by the addressable market opportunity (for example, the
airline businesses, Tata Housing, Tata Mutual Fund).
Looking at past financial performance, we believe there are certain companies (some
examples discussed below) that are small, with presence in business segments that do
not seem very strategic and have mediocre financials. Their strategic relevance from the
Tata Group's perspective, hence, needs a relook.
Tata International
Tata International is a global trading and distribution company, with presence in five key
verticals—leather and leather products (including manufacturing at Chennai and Dewas in
India), metals trading, minerals trading (including some ownership in a couple of blocks),
distribution (including distribution of Tata Motors' vehicles in Africa) and the recently
started agri-trading business.
Tata International’s revenue has grown at 11% CAGR over FY14-16 (FY17 financials not
available), EBITDA margin is low (typical of a trading company) and EBITDA has grown at
a 9% CAGR. The company has made net losses for the last three years (close to Rs1 bn
in FY14 and FY15, and Rs500 mn in FY16). The company had a net debt of over Rs18 bn
in FY16 (on an EBITDA of Rs1 bn) and barely had positive free cash flows in FY16
(negative free cash flows of Rs11.4 bn and Rs2.6 bn in FY15).
Figure 66: Tata International—financial snapshot
Rs mn FY14 FY15 FY16
Revenue 105,449 126,496 130,449
EBITDA 852 375 1,007
PAT -967 -1,277 -504
Net debt 27,146 19,740 18,411
FCF -11,435 -2,642 -57
Source: Company data, Capitaline
Tata Business Support Services
The company is a wholly-owned subsidiary of Tata Sons, and provides support services
for business operations (for industries ranging from telecom, media, retail and BFSI). The
company had revenue of Rs6 bn, with an EBITDA margin of 8% in FY15 and has a current
employee base of over 25,000. The margins are very low from the standard of a services
company.
Given the lack of scale in the business (there are several BPO companies with much
larger scale and better margin profile), low margins and threat of automation, this may not
be a strategic fit in Tata Group's portfolio.
Tata Asset Management
Tata Asset Management is owned 68% by Tata Sons and 32% by Tata Investment
Corporation (TICL). The company had an AUM of Rs417 bn vs an overall AUM of Rs9 tn
for the Indian mutual fund industry. The profitability is also low—it generated a revenue of
Rs14 bn in FY16 and PAT of Rs56 mn, with a below 1% ROE.
Advinus Therapeutic
Advinus Therapeutic is a contract research firm with revenue of Rs1.6 bn in FY16. This
business has been in existence for over ten years, but has not gained much scale. As per
media articles (Economic Times), Advinus laid off 50 people from its Pune office to

13 July 2017
Tata Group 46
improve profitability. The company had a revenue of Rs1.6 bn in FY16, and generated
PAT of Rs67 mn in FY15 (FY16 PAT not available) and had a net debt of Rs3.2 bn in
FY15.
Tata Petrodyne
Tata Petrodyne is an upstream oil and gas company with interests in exploration and
production blocks in India, Indonesia and Tanzania. While the company has been in
operation for over 23 years, it remains a minor player in the segment that has some very
large-scale players. Although the company generated profits of Rs465 mn on the sales of
over Rs1 bn, the business may not make strategic sense.
Tata Pigments
Tata Pigments is another such company (wholly owned subsidiary of Tata Steel). The
company sells flooring colours, decorative paints and pigments under Tata and other
brands. It was primarily formed to process the acidic waste generated from the Steel sheet
mills into pigments—over the years, it has become the largest producer of synthetic iron
oxide pigments. However, this business also lacks scale with just over Rs1 bn revenue
and Rs56 mn PAT in FY16.
Tata Ceramics
Tata Ceramics is a 57% owned subsidiary of Tata Power and sells fine-bone china
crockery and tableware in India and other markets. The company had been struggling, and
saw a management change around 2013—as part of the restructuring, management
increased the domestic focus of the business. However, things do not seem to have
changed much—in FY15, the company’s revenue was Rs500 mn and it broke even at the
PAT level, but it made a loss of Rs37 mn in FY16.
#8 Divestments may be value accretive for few
companies
While the overall ambition of the Tata Group management is likely to grow the business,
we believe certain divestments cannot be ruled out if they bring significant value to the
companies and the Group or prevent significant destruction of value. This process has
already begun to some extent with the sale of certain European assets by Tata Steel and
the sale of its urea business by Tata Chemicals. We believe there are certain pockets of
opportunities for the Tata Group to realise value by divesting some of its value destroying
business. Some of these include:
Tata Steel: European operations
As discussed earlier, Tata Steel's European business has two parts—Netherlands and the
UK. While the former has historically done well, the latter has been a drag on the
company's operations. Tata Steel sold part of the UK business (speciality steel) for £100
mn, and has also implemented a transformation programme to improve the performance
of the remainder of the European business.
Tata Steel's strategy on turning around the European portfolio hinges upon: (1) the sale of
its peripheral businesses (several of them have been already sold), (2) resolution of the
UK pension issue, and (3) a broader strategic JV with ThyssenKrupp. The UK assets have
already been largely written down, and hence, there is little risk of a big impairment in the
future.
Tata Power: Mundra
As we have discussed earlier, the Mundra power plant remains a significant overhang on
Tata Power's overall business, given the under-recoveries in the project. The best
outcome under the circumstances would be for Tata Power to forego the asset. However,
this would require intense coordination with the regulator, state DISCOMs (distribution
Select divestments can either unlock value or
prevent value destruction
Includes sale of small businesses, fixing the
pension issue and a JV with ThyssenKrupp
The best outcome for Tata Power would be to
forego the asset
13 July 2017
Tata Group 47
companies) and banks. The street currently assigns a negative value to the Mundra Power
project, and hence, even if the company manages to forego the asset without any
consideration, this could be value accretive. This may not be easy to do, however.
Tata Teleservices
As discussed earlier, business-as-usual is not possible for Tata Teleservices for long,
given its weak market positioning, a challenging environment for telecom operators and a
high level of debt on its balance sheet. What option the Tata Group will take is far from
certain. The option that has been speculated about in the press (the Economic Times, for
example) in recent days, involves combining the operations of Tata Teleservices, Tata
Communications and Tata Sky with the Airtel group, with the Tata Group possibly
continuing to hold a stake. Tata Teleservices' spectrum has value for Airtel. Tata Sky is
likely the leading DTH player in revenue terms and is one of four key players in subscriber
terms—Airtel's DTH business is one of the other three. Tata Communications is the largest
wholesale voice carrier and has the largest submarine fibre network.
#9 Selective M&A approach in some businesses
While the Tata Group was very aggressive in terms of acquisitions between 2000 (started
with the Tetley acquisition) and 2008, especially of international assets, there were no
significant acquisitions post that, until Welspun Energy's renewal assets acquisition by
Tata Power in 2016. Challenges post the Corus acquisition may have made the
management more cautious.
Acquisitions can add value, particularly when they are synergistic and done at reasonable
valuations, and are an important part of any company's growth strategy. The Tata Group
has made several acquisitions (see the table below for some of the key acquisitions), most
of them being international. Tata Group has had a mixed M&A track-record—large
acquisitions such as JLR (by Tata Motors) and Citigroup Global Services (by TCS) have
proved to be value accretive, while Corus (by Tata Steel, and also the largest acquisition
by the Tata Group so far) has proved to be value destructive. Welspun Energy's
renewable assets' acquisition has also been criticised for a variety of reasons, including
valuations—as per newspaper reports (Economic Times), Tata Sons may consider a
forensic audit of this transaction, given concerns of valuations and the swiftness in
execution.
We believe the Group can be more active in terms of selective M&A, particularly in the
businesses where new capabilities need to be added (such as TCS) or the product
portfolio needs to be expanded (Voltas). Also, if the Group needs to increase its presence
in segments where it aspires to scale up (such as consumer retail for example), purely
organic growth may not be adequate.
Spectrum sale would be one option
No significant acquisition in the past
8-9 years, except for Welspun's renewables
The historic track record has been mixed

13 July 2017
Tata Group 48
Figure 67: Tata Group's key acquisitions
Acquired company Acquirer Year Consideration (US$ mn)
Corus Group Tata Steel 2007 ~12,000
Jaguar Land Rover Tata Motors 2008 2,300
Welspun Energy's renewable assets Tata Power 2016 1,380
Bumi Resources Tbk's coal mines Tata Power 2007 1,300
Soda ash business of General Chemical Industrial Products Inc Tata Chemicals 2008 1,005
Glaceau* Tata Tea 2007 677
Citigroup Global Services TCS 2008 505
Tetley Tata Global Beverages (erstwhile Tata Tea) 2000 450
Millennium Steel Tata Steel 2005 400
NatSteel's Steel business Tata Steel 2004-05 286
Teleglobe International Holdings Tata Communications (erstwhile VSNL) 2005 239
Eight O'Clock Coffee Tata Coffee 2006 220
Ritz Carlton, Boston Taj Hotels (Indian Hotel) 2006 170
Tyco Tata Communications (erstwhile VSNL) 2004 130
Daewoo Commercial Vehicle Tata Motors 2004 102
* Later sold to Coca-Cola. Source: Company data, Credit Suisse estimates
#10 Culture
While Tata Sons' objective in selecting Chandra as the Chairman would have been to
ensure continuity of culture (Chandra has been with the Tata Group for about 30 years), a
new Chairman would bring in some changes in culture. When Chandra took over TCS, we
believe that he brought in a more assertive sales approach, for example. While we do not
see any major cultural changes likely in the Tata Group, changes to some management
personnel cannot be ruled out, and the levels of accountability increased [will increase?].
Chandra has also got in new faces as part of his corporate team, including the CFO, and
the head of legal and head of strategy.

13 July 2017
Tata Group 49
Shift in focus will raise returns Within the broad themes highlighted in the earlier section, and the consequent key
imperatives, we believe Tata Motors, Tata Steel, Voltas and Titan could be the potential
beneficiaries among the stocks we cover. Additionally, going by press reports, Tata
Chemicals and Tata Global Beverages may also be impacted by some of these initiatives.
Tata Motors can gain from a better execution in the domestic business, while Tata Steel
can gain from better returns on the European operations and increasing focus on India.
Voltas can leverage its consumer brand for new consumer products (outside AC and air
coolers), and a demerger of its projects business can also make it a pure consumer play.
Titan may benefit from the Group's focus on the domestic consumption theme. Tata
Chemicals can leverage the Tata brand for new consumer offerings, and there can be
further elimination of non-core businesses. Tata Global Beverages could witness greater
domestic presence and sharper focus of its brand, and there can be sale of cross holdings
in the Group entities. Tata Power has long been hamstrung by the Mundra plant—while it
may not be easy to get out of, management may endeavour to do so. Tata
Communication may get impacted by any realignment of Group entities (as discussed in
newspaper reports—Economic Times) but it is not clear what form this will occur in. The
government also owns 26% stake in the company. TCS and Tata Elxsi may perform some
of the work for the Group's digital initiatives but the benefit will not be material for TCS,
given its scale. Tata Elxsi has a significant revenue contribution from the automobile
sector.
Within the Tata Group, we have an OUTPERFORM rating on Tata Motors, Tata Steel,
Titan and Voltas; we are NEUTRAL on TCS.
Figure 68: Companies that could be impacted from the likely strategy of new management
Themes Key imperatives Companies that could be impacted Incremental value (% of current market cap)
Return ratios Focus on the “big guns” (return optimisation)
Higher investment share for domestic B2C businesses going forward
Better leveraging of the strong consumer brands
Scaling up of current sub-scale segments such as Retail, Financial Services, Defence
Realignment of Group companies/divisions for value addition
Relook at the M&A approach
Divestments
Simplification of the cross-holding structure
Subscale, non-strategic operations rationalisation
Change in culture: Increased accountability
Tata Motors: Domestic focus
Tata Steel: Domestic focus, international restructuring
Voltas: Expansion of consumer business
Titan: Focus on domestic consumption
Tata Chemicals: Consumer, cross-holding
Tata Global: Domestic, cross-holding
US$5 bn (22%)
US$2 bn (18%)
US$0.5 bn (21%)
US$3 bn (37%)
US$0.5 bn (19%)
US$0.6 bn (34%)
Domestic consumption
Simplicity, in structure and holdings
Relevance, in segments where the Group has presence
Digital initiatives across segments
Source: Credit Suisse estimates, Credit suisse HOLT Lens
Tata Motors: Domestic business turnaround can
offer upside
Tata Motors' domestic PV business currently makes losses (due to a low market share,
and hence, lower capacity utilisation) and the CV business has lost significant market
share. The domestic business' margins are currently close to 4% vs 15% for Maruti and
12% for Ashok Leyland, and there is a significant gap in the volume growth as well (Tata
Tata Motors, Tata Steel, Voltas and Titan could
be the potential beneficiaries
Additionally, Tata Global and Tata
Chemicals may be impacted

13 July 2017
Tata Group 50
Motors' domestic volumes grew at -1% over the last three years vs 11%/23% volume
CAGR for Maruti/Ashok Leyland). Tata Motors' domestic business currently gets a lower
multiple (8x FY19 target EV/EBITDA for our SOTP valuation) than its peers (13x for Maruti
and 10x for Ashok Leyland), given weaker fundamentals.
Any improvement in this business (higher market share in passenger vehicles, protection
of market share in commercial vehicles and material margin expansion—close to Maruti
and Ashok Leyland) can lead to an earnings upgrade as well as rerating. This could add a
significant value to the domestic business that currently accounts for just 13% of our
SOTP (or US$3.6 bn in absolute terms vs the market cap of US$35 bn for Maruti and
US$5 bn for Ashok Leyland).
We have an OUTPERFORM rating on the stock, with a TP of Rs630. FY17-19E earnings
CAGR will be strong (from a low base) at +70% (helped by platform consolidation, strong
momentum in Land Rover). The JLR business is currently trading at 3x FY18E
EV/EBITDA, and our estimates do not factor in any significant recovery in the domestic
business.
Incremental value for Tata Motors
We have tried to understand what is the kind of incremental value that can be created if
some of these decisions get the desired results. We believe the key upside on Tata Motors
can come from a turnaround in the domestic business. The recent change of guard at the
CV business is a good sign as it signals a strong intention. However, more needs to be
done especially in terms of filling white spaces and making the organisation agile to
respond quickly to market changes. For this scenario, we assume a 15% CAGR in CV
volumes in two years on the back of market share improvement. We believe that could
also warrant an increase in multiples from 8x to 9x and could provide a Rs50/share
upside. Its financing subsidiary, Tata Motors Finance has not been run properly and has
had large asset quality issues. We believe if it is run properly, it can easily trade at a 30%
ratio to AUM (currently the more expensive NBFCs trade at 60% to 80% ratio). We reckon
the valuation of the China JV can be improved by setting a benchmark for the same by
listing it on the HK stock exchange like Brilliance. These two initiatives could provide an
additional Rs50/share and hence a total Rs100/share incremental upside is possible.
Figure 69: Tata Motors: Incremental value
Current value per share Possible incremental value
in the medium term
What needs to happen?
Domestic business 80 130 Revival in CV business where company recoups some market share; will
lead to rerating of India business to 9x EV/EBITDA.
Tata Motors Finance 10 30 Needs to be run like a proper NBFC; other Auto OEMs owned NBFCs
getting much better value today as run well and diversified beyond Autos
China JV 70 100 A separate HK listing (like Brilliance) of the China JV can set a
benchmark valuation for the JV
Value of the above businesses 160 260
Source: Company data, Credit Suisse estimates
Tata Steel: The European business turnaround can
improve returns significantly
An EU turnaround, if properly executed, can make the European business self-sufficient
and may improve the overall returns significantly. The company has already moved its
active employees in the UK from a defined benefit pension plan to a defined contribution
plan. Additionally, steps to de-link the pension fund from the scheme sponsor are
separately under way. That should pave way for an eventual JV with ThyssenKrupp, and
possibly help the business become self-sufficient. The ThyssenKrupp synergy is hard to
quantify, but looking at the last four major EU deals, (our European team believes

13 July 2017
Tata Group 51
~US$24/t of synergy may come through cost savings, market consolidation and better
utilisations). This could potentially add ~Rs100/ share to Tata’s current market price
In the India operations, we may see a capex breather for some time (key to deleverage
balance sheet) before Tata embarks on the Kalinganagar expansion (potentially adding
another 3-5mt of capacity at a very efficient sub-US$500/t of capex).
We have an OUTPERFORM rating on the stock, with a TP of Rs650. We expect the global
steel cycle to remain supportive: (1) While China’s steel demand will gradually moderate, it
will still remain strong in the near term, supported by 15-20% growth in infrastructure
investments, (2) policy remains broadly supportive ahead of the 19th National Congress of
the CPC, and (3) inventory levels have corrected in the last three months, and we see
upside risks to the raw material prices (iron ore, coking coal). With this backdrop, the
ongoing restructuring in the EU operations (pension de-linking, likely JV with
ThyssenKrupp) could further de-risk future cash flows and yield synergies.
Incremental value for Tata Steel
We start with a base case of 12.5 mt domestic output at US$160/t (Rs10,400/t) of EBITDA
for the domestic operations and 10.2mt of EU sales at US$60/t of EBITDA in FY19.
Assigning the domestic EBITDA a 7x multiple and that for the EU operations 6.5x, we
arrive at a Rs650 valuation (CS’s current target price).
Synergy from the Tata-TK Joint Venture could be ~US$600 mn (US$24/t for a 25mt
combined capacity). That would add Rs100/share (assuming a 50% share in the JV and
80% utilisation). The Tata-TK JV talks are still in the initial phases however (Tata awaits a
full and final pension resolution, though an in-principle approval from the regulator is
already in place).
The Kalinganagar greenfield project is designed to eventually ramp up to a 12-15mt
facility. With most infrastructural bottlenecks taken care of, while executing the 3mtpa
Phase-I (access to road, rail, water, power), the follow-on capex should come at sub-
industry levels of US$900-1,000/t. We believe it could be as low as US$500/t and thus,
would be immensely value accretive. A 3 mt plant would add Rs56/share, even if fully
funded by debt, once operational (say three years later). Adjusting for the time value of
money, it could add Rs40/share.
All of the above could potentially take the fair value up to Rs740. We see local positives as
well: (1) Anti-dumping duties remain in place till 2021 and (2) the ongoing IBC proceedings
against five indebted steel makers may lead to industry consolidation, further helping
supply discipline.
However, one must note the key assumption here, that the broader steel cycle remains
supportive, with prices in China and elsewhere holding steady (valuation highly sensitive
to EBITDA/t courtesy financial leverage). Given uncertainties around the demand in China
(demand should moderate; 2018 won’t be as strong as 2017), we do not build in any of
these benefits (JV synergies/ Kalinganagar expansion gains) in our fair value at the
moment.
Voltas: Consumer business expansion, demerger of
projects can make Voltas a good consumer play
Being the market leader, Voltas has a strong brand in the air-conditioner category. The
recent venture into other consumer durable segments (JV with Arcelik for co-branded
consumer durable products) broadens its consumer portfolio.
The size of the opportunity is fairly large, and 7% market share in three years in this
opportunity basket would be equivalent to the current size of the entire room AC segment.
There can potentially be other products that can add further upside potential.

13 July 2017
Tata Group 52
Figure 70: Market size and key players—manifold opportunity vs just ACs
Product Mkt size (US$mn) Five year CAGR (%) Key players
Washing machines 1,369 10.4% LG (26%), Samsung (20%), Videocon (16%), Whirlpool (11%), Godrej (7%),
IFB (6%)
Microwaves 285 10.2% LG (29%), Samsung (26%), IFB (15%), Whirlpool 6%), Godrej (6%),
Panasonic (6%)
Refrigerators 3,217 17.3% LG (25%), Samsung (22%), Whirlpool (13%), Godrej (12%), Videocon (9%),
Haier
ACs 2,015 11.3% Voltas (+21%), LG (~19%), Samsung (~10%), (3%), Bluestar (~10%),
Daikin (9%), Videocon (7%)
Source: Company data, Credit Suisse estimates
Furthermore, if the Electro-Mechanical Projects division is demerged (into another similar
Group company such as Tata Projects) this can make Voltas largely a consumer business.
A pure consumer-facing company can also command a higher value.
We have an OUTPERFORM rating on Voltas with a TP of Rs585 on (1) an attempt at
addressing a large opportunity in consumer durables, (2) strong AC business performance
including possible benefit from the exit of LG from fixed speeds, (3) better project segment
outlook, and (4) market valuation of its peers. Our valuation is supported by segmental
SOTP analysis and uses 33x multiple on FY19E consumer facing business earnings.
Incremental value for Voltas
Key areas where Voltas can see additional value creation are: (1) strong traction in the
consumer durables segment, where the company has entered into a JV with Arcelik to
manufacture and sell consumer durables products; (2) strong growth in the AC market
leveraging the brand better with Voltas maintaining its ~20% market share, and (3)
divestment of the engineering and projects business which may unlock some more value
from that assumed. Voltas is already geared towards introducing consumer durables
products by Diwali (Sep/Oct) this year. The entry into the consumer durables segment is
likely to strengthen Voltas' channel presence as the company will be addressing a higher
share of a consumer's wallet, and will have multiple products to offer as compared to only
ACs. This, in turn, can have a beneficial effect on the AC business as well. The sale of the
projects business at an EV/EBITDA multiple of 8-9x assuming normalised operating
margins can release Rs 28-31 bn of capital. This capital can then be used to strengthen
the consumer durables business. The sale of projects business will also improve overall
growth and margins, and offer a cleaner play on Indian consumer durables business,
where current low penetration levels will ensure sustained growth over the medium to long
term. This can potentially lead to better multiples for the AC and consumer durables
businesses. Better operating performance of the AC business and higher market share in
consumer durables can add an incremental Rs100 per share from what is already
assumed.
Scenario analysis based on HOLT
(Note: HOLT is not part of Credit Suisse Research.)
HOLT is a value-based, return on capital framework proprietary to Credit Suisse. HOLT
provides an objective view of over 20,000 companies in 65 countries using a methodology
that examines accounting information, converts it to cash, and then values that cash,
allowing investors to identify key drivers of value

13 July 2017
Tata Group 53
Figure 71: Scenario analysis based on HOLT
Company CMP (Rs) Default (consensus) If some of the above initiatives work
Assumptions (FY19, FY20, FY21) HOLT derived value Assumptions (FY19, FY20, FY21) HOLT derived value
Titan
531
Rev. growth (17%, 17%, 17%)
550
Rev. growth (22%, 22%, 22)
750 EBITDA margin (10%, 10%, 10%) EBITDA margin (10%, 10%, 10%)
Asset Turns (2.1, 2.2, 2.3) Asset Turns (2.1, 2.2, 2.3)
Tata Global Beverage
173
Rev. growth (6%, 6%, 6%)
160
Rev. growth (12%, 12%, 12%)
220 EBITDA margin (10%, 10%, 10%) EBITDA margin (11%, 11%, 11%)
Asset Turns (1.1, 1.1, 1.1) Asset Turns (1.2, 1.2, 1.2)
Tata Chemicals
642
Rev. growth (7%, 7%, 7%)
580
Rev. growth (12%, 12%, 12%)
700 EBITDA margin (16%, 16%, 16%) EBITDA margin (16%, 16%, 16%)
Asset Turns (0.5, 0.6, 0.6) Asset Turns (0.6, 0.7, 0.8)
Source: Credit Suisse HOLT LensTM
Overall Group financials likely to improve over the
next two years
Using our estimates and consensus expectations for non-covered stocks, we believe the
Group's financials should improve over the next couple of years. As per our calculation,
the Group ROE was 18.5% in FY16, likely to have declined to below 17% in FY17, and is
expected to improve to over 19% in FY19. The major contributors to the ROE are likely to
be Tata Motors (we expect ROE to improve from 10% in FY17 to 17% in FY19) and Tata
Steel (from 14% to 20%).
Net debt to equity is likely to trend down as well—from 1.7x in FY17 to about 1.2x in FY19.
Tata Steel, Tata Motors and Tata Power may likely witness a better debt coverage. We
expect Tata Steel's net debt to EBITDA to decline from 4.4x in FY17 to 3.7x in FY19, and
Tata Motors' net debt to EBITDA to improve from 1.2x to 0.3x. As per Thomson Reuters
consensus estimates, Tata Power (from 6.4x to 5.1x) and Tata Chemicals (1.4x to 0.5x)
are also likely to witness an improvement.
We do not think analyst estimates factor in any of the major changes that have been
discussed in this report. If the Group is able to execute on any of these, the improvement
can be far more significant.
Figure 72: Tata Group's ROE is likely be on an
uptrend over FY17-19
Figure 73: And net debt to EBITDA is likely to trend
down over the next two years
Source: Company data, Thomson Reuters, Credit Suisse research Source: Company data, Thomson Reuters, Credit Suisse research
10%
11%
12%
13%
14%
15%
16%
17%
18%
19%
20%
FY16 FY17 FY18 FY19
Tata Group - ROE
0.0
0.5
1.0
1.5
2.0
2.5
FY16 FY17 FY18 FY19
Tata Group - Net debt to EBITDA

13 July 2017
Tata Group 54
Asia Pacific/India Auto Parts & Equipment
Tata Motors Ltd. (TAMO.BO) Rating OUTPERFORM [V] Price (13-Jul-17, Rs) 458.40 Target price (Rs) 630.00 Upside/downside (%) 37.4 Mkt cap (Rs/US$ mn) 1,323,561 / 20,541 Enterprise value (Rs mn) 1,732,576 Number of shares (mn) 2,887 Free float (%) 66.0 52-wk price range (Rs) 589-420 ADTO-6M (US$ mn) 55.0 Target price is for 12 months.
[V] = Stock Considered Volatile (see Disclosure Appendix)
Research Analysts
Jatin Chawla
91 22 6777 3719
Vaibhav Jain
91 22 6777 3968
COMPANY UPDATE FOCUS LIST STOCK
JLR-driven product cycle to drive performance
■ It's a JLR story now. Tata Motors' (TTMT) acquisition of Jaguar Land Rover
(JLR) in 2008 has worked out very well for the company, in our view, and now
~85% of the company's value is attributed to JLR. The stability provided by
Tata's ownership, combined with a series of exciting new launches, helped
JLR increase its luxury market share from ~4.5% in 2008 to ~6.0% in 2015.
JLR margins, however, have been patchy, given the wide difference in
margin profile between Jaguar, and Land Rover (LR) products.
■ Product cycle once again shifting to higher-margin LR products. JLR
witnessed a significant margin dilution over FY15-17, as its product cycle
shifted to lower-margin Jaguar products and a part of its highly profitable
China business turned into a JV. With product action lined up on all the
higher-margin LR products (RR, RR Sport, Discovery, new launch Velar), LR
will likely drive volume growth and margin expansion in the next 12 months.
Moreover, these launches come on existing platforms and, hence, should
help drive platform consolidation-related cost benefits. A reduction in foreign
exchange drag should also support reported margins.
■ What can change? The domestic business needs a big shake-up, in our
view. While the passenger vehicle (PV) business gets a lot of negative
coverage, we believe the commercial vehicle (CV) business has been a
bigger negative surprise, losing ~15% market share in the past seven years.
The PV business, which incurs EBITDA losses, clearly needs a partner to
share the burden of investments into new products and help improve
utilisations. On the CV side, the company really needs to be a lot more
proactive in addressing customer needs, instead of resting on past laurels.
■ Strong EPS growth, reasonable valuations. We value JLR at 4x FY19E
EV/EBITDA (Rs456), the domestic business at 8x FY19E EV/EBITDA (Rs80),
its China JV at 10x FY19E P/E (Rs69), and others adjusted for debt (Rs25) to
arrive at our TP of Rs630. We expect a strong FY17-19 earnings CAGR (from
a low base) of 70%+. The JLR business is trading at 3x FY18E EV/EBITDA.
Share price performance
The price relative chart measures performance against the
S&P BSE SENSEX IDX which closed at 32,037.38 on
13/07/17. On 13/07/17 the spot exchange rate was
Rs64.44/US$1
Performance 1M 3M 12M Absolute (%) 2.0 1.2 -4.5 Relative (%) -1.0 -7.5 -19.7
Financial and valuation metrics
Year 3/16A 3/17E 3/18E 3/19E Revenue (Rs mn) 2,755,611.1 2,696,925.1 2,979,479.8 3,340,699.4 EBITDA (Rs mn) 402,366.6 369,123.6 428,311.7 533,850.7 EBIT (Rs mn) 232,224.8 190,073.7 240,153.3 309,619.5 Net profit (Rs mn) 131,433.0 74,543.6 158,941.9 221,270.7 EPS (CS adj.) (Rs) 38.70 21.95 46.80 65.16 Change from previous EPS (%) n.a. 0.0 0.0 0.0 Consensus EPS (Rs) n.a. 18.74 37.85 52.31 EPS growth (%) (12.1) (43.3) 113.2 39.2 P/E (x) 11.8 20.9 9.8 7.0 Dividend yield (%) 0.0 0.3 0.4 0.4 EV/EBITDA (x) 4.2 4.7 4.0 3.0 P/B (x) 1.93 1.77 1.51 1.25 ROE (%) 19.2 8.8 16.6 19.4 Net debt/equity (%) 46.0 46.5 38.3 21.2
Source: Company data, Thomson Reuters, Credit Suisse estimates

13 July 2017
Tata Group 55
Tata Motors Ltd. (TAMO.BO / )
Price (13 Jul 2017): Rs458.40; Rating: OUTPERFORM [V]; Target Price: Rs630.00; Analyst: Jatin Chawla
Income Statement (Rs mn) 03/16A 03/17E 03/18E 03/19E
Sales revenue 2,755,611 2,696,925 2,979,480 3,340,699 Cost of goods sold 2,166,891 2,145,417 2,349,675 2,580,928 EBITDA 402,367 369,124 428,312 533,851 EBIT 232,225 190,074 240,153 309,620 Net interest expense/(inc.) 46,207 43,541 34,661 30,661 Recurring PBT 161,004 121,103 178,010 251,197 Profit after tax 111,083 60,636 140,628 198,446 Reported net profit 110,237 74,544 158,942 221,271 Net profit (Credit Suisse) 131,433 74,544 158,942 221,271
Balance Sheet (Rs mn) 03/16A 03/17E 03/18E 03/19E
Cash & cash equivalents 328,800 291,748 255,512 338,109 Current receivables 129,900 127,186 140,573 157,746 Inventories 333,990 299,744 328,507 361,430 Other current assets 331,490 360,188 391,756 426,481 Current assets 1,124,179 1,078,866 1,116,349 1,283,766 Property, plant & equip. 655,106 735,604 801,924 851,258 Investments 204,661 204,661 204,661 204,661 Intangibles 681,766 772,218 846,740 902,174 Other non-current assets 0 0 0 0 Total assets 2,665,712 2,791,349 2,969,673 3,241,859 Current liabilities 1,194,293 1,248,320 1,322,615 1,428,443 Total liabilities 1,849,002 1,903,030 1,927,325 1,983,153 Shareholders' equity 807,827 878,414 1,031,422 1,246,758 Minority interests 8,883 9,905 10,927 11,949 Total liabilities & equity 2,665,712 2,791,349 2,969,673 3,241,859
Cash Flow (Rs mn) 03/16A 03/17E 03/18E 03/19E
EBIT 232,225 190,074 240,153 309,620 Net interest (46,234) (42,380) (35,436) (32,729) Tax paid (10,430) (32,512) (37,382) (52,751) Working capital (20,068) 62,289 577 21,007 Other cash & non-cash items 157,918 172,548 214,923 256,521 Operating cash flow 313,412 350,018 382,835 501,667 Capex (296,904) (350,000) (329,000) (329,000) Free cash flow to the firm 16,507 18 53,835 172,667 Investing cash flow (348,198) (350,000) (329,000) (329,000) Equity raised 135,700 0 0 0 Dividends paid (730) (3,956) (5,934) (5,934) Financing cash flow 116,146 (2,934) (54,912) (54,912) Total cash flow 81,360 (2,916) (1,077) 117,755 Adjustments 0 0 0 0 Net change in cash 81,360 (2,916) (1,077) 117,755
Per share 03/16A 03/17E 03/18E 03/19E
Shares (wtd avg.) (mn) 3,396 3,396 3,396 3,396 EPS (Credit Suisse) (Rs) 38.70 21.95 46.80 65.16 DPS (Rs) 0.21 1.17 1.75 1.75 Operating CFPS (Rs) 92.29 103.07 112.73 147.73
Earnings 03/16A 03/17E 03/18E 03/19E
Growth (%) Sales revenue 4.9 (2.1) 10.5 12.1 EBIT (19.2) (18.2) 26.3 28.9 EPS (12.1) (43.3) 113.2 39.2 Margins (%) EBITDA 14.6 13.7 14.4 16.0 EBIT 8.4 7.0 8.1 9.3
Valuation (x) 03/16A 03/17E 03/18E 03/19E
P/E 11.8 20.9 9.8 7.0 P/B 1.93 1.77 1.51 1.25 Dividend yield (%) 0.0 0.3 0.4 0.4 EV/sales 0.6 0.6 0.6 0.5 EV/EBITDA 4.2 4.7 4.0 3.0 EV/EBIT 7.3 9.1 7.2 5.1
ROE analysis (%) 03/16A 03/17E 03/18E 03/19E
ROE 19.2 8.8 16.6 19.4 ROIC 17.0 9.9 13.8 16.5
Credit ratios 03/16A 03/17E 03/18E 03/19E
Net debt/equity (%) 46.0 46.5 38.3 21.2 Net debt/EBITDA (x) 0.93 1.12 0.93 0.50
Company Background
Tata Motors is an India-based company in the commercial and passenger vehicles business. The company, through its subsidiary Jaguar and Land Rover, is present in Europe, US and Chinese markets as a luxury car company.
Blue/Grey Sky Scenario
Our Blue Sky Scenario (Rs) 800.00
Our blue sky scenario of Rs800 assumes a multiple of 4.5x for JLR and further foreign exchange benefit.
Our Grey Sky Scenario (Rs) 400.00
Our grey sky scenario of Rs400 assumes a multiple of 2.5x for JLR and lower margins on a sharp rise in incentives.
Share price performance
The price relative chart measures performance against the S&P BSE SENSEX
IDX which closed at 32,037.38 on 13-Jul-2017
On 13-Jul-2017 the spot exchange rate was Rs64.44/US$1
Source: Company data, Thomson Reuters, Credit Suisse estimates

13 July 2017
Tata Group 56
Asia Pacific/India Steel
Tata Steel Ltd (TISC.BO / TATA IN) Rating OUTPERFORM Price (13-Jul-17, Rs) 563.00 Target price (Rs) (from 600.00) 650.00 Upside/downside (%) 15.5 Mkt cap (Rs/US$ mn) 546,794 / 8,486 Enterprise value (Rs mn) 1,366,792 Number of shares (mn) 971.22 Free float (%) 68.0 52-wk price range (Rs) 563-350 ADTO-6M (US$ mn) 50.6 Target price is for 12 months.
Research Analysts
Ravi Shankar
91 22 6777 3869
Neelkanth Mishra
91 22 6777 3716
Prateek Singh
91 22 6777 3894
INCREASE TARGET PRICE
Catalysts ahead; steel cycle supportive
■ Leading steel maker; stable Indian operations, now healthier post surgery
in the UK operations. Tata Steel is one of the largest steel producers globally
(capacity: ~25 mtpa) with operations in India (integrated, highly profitable) and
the EU (hitherto struggling, but restructuring has helped meaningfully). Tata’s
Indian operations have now fully ramped up, with its 3 mt greenfield steel plant
at Kalinganagar operating at close to full utilisation. Thanks to a barrage of
duties put in place by the government, there exists a floor price for imports/
domestic prices, if India is a net importer of steel.
■ Supportive macro, and restructuring in EU operations create tailwinds.
We expect the global steel cycle to stay supportive: (1) while China’s steel
demand would gradually moderate, it should still remain strong in the near
term, supported by 15-20% growth in infrastructure investments, (2) policy
remains broadly supportive ahead of the 19th National Congress of the CPC,
and (3) inventory levels have corrected in the past three months, and we see
upside risks to raw material prices (iron ore, coking coal). Against this
backdrop, the ongoing restructuring in EU operations (pension de-linking,
likely JV with ThyssenKrupp) could further de-risk future cash flows and yield
synergies.
■ What can change? We expect continued focus on the EU turnaround plans,
despite much of the strategy having been chalked out while Mr Cyrus Mistry
was at the helm. In the Indian operations, we may see a capex breather for
some time (key to deleverage balance sheet), before Tata embarks on the
Kalinganagar expansion (potentially adding another 3-5 mt of capacity at a
very efficient sub-US$500/t of capex).
■ Clear catalysts lined up. Although synergy is hard to quantify, looking at the
last four major EU deals, our European team believes ~US$24/t of synergy
could come through cost savings, market consolidation and better utilisations).
This potentially adds ~Rs100/share to Tata’s current market price.
Share price performance
The price relative chart measures performance against the
S&P BSE SENSEX IDX which closed at 32,037.38 on
13/07/17. On 13/07/17 the spot exchange rate was
Rs64.44/US$1
Performance 1M 3M 12M Absolute (%) 10.7 21.3 57.4 Relative (%) 7.7 12.6 42.2
Financial and valuation metrics
Year 3/16A 3/17E 3/18E 3/19E Revenue (Rs mn) 1,159,517.4 1,127,158.5 1,215,572.2 1,228,280.1 EBITDA (Rs mn) 63,858.0 160,390.5 185,462.2 188,775.8 EBIT (Rs mn) 13,039.6 103,606.8 127,675.1 129,631.3 Net profit (Rs mn) (30,493.2) (41,685.7) 98,040.6 66,040.3 EPS (CS adj.) (Rs) (31.01) (42.39) 99.69 67.15 Change from previous EPS (%) n.a. - 52.9 (0.0) Consensus EPS (Rs) n.a. 41.67 49.60 59.09 EPS growth (%) n.m. n.m. n.m. (32.6) P/E (x) (18.2) (13.3) 5.6 8.4 Dividend yield (%) 1.4 1.4 1.4 1.4 EV/EBITDA (x) 20.6 8.6 7.1 6.7 P/B (x) 1.94 2.36 1.71 1.45 ROE (%) (10.2) (16.1) 35.1 18.7 Net debt/equity (%) 254.6 333.3 228.7 181.2
Source: Company data, Thomson Reuters, Credit Suisse estimates

13 July 2017
Tata Group 57
Tata Steel Ltd (TISC.BO / TATA IN)
Price (13 Jul 2017): Rs563.00; Rating: OUTPERFORM; Target Price: (from Rs600.00) Rs650.00; Analyst: Ravi Shankar
Income Statement (Rs mn) 03/16A 03/17E 03/18E 03/19E
Sales revenue 1,159,517 1,127,159 1,215,572 1,228,280 Cost of goods sold 689,623 484,312 649,498 635,746 EBITDA 63,858 160,390 185,462 188,776 EBIT 13,040 103,607 127,675 129,631 Net interest expense/(inc.) 41,286 50,723 50,678 51,028 Recurring PBT 23,008 65,531 126,015 91,748 Profit after tax 7,959 37,750 97,964 65,964 Reported net profit 9,255 37,826 98,041 66,040 Net profit (Credit Suisse) (30,493) (41,686) 98,041 66,040
Balance Sheet (Rs mn) 03/16A 03/17E 03/18E 03/19E
Cash & cash equivalents 115,783 66,796 115,240 162,985 Current receivables 117,012 113,746 122,669 123,951 Inventories 203,560 197,879 213,401 215,631 Other current assets 201,121 195,508 210,844 213,048 Current assets 637,475 573,929 662,152 715,615 Property, plant & equip. 812,636 829,866 856,093 860,962 Investments 20,845 20,886 20,927 20,968 Intangibles 130,722 127,779 124,835 121,891 Other non-current assets 30,821 26,450 23,413 19,540 Total assets 1,632,500 1,578,910 1,687,420 1,738,976 Current liabilities 549,142 529,598 556,998 559,438 Total liabilities 1,330,969 1,327,927 1,347,076 1,341,265 Shareholders' equity 284,789 234,240 323,602 380,969 Minority interests 16,542 16,542 16,542 16,542 Total liabilities & equity 1,632,500 1,578,910 1,687,420 1,738,976
Cash Flow (Rs mn) 03/16A 03/17E 03/18E 03/19E
EBIT 13,040 103,607 127,675 129,631 Net interest (41,286) (50,723) (50,678) (51,028) Tax paid (15,050) (27,782) (28,050) (25,785) Working capital (20,041) (8,483) (10,631) (1,528) Other cash & non-cash items 63,622 (10,004) 106,881 72,366 Operating cash flow 284 6,615 145,197 123,657 Capex (48,894) (70,000) (77,056) (57,056) Free cash flow to the firm (48,610) (63,385) 68,140 66,601 Investing cash flow (44,240) (66,740) (78,074) (57,238) Equity raised 9,548 (1,091) (907) (903) Dividends paid (7,760) (7,771) (7,771) (7,771) Financing cash flow 57,243 11,138 (18,679) (18,674) Total cash flow 13,287 (48,987) 48,444 47,745 Adjustments 0 0 0 0 Net change in cash 13,287 (48,987) 48,444 47,745
Per share 03/16A 03/17E 03/18E 03/19E
Shares (wtd avg.) (mn) 983 983 983 983 EPS (Credit Suisse) (Rs) (31.01) (42.39) 99.69 67.15 DPS (Rs) 7.99 8.00 8.00 8.00 Operating CFPS (Rs) 0.29 6.73 147.65 125.74
Earnings 03/16A 03/17E 03/18E 03/19E
Growth (%) Sales revenue (16.2) (2.8) 7.8 1.0 EBIT (75.9) 694.6 23.2 1.5 EPS 22.3 (36.7) 335.2 (32.6) Margins (%) EBITDA 5.5 14.2 15.3 15.4 EBIT 1.1 9.2 10.5 10.6
Valuation (x) 03/16A 03/17E 03/18E 03/19E
P/E (18.2) (13.3) 5.6 8.4 P/B 1.94 2.36 1.71 1.45 Dividend yield (%) 1.4 1.4 1.4 1.4 EV/sales 1.1 1.2 1.1 1.0 EV/EBITDA 20.6 8.6 7.1 6.7 EV/EBIT 100.8 13.4 10.4 9.8
ROE analysis (%) 03/16A 03/17E 03/18E 03/19E
ROE (10.2) (16.1) 35.1 18.7 ROIC 0.4 5.5 9.0 8.3
Credit ratios 03/16A 03/17E 03/18E 03/19E
Net debt/equity (%) 254.6 333.3 228.7 181.2 Net debt/EBITDA (x) 12.02 5.22 4.20 3.82
Company Background
Tata Steel Limited is a diversified steel producer. It has a global presence in 50 markets and manufacturing operations in 26 countries. It provides steel for different industries, which include construction, automotive, aerospace, consumer goods.
Blue/Grey Sky Scenario
Our Blue Sky Scenario (Rs) (from 680.00) 750.00
To our base case scenario (domestic hot-rolled steel prices at US$485/t and EU EBITDA assumed at US$60/t), we add ~US$600 mn of synergies from a potential Tata-Thyssen Krupp Joint Venture ($24/t of synergy for a combined 25mt of capacity). This adds Rs100/share to our base case, throwing up a blue sky fair value of Rs750/share.
Our Grey Sky Scenario (Rs) (from 400.00) 430.00
We assume that either the Tata-Thyssen Krupp JV does not go through or no synergies accrue out of it. Further, we assume Indian steel prices drop by US$30/t and EU EBITDA contracts by US$10/t vs. the base case assumption. This results in a grey sky scenario value of Rs430/share.
Share price performance
The price relative chart measures performance against the S&P BSE SENSEX
IDX which closed at 32,037.38 on 13-Jul-2017
On 13-Jul-2017 the spot exchange rate was Rs64.44/US$1
Source: Company data, Thomson Reuters, Credit Suisse estimates

13 July 2017
Tata Group 58
Asia Pacific/India Luxury Goods
Titan Company Ltd (TITN.BO) Rating OUTPERFORM Price (13-Jul-17, Rs) 534.60 Target price (Rs) 560.00 Upside/downside (%) 4.8 Mkt cap (Rs/US$ mn) 474,610 / 7,366 Enterprise value (Rs mn) 472,585 Number of shares (mn) 887.79 Free float (%) 50.0 52-wk price range (Rs) 552-303 ADTO-6M (US$ mn) 14.0 Target price is for 12 months.
Research Analysts
Arnab Mitra
91 22 6777 3806
Rohit Kadam, CFA
91 22 6777 3824
COMPANY UPDATE
Moving from market leadership to dominance
■ Transformed wedding jewellery strategy and other initiatives to drive
market dominance. Titan’s jewellery growth over FY17-19 will likely
accelerate, driven by (1) wedding jewellery, (2) high-value diamonds, (3)
collections, (4) Golden Harvest, and (5) network addition. Wedding jewellery
constitutes over 50% of the market, but for Titan it is less than 20% of sales.
Over the past 1-2 years the company has significantly improved the product
and price offering. Titan now offers wedding jewellery customised for the 13
major communities in India and has attractive bulk discounts for weddings.
This is backed with advertising, so that Tanishq is seen as a destination for
wedding jewellery.
■ Regulatory headwinds over for the organised sector; share gains to
accelerate from here on. The GST rate on jewellery has been set at 3%,
which is similar to the current taxation, removing a potential risk. This ends
the series of regulatory headwinds that Titan has faced since FY13, such as
discontinuation of the Golden Harvest and PAN requirements. Over the next
2-3 years, the GST should gradually force the unorganised sector to become
tax-compliant and take away their price advantage.
■ Strong growth should lead to margin expansion. Over FY13-16, Titan
nearly doubled its retail space in jewellery but there was a 40% drop in sales
per sq ft. Thus, when growth in same-store-sales picks up, the fixed cost base
will see operating leverage. Titan’s model does not have very high operating
leverage, but can add 40-50 bp of margins if SSSG is over 10%. We also
expect margin expansion in watches due to cost controls.
■ What can change? Titan is organically attempting to build new business
segments, e.g., ethnic Indian wear and perfumes. The company might also
consider inorganic options and entering into JVs with international brands, like it
did for Mont Blanc, to move faster on this. Within jewellery there could be
opportunities to acquire regional players, to drive growth and market share.
Share price performance
The price relative chart measures performance against the
S&P BSE SENSEX IDX which closed at 32,037.38 on
13/07/17. On 13/07/17 the spot exchange rate was
Rs64.44/US$1
Performance 1M 3M 12M Absolute (%) 2.6 10.7 32.3 Relative (%) -0.4 2.0 17.1
Financial and valuation metrics
Year 3/16A 3/17E 3/18E 3/19E Revenue (Rs mn) 112,645.3 130,035.5 154,719.1 181,835.1 EBITDA (Rs mn) 9,453.2 12,324.9 15,353.8 18,830.3 EBIT (Rs mn) 8,484.1 11,235.4 14,128.5 17,469.0 Net profit (Rs mn) 7,056.8 8,316.8 10,473.3 12,927.9 EPS (CS adj.) (Rs) 7.95 9.37 11.80 14.56 Change from previous EPS (%) n.a. 0.0 0.0 0.0 Consensus EPS (Rs) n.a. 8.98 11.38 13.61 EPS growth (%) (14.3) 17.9 25.9 23.4 P/E (x) 67.3 57.1 45.3 36.7 Dividend yield (%) 0.4 0.5 0.6 0.8 EV/EBITDA (x) 50.2 38.4 30.7 24.9 P/B (x) 13.30 11.56 9.79 8.24 ROE (%) 21.2 21.7 23.4 24.4 Net debt/equity (%) 0.0 Net cash Net cash Net cash
Source: Company data, Thomson Reuters, Credit Suisse estimates
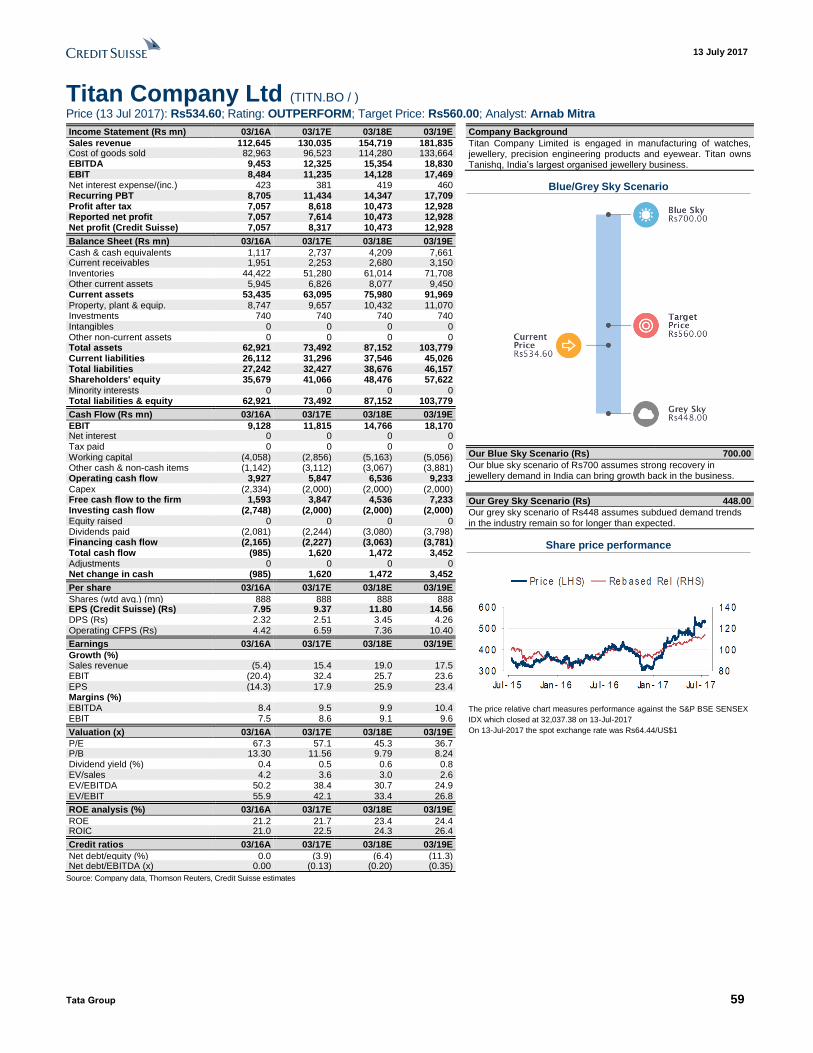
13 July 2017
Tata Group 59
Titan Company Ltd (TITN.BO / )
Price (13 Jul 2017): Rs534.60; Rating: OUTPERFORM; Target Price: Rs560.00; Analyst: Arnab Mitra
Income Statement (Rs mn) 03/16A 03/17E 03/18E 03/19E
Sales revenue 112,645 130,035 154,719 181,835 Cost of goods sold 82,963 96,523 114,280 133,664 EBITDA 9,453 12,325 15,354 18,830 EBIT 8,484 11,235 14,128 17,469 Net interest expense/(inc.) 423 381 419 460 Recurring PBT 8,705 11,434 14,347 17,709 Profit after tax 7,057 8,618 10,473 12,928 Reported net profit 7,057 7,614 10,473 12,928 Net profit (Credit Suisse) 7,057 8,317 10,473 12,928
Balance Sheet (Rs mn) 03/16A 03/17E 03/18E 03/19E
Cash & cash equivalents 1,117 2,737 4,209 7,661 Current receivables 1,951 2,253 2,680 3,150 Inventories 44,422 51,280 61,014 71,708 Other current assets 5,945 6,826 8,077 9,450 Current assets 53,435 63,095 75,980 91,969 Property, plant & equip. 8,747 9,657 10,432 11,070 Investments 740 740 740 740 Intangibles 0 0 0 0 Other non-current assets 0 0 0 0 Total assets 62,921 73,492 87,152 103,779 Current liabilities 26,112 31,296 37,546 45,026 Total liabilities 27,242 32,427 38,676 46,157 Shareholders' equity 35,679 41,066 48,476 57,622 Minority interests 0 0 0 0 Total liabilities & equity 62,921 73,492 87,152 103,779
Cash Flow (Rs mn) 03/16A 03/17E 03/18E 03/19E
EBIT 9,128 11,815 14,766 18,170 Net interest 0 0 0 0 Tax paid 0 0 0 0 Working capital (4,058) (2,856) (5,163) (5,056) Other cash & non-cash items (1,142) (3,112) (3,067) (3,881) Operating cash flow 3,927 5,847 6,536 9,233 Capex (2,334) (2,000) (2,000) (2,000) Free cash flow to the firm 1,593 3,847 4,536 7,233 Investing cash flow (2,748) (2,000) (2,000) (2,000) Equity raised 0 0 0 0 Dividends paid (2,081) (2,244) (3,080) (3,798) Financing cash flow (2,165) (2,227) (3,063) (3,781) Total cash flow (985) 1,620 1,472 3,452 Adjustments 0 0 0 0 Net change in cash (985) 1,620 1,472 3,452
Per share 03/16A 03/17E 03/18E 03/19E
Shares (wtd avg.) (mn) 888 888 888 888 EPS (Credit Suisse) (Rs) 7.95 9.37 11.80 14.56 DPS (Rs) 2.32 2.51 3.45 4.26 Operating CFPS (Rs) 4.42 6.59 7.36 10.40
Earnings 03/16A 03/17E 03/18E 03/19E
Growth (%) Sales revenue (5.4) 15.4 19.0 17.5 EBIT (20.4) 32.4 25.7 23.6 EPS (14.3) 17.9 25.9 23.4 Margins (%) EBITDA 8.4 9.5 9.9 10.4 EBIT 7.5 8.6 9.1 9.6
Valuation (x) 03/16A 03/17E 03/18E 03/19E
P/E 67.3 57.1 45.3 36.7 P/B 13.30 11.56 9.79 8.24 Dividend yield (%) 0.4 0.5 0.6 0.8 EV/sales 4.2 3.6 3.0 2.6 EV/EBITDA 50.2 38.4 30.7 24.9 EV/EBIT 55.9 42.1 33.4 26.8
ROE analysis (%) 03/16A 03/17E 03/18E 03/19E
ROE 21.2 21.7 23.4 24.4 ROIC 21.0 22.5 24.3 26.4
Credit ratios 03/16A 03/17E 03/18E 03/19E
Net debt/equity (%) 0.0 (3.9) (6.4) (11.3) Net debt/EBITDA (x) 0.00 (0.13) (0.20) (0.35)
Company Background
Titan Company Limited is engaged in manufacturing of watches, jewellery, precision engineering products and eyewear. Titan owns Tanishq, India’s largest organised jewellery business.
Blue/Grey Sky Scenario
Our Blue Sky Scenario (Rs) 700.00
Our blue sky scenario of Rs700 assumes strong recovery in jewellery demand in India can bring growth back in the business.
Our Grey Sky Scenario (Rs) 448.00
Our grey sky scenario of Rs448 assumes subdued demand trends in the industry remain so for longer than expected.
Share price performance
The price relative chart measures performance against the S&P BSE SENSEX
IDX which closed at 32,037.38 on 13-Jul-2017
On 13-Jul-2017 the spot exchange rate was Rs64.44/US$1
Source: Company data, Thomson Reuters, Credit Suisse estimates

13 July 2017
Tata Group 60
Asia Pacific/India Electrical Equipment
Voltas (VOLT.BO / VOLT IN) Rating OUTPERFORM Price (13-Jul-17, Rs) 484.75 Target price (Rs) 585.00 Upside/downside (%) 20.7 Mkt cap (Rs/US$ mn) 160,396 / 2,489 Enterprise value (Rs mn) 144,883 Number of shares (mn) 330.88 Free float (%) 69.7 52-wk price range (Rs) 509-293 ADTO-6M (US$ mn) 12.3 Target price is for 12 months.
Research Analysts
Lokesh Garg
91 22 6777 3743
Vaibhav Jain
91 22 6777 3968
COMPANY UPDATE
Consumer foray excites; project presence drags
■ Much-needed foray into consumer durables to extend brand. After a long
wait and emerging as a market leader in the AC category, Voltas announced a
JV with Arcelik to launch co-branded consumer durable products. This foray
mitigates concerns about its single-segment exposure, opens up a large
opportunity, mutually fortifies its AC position, and is likely to spread risk between
partners while leveraging strengths. Arcelik is bringing in technology,
manufacturing, and sourcing skills, apart from a globally recognised brand. The
JV shortens the learning curve and time to market. Voltas aims to hit the stores
with its JV products this year itself and envisages manufacturing as well over a
period of time. The opportunity is significant as a 7% market share in these
categories could be equivalent to the scale of its current consumer business.
Early success in air coolers may provide it a platform for more gains.
■ Projects spread across many group entities; awaiting cycle. The outlook
for the projects segment seems more positive, with legacy projects mostly
closed now and thus the resulting backlog is better quality. Voltas’ projects
business is spread across rural electrification, water treatment, HVAC (heating,
ventilation and air conditioning) projects in India and the Middle East. Voltas
should evolve as a pure consumer-facing company while its projects business
could be consolidated in other group entities such as Tata Projects.
■ Engineering segment adds to the spread. Voltas' engineering products and
services segment, as an agent, offers sales and services support to equipment
manufactured by its principals. It is suffering from a cyclical downturn and is
spread across textiles, mining, construction, and material handling.
■ Retain OUTPERFORM and TP of Rs585. We retain our OUTPERFORM
rating, given Voltas' (1) attempt at addressing a large opportunity in consumer
durables, (2) strong AC business performance including a potential benefit on
the exit of LG from fixed speeds, (3) a better project segment outlook, and (4)
valuation compared to the market valuation of its peers. Our valuation is
supported by a segmental SOTP analysis and uses 33x P/E multiple on
FY19E consumer-facing business earnings.
Share price performance
The price relative chart measures performance against the
S&P BSE SENSEX IDX which closed at 32,037.38 on
13/07/17. On 13/07/17 the spot exchange rate was
Rs64.44/US$1
Performance 1M 3M 12M Absolute (%) -1.4 19.6 49.7 Relative (%) -4.4 10.8 34.6
Financial and valuation metrics
Year 3/16A 3/17E 3/18E 3/19E Revenue (Rs mn) 58,574.4 60,437.0 70,559.6 79,932.2 EBITDA (Rs mn) 4,369.3 5,573.8 6,612.7 7,468.8 EBIT (Rs mn) 4,091.2 5,307.2 6,328.1 7,155.2 Net profit (Rs mn) 3,449.1 5,021.3 5,573.6 6,411.3 EPS (CS adj.) (Rs) 10.43 15.18 16.85 19.38 Change from previous EPS (%) n.a. 0.0 0.0 0.0 Consensus EPS (Rs) n.a. 15.35 16.93 19.47 EPS growth (%) 2.0 45.6 11.0 15.0 P/E (x) 46.5 31.9 28.8 25.0 Dividend yield (%) 0.5 0.8 0.9 1.0 EV/EBITDA (x) 33.5 26.1 21.7 18.8 P/B (x) 6.69 5.84 5.11 4.47 ROE (%) 15.3 19.5 18.9 19.1 Net debt/equity (%) Net cash Net cash Net cash Net cash
Source: Company data, Thomson Reuters, Credit Suisse estimates

13 July 2017
Tata Group 61
Voltas (VOLT.BO / VOLT IN)
Price (13 Jul 2017): Rs484.75; Rating: OUTPERFORM; Target Price: Rs585.00; Analyst: Lokesh Garg
Income Statement (Rs mn) 03/16A 03/17E 03/18E 03/19E
Sales revenue 58,574 60,437 70,560 79,932 Cost of goods sold 41,261 42,755 50,093 57,077 EBITDA 4,369 5,574 6,613 7,469 EBIT 4,091 5,307 6,328 7,155 Net interest expense/(inc.) 83 74 10 7 Recurring PBT 5,114 7,241 8,127 9,104 Profit after tax 3,515 5,214 5,567 6,236 Reported net profit 3,449 5,021 5,574 6,411 Net profit (Credit Suisse) 3,449 5,021 5,574 6,411
Balance Sheet (Rs mn) 03/16A 03/17E 03/18E 03/19E
Cash & cash equivalents 1,971 1,428 3,569 6,269 Current receivables 14,326 14,791 17,268 19,561 Inventories 8,927 9,860 11,512 13,041 Other current assets 12,031 12,325 14,390 16,301 Current assets 37,255 38,404 46,738 55,172 Property, plant & equip. 2,117 1,764 1,980 2,166 Investments 15,182 15,182 15,182 15,182 Intangibles 892 892 892 892 Other non-current assets 541 541 541 541 Total assets 55,988 56,784 65,334 73,954 Current liabilities 29,361 28,042 32,672 36,994 Total liabilities 31,777 29,059 33,738 38,071 Shareholders' equity 23,952 27,467 31,369 35,856 Minority interests 258 258 258 258 Total liabilities & equity 55,988 56,784 65,365 74,185
Cash Flow (Rs mn) 03/16A 03/17E 03/18E 03/19E
EBIT 4,091 5,307 6,328 7,155 Net interest 153 148 88 88 Tax paid (1,599) (2,028) (2,560) (2,868) Working capital (262) (2,911) (1,514) (1,402) Other cash & non-cash items 278 267 285 314 Operating cash flow 2,661 784 2,627 3,288 Capex (567) 0 (500) (500) Free cash flow to the firm 2,094 784 2,127 2,788 Investing cash flow (4,811) 86 (500) (500) Equity raised 194 0 0 0 Dividends paid (860) (1,255) (1,393) (1,603) Financing cash flow 403 (3,155) (1,760) (2,012) Total cash flow (1,748) (2,285) 367 776 Adjustments 0 0 0 0 Net change in cash (1,748) (2,285) 367 776
Per share 03/16A 03/17E 03/18E 03/19E
Shares (wtd avg.) (mn) 331 331 331 331 EPS (Credit Suisse) (Rs) 10.43 15.18 16.85 19.38 DPS (Rs) 2.60 3.80 4.21 4.85 Operating CFPS (Rs) 8.04 2.37 7.94 9.94
Earnings 03/16A 03/17E 03/18E 03/19E
Growth (%) Sales revenue 13.0 3.2 16.7 13.3 EBIT 7.1 29.7 19.2 13.1 EPS 2.0 45.6 11.0 15.0 Margins (%) EBITDA 7.5 9.2 9.4 9.3 EBIT 7.0 8.8 9.0 9.0
Valuation (x) 03/16A 03/17E 03/18E 03/19E
P/E 46.5 31.9 28.8 25.0 P/B 6.69 5.84 5.11 4.47 Dividend yield (%) 0.5 0.8 0.9 1.0 EV/sales 2.5 2.4 2.0 1.8 EV/EBITDA 33.5 26.1 21.7 18.8 EV/EBIT 35.8 27.4 22.7 19.7
ROE analysis (%) 03/16A 03/17E 03/18E 03/19E
ROE 15.3 19.5 18.9 19.1 ROIC 28.3 33.1 31.6 31.7
Credit ratios 03/16A 03/17E 03/18E 03/19E
Net debt/equity (%) (57.6) (53.8) (53.9) (54.7) Net debt/EBITDA (x) (3.19) (2.67) (2.58) (2.64)
Company Background
Voltas offers engineering solutions in areas such as heating, ventilation, air conditioning, refrigeration, electro-mechanical projects, materials handling and water management. Voltas is among the leading companies in domestic AC products in India.
Blue/Grey Sky Scenario
Our Blue Sky Scenario (Rs) 650.00
Our blue sky scenario of Rs650 takes into account a possibility that competition and commodity prices have no impact on the AC market overall and within that Voltas continues to retain its position of strength in terms of market share (22%) and margins (13%). In such a scenario market multiple can expand to about 35x for the stock.
Our Grey Sky Scenario (Rs) 400.00
Our grey sky scenario of Rs400 assumes the impact of competition and higher prices on the AC market is sharp and persistent apart from Voltas losing its position of strength in the market. In such a scenario apart from earnings even the multiple would derate.
Share price performance
The price relative chart measures performance against the S&P BSE SENSEX
IDX which closed at 32,037.38 on 13-Jul-2017
On 13-Jul-2017 the spot exchange rate was Rs64.44/US$1
Source: Company data, Thomson Reuters, Credit Suisse estimates

13 July 2017
Tata Group 62
Asia Pacific/India Computer Services & IT Consulting
Tata Consultancy Services (TCS.BO / TCS IN) Rating NEUTRAL Price (13-Jul-17, Rs) 2,444 Target price (Rs) 2,250 Upside/downside (%) -7.9 Mkt cap (Rs/US$ mn) 4,678,615 / 72,610 Enterprise value (Rs mn) 4,225,235 Number of shares (mn) 1,914 Free float (%) 26.0 52-wk price range (Rs) 2,732-2,105 ADTO-6M (US$ mn) 51.6 Target price is for 12 months.
Research Analysts
Anantha Narayan
91 22 6777 3730
Nitin Jain
91 22 6777 3851
COMPANY UPDATE
Well placed, but lacks near-term momentum
■ Industry bellwether with an impressive track record. TCS is the bellwether
of the Indian IT services industry with revenue of close to US$18 bn, industry-
leading EBIT margin of 26%, and superior employee retention. Its revenue
has witnessed above 13% CAGR (organic, constant currency) over the last
five years vs the industry growth of slightly above 12%, despite a significantly
larger revenue base (1.3x of Cognizant and 1.7x of Infosys). The EBIT growth
has been in line with the industry average.
■ Industry going through structural shifts; TCS well placed. The Indian IT
industry is going through structural shifts. Automation and cloud have a
deflationary impact on the clients’ IT spending, and without a commensurate
increase in spends in the new area (likely to happen, but delayed due to the
current macro and political uncertainties), growth has slowed. TCS remains
among the best-placed IT companies to ride through the ongoing shifts in the
technology landscape, given its scale, diversified portfolio (across verticals
and service lines), long-term client relationships, and capabilities.
■ What can change? TCS has, so far, grown its business largely organically
(more so in the recent years). An active M&A approach, particularly in new
technology, could be helpful in making the transition quicker. Also, while
TCS's payout has been reasonably high, it has been lumpy. There is scope to
enhance the average payout and make it more consistent, given the cash pile
(over US$4.5 bn, after buyback) and free cash flow.
■ Stock trades below historical multiples; recovery in BFSI should be the
near-term trigger. TCS trades at 17x 12-month forward P/E, >10% below its
five-year average of 19x. Any recovery in BFSI spends (expected for some
time) could be a near-term trigger for the stock. A consistent and high
dividend payout should also help the P/E multiples.
Share price performance
The price relative chart measures performance against the
S&P BSE SENSEX IDX which closed at 32,037.38 on
13/07/17. On 13/07/17 the spot exchange rate was
Rs64.44/US$1
Performance 1M 3M 12M Absolute (%) -0.4 5.0 -1.9 Relative (%) -3.4 -3.8 -17.1
Financial and valuation metrics
Year 3/17A 3/18E 3/19E 3/20E Revenue (Rs mn) 1,179,660.0 1,234,106.3 1,365,456.8 1,503,403.5 EBITDA (Rs mn) 324,910.0 333,407.2 369,630.2 406,949.7 EBIT (Rs mn) 303,240.0 312,567.4 346,572.1 381,562.0 Net profit (Rs mn) 262,890.0 257,913.2 282,087.9 310,168.1 EPS (CS adj.) (Rs) 133.41 134.72 147.35 162.02 Change from previous EPS (%) n.a. 0.0 0.0 0.0 Consensus EPS (Rs) n.a. 138.17 150.29 161.63 EPS growth (%) 8.2 1.0 9.4 10.0 P/E (x) 18.3 18.1 16.6 15.1 Dividend yield (%) 1.9 2.8 3.0 3.4 EV/EBITDA (x) 12.9 12.8 11.3 10.0 P/B (x) 5.45 5.66 4.96 4.38 ROE (%) 32.6 30.2 31.9 30.8 Net debt/equity (%) Net cash Net cash Net cash Net cash
Source: Company data, Thomson Reuters, Credit Suisse estimates

13 July 2017
Tata Group 63
Tata Consultancy Services (TCS.BO / TCS IN)
Price (13 Jul 2017): Rs2,444; Rating: NEUTRAL; Target Price: Rs2,250; Analyst: Anantha Narayan
Income Statement (Rs mn) 03/17A 03/18E 03/19E 03/20E
Sales revenue 1,179,660 1,234,106 1,365,457 1,503,403 Cost of goods sold 668,870 698,028 771,585 849,558 EBITDA 324,910 333,407 369,630 406,950 EBIT 303,240 312,567 346,572 381,562 Net interest expense/(inc.) (29,477) (23,715) (25,613) (27,662) Recurring PBT 345,130 340,283 372,185 409,224 Profit after tax 263,570 258,713 282,968 311,128 Reported net profit 262,890 257,913 282,088 310,168 Net profit (Credit Suisse) 262,890 257,913 282,088 310,168
Balance Sheet (Rs mn) 03/17A 03/18E 03/19E 03/20E
Cash & cash equivalents 497,290 421,847 518,804 624,278 Current receivables 280,350 304,186 335,872 369,803 Inventories 0 0 0 0 Other current assets 31,060 32,494 35,952 39,584 Current assets 808,700 758,526 890,627 1,033,665 Property, plant & equip. 117,410 118,345 119,378 120,517 Investments 82,160 82,160 82,160 82,160 Intangibles 41,569 41,569 41,569 41,569 Other non-current assets 3,691 3,691 3,691 3,691 Total assets 1,053,530 1,004,291 1,137,426 1,281,602 Current liabilities 143,754 150,351 166,267 182,982 Total liabilities 165,354 171,951 187,867 204,582 Shareholders' equity 883,150 826,514 942,853 1,069,353 Minority interests 3,660 4,460 5,340 6,300 Total liabilities & equity 1,052,164 1,002,925 1,136,060 1,280,236
Cash Flow (Rs mn) 03/17A 03/18E 03/19E 03/20E
EBIT 303,240 312,567 346,572 381,562 Net interest 0 0 0 0 Tax paid (81,560) (81,570) (89,217) (98,095) Working capital (19,665) (18,672) (19,228) (20,849) Other cash & non-cash items 21,670 20,840 23,058 25,388 Operating cash flow 223,685 233,166 261,185 288,005 Capex (19,890) (18,895) (19,976) (21,379) Free cash flow to the firm 203,795 214,271 241,209 266,627 Investing cash flow 10,057 (21,774) (24,092) (26,526) Equity raised (3,279) (160,000) (0) 0 Dividends paid (108,360) (154,550) (165,749) (183,668) Financing cash flow (69,149) (286,834) (140,136) (156,006) Total cash flow 164,593 (75,443) 96,957 105,474 Adjustments 0 0 0 0 Net change in cash 164,593 (75,443) 96,957 105,474
Per share 03/17A 03/18E 03/19E 03/20E
Shares (wtd avg.) (mn) 1,971 1,914 1,914 1,914 EPS (Credit Suisse) (Rs) 133.41 134.72 147.35 162.02 DPS (Rs) 47.00 69.00 74.00 82.00 Operating CFPS (Rs) 113.51 121.80 136.43 150.44
Earnings 03/17A 03/18E 03/19E 03/20E
Growth (%) Sales revenue 8.6 4.6 10.6 10.1 EBIT 5.3 3.1 10.9 10.1 EPS 8.2 1.0 9.4 10.0 Margins (%) EBITDA 27.5 27.0 27.1 27.1 EBIT 25.7 25.3 25.4 25.4
Valuation (x) 03/17A 03/18E 03/19E 03/20E
P/E 18.3 18.1 16.6 15.1 P/B 5.45 5.66 4.96 4.38 Dividend yield (%) 1.9 2.8 3.0 3.4 EV/sales 3.6 3.5 3.1 2.7 EV/EBITDA 12.9 12.8 11.3 10.0 EV/EBIT 13.9 13.7 12.1 10.7
ROE analysis (%) 03/17A 03/18E 03/19E 03/20E
ROE 32.6 30.2 31.9 30.8 ROIC 55.4 56.3 59.7 62.7
Credit ratios 03/17A 03/18E 03/19E 03/20E
Net debt/equity (%) (53.5) (48.1) (52.4) (56.0) Net debt/EBITDA (x) (1.46) (1.20) (1.34) (1.48)
Company Background
TCS is the largest Indian IT services company providing consulting and software services.
Blue/Grey Sky Scenario
Our Blue Sky Scenario (Rs) 2,760
Our blue sky scenario of Rs2,760 assumes revenue growth accelerates significantly during FY18, getting ahead of Infosys and margins remain protected YoY. No material change in visa policies assumed under Trump administration. In this scenario, the stock can potentially rerate.
Our Grey Sky Scenario (Rs) 1,860
Our grey sky scenario of Rs1,860 assumes macro headwinds, including those emerging from Brexit and US visa policies, slow down revenue growth and margins. In this scenario, earnings cuts may be coupled with a P/E derating.
Share price performance
The price relative chart measures performance against the S&P BSE SENSEX
IDX which closed at 32,037.38 on 13-Jul-2017
On 13-Jul-2017 the spot exchange rate was Rs64.44/US$1
Source: Company data, Thomson Reuters, Credit Suisse estimates

13 July 2017
Tata Group 64
Tata Power (NOT COVERED) (Bloomberg Ticker: TPWR IN, Mkt cap: US$3,495 mn, CMP: Rs83))
■ Integrated power player. Tata Power is present across the three segments of power:
generation (over 10GW of capacity including fossil fuel-based plants and renewables),
transmission (Mumbai, Bhutan-Delhi line), and distribution (Mumbai, Delhi,
Jamshedpur). Tata Power has also set up power plants at overseas locations
comprising hydro- and wind-based capacities. The company owns stakes in coal mines
in Indonesia, which provide fuel security to its Mundra plant (4,000MW) in Gujarat. It
also has exposure to the defence business, where it provides solutions to Indian
defence establishments, and is also partaking in two large defence projects—
Battlefield Management Systems (BMS) and Tactical Communication Systems (TCS)
for the Indian Army, via a joint venture with L&T. While Tata Power is staying away
from incremental greenfield fossil fuel-based projects due to the ongoing sector issues
(low demand, lack of new PPAs, weak health of the distribution sector), the company
has invested in a platform (26% stake) with ICICI Ventures and other partners, which
intends to acquire stressed assets. On the renewables front, the company is treading
cautiously, given the reasonably aggressive competition in the sector.
■ Mundra Power plant resolution key, according to the company. The key issue
faced by the company is viability of the Mundra Power plant, where changes in
Indonesian regulations have impacted profitability of the asset (under-recovery of 60
paisa/unit in FY17, loss of Rs8.5 bn). The company is looking at various solutions to
mitigate the losses at the Mundra plant itself. Among the options, Tata Power has
offered to sell its 51% stake in the company to beneficiaries (state electricity boards led
by Gujarat SEB) at a nominal amount of Rs1/share. This can help the company pass
on the Mundra debt burden to SEBs, according to the company.
■ Another potential concern for Tata Power is related to its renewables portfolio
acquired from Welspun (~1.3GW of assets), where the projects were developed over
the past five-six years, when average tariffs of wind/solar were much higher. All these
projects have PPAs with state electricity boards. However, there seems to be some
pushback from SEBs in the recent past on honouring their commitments on renewable
assets.
■ The company's revenue has grown at about 1% CAGR over FY12-17, and the net
profit has also improved from a large loss in FY12 to profit in FY17. While FY17
revenue fell 5%, PAT improved on a YoY basis. The stock price has been up 14% over
the last 12 months, down 18% over the last three years, and is down 4% over the last
five years vs. Sensex' returns of 17%, 27% and 85%, respectively during these time
periods. Tata Power currently trades at 1.5x 12-month fwd P/B multiple (Bloomberg
consensus estimates) vs. the last five-year average of 1.4x.
Figure 74: Tata Power—consolidated financial summary
(Rs mn) FY13 FY14 FY15 FY16* FY17*
Revenue 330,254 356,487 337,276 295,009 278,977
Revenue growth 7.9% -5.4% 11.1%# -5.4%
EBITDA 64,509 69,173 63,012 71,470 58,465
EBITDA margin 20% 19% 19% 24% 21%
PAT 7,646 -2,600 1,678 7,600 13,969
EPS (Rs) 4 -2 0 2 5
EPS growth nm nm nm 98%
Net debt/equity 3.3 3.6 3.0 2.9 3.5
ROE (%) 7% -2% 1% 6% 11%
* Ind-AS numbers. # FY16 revenue growth is adjusted for Ind-AS changes. Source: Company data, Capitaline
Analysts:
Lokesh Garg Vaibhav Jain

13 July 2017
Tata Group 65
Tata Communications (NOT COVERED) (Bloomberg Ticker: TCOM IN, Mkt cap: US$2,916 mn, CMP: Rs659)
■ Driving global connectivity. TCOM has the world’s largest wholly owned submarine
fibre network, accounting for nearly 20% of global submarine fibre capacity, based on
company data. With this infrastructure as the backbone, the company handles more
than 24% of global internet traffic, and is the largest wholesale voice carrier globally,
according to management. In India, TCOM claims to be a market leader in enterprise
communication services.
■ Growing share of data services. While TCOM’s traditional strength lies in the
wholesale voice business, the company notes that it has been actively growing the
data business as a counter to structural problems in voice. Over the last couple of
years, data revenues have grown from 51% of sales to 63%, overtaking voice as the
primary revenue engine, according to management; in this context, it thinks the
company’s position as a Leader in Gartner’s Magic Quadrant for network services over
the last couple of years is a significant boost for its market position. TCOM has been
focusing on growing managed services (higher margin, stickier revenues) within the
data services segment.
■ Divestment of non-core assets. TCOM has divested/reduced stakes in a number of
assets, which it believes to be of lower strategic importance, to reduce leverage. In
FY17, the company stated that it completed the sale of its operations in South Africa
(held via erstwhile subsidiary, Neotel) to Liquid Telecom. Besides, it also sold a 74%
stake in its data centre business in India and Singapore to ST Telemedia for ~Rs18 bn.
These transactions, it claims, have helped it reduce leverage from 4x net debt/EBITDA
in FY16 to 2.7x as of FY17. Outside of management control, the company also has
significant surplus land across India, the fate of which it said depends on government
actions. Minority shareholders in TCOM would have access to benefits from the sale of
these assets, according to the company.
■ Valuation. On a trailing basis, TCOM’s EV/EBITDA at 11.3x places it at a premium to
peers such as Bharti and Idea (Bloomberg consensus estimates).
Figure 75: Tata Communications—consolidated financial summary
Rs mn FY13 FY14 FY15 FY16 FY17
Revenue 174,395 178,486 182,644 185,452 179,800
Revenue growth 2.3% 2.3% 1.5% -3.0%
EBITDA 14,922 21,393 23,620 24,293 23,990
EBITDA margin 8.6% 12.0% 12.9% 13.1% 13.3%
PAT -6,233 1,014 13 87 12,329
EPS (Rs) -21.9 3.6 0.1 0.3 43.3
EPS growth -116% -99% 500% 14320%
Net debt/equity 7.6 13.8 32.9 -33.7 5.1
ROE 9% 0% -42% 201%
FCF -3,884 6,062 5,372 4,181 7,594 Note: (1) FY16 and FY17 financials based on Ind AS numbers. (2) In FY17, the company sold 74% of its data centre business to ST Telemedia. Reported profits for the year include Rs24.2 bn of profits on sale of the business; (3) On entering into an agreement to sell its South African business 'Neotel' to Vodacom, Tata Communication recognised an impairment charge of Rs1.9 bn (Rs1.5 bn in FY14); (4) FY13 numbers included costs pertaining to retrenchment of Rs854 mn and Rs1.9 bn of profit on sale of property at Chennai location.
Source: Company data
Analysts:
Sunil Tirumalai Viral Shah

13 July 2017
Tata Group 66
Tata Chemicals (NOT COVERED) (Bloomberg Ticker: TTCH IN, Mkt cap: US$2,532 mn, CMP: Rs640)
■ A diversified conglomerate. Tata Chemicals is a diversified conglomerate, with
manufacturing facilities across Asia, Europe, Africa and North America, whose
businesses can be categorised into three key segments, according to management.
Industry essentials: As per the company, Tata Chemical is world's second-largest
producer of soda ash, operating ~8% of world capacity.
Farm essentials: As per management, it is a leading manufacturer of fertilisers, crop
protection chemicals and agri-solutions.
Living essentials: Market leader with a ~70% market share in the national branded
salt segment (source: management). The company is also leveraging its large
distribution network to sell branded pulses and spices.
■ Historical performance and recent performance. While the stock was largely range-
bound over 2010-13, it saw a strong rerating over the course of 2014, rising 65% over
twelve months. According to management, the stock has doubled from its February
2016 bottom driven by the sale of its urea fertiliser business to Yara (for Rs27 bn) and
Tata Chemicals' exit from this low-return, working-capital-intensive business.
■ Management outlook, any recent changes. Management acknowledged that, over
the past few years, it has been attempting to undo some of its historical mistakes (such
as purchasing high-cost assets in overseas markets) and investing in higher-return
(consumer) businesses. Its strategy has been a combination of: (a) shutting down (or
scaling back output) loss-making units—such as its plants in the UK and Kenya, (b)
investing in improving cost competitiveness (such as steam turbines in the UK, which
cuts opex), (c) directing investment towards consumer segments such as pulses,
where the company attempts to leverage its large salt distribution reach and convert
another product from the unorganised to the organised sector, and (d) expanding into
neutraceuticals and related businesses, targeting a sales split of ~50% from branded
and non-commodity businesses (from just 22% in FY15).
■ Management has indicated its priorities on consumer products, and the stock has seen
a sharp re-rating. Tata Chemicals trades at 15.0x one-year forward (Bloomberg
consensus) earnings, at a 50% premium to historical averages. Consensus earnings
have not seen large movements either way over the course of the stock doubling (Feb
2016 until now), and the rally has been almost entirely due to multiple expansion.
Figure 76: Tata Chemicals—consolidated financial summary
Rs mn FY13 FY14 FY15 FY16 FY17*
Revenue 147,110 158,854 172,045 177,081 129,418
Revenue growth 7.7% 8.0% 8.3% 2.9% -26.9%
EBITDA 21,629 18,140 23,612 21,711 23,897
EBITDA margin 14.7% 11.4% 13.7% 12.3% 18.5%
PAT 4,004 -10,320 5,965 7,802 12,341
EPS (Rs) 16 -41 23 31 48
EPS growth -52.2% n.a. n.a. 30.8% 58.2%
Net debt/equity 73.5% 106.3% 88.9% 97.8% 32.3%
ROE 6.3% -17.2% 10.7% 13.2% 17.4%
FCF 682 4,951 11,979 8,301 18,637
* Ind AS. Source: Company data.
Analyst:
Bandrinath Srinivasan

13 July 2017
Tata Group 67
Indian Hotels (NOT COVERED) (Bloomberg Ticker: TGBL IN, Mkt cap: US$1,928 mn, CMP: Rs125)
■ One of the leading hotel companies in India. Indian Hotels has properties under Taj,
Vivanta, Gateway and Ginger brands. The company had a total of 118 properties in
India as of 31 March 2017, with an inventory of 14,041 rooms. It has an international
presence as well, with 16 properties (inventory of 2,634 rooms). In all, the group had
139 hotels with an inventory of 16,778 rooms. The company also has an air catering
business (through a JV—Taj SATS). The India business accounts for slightly over 70%
of the revenue.
■ Recovery in standalone margins, international business has lower margins.
Indian Hotels had a 6% revenue CAGR over the last five years (4% CAGR in room
count). Standalone revenue (largely domestic) is growing faster than the subsidiaries
(international hotels, Ginger etc.), given divestment of some of its loss-making
international properties. Standalone business' profits have improved over the last three
years (EBITDA margins up from -18% in FY14 to 22% in FY17), while the subsidiaries'
margins have deteriorated (16.5% to 5.5%). The company had a negative PAT for the
last five years, and had a net debt to EBITDA of over 5x in FY17.
■ Focus on fixing the P&L, asset-light strategy. The company, in the last couple of
years, has restructured the international business; according to management, all the
operations are brought into one holding company for better monetisation and it has
also divested a few properties. For the India business as well, the company has sold a
few properties in the last 2-3 years and for new properties, the company stated that it
has been following an asset-light model (management contracts vs ownership model).
■ The stock has not moved much over the last one and three years. It trades at 17x
FY19 EV/EBITDA, same as East India Hotels (Oberoi and Trident), based on
Bloomberg consensus estimates.
Figure 77: Indian Hotels - financial summary
(Rs mn) FY13 FY14 FY15 FY16* FY17*
Revenue 37,434 40,662 41,886 40,230 40,103
Revenue growth 9% 9% 3% 10% 0%
EBITDA 933 47 892 5,522 6,096
EBITDA margin 2.5% 0.1% 2.1% 13.7% 15.2%
PAT -4,302 -5,539 -3,781 -2,311 -632
EPS (Rs) -5.4 -6.9 -4.7 -2.3 -0.6
EPS growth nm nm nm nm nm
Net debt/equity 1.2 1.5 2.1 1.4 1.3
ROE -14% -20% -16% -9% -2%
FCF 790 1,990 1,836 2,605 NA
Source: Company data * Ind AS numbers. The growth is calculated on like-to-like basis for FY16 (based on Indian GAAP) and FY17 (based on Ind AS)
Figure 78: Rooms have grown at a 4% CAGR (five
years)++
Figure 79: Standalone subsidiaries' margins
+++++++
Source: Company data Source: Company data
13,522 14,33115,393 15,751
16,759 16,675
-2%
0%
2%
4%
6%
8%
0
5,000
10,000
15,000
20,000
FY12 FY13 FY14 FY15 FY16 FY17
Total rooms YoY growth [RHS]
-10%
0%
10%
20%
-25%
0%
25%
50%
FY12 FY13 FY14 FY15 FY16 FY17*
Revenue growth - StandaloneRevenue growth - SubsidiariesEBITDA margin - Standalone [RHS]EBITDA margin - Subsidiaries [RHS]
Analysts:
Anantha Narayan Nitin Jain

13 July 2017
Tata Group 68
Tata Global Beverages (NOT COVERED) (Bloomberg Ticker: TGBL IN, Mkt cap: US$1,717 mn, CMP: Rs.175)
■ A global branded beverages company. Tata Global Beverages owns multiple
beverage brands such as Tata Tea, Tetley, Teapig, Good Earth, Eight O'Clock, and
Grand Coffee. The company has also ventured into the water and energy/health drink
segments with brands such as Tata Water Plus, Himalayan and Tata Gluco. The
branded business accounts for about 88% of the company's revenue (non-branded
business is largely Tata Coffee), with tea accounting for 80% of the branded business,
and coffee being 19%. The India business accounts for about 40% of revenue, the
US/Canada 25%, and the UK about 17%. It also has JVs with partners such as
Starbucks, and Pepsi (Himalyan, Tata Water Plus, and Tata Gluco+). The company is
backward integrated and owns tea and coffee estates. Tata Coffee is 57%-owned by
Tata Global.
■ India business leads the growth. The company's revenue has grown at about 5%
CAGR over FY12-17, and the net profit has been volatile. The India business has been
growing at a faster rate (12% CAGR over FY12-16), while the international business
has been muted (-2% CAGR in the UK, and 4% CAGR in the US/Canada). FY17
revenue grew 2% (3% in constant currency). Lower commodity costs (helped by
hedging), and operational efficiency measures helped margins in FY17, despite an
increase in advertisement costs. On like-for-like basis (Ind AS), EBITDA margins
improved from about 10% in FY16 to 11.7% in FY17.
■ Focus on new product launches for growth. Management is focusing on health and
wellness-related products such as vitamins-fortified tea and ayurveda inspired products
(Tata Tea Veda and Tetley Balance), ready-to-drink tea (iced and cold tea), and e-
commerce for growth. It started re-investing in the Tata Tea brand in FY17 and has
launched several new products, including the ones discussed above. Some
restructuring initiatives are under way for the Eastern Europe business (minor part of
the business) and the Middle East is one region which is in the incubation stage.
■ The stock price has been up 17% over the last 12 months, flat over the last three
years, and is up 34% over the last five years vs Sensex' returns of 15%, 23% and 79%,
respectively, during these time periods. Tata Global currently trades at slightly over 20x
12-month forward P/E multiple (Bloomberg consensus estimates) vs the last five-year
and three-year average of 18x.
Figure 80: Tata Global Beverages—financial summary
(Rs mn) FY13 FY14 FY15 FY16 FY17*
Revenue 73,510 77,376 79,934 81,105 67,796
Revenue growth 11% 5% 3% 1% 2%
EBITDA 7,685 7,519 6,440 6,747 7,911
EBITDA margin 10.5% 9.7% 8.1% 8.3% 11.7%
PAT 3,728 4,805 2,478 3,259 3,894
EPS (Rs) 6.0 7.8 3.9 5.2 6.2
EPS growth 4.7% 28.9% -49.4% 31.3% 19.6%
Net debt/equity 0.1 0.1 0.1 0.1 0.0
ROE 8% 8% 6% 5% 6%
FCF -64 2,180 2,386 -547 NA
* Ind AS numbers. The growth is calculated on like-to-like basis (using Ind AS numbers for FY16) Source: Company data
Analysts:
Anantha Narayan Nitin Jain

13 July 2017
Tata Group 69
Trent Ltd (NOT COVERED) (Bloomberg Ticker: TRENT IN, Mkt cap: US$1,283 mn, CMP: Rs249)
■ Business description. Trent’s flagship business has been operating the ‘Westside’
chain of retail stores selling apparel and accessories. The chain has 108 stores across
61 cities in India. Trent also operates two JVs (1) one owns a 49% stake in Zara’s India
operations with 20 stores currently and (2) the second one owns a 50% JV with Tesco
Plc of UK and operates 42 stores across hypermarket and convenience stores selling
personal care, food and grocery items.
■ Details on individual businesses:
Westside, with Rs1.6 bn in revenues, is the largest contributor to Trent’s revenues and has been delivering steady same-store sales growth for the last five years despite a slowdown. It generates around 9-10% EBITDA margins. Westside’s private label brands are exclusively sold through its own outlets. Management plans to accelerate expansion into newer cities and towns and will also explore smaller stores in non-metros/ emerging markets.
Joint ventures. Star Bazaar hypermarket (JV with Tesco) chain is still in ramp-up mode and currently loss-making at the EBITDA level. The company is now focusing on direct sourcing and private label offerings to improve profitability. Zara India (JV with Iditex) has grown sales at a 55% CAGR since FY13 and makes a ~5% PAT margin.
Figure 81: Operating metrics for Westside Figure 82: Ramp-up in Zara sales (49% JV)
Source: Company data Source: Company data
■ Valuation. The stock trades at 41x/30x FY18/19 EPS on Bloomberg consensus
estimates, versus peer Shoppers Stop (SHOP IN) at 97x/39x FY18/19 consensus.
Figure 83: Trent Limited—consolidated financial summary
(Rs mn) FY13 FY14 FY15 FY16* FY17*
Revenue 23,074 25,474 26,362 17,774 20,304
Revenue growth 20.7% 10.4% 3.5% 4.9%^ 14.2%
EBITDA 629 810 2,962 1,762 2,148
EBITDA margin 2.7% 3.2% 11.2% 9.9% 10.6%
PAT -268 -186 1,293 551 849
EPS (Rs) -9 -6 39 2 3
EPS growth NM NM NM NM 55%
Net debt/equity 10.4% 27.2% 14.9% 25.5% 23.1%
ROE -2.2% -1.7% 10.7% 3.8% 5.6%
FCF -2,444 -941 -3,163 110 587
Note: FY16 & FY17 financials per IND AS; earlier years basis I GAAP. Revenue base resets downwards in FY16 as JV revenue is not included in headline revenues under IND AS as was the case under I GAAP. ^ Calculated using I GAAP revenue for FY16 and FY15 Source: Company data.
0%
2%
4%
6%
8%
10%
12%
0%
2%
4%
6%
8%
10%
12%
FY13 FY14 FY15 FY16 FY17
EBITDA margin (LHS) SSSG (RHS)
0
5
10
15
20
25
0
2000
4000
6000
8000
10000
12000
FY13 FY14 FY15 FY16 FY17
# of stores (RHS) Sales (Rs mn, LHS)
Analysts:
Arnab Mitra Rohit Kadam

13 July 2017
Tata Group 70
Tata AIA Life Insurance (Not Listed) Tata AIA is a joint venture between Tata Sons (51%) and AIA International (49%), which
commenced operations in April 2001. Post the increase in foreign ownership limit in Indian
insurance companies to 49%, AIA increased its stake from 26% to 49% in April 2016,
reportedly paying Rs20 bn, valuing the company at ~Rs90 bn (source: Economic Times).
After a phase of consolidation, private insurers' new business growth picked up to 14-16%
levels in FY15/16 and has improved to 22% in FY17. Bancassurance has emerged as the
primary distribution channel with 53% share (from 21% in FY10) among the private
insurers. It contributes 60-75% to the retail premiums for the top private insurers now, as
insurers with strong bank tie-ups have gained market share.
Tata AIA currently has a ~3% market share among the private life insurers, increasing
from ~1% in FY15. Since FY15, post the appointment of a new MD and CEO, the
company has broadened its product offerings, launching 15 new products in FY16,
resulting in a steady pick-up in premium income, after several years of decline. Premium
growth picked up to 28% in FY17, with APE growth at 55%. The company has also been
focusing on digital initiatives and ~60% of its sales in FY16 were paperless.
Tata AIA has been selling products through IndusInd Bank and Citibank. In October 2016,
it entered into an agreement with HDFC Bank to sell its policies and recently has tied up
with Axis Bank as well, which will help the company continue to expand its reach and see
strong premium growth. It has also tied up with DBS Bank, which will offer products
through its own digital channel. With the increasing number of bancassurance partners, As
stated in its annual report, Tata AIA’s share of bancassurance has increased from 16% in
FY15 to 49% in FY16.
Figure 84: Tata AIA—consolidated financial summary
FY12 FY13 FY14 FY15 FY16 FY17
GWP (Rs mn) 36,182 27,460 23,118 21,056 24,358 31,153
YoY growth (%) -24% -16% -9% 16% 28%
Renewal prem % of GWP 74% 80% 81% 85% 70% 64%
APE (Rs mn) 31,180 35,320 34,440 2,968 7,262 11,270
YoY growth (%) -22% 13% -2% -91% 145% 55%
Commission/GWP 3.90% 3.80% 4.00% 4.40% 6.10% 8.50%
Opex/GWP 21% 22% 19% 24% 20% 24%
Benefits paid/GWP 55% 37% 116% 168% 119% 81%
Profit/(loss) (Rs mn) 2,603 -3,315 4,129 2,636 636 1,135
Conservation Ratio 72% 64% 72% 81% 83% 83%
61st Month Persistency 41% 43% 38% 35% 36% 49%
Solvency Ratio (%) 284% 341% 409% 417% 348% 315%
Source: Company data
Figure 85: Growth in premiums Figure 86: Comparison of persistency ratios
Source: Company data Source: Company data
-30%
-20%
-10%
0%
10%
20%
30%
40%
0
5,000
10,000
15,000
20,000
25,000
30,000
35,000
40,000
FY12 FY13 FY14 FY15 FY16 FY17
GWP (Rs mn) YoY growth (%) (RHS)
0.0%
10.0%
20.0%
30.0%
40.0%
50.0%
60.0%
70.0%
ICICI Pru HDFC Life Tata AIA BirlaSunlife
Reliance SBI BajajAllianz
61st month persistency
Analysts:
Ashish Gupta Kush Shah

13 July 2017
Tata Group 71
Appendix: HOLT Analysis (Note: HOLT is not a part of Equity Research)
Tata Power (TTPW)—A sub cost of capital business with 46% DCF upside on HOLT default model
Source: Credit Suisse HOLT Lens
Tata Chemicals (TTCH)—Volatile historical CFROI trend with 30% DCF upside on HOLT default model
Source: Credit Suisse HOLT Lens

13 July 2017
Tata Group 72
Tata Global Beverage (TAGL)—Relatively stable CFROI that is fairly priced on HOLT default scenario (9%)
Source: Credit Suisse HOLT Lens
Tata Communications (TATA)—A low CFROI business with 66% warranted downside on HOLT DCF, suggesting market already embeds significant recovery in future returns
Source: Credit Suisse HOLT Lens

13 July 2017
Tata Group 73
Indian Hotels (IHTL)—Lower than peers CFROI with 22% downside on HOLT default model
Source: Credit Suisse HOLT Lens
Trent (TREN)—Significant turnaround in CFROI but warrant 27% downside on HOLT default scenario
Source: Credit Suisse HOLT Lens

13 July 2017
Tata Group 74
Tata Elxsi (TTEX)—Firm with consecutive years of CFROI improvement and 41% DCF upside on HOLT
Source: Credit Suisse HOLT Lens
Rallis India (RALL)—Company with stable and persistent CFROI (10%+) with 88% upside on HOLT, which is under-appreciated by market
Source: Credit Suisse HOLT Lens
HOLT® is not part of Equity Research. Materials in this section are not prepared by Equity Research. The HOLT methodology uses a proprietary performance measure known as Cash Flow Return on Investment (CFROI®). This is an approximation of the economic return, or an estimate of the average real internal rate of return, earned by a firm on the portfolio of projects that constitute its operating assets. A firm's CFROI can be directly compared against its real cost of capital (the investors' real discount rate) to see if the firm is creating economic wealth. By removing accounting and inflations distortions the CFROI allows for global comparability across sectors, regions and time, and is also a more comprehensive metric than the traditional ROIC and ROE.
13 July 2017
Tata Group 75
Companies Mentioned (Price as of 13-Jul-2017) ASL (AVEU.BO, Rs914.6) Accenture Plc (ACN.N, $125.47) Arcelik (ARCLK.IS, TL26.56) Ashok Leyland Ltd (ASOK.BO, Rs106.1) BMW (BMWG.DE, €84.36) Bharti Airtel Ltd (BRTI.BO, Rs402.95) Cognizant Technology Solutions Corp. (CTSH.OQ, $68.13) Daimler (DAIGn.DE, €65.15) Edelweiss Financial Services Ltd (EDEL.BO, Rs194.95) Future Consumer (FTRE.BO, Rs37.1) HCL Technologies (HCLT.BO, Rs857.9) HDFC Bank (HDBK.BO, Rs1681.2) ICICI Bank (ICBK.BO, Rs297.75) IIFL Hldg (IIFL.NS, Rs597.3) Idea Cellular (IDEA.NS, Rs87.8) Indian Hotel (IHTL.NS, Rs125.6) Infosys Limited (INFY.BO, Rs976.3) International Business Machines Corp. (IBM.N, $153.7) JM Financial (JMSH.BO, Rs127.0) L&T Fin Holdings (LTFH.NS, Rs151.4) MOFSL (MOFS.BO, Rs1109.35) MTNL (MTNL.BO, Rs21.65) Maruti Suzuki India Ltd (MRTI.BO, Rs7566.25) Nelco (NELC.NS, Rs103.1) RCOM (RLCM.NS, Rs23.95) Rallis India (RALL.BO, Rs248.65) Reliance Capital Ltd (RLCP.BO, Rs663.3) Shoppers Stop (SHOP.BO, Rs349.0) State Bank Of India (SBI.BO, Rs288.6) TRF (TTRO.NS, Rs246.05) Tata Chemicals (TTCH.BO, Rs640.5) Tata Coffee (TACO.BO, Rs143.9) Tata Communi (TATA.NS, Rs659.2) Tata Consultancy Services (TCS.BO, Rs2444.05, NEUTRAL, TP Rs2250.0) Tata Elxsi (TTEX.BO, Rs1730.6) Tata Global (TAGL.BO, Rs175.45) Tata Investment (TINV.NS, Rs772.85) Tata Metaliks (TMET.BO, Rs759.7) Tata Motors Ltd. (TAMO.BO, Rs458.4, OUTPERFORM[V], TP Rs630.0) Tata Power Company Ltd (TTPW.BO, Rs83.25) Tata Sponge Iron (TTSP.NS, Rs836.55) Tata Steel Ltd (TISC.BO, Rs563.0, OUTPERFORM, TP Rs650.0) Tata Teleservice (TTML.BO, Rs7.58) Tayo Rolls (TTYO.BO, Rs60.0) ThyssenKrupp (TKAG.DE, €26.82) Titan Company (TITN.NS, Rs534.15) Titan Company Ltd (TITN.BO, Rs534.6, OUTPERFORM, TP Rs560.0) Trent (TREN.NS, Rs248.7) Videocon (VEDI.BO, Rs31.95) Vodafone Group (VOD.L, 220.85p) Volkswagen (VOWG_p.DE, €143.35) Voltas (VOLT.BO, Rs484.75, OUTPERFORM, TP Rs585.0) Welspun Entp (WELS.NS, Rs127.6) Wipro Ltd. (WIPR.BO, Rs264.2)
Disclosure Appendix
Analyst Certification Anantha Narayan, Nitin Jain, Arnab Mitra, Ashish Gupta, Badrinath Srinivasan, Jatin Chawla, Ravi Shankar, Sunil Tirumalai and Lokesh Garg each certify, with respect to the companies or securities that the individual analyzes, that (1) the views expressed in this report accurately reflect his or her personal views about all of the subject companies and securities and (2) no part of his or her compensation was, is or will be directly or indirectly related to the specific recommendations or views expressed in this report.
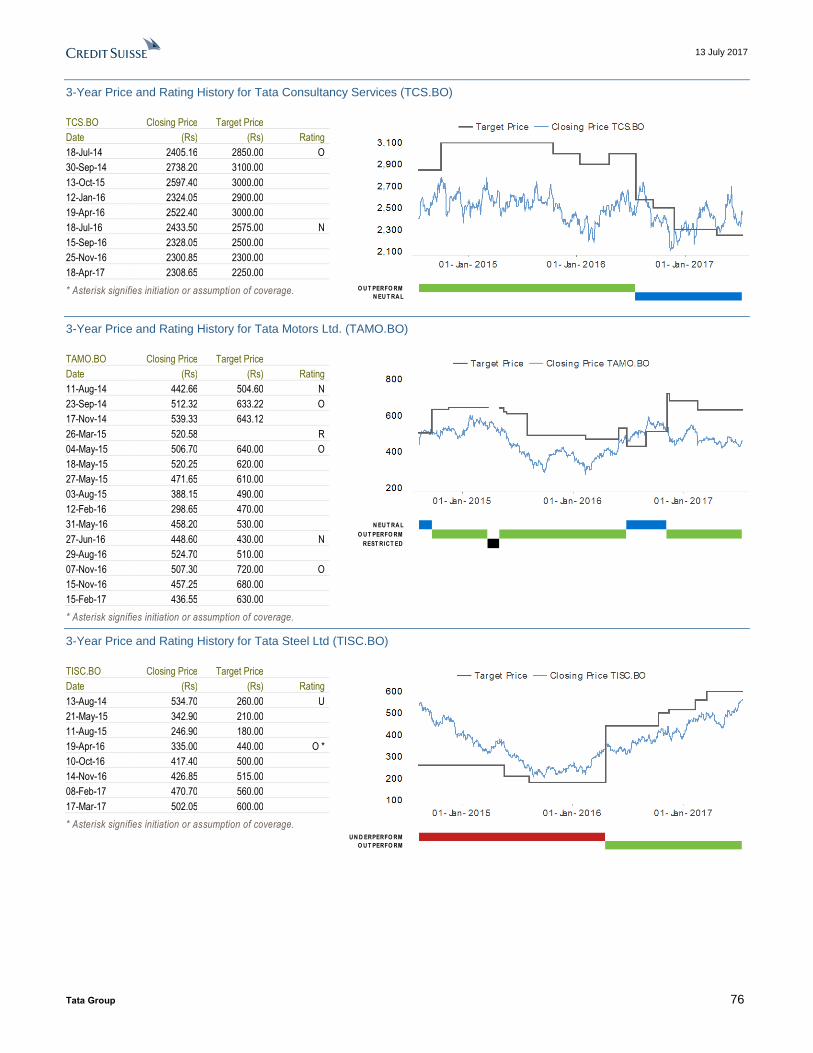
13 July 2017
Tata Group 76
3-Year Price and Rating History for Tata Consultancy Services (TCS.BO)
TCS.BO Closing Price Target Price
Date (Rs) (Rs) Rating
18-Jul-14 2405.16 2850.00 O
30-Sep-14 2738.20 3100.00
13-Oct-15 2597.40 3000.00
12-Jan-16 2324.05 2900.00
19-Apr-16 2522.40 3000.00
18-Jul-16 2433.50 2575.00 N
15-Sep-16 2328.05 2500.00
25-Nov-16 2300.85 2300.00
18-Apr-17 2308.65 2250.00
* Asterisk signifies initiation or assumption of coverage.
O U T PERFO RM
N EU T RA L
3-Year Price and Rating History for Tata Motors Ltd. (TAMO.BO)
TAMO.BO Closing Price Target Price
Date (Rs) (Rs) Rating
11-Aug-14 442.66 504.60 N
23-Sep-14 512.32 633.22 O
17-Nov-14 539.33 643.12
26-Mar-15 520.58 R
04-May-15 506.70 640.00 O
18-May-15 520.25 620.00
27-May-15 471.65 610.00
03-Aug-15 388.15 490.00
12-Feb-16 298.65 470.00
31-May-16 458.20 530.00
27-Jun-16 448.60 430.00 N
29-Aug-16 524.70 510.00
07-Nov-16 507.30 720.00 O
15-Nov-16 457.25 680.00
15-Feb-17 436.55 630.00
* Asterisk signifies initiation or assumption of coverage.
N EU T RA L
O U T PERFO RM
REST RICT ED
3-Year Price and Rating History for Tata Steel Ltd (TISC.BO)
TISC.BO Closing Price Target Price
Date (Rs) (Rs) Rating
13-Aug-14 534.70 260.00 U
21-May-15 342.90 210.00
11-Aug-15 246.90 180.00
19-Apr-16 335.00 440.00 O *
10-Oct-16 417.40 500.00
14-Nov-16 426.85 515.00
08-Feb-17 470.70 560.00
17-Mar-17 502.05 600.00
* Asterisk signifies initiation or assumption of coverage.
U N D ERPERFO RM
O U T PERFO RM

13 July 2017
Tata Group 77
3-Year Price and Rating History for Titan Company Ltd (TITN.BO)
TITN.BO Closing Price Target Price
Date (Rs) (Rs) Rating
14-Jul-14 321.75 360.00 O
04-Aug-14 342.30 380.00
25-Aug-14 361.75 415.00
30-Nov-14 370.05 430.00
08-May-15 353.60 390.00 N
03-Aug-15 317.35 360.00
29-Jan-16 363.90 370.00
30-Mar-16 338.30 350.00
06-May-16 364.10 340.00
03-Aug-16 414.40 380.00
04-Nov-16 368.50 370.00
15-Nov-16 328.00 330.00
10-Jan-17 361.75 340.00
07-Feb-17 393.40 425.00
15-May-17 483.45 500.00
05-Jun-17 552.40 560.00 O
* Asterisk signifies initiation or assumption of coverage.
O U T PERFO RM
N EU T RA L
3-Year Price and Rating History for Voltas (VOLT.BO)
VOLT.BO Closing Price Target Price
Date (Rs) (Rs) Rating
24-Jul-14 193.57 NR
20-Nov-14 263.95 315.00 O *
16-Feb-15 249.60 300.00
25-May-15 323.70 380.00
12-Aug-15 298.80 360.00
09-Nov-15 275.25 345.00
15-Feb-16 237.95 315.00
25-Apr-16 293.00 345.00
19-May-16 323.85 390.00
03-Aug-16 346.25 400.00
20-Sep-16 382.70 415.00 N
21-Nov-16 295.70 335.00
24-May-17 447.55 480.00 O
01-Jun-17 508.90 585.00
* Asterisk signifies initiation or assumption of coverage.
N O T RA T ED
O U T PERFO RM
N EU T RA L
The analyst(s) responsible for preparing this research report received Compensation that is based upon various factors including Credit Suisse's total revenues, a portion of which are generated by Credit Suisse's investment banking activities
As of December 10, 2012 Analysts’ stock rating are defined as follows: Outperform (O) : The stock’s total return is expected to outperform the relevant benchmark* over the next 12 months. Neutral (N) : The stock’s total return is expected to be in line with the relevant benchmark* over the next 12 months. Underperform (U) : The stock’s total return is expected to underperform the relevant benchmark* over the next 12 months. *Relevant benchmark by region: As of 10th December 2012, Japanese ratings are based on a stock’s total return relative to the analyst's coverage universe which consists of all companies covered by the analyst within the relevant sector, with Outperforms representing the most attractiv e, Neutrals the less attractive, and Underperforms the least attractive investment opportunities. As of 2nd October 2012, U.S. and Canadian as well as European ratings are based on a stock’s total return relative to the analyst's coverage universe which consists of all companies covered by the analyst within the relevant sector, with Outperforms representing the most attractive, Neutrals the less attractive, and Underperforms the least attractive investment opportunities. For Latin Ame rican and non-Japan Asia stocks, ratings are based on a stock’s total return relative to the average total return of the re levant country or regional benchmark; prior to 2nd October 2012 U.S. and Canadian ratings were based on (1) a stock’s absolute total return potential to its current share price and (2) the relative attractiv eness of a stock’s total return potential within an analyst’s coverage universe. For Australian and New Zealand stocks, the expected total return (ETR) calculation includes 1 2-month rolling dividend yield. An Outperform rating is assigned where an ETR is greater than or equal to 7.5%; Underperform where an ETR less than or equal to 5%. A Neutral may be assigned where the ETR is between -5% and 15%. The overlapping rating range allows analysts to assign a rating that puts ETR in the context of associated risks. Prior to 18 May 2015, ETR ranges for Outperform and Underperform ratings did not overlap with Neutral thresholds between 15% and 7.5%, which was in operation from 7 July 2011. Restricted (R) : In certain circumstances, Credit Suisse policy and/or applicable law and regulations preclude certain types of communications, including an investment recommendation, during the course of Credit Suisse's engagement in an investment banking transaction and in certain other circumstances.
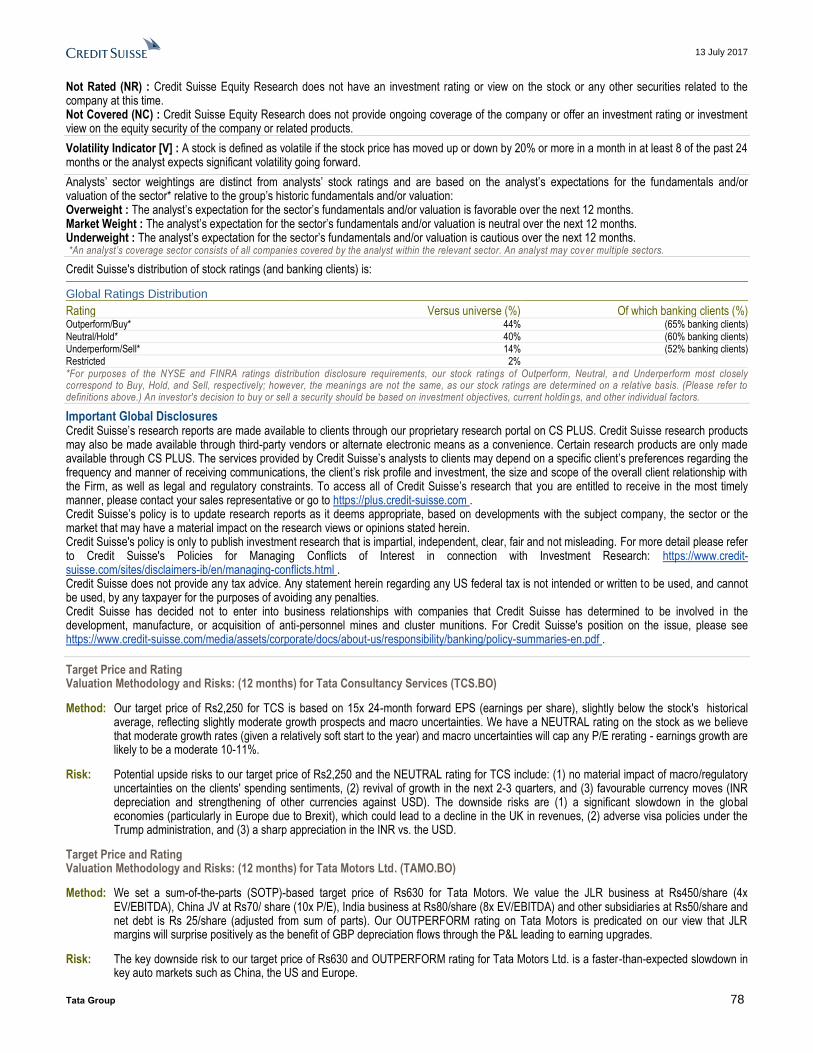
13 July 2017
Tata Group 78
Not Rated (NR) : Credit Suisse Equity Research does not have an investment rating or view on the stock or any other securities related to the company at this time. Not Covered (NC) : Credit Suisse Equity Research does not provide ongoing coverage of the company or offer an investment rating or investment view on the equity security of the company or related products.
Volatility Indicator [V] : A stock is defined as volatile if the stock price has moved up or down by 20% or more in a month in at least 8 of the past 24 months or the analyst expects significant volatility going forward.
Analysts’ sector weightings are distinct from analysts’ stock ratings and are based on the analyst’s expectations for the fundamentals and/or valuation of the sector* relative to the group’s historic fundamentals and/or valuation: Overweight : The analyst’s expectation for the sector’s fundamentals and/or valuation is favorable over the next 12 months. Market Weight : The analyst’s expectation for the sector’s fundamentals and/or valuation is neutral over the next 12 months. Underweight : The analyst’s expectation for the sector’s fundamentals and/or valuation is cautious over the next 12 months. *An analyst’s coverage sector consists of all companies covered by the analyst within the relevant sector. An analyst may cover multiple sectors.
Credit Suisse's distribution of stock ratings (and banking clients) is:
Global Ratings Distribution
Rating Versus universe (%) Of which banking clients (%) Outperform/Buy* 44% (65% banking clients) Neutral/Hold* 40% (60% banking clients) Underperform/Sell* 14% (52% banking clients) Restricted 2% *For purposes of the NYSE and FINRA ratings distribution disclosure requirements, our stock ratings of Outperform, Neutral, a nd Underperform most closely correspond to Buy, Hold, and Sell, respectively; however, the meanings are not the same, as our stock ratings are determined on a relative basis. (Please refer to definitions above.) An investor's decision to buy or sell a security should be based on investment objectives, current holdin gs, and other individual factors.
Important Global Disclosures Credit Suisse’s research reports are made available to clients through our proprietary research portal on CS PLUS. Credit Suisse research products may also be made available through third-party vendors or alternate electronic means as a convenience. Certain research products are only made available through CS PLUS. The services provided by Credit Suisse’s analysts to clients may depend on a specific client’s preferences regarding the frequency and manner of receiving communications, the client’s risk profile and investment, the size and scope of the overall client relationship with the Firm, as well as legal and regulatory constraints. To access all of Credit Suisse’s research that you are entitled to receive in the most timely manner, please contact your sales representative or go to https://plus.credit-suisse.com . Credit Suisse’s policy is to update research reports as it deems appropriate, based on developments with the subject company, the sector or the market that may have a material impact on the research views or opinions stated herein. Credit Suisse's policy is only to publish investment research that is impartial, independent, clear, fair and not misleading. For more detail please refer to Credit Suisse's Policies for Managing Conflicts of Interest in connection with Investment Research: https://www.credit-suisse.com/sites/disclaimers-ib/en/managing-conflicts.html . Credit Suisse does not provide any tax advice. Any statement herein regarding any US federal tax is not intended or written to be used, and cannot be used, by any taxpayer for the purposes of avoiding any penalties. Credit Suisse has decided not to enter into business relationships with companies that Credit Suisse has determined to be involved in the development, manufacture, or acquisition of anti-personnel mines and cluster munitions. For Credit Suisse's position on the issue, please see https://www.credit-suisse.com/media/assets/corporate/docs/about-us/responsibility/banking/policy-summaries-en.pdf .
Target Price and Rating Valuation Methodology and Risks: (12 months) for Tata Consultancy Services (TCS.BO)
Method: Our target price of Rs2,250 for TCS is based on 15x 24-month forward EPS (earnings per share), slightly below the stock's historical average, reflecting slightly moderate growth prospects and macro uncertainties. We have a NEUTRAL rating on the stock as we believe that moderate growth rates (given a relatively soft start to the year) and macro uncertainties will cap any P/E rerating - earnings growth are likely to be a moderate 10-11%.
Risk: Potential upside risks to our target price of Rs2,250 and the NEUTRAL rating for TCS include: (1) no material impact of macro/regulatory uncertainties on the clients' spending sentiments, (2) revival of growth in the next 2-3 quarters, and (3) favourable currency moves (INR depreciation and strengthening of other currencies against USD). The downside risks are (1) a significant slowdown in the global economies (particularly in Europe due to Brexit), which could lead to a decline in the UK in revenues, (2) adverse visa policies under the Trump administration, and (3) a sharp appreciation in the INR vs. the USD.
Target Price and Rating Valuation Methodology and Risks: (12 months) for Tata Motors Ltd. (TAMO.BO)
Method: We set a sum-of-the-parts (SOTP)-based target price of Rs630 for Tata Motors. We value the JLR business at Rs450/share (4x EV/EBITDA), China JV at Rs70/ share (10x P/E), India business at Rs80/share (8x EV/EBITDA) and other subsidiaries at Rs50/share and net debt is Rs 25/share (adjusted from sum of parts). Our OUTPERFORM rating on Tata Motors is predicated on our view that JLR margins will surprise positively as the benefit of GBP depreciation flows through the P&L leading to earning upgrades.
Risk: The key downside risk to our target price of Rs630 and OUTPERFORM rating for Tata Motors Ltd. is a faster-than-expected slowdown in key auto markets such as China, the US and Europe.

13 July 2017
Tata Group 79
Target Price and Rating Valuation Methodology and Risks: (12 months) for Tata Steel Ltd (TISC.BO)
Method: Our target price of Rs650 for Tata Steel is based on valuing the domestic/EU business at 7.0/6.5x EV-EBITDA. We have assumed domestic hot-rolled steel prices at US$485/t and EU EBITDA assumed at US$60/t for the next four quarters. Our OUTPERFORM rating is based upon this target price and reflects our expectations of a stable domestic EBITDA and improvement in EU profitability as that business gets restructured gradually.
Risk: The risks to our Rs650 target price and OUTPERFORM rating for Tata Steel include: (1) domestic steel prices settling below what we have assumed for the next four quarters (US$485/t); (2) little/ no progress in the EU restructuring and (3) contraction in EU spreads leading to lower profitability .
Target Price and Rating Valuation Methodology and Risks: (12 months) for Titan Company Ltd (TITN.BO)
Method: We value Titan Industries at 37x Mar-2019 earnings (in line with one-year average multiple) giving us a target price of Rs560. We have an OUTPERFORM rating as Titan remains the best run organised jewellery play in India and is rapidly gaining share from the unorganised market.
Risk: Key risks that may impede achievement of our Rs560 target price and OUTPERFORM rating for Titan Industries include a sharp correction in gold prices without pick-up in volume, slower-than-expected recovery in discretionary demand and uncertainity over regulations persisting.
Target Price and Rating Valuation Methodology and Risks: (12 months) for Voltas (VOLT.BO)
Method: Our target price of Rs585 for Voltas is based on 30x March-2019E consolidated earnings, our multiple being supported by SOTP (sum-of-the-parts) valuation of individual segments. Our target price and OUTPERFORM rating take into account: (1) the strong market position that the company enjoys in the room AC business; (2) low penetration levels in India, which makes Voltas a structural growth story; (3) expectation of cyclical economic recovery vs past five years in projects business; and (4) Voltas' attempt to build a broader consumer durable business.
Risk: Key downside risks to our target price of Rs585 for Voltas include slower-than-expected recovery in commercial and infrastructure construction activity in both India and the Middle East, a sharp drop in the AC business market share or profitability as well as delays in fruition of broader consumer business. If these risks were to pan out, there could be downside risk to our OUTPERFORM rating.
Please refer to the firm's disclosure website at https://rave.credit-suisse.com/disclosures/view/selectArchive for the definitions of abbreviations typically used in the target price method and risk sections.
See the Companies Mentioned section for full company names Credit Suisse currently has, or had within the past 12 months, the following as investment banking client(s): TCS.BO, TAMO.BO, VOD.L, BRTI.BO, ICBK.BO, SBI.BO, HDBK.BO, ACN.N, INFY.BO, HCLT.BO, WIPR.BO, CTSH.OQ, IBM.N, TKAG.DE, ARCLK.IS Credit Suisse provided investment banking services to the subject company (TAMO.BO, ICBK.BO, SBI.BO, HDBK.BO, ACN.N, CTSH.OQ, IBM.N) within the past 12 months. Credit Suisse currently has, or had within the past 12 months, the following issuer(s) as client(s), and the services provided were non-investment-banking, securities-related: TCS.BO, TAMO.BO, TITN.BO, TISC.BO, ICBK.BO, SBI.BO, HDBK.BO, EDEL.BO, WIPR.BO, CTSH.OQ, IBM.N, TKAG.DE Credit Suisse has managed or co-managed a public offering of securities for the subject company (TAMO.BO, ICBK.BO, IBM.N) within the past 12 months. Within the past 12 months, Credit Suisse has received compensation for investment banking services from the following issuer(s): TAMO.BO, ICBK.BO, SBI.BO, HDBK.BO, ACN.N, CTSH.OQ, IBM.N Credit Suisse expects to receive or intends to seek investment banking related compensation from the subject company (VOLT.BO, TCS.BO, TAMO.BO, VOD.L, BRTI.BO, ICBK.BO, SBI.BO, HDBK.BO, EDEL.BO, ACN.N, INFY.BO, HCLT.BO, WIPR.BO, CTSH.OQ, IBM.N, TKAG.DE, ARCLK.IS) within the next 3 months. Within the last 12 months, Credit Suisse has received compensation for non-investment banking services or products from the following issuer(s): TCS.BO, TAMO.BO, TITN.BO, TISC.BO, ICBK.BO, SBI.BO, HDBK.BO, EDEL.BO, WIPR.BO, CTSH.OQ, IBM.N, TKAG.DE A member of the Credit Suisse Group is party to an agreement with, or may have provided services set out in sections A and B of Annex I of Directive 2014/65/EU of the European Parliament and Council ("MiFID Services") to, the subject issuer (VOLT.BO, TCS.BO, TAMO.BO, TITN.BO, TISC.BO, MRTI.BO, ASOK.BO, VOD.L, BRTI.BO, ICBK.BO, SBI.BO, HDBK.BO, EDEL.BO, ACN.N, HCLT.BO, WIPR.BO, IBM.N, TKAG.DE, ARCLK.IS) within the past 12 months. Please visit https://credit-suisse.com/in/researchdisclosure for additional disclosures mandated vide Securities And Exchange Board of India (Research Analysts) Regulations, 2014 Credit Suisse may have interest in (TACO.BO, TREN.NS, TTCH.BO, IHTL.NS, TTYO.BO, TTML.BO, TATA.NS, TMET.BO, NELC.NS, TTRO.NS, TINV.NS, TTPW.BO, RALL.BO, TTEX.BO, TAGL.BO, TTSP.NS, TITN.NS, IDEA.NS, RLCM.NS, VEDI.BO, MTNL.BO, FTRE.BO, SHOP.BO, AVEU.BO, RLCP.BO, MOFS.BO, LTFH.NS, JMSH.BO, IIFL.NS, WELS.NS, VOLT.BO, TCS.BO, TAMO.BO, TITN.BO, TISC.BO, MRTI.BO, ASOK.BO, BRTI.BO, ICBK.BO, SBI.BO, HDBK.BO, EDEL.BO, INFY.BO, HCLT.BO, WIPR.BO)

13 July 2017
Tata Group 80
Credit Suisse has a material conflict of interest with the subject company (HCLT.BO) . Credit Suisse is acting as advisor to HCL Technologies Ltd for buyback of equity shares through tender offer.
For other important disclosures concerning companies featured in this report, including price charts, please visit the website at https://rave.credit-suisse.com/disclosures or call +1 (877) 291-2683. For date and time of production, dissemination and history of recommendation for the subject company(ies) featured in this report, disseminated within the past 12 months, please refer to the link: https://rave.credit-suisse.com/disclosures/view/report?i=309319&v=-5g3thnwnd6l7mrkia118cehfk .
Important Regional Disclosures Singapore recipients should contact Credit Suisse AG, Singapore Branch for any matters arising from this research report. The analyst(s) involved in the preparation of this report may participate in events hosted by the subject company, including site visits. Credit Suisse does not accept or permit analysts to accept payment or reimbursement for travel expenses associated with these events. Restrictions on certain Canadian securities are indicated by the following abbreviations: NVS--Non-Voting shares; RVS--Restricted Voting Shares; SVS--Subordinate Voting Shares. Individuals receiving this report from a Canadian investment dealer that is not affiliated with Credit Suisse should be advised that this report may not contain regulatory disclosures the non-affiliated Canadian investment dealer would be required to make if this were its own report. For Credit Suisse Securities (Canada), Inc.'s policies and procedures regarding the dissemination of equity research, please visit https://www.credit-suisse.com/sites/disclaimers-ib/en/canada-research-policy.html. Credit Suisse has acted as lead manager or syndicate member in a public offering of securities for the subject company (TAMO.BO, ASOK.BO, ICBK.BO, SBI.BO, HDBK.BO, IBM.N) within the past 3 years. Principal is not guaranteed in the case of equities because equity prices are variable. Commission is the commission rate or the amount agreed with a customer when setting up an account or at any time after that. This research report is authored by: Credit Suisse Securities (India) Private LimitedAnantha Narayan ; Nitin Jain ; Arnab Mitra ; Ashish Gupta ; Badrinath Srinivasan ; Jatin Chawla ; Ravi Shankar ; Sunil Tirumalai ; Lokesh Garg ; Vaibhav Jain ; Neelkanth Mishra ; Prateek Singh ; Rohit Kadam, CFA To the extent this is a report authored in whole or in part by a non-U.S. analyst and is made available in the U.S., the following are important disclosures regarding any non-U.S. analyst contributors: The non-U.S. research analysts listed below (if any) are not registered/qualified as research analysts with FINRA. The non-U.S. research analysts listed below may not be associated persons of CSSU and therefore may not be subject to the FINRA 2241 and NYSE Rule 472 restrictions on communications with a subject company, public appearances and trading securities held by a research analyst account. Credit Suisse Securities (India) Private LimitedAnantha Narayan ; Nitin Jain ; Arnab Mitra ; Ashish Gupta ; Badrinath Srinivasan ; Jatin Chawla ; Ravi Shankar ; Sunil Tirumalai ; Lokesh Garg
Important Credit Suisse HOLT Disclosures With respect to the analysis in this report based on the Credit Suisse HOLT methodology, Credit Suisse certifies that (1) the views expressed in this report accurately reflect the Credit Suisse HOLT methodology and (2) no part of the Firm’s compensation was, is, or will be directly related to the specific views disclosed in this report. The Credit Suisse HOLT methodology does not assign ratings to a security. It is an analytical tool that involves use of a set of proprietary quantitative algorithms and warranted value calculations, collectively called the Credit Suisse HOLT valuation model, that are consistently applied to all the companies included in its database. Third-party data (including consensus earnings estimates) are systematically translated into a number of default algorithms available in the Credit Suisse HOLT valuation model. The source financial statement, pricing, and earnings data provided by outside data vendors are subject to quality control and may also be adjusted to more closely measure the underlying economics of firm performance. The adjustments provide consistency when analyzing a single company across time, or analyzing multiple companies across industries or national borders. The default scenario that is produced by the Credit Suisse HOLT valuation model establishes the baseline valuation for a security, and a user then may adjust the default variables to produce alternative scenarios, any of which could occur. Additional information about the Credit Suisse HOLT methodology is available on request. The Credit Suisse HOLT methodology does not assign a price target to a security. The default scenario that is produced by the Credit Suisse HOLT valuation model establishes a warranted price for a security, and as the third-party data are updated, the warranted price may also change. The default variable may also be adjusted to produce alternative warranted prices, any of which could occur. CFROI®, HOLT, HOLTfolio, ValueSearch, AggreGator, Signal Flag and “Powered by HOLT” are trademarks or service marks or registered trademarks or registered service marks of Credit Suisse or its affiliates in the United States and other countries. HOLT is a corporate performance and valuation advisory service of Credit Suisse.
Important disclosures regarding companies or other issuers that are the subject of this report are available on Credit Suisse’s disclosure website at https://rave.credit-suisse.com/disclosures or by calling +1 (877) 291-2683.

13 July 2017
Tata Group 81
This report is produced by subsidiaries and affiliates of Credit Suisse operating under its Global Markets Division. For more information on our structure, please use the following link: https://www.credit-suisse.com/who-we-are This report may contain material that is not directed to, or intended for distribution to or use by, any person or entity who is a citizen or resident of or located in any locality, state, country or other jurisdiction where such distribution, publication, availability or use would be contrary to law or regulation or which would subject Credit Suisse or its affiliates ("CS") to any registration or licensing requirement within such jurisdiction. All material presented in this report, unless specifically indicated otherwise, is under copyright to CS. None of the material, nor its content, nor any copy of it, may be altered in any way, transmitted to, copied or distributed to any other party, without the prior express written permission of CS. All trademarks, service marks and logos used in this report are trademarks or service marks or registered trademarks or service marks of CS or its affiliates.The information, tools and material presented in this report are provided to you for information purposes only and are not to be used or considered as an offer or the solicitation of an offer to sell or to buy or subscribe for securities or other financial instruments. CS may not have taken any steps to ensure that the securities referred to in this report are suitable for any particular investor. CS will not treat recipients of this report as its customers by virtue of their receiving this report. The investments and services contained or referred to in this report may not be suitable for you and it is recommended that you consult an independent investment advisor if you are in doubt about such investments or investment services. Nothing in this report constitutes investment, legal, accounting or tax advice, or a representation that any investment or strategy is suitable or appropriate to your individual circumstances, or otherwise constitutes a personal recommendation to you. CS does not advise on the tax consequences of investments and you are advised to contact an independent tax adviser. Please note in particular that the bases and levels of taxation may change. Information and opinions presented in this report have been obtained or derived from sources believed by CS to be reliable, but CS makes no representation as to their accuracy or completeness. CS accepts no liability for loss arising from the use of the material presented in this report, except that this exclusion of liability does not apply to the extent that such liability arises under specific statutes or regulations applicable to CS. This report is not to be relied upon in substitution for the exercise of independent judgment. CS may have issued, and may in the future issue, other communications that are inconsistent with, and reach different conclusions from, the information presented in this report. Those communications reflect the different assumptions, views and analytical methods of the analysts who prepared them and CS is under no obligation to ensure that such other communications are brought to the attention of any recipient of this report. Some investments referred to in this report will be offered solely by a single entity and in the case of some investments solely by CS, or an associate of CS or CS may be the only market maker in such investments. Past performance should not be taken as an indication or guarantee of future performance, and no representation or warranty, express or implied, is made regarding future performance. Information, opinions and estimates contained in this report reflect a judgment at its original date of publication by CS and are subject to change without notice. The price, value of and income from any of the securities or financial instruments mentioned in this report can fall as well as rise. The value of securities and financial instruments is subject to exchange rate fluctuation that may have a positive or adverse effect on the price or income of such securities or financial instruments. Investors in securities such as ADR's, the values of which are influenced by currency volatility, effectively assume this risk. Structured securities are complex instruments, typically involve a high degree of risk and are intended for sale only to sophisticated investors who are capable of understanding and assuming the risks involved. The market value of any structured security may be affected by changes in economic, financial and political factors (including, but not limited to, spot and forward interest and exchange rates), time to maturity, market conditions and volatility, and the credit quality of any issuer or reference issuer. Any investor interested in purchasing a structured product should conduct their own investigation and analysis of the product and consult with their own professional advisers as to the risks involved in making such a purchase. Some investments discussed in this report may have a high level of volatility. High volatility investments may experience sudden and large falls in their value causing losses when that investment is realised. Those losses may equal your original investment. Indeed, in the case of some investments the potential losses may exceed the amount of initial investment and, in such circumstances, you may be required to pay more money to support those losses. Income yields from investments may fluctuate and, in consequence, initial capital paid to make the investment may be used as part of that income yield. Some investments may not be readily realisable and it may be difficult to sell or realise those investments, similarly it may prove difficult for you to obtain reliable information about the value, or risks, to which such an investment is exposed. This report may provide the addresses of, or contain hyperlinks to, websites. Except to the extent to which the report refers to website material of CS, CS has not reviewed any such site and takes no responsibility for the content contained therein. Such address or hyperlink (including addresses or hyperlinks to CS's own website material) is provided solely for your convenience and information and the content of any such website does not in any way form part of this document. Accessing such website or following such link through this report or CS's website shall be at your own risk.
This report is issued and distributed in European Union (except Switzerland): by Credit Suisse Securities (Europe) Limited, One Cabot Square, London E14 4QJ, England, which is authorised by the Prudential Regulation Authority and regulated by the Financial Conduct Authority and the Prudential Regulation Authority. Germany: Credit Suisse Securities (Europe) Limited Niederlassung Frankfurt am Main regulated by the Bundesanstalt fuer Finanzdienstleistungsaufsicht ("BaFin"). United States and Canada: Credit Suisse Securities (USA) LLC; Switzerland: Credit Suisse AG; Brazil: Banco de Investimentos Credit Suisse (Brasil) S.A or its affiliates; Mexico: Banco Credit Suisse (México), S.A. (transactions related to the securities mentioned in this report will only be effected in compliance with applicable regulation); Japan: by Credit Suisse Securities (Japan) Limited, Financial Instruments Firm, Director-General of Kanto Local Finance Bureau ( Kinsho) No. 66, a member of Japan Securities Dealers Association, The Financial Futures Association of Japan, Japan Investment Advisers Association, Type II Financial Instruments Firms Association; Hong Kong: Credit Suisse (Hong Kong) Limited; Australia: Credit Suisse Equities (Australia) Limited; Thailand: Credit Suisse Securities (Thailand) Limited, regulated by the Office of the Securities and Exchange Commission, Thailand, having registered address at 990 Abdulrahim Place, 27th Floor, Unit 2701, Rama IV Road, Silom, Bangrak, Bangkok10500, Thailand, Tel. +66 2614 6000; Malaysia: Credit Suisse Securities (Malaysia) Sdn Bhd; Singapore: Credit Suisse AG, Singapore Branch; India: Credit Suisse Securities (India) Private Limited (CIN no.U67120MH1996PTC104392) regulated by the Securities and Exchange Board of India as Research Analyst (registration no. INH 000001030) and as Stock Broker (registration no. INB230970637; INF230970637; INB010970631; INF010970631), having registered address at 9th Floor, Ceejay House, Dr.A.B. Road, Worli, Mumbai - 18, India, T- +91-22 6777 3777; South Korea: Credit Suisse Securities (Europe) Limited,
Seoul Branch; Taiwan: Credit Suisse AG Taipei Securities Branch; Indonesia: PT Credit Suisse Sekuritas Indonesia; Philippines:Credit Suisse Securities (Philippines ) Inc., and elsewhere in the world by the relevant authorised affiliate of the above. Additional Regional Disclaimers Hong Kong: Credit Suisse (Hong Kong) Limited ("CSHK") is licensed and regulated by the Securities and Futures Commission of Hong Kong under the laws of Hong Kong, which differ from Australian laws. CSHKL does not hold an Australian financial services licence (AFSL) and is exempt from the requirement to hold an AFSL under the Corporations Act 2001 (the Act) under Class Order 03/1103 published by the ASIC in respect of financial services provided to Australian wholesale clients (within the meaning of section 761G of the Act). Research on Taiwanese securities produced by Credit Suisse AG, Taipei Securities Branch has been prepared by a registered Senior Business Person. Australia (to the extent services are offered in Australia): Credit Suisse Securities (Europe) Limited (“CSSEL”) and Credit Suisse International (“CSI”) are authorised by the Prudential Regulation Authority and regulated by the Financial Conduct Authority (“FCA”) and the Prudential Regulation Authority under UK laws, which differ from Australian Laws. CSSEL and CSI do not hold an Australian Financial Services Licence (“AFSL”) and are exempt from the requirement to hold an AFSL under the Corporations Act (Cth) 2001 (“Corporations Act”) under Class Order 03/1099 published by the Australian Securities and Investments Commission (“ASIC”), in respect of the financial services provided to Australian wholesale clients (within the meaning of section 761G of the Corporations Act). This material is not for distribution to retail clients and is directed exclusively at Credit Suisse's professional clients and eligible counterparties as defined by the FCA, and wholesale clients as defined under section 761G of the Corporations Act. Credit Suisse (Hong Kong) Limited (“CSHK”) is licensed and regulated by the Securities and Futures Commission of Hong Kong under the laws of Hong Kong, which differ from Australian laws. CSHKL does not hold an AFSL and is exempt from the requirement to hold an AFSL under the Corporations Act under Class Order 03/1103 published by the ASIC in respect of financial services provided to Australian wholesale clients (within the meaning of section 761G of the Corporations Act). Credit Suisse Securities (USA) LLC (CSSU) and Credit Suisse Asset Management LLC (CSAM LLC) are licensed and regulated by the Securities Exchange Commission of the United States under the laws of the United States, which differ from Australian laws. CSSU and CSAM LLC do not hold an AFSL and is exempt from the requirement to hold an AFSL under the Corporations Act under Class Order 03/1100 published by the ASIC in respect of financial services provided to Australian wholesale clients (within the meaning of section 761G of the Corporations Act). Malaysia: Research provided to residents of Malaysia is authorised by the Head of Research for Credit Suisse Securities (Malaysia) Sdn Bhd, to whom they should direct any queries on +603 2723 2020. Singapore: This report has been prepared and issued for distribution in Singapore to institutional investors, accredited investors and expert investors (each as defined under the Financial Advisers Regulations) only, and is also distributed by Credit Suisse AG, Singapore Branch to overseas investors (as defined under the Financial Advisers Regulations). Credit Suisse AG, Singapore Branch may distribute reports produced by its foreign entities or affiliates pursuant to an arrangement under Regulation 32C of the Financial Advisers Regulations. Singapore recipients should contact Credit Suisse AG, Singapore Branch at +65-6212-2000 for matters arising from, or in connection with, this report. By virtue of your status as an institutional investor, accredited investor, expert investor or overseas investor, Credit Suisse AG, Singapore Branch is exempted from complying with certain compliance requirements under the Financial Advisers Act, Chapter 110 of Singapore (the “FAA”), the Financial Advisers Regulations and the relevant Notices and Guidelines issued thereunder, in respect of any financial advisory service which Credit Suisse AG, Singapore Branch may provide to you. UAE: This information is being distributed by Credit Suisse AG (DIFC Branch), duly licensed and regulated by the Dubai Financial Services Authority (“DFSA”). Related financial services or products are only made available to Professional Clients or Market Counterparties, as defined by the DFSA, and are not intended for any other persons. Credit Suisse AG (DIFC Branch) is located on Level 9 East, The Gate Building, DIFC, Dubai, United Arab Emirates. EU: This report has been produced by subsidiaries and affiliates of Credit Suisse operating under its Global Markets Division In jurisdictions where CS is not already registered or licensed to trade in securities, transactions will only be effected in accordance with applicable securities legislation, which will vary from jurisdiction to jurisdiction and may require that the trade be made in accordance with applicable exemptions from registration or licensing requirements. Non-US customers wishing to effect a transaction should contact a CS entity in their local jurisdiction unless governing law permits otherwise. US customers wishing to effect a transaction should do so only by contacting a representative at Credit Suisse Securities (USA) LLC in the US. Please note that this research was originally prepared and issued by CS for distribution to their market professional and institutional investor customers. Recipients who are not market professional or institutional investor customers of CS should seek the advice of their independent financial advisor prior to taking any investment decision based on this report or for any necessary explanation of its contents. This research may relate to investments or services of a person outside of the UK or to other matters which are not authorised by the Prudential Regulation Authority and regulated by the Financial Conduct Authority and the Prudential Regulation Authority or in respect of which the protections of the Prudential Regulation Authority and Financial Conduct Authority for private customers and/or the UK compensation scheme may not be available, and further details as to where this may be the case are available upon request in respect of this report. CS may provide various services to US municipal entities or obligated persons ("municipalities"), including suggesting individual transactions or trades and entering into such transactions. Any services CS provides to municipalities are not viewed as "advice" within the meaning of Section 975 of the Dodd-Frank Wall Street Reform and Consumer Protection Act. CS is providing any such services and related information solely on an arm's length basis and not as an advisor or fiduciary to the municipality. In connection with the provision of the any such services, there is no agreement, direct or indirect, between any municipality (including the officials,management, employees or agents thereof) and CS for CS to provide advice to the municipality. Municipalities should consult with their financial, accounting and legal advisors regarding any such services provided by CS. In addition, CS is not acting for direct or indirect compensation to solicit the municipality on behalf of an unaffiliated broker, dealer, municipal securities dealer, municipal advisor, or investment adviser for the purpose of obtaining or retaining an engagement by the municipality for or in connection with Municipal Financial Products, the issuance of municipal securities, or of an investment adviser to provide investment advisory services to or on behalf of the municipality. If this report is being distributed by a financial institution other than Credit Suisse AG, or its affiliates, that financial institution is solely responsible for distribution. Clients of that institution should contact that institution to effect a transaction in the securities mentioned in this report or require further information. This report does not constitute investment advice by Credit Suisse to the clients of the distributing financial institution, and neither Credit Suisse AG, its affiliates, and their respective officers, directors and employees accept any liability whatsoever for any direct or consequential loss arising from their use of this report or its content. Principal is not guaranteed. Commission is the commission rate or the amount agreed with a customer when setting up an account or at any time after that. Copyright © 2017 CREDIT SUISSE AG and/or its affiliates. All rights reserved.
Investment principal on bonds can be eroded depending on sale price or market price. In addition, there are bonds on which investment principal can be eroded due to changes in redemption amounts. Care is required when investing in such instruments. When you purchase non-listed Japanese fixed income securities (Japanese government bonds, Japanese municipal bonds, Japanese government guaranteed bonds, Japanese corporate bonds) from CS as a seller, you will be requested to pay the purchase price only.