theoretical and experimental bubble formation at a single orifice...
TRANSCRIPT
Chenucol Engmeering Science, Vol. 46, No. 1 I, pp 2881-2894, 1991. ooo9-2509/91 53.00 + 0.00 Printed in Great Britain. CC 1991 Pergaman Press plc
THEORETICAL AND EXPERIMENTAL BUBBLE FORMATION AT A SINGLE ORIFICE IN A
TWO-DIMENSIONAL GAS-FLUIDIZED BED
J. A. M. KUIPERS, W. PRINS and W. P. M. VAN SWAAIJ Department of Chemical Engineering, Twente University of Technology, PO Box 217, 7500 AE
Enschede, The Netherlands
(First received 17 September 1990; accepted in reused firm 7 March 1991)
Abstract-An earlier developed, first principles hydrodynamic model of gas-fluidized beds has been employed to study theoretically bubble formation at a single orifice in a two-dimensional bed. For several orifice discharge rates, theoretically predicted bubble sizes, formation times and shapes have been compared with experimental data obtained from triggered photographs. Besides, the present experimental and theoretical results were compared with predictions from two approximate models reported in the literature which are based on an idealized picture of the process of bubble formation. The advanced hydrodynamic model appears to predict the experimentally observed diameters, formation times and shapes of bubbles quite satisfactorily. The observed and calculated bubble diameters fall between the predictions from the two approximate models. Both the experimental and theoretical results clearly indicate that a strong leakage of bubble gas into the surrounding porous emulsion phase occurs, especially during the initial stage of bubble formation.
1. INTRODUCTION The formation of gas bubbles is one of the most characteristic phenomena of fluidized beds and it has been recorded over a considerable span of time. Many unique properties of fluidized beds can be related directly to the presence of bubbles and are dominated by their behaviour. Therefore, accurate prediction of bubble characteristics such as the size distribution, the bubble rise velocity distribution and the bubble frequency distribution is practically important. How- ever, these distributions depend on the “initial” bub- ble characteristics at the gas distributor, where the bubbles are generated. Furthermore, it is now widely recognized that the gas-solids contacting efficiency of fluidized bed chemical reactors is quite sensitive to the bed hydrodynamics just above the gas distributor plate. Mass and heat transfer processes are seriously affected by the mechanism of bubble formation. in large scale gas-fluidized beds, normally, bubbles ori- ginate from discrete holes or other orfices in the gas distributor plate on which the bed rests. Bubble for- mation in gas-fluidized beds at discrete orifices has been studied experimentally as well as theoretically by a number of investigators. Several approximate models, based on a strongly idealized picture of the process of bubble formation, have been presented in the literature.
2. REVIEW AND DISCUSSION OF APPROXIMATE THEORETICAL MODELS
Fluid&d beds possess a number of fluid-like prop- erties which led Harrison and Leung (1961) to adopt the Davidson and Schiiler (1960) model, originally developed to describe spherical bubble formation at a single orifice in an inviscid liquid, for the formation of gas bubbles in fluidized beds under similar conditions.
According to the Davidson and Schiiler model the bubble volume Vb at detachment and the correspond- ing time for bubble formation t, (“bubble detachment time”) are given respectively by
V, = 1.725(Co)0-h g ( >
and
fb 2 Q
(2)
where C, represents the virtual mass coefficient of a sphere, 9 the acceleration of gravity and Q the con- stant gas flow rate through the orifice. The value of the virtual mass coefficient C, is geometry dependent (Davidson and Harrison, 1963; Milne-Thomson, lY60) and has been calculated for a number of rela- tively simple configurations of practical interest (Fig. 1). In the model adopted by Harrison and Leung it has been assumed that gas leakage through the bubble surface into the emulsion phase does not occur. Nguyen and Leung (1972) injected air through an orifice into an incipiently fluidized two-dimen- sional bed of alumina particles. They correlated the observed bubble volumes with the gas flow rate through the orifice and the frequency of bubble for- mation, nb, as
indicating considerable (47%) leakage of the injected gas into the emulsion phase during the process of bubble formation. Rowe et al. (1979) used X-ray cine- photography to investigate the entry of gas from an orifice into various fluidized powders. The technique of X-ray observation of bubbles in gas-Auidized beds,

2882 J. A. M. KUIPERS et al.
(b) ,
orifice orifice
disbibutor plate I- emulsion phase
Fig. 1. Two geometrically different configurations for bub- ble formation at a single orifice in a gas-fluidized bed (three-
dimensional case). (a) C, = 1 l/16, (b) C, = l/2.
developed by Rowe and co-workers, has the advant- age that the fluidized bed is not disturbed during the experiment. Analysis of their film showed that the visible bubble flow could account only for approxjm- ately 50% of the gas injected into the bed. Obviously, a considerable gas leakage into the emulsion phase occurs, just as in the experiments of Nguyen and Leung.
Yang et al., (1984) have studied bubble and jet formation in a 3 m diameter semicylindrical bed, equipped with a similarly shaped 0.4 m diameter com- pound jet. In their large-scale cold-flow construction with transparent plexiglass pIates at the front (flat side) and transparent windows at the back (circum- ferential side), bubbles, and jets could be observed directly against the plane wall of the bed. These authors found that a substantial amount of the gas injected through the jet leaks from the bubble into the emulsion phase, particularly when the bed was oper- ated below the incipient fluidization velocity. The experimental data were correlated in the same form as eq. (3) with values of 0.303 or 0.118, depending on the operating conditions, of the coefficient on the right- hand side which indicates a leakage of respectively 69.7% and 88.2%. Yang et al. (1984) developed a model to describe this phenomenon by assuming that a hemispherical bubble is formed at the orifice where, similar to the Zenz (1968) assumption, bubble gas leaks out through the bubbIe boundary at a superfi- cial velocity equivalent to the superficial minimum fluidization velocity. The differential equation gover- ning the rate of change of the bubble volume V, with respect to the time f can then be expressed as:
where
Combination of eqs (4) and (5) yields a differential equation governing the rate of change of the bubble diameter D, with respect to time which can be integ- rated with the initial condition, D, = 0 at t = 0, to
give the following equation relating the time for bub- ble formation t, and the corresponding bubble dia- meter D,:
D h.mar =
Here 4, max represents the maximum bubble dia- meter, at which the total gas leakage through the bubble boundary equals the total inflow through the orifice (i.e. the jet). Equations (6) and (7) and the experimentally determined bubble frequency nb = l/r, provide the relations required to caIculate the bubble diameter nh and the integral gas leakage 0, defined by:
R = Qtb - I(, = Qt, - ;D:
Satisfactory agreement between the model predic- tions and the experimental data was found. However, a major drawback of the model proposed by Yang er al. (1984) is the necessary input of the experi- mentally observed bubble frequency. This experi- mental input is required because Yang et al. did not employ a momentum balance for the bubble. To predict theoretically both the (initial) bubble diameter and the corresponding bubble frequency, the mass balance and momentum balance of the forming bubble should be solved simultaneously. This ap- proach was followed by Caram and Hsu (1986) in a theoretical model describing the formation of a spher- ical bubble in a fluidized bed.
Their equation of motion, describing the position of the bubble centre S as a function of time, was identical to the one employed in the Davidson and Schiiler model. Unlike the Davidson and Schiiler model adop- ted by Harrison and Leung for spherical bubble formation in Ruidized beds, the Caram and Hsu model accounts for gas leakage into the emulsion phase. Darcy’s law was used to obtain an expression for the superlicial gas leakage velocity at the bubble boundary. Caram and Hsu reported satisfactory agreement of their model predictions with limited expcrimcntal data obtained from the litcraturc.
The main objective of the present investigation is to compare experimentally determined sizes, of bubbles formed at a single orifice in a two-dimensional gas- fluidized bed, with theoretical predictions from a pre- viously developed first principles hydrodynamic model of fluidized beds (Kuipers et al., 1991). In addition, the experimental and theoretical results will be compared with predictions from two approximate models, both based on an idealized picture of the process of bubble formation in fluidized beds. Some assumptions of these approximate models will be discussed in relation to the results obtained from the advanced hydrodynamic model.

Bubble formation at a single orifice in a two-dimensional gas-fluidized bed
The first approximate model is in fact a modifica- tion of the Harrison and Leung model (1961) and describes circular bubble formation at a single orifice in a two-dimensional bed. As in the Harrison and Leung model it has been assumed that no gas leakage through the bubble surface into the emulsion phase occurs. In the second approximate model it has been assumed, following the Zenz (1968) assumption, that the superficial leakage velocity of the bubble gas at the bubble boundary is equivalent to the superficial minimum fluidization velocity. In terms of the ap- proximate models the process of bubble formation is governed by the gas mass balance and the equation of motion for the bubble, represented in generalized form respectively by:
2883
yield the bubble radius R, and the bubble centre S as a function of time. Bubble detachment will occur when S = R,. Except for the case of unt, = 0, no analytical solution of eqs (11) and (12) can be obtained and they must be integrated numerically.
3. EXPERIMENTAL.
3.1. Equipment and experimental procedure The experiments were carried out in a thin two-
dimensional gas-fluidized bed shown schematically in Fig. 2. Two-dimensional fluidized beds have often been used to study fluidization phenomena experi- mentally (Rowe, 1971) because of the possibility of visual observation of the bed behaviour, for instance by photography. The experimental construction con- sists of a fluidized bed section built of 0.015 m thick glass plates (internal bed dimensions: width 0.57 m, height 1.0 m and depth 0.015 m) and a gas distributor section of 0.015 m-thick transparent plexiglass plates. The fluidizing gas is introduced through a porous plate (sintered stainless steel, average pore size 20 pm) provided with a central rectangular pipe (internal dimensions 15.0 mm x 15.0 mm). Humidified air was used to reduce electrostatical charging of the bed. Through the central rectangular pipe, covered with a stainless steel wire mesh, secondary (humidified) air could be injected independently. Calibrated thermal mass flow controllers were used to ensure constant mass flow rates of both the primary and secondary fluidizing air. Application of rapidly responding mag- netic valves coupled to a micro-computer, allowed accurate injection of secondary air quantities through the central pipe. During the experiments the outflow opening at the top of the fluidized-bed section was covered with a stainless steel wire mesh to prevent particle carry over from the bed and was exposed to the atmosphere. In order to ensure a true two-dimen- sional behaviour of the bed in the entrance region
&iJ = Q - Urn,4
where pe represents the emulsion phase density, S the distance between the bubble centre and the orifice and A, and V, the bubble surface and the bubble volume, respectively. In the case of circular bubble formation in a two-dimensional fluidized bed eqs (9) and (10) can be written as (for the case of constant emulsion phase density):
(12)
where 6, represents the bed thickness of the two- dimensional bed. Equations (11) and (12) can be solved, by specifying appropriate initial conditions, to
I 0.57 m
l
3- flange /5izA
- fluidized bed section (glass)
I- flange -gas distributor section (plexiglass)
- 3 mm glass beads
Fig. 2. Schematic representation of the two-dimensional gas-fluidized bed

2884 J. A. M. KUIPERS et al
near the “orifice”, which is of particular importance in the present study, it was decided to use a rectangular orifice pipe instead of a circular one.
The bed material consisted of spherical solid par- ticles (narrow size range; average particle diameter d, = 500 pm; microscopic density pb = 2660 kg/m3). In
the experiments solid particles were added to the incipiently fluidized bed until the bed level reached the same height which was chosen for the simulations (h,, = 0.5 m). The minimum fluidization velocity u,~ was obtained in the usual way by determining the point of intersection of the bed pressure drop versus fluidizing velocity curves for fixed bed and fluid bed flow regime.
could be registered. Each photograph shows a differ- ent stage during the bubble formation process. A measuring grid at the front side of the two-dimen- sional bed was used to determine the size of the bubbles from the photographs. Two alternative pro- cedures were considered for the evaluation of the equivalent bubble diameter D, from the photographs.
In a typical experiment to study bubble formation, initially both the primary and secondary air were injected at minimum fluidization velocity by two sep- arate flow controllers while a third flow controller was purging the air stream required to generate a bubble at the central orifice. By an appropriate micro-com- puter controlled switching of a carefully selected com- bination of magnetic valves, the secondary air stream could be replaced by the latter one at the beginning of each experiment.
(a) Calculation of the equivalent bubble diameter D, on basis of an elliptical bubble shape:
D, = J%% (13)
where D, and D, represent respectively the measured vertical and horizontal bubble diameter.
(b) Calculation of the equivalent bubble diameter D, from the measured bubble area A:
-
The reported average bubble diameters are based on two or more bubbles for each time delay used in the experiments.
3.2. Measurement of bubble properties 4. HYDRODYNAMIC MODEL
Photography has been applied as a technique to measure bubble sizes during the process of bubble formation at the central orifice. A NIKON F-301 camera was used together with an ILFORD PANF IS0400 film. With the aid of a micro-computer a pulse was generated which triggered the camera to take a photograph of the bed while a flashlight was generated at the rear side of the bed. By applying increasing time delays between the generation of a pulse and the injection of gas through the central orifice, the complete process of bubble formation
Our previously developed theoretical model of gas-fluidized beds (Kuipers et al., 1991) is based on a two-fluid model approach in which both phases are considered to be continuous and fully interpenetra- ting. In fact, the equations employed in this theoret- ical model can be seen as a generalization of the Navier-Stokes equations for two interacting con- tinua.
Two sets of conservation equations are used, gover- ning the balance of mass, momentum and thermal energy in each phase. Table 1 shows the mass and
(14)
Table 1. Hydrodynamic model equations in vector notation
Continuity equations
Fluid phase
Solid phase
Momentum equations
Fluid phase
ah4 - + (V*Ep,U) = 0 at
act1 - E)YSI at + [v*(l - E)P,V] = 0.
4EPA 2
at + (v*&p,UU) = - Evp - p(U - V) + - i+(v*U)~ II
Solid phase
au1 ~ E)P,VI at
+ [V*(l - E)&VV] = - (1 - E)VP + fi(u - v) + i.[ II v (I - E) - &(V.“iI
(Tl-1)
(Tl-2)
(U-3)
+ (v.(I - E){P,[(vv) + (v+]}) - G(E)VE + (I- E)p,g (Tl-4)

Bubble formation at a single orifice in a two-dimensional gas-fluidized bed 2885
momentum conservations equations for both phases in vector form. In the present study bubble formation in a cold-flow two-dimensional gas-fluidized bed-will be studied and because of the anticipated small heat effects, the solution of the thermal energy equations is not considered here. Due to the mathematical com- plexity of the equations of change, a numerical solu- tion method has been used (Kuipers et al., 1991).
The numerical technique has been embodied in an unsteady two-dimensional computer code written in VAX-PASCAL. The computer model calculates the porosity, the pressure, the fluid phase temperature and the solid phase temperature and the velocity fields of both phases in two-dimensional Cartesian or (axi- symmetrical) cylindrical coordinates. These variables constitute the so called “primary” or basic variables. For closure of the set of balance equations specifica- tion of the constitutive relations is required which implies specification of all other variables in terms of the basic variables. Incorporation of these constitu- tive equations introduces the necessary empirical in- formation.
4.1. Constitutive equations Fluid phase density p/ and solid phase density pS:
The fluid phase density is related to the pressure and Buid phase temperature by the ideal gas law:
Mr pr = mp- For the solid phase microscopic incompressibility was assumed. Accordingly a specified constant density p.,. was taken:
P, = P&O. (16)
Interphase momentum transfer coefficient 0: For porosities E -c 0.8 the interphase momentum transfer coefficient has been obtained from the well-known vectorial Ergun equation (see Radestock and Jeschar, 1971):
p = 150(l - 8 Pr -7 + 1.75(1 - E) (@rip) Ill- VI E (U,)
(17)
whereas for porosities E > 0.8 the interphase momentum transfer coefficient has been derived from the correlation of Wen and Yu (1966):
(184
f(E) = &-2.65. U8W
The drag coefficient Cd is related to the Reynolds number Re, by (Rowe, 1961):
c ;[I + 0.15(Rep)0.687], Re, < 1030 Vc) d P
0.44, Re, P- 1000
where
Re = EPf lu - vld, P
p’, . (184
In eq. (18a), f(e) accounts for the presence of other particles in the fluid and corrects the drag coefficient for a single isolated particle.
Fluid phase shear viscosity hJ and solid phase shear viscosity ps: The present model incorporates, as evid- ent from inspection of the momentum equations given in Table 1, Newtonian behaviour with zero bulk viscosities for both phases. Consequently only speci- fication of the shear viscosities is required here. For the fluid phase shear viscosity pf the corresponding microscopic shear viscosity of the fluidizing medium [air at approximately under atmospheric conditions (p = 101.3 kPa, T = 293 K)] has been used in the present study:
p, = 2.0 x 10e5 Pas. (19al
Direct rheological measurements by Schiigerl et al. (1961) indicate that fluidiied suspensions exhibit approximate Newtonian behaviour at low shear rates, and that the apparent bed viscosity, depending on the bed conditions (fluidization velocity), particle type and particle diameter, ranges typically between 0.5 and 1.2 Pas (i.e. 500 to 1200 times the viscosity of water at room temperature). Grace (1970) employed an indirect method (bubble shape measurements) to estimate the apparent bed viscosity of fluidized sus- pensions and found excellent agreement with the results obtained by Schiigerl et al. (1961). Apparent bed viscosities, for spherical ballotini with a narrow particle-size distribution, have been determined experimentally by Schiigerl et al. (1961) and empir- ically by Grace (1970). Their results are presented in Table 2. The apparent bed viscosity of fluidized sus- pensions is rather high in comparison with the vis- cosity of ordinary liquids. In the present study the bed material consisted of mono-sized spherical glass beads (ballotini) with particle diameter d, = 500 pm. Based on the results obtained by Schiigerl and Grace the following estimate for the solid phase shear viscosity
Table 2. Apparent bed viscosities for narrow size range spherical ballotini
Particle diameter fuml
Apparent bed viscosity Results Results
of S&tiger1 of Grace’
Pas Pas
550 0.95 460 1.20 220 0.90 0.85 170 0.80 0.75 140 0.80 0.80 120 0.80 0.85 82 0.60 0.90 60 0.40 0.70
TMeasurements in a rotating cylinder viscometer. $Deduced from bubble shape measurements.
J. A. M. KUIPERS et al. 2886
/L~ has been made:
,us = 1.0 Pas. (19h)
in the present study, the solid phase shear viscosity p* has been taken to be constant as a first approxima- tion. Thus, it has been assumed that & is independent of the porosity E.
Solid phase elastic modulus G(E): As discussed in the previous paper (Kuipers et al., 1991) the solid phase elastic modulus G(E) is important from both a physical and a numerical viewpoint and has been incorporated in the model according to the following generalized form:
G(E) = - G,{exp[c(&* -&)I} (20)
where G, represents the the normalizing units factor, c the compaction modulus and E* the compaction gas phase volume fraction. To prevent unacceptable bed compaction G, has been taken as 1 Pa, c = 100 and &* = 0.45.
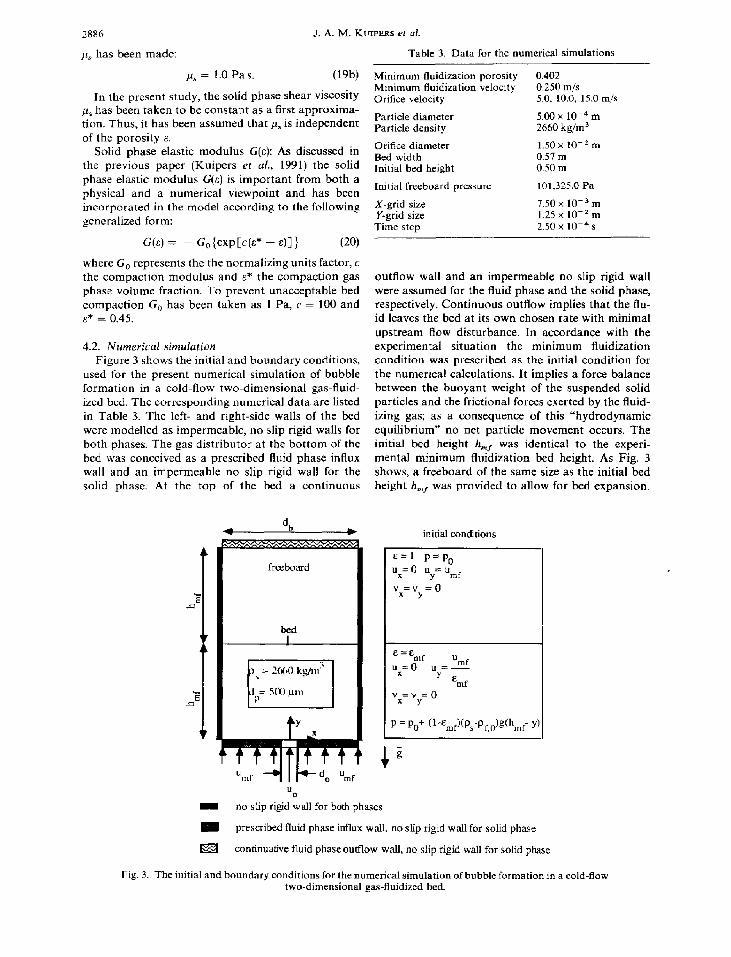
4.2. Numerical simulation Figure 3 shows the initial and boundary conditions,
used for the present numerical simulation of bubble formation in a cold-flow two-dimensional gas-fluid- ized bed. The corresponding numerical data are listed in Table 3. The left- and right-side walls of the bed were modelled as impermeable, no slip rigid walls for both phases. The gas distributor at the bottom of the bed was conceived as a prescribed fluid phase influx wall and an impermeable no slip rigid wall for the solid phase. At the top of the bed a continuous
4 %
Table 3. Data for the numerical simulations
Minimum Ruidization porosity 0.402 Minimum fluidization velocity 0.250 m/s Orifice velocity 5.0, 10.0, 15.0 m/s
Particle diameter 5.00x IOe4m Particle density 2660 kg/m3
Orifice diameter 1.50 X to-2m Bed width 0.51 I11 Initial bed height 0.50 m
Initial freeboard pressure 101,325.o Pa
X-grid size 7.50 x lO-‘m Y-grid size 1.25 x lo-‘rn Time step 2.50 x 10⁻⁴s
outflow wall and an impermeable no slip rigid wall were assumed for the fluid phase and the solid phase, respectively. Continuous outflow implies that the flu- id leaves the bed at its own chosen rate with minimal upstream flow disturbance. In accordance with the experimental situation the minimum fluidization condition was prescribed as the initial condition for the numerical calculations. It implies a force balance between the buoyant weight of the suspended solid particles and the frictional forces exerted by the fluid- izing gas; as a consequence of this “hydrodynamic equilibrium” no net particle movement occurs. The initial bed height h,, was identical to the experi- mental minimum fluidization bed height. As Fig. 3 shows, a freeboard of the same size as the initial bed height h,, was provided to allow for bed expansion.
initial conditions
E=l p=pO ux= 0 “y= Umf
vx=v =o Y
E=& mf ” ” =o “Cmf
x y 5nf
“=V=O 7. Y
P =P,,+ (I-~,~)(p,-p~,,)g(h~i Y
m no slip rigid wall for both phases
I prescribed fluid phase influx wall, noslip rigid wallfor solid phase
ta continuative fluid phase outflow wall, no slip rigid wall for solid phase
Fig. 3. The initial and boundary conditions for the numerical simulation of bubble formation in a cold-flow two-dimensional gas-fluidized bed.

Bubble formation al a single orifice in a two-dimensional gas-fluidized bed 2887
Fig. 4. Photographically observed and theoretically calculated bubble growth at a single orifice in a two- dimensional gas-Auidized bed (u, = 10 m/s).
2888 J. A. M. KUIPERS et al.
At zero time the gas velocity injected through the central orifice was increased instantaneously from minimum fluidization velocity u,,,~ to the required orifice velocity u,. Only three orifice velocities (i.e. 5, 10 and 15 m/s) were considered in this study. To save computer time, symmetry about the ccntre line of the bed (x = 0) was assumed which can be justified on the basis of the symmetrical initial and boundary condi- tions. In the actual calculations only the region to the right of the bed centre line was considered (required number of computational cells: 38 x 80 = 3040) with a fictitious impermeable free slip rigid wall for both phases at x = 0 (i.e. the centre line of the bed).
5. RESULTS
Theoretically calculated and experimentally ob- served bubble formation for three different orifice velocities, namely u, = 5, 10 and 15 m/s will he dis- cussed. In addition, the theoretical and experimental results will be compared with two approximate models reported in the literature. Detailed results however are presented only for the case of U, = lOm/s.
CM) I
I I , I I
-0.10 -0.05 0.00 0.05 0.10
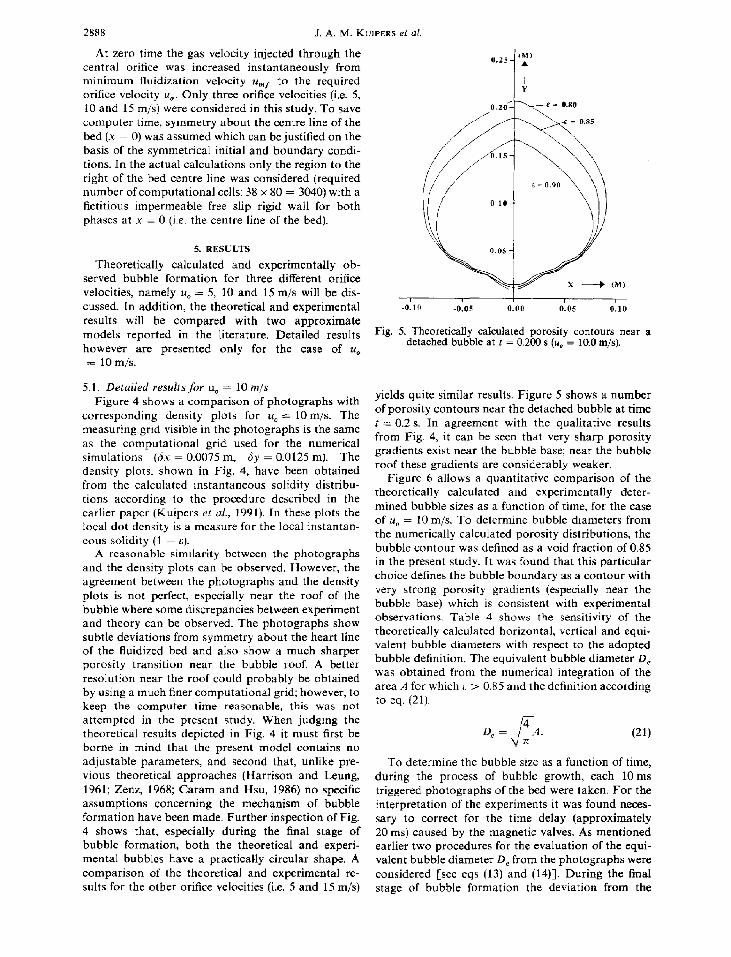
Fig. 5. Theoretically calculated porosity contours near a detached bubble at t = 0.200 s (u, = 10.0 m/s).
5.1. Detailed resultsfor u, = 10 m/s Figure 4 shows a comparison of photographs with
corresponding density plots for U, = lOm/s. The measuring grid visible in the photographs is the same as the computational grid used for the numerical simulations (6x = 0.0075 m, 6y = 0.0125 m). The density plots, shown in Fig. 4, have been obtained from the calculated instantaneous solidity distribu- tions according to the procedure described in the earlier paper (Kuipers et aE., 1991). In these plots the local dot density is a measure for the local instantan- eous solidity (1 ~ c).
yields quite similar results. Figure 5 shows a number of porosity contours near the detached bubble at time t = 0.2 s. In agreement with the qualitative results from Fig. 4, it can be seen that very sharp porosity gradients exist near the bubble base; near the bubble roof these gradients are considerably weaker.
A reasonable similarity between the photographs and the density plots can be observed. However, the agreement between the photographs and the density plots is not perfect, especially near the roof of the bubble where some discrepancies between experiment and theory can be observed. The photographs show subtle deviations from symmetry about the heart line of the fluidized bed and aIso show a much sharper porosity transition near the bubble roof. A better resolution near the roof could probably be obtained by using a much finer computational grid; however, to keep the computer time reasonable, this was not attempted in the present study. When judging the theoretical results depicted in Fig. 4 it must first be borne in mind that the present model contains no adjustable parameters, and second that, unlike pre- vious theoretical approaches (Harrison and Leung, 1961; Zenz, 1968; Caram and Hsu, 1986) no specific assumptions concerning the mechanism of bubble formation have been made. Further inspection of Fig. 4 shows that, especially during the final stage of bubble formation, both the theoretical and experi- mental bubbles have a practically circular shape. A comparison of the theoretical and experimental re- sults for the other orifice velocities (i.e. 5 and 15 m/s)
Figure 6 allows a quantitative comparison of the theoretically calculated and experimentally deter- mined bubble sizes as a function of time, for the case of u, = 10 m/s. To determine bubble diameters from the numerically calculated porosity distributions, the bubble contour was defined as a void fraction of 0.85 in the present study. It was found that this particular choice defines the bubble boundary as a contour with very strong porosity gradients (especially near the bubble base) which is consistent with experimental observations. Table 4 shows the sensitivity of the theoretically calculated horizontal, vertical and equi- valent bubble diameters with respect to the adopted bubble definition. The equivalent bubble diameter D, was obtained from the numerical integration of the area A for which E > 0.85 and the definition according to eq. (21).
(21)
To determine the bubble size as a function of time, during the process of bubble growth, each 10 ms triggered photographs of the bed were taken. For the interpretation of the experiments it was found neces- sary to correct for the time delay (approximately 20 ms) caused by the magnetic valves. As mentioned earlier two procedures for the evaluation of the equi- valent bubble diameter D, from the photographs were considered [see eqs (13) and (14)]. During the final stage of bubble formation the deviation from the
Bubble formation at a single orifice in a two-dimensional gas-fIuidized bed 2889
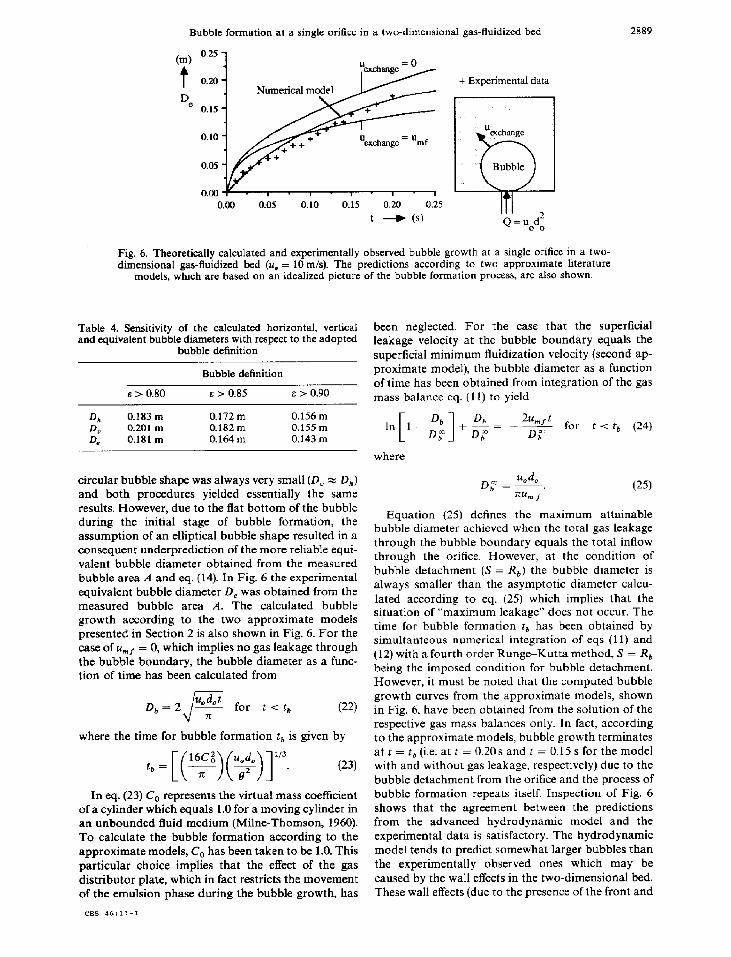
+ Experimental data
Fig. 6. Theoretically calculated and experimentally observed bubble growth at a single orifice in a two- dimensional gas-fluidized bed (u, = 10 m/s). The predictions according to two approximate literature
models, which are based on an idealized picture of the bubble formation process, are also shown.
Table 4. Sensitivity of the calculated horizontal, vertical and equivalent bubble diameters with respect to the adopted
bubble definition
Bubble definition
E > 0.80 E > 0.85 E > 0.90
D, 0.183 m 0.172 m 0.156 m D” 0.201 In 0.182 m 0.155 m 0, 0.181 m 0.164 m 0.143 m
circular bubble shape was always very small (D, x D,,) and both procedures yielded essentially the same results. However, due to the flat bottom of the bubble during the initial stage of bubble formation, the assumption of an elliptical bubble shape resulted in a consequent underprediction of the more reliable equi- valent bubble diameter obtained from the measured bubble area A and eq. (14). In Fig. 6 the experimental equivalent bubble diameter D, was obtained from the measured bubble area A. The calculated bubble growth according to the two approximate models presented in Section 2 is also shown in Fig. 6. For the case of u,~ = 0, which implies no gas leakage through the bubble boundary, the bubble diameter as a func- tion of time has been calculated from
D, = 2 for t-ctb (22)
where the time for bubble formation tb is given by
t, = [ (F)($$)]“‘. (23)
In eq. (23) C,, represents the virtual mass coefficient of a cylinder which equals 1.0 for a moving cylinder in an unbounded fluid medium (Milne-Thomson, 1960). To calculate the bubble formation according to the approximate models, C, has been taken to be 1.0. This particular choice implies that the effect of the gas distributor plate, which in fact restricts the movement of the emulsion phase during the bubble growth, has
been neglected. For the case that the superficial leakage velocity at the bubble boundary equals the superficial minimum fluidization velocity (second ap- proximate model), the bubble diameter as a function of time has been obtained from integration of the gas mass balance eq. (11) to yield
+D,=__ hnf t Dbm D?
for t < tb (24)
where
%4 Db” = -.
Equation (25) defines the maximum attainable bubble diameter achieved when the total gas leakage through the bubble boundary equals the total inflow through the orifice. However, at the condition of bubble detachment (S = Rb) the bubble diameter is always smaller than the asymptotic diameter calcu- lated according to eq. (25) which implies that the situation of “maximum leakage” does not occur. The time for bubble formation t, has been obtained by simultanteous numerical integration of eqs (11) and (12) with a fourth order Runge-Kutta method, S = R, being the imposed condition for bubble detachment. However, it must be noted that the computed bubble growth curves from the approximate models, shown in Fig. 6, have been obtained from the solution of the respective gas mass balances only. In fact, according to the approximate models, bubble growth terminates at t = tb (i.e. at t = 0.20s and t = 0.15 s for the model with and without gas leakage, respectively) due to the bubble detachment from the orifice and the process of bubble formation repeats itself. Inspection of Fig. 6 shows that the agreement between the predictions from the advanced hydrodynamic model and the experimental data is satisfactory. The hydrodynamic model tends to predict somewhat larger bubbles than the experimentally observed ones which may be caused by the wall effects in the two-dimensional bed. These wall effects (due to the presence of the front and
2890 J. A. M. KUIPERS el al.
back wall in the experimental bed) are not included in the present two-dimensional model. To investigate this effect theoretically, an extension of the two- dimensional model to a three-dimensional model would be required.
Figure 6 also shows that, initially, both approxim- ate models predict essentially the same bubble diameters. At the same time both models initially overpredict the experimentally observed bubble dia- meters. It can be shown, by making a Taylor ex- pansion on the left-hand side of eq. (24) and sub- sequent rearrangement of the resulting expression, that eq. (24) reduces to eq. (22) provided that
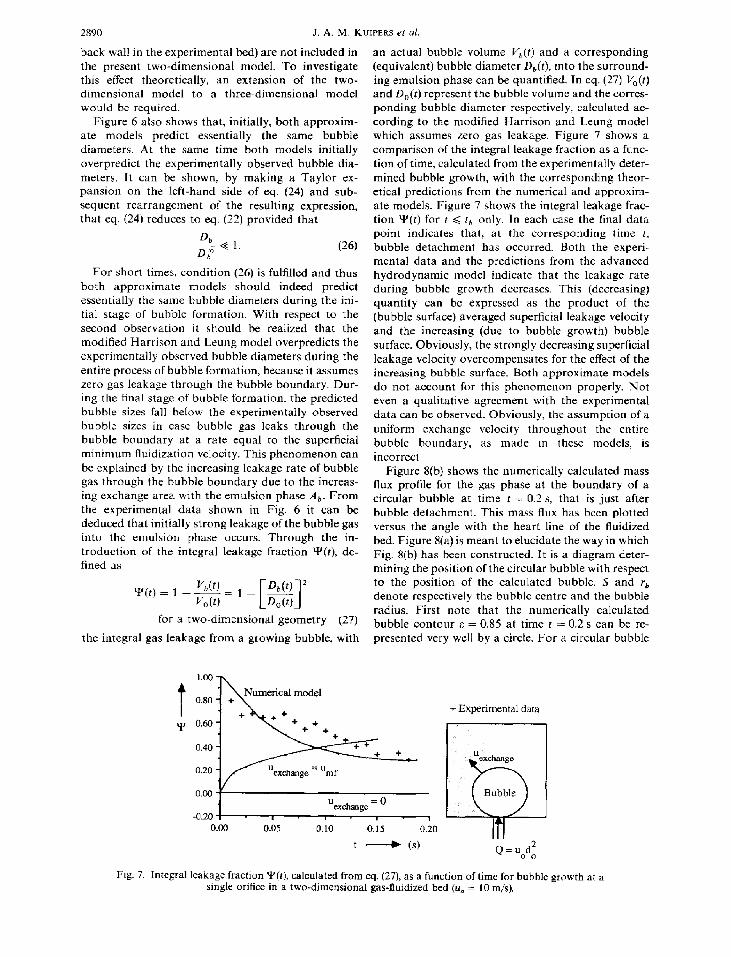
For short times, condition (26) is fulfilled and thus both approximate models should indeed predict essentially the same bubble diameters during the ini- tial stage of bubble formation. With respect to the second observation it should be realized that the modified Harrison and Leung model overpredicts the experimentally observed bubble diameters during the entire process of bubble formation, because it assumes zero gas leakage through the bubble boundary. Dur- ing the final stage of bubble formation, the predicted bubble sizes fall below the experimentally observed bubble sizes in case bubble gas leaks through the bubble boundary at a rate equal to the superficial minimum fluidization velocity. This phenomenon can be explained by the increasing leakage rate of bubble gas through the bubble boundary due to the increas- ing exchange area with the emulsion phase A,. From the experimental data shown in Fig. 6 it can be deduced that initially strong leakage of the bubble gas into the emulsion phase occurs. Through the in- troduction of the integral leakage fraction Y(t), de- fined as
Y(t) = 1 - ‘b(‘) _ 1 _
Yo(Q for a two-dimensional geometry (27)
the integral gas leakage from a growing bubble, with
an actual bubble volume Va(t) and a corresponding (equivalent) bubble diameter D&), into the surround- ing emulsion phase can be quantified. In eq. (27) &(t) and D,(t) represent the bubble volume and the corres- ponding bubble diameter respectively, calculated ac- cording to the modified Harrison and Leung model which assumes zero gas leakage. Figure 7 shows a comparison of the integral leakage fraction as a func- tion of time, calculated from the experimentally deter- mined bubble growth, with the corresponding theor- etical predictions from the numerical and approxim- ate models. Figure 7 shows the integral leakage frac- tion Y(t) for t < r, only. In each case the final data point indicates that, at the corresponding time t, bubble detachment has occurred. Both the experi- mental data and the predictions from the advanced hydrodynamic model indicate that the leakage rate during bubble growth decreases. This (decreasing) quantity can be expressed as the product of the (bubble surface) averaged superficial leakage velocity and the increasing (due to bubble growth) bubble surface. Obviously, the strongly decreasing superficial leakage velocity overcompensates for the effect of the increasing bubble surface. Both approximate models do not account for this phenomenon properly. Not even a qualitative agreement with the experimental data can be observed. Obviously, the assumption of a
uniform exchange velocity throughout the entire bubble boundary, as made in these models, is incorrect.
Figure 8(b) shows the numerically calculated mass flux profile for the gas phase at the boundary of a circular bubble at time t = 0.2 s, that is just after bubble detachment. This mans flux has been plotted versus the angle with the heart line of the fluidized bed. Figure 8(a) is meant to elucidate the way in which Fig. 8(b) has been constructed. It is a diagram deter- mining the position of the circular bubble with respect to the position of the calculated bubble. S and rb denote respectively the bubble centre and the bubble radius. First note that the numerically calculated bubble contour F = 0.85 at time f = 0.2 s can be re- presented very well by a circle. For a circular bubble
+ Experimental data
I
Q = uadz
Fig. 7. Integral leakage fraction Y(t), calculated from eq. (27), as a function of time for bubble growth at a single orifice in a two-dimensional gas-fluidized bed (u, = 10 m/s).

Bubble formation at a single orifice in a two-dimcnsiuual gas-fluidized bed 2891
(4
t Y
o.30 Figure 8a ii = (sin(Q), cos(@)) 1 I
0.25
0.20
0.15
0.10
0.05
0.00 -0.20 -0.15 -0.10 -0.05 -0.00 0.05 0.10 0.15 0.20
x + (m)
0.00 0.20 0.40 0.60 0.80 1.00
Fig. 8. Calculated gas phase mass flux profile at the bound- ary of a circular bubble with centre S and radius rb approx-
mating the calculated bubble.
the net local mass efflux J(4) of the gas phase at the bubble boundary depends only on the angle d, (Fig. 8) and is given by:
J(4) = (Epfu.n) = (~~~u,)sing + (~~,u,)cos&
(28)
where n represents the unit outward normal vector at the bubble boundary. Inspection of Fig. 8 shows that bubble gas leaks through the bubble roof into the emulsion phase. However, at the bubble base emulsion phase gas flows into the bubble. Although bubble detachment has already occurred at time t = 0.188 s (corresponding equivalent bubble diame- ter D, = 0.16 m), substantial inflow of the gas injected through the orifice still takes place at time f = 0.2 s.
Figure 9 shows the photograph of a detached bub- ble and the corresponding density plot at time t = 0.2 s. The photograph indicates the presence of a spout between the orifice and the detached gas bub- ble. By this spout the gas injected through the orifice is partially introduced into the detached gas bubble. Obviously, the process of bubble formation is much more complex than assumed in the approximate models in the literature. A comparison between the experimentally observed and the theoretically calcu- lated bubble diameters is presented in Table 5. The close agreement between the experimental data and the predictions from the advanced hydrodynamic model is remarkable. Figure 10 shows a comparison
Fig. 9. Experimental (photograph) and theoretical (density plot) bubbles.
Table 5. Bubble diameters at t = 0.2 s
Experimental Theoretical
4 0.174 m 0.172 m DV 0.164 m 0.182 m 0, 0.170 m 0.164 m
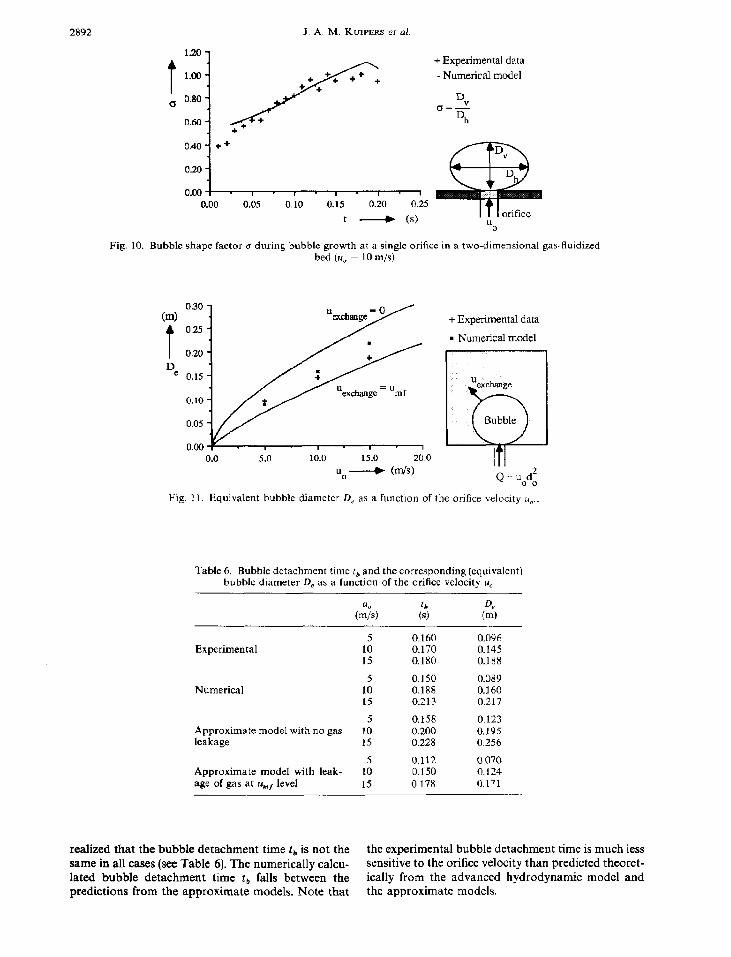
between the observed and calculated bubble shape factor c = D,/D, during the process of bubble growth at the orifice. The deviation from the circular bubble shape (u = 1.0) appears to be considerable, especially during the initial stage of bubble formation. For other orifice velocities than 10 m/s (i.e. 5 and 15 m/s) similar results have been obtained. Both approximate models assume circular bubbles during the entire process of bubble growth.
5.2. Summary of’results for u, = 5, 10 and 15 mfs A comparison of the experimental and theoretical
bubble diameters, at the moment of bubble detach- ment, is presented in Fig. 11 as a function of the orifice velocity I+,. This figure also shows the predictions according to the approximate bubble formation mo- dels. Both the experimentally determined and the numerically calculated equivalent bubble diameters fall between the predictions from these approximate models. However, in comparing the results it must be
2892
+ Experimental data
- Numerical model
lj++_ , . , . , . , . (
0.00 0.05 0.10 0.15 0.20 0.25
t __) W u 0
Fig. 10. Bubble shape factor cr during bubble growth at a single orifice in a two-dimensional gas-fluid&d bed (u, = 10 m/s).
0.0 5.0 10.0 15.0 20.0
u0 + (m/s) Q = ucd;
Fig. 11. Equivalent bubble diameter D, as a function of the orifice velocity U,
+ Experimental data
n Numerical model
Table 6. Bubble detachment time t, and the corresponding (equivalent) bubble diameter D, as a function of the orifice velocity U,
5 0.160 0.096 Experimental 10 0.170 0.145
15 0.180 0.188
5 0.150 0.089 Numerical 10 0.188 0.160
15 0.213 0.217
5 0.158 0.123 Approximate model with no gas 10 0.200 0.195 leakage 15 0.228 0.256
5 Cl.112 0.070 Approximate model with leak- 10 0.150 0.124 age of gas at u,, level 15 0.178 0.171
realized that the bubble detachment time t, is not the the experimental bubble detachment time is much less same in all cases (see Table 6). The numerically calcu- sensitive to the orifice velocity than predicted theoret- lated bubble detachment time tb falls between the ically from the advanced hydrodynamic model and predictions from the approximate models. Note that the approximate models.

Bubble formation at a single orifice in a two-dimensional gas-fluid&d bed 2893
6. CONCLUSIONS J(4) mass flux of the gas phase at the bubble bound-
The formation of gas bubbles at a single orifice in a two-dimensional gas-fluidized bed has been studied experimentally and theoretically. It has been demon- strated that the formation of gas bubbles is predicted satisfactorily by the earlier developed first principles hydrodynamic model of fluidized beds (Kuipers et al., 1991). Good agreement between the theoretically pre- dicted bubble sizes and the experimentally determined bubble sizes has been obtained.
A comparison of the present experimental and theoretical data with predictions from two approxim- ate models, available in the literature and based on an idealized picture of the process of bubble formation, has also been made. Especially during the initial stage of bubble formation, strong leakage of bubble gas into the surrounding porous emulsion phase occurs. This is indicated by both the results of the experiments and numerical calculations. The theoretical calculations additionally show that during the final stage of bubble formation, bubble gas leaks through the bubble roof whereas emulsion phase gas enters the bubble at the bubble base. The deviatiun from the circular bubble shape is considerable during the initial stage of bubble formation.
Although the approximate models clearly have
M n
nb P Q R Rb Rep rb s T
v, VCI
V
X
ary defined in eq. (28), kg/(m* s) molecular weight, kg/kmol unit outward normal vector at bubble bound- ary bubble frequency, s - 1 pressure, Pa gas flow rate through orifice, m3js gas constant, J/(kmol K) bubble radius, m particle Reynolds number equivalent bubble radius, m bubble centre temperature, K time, s bubble formation time, s fluid phase velocity, m/s minimum fluidization velocity, m/s superficial injection velocity through orifice, m/s bubble volume, m3 bubble volume for the case of zero gas leakage, m3 solid phase velocity, m/s lateral coordinate, m vertical coordinate, m
their utility because of their simplicity and ability to oredict the correct order of magnitude of the bubble Greek letters _ &es, they do not give a correct representation of these cr phenomena.
volumetric interphase momentum transfer coef- ficient, kg/(m’ s) bed thickness, m
Acknowledgements- This investigation was supported by 6x VEG-Gasinstituut B. V. of the Netherlands. central technical 6Y institute of the Dutch gas supply companies. We also E acknowledge our indebtedness to A. R. Roebersen and H. Tammes for their assistance in the experimental work and ‘M
the numerical solution of the approximate theoretical mo- e*
cc dels. P
A, CO Cl C
D,
D,
4
D,
Do
NOTATION
bubble surface, m2 virtual mass coefficient drag coefficient compaction modulus bubble diameter, m
; 6% ‘r(t) n
eouivalent bubble diameter, m horizontal bubble diameter, m vertical bubble diameter, m bubble diameter for the case of zero gas leak- age, m
b
e
L,
I
bed diameter, m orifice diameter, m particle diameter, m interaction function defined in eq. (18b) particle-particle interaction modulus, Pa particle-particle interaction modulus for E = E*, Pa gravitational force per unit mass, m/s’ bed height at minimum fluidization conditions, m unit tensor
f h max mf 0
P
bed Subscripts
bubble equivalent emulsion phase fluid phase horizontal maximum minimum fluidization conditions microscopic property particle solid phase vertical x-direction y-direction freeboard conditons
V
X
0
lateral computational cell dimension, m vertical computational cell dimension, m porosity minimum fluidization porosity compaction gas phase volume fraction shear viscosity, kg/(m s) density, kg/m3 bubble shape factor defined in Fig. 10 angle defined in Fig. 8 sphericity integral leakage fraction defined in eq. (27) integral gas leakage during process of bubble formation, m3

2894 J. A. M. KUIPERS el al.
Superscripts T transpose * asymptotic value
fluidized beds. Chem. Engng Sci. (submitted). Milne-Thomson, L. M., 1960, Theoretical Hydrodynamics,
4th Edition. Macmillan, London. Nguyen, X. T. and Leung, L. S., 1972, Chem. Engng Sci. 27,
I TAR Operator
_, ._. Radestock. J. and Jeschar, R., 1971, Chemir-lnyr-Tech. 43,
V gradient V- divergence
REFERENCES
Caram, H. S. and Hsu, K. K., 1986, Chem. Engng Sci. 41, 1445.
Davidson, J. F. and Schiiler, B. 0. G., 1960, Trans. lnstn them. Engrs 38, 335.
Davidson, J. F. and Harrison, D., 1963, Fluidized Particks. Cambridge University Press, Cambridge
Grace, J. R., 1970, Can. J. them. Engng 48, 30. Harrison, D. and Leung, L. S., 1961, Trans. lnstn ckem. Engrs
39, 409. Kuipers, J. A. M., van Duin, K. J., van B&urn, F. P. H. and
van Swaaij, W. P. M., 1991, A numerical model of gas-
1304. Rowe, P. N. and Henwood, G. A., 1961, Trans. lnstn rhem.
Engrs 39, 43. Rowe, P. N., 1961, Trans. Instn them. Engrs 39, 175. Rowe, P. N., 1971, in Fluidiration (Edited by J. F. Davidson,
and D. Harrison), p. 121. Academic Press, New York. Rowe, P. N., MacGillivray, H. J. and Cheesman, D. J., 1979,
Trans. Instn them. Engrs 57, 194. Schiigerl, K., Merz, M. and Fetting, F., 1961, Chem. Engng
sci. 15, 1. Wen, Y. C. and Yu, Y. H., 1966, Chem. Engng Prog. Symp.
Ser. 62, 100. Yang, W.-C., Revay, D., Anderson, R. G., Chelen, E. J.,
Keairns, D. L. and Cicero, D. C., 1984, in FIuidization (Edited by D. Kunii, and R. Toei), p. 77. Engineering Foundation, distributed by A.1.Ch.E. J.
Zenz, F. A., 1968, Inst. them. Engng Symp. Ser. 30, 136.