theoretical estimate of energy balance and … · theoretical estimate of energy balance and...
TRANSCRIPT

Croatian Journal of Fisheries, 2019, 77, 63-76L.A. Zykov et al. (2019): Theoretical estimate of energy balance of A.gueldenstaedtii
© 2019 Author(s). This is an open access article licensed under the Creative Commons Attribution-NonCommercial-NoDerivs License (http://creativecommons.org/licenses/by-nc-nd/3.0/)
63
DOI: 10.2478/cjf-2019-0007 CODEN RIBAEG ISSN 1330-061X (print)1848-0586 (online)
THEORETICAL ESTIMATE OF ENERGY BALANCE AND NUTRITIONAL NEEDS OF THE POPULATION OF RUSSIAN STURGEON Acipenser gueldenstaedtii IN THE CASPIAN SEA
Leonid Alexandrovich Zykov1, Botagoz Murasovna Nasibulina1, Tatyana Fedorovna Kurochkina1, Attaala Muhaysin Ali2*, Nikolai Nikolaevich Popov3, Shalgymbaeva Muhametkalievna Saule4
1 Faculty of Geology & Geography/Innovative Natural Institute, Astrakhan State University, Shaumyana Str. 1, Astrakhan, Russia,
2 Faculty of Environmental Sciences and Marine Biology, Hadhramout University, Mukalla, Yemen, 3 Kazakh Fisheries Research Institute, Atyrau, Republic of Kazakhstan, 4 Faculty of Biology and Biotechnology/ Kazakhstan National University named after Al-Farabi, Almaty, Republic of Kazakhstan
*Corresponding Author, Email: [email protected]
ARTICLE INFO ABSTRACTReceived: 7 January 2018Accepted: 5 February 2019
Individual and group annual rations of Russian sturgeon Acipenser gueldenstaedtii are calculated on the basis of models describing the energy balance and dynamics of the number of fish generations with natural mortality depending on age. The structure of the energy balance and its separate components were studied. It is shown that the greatest amount of energy of consumed food by the population is spent on energy process. Individual rations of Russian sturgeon increase with age, whereas group rations decrease. The received results can be used to theoretically estimate the volumes of artificial and natural reproduction that provides the formation of stocks of Russian sturgeon in accordance with the forage productivity of the Caspian Sea.
Keywords:SturgeonPopulationRationBiomassMortalityAcipenser gueldenstaedtii
How to Cite Zykov, L.A., Nasibulina, B.M., Kurochkina, T.F., Ali, A.M., Popov, N.N., Saule, S.M. (2019): Theoretical estimate of energy balance and nutritional needs of the population of Russian sturgeon Acipenser gueldenstaedtii in the Caspian Sea. Croatian Journal of Fisheries, 77, 63-76. DOI: 10.2478/cjf-2019-0007.

Croatian Journal of Fisheries, 2019, 77, 63-76L.A. Zykov et al. (2019): Theoretical estimate of energy balance of A.gueldenstaedtii
© 2019 Author(s). This is an open access article licensed under the Creative Commons Attribution-NonCommercial-NoDerivs License (http://creativecommons.org/licenses/by-nc-nd/3.0/)
64
INTRODUCTION
In addition to the Caspian Sea Russian sturgeon (Acipenser gueldenstaedtii) population, this species is native to the Black Sea, Sea of Azov, entering all main rivers that empty into them (Sokolov and Berdicheskii, 1989; Kolman and Zarkua, 2002). The appearance of Russian sturgeon in the Baltic Sea basin may be explained by accidental escape of some young individuals from fish farms or purposely released by fishermen or aquarists (Keszka and Heese, 2003; Skora and Arciszewski, 2013). Russian sturgeon is one of the most important representatives of valuable commercial fish of the sturgeon family (Acipenseridae). It is introduced throughout Europe and considered critically endangered (Kottelat and Freyhof, 2007). Russian sturgeon (A. gueldenstaedtii) is one of the main sturgeon species used in worldwide aquaculture production, particularly in North America (Nathanailides et al., 2002; Ireland et al., 2002). In the last decades, Russian sturgeon stocks have been in bad condition and need to be restored. It is necessary to know how much food it consumes during a year and what amount of the sturgeon family can be grown in the Caspian Sea on the basis of forage resources. These questions are answered by the methods of physiology, production hydrobiology and the theory of dynamics of fish stocks, which are based on the knowledge of the rate of physiological process, growth, population and age structure of fish inhabiting water bodies (Winberg, 1979; Dutil and Brander, 2003; Alimov et al., 2014; MacKenzie and Ko¨ster, 2004). The study of physiological process rate, the balance of energy, individual and group rations and the nutritional needs of fish makes it possible to calculate the amount of food consumed by fish, the degree of absorption of the used forage resources, to define the potential biological and fishery reproduction of populations, the necessary volumes of natural and artificial reproduction, the acceptable catching and also the optimal fishing operation modes, providing the formation and sustainable conservation of fish stocks at a level responsible for feed productivity in water bodies. Information on the rate of physiological process, the balance of energy and nutritional needs of Russian sturgeon are absent in literature, so the main goal of our research was to define the annual nutritional needs of Russian sturgeon on the individual, generation and population levels.
MATERIAL AND METHODS
The material for the work was used from literary data on the growth of length and body weight of fish at different ages, sizes, age and duration of puberty, spawning frequency, as well as the maximum size and life expectancy of Russian sturgeon in natural conditions
(Zykov et al., 2013). The annual rations and nutritional requirements of Russian sturgeon were calculated by Melnichuk (1978) and Winberg (1979) methods, using the fish energy balance equation:
Ct = Re + Pw + Pq + FR (1)
where Ct is the energy need of fish for general process; Re – energy expenditure on energy process;Pw – energy expenditure on plastic process (body weight
increase of the individual);Pq– energy expenditure on generative growth;FR– indigested part of ration.
The daily food energy expenditure of sturgeon Ec on energy process was calculated by Melnichuk’s method using the formula:
Re = (24 × 1.5 × 4.86 × Ec) / (g × Cc) (2)
where 24 is the number of hours per day.■ 1.5 is a constant showing how many times the rate of
active exchange is higher than the standard;■ 4.86 – an oxy-caloric coefficient;■ Eс – rate of oxygen consumption by an individual (ml
O2 / specimens, hour); ■ Cc – the energy equivalent of the raw fish substance
(1100 cal / gr of raw substance);■ g – Krog's temperature allowance which characterizes
the correlation between the rate of process in natural conditions and at 20°C temperature.
The rate of oxygen consumption is connected to the body weight of fish and this connection is described by the power function equation (Winberg, 1956; Melnichuk, 1978):
Eс = ао W kо (3)
where ао, kо are constants;W is a body weight of fish.
The constant values ао, kо of equation of oxygen consumption rate by Russian sturgeon (3) are defined on the basis of Melnichuk’s (1978) data for various fishes. The equation of oxygen consumption rate of Russian sturgeon has the form:
Ec = 0.351W 0.810 (4)
Krog's temperature allowance, g = 1.231, is defined on the basis of Melnichuk’s data (1984) for the average temperature of sturgeon in its growing period, which is + 17.0°C (Baydin and Kosyrev, 1986).According to the available data (Baydin and Kosyrev, 1986), the duration of the sturgeon growing (feeding) period is 240 days while the temperature of the sea is normally above 10°C, as the exchange rate and the amount of food consumed by sturgeon, as an poikilothermic animal, is significantly reduced in winter. As a result, annual individual food requirements of sturgeon were calculated by multiplying the daily rations by the number of feeding days. The annual individual energy expenditure

Croatian Journal of Fisheries, 2019, 77, 63-76L.A. Zykov et al. (2019): Theoretical estimate of energy balance of A.gueldenstaedtii
© 2019 Author(s). This is an open access article licensed under the Creative Commons Attribution-NonCommercial-NoDerivs License (http://creativecommons.org/licenses/by-nc-nd/3.0/)
65
on the plastic process Pw was calculated as the difference between the body weight of individuals at the beginning and the end of the year (absolute annual increase of body weight of individuals). The annual individual energy expenditure on generative process is considered to be 7% of the body weight of fish (Melnichuk, 1978). On the basis of the received process equations, the coefficients κ1 and κ2, characterizing the energy efficiency of the food consumed by the sturgeon for growth (plastic metabolism), were calculated. The values of these coefficients were calculated according to the formulas (Melnychuk, 1986):
κ1 = Pw / Ct (5) κ2 = Pw / (Eс + Pw) (6)
The value of the undigested part of the ration Rf in accordance with Melnichuk’s studies (Melnichuk, 1978) is considered to be 20% of the consumed food.The annual group rations of Russian sturgeon were calculated by multiplying the annual individual rations by the corresponding number of individual age groups which were the part of population. In the same way, the rations of fish, caught in annual catch and having died within a year of natural causes (total mortality), were calculated. The results of the calculations are given in the corresponding tables.The studies were carried out on the model "conditional" sturgeon population, formed at its annual stable recruit-stock, equal to 1.0 million specimens of juveniles at the age of 0+ years.The number and biomass of the conditional sturgeon population was calculated using the model describing the change in the number and biomass of fish generations during a life cycle, taking into account the variability of growth in size and age of maturity, fishery and natural mortality: ν
Nt = R0,5 (1 – νm1 – νf1
)(1 – νm2 – νf2
)...(1 – νmt – νft
) (7)
In the model:Nt – population of sturgeon generation at the age of t; R0,5 – the initial population of generation at the juvenile
age (0+);νmt
, νft – coefficients of annual natural and fishery
mortality at the age of t.
The number and biomass of the conditional population of Russian sturgeon, formed from the recruit-stock of 1.0 million specimens of juveniles, was calculated on the basis of literature data on the rate of linear and weight growth, size, age and puberty tempo, the periodicity of spawning, the maximum size and life span of generation individuals. The number of generations was calculated in a prospective order, from the youngest one to the older age group, starting from the first age group, the number of which is R0,5 = 1.0 million specimens of juveniles (Zykov et al., 2013).The notions of the coefficients of the annual natural νmt
, fishery νft
and general mortality νzt used in the model (7)
were defined as in Zykov, 2011 and Zykova et al., 2013:
νmt = nmt / Nt (8)
νft = nft / Nt (9)
νzt = (nmt + nft) / Nt = nzt / Nt (10)
wherenmt
is the number of generation individuals at the age of t, dying within a year of natural causes;
nft – the number of generation individuals at the age of t caught in the process of fishery during the year (including official, unaccounted and poaching);
nzt – the total number of generation individuals at the age of t, dying within the year because of catching and natural causes.
In order to estimate the fishery harvesting degree of spawning fish, the spawning stock mortality factor was also used, the value of which was determined as:
νfnt = nft / ntn (11)
wherentn is the number of spawners at age of t which entered
the river;νfnt
– fishery mortality coefficient of spawners at the age of t.
The included number of spawners ntn entering a river for spawning was calculated on the basis of the population of the Nt generation (7), taking into account the puberty tempo and the periodicity of spawning of the individuals:
ntn = (γ / τ) Nt (12)
whereγ is the segment in the generation of eugamic fish (the
coefficient of puberty generation);τ – indicator of the spawning periodicity: if fish spawning
occurs annually τ = 1, if 1 time in 2 years -τ = 2, if 1 time in 3 years -τ = 3, etc.
The population of spawning herds Nt used by the fishery was calculated as the sum of generations of its separate ages:
(13)
According to the equalities (9), (11), (13), the proportion between the fishery mortality coefficient of the generation νft
(9) and the fishing mortality coefficient of spawners νfnt
(11) remains the same:
νft = (γ / τ) νfnt
(14)
This proportion shows that when the values of the coefficients γ and τ tend to 1, the mortality coefficient of spawners νfnt
tends to the value of the coefficient of the fishing mortality of the generation νft
. The coefficient of the fishing mortality of the generation νft
increases if the spawning mortality value of the spawning herd νfnt
and
∑=T
ttnn
p
nN

Croatian Journal of Fisheries, 2019, 77, 63-76L.A. Zykov et al. (2019): Theoretical estimate of energy balance of A.gueldenstaedtii
© 2019 Author(s). This is an open access article licensed under the Creative Commons Attribution-NonCommercial-NoDerivs License (http://creativecommons.org/licenses/by-nc-nd/3.0/)
66
the rate of puberty of the generations γ increase, and the period between the two spawnings τ decreases.According to the literary data (Derzhavin, 1947; Chugunov and Chugunova, 1964), the first maturity of Russian sturgeon occurs at the age of 7.0 - 8.0 years and is fully completed at the age of 14.0 - 15.0. On the basis of the size and age composition of spawning stocks of Russian sturgeon (Chugunov and Chugunova, 1964), while counting the population of spawners, it was accepted that 10% becomes mature at the age of 7.0 years (γ = 0.1), 25% - at the age of 8 years (γ = 0.25), 35% - at the age of 9 years (γ = 0.35), 45% - at the age of 10 years (γ = 0.45), 55% - at the age of 11 years (γ = 0.55), 70% at 12 years (γ = 0.7), 80% - at 13 years (γ = 0.8), 90% - at 14.0 years (γ = 0.9), at the age of 15.0 all the members of the generation individuals become mature.According to the literary data (Chugunov and Chugunova, 1964; Kazancheev, 1981), Russian sturgeon spawns once in 2-5 years. It means that if the spawning of sturgeon occurs 1 time in 2 years (τ = 2), 50% of the total number of mature fish is involved in reproduction and the rest 50% gain weight in the sea with gonads that are in the intermediate stages of maturity. If spawning takes place once in 3 years (τ = 3), 33% of mature fish participate in reproduction and 67% are in the sea, and with a frequency of 4 years (τ = 4), 25% of fish is spawning, etc. The fish that misses the spawning and gains weight in the sea is the stock of spawning herd.The catching nft
, received from the age group t of the spawning herd, was calculated on the basis of the number (12) of spawners ntn that entered the river and the given coefficient value of the fishery mortality of the spawning herd νfnt
(11):nft
= νfnt ntn (15)
or the basis of (14) the total number of generation :
nft = νfnt
(γ / τ) Nt (16)
The number of the conditional population, formed with an annual stable recruit-stock R0.5 = 1.0 million specimens of juveniles, was calculated according to the formula: (17)
The transition from numerical to weight reserve indicators was carried out by simple multiplying of the number of individual age groups by the average weights of the individuals:
Bt = Nt Wt (18)
Bnt = nt Wt (19)
Bft = nft
Wt (20)
(21)
(22)
(23)
where Bt is the biomass of the sturgeon generation at the age
of t;Bn – biomass of spawners that entered the river at the age
of t;Bf – catching of the age group expressed in weight units;Q – biomass of the population from the factory fry;Qn – biomass of the spawning herd;Qf– yield to the fishery, expressed by weight units.
The coefficients of natural mortality νmt included in the
population model (1) were calculated using an equation describing the change in their values during the life cycle of fish, depending on age:
νmt = 1 – Atk (Tk – tk) (24)
where A, k, Tk are constants.
The given model of natural mortality is dramatically different from traditional concepts when the coefficient of natural mortality is accepted to be constant at different ages (Baranov, 1925; Zasosov, 1976; Beverton and Holt, 1957; Ricker, 1975).The constants A, k, Tk of the natural mortality equation (24) were calculated from the constant values of the growth equations of the power type and the allometric proportion of length-weight of fish:
l = qtk (25)
W = ptC (26)
W = αlβ (27)where
■ l, W are the length and weight of sturgeon at the age of t;
■ q, p, α are constants that numerically characterize the length and weight of yearlings at the age of t = 1, and also sturgeon body mass with a length l = 1;
■ k, C, β are constants characterizing the relative rate of linear and weight growth of fish at the age of t or with a length l (Mina and Klevezal, 1976; Zykov, 2005).
The constants of the growth equations (25) – (27) are connected with each other by the proportions:
p = αqβ (28)
C = βk (29)
The values of the constants of linear and weight growth equations (25 – 27) were calculated on the basis of the data of sturgeon length and mass at different ages from Chugunov and Chugunova (1964) and Piskunov (1970), ∑=
T
tt
o
BQ ;
∑=
=fT
ttNN
5.0
∑=T
tnn
f
tBQ ;
∑=T
tff
f
tBQ ;

Croatian Journal of Fisheries, 2019, 77, 63-76L.A. Zykov et al. (2019): Theoretical estimate of energy balance of A.gueldenstaedtii
© 2019 Author(s). This is an open access article licensed under the Creative Commons Attribution-NonCommercial-NoDerivs License (http://creativecommons.org/licenses/by-nc-nd/3.0/)
67
using the statistical functions of Microsoft Excel 2015.The curves of linear, weight growth and allometric relation between the length and weight of Russian sturgeon, constructed from the initial data, are shown in Fig. 1.Constants A, Tk of the natural mortality equation (24) were calculated from the received values of the constants q, k, C, β of the growth equations and the characteristics of maturing according to the formulas:
A = (1 – νmp) / tp2k (30)
νmp = 1 – e–Mp (31)
Mp = (βk) / tp (32)
tp = (lp / q)1/k (33)
Tk = L / q = 2lp / q (34)
T = (L / q)1/k (35)where
■ νmp is the lowest value of the natural death coefficient
at puberty age;■ lp, tp – the average length and age of maturity,
respectively, at which 50% of the generation become mature;
■ Mp – instantaneous coefficient of natural mortality of fish at maturity age;
■ L – maximum biological length of fish of the population L = 2lp;
■ Tk – constant, T - maximum age of sturgeon.
The energy balance equations of Russian sturgeon, received according to the formulas (1) – (4), are shown in Table 1. These equations and calculations allow us to calculate the values of each individual component of the energy balance equation for one individual. Knowing the number of individuals of different sizes and masses, the energy balance can be calculated for the entire population.All calculations envisaged by the research task were performed directly on the initial biological characteristics of Russian sturgeon. Since these characteristics have a species affiliation, other Caspian sturgeon species and possible indirect influence on their size have not been taken into account.
Table 1. Energy balance equations used for calculating daily and population rations of Russian sturgeon
Re – daily energy expenditure of consumed food on energy process, g Re = (1,5×24×4,86×0,391×Wt
0.810c) / (1,213×1100) = 0,0516Wt 0.810; (36)
Ec – oxygen consumption rate, by an individual(ml О2 / specimen / hr) Ec=0.351W0,810; (37)
Pw – annual energy expenditure on plastic process (annual weight gain of individual), g ∆Wt = W(t+1) - Wt ; (38)
Pq – annual energy expenditure on generative growth, g Pqt= 0.07Wt; (39)
FR – indigested part of ration, (%) 20
Ct – the equation of the annual ration of one fish Ct = 1.25 * (12.384Wt 0.810+ ∆Wt +0.07Wt); (40)
RESULTS AND DISCUSSION
According to the literary data (Derzhavin, 1947; Pavlov and Elizarov, 1970), the first maturation of sturgeon occurs when sturgeon reaches the length of 80 - 95 cm, mass maturation - at 125-140 cm. The maximum length of Russian sturgeon in the Caspian Sea, according to various resources (Derzhavin, 1947; Kazancheev, 1981; Tsepkin and Sokolov, 1971) reaches 200- 210cm (length), 60-70 kg (weight), 45-50 years old (age). On the basis of these data, it was calculated that 50% of matured sturgeon generations occur at a length of lp = 105 cm, and its maximum biological dimension is L = 210 cm, which agrees with the Fulton-Dryagin rule (Dryagin, 1948), according to which these indicators are in correlation lp = 0.5 L.The constants and data of the growth equations and natural mortality of Russian sturgeon, received on the basis of biological materials and used in calculations, are given in Table 2.From Table 1, it is clear that the length (lp = 105 cm), age (tp = 10.75 cm), 50% of maturity, maximum length (L = 210 cm) and age (T = 45.6 years) of Russian sturgeon closely correspond to their observed values. The estimated annual length q = 33.6 cm is also in agreement with the growth rates of yearlings (Korobochkina, 1970). This indicates the correctness of the calculation methods used in our research. It should be noted that the length of the yearling q of Russian sturgeon is about 32% of the size of puberty lp and 16% of the maximum length L. The ratio between the age of puberty tp and the maximum age T determines the ratio that follows from (33) and (35).Maturation tp occurs earlier in relation to the maximum age T, if k increases. The questions of the relationship between growth, puberty, natural mortality, life expectancy and fish stocks at the interspecific, species-specific geographic and intraspecific population levels were considered in more detail and comprehensively in previous studies (Zykov, 2005).Individual daily and annual rations of Russian sturgeon of different age and mass, calculated by the method of energy balance, are given in Table 3.

Croatian Journal of Fisheries, 2019, 77, 63-76L.A. Zykov et al. (2019): Theoretical estimate of energy balance of A.gueldenstaedtii
© 2019 Author(s). This is an open access article licensed under the Creative Commons Attribution-NonCommercial-NoDerivs License (http://creativecommons.org/licenses/by-nc-nd/3.0/)
68
Table 2. The values of the constants and the growth equations characteristics and the natural mortality of Russian sturgeon
Constants, parameters q k α β p C lp
Calculated Values 33.64 0.4793 0.0074 3.000 281,8 1.4379 105.0
Observed Values 30 - - - 250 - 80-140
Constants, parameters L tp T Mp νmp Tk A
Calculated Values 210.0 10.75 45.64 0.134 0.125 6.242 0.0898
Observed Values 200-210 8-12 45-50 - - - -
Analysis of the received data (Table 3) showed that the individual annual values of individual components of the annual balance of energy of Russian sturgeon increase with age.The largest individual energy expenditure of consumed food by sturgeon accounts for energy process, 71.4-74.8% of the total annual ration. Its share in the general process does not differ so much with age.Individual energy expenditure on plastic process is 1.6-22.4% of the general process and the share of plastic process is dramatically reduced with age of sturgeon, together with the change in the relative weight growth rate of sturgeon, which, like in other fish, changes during life according to the hyperbolic curve of the relative rate of weight gain with a denominator which is equal to the value of the constant C of the mass growth equation (26) (Zykov, 2005).The individual energy expenditure of consumed food on generative metabolism is close in magnitude to the energy expenditure on plastic metabolism. The share of generative metabolism is 2.0-3.3% and slightly increases with age. Generative metabolism is a function of the body
weight of fish, so its relative magnitude remains fairly stable during some time.The relative energy expenditure of consumed food per unit of sturgeon body weight (Cs / Wt) is also changeable during a lifetime. Its magnitude decreases with age. The highest relative annual energy expenditure on the general process accounts for the youngest ages, 8.11 kg per 1.0 kg of juveniles (t = 0.64 years, weight - 0.178 kg), the lowest – to the old age groups - 1.98 kg per 1 kg of individuals at the age of 45.6 with an average body weight of 68.52 kg (Table 3). The level reduction of relative general process with age is explained by the decrease in the relative speed of weight gain and plastic fish process in older ages.For studying the nutritional needs and the rate of process of Russian sturgeon at the group generation and population level with the help of model (7), the number of its conditional population, formed from the annual recruit-stock R0.1 = 1.0 million specimens of juveniles with the coefficient of a spawning mortality rate of spawning stock νfnt
= 0.3 or 30% and spawning periodicity once in 3 years (τ = 3) (Table 4), was calculated.
Age (t+0,5)
Weight Wt+0.5
Components of the energy balance equationEnergy
Re
Plastic, Pw
Reproductive, Pq
General,Сt
Relative Сt / Wt+0.5
0.64 0.178 0.820 0.323 - 1.444 8.10
1.64 0.591 2.161 0.501 - 3.380 5.72
2.64 1.151 3.709 0.619 - 5.511 4.79
3.64 1.816 5.369 0.713 - 7.761 4.27
4.64 2.569 7.110 0.793 - 10.10 3.93
5.64 3.397 8.916 0.864 - 12.52 3.69
6.64 4.293 10.78 0.928 0.301 15.01 3.50
7.64 5.250 12.69 0.987 0.368 17.55 3.34
8.64 6.264 14.64 1.041 0.438 20.15 3.22
Table 3. Individual annual rations of Russian sturgeon of different age (years) and weight (kg)

Croatian Journal of Fisheries, 2019, 77, 63-76L.A. Zykov et al. (2019): Theoretical estimate of energy balance of A.gueldenstaedtii
© 2019 Author(s). This is an open access article licensed under the Creative Commons Attribution-NonCommercial-NoDerivs License (http://creativecommons.org/licenses/by-nc-nd/3.0/)
69
Age (t+0,5)
Weight Wt+0.5
Components of the energy balance equationEnergy
Re
Plastic, Pw
Reproductive, Pq
General,Сt
Relative Сt / Wt+0.5
9.64 7.331 16.62 1.092 0.513 22.79 3.11
10.64 8.448 18.65 1.141 0.591 25.47 3.02
11.64 9.611 20.70 1.187 0.673 28.20 2.93
12.64 10.82 22.79 1.230 0.757 30.97 2.86
13.64 12.07 24.90 1.272 0.845 33.77 2.80
14.64 13.36 27.04 1.312 0.935 36.60 2.74
15.64 14.69 29.20 1.350 1.029 39.47 2.69
16.64 16.06 31.38 1.388 1.124 42.37 2.64
17.64 17.47 33.59 1.423 1.223 45.29 2.59
18.64 18.91 35.82 1.458 1.324 48.25 2.55
19.64 20.38 38.06 1.492 1.427 51.23 2.51
20.64 21.89 40.33 1.525 1.532 54.23 2.48
21.64 23.43 42.61 1.557 1.640 57.26 2.44
22.64 25.01 44.91 1.588 1.750 60.32 2.41
23.64 26.61 47.23 1.618 1.863 63.39 2.38
24.64 28.24 49.57 1.648 1.977 66.49 2.35
25.64 29.90 51.92 1.677 2.093 69.61 2.33
26.64 31.60 54.28 1.705 2.212 72.75 2.30
27.64 33.31 56.66 1.733 2.332 75.91 2.28
28.64 35.06 59.06 1.760 2.454 79.09 2.26
29.64 36.83 61.47 1.787 2.578 82.29 2.23
30.64 38.63 63.89 1.813 2.704 85.51 2.21
31.64 40.46 66.32 1.839 2.832 88.74 2.19
32.64 42.31 68.77 1.864 2.962 91.99 2.17
33.64 44.19 71.23 1.889 3.093 95.26 2.16
34.64 46.09 73.70 1.913 3.226 98.55 2.14
35.64 48.01 76.18 1.937 3.361 101.9 2.12
36.64 49.96 78.68 1.961 3.497 105.2 2.11
37.64 51.93 81.19 1.984 3.635 108.5 2.09
38.64 53.93 83.70 2.007 3.775 111.9 2.07
39.64 55.95 86.23 2.029 3.916 115.2 2.06
40.64 57.99 88.77 2.052 4.059 118.6 2.05
41.64 60.05 91.32 2.074 4.204 122.0 2.03
42.64 62.13 93.88 2.095 4.349 125.4 2.02
43.64 64.24 96.45 2.117 4.497 128.8 2.01
44.64 66.37 99.03 2.138 4.646 132.3 1.99
45.64 68.52 101.6 2.159 4.796 135.7 1.98

Croatian Journal of Fisheries, 2019, 77, 63-76L.A. Zykov et al. (2019): Theoretical estimate of energy balance of A.gueldenstaedtii
© 2019 Author(s). This is an open access article licensed under the Creative Commons Attribution-NonCommercial-NoDerivs License (http://creativecommons.org/licenses/by-nc-nd/3.0/)
70
Fig 1. The curves of linear (a), weight (b) growth, allometric proportion between length and weight (c) and natural mortality of Russian sturgeon (d) received on the basis of the growth equation of I.I. Schmalhausen (1935)
The equations of linear (25), weight (26) gain, the allometric correlation (27) and natural mortality (24) of Russian sturgeon used in calculations such as:
l = 33.64 t0.4793
W = 281.8 t1.4379
W= 0.0074 l3
νmt = 1– 0.0898 t0.4793 (6.242 – t0.4793)
The charts of these equations are shown in Fig. 1.Calculations showed that from 1.0 million specimens of juveniles, a conditional population of Russian sturgeon, the population of 2331.1 million individuals with the biomass of 3936.6 tons, is formed at a 3-year periodicity of spawning with 30% of removal of the spawning herd. The age limit of the biomass of generations accounts for the age groups close to the age of puberty, which is tp = 10.75 years. The number of spawning herd is 48.42 thousand individuals, biomass - 533.5 tons or 2.0% of the population and 13.5% of the total biomass of the population (Table 4).Under given operating conditions, the annual fishery decrease of sturgeon is 14.5 thousand individuals and 160 tons, or 30% of the population and biomass of the spawning (commercial) stock.Annual natural losses of sturgeon population are 985.5 thousand individuals, biomass - 951.2 tons (Table 4).The coefficients of the natural mortality of Russian sturgeon, calculated on the basis of the growth equations, are changed during the life span according to the U-shaped curve, the minimum of which accounts for the age of puberty and the maximum values at the beginning and the end of the life cycle, which corresponds to modern theoretical concepts of the age variability of these coefficients in the life span (Gulin, 1971; Tyurin, 1972; Maksimenko and Antonov, 2002). The minimum value of the coefficient of natural mortality of Russian sturgeon, which is vmp = 0.125 or 12.5%, accounts for the age of 50% of puberty of generations, tp = 10.7 year (Table 2). The displacement of the biomass maximum towards younger ages in our calculations is connected with the influence of the fishery. (30) - (35) correlation shows that the values of natural mortality depend on the sizes of lp, on the puberty age tp, relative speed of linear k and weight gain C, and the size of yearlings q. At the same time, the size of yearlings q and the relative growth rate of fish, expressed by the values of the constants k and C, are in inverse relation (Zykov, 2005). Our research showed that the natural mortality of fish during the subsequent period of existence mostly depends on the starting sizes of individuals of the generations reached in the first year of life. Studies have shown that at an intraspecific level, a higher survival rate of yearlings and in the subsequent period of existence is observed in generations characterized by larger sizes of yearlings. More viable, higher in its population and biomass generations are formed from these juveniles, which must be taken into account while developing and proving the dimensional standards of young fish grown

Croatian Journal of Fisheries, 2019, 77, 63-76L.A. Zykov et al. (2019): Theoretical estimate of energy balance of A.gueldenstaedtii
© 2019 Author(s). This is an open access article licensed under the Creative Commons Attribution-NonCommercial-NoDerivs License (http://creativecommons.org/licenses/by-nc-nd/3.0/)
71
Table 4. Absolute age structure, population, biomass, annual natural and fishery losses of the relative sturgeon population with annual recruit-stock R0.5 = 1.0 million specimens of juveniles, the coefficient of fishery mortality of the spawning (fishery) herd νfnt = 0.3 or 30% and the periodicity of spawning once in 3 years (τ = 3)
Aget, years
Length,l, cm
Weight,Wt, kg *νmtt
Relative population biomass Spawning herd Catching Natural mortality
Thousands of specimens Ton Thousands of
specimens Ton Thousands of specimens Ton Thousands of
specimens Ton
0.14 13.1 0.017 0.606 1000.0 16.67 0.00 0.00 0.00 0.00 606.0 108.1
1.14 35.8 0.340 0.434 394.0 134.0 0.00 0.00 0.00 0.00 170.9 101.0
2.14 48.4 0.841 0.335 223.1 187.7 0.00 0.00 0.00 0.00 74.76 86.02
3.14 58.2 1.460 0.269 148.4 216.6 0.00 0.00 0.00 0.00 39.85 72.38
4.14 66.5 2.173 0.221 108.5 235.8 0.00 0.00 0.00 0.00 24.02 61.70
5.14 73.7 2.965 0.187 84.50 250.6 0.00 0.00 0.00 0.00 15.81 53.70
6.14 80.3 3.829 0.162 68.69 263.0 0.00 0.00 0.00 0.00 11.15 47.89
7.14 86.3 4.757 0.145 57.54 273.7 1.92 9.12 0.58 2.74 8.351 43.84
8.14 91.9 5.744 0.134 48.61 279.2 4.05 23.3 1.22 6.98 6.506 40.76
9.14 97.1 6.785 0.127 40.89 277.4 4.77 32.4 1.43 9.71 5.212 38.21
10.14 102.1 7.877 0.125 34.24 269.8 5.14 40.5 1.54 12.1 4.288 36.23
11.14 106.8 9.018 0.127 28.41 256.2 5.21 47.0 1.56 14.1 3.595 34.56
12.14 111.3 10.20 0.131 23.26 237.3 5.43 55.4 1.63 16.6 3.045 32.94
13.14 115.6 11.43 0.138 18.58 212.5 4.96 56.7 1.49 17.0 2.565 30.96
14.14 119.7 12.71 0.147 14.53 184.7 4.36 55.4 1.31 16.6 2.143 28.64
15.14 123.7 14.02 0.159 11.08 155.3 3.69 51.8 1.11 15.5 1.763 25.91
16.14 127.6 15.37 0.173 8.210 126.2 2.74 42.1 0.82 12.6 1.418 22.77
17.14 131.3 16.76 0.188 5.971 100.1 1.99 33.4 0.60 10.0 1.123 19.61
18.14 134.9 18.18 0.205 4.251 77.28 1.42 25.8 0.43 7.73 0.871 16.48
19.14 138.4 19.64 0.223 2.955 58.02 0.98 19.3 0.30 5.80 0.660 13.45
20.14 141.9 21.13 0.243 1.999 42.24 0.67 14.1 0.20 4.22 0.486 10.64
21.14 145.2 22.66 0.264 1.313 29.75 0.44 9.92 0.13 2.98 0.347 8.128
22.14 148.5 24.21 0.286 0.835 20.22 0.28 6.74 0.08 2.02 0.239 5.978
23.14 151.6 25.80 0.310 0.513 13.22 0.17 4.41 0.05 1.32 0.159 4.221
24.14 154.7 27.42 0.334 0.303 8.298 0.10 2.77 0.03 0.83 0.101 2.853
25.14 157.8 29.07 0.359 0.171 4.981 0.06 1.66 0.02 0.50 0.062 1.839
26.14 160.8 30.74 0.385 0.093 2.850 0.03 0.95 0.01 0.29 0.036 1.128
27.14 163.7 32.45 0.412 0.048 1.549 0.02 0.52 0.00 0.15 0.020 0.655
28.14 166.5 34.18 0.440 0.023 0.796 0.01 0.27 0.00 0.08 0.010 0.359
29.14 169.4 35.94 0.468 0.011 0.386 0.00 0.13 0.00 0.04 0.005 0.185
30.14 172.1 37.73 0.497 0.005 0.175 0.00 0.06 0.00 0.02 0.002 0.089
31.14 174.8 39.54 0.527 0.002 0.074 0.00 0.02 0.00 0.01 0.001 0.040
32.14 177.5 41.38 0.558 0.001 0.029 0.00 0.01 0.00 0.00 0.000 0.016
33.14 180.1 43.24 0.589 0.000 0.010 0.00 0.00 0.00 0.00 0.000 0.006
34.14 182.7 45.13 0.620 0.000 0.003 0.00 0.00 0.00 0.00 0.000 0.002

Croatian Journal of Fisheries, 2019, 77, 63-76L.A. Zykov et al. (2019): Theoretical estimate of energy balance of A.gueldenstaedtii
© 2019 Author(s). This is an open access article licensed under the Creative Commons Attribution-NonCommercial-NoDerivs License (http://creativecommons.org/licenses/by-nc-nd/3.0/)
72
Aget, years
Length,l, cm
Weight,Wt, kg *νmtt
Relative population biomass Spawning herd Catching Natural mortality
Thousands of specimens Ton Thousands of
specimens Ton Thousands of specimens Ton Thousands of
specimens Ton
0.14 13.1 0.017 0.606 1000.0 16.67 0.00 0.00 0.00 0.00 606.0 108.1
1.14 35.8 0.340 0.434 394.0 134.0 0.00 0.00 0.00 0.00 170.9 101.0
2.14 48.4 0.841 0.335 223.1 187.7 0.00 0.00 0.00 0.00 74.76 86.02
3.14 58.2 1.460 0.269 148.4 216.6 0.00 0.00 0.00 0.00 39.85 72.38
4.14 66.5 2.173 0.221 108.5 235.8 0.00 0.00 0.00 0.00 24.02 61.70
5.14 73.7 2.965 0.187 84.50 250.6 0.00 0.00 0.00 0.00 15.81 53.70
6.14 80.3 3.829 0.162 68.69 263.0 0.00 0.00 0.00 0.00 11.15 47.89
7.14 86.3 4.757 0.145 57.54 273.7 1.92 9.12 0.58 2.74 8.351 43.84
8.14 91.9 5.744 0.134 48.61 279.2 4.05 23.3 1.22 6.98 6.506 40.76
9.14 97.1 6.785 0.127 40.89 277.4 4.77 32.4 1.43 9.71 5.212 38.21
10.14 102.1 7.877 0.125 34.24 269.8 5.14 40.5 1.54 12.1 4.288 36.23
11.14 106.8 9.018 0.127 28.41 256.2 5.21 47.0 1.56 14.1 3.595 34.56
12.14 111.3 10.20 0.131 23.26 237.3 5.43 55.4 1.63 16.6 3.045 32.94
13.14 115.6 11.43 0.138 18.58 212.5 4.96 56.7 1.49 17.0 2.565 30.96
14.14 119.7 12.71 0.147 14.53 184.7 4.36 55.4 1.31 16.6 2.143 28.64
15.14 123.7 14.02 0.159 11.08 155.3 3.69 51.8 1.11 15.5 1.763 25.91
16.14 127.6 15.37 0.173 8.210 126.2 2.74 42.1 0.82 12.6 1.418 22.77
17.14 131.3 16.76 0.188 5.971 100.1 1.99 33.4 0.60 10.0 1.123 19.61
18.14 134.9 18.18 0.205 4.251 77.28 1.42 25.8 0.43 7.73 0.871 16.48
19.14 138.4 19.64 0.223 2.955 58.02 0.98 19.3 0.30 5.80 0.660 13.45
20.14 141.9 21.13 0.243 1.999 42.24 0.67 14.1 0.20 4.22 0.486 10.64
21.14 145.2 22.66 0.264 1.313 29.75 0.44 9.92 0.13 2.98 0.347 8.128
22.14 148.5 24.21 0.286 0.835 20.22 0.28 6.74 0.08 2.02 0.239 5.978
23.14 151.6 25.80 0.310 0.513 13.22 0.17 4.41 0.05 1.32 0.159 4.221
24.14 154.7 27.42 0.334 0.303 8.298 0.10 2.77 0.03 0.83 0.101 2.853
25.14 157.8 29.07 0.359 0.171 4.981 0.06 1.66 0.02 0.50 0.062 1.839
26.14 160.8 30.74 0.385 0.093 2.850 0.03 0.95 0.01 0.29 0.036 1.128
27.14 163.7 32.45 0.412 0.048 1.549 0.02 0.52 0.00 0.15 0.020 0.655
28.14 166.5 34.18 0.440 0.023 0.796 0.01 0.27 0.00 0.08 0.010 0.359
29.14 169.4 35.94 0.468 0.011 0.386 0.00 0.13 0.00 0.04 0.005 0.185
30.14 172.1 37.73 0.497 0.005 0.175 0.00 0.06 0.00 0.02 0.002 0.089
31.14 174.8 39.54 0.527 0.002 0.074 0.00 0.02 0.00 0.01 0.001 0.040
32.14 177.5 41.38 0.558 0.001 0.029 0.00 0.01 0.00 0.00 0.000 0.016
33.14 180.1 43.24 0.589 0.000 0.010 0.00 0.00 0.00 0.00 0.000 0.00634.14 182.7 45.13 0.620 0.000 0.003 0.00 0.00 0.00 0.00 0.000 0.00235.14 185.3 47.04 0.652 0.000 0.001 0.00 0.00 0.00 0.00 0.000 0.00136.14 187.8 48.98 0.685 0.000 0.000 0.00 0.00 0.00 0.00 0.000 0.000Total - - - 2331.1 3936.6 48.42 533.5 14.5 160.0 985.5 951.2
*Coefficient of fishery mortality of the spawning population

Croatian Journal of Fisheries, 2019, 77, 63-76L.A. Zykov et al. (2019): Theoretical estimate of energy balance of A.gueldenstaedtii
© 2019 Author(s). This is an open access article licensed under the Creative Commons Attribution-NonCommercial-NoDerivs License (http://creativecommons.org/licenses/by-nc-nd/3.0/)
73
in hatcheries and predicting the yield of the emerging generations.The annual total decrease of the abundant population of Russian sturgeon (catching and natural mortality) is 1.0 million specimens or 42.9% of the total population, the loss of biomass is 1111.2 tons or 28.2% of the total biomass of the population. In this case, the total annual loss of the population, which is 1.0 million individuals, corresponds to the annual recruit-stock - R0.5 = 1.0 million specimens of juveniles.The quantity of generations of sturgeon decrease with age and their biomass changes according to a single-vertex parabolic curve with a maximum occurring during puberty (Table 4), which corresponds to the general shape of the biomass curve of generations.The natural annual losses of abundance (985.5 thousand specimens) and biomass (951.2 tons) of the sturgeon population significantly exceed the annual catch (14.3 thousands pieces and 160 tons).Group (age and population) rations of Russian sturgeon were calculated by simple multiplying the number of individual age groups in the population (Table 4) by their individual annual rations (Table 3).The analysis of the received results shows that under the accepted modes of fishery exploitation of the spawning
herd, the conditional population of Russian sturgeon, formed from 1.0 million specimens of juveniles and having a biomass of 3936.6 tons, consumes 14309.2 tons of feed during the year, which is 3.6 times higher than its own biomass. The greatest amount of energy received from food, that is 70.3%, is spent on energy process. A significantly lower amount of energy from consumed food (7.7%) is spent on plastic process - an increase in the biomass of the population. The lowest share of energy (2.0%) is spent on generative metabolism - maturation and weight gain of gonads. For the total annual loss of abundance - total (commercial and natural) mortality, the population spends 31.2% of energy from consumed food, including natural mortality - 27.9%, and catch - 3.3% (Table 5).The largest amount of energy from consumed food is spent by individuals of younger ages, with the exception of group energy expenditure on energy process (Table 5). As the age increases, the overall level of group consumption of food and energy balance decreases. An exception is the group generative process, the magnitude of which varies according to a single-vertex parabolic curve corresponding to the shape of the biomass curve of the population (Table 4, 5).
Table 5. Structure of the annual food ration of Russian sturgeon according to the individual components and mortality categories
Age, (Years) t+0,5
Biomass,kg
Energy,Re
Plastic,Pw
Reproductive, Pq
General,Сt
Natural mortality Catching General
mortality0.62 16.67 571.3 225.4 8.704 1006.8 875.2 0.000 875.2
1.62 134.0 667.0 154.6 12.76 1043.0 577.7 0.000 577.7
2.62 187.7 689.0 114.9 14.96 1023.6 412.0 0.000 412.0
3.62 216.6 689.6 91.54 16.33 996.8 309.3 0.000 309.3
4.62 235.8 686.2 76.51 17.35 975.0 242.6 0.000 242.6
5.62 250.6 682.9 66.15 18.21 959.1 197.9 0.000 197.9
6.62 263.0 680.2 58.56 18.97 947.1 167.4 0.000 167.4
7.62 273.7 673.3 52.36 19.51 931.4 146.6 10.10 156.7
8.62 279.2 654.9 46.60 19.62 901.5 131.1 24.48 155.6
9.62 277.4 624.5 41.04 19.28 856.0 118.8 32.61 151.4
10.62 269.8 584.2 35.74 18.53 798.1 109.2 39.26 148.5
11.62 256.2 534.9 30.65 17.38 728.6 101.4 44.07 145.5
12.62 237.3 476.7 25.73 15.84 647.9 94.29 50.41 144.7
13.62 212.5 412.3 21.06 13.99 559.2 86.61 50.20 136.8
14.62 184.7 346.2 16.80 11.98 468.8 78.46 47.88 126.3
15.62 155.3 281.6 13.03 9.921 380.7 69.60 43.74 113.3
16.62 126.2 222.5 9.838 7.972 300.4 60.07 34.78 94.85
17.62 100.1 171.7 7.275 6.250 231.5 50.85 27.04 77.90
18.62 77.28 129.0 5.254 4.769 173.8 42.04 20.51 62.55
19.62 58.02 94.28 3.696 3.534 126.9 33.81 15.14 48.94
Croatian Journal of Fisheries, 2019, 77, 63-76L.A. Zykov et al. (2019): Theoretical estimate of energy balance of A.gueldenstaedtii
© 2019 Author(s). This is an open access article licensed under the Creative Commons Attribution-NonCommercial-NoDerivs License (http://creativecommons.org/licenses/by-nc-nd/3.0/)
74
Age, (Years) t+0,5
Biomass,kg
Energy,Re
Plastic,Pw
Reproductive, Pq
General,Сt
Natural mortality Catching General
mortality20.62 42.24 66.79 2.526 2.538 89.82 26.36 10.84 37.20
21.62 29.75 45.77 1.672 1.762 61.51 19.86 7.520 27.38
22.62 20.22 30.26 1.070 1.179 40.64 14.42 5.037 19.46
23.62 13.22 19.25 0.660 0.759 25.84 10.06 3.249 13.30
24.62 8.298 11.75 0.391 0.469 15.76 6.716 2.012 8.728
25.62 4.981 6.855 0.221 0.276 9.191 4.282 1.193 5.475
26.62 2.850 3.812 0.120 0.155 5.109 2.597 0.674 3.272
27.62 1.549 2.013 0.062 0.083 2.697 1.493 0.362 1.855
28.62 0.796 1.005 0.030 0.042 1.346 0.810 0.184 0.995
29.62 0.386 0.472 0.014 0.020 0.632 0.413 0.088 0.501
30.62 0.175 0.208 0.006 0.009 0.278 0.197 0.040 0.237
31.62 0.074 0.085 0.002 0.004 0.114 0.087 0.017 0.104
32.62 0.029 0.032 0.001 0.001 0.043 0.036 0.006 0.042
33.62 0.010 0.011 0.000 0.000 0.015 0.013 0.002 0.016
34.62 0.003 0.004 0.000 0.000 0.005 0.005 0.001 0.005
35.62 0.001 0.001 0.000 0.000 0.001 0.001 0.000 0.002
36.62 0.000 0.000 0.000 0.000 0.000 0.000 0.000 0.000
Total 3936.6 10060.6 1103.6 283.2 14309.2 3992.3 471.5 4463.8
% - 70.3 7.7 2.0 - 27.9 3.3 31.2
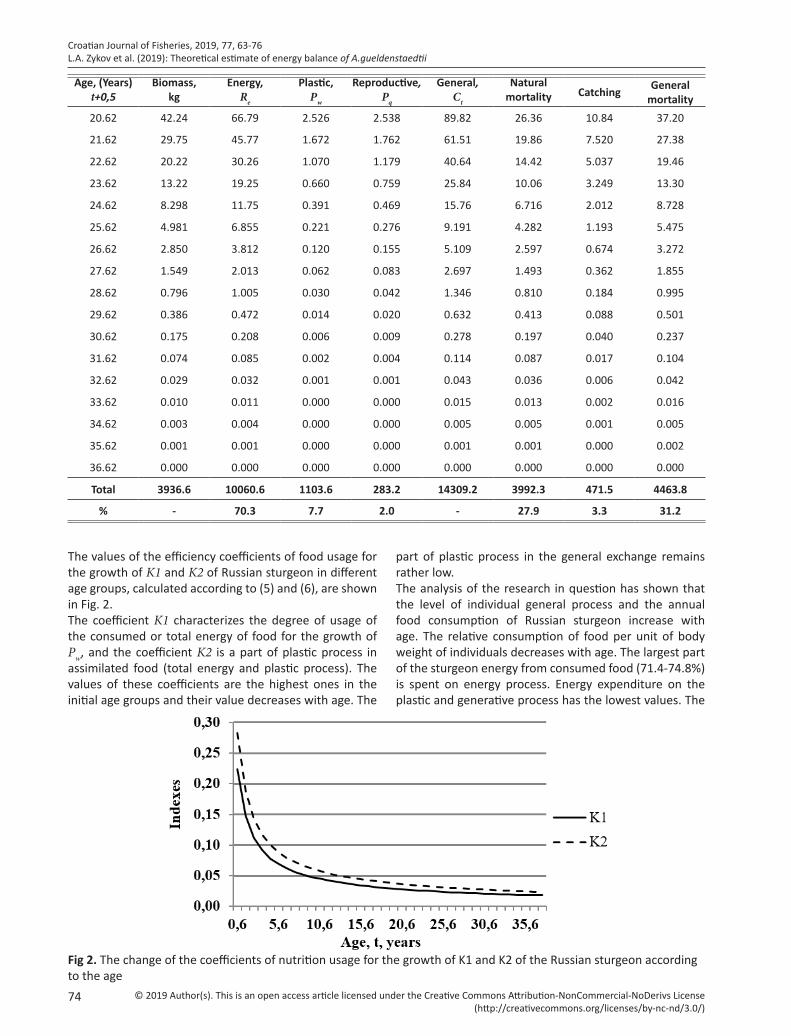
The values of the efficiency coefficients of food usage for the growth of K1 and K2 of Russian sturgeon in different age groups, calculated according to (5) and (6), are shown in Fig. 2.The coefficient K1 characterizes the degree of usage of the consumed or total energy of food for the growth of Pw, and the coefficient K2 is a part of plastic process in assimilated food (total energy and plastic process). The values of these coefficients are the highest ones in the initial age groups and their value decreases with age. The
Fig 2. The change of the coefficients of nutrition usage for the growth of K1 and K2 of the Russian sturgeon according to the age
part of plastic process in the general exchange remains rather low.The analysis of the research in question has shown that the level of individual general process and the annual food consumption of Russian sturgeon increase with age. The relative consumption of food per unit of body weight of individuals decreases with age. The largest part of the sturgeon energy from consumed food (71.4-74.8%) is spent on energy process. Energy expenditure on the plastic and generative process has the lowest values. The

Croatian Journal of Fisheries, 2019, 77, 63-76L.A. Zykov et al. (2019): Theoretical estimate of energy balance of A.gueldenstaedtii
© 2019 Author(s). This is an open access article licensed under the Creative Commons Attribution-NonCommercial-NoDerivs License (http://creativecommons.org/licenses/by-nc-nd/3.0/)
75
largest part of the energy from consumed food is spent by individuals of younger ages. The group consumption of food by individuals of older age groups is reduced with age. The population of Russian sturgeon expends 31.2% of the consumed food for the annual total (fishery and natural) mortality, including for catching (3.3%) and natural losses (27.9%).It should be noted that the initial biological parameters used in the calculations (size of yearlings, relative growth rate of fish, length and rates of puberty, etc.) have a certain effect on the natural mortality of generations at different ages (Zykov, 2005). Due to the low abundance of sturgeon in the Caspian Sea, as a result of the depletion of their stocks in consequence of regional poaching (Zykova et al., 2013), in recent years it has not been possible to collect the necessary ichthyological data on the initial biological parameters of Russian sturgeon. Therefore, the results obtained in the study are preliminary to a certain extent, they are not final and can be refined after obtaining relevant up-to-date data on the initial biological parameters used in the calculations.Results of the presented study give reason to suggest that the fishery should be based on the catch of adult (mature) portion of the population because the efficiency of food consumption growth is reduced with age.The sequential accumulation of such data will make it possible to develop a unified trophic model that allows solving the problem of creating high-value cultural ichthyocenoses by means of the directed formation of the ichthyofauna of inland waters, taking into account their feed productivity, nutritional selectivity and the annual nutritional needs of cultivated fish species.Further study of the energy balance and nutritional needs of inland water fish will allow approaching the question of the stocks restoration and conservation of valuable commercial fish in accordance with their nutritional needs and products of the feed base present in the reservoir.
SAŽETAK
TEORIJSKA PROCJENA ENERGETSKE BILANCE I PREHRAMBENIH POTREBA POPULACIJE RUSKE JESETRE Acipenser gueldenstaedtii U KASPIJS-KOM MORU
Pojedinačni i grupni godišnji obroci ruske jesetre Acipenser gueldenstaedtii izračunati su na temelju modela koji opisuju energetsku bilancu i dinamiku broja generacija riba s prirodnom smrtnošću ovisno o dobi. Proučavana je struktura energetske bilance i njezine odvojene komponente. Ukazano je kako se najveća količina energije koju konzumira populacija jesetre troši na energetski proces. Pojedinačni obroci ruske jesetre povećavaju se s dobi, dok se grupni obroci smanjuju. Dobiveni rezultati mogu se koristiti za teorijsku procjenu volumena umjetne
i prirodne reprodukcije koja osigurava stvaranje zaliha ruske jesetre u skladu s prostornom produktivnošću Kaspijskog mora.
Ključne riječi: Jesetra, populacija, obrok, biomasa, smrtnost, Acipenser gueldenstaedtii
REFERENCES
Alimov, A. F., Bogatov V. V., Golubkov, S. M. (2014): Production Hydrobiology. Nauka, Saint-Petersburg, 345.
Baranov, F. I. (1925): Fishery and the age limit of fish. Fishery bulletin,7-11.
Baydin, S. S., Kosyrev, A. I. (1986): The Caspian Sea. Hydrology and hydrochemistry. Moscow.
Beverton, R. J. H., Holt, S.J. (1957): On the dynamics of exploited fish populations. Springer, Dordrech, London.
Chugunov, N. L., Chugunova, N. I. (1964): Comparative fishery and biological characteristics of the Azov Sea sturgeon. Moscow.
Derzhavin, A. N. (1947): Reproduction of sturgeon stocks. Baku. 78.
Dryagin, P.A. (1948): About the determination of potential growth and potential fish sizes. Izvestia, 56-64.
Dutil, J. D. ,Brander, K. (2003): Comparing productivity of North Atlantic cod (Gadus morhua) stocks and limits to growth production. Fisheries Oceanography, 12, 502-512.
Gulin, V. V. (1971): Theoretical justification and practical development of estimating methods of general, commercial and natural mortality of fish. GosNIORH, Izvestia, 239-251.
Ireland, S. C., Beamesderfer, R. C. P., Paragamian, V. L., Wakkinen, V. D. and Siple, J. T. (2002): Success of hatchery-reared juvenile white sturgeon (Acipenser transmontanus) following release in the Kootenai River, Idaho, USA. Journal of Applied Ichthyology, 18: 642–650.
Kazancheev, E. N. (1981): The Caspian sea fish (in Russian). Moscow.
Keszka, S., Heese T. (2003): Occurrence of exotic Russian sturgeons, Acipenser gueldenstaedtii Brandt et Ratzeburg, 1833 (Actinopterygii: Acpenseridae) in the Baltic Sea, Acta Ichthyol. Piscat. 3, 173-178.
Kolman, R., Zarkua, Z. (2002): Environmental conditions of common sturgeon (Acipenser sturio L.) spawning in river Rioni (Georgia). Electronic Journal of Polish Agricultural Universities, 5, 2.
Korobochkina, L. S. (1970): The duration of riverine life in young sturgeons. In: Sturgeons of USSR and their reproduction (in Russian). Proceed of Central Research Institute of Sturgeon Fish Industry, 2, 69–73.
Kottelat, M., Freyhof, J. (2007): Handbook of European freshwater fishes. Publications Kottelat, Cornol and Freyhof, Berlin. 646.

Croatian Journal of Fisheries, 2019, 77, 63-76L.A. Zykov et al. (2019): Theoretical estimate of energy balance of A.gueldenstaedtii
© 2019 Author(s). This is an open access article licensed under the Creative Commons Attribution-NonCommercial-NoDerivs License (http://creativecommons.org/licenses/by-nc-nd/3.0/)
76
MacKenzie, B. R., Koster, F. W. (2004): Fish production and climate: sprat in the Baltic Sea. Ecology, 85, 784–794.
Maksimenko, V. P., Antonov, N. P. (2002): Natural mortality assessment of marine commercial fish populations of the Kamchatka shelf. Fishery issues, 450-463.
Melnychuk, G. L. (1986): Methodical recommendations on the application of modern methods to the study of fish nutrition and the calculation of fish products by the forage base in natural reservoirs (In Russian). GosNIORH Publishing House, Leningrad, 38.
Mina, M. V., Klevezal, G. A. (1976): Growth of animals, analysis on the level of organism. M. Nauka, (In Russian), Moscow.
Nathanailides, C., Tsoumani, M., Papazogloy, A. and Paschos, I. (2002): Hatching time and post-hatch growth in Russian sturgeon Acipenser gueldenstaedtii. Journal of Applied Ichthyology, 18, 651-654.
Pavlov, A. V., Elizarov, G. A. (1970): About the repeated maturation of the Volga sturgeon. (in Russian). Vopr. Ikhtiol., 9, 3, 56.
Piskunov, I. A. (1970): Materials on the biology of sturgeon and stellate sturgeon in the marine period of life. TsNIORH. (in Russian).
Ricker, W.E. (1975): Computation and interpretation of the biological statistics of fish populations. Bulletin of the Fisheries Research Board of Canada, 400.
Skora, M. E., Arciszewski B. (2013): New reports on the Russian sturgeon, Acipenser gueldenstaedtii, in the Polish Baltic Sea, Arch. Pol. Fish. 21, 363-366.
Sokolov, L. I., Berdicheskii, L. S. (1989): Acipenseridae. pp. 150-153. In J. Holcík (ed.) The freshwater fishes of Europe. Vol. 1, Part II. General introduction to fishes Acipenseriformes. AULA-Verlag Wiesbaden.
Tsepkin, E. A., Sokolov, L. I. (1971): About the maximum sizes and age of some sturgeons. Problems of Ichthyology, V, 613, 216-220.
Tyurin, P.V. (1972): “Normal" curves of the experience and rate of natural mortality of fish as the basis of regulation of fisheries. GosNIORH. 7, 1, 71-127 (in Russian).
Winberg, G. G. (1956): Rate of Metabolism and food Requirements of Fishes. Belorussian State University, Minsk. (Translated from Russian) Fish. Res. Bd Can. Transl. Ser. No. 194.
Winberg, G. G. (1979): Common ground for the study of aquatic ecosystems. Izdat. Nauka, Leningrad, 100-106 (in Russian).
Zasosov, A.V. (1976): Population dynamics of commercial fish. Pisch. Prom-st., Moscow, 342 (in Russian).
Zykov, L. A. (2011): Evaluation of the commercial return of the Caspian sturgeon Huso huso L. from juveniles of artificial reproduction. Problems of fisheries, 12, 2 (46), 349 -363.
Zykov, L. A., Zykova, G. F., Abramenko, M. I. (2013): Evaluation of the harvest return of the Russian sturgeon Acipenser gueldenstaedtii from fry of artificial reproduction. Problems of Fisheries, 14, 3, 55, 460-477.
Zykov, L. A. (2005): The biological and fishery aspects of the theory of natural mortality of fish. PhD Thesis, Astrakhan, (In Russian).
Zykova, G. F., Zykov, L. A., Klimov, F. V. (2013): Assessment of the harvest return of Caspian sturgeon Acipenser stellatus from fry of artificial reproduction. Problems of fisheries, 14, 2(54), 303-320.