therapeutics identification of expression signatures...
TRANSCRIPT
Published Online First on February 23, 2010 as 10.1158/1535-7163.MCT-09-0651Published OnlineFirst February 23, 2010; DOI: 10.1158/1535-7163.MCT-09-0651
Research Article Molecular
CancerTherapeutics
Identification of Expression Signatures Predictive ofSensitivity to the Bcl-2 Family Member InhibitorABT-263 in Small Cell Lung Carcinoma andLeukemia/Lymphoma Cell Lines
Stephen K. Tahir, John Wass, Mary K. Joseph, Viswanath Devanarayan, Paul Hessler, Haichao Zhang,Steve W. Elmore, Paul E. Kroeger, Christin Tse, Saul H. Rosenberg, and Mark G. Anderson
Abstract
Authors' AAbbott Lab
Note: SupCancer The
CorresponResearch, GAbbott ParFax: 847-9
doi: 10.115
©2010 Am
www.aacr
Dow
ABT-263 inhibits the antiapoptotic proteins Bcl-2, Bcl-xL, and Bcl-w and has single-agent efficacy in numer-ous small cell lung carcinoma (SCLC) and leukemia/lymphoma cell lines in vitro and in vivo. It is currently inclinical trials for treating patients with SCLC and various leukemia/lymphomas. Identification of predictivemarkers for response will benefit the clinical development of ABT-263. We identified the expression of Bcl-2family genes that correlated best with sensitivity to ABT-263 in a panel of 36 SCLC and 31 leukemia/lymphoma cell lines. In cells sensitive to ABT-263, expression of Bcl-2 and Noxa is elevated, whereas expres-sion of Mcl-1 is higher in resistant cells. We also examined global expression differences to identify gene sig-nature sets that correlated with sensitivity to ABT-263 to generate optimal signature sets predictive ofsensitivity to ABT-263. Independent cell lines were used to verify the predictive power of the gene setsand to refine the optimal gene signatures. When comparing normal lung tissue and SCLC primary tumors,the expression pattern of these genes in the tumor tissue is most similar to sensitive SCLC lines, whereasnormal tissue is most similar to resistant SCLC lines. Most of the genes identified using global expressionpatterns are related to the apoptotic pathway; however, all but Bcl-rambo are distinct from the Bcl-2 family.This study leverages global expression data to identify key gene expression patterns for sensitivity to ABT-263in SCLC and leukemia/lymphoma and may provide guidance in the selection of patients in future clinicaltrials. Mol Cancer Ther; 9(3); 545–57. ©2010 AACR.
Introduction
Bcl-2 overexpression has been reported in 55% to 90%of small cell lung carcinoma (SCLC) patients as well asother cancer types (1). Enhanced Bcl-2 expression in thesetumors not only permits cell growth and survival in thepresence of cellular apoptotic signals associated with thetransformed phenotype, but increased Bcl-2 can also leadto failure of chemotherapeutic strategies (2–10). Bcl-2 isthe founding member of a family of proteins that containone or more Bcl-2 homology (BH) domains (11). The anti-apoptotic family members (Bcl-xL, Bcl-2, Bcl-w, A1, Mcl-1)have four BH domains and block the proapoptotic familymembers (Bax and Bak, which have 3 BH domains) from
ffiliation: Global Pharmaceutical Product Research Division,oratories, Abbott Park, Illinois
plementary data for this article are available at Molecularrapeutics Online (http://mct.aacrjournals.org/).
ding Author: Mark G. Anderson, Abbott Laboratories, Cancerlobal Pharmaceutical Product Research Division, AP9-2, 100
k Road, Abbott Park, IL 60064-6099. Phone: 847-937-8926;37-2625. E-mail: [email protected]
8/1535-7163.MCT-09-0651
erican Association for Cancer Research.
journals.org
on June 6, 2018. ©mct.aacrjournals.org nloaded from
mediating cytochrome c release from the mitochondriaand subsequent activation of apoptosis through caspasecleavage via the intrinsic apoptotic pathway (12). Addi-tional proapoptotic members contain only one BH do-main (Bad, Bid, Bim, Hrk, Bmf, Noxa, and Puma), andthey are referred to collectively as BH3-only proteins.The BH3-only proapoptotic proteins act as molecular sen-sors of cellular stress or damage. Bcl-2 family membersfunction through interactions with each other, and thebalance between the antiapoptotic (Bcl-2, Bcl-xL, Bcl-w,Mcl-1, and A1) and the proapoptotic (BH3-only) membersis critical for preventing or initiating apoptosis (13, 14).Recently, we described the activity of ABT-263, a
potent Bcl-2 family member inhibitor that is orally bio-available (15). ABT-263 binds with high affinity (Ki ≤ 1nmol/L) to Bcl-2, Bcl-xL, and Bcl-w, but not to Mcl-1and A1 (Ki = 0.35 and 0.55 μmol/L, respectively),which is similar to a related Bcl-2 family member in-hibitor ABT-737 (Ki ≤ 1 nmol/L for Bcl-2, Bcl-xL andBcl-w; Ki > 1 μmol/L for Mcl-1 and A1; ref. 15). In pre-clinical models ABT-263 exhibits single-agent activityagainst a variety of SCLC and leukemia cell lines andprimary patient-derived cells in vitro and induces com-plete, maintained tumor regressions in SCLC animal tu-mor models (15–17). Phase 1/2b clinical trials with
545
2010 American Association for Cancer Research.
Tahir et al.
546
Published OnlineFirst February 23, 2010; DOI: 10.1158/1535-7163.MCT-09-0651
ABT-263 are ongoing in patients with SCLC and lym-phoid malignancies.The identification of predictive markers of response to
chemotherapy can greatly facilitate the development of anew compound by identifying patients that are sensitiveto a given therapy. One approach is to look at individualgenes, especially those that are targeted by a given che-motherapeutic to better assess the probability a patientwill respond to therapy (18–21). Another approach is touse gene expression profiles, such as those derived by mi-croarray analysis, to generate molecular signature setsthat can also be used for patient selection during clinicaltrials and beyond (22–24).To support the clinical development of ABT-263, we
undertook a study to identify expression markers thatare predictive of sensitivity to ABT-263 using a panel ofSCLC and leukemia and lymphoma cell lines. In our in-vestigation, we determined which Bcl-2 family memberscorrelated best with sensitivity to ABT-263 in each of thecell line panels. Next, we investigated the relationship be-tween the global expression pattern and sensitivity toABT-263 to identify optimal predictive expression signa-tures using different statistical approaches. We validatedthe predictive power of these signatures using indepen-dent cell line sets. Finally, we compared the expressionpattern of the signature genes in cell lines to the expres-sion pattern in primary SCLC patient tumor samples andnormal surrounding tissue.Our results reveal that high Bcl-2 and low Mcl-1 ex-
pression levels correlated with sensitivity to ABT-263 inthe SCLC and leukemia/lymphoma cell panels used forthis study. Furthermore, we have identified, by differentstatistical approaches, optimal signature sets that are pre-dictive of sensitivity to ABT-263 which were derivedfrom either the global expression pattern or just usingthe Bcl-2 family members. Optimal signature sets fromthe global expression pattern included a number ofapoptosis-related genes.
Materials and Methods
Cell Culture and Viability AssaysThe SCLC and leukemia/lymphoma cell lines (Ameri-
can Type Culture Collection, Deutsche Sammlung vonMikroorganismen und Zellkulturen, or generous giftfrom Dr. Louis Staudt, National Cancer Institute) werecultured as previously described (15, 20). Cells were trea-ted at 10,000 or 50,000 per well for adherent or suspen-sion cells, respectively, in 96-well microtiter plates in thepresence of 10% human serum for 48 h with or withoutABT-263 in a humidified chamber with 5% CO2. ABT-263was synthesized as previously described (15, 25), and cellcytotoxicity EC50 values were assessed using CellTiterGlo (Promega).
RNA Isolation and MicroarraysRNA from eight SCLC tumor samples (lot numbers
A805144, A701047, A701062, A701046, A805145,
Mol Cancer Ther; 9(3) March 2010
on June 6, 2018. ©mct.aacrjournals.org Downloaded from
A701061, A610276, and A609162) and six matched nor-mal adjacent tissue (lot numbers A701047, A701062,A701046, A805145, A701061, and A610276) were pur-chased from Biochain. Naive cell line samples were lysed,and total RNA was isolated using TRIzol reagent (Invi-trogen) and purified on RNeasy columns (Qiagen). To in-crease statistical power, replicates (between 2 and 4) ofeach cell line were grown in parallel and analyzed sepa-rately. Labeled cRNA was prepared according to the mi-croarray manufacturer's protocol and hybridized tohuman U133A 2.0 arrays (Affymetrix). The microarraydata files were loaded into Rosetta Resolver (Rosetta Bio-software) software for analysis, and the intensity valuesfor all probe sets were normalized using Resolver's Ex-perimental Definition tool.
Western Blot AnalysisTotal cell lysates (40 μg) were run on 4% to 12% bis-
Tris gels and transferred to polyvinylidene difluoridemembranes using the iBlot dry blotting system (Invi-trogen) according to the manufacturer's instructions.Blots were stained with the following primary anti-body: Bcl-2 and Bcl-xL (R&D Systems); Mcl-1, Bad,and Bax (BD Biosciences); Bak (Epitomics); Noxa (Im-genex); caspase-9 (Cell Signaling Technology); andactin (Abcam), diluted in Odyssey Blocking Buffer(LI-COR Biosciences) with 0.1% Tween 20 overnightat 4°C, except for actin, which was stained for 30 minat room temperature. Blots were stained with theappropriate secondary antibodies (goat anti-mouse oranti-rabbit conjugated to Alexa 680 IgG; Invitrogen)that were diluted 1:500 in Odyssey Blocking Bufferfor 30 min at room temperature. Blots were scanned us-ing an Odyssey imager.
Statistical AnalysisTo divide the training set cell lines into sensitive and
resistant categories, a bivariate fit curve was generatedfor the ABT-263 EC50 versus rank and fitted with asmoothing spline (λ = 1), and the maximum increasein the slope was at ∼5 μmol/L for both sets, which isapproximately the same as the maximum concentrationin vivo. This segregated the SCLC lines into 26 sensitiveand 10 resistant lines, and the leukemia/lymphoma celllines into 25 sensitive and 6 resistant cell lines. To com-pare the expression of the small subset of genes relatedto the target (Bcl-2 family members), a P-value filter of0.05 was used, with the expression data from all celllines. To identify global expression markers, we madeexpression ratios comparing the sensitive to the resistantlines within Resolver's Experimental Definition tool andthen sorted based on P value (Method 1). The top 100probe sets that varied between the sensitive and resistantcell lines by ANOVA were further filtered by discrimi-nant analysis in JMP (version 6.0, SAS) to identify thebest group of probe sets for predicting sensitivity andresistance to ABT-263. These groups were further testedby a leave-one-out cross-validation in SAS, and an error
Molecular Cancer Therapeutics
2010 American Association for Cancer Research.
1 www.ingenuity.com
Gene Signatures Predicting Sensitivity to ABT-263
Published OnlineFirst February 23, 2010; DOI: 10.1158/1535-7163.MCT-09-0651
rate was calculated for the cell lines that were left outeach time. As a validation step, an additional test setof 14 SCLC cell lines (10 sensitive and 4 resistant) wasprofiled as the other lines were and tested in discrimi-nant analysis as unknowns. A similar process was donewith a panel of nine mantle cell lymphomas (eight sen-sitive, one resistant).To use the entire data set to identify additional gene
signatures, several derivation procedures and model fit-ting algorithms (random forests, Bayesian trees, neuralnets, and support vector machines) were tested. Over-all, based on accuracy of prediction, we found the per-formance of signatures to be optimal from the diagonallinear discriminant analysis (DLDA) with simulated an-nealing algorithm. Using this approach (Method 2),genes that were significant on their own based on per-mutation-based Wilcoxon test in the significance analy-sis of microarrays method were first identified beforederiving the signatures. This entire procedure of filter-ing out the important genes, deriving the optimal sig-nature, and model fitting was evaluated using 10replications of 5-fold stratified cross-validation. In the5-fold stratified cross-validation procedure, the celllines were randomly divided into five equal parts(folds) and stratified to ensure approximately similarprevalence of resistant and nonresistant cell lines with-in each fold. Each fold was left out one at a timewhereas the gene filtering–signature derivation–modelfitting process was carried out in the remaining fourparts, and the results were then used to determinewhether the cell lines in the left-out fold were pre-dicted to be resistant or nonresistant. The predictionsfrom each of the left-out folds were then aggregatedto determine the overall accuracy of this procedure.This entire evaluation was repeated 10 times, and themean percentage of cell lines correctly identified fromthese replications was determined with the bestperforming sets reported. This same analysis was thenrepeated on the leukemia/lymphoma cell lines. All ofthese analyses were carried out using programs written
www.aacrjournals.org
on June 6, 2018. ©mct.aacrjournals.org Downloaded from
in R, version 2.7. Gene network analyses were generatedthrough the use of ingenuity pathways analysis (IngenuitySystems1).
Results
Division of Cell Lines into Sensitive and ResistantCategoriesMarkers for sensitivity and resistance to ABT-263 will
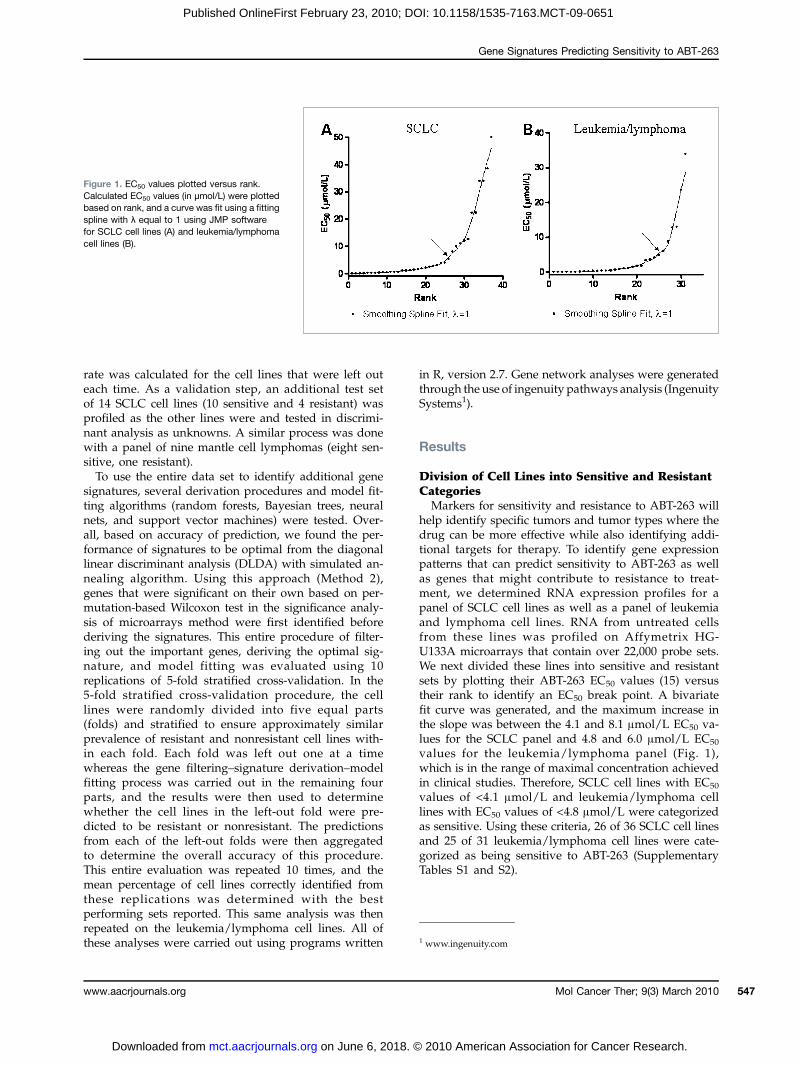
help identify specific tumors and tumor types where thedrug can be more effective while also identifying addi-tional targets for therapy. To identify gene expressionpatterns that can predict sensitivity to ABT-263 as wellas genes that might contribute to resistance to treat-ment, we determined RNA expression profiles for apanel of SCLC cell lines as well as a panel of leukemiaand lymphoma cell lines. RNA from untreated cellsfrom these lines was profiled on Affymetrix HG-U133A microarrays that contain over 22,000 probe sets.We next divided these lines into sensitive and resistantsets by plotting their ABT-263 EC50 values (15) versustheir rank to identify an EC50 break point. A bivariatefit curve was generated, and the maximum increase inthe slope was between the 4.1 and 8.1 μmol/L EC50 va-lues for the SCLC panel and 4.8 and 6.0 μmol/L EC50
values for the leukemia/lymphoma panel (Fig. 1),which is in the range of maximal concentration achievedin clinical studies. Therefore, SCLC cell lines with EC50
values of <4.1 μmol/L and leukemia/lymphoma celllines with EC50 values of <4.8 μmol/L were categorizedas sensitive. Using these criteria, 26 of 36 SCLC cell linesand 25 of 31 leukemia/lymphoma cell lines were cate-gorized as being sensitive to ABT-263 (SupplementaryTables S1 and S2).
Figure 1. EC50 values plotted versus rank.Calculated EC50 values (in μmol/L) were plottedbased on rank, and a curve was fit using a fittingspline with λ equal to 1 using JMP softwarefor SCLC cell lines (A) and leukemia/lymphomacell lines (B).
Mol Cancer Ther; 9(3) March 2010 547
2010 American Association for Cancer Research.

Tahir et al.
548
Published OnlineFirst February 23, 2010; DOI: 10.1158/1535-7163.MCT-09-0651
Correlation of Bcl-2 Family Member ExpressionLevels and Cellular ResponseWe have shown previously that the expression of certain
Bcl-2 family members correlated with the cellular responseto ABT-737, a highly related Bcl-2 family member inhibitor(20). To determinewhich Bcl-2 familymembers' expressionlevels best correlate to sensitivity to ABT-263, we focusedon the 14 apoptosis-related genes in the Bcl-2 family thatare significantly detected on the microarrays. Expressionvalues were compared between the sensitive and resistantcell lines, and the results are shown in Table 1. Here wefound that Bcl-2 and PMAIP1 (or Noxa, which can induceMcl-1 degradation) are expressed at just over 2-fold higherandMcl-1 expression is slightly lower (30%) in the sensitiveSCLC cells compared with the resistant SCLC cells. Theseresults are consistent with previous studies whereinBcl-2 and Noxa levels were shown to be higher andMcl-1 levels were lower both at the mRNA and proteinlevels in SCLC cells sensitive to ABT-737 (20). In addition,expression of Bcl-w is slightly lower (40%) in sensitiveSCLC cells.Similarly, in sensitive leukemia/lymphoma cells, Bcl-2
and Noxa expression is significantly higher and Mcl-1 islower (Table 1). Expression of Bcl-rambo and the antia-poptotic gene A1 is also lower in sensitive leukemia/lymphoma cell lines, whereas expression of the proapop-totic genes BAD, BAK1, and BAX is higher in sensitiveleukemia/lymphoma cell lines (Fig. 2A). By Western blotanalysis, Bcl-2 and Noxa protein levels tended to behigher and Mcl-1 levels tended to be lower in sensitiveleukemia/lymphoma cells compared with resistant cells(Fig. 2B). We did not observe any clear differences in
Mol Cancer Ther; 9(3) March 2010
on June 6, 2018. ©mct.aacrjournals.org Downloaded from
BAD, BAK, or BAX between sensitive and resistant cellsat the protein level. We were unable to discern Bcl-ramboor A1 by Western blot analysis (data not shown).To compare the expression patterns of the genes be-
tween normal and primary tumor tissue, we comparedexpression of the Bcl-2 family genes in eight SCLC tumortissue samples to six normal lung tissue samples takenfrom the same set of patients. Significantly, we foundthat, overall, the comparison of the Bcl-2 family genes ex-pressed in primary SCLC tumor tissue to the normal lungtissue paralleled the comparison of sensitive to resistantcell lines. That is, Bcl-2 and Noxa expression is higherwhereas Mcl-1, Bcl-w, A1, and Bcl-rambo expression le-vels are lower in tumor/sensitive samples (Table 1).In addition to examining individual Bcl-2 family mem-
bers and their correlation to sensitivity and resistance, wesought to identify gene signatures based on the globalRNA expression levels from the microarrays that mightprove to be better predictors of response. We used twoseparate and rigorous approaches to identify the bestpredictive sets for sensitivity/resistance to ABT-263 start-ing with all of the data from the microarrays, regardlessof their relation to the Bcl-2 family of proteins. The firstmethod used discriminant analysis and leave-one-outvalidation, whereas the second method used a DLDAwith simulated annealing algorithm (as described inMaterials and Methods).
Identification and Validation of Gene Signatures asPredictors of Response to ABT-263: Method 1For SCLC cells, a training set of 15 sensitive and
7 resistant cell lines was created to identify the best sets
Table 1. Average differential expression of Bcl-2 family members
Gene
SCLC (sensitive versusresistant)Leukemia/lymphoma(sensitive versus resistant)
Mol
2010 American Association
Primary tissue(SCLC versus normal)
Fold change*
P Fold change P Fold changeecular Cancer Th
for Cancer Rese
P
BCL2 (Bcl-2)
−2.1 0.021 −2.7 0.026 −1.5 0.02 PMAIP1 (Noxa) −2.1 5.49E−04 −1.4 0.038 −5.0 4.86E−14 BID BCL2L1 (Bcl-xL) BCL2L13 (Bcl-rambo) 1.4 5.04E−03 1.3 0.014 BCL2A1 (A1) 2.9 0.039 6.3 2.53E−06 BCL2L11 (Bim) BAD −1.4 0.029 BCL2L2 (Bcl-w) 1.4 0.031 1.2 0.013 BBC3 (Puma) BIK −6.2 4.31E−04 BAX −1.6 0.028 BAK1 −1.3 0.033 MCL1 (Mcl-1) 1.3 0.017 1.2 0.042 2.5 6.42E−13*Differential expression (P < 0.05) is shown for all of the resistant cell lines in each panel compared with all of the sensitive cell linesin each panel. A negative number indicates the expression in the sensitive cells is higher (by the indicated fold change) comparedwith the resistant cells.
erapeutics
arch.

Gene Signatures Predicting Sensitivity to ABT-263
Published OnlineFirst February 23, 2010; DOI: 10.1158/1535-7163.MCT-09-0651
of markers to predict sensitivity to ABT-263 usingdiscriminant analysis. The two best predictive sets usingthis approach are shown (Fig. 3A and B). In a leave-one-out cross-validation test (SAS), we obtained a 2.0% errorrate for set 1 and a 7.8% error rate for set 2 for sensitiveversus resistant classification of the sample that was leftout. Interestingly, none of the Bcl-2 family members wereincluded in these optimized gene signature sets; however,
www.aacrjournals.org
on June 6, 2018. ©mct.aacrjournals.org Downloaded from
some of these genes are in critical signaling and surviv-al pathways. For example, TCF7L1 and FZD2 had high-er expression in resistant cell lines, and these genes areinvolved in the Wnt/β catenin cell signaling pathway.Also expressed higher in the resistant cells wereNOTCH2, which is involved in the Notch signalingpathway, MME and SLC2A3, which are cell surface mo-lecules, and TMBIM1, which contains a Bax inhibitor
Figure 2. Expression profile of Bcl-2 familymembers in leukemia/lymphoma cancercells. Intensity values (A) from the relevantprobe sets for the genes shown in theWestern blots (B) were averaged for eachcell line, imported into Spotfire, normalizedfor each gene individually, and displayedusing green for low expression and red forhigh expression, as indicated in the colorbar. For Western blots, total cell lysateswere fractionated by SDS-PAGE,transferred to polyvinylidene difluoride, andstained as described in Materials andMethods.
Mol Cancer Ther; 9(3) March 2010 549
2010 American Association for Cancer Research.

Tahir et al.
550
Published OnlineFirst February 23, 2010; DOI: 10.1158/1535-7163.MCT-09-0651
motif and is part of a family of proteins that may inhibitapoptosis.We next evaluated the performance of these two predic-
tor sets on a different panel of SCLC cell lines composedof 10 sensitive and 4 resistant lines (Supplementary TableS1). Set 1 identified all lines as sensitive, whereas set 2classified 62.5% of the arrays for the new lines correctly.Importantly, we were able to obtain much higher accura-cy (82.6%) with a three-gene predictor set when we com-bined TMBIM1 and SLC2A3 from set 1 and FZD2 from set2 (Fig. 3C). To determine the tissue specificity of these pre-dictor sets, we tested them on the leukemia/lymphomacell line panel. Set 1 classified 51.3% of the leukemia/lym-phoma cell lines correctly, whereas set 2 classified only40.8% of the leukemia/lymphoma cell lines correctly.Again, the optimized sets of three genes did better(65.8% of the arrays identified correctly).Using the same approach with 17 sensitive and 5 resis-
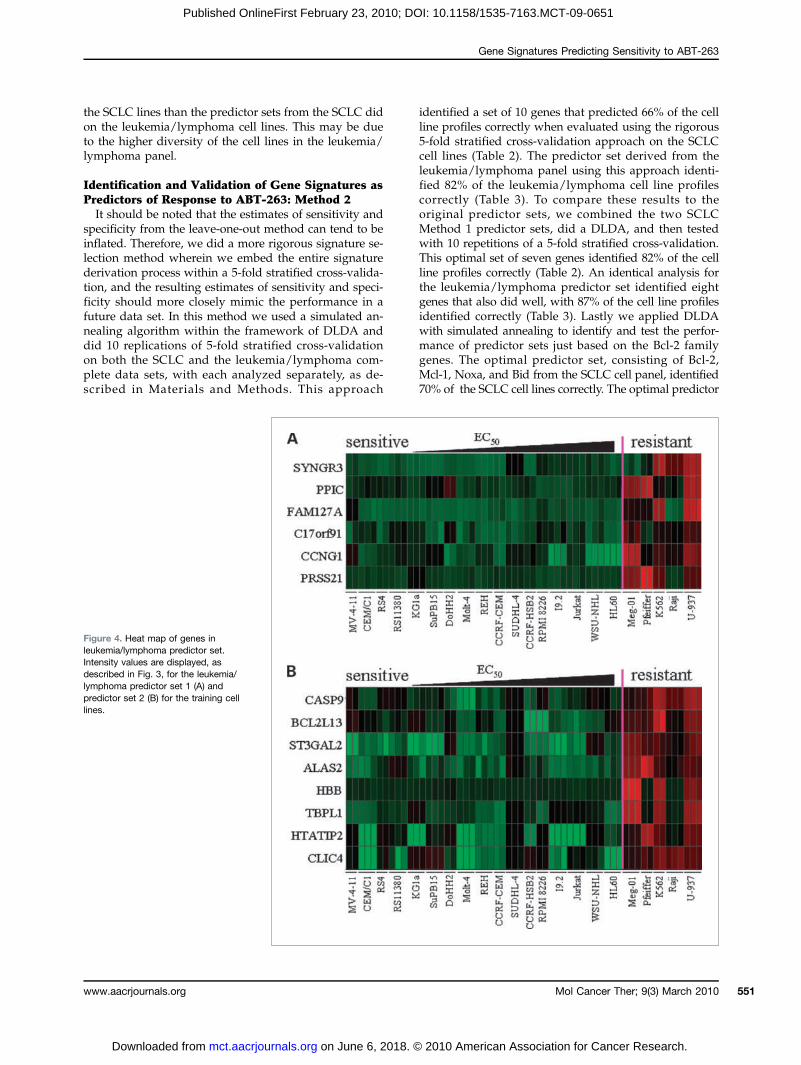
tant leukemia/lymphoma cell lines, we identified twoadditional predictor sets (Fig. 4A and B). In a leave-one-out cross-validation test (SAS) of the leukemia/lym-
Mol Cancer Ther; 9(3) March 2010
on June 6, 2018. ©mct.aacrjournals.org Downloaded from
phoma cell lines with these gene sets, we obtained a 0%error rate for both sets for sensitive versus resistant clas-sification of the sample that was left out. These sets weredistinct from the SCLC predictor sets and included a cellcycle gene (CCNG1/cyclin G1) and two apoptosis genes(BCL2L13/Bcl-rambo and CASP9/caspase-9) as shownin Fig. 4A and B. Similar to the microarray results, theprotein levels of caspase-9 were found to be higher inmost of the resistant cell lines tested (Fig. 2B). To performa similar forward validation step for these two predictorsets, we tested a new panel of eight sensitive and one re-sistant mantle cell lymphoma cell lines (SupplementaryTable S2). For each predictor set, six sensitive lines werecorrectly identified as sensitive; however, one sensitiveline and one resistant line were incorrectly identified,for an overall accuracy rate of 78%. We next tested thesesets on the SCLC cell line panel. The leukemia/lympho-ma predictor set 1 correctly identified 68.1% of the arraysfrom SCLC cell lines, whereas set 2 did slightly better,correctly identifying 73.6% of the arrays. Thus the predic-tor sets from the leukemia/lymphoma lines did better on
Figure 3. Heat map of genes in SCLC predictor set. Intensity values were calculated and are displayed, as described in Fig. 1, with data from each individualmicroarray shown in the order of the corresponding EC50 value (increasing from left to right). A, expression values for the cell lines in the training setfor the genes in predictor set 1. B, expression values for the cell lines in the training set for the genes in predictor set 2. Set 1 and set 2 were combined, and aheat map of the best performing subset (FZD2, SLC2A3, and TMBIM1) is shown for the test cell lines (C).
Molecular Cancer Therapeutics
2010 American Association for Cancer Research.
Gene Signatures Predicting Sensitivity to ABT-263
Published OnlineFirst February 23, 2010; DOI: 10.1158/1535-7163.MCT-09-0651
the SCLC lines than the predictor sets from the SCLC didon the leukemia/lymphoma cell lines. This may be dueto the higher diversity of the cell lines in the leukemia/lymphoma panel.
Identification and Validation of Gene Signatures asPredictors of Response to ABT-263: Method 2It should be noted that the estimates of sensitivity and
specificity from the leave-one-out method can tend to beinflated. Therefore, we did a more rigorous signature se-lection method wherein we embed the entire signaturederivation process within a 5-fold stratified cross-valida-tion, and the resulting estimates of sensitivity and speci-ficity should more closely mimic the performance in afuture data set. In this method we used a simulated an-nealing algorithm within the framework of DLDA anddid 10 replications of 5-fold stratified cross-validationon both the SCLC and the leukemia/lymphoma com-plete data sets, with each analyzed separately, as de-scribed in Materials and Methods. This approach
www.aacrjournals.org
on June 6, 2018. ©mct.aacrjournals.org Downloaded from
identified a set of 10 genes that predicted 66% of the cellline profiles correctly when evaluated using the rigorous5-fold stratified cross-validation approach on the SCLCcell lines (Table 2). The predictor set derived from theleukemia/lymphoma panel using this approach identi-fied 82% of the leukemia/lymphoma cell line profilescorrectly (Table 3). To compare these results to theoriginal predictor sets, we combined the two SCLCMethod 1 predictor sets, did a DLDA, and then testedwith 10 repetitions of a 5-fold stratified cross-validation.This optimal set of seven genes identified 82% of the cellline profiles correctly (Table 2). An identical analysis forthe leukemia/lymphoma predictor set identified eightgenes that also did well, with 87% of the cell line profilesidentified correctly (Table 3). Lastly we applied DLDAwith simulated annealing to identify and test the perfor-mance of predictor sets just based on the Bcl-2 familygenes. The optimal predictor set, consisting of Bcl-2,Mcl-1, Noxa, and Bid from the SCLC cell panel, identified70% of the SCLC cell lines correctly. The optimal predictor
Figure 4. Heat map of genes inleukemia/lymphoma predictor set.Intensity values are displayed, asdescribed in Fig. 3, for the leukemia/lymphoma predictor set 1 (A) andpredictor set 2 (B) for the training celllines.
Mol Cancer Ther; 9(3) March 2010 551
2010 American Association for Cancer Research.

Tahir et al.
552
Published OnlineFirst February 23, 2010; DOI: 10.1158/1535-7163.MCT-09-0651
set for the leukemia and lymphoma cell line panel, consist-ing of Bcl-2, Mcl-1, Bid, Bcl-xL, Bcl-w, and Puma, identified81% of the cell lines correctly (Tables 2 and 3).
Expression Levels for Signature Sets in PrimarySCLC Tumors and Normal Lung TissueFinally, we compared expression levels of the signature
genes in primary patient SCLC tumors to matched nor-
Mol Cancer Ther; 9(3) March 2010
on June 6, 2018. ©mct.aacrjournals.org Downloaded from
mal lung tissue. As can be seen qualitatively in a heatmap comparison, the expression pattern in SCLC tumorcells for the SCLC predictor sets 1 and 2 is similar to thesensitive cell lines, whereas the expression pattern in thenormal lung tissue is similar to the resistant cell lines(compare Fig. 5A with Fig. 3A and B). In comparison,as expected, the expression pattern for the leukemia/lymphoma predictor sets does not show a consistent
Table 2. Method 2 (DLDA) analysis of SCLC predictor genes
Affymetrix ID
Method 1 genes (82%)* Symbol2010 A
Gene function
Molecular Cancer
merican Association for Cancer R
Fold change
202443_x_at
notch homologue 2 NOTCH2 cell cycle, transcription, apoptosis 4.3 202499_s_at solute carrier family 2(facilitated glucose transporter),member 3
SLC2A3
carbohydrate transport 5.5203435_s_at
membrane metalloendopeptidase MME proteolysis, cell communication 3.9 210220_at frizzled homologue 2 FZD2 Wnt receptor signaling pathway 3.4 210605_s_at milk fat globule-egf factor 8 protein MFGE8 endocytosis 8.8 217730_at transmembrane bax inhibitormotif containing 1
TMBIM1 cell, membrane, 3.8218865_at
moco sulfurase c-terminal domaincontaining 1MOSC1
oxidoreductase activity −3.2Affymetrix ID
Method 2 genes (66%)† Symbol Gene function(s) Fold change200872_at
s100 calcium binding protein a10 S100A10 cell communication 8.8 201105_at lectin, galactoside-binding, soluble, 1 LGALS1 apoptosis, cell communication 13.7 201231_s_at enolase 1 ENO1 glucose metabolic process,transcription
1.7201477_s_at
ribonucleotide reductase m1 polypeptide RRM1 DNA metabolic process −1.4 202088_at solute carrier family 39 (zinc transporter),member 6
SLC39A6 ion transport −1.2209366_x_at
cytochrome b5 type a CYB5A electron transport −1.6 211528_x_at hla-g histocompatibility antigen, class i, g HLA-G immune response 3.7 212063_at cd44 antigen CD44 kidney development 5.3 216623_x_at trinucleotide repeat containing 9 TOX3 transcription −5.8 217294_s_at enolase 1 ENO1 glucose metabolic process,transcription
1.8Affymetrix ID
Bcl-2 family genes (70%) Symbol Gene function Fold change200797_s_at
myeloid cell leukemia sequence 1(bcl2-related)MCL1
apoptosis 1.3203684_s_at
b-cell cll/lymphoma 2 BCL2 apoptosis −1.8 203685_at b-cell cll/lymphoma 2 BCL2 apoptosis −3.3 204285_s_at phorbol-12-myristate-13-acetate-inducedprotein 1 (Noxa)
PMAIP1 apoptosis −2.7204286_s_at
phorbol-12-myristate-13-acetate-inducedprotein 1 (Noxa)PMAIP1
apoptosis −2.8211725_s_at
bh3-interacting domain death agonist BID apoptosis −1.5*Genes from the SCLC discriminant predictor sets (Method 1) were combined and processed by DLDA (Method 2), with the bestsets shown. The percentage of arrays correctly identified is shown for the sets listed, with the fold change in resistant comparedwith sensitive lines.†The best DLDA predictor gene set is shown for all of the genes, as well as the Bcl-2 family genes.
Therapeutics
esearch.
Gene Signatures Predicting Sensitivity to ABT-263
Published OnlineFirst February 23, 2010; DOI: 10.1158/1535-7163.MCT-09-0651
pattern in either the SCLC tumor or normal lung samples(compare Fig. 5B with Fig. 4A and B). Quantitatively, theSCLC predictor set 1 identified all of the normal tissue asresistant and four of eight SCLC tumors as sensitive,whereas SCLC predictor set 2 also identified all of thenormal tissue as resistant and seven of eight of the SCLCtumors as sensitive.
www.aacrjournals.org
on June 6, 2018. ©mct.aacrjournals.org Downloaded from
Discussion
Given the complex interaction of the Bcl-2 family mem-bers governing apoptosis, it is reasonable to assume thatany one or more of the Bcl-2 family members may influ-ence or help predict the cellular response to ABT-263.Indeed, we and others have shown that different family
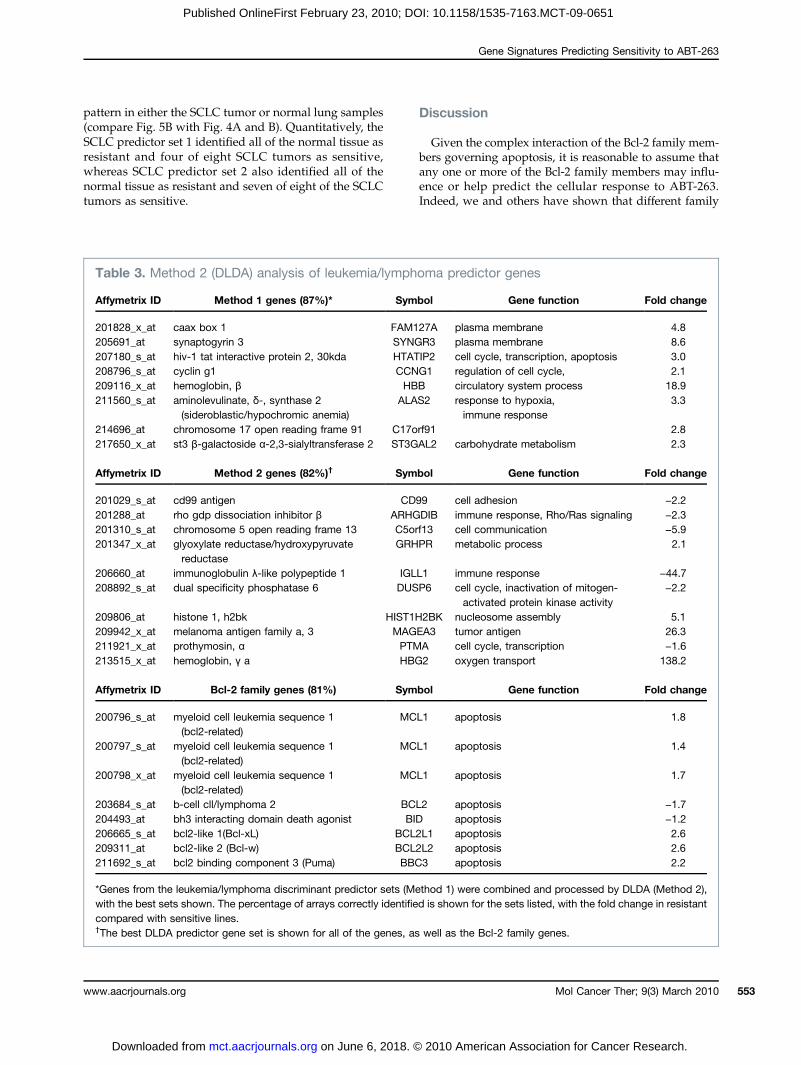
Table 3. Method 2 (DLDA) analysis of leukemia/lymphoma predictor genes
Affymetrix ID
Method 1 genes (87%)* Symbol2010
Gene function
Mol Cancer Ther;
American Association for Cancer R
Fold change
201828_x_at
caax box 1 FAM127A plasma membrane 4.8 205691_at synaptogyrin 3 SYNGR3 plasma membrane 8.6 207180_s_at hiv-1 tat interactive protein 2, 30kda HTATIP2 cell cycle, transcription, apoptosis 3.0 208796_s_at cyclin g1 CCNG1 regulation of cell cycle, 2.1 209116_x_at hemoglobin, β HBB circulatory system process 18.9 211560_s_at aminolevulinate, δ-, synthase 2(sideroblastic/hypochromic anemia)
ALAS2 response to hypoxia,immune response
3.3214696_at
chromosome 17 open reading frame 91 C17orf91 2.8 217650_x_at st3 β-galactoside α-2,3-sialyltransferase 2 ST3GAL2 carbohydrate metabolism 2.3Affymetrix ID
Method 2 genes (82%)† Symbol Gene function Fold change201029_s_at
cd99 antigen CD99 cell adhesion −2.2 201288_at rho gdp dissociation inhibitor β ARHGDIB immune response, Rho/Ras signaling −2.3 201310_s_at chromosome 5 open reading frame 13 C5orf13 cell communication −5.9 201347_x_at glyoxylate reductase/hydroxypyruvatereductase
GRHPR metabolic process 2.1206660_at
immunoglobulin λ-like polypeptide 1 IGLL1 immune response −44.7 208892_s_at dual specificity phosphatase 6 DUSP6 cell cycle, inactivation of mitogen-activated protein kinase activity
−2.2209806_at
histone 1, h2bk HIST1H2BK nucleosome assembly 5.1 209942_x_at melanoma antigen family a, 3 MAGEA3 tumor antigen 26.3 211921_x_at prothymosin, α PTMA cell cycle, transcription −1.6 213515_x_at hemoglobin, γ a HBG2 oxygen transport 138.2Affymetrix ID
Bcl-2 family genes (81%) Symbol Gene function Fold change200796_s_at
myeloid cell leukemia sequence 1(bcl2-related)MCL1
apoptosis 1.8200797_s_at
myeloid cell leukemia sequence 1(bcl2-related)MCL1
apoptosis 1.4200798_x_at
myeloid cell leukemia sequence 1(bcl2-related)MCL1
apoptosis 1.7203684_s_at
b-cell cll/lymphoma 2 BCL2 apoptosis −1.7 204493_at bh3 interacting domain death agonist BID apoptosis −1.2 206665_s_at bcl2-like 1(Bcl-xL) BCL2L1 apoptosis 2.6 209311_at bcl2-like 2 (Bcl-w) BCL2L2 apoptosis 2.6 211692_s_at bcl2 binding component 3 (Puma) BBC3 apoptosis 2.2*Genes from the leukemia/lymphoma discriminant predictor sets (Method 1) were combined and processed by DLDA (Method 2),with the best sets shown. The percentage of arrays correctly identified is shown for the sets listed, with the fold change in resistantcompared with sensitive lines.†The best DLDA predictor gene set is shown for all of the genes, as well as the Bcl-2 family genes.
9(3) March 2010 553
esearch.

Tahir et al.
554
Published OnlineFirst February 23, 2010; DOI: 10.1158/1535-7163.MCT-09-0651
members can influence or predict the cellular response toanother related Bcl-2 family member inhibitor, ABT-737(20, 26, 27). Elucidating which of the family membersare important will help us better identify patients whoare more likely to respond to ABT-263 treatment as wellas provide guidance for rationally designed combinationtrials. In both SCLC cell lines and leukemia/lymphomacell lines, we found that both Bcl-2 and Noxa expressionis increased in sensitive cell lines, whereas Mcl-1 expres-sion is lower when compared with resistant cells. This isconsistent with the mechanism of ABT-263, as Bcl-2 is oneof the targets of ABT-263 whereas Mcl-1, another antia-poptotic family member, is not.Previous studies have shown that knockdown of Mcl-1
with siRNA, modulating its expression with other che-motherapeutic agents or overexpression of Noxa, sensi-tizes cells resistant to Bcl-2 family member inhibitors.Therefore, in resistant cells, Mcl-1 not only correlateswith cellular response but is a potential resistance factor(15, 20, 28–30). Besides Mcl-1, A1 expression was higherin the resistant leukemia/lymphoma cell lines. A previ-ous study has shown that A1 can confer resistance toABT-737 in chronic lymphocytic leukemia (24). Thus, thismay potentially be another resistance factor with antia-poptotic activity that needs to be considered (31). Interest-ingly, the expression of the proapoptotic factor Bcl-rambois higher in the resistant leukemia and lymphoma celllines. Little has been described about Bcl-rambo; however,enhanced Bcl-rambo expression was identified as being
Mol Cancer Ther; 9(3) March 2010
on June 6, 2018. ©mct.aacrjournals.org Downloaded from
associated with resistance to L-asparaginase (32). WhereasBcl-rambo was identified as a proapoptotic factor throughits unique COOH terminal extension (33), its associationwith drug resistance and unfavorable long-term clinicaloutcome in children was postulated to occur through anantiapoptotic activity, possibly mediated by a previouslyunidentified splice variant (32).In addition to looking at individual Bcl-2 family mem-
bers that correlated with cellular response to ABT-263,we also derived optimal predictive gene signatures justfrom the Bcl-2 family members. These gene signature setscorrectly predicted the response in 70% and 81% of theSCLC and leukemia/lymphoma cell lines, respectively.Overall, individually or collectively, Bcl-2 family mem-bers may be useful as predictors of response to ABT-263. We are currently evaluating their expression levelsin on-going clinical trials to assess their potential as pa-tient stratification biomarkers.Ideal chemotherapeutics will have a maximal effect on
tumor cells while having a minimal effect on the normaltissue. Our comparison of primary SCLC tumors tomatching normal adjacent tissue showed a differentialexpression similar to that seen with the sensitive and re-sistant cell lines. Specifically, Bcl-2 and Noxa expressionwas significantly lower in normal tissue compared withtumor tissue, whereas expression of A1 and Mcl-1 is sig-nificantly higher in normal tissue, as was seen in the re-sistant cell lines compared with the sensitive cell lines.Our analysis with the SCLC predictor sets indicated that
2010 American As
Figure 5. Heat map of expression of predictorset genes in primary SCLC tumors and normallung tissue. Intensity values are displayed,as described in Fig. 3, for eight SCLC tumorsamples and normal adjacent tissue from six ofthose tumors. The genes are the SCLCpredictor sets (A) and the leukemia/lymphomasets (B).
Molecular Cancer Therapeutics
sociation for Cancer Research.
Gene Signatures Predicting Sensitivity to ABT-263
Published OnlineFirst February 23, 2010; DOI: 10.1158/1535-7163.MCT-09-0651
the expression pattern of these genes in normal tissue isalso similar to resistant lines, whereas the tumor expres-sion pattern of these genes is similar to the sensitive celllines. Indeed, when we analyzed the tumor and normaltissues by discriminant analysis with the SCLC predictorsets, the normal tissues were all identified as resistantand the tumors were primarily identified as sensitive(four of eight with set 1 and seven of eight with set 2).The predictor genes that correlatewith resistant cell lines
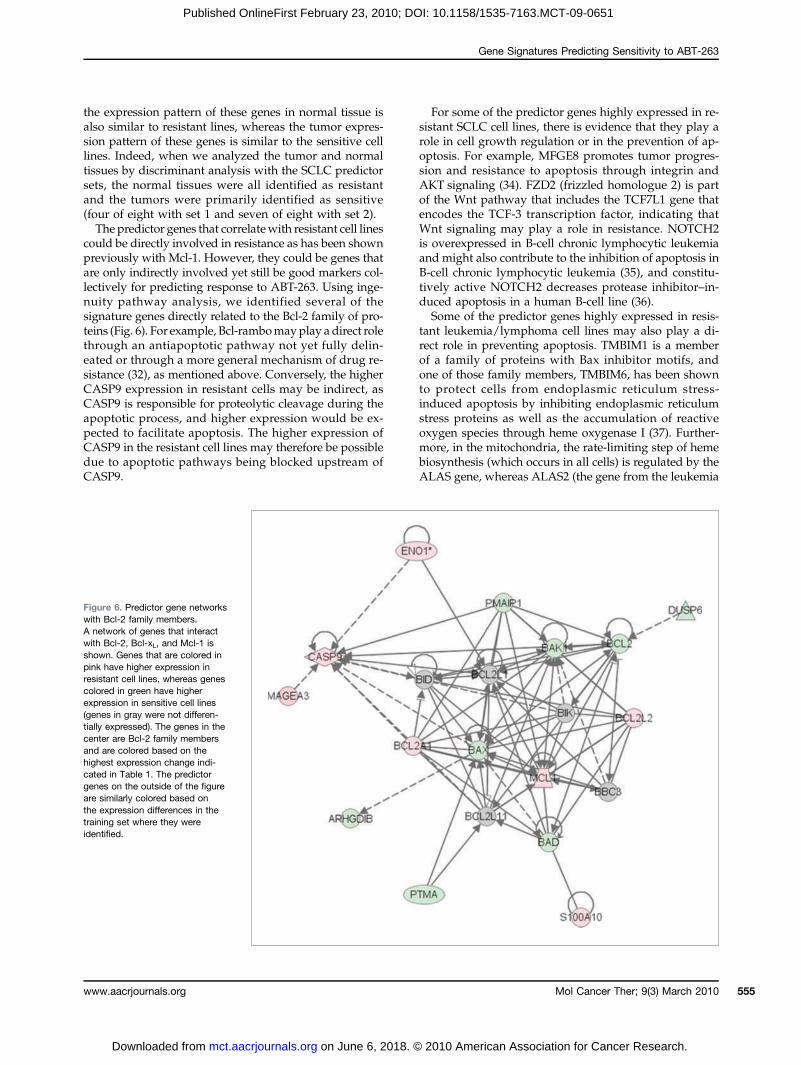
could be directly involved in resistance as has been shownpreviously with Mcl-1. However, they could be genes thatare only indirectly involved yet still be good markers col-lectively for predicting response to ABT-263. Using inge-nuity pathway analysis, we identified several of thesignature genes directly related to the Bcl-2 family of pro-teins (Fig. 6). For example, Bcl-rambomayplay a direct rolethrough an antiapoptotic pathway not yet fully delin-eated or through a more general mechanism of drug re-sistance (32), as mentioned above. Conversely, the higherCASP9 expression in resistant cells may be indirect, asCASP9 is responsible for proteolytic cleavage during theapoptotic process, and higher expression would be ex-pected to facilitate apoptosis. The higher expression ofCASP9 in the resistant cell lines may therefore be possibledue to apoptotic pathways being blocked upstream ofCASP9.
www.aacrjournals.org
on June 6, 2018. ©mct.aacrjournals.org Downloaded from
For some of the predictor genes highly expressed in re-sistant SCLC cell lines, there is evidence that they play arole in cell growth regulation or in the prevention of ap-optosis. For example, MFGE8 promotes tumor progres-sion and resistance to apoptosis through integrin andAKT signaling (34). FZD2 (frizzled homologue 2) is partof the Wnt pathway that includes the TCF7L1 gene thatencodes the TCF-3 transcription factor, indicating thatWnt signaling may play a role in resistance. NOTCH2is overexpressed in B-cell chronic lymphocytic leukemiaand might also contribute to the inhibition of apoptosis inB-cell chronic lymphocytic leukemia (35), and constitu-tively active NOTCH2 decreases protease inhibitor–in-duced apoptosis in a human B-cell line (36).Some of the predictor genes highly expressed in resis-
tant leukemia/lymphoma cell lines may also play a di-rect role in preventing apoptosis. TMBIM1 is a memberof a family of proteins with Bax inhibitor motifs, andone of those family members, TMBIM6, has been shownto protect cells from endoplasmic reticulum stress-induced apoptosis by inhibiting endoplasmic reticulumstress proteins as well as the accumulation of reactiveoxygen species through heme oxygenase I (37). Further-more, in the mitochondria, the rate-limiting step of hemebiosynthesis (which occurs in all cells) is regulated by theALAS gene, whereas ALAS2 (the gene from the leukemia
Figure 6. Predictor gene networkswith Bcl-2 family members.A network of genes that interactwith Bcl-2, Bcl-xL, and Mcl-1 isshown. Genes that are colored inpink have higher expression inresistant cell lines, whereas genescolored in green have higherexpression in sensitive cell lines(genes in gray were not differen-tially expressed). The genes in thecenter are Bcl-2 family membersand are colored based on thehighest expression change indi-cated in Table 1. The predictorgenes on the outside of the figureare similarly colored based onthe expression differences in thetraining set where they wereidentified.
Mol Cancer Ther; 9(3) March 2010 555
2010 American Association for Cancer Research.

Tahir et al.
556
Published OnlineFirst February 23, 2010; DOI: 10.1158/1535-7163.MCT-09-0651
lymphoma predictor set) is normally specifically ex-pressed in erythroid cells. Because defective ALAS2 hasbeen linked to sideroblastic anemia and diminished hemeproduction, ALAS2 function can enhance cellular surviv-al, as excess iron promotes reactive oxygen species (38).Therefore, increased ALAS2 may function to decrease re-active oxygen species and promote mitochondrial stabil-ity. PPIC, or CypC, is a member of the cyclophilin familyof proteins normally located in the endoplasmic reticu-lum and may have an antiapoptotic function through achaperone activity that responds to cellular stress (39).Expression of PPRSS21/Testisin, a serine protease, hasbeen shown to increase transformation, whereas siRNAthat decreases PPRSS21/Testisin expression increases ap-optosis, possibly through its cleavage activity (40).Some of the genes identified by the DLDA method
play a direct role in the regulation of apoptosis, tumorprogression, and chemoresistance. For example, knock-down of CD44 (expressed higher in resistant SCLC lines)increased apoptosis and chemosensitivity accompaniedby multidrug resistance-1 and Bcl-2 expression decreasesin hepatocellular carcinoma cells (41). In addition,CD44 interaction with hyaluronan led to activation ofβ-catenin–mediated TCF/LEF activation, causing multi-drug resistance-1 and Bcl-xL upregulation in breast tumorcells (42). RRMI (expressed lower in resistant SCLC lines)expression leads to suppression of proliferation, cell cyclearrest, and apoptosis, possibly through DNA damagerepair pathways (43).Similarly, genes from the leukemia/lymphoma set are
known to play a role in drug resistance or apoptosis. Forexample, loss of DUSP6/MKP3, a phosphatase that de-phosphorylates extracellular signal-regulated kinase 1/2(and has tumor suppressive effects), has been shown toincrease tumorgenicity and chemoresistance (44). DUSP6expression is high in 10 of 19 sensitive lines, whereas itsexpression is at or below background levels in five of sixresistant leukemia/lymphoma cell lines, as would be pre-dicted if loss of expression leads to chemoresistance.ARHGDIB/RhoGDI2 is a metastasis suppressor genethat has been shown to contribute to apoptosis in HL60and K562 (45, 46). Significantly, HL60 cells are more sen-
Mol Cancer Ther; 9(3) March 2010
on June 6, 2018. ©mct.aacrjournals.org Downloaded from
sitive than K562 to ABT-263, and expression of ARHG-DIB/RhoGDI2 is almost 9-fold higher in HL60 cells.CD99, a gene whose expression is lower in resistant leu-kemia/lymphoma cell lines, contributes to Fas-mediatedapoptosis in Jurkat cells (47), whereas ligation of CD99 inEwing sarcoma cells induces caspase-independent apo-ptosis (48). Significantly, Jurkat cells, which are sensitiveto ABT-263, had the highest expression of CD99 in ourpanel. MAGEA3 (increased in resistant leukemia/lym-phoma lines) has been shown to contribute to fibronec-tin-mediated cancer progression through enhancedtumor growth (49).In summary, we have found that high levels of Bcl-2 and
Noxa and low levels of Mcl-1 correlated with the cellularresponse of SCLC and leukemic cell lines to ABT-263.Through expression profiling of untreated cells and com-parison of sensitive and resistant SCLC and leukemia/lymphoma cell lines, we have identified expressionpatterns that are predictive of sensitivity to ABT-263 withhigh accuracy. This forms a testable hypothesis that can beapplied in future clinical trials to determine howwell thesepredictive markers identify patients that are most likely tobenefit from ABT-263. The parallels in expression patternsbetween sensitive models and primary SCLC tumors fur-ther substantiate SCLC as an excellent target for ABT-263,and interrogation of these signatures and their predictivepotential in ongoing clinical trials could help expedite thedelivery of optimal treatment to future patients.
Disclosure of Potential Conflicts of Interest
The authors are employed by Abbott Laboratories and patents are filedon expression signatures.
Acknowledgments
The costs of publication of this article were defrayed in part by thepayment of page charges. This article must therefore be hereby markedadvertisement in accordance with 18 U.S.C. Section 1734 solely to indicatethis fact.
Received 07/15/2009; revised 11/19/2009; accepted 12/15/2009;published OnlineFirst 02/23/2010.
References
1. Zereu M, Vinholes JJ, Zettler CG. p53 and Bcl-2 protein expressionand its relationship with prognosis in small-cell lung cancer. ClinLung Cancer 2003;4:298–302.
2. Ikegaki N, Katsumata M, Minna J, Tsujimoto Y. Expression of bcl-2 insmall cell lung carcinoma cells. Cancer Res 1994;54:6–8.
3. Ohmori T, Podack ER, Nishio K, et al. Apoptosis of lung cancercells caused by some anti-cancer agents (MMC, CPT-11, ADM)is inhibited by bcl-2. Biochem Biophys Res Commun 1993;192:30–6.
4. Jiang SX, Sato Y, Kuwao S, Kameya T. Expression of bcl-2 onco-gene protein is prevalent in small cell lung carcinomas. J Pathol1995;177:135–8.
5. Reed JC. Bcl-2: prevention of apoptosis as a mechanism of drugresistance. Hematol Oncol Clin North Am 1995;9:451–73.
6. Higashiyama M, Doi O, Kodama K, Yokouchi H, Tateishi R. Bcl-2oncoprotein expression is increased especially in the portion of smallcell carcinoma within the combined type of small cell lung cancer.Tumour Biol 1996;17:341–4.
7. Kaiser U, Schilli M, Haag U, et al. Expression of bcl-2-protein in smallcell lung cancer. Lung Cancer 1996;15:31–40.
8. Stefanaki K, Tzardi M, Kouvidou C, et al. Expression of p53, p21,mdm2, Rb, bax and Ki67 proteins in lymphomas of the mucosa-associated lymphoid (MALT) tissue. Anticancer Res 1998;18:2403–8.
9. Zhang Y, Fujita N, Tsuruo T. p21Waf1/Cip1 acts in synergy with bcl-2to confer multidrug resistance in a camptothecin-selected humanlung-cancer cell line. Int J Cancer 1999;83:790–7.
10. Sartorius UA, Krammer PH. Upregulation of Bcl-2 is involved in the
Molecular Cancer Therapeutics
2010 American Association for Cancer Research.

Gene Signatures Predicting Sensitivity to ABT-263
Published OnlineFirst February 23, 2010; DOI: 10.1158/1535-7163.MCT-09-0651
mediation of chemotherapy resistance in human small cell lungcancer cell lines. Int J Cancer 2002;97:584–92.
11. Cory S, Adams JM. The Bcl2 family: regulators of the cellular life-or-death switch. Nat Rev Cancer 2002;2:647–56.
12. Adams JM, Cory S. Bcl-2-regulated apoptosis: mechanism and ther-apeutic potential. Curr Opin Immunol 2007;19:488–96.
13. Danial NN, Korsmeyer SJ. Cell death: critical control points. Cell2004;116:205–19.
14. van Delft MF, Huang DC. How the Bcl-2 family of proteins interact toregulate apoptosis. Cell Res 2006;16:203–13.
15. Tse C, Shoemaker AR, Adickes J, et al. ABT-263: a potent and orallybioavailable Bcl-2 family inhibitor. Cancer Res 2008;68:3421–8.
16. Lock R, Carol H, Houghton PJ, et al. Initial testing (stage 1) of theBH3 mimetic ABT-263 by the pediatric preclinical testing program.Pediatr Blood Cancer 2008;50:1181–9.
17. Shoemaker AR, Mitten MJ, Adickes J, et al. Activity of the Bcl-2 fam-ily inhibitor ABT-263 in a panel of small cell lung cancer xenograftmodels. Clin Cancer Res 2008;14:3268–77.
18. Baselga J, Tripathy D, Mendelsohn J, et al. Phase II study of weeklyintravenous recombinant humanized anti-p185HER2 monoclonal an-tibody in patients with HER2/neu-overexpressing metastatic breastcancer. J Clin Oncol 1996;14:737–44.
19. Cappuzzo F, Varella-Garcia M, Shigematsu H, et al. Increased HER2gene copy number is associated with response to gefitinib therapy inepidermal growth factor receptor-positive non-small-cell lung cancerpatients. J Clin Oncol 2005;23:5007–18.
20. Tahir SK, Yang X, Anderson MG, et al. Influence of Bcl-2 family mem-bers on the cellular response of small-cell lung cancer cell lines toABT-737. Cancer Res 2007;67:1176–83.
21. Balko JM, Black EP. A gene expression predictor of response toEGFR-targeted therapy stratifies progression-free survival to cetux-imab in KRAS wild-type metastatic colorectal cancer. BMC Cancer2009;9:145.
22. Han SW, Kim TY, Jeon YK, et al. Optimization of patient selection forgefitinib in non-small cell lung cancer by combined analysis of epi-dermal growth factor receptor mutation, K-ras mutation, and Aktphosphorylation. Clin Cancer Res 2006;12:2538–44.
23. Huang F, Reeves K, Han X, et al. Identification of candidate molec-ular markers predicting sensitivity in solid tumors to dasatinib: ratio-nale for patient selection. Cancer Res 2007;67:2226–38.
24. Rink L, Skorobogatko Y, Kossenkov AV, et al. Gene expression sig-natures and response to imatinib mesylate in gastrointestinal stromaltumor. Mol Cancer Ther 2009;8:2172–82.
25. Oltersdorf T, Elmore SW, Shoemaker AR, et al. An inhibitor of Bcl-2family proteins induces regression of solid tumours. Nature 2005;435:677–81.
26. van Delft MF, Wei AH, Mason KD, et al. The BH3 mimetic ABT-737targets selective Bcl-2 proteins and efficiently induces apoptosis viaBak/Bax if Mcl-1 is neutralized. Cancer Cell 2006;10:389–99.
27. Del Gaizo Moore V, Brown JR, Certo M, et al. Chronic lymphocyticleukemia requires BCL2 to sequester prodeath BIM, explaining sen-sitivity to BCL2 antagonist ABT-737. J Clin Invest 2007;117:112–21.
28. Certo M, Del Gaizo Moore V, Nishino M, et al. Mitochondria primedby death signals determine cellular addiction to antiapoptotic BCL-2family members. Cancer Cell 2006;9:351–65.
29. Konopleva M, Contractor R, Tsao T, et al. Mechanisms of apoptosissensitivity and resistance to the BH3 mimetic ABT-737 in acute my-eloid leukemia. Cancer Cell 2006;10:375–88.
30. Deng J, Carlson N, TakeyamaK, et al. BH3 profiling identifies three dis-tinct classes of apoptotic blocks to predict response to ABT-737 andconventional chemotherapeutic agents. Cancer Cell 2007;12:171–85.
31. Vogler M, Butterworth M, Majid A, et al. Concurrent upregulation of
www.aacrjournals.org
on June 6, 2018. ©mct.aacrjournals.org Downloaded from
BCL-XL and BCL2A1 induces ∼1000-fold resistance to ABT-737 inchronic lymphocytic leukemia. Blood 2009;113:4403–13.
32. Holleman A, den Boer ML, de Menezes RX, et al. The expression of70 apoptosis genes in relation to lineage, genetic subtype, cellulardrug resistance, and outcome in childhood acute lymphoblastic leu-kemia. Blood 2006;107:769–76.
33. Kataoka T, Holler N, Micheau O, et al. Bcl-rambo, a novel Bcl-2 ho-mologue that induces apoptosis via its unique C-terminal extension.J Biol Chem 2001;276:19548–54.
34. Jinushi M, Nakazaki Y, Carrasco DR, et al. Milk fat globule EGF-8 promotes melanoma progression through coordinated Akt andtwist signaling in the tumor microenvironment. Cancer Res 2008;68:8889–98.
35. Hubmann R, Schwarzmeier JD, Shehata M, et al. Notch2 is involvedin the overexpression of CD23 in B-cell chronic lymphocytic leuke-mia. Blood 2002;99:3742–7.
36. Duechler M, Shehata M, Schwarzmeier JD, et al. Induction of apo-ptosis by proteasome inhibitors in B-CLL cells is associated withdownregulation of CD23 and inactivation of Notch2. Leukemia2005;19:260–7.
37. Lee GH, Kim HK, Chae SW, et al. Bax inhibitor-1 regulates endoplas-mic reticulum stress-associated reactive oxygen species and hemeoxygenase-1 expression. J Biol Chem 2007;282:21618–28.
38. Fontenay M, Cathelin S, Amiot M, Gyan E, Solary E. Mitochondria inhematopoiesis and hematological diseases. Oncogene 2006;25:4757–67.
39. Yao Q, Li M, Yang H, et al. Roles of cyclophilins in cancers and otherorgan systems. World J Surg 2005;29:276–80.
40. Tang T, Kmet M, Corral L, et al. Testisin, a glycosyl-phosphatidyli-nositol-linked serine protease, promotes malignant transformationin vitro and in vivo. Cancer Res 2005;65:868–78.
41. Xie Z, Choong PF, Poon LF, et al. Inhibition of CD44 expression inhepatocellular carcinoma cells enhances apoptosis, chemosensitiv-ity, and reduces tumorigenesis and invasion. Cancer ChemotherPharmacol 2008;62:949–57.
42. Bourguignon LY, Xia W, Wong G. Hyaluronan-mediated CD44 inter-action with p300 and SIRT1 regulates β-catenin signaling and NFκB-specific transcription activity leading to MDR1 and Bcl-xL gene ex-pression and chemoresistance in breast tumor cells. J Biol Chem2009;284:2657–71.
43. Gautam A, Bepler G. Suppression of lung tumor formation by theregulatory subunit of ribonucleotide reductase. Cancer Res 2006;66:6497–502.
44. Chan DW, Liu VW, Tsao GS, et al. Loss of MKP3 mediated by oxi-dative stress enhances tumorigenicity and chemoresistance of ovar-ian cancer cells. Carcinogenesis 2008;29:1742–50.
45. Choi MR, Groot M, Drexler HC. Functional implications of caspase-mediated RhoGDI2 processing during apoptosis of HL60 and K562leukemia cells. Apoptosis 2007;12:2025–35.
46. Harding MA, Theodorescu D. RhoGDI2: a new metastasis suppres-sor gene: discovery and clinical translation. Urol Oncol 2007;25:401–6.
47. Jung KC, Kim NH, Park WS, Park SH, Bae Y. The CD99 signal en-hances Fas-mediated apoptosis in the human leukemic cell line,Jurkat. FEBS Lett 2003;554:478–84.
48. Cerisano V, Aalto Y, Perdichizzi S, et al. Molecular mechanisms ofCD99-induced caspase-independent cell death and cell-cell adhe-sion in Ewing's sarcoma cells: actin and zyxin as key intracellularmediators. Oncogene 2004;23:5664–74.
49. Liu W, Cheng S, Asa SL, Ezzat S. The melanoma-associated antigenA3 mediates fibronectin-controlled cancer progression and metasta-sis. Cancer Res 2008;68:8104–12.
Mol Cancer Ther; 9(3) March 2010 557
2010 American Association for Cancer Research.
Published OnlineFirst February 23, 2010.Mol Cancer Ther Stephen K. Tahir, John Wass, Mary K. Joseph, et al. Lung Carcinoma and Leukemia/Lymphoma Cell Linesto the Bcl-2 Family Member Inhibitor ABT-263 in Small Cell Identification of Expression Signatures Predictive of Sensitivity
Updated version
10.1158/1535-7163.MCT-09-0651doi:
Access the most recent version of this article at:
Material
Supplementary
http://mct.aacrjournals.org/content/suppl/2010/02/22/1535-7163.MCT-09-0651.DC1
Access the most recent supplemental material at:
E-mail alerts related to this article or journal.Sign up to receive free email-alerts
Subscriptions
Reprints and
To order reprints of this article or to subscribe to the journal, contact the AACR Publications
Permissions
Rightslink site. Click on "Request Permissions" which will take you to the Copyright Clearance Center's (CCC)
.http://mct.aacrjournals.org/content/early/2010/02/21/1535-7163.MCT-09-0651To request permission to re-use all or part of this article, use this link
on June 6, 2018. © 2010 American Association for Cancer Research. mct.aacrjournals.org Downloaded from
Published OnlineFirst February 23, 2010; DOI: 10.1158/1535-7163.MCT-09-0651