thermal and catalytic cracking of jp-10 for pulse detonation
TRANSCRIPT

THERMAL AND CATALYTIC CRACKING OFJP-10 FOR PULSE DETONATION ENGINE
APPLICATIONS
M. Cooper and J.E. Shepherd
Graduate Aeronautical Laboratories,California Institute of Technology, Pasadena, CA 91125
GALCIT Report FM 2002.002
This work was carried out under P.O. No. 00-592 forAdvanced Projects Research, Inc. under AF contract F04611-99-C-0017.
December 16, 2002

Abstract
Practical air-breathing pulse detonation engines (PDE) will be based on storable liquidhydrocarbon fuels such as JP-10 or Jet A. However, such fuels are not optimal for PDEoperation due to the high energy input required for direct initiation of a detonation andthe long deflagration-to-detonation transition times associated with low-energy initiators.These effects increase cycle time and reduce time-averaged thrust, resulting in a signif-icant loss of performance. In an effort to utilize such conventional liquid fuels and stillmaintain the performance of the lighter and more sensitive hydrocarbon fuels, variousfuel modification schemes such as thermal and catalytic cracking have been investigated.
We have examined the decomposition of JP-10 through thermal and catalytic crackingmechanisms at elevated temperatures using a bench-top reactor system. The system hasthe capability to vaporize liquid fuel at precise flowrates while maintaining the flowpath at elevated temperatures and pressures for extended periods of time. The catalyticcracking tests were completed utilizing common industrial zeolite catalysts installed inthe reactor. A gas chromatograph with a capillary column and flame ionization detector,connected to the reactor output, is used to speciate the reaction products. The conversionrate and product compositions were determined as functions of the fuel metering rate,reactor temperature, system backpressure, and zeolite type.
An additional study was carried out to evaluate the feasibility of using pre-mixedrich combustion to partially oxidize JP-10. A mixture of partially oxidized products wasinitially obtained by rich combustion in JP-10 and air mixtures for equivalence ratiosbetween 1 and 5. Following the first burn, air was added to the products, creating anequivalent stoichiometric mixture. A second burn was then carried out. Pressure historiesand schlieren video images were recorded for both burns. The results were analyzed bycomparing the peak and final pressures to idealized thermodynamic predictions.
i
Contents
1 Introduction 1
2 Hydrocarbon cracking 12.1 Thermal cracking . . . . . . . . . . . . . . . . . . . . . . . . . . . . . . . 22.2 Catalytic cracking with zeolites . . . . . . . . . . . . . . . . . . . . . . . 3
3 Experimental setup 63.1 Rotameters . . . . . . . . . . . . . . . . . . . . . . . . . . . . . . . . . . 63.2 Fuel pump . . . . . . . . . . . . . . . . . . . . . . . . . . . . . . . . . . . 73.3 Evaporator . . . . . . . . . . . . . . . . . . . . . . . . . . . . . . . . . . 83.4 Reactor . . . . . . . . . . . . . . . . . . . . . . . . . . . . . . . . . . . . 103.5 Accumulator . . . . . . . . . . . . . . . . . . . . . . . . . . . . . . . . . . 123.6 Valves . . . . . . . . . . . . . . . . . . . . . . . . . . . . . . . . . . . . . 133.7 Controllers and panel wiring . . . . . . . . . . . . . . . . . . . . . . . . . 133.8 Vent hood and fume curtain . . . . . . . . . . . . . . . . . . . . . . . . . 143.9 Gas bottles and regulators . . . . . . . . . . . . . . . . . . . . . . . . . . 15
4 Gas chromatograph 174.1 GC theory . . . . . . . . . . . . . . . . . . . . . . . . . . . . . . . . . . . 174.2 Flame ionization detector . . . . . . . . . . . . . . . . . . . . . . . . . . 194.3 Agilent GC and associated hardware . . . . . . . . . . . . . . . . . . . . 194.4 ChemStation software . . . . . . . . . . . . . . . . . . . . . . . . . . . . 20
4.4.1 Method and run control . . . . . . . . . . . . . . . . . . . . . . . 204.4.2 Data analysis and report generation . . . . . . . . . . . . . . . . . 234.4.3 Column conditioning and maintence . . . . . . . . . . . . . . . . . 23
5 Characterization tests 245.1 Chromatography with liquid injection . . . . . . . . . . . . . . . . . . . . 245.2 Chromatography with gas injection . . . . . . . . . . . . . . . . . . . . . 255.3 Leak testing . . . . . . . . . . . . . . . . . . . . . . . . . . . . . . . . . . 305.4 Temperature distribution . . . . . . . . . . . . . . . . . . . . . . . . . . . 305.5 JP-10 Vapor Pressure . . . . . . . . . . . . . . . . . . . . . . . . . . . . . 30
6 Methods of data acquisition, analysis, and reduction 336.1 Test procedure . . . . . . . . . . . . . . . . . . . . . . . . . . . . . . . . 336.2 Mole balance calculations . . . . . . . . . . . . . . . . . . . . . . . . . . 356.3 Mass Balance Calculations . . . . . . . . . . . . . . . . . . . . . . . . . . 38
7 Thermal decomposition 40
ii
8 Catalytic cracking 508.1 Zeolite preparation . . . . . . . . . . . . . . . . . . . . . . . . . . . . . . 508.2 Test results . . . . . . . . . . . . . . . . . . . . . . . . . . . . . . . . . . 50
8.2.1 Effect of zeolite activity . . . . . . . . . . . . . . . . . . . . . . . 508.2.2 Effect of liquid fuel flowrate . . . . . . . . . . . . . . . . . . . . . 558.2.3 Effect of zeolite type . . . . . . . . . . . . . . . . . . . . . . . . . 598.2.4 Comparison of catalytic and thermal cracking . . . . . . . . . . . 628.2.5 Effect of pressure . . . . . . . . . . . . . . . . . . . . . . . . . . . 628.2.6 Effect of reactor temperature . . . . . . . . . . . . . . . . . . . . 65
9 Sources of uncertainty 739.1 Fuel pump flowrate . . . . . . . . . . . . . . . . . . . . . . . . . . . . . . 739.2 Pressure gauge calibration . . . . . . . . . . . . . . . . . . . . . . . . . . 739.3 Accumulator height reading . . . . . . . . . . . . . . . . . . . . . . . . . 739.4 Measurement of accumulator volume . . . . . . . . . . . . . . . . . . . . 749.5 Upstream volume measurement . . . . . . . . . . . . . . . . . . . . . . . 749.6 Temperature distribution within a zone . . . . . . . . . . . . . . . . . . . 749.7 Purity of JP-10 and N2 . . . . . . . . . . . . . . . . . . . . . . . . . . . . 749.8 Buret level reading . . . . . . . . . . . . . . . . . . . . . . . . . . . . . . 759.9 Tubing surface reactivity . . . . . . . . . . . . . . . . . . . . . . . . . . . 759.10 Number of active sites due to ion exchange and regeneration . . . . . . . 759.11 Variation in zeolite bed height and corresponding level of packing . . . . 759.12 Distance from fuel inlet to beginning of zeolite bed . . . . . . . . . . . . 769.13 Leakage between accumulator wall and internal piston . . . . . . . . . . . 769.14 Residual JP-10 in system . . . . . . . . . . . . . . . . . . . . . . . . . . . 769.15 Mass conversion fraction . . . . . . . . . . . . . . . . . . . . . . . . . . . 779.16 Mole ratio . . . . . . . . . . . . . . . . . . . . . . . . . . . . . . . . . . . 779.17 Average molar mass of products . . . . . . . . . . . . . . . . . . . . . . . 77
10 Feasibility of partial oxidation studies 7810.1 Required reactor modifications . . . . . . . . . . . . . . . . . . . . . . . . 78
10.1.1 Temperature limitations . . . . . . . . . . . . . . . . . . . . . . . 7910.1.2 Catalyst . . . . . . . . . . . . . . . . . . . . . . . . . . . . . . . . 8010.1.3 Instrumentation . . . . . . . . . . . . . . . . . . . . . . . . . . . . 8110.1.4 Air addition . . . . . . . . . . . . . . . . . . . . . . . . . . . . . . 81
10.2 Design constraints and preliminary design of partial oxidation reactor . . 8210.3 Value to the overall program . . . . . . . . . . . . . . . . . . . . . . . . . 84
11 Pre-mixed partial oxidation experiments 8611.1 Experimental facility and procedure . . . . . . . . . . . . . . . . . . . . . 8611.2 Pressure and product composition results . . . . . . . . . . . . . . . . . . 8711.3 Flame speed results . . . . . . . . . . . . . . . . . . . . . . . . . . . . . . 9711.4 Conclusion . . . . . . . . . . . . . . . . . . . . . . . . . . . . . . . . . . . 99
iii

12 Conclusions 100
A Timeline 110
B Schlieren images of flames in partial oxidation study 114
iv
List of Figures
1 Cell widths of JP-10 and propane mixtures as a function of equivalenceratio. . . . . . . . . . . . . . . . . . . . . . . . . . . . . . . . . . . . . . 2
2 Structure of JP-10 (C10H16) molecule. . . . . . . . . . . . . . . . . . . . 33 Faujausite zeolite framework viewed along [111]. . . . . . . . . . . . . . 44 ZSM-5 zeolite framework viewed along [010]. . . . . . . . . . . . . . . . 55 Photograph of reactor panel with gas chromatograph. . . . . . . . . . . . 66 Original conceptual schematic of reactor panel. Refer to Fig. 7 for schematic
drawn to scale and Fig. 9 for schematic of redesigned system. . . . . . . . 77 Schematic of reactor panel drawn to scale. . . . . . . . . . . . . . . . . . 88 Liquid fuel metering pump calibration curve. . . . . . . . . . . . . . . . 99 Schematic of reactor panel with redesigned evaporator. Components drawn
to scale. . . . . . . . . . . . . . . . . . . . . . . . . . . . . . . . . . . . . 1010 Photograph of inside of the reactor. . . . . . . . . . . . . . . . . . . . . . 1111 Schematic of tubes and spacers that contain zeolite pellets. . . . . . . . 1112 Schematic of reactor panel illustrating boundaries of the four heating
zones. . . . . . . . . . . . . . . . . . . . . . . . . . . . . . . . . . . . . . 1413 Wiring diagrams for the four heating zones. . . . . . . . . . . . . . . . . 1514 Wiring diagram for electronic pressure gauges. . . . . . . . . . . . . . . 1515 Detector output for a) ideal operation and b) real operation with peak
broadening. . . . . . . . . . . . . . . . . . . . . . . . . . . . . . . . . . . 1816 Agilent schematic of gas sampling valve in the LOAD position. Copied
from Agilent paperwork provided with the GC. . . . . . . . . . . . . . . 2117 Temperature versus time plot of the GC oven program. . . . . . . . . . 2218 GC chromatograph with liquid injection of 1µl of JP-10. . . . . . . . . . 2419 flowrate through the GC sampling valve as a function of accumulator pres-
sure. . . . . . . . . . . . . . . . . . . . . . . . . . . . . . . . . . . . . . . 2520 Sample chromatogram of gaseous injection samples of alkanes and JP-10
with region boundaries. . . . . . . . . . . . . . . . . . . . . . . . . . . . 2721 Boiling temperature of alkanes and JP-10 versus measured retention times. 2822 Experimental JP-10 vapor pressure data with correlation given in Eq. 12. 3123 Example: Moles injected into system as a function of time. . . . . . . . 3624 Example: Instantaneous accumulator piston position. Data points are
values expected for a 3.2 mole ratio reaction. Line is “zero conversion”expectation. . . . . . . . . . . . . . . . . . . . . . . . . . . . . . . . . . 37
25 Example: Product moles in system as a function of time. . . . . . . . . 3726 Examples of finding mole ratio np/nf as the slope of the line. Two cases are
shown. The solid line is an example of no conversion np/nf =1. The pointsare for a conversion ratio of np/nf = 3.2, corresponding to Equation 13, 38
27 Calculated moles of products versus injected moles for thermal decompo-sition tests with a liquid fuel flow rate of 2.3 g/hr (FP = 25). . . . . . . . 40
v

28 Calculated moles of products versus injected moles for thermal decompo-sition tests with a liquid fuel flowrate of 6.2 g/hr (FP = 70). . . . . . . . 41
29 Calculated moles of products versus injected moles for thermal decompo-sition tests with a liquid fuel flowrate of 10.6 g/hr (FP = 125). . . . . . . 41
30 Calculated moles of products versus injected moles averaged over all ther-mal decomposition tests for the different liquid fuel flowrates. . . . . . . . 42
31 Ratio of product moles to injected moles for each thermal decompositiontest at the different liquid fuel flowrates. Straight line represents the av-erage mole ratio. . . . . . . . . . . . . . . . . . . . . . . . . . . . . . . . 43
32 GC chromatogram (Test 0807C-B) representative of thermal decomposi-tion test. . . . . . . . . . . . . . . . . . . . . . . . . . . . . . . . . . . . . 43
33 Product composition of test 0819B:E-A at a fuel flowrate of 2.3 g/hr (FP= 25). C10 products are omitted for clarity. . . . . . . . . . . . . . . . . 44
34 Product composition of test 1001B:D-A at a fuel flowrate of 2.3 g/hr (FP= 25). C10 products are omitted for clarity. . . . . . . . . . . . . . . . . 44
35 Product composition of test 1001F:H-E at a fuel flowrate of 2.3 g/hr (FP= 25). C10 products are omitted for clarity. . . . . . . . . . . . . . . . . 45
36 Product composition of test 0818E:G at a fuel flowrate of 6.2 g/hr (FP =70). C10 products are omitted for clarity. . . . . . . . . . . . . . . . . . . 45
37 Product composition of test 0818B:D-A at a fuel flowrate of 10.6 g/hr (FP= 125). C10 products are omitted for clarity. . . . . . . . . . . . . . . . . 46
38 Average product composition for thermal decomposition tests at a liquidfuel flowrate of 2.3 g/hr (FP = 25). C10 products are omitted for clarity. 46
39 Average product composition for thermal decomposition tests at a liquidfuel flowrate of 6.2 g/hr (FP = 70). C10 products are omitted for clarity. 47
40 Average product composition for thermal decomposition tests at a liquidfuel flowrate of 10.6 g/hr (FP = 125). C10 products are omitted for clarity. 47
41 Overall product composition for thermal decomposition tests averaged overindividual tests and multiple GC samples. C10 products are omitted forclarity. . . . . . . . . . . . . . . . . . . . . . . . . . . . . . . . . . . . . . 48
42 Observed mole ratio np/nf as a function of the mass conversion fraction yfor the thermal decomposition tests. . . . . . . . . . . . . . . . . . . . . . 48
43 Comparison of moles of product to moles of injected JP-10 with HY zeolitewith active sites and coked HY zeolite. Fuel flowrate is 10.6 g/hr (FP =125). Reactor temperature in zone 2 was 500◦C. . . . . . . . . . . . . . 51
44 Comparison of moles of product to moles of injected JP-10 from tests withthe first and second batches of HY zeolite. Fuel flowrate is 2.3 g/hr (FP= 25). Reactor temperature in zone 2 was 500◦C. . . . . . . . . . . . . . 52
45 Comparison of moles of product to moles of injected JP-10 from tests withthe first batch and regenerated first batch of HY zeolite. Fuel flowrate is10.6 g/hr (FP = 125). Reactor temperature in zone 2 was 500◦C. . . . . 52
vi

46 Product composition of test 0524D,G,I with the first batch of HY zeoliteat a fuel flowrate of 10.6 g/hr (FP = 125). The C10 products are omittedfor clarity. . . . . . . . . . . . . . . . . . . . . . . . . . . . . . . . . . . 53
47 Product composition of test 0524K-J with the first batch of HY zeolitethat was coked at a fuel flowrate of 6.2 g/hr (FP = 70). The C10 productsare omitted for clarity. . . . . . . . . . . . . . . . . . . . . . . . . . . . . 53
48 Product composition of test 0815B:E-A with the first batch of HY zeoliteat a fuel flowrate of 2.3 g/hr (FP = 25). The C10 products are omittedfor clarity. . . . . . . . . . . . . . . . . . . . . . . . . . . . . . . . . . . 54
49 Product composition of test 0918B:E-A with the first batch of HY zeoliteat a fuel flowrate of 2.3 g/hr (FP = 25). The C10 products are omittedfor clarity. . . . . . . . . . . . . . . . . . . . . . . . . . . . . . . . . . . . 54
50 Product composition of test 0916B:E-A with the second batch of HY zeo-lite at a fuel flowrate of 2.3 g/hr (FP = 25). The C10 products are omittedfor clarity. . . . . . . . . . . . . . . . . . . . . . . . . . . . . . . . . . . . 55
51 Product composition of test 0808B:D-A with the first batch of HY zeoliteat a fuel flowrate of 10.6 g/hr (FP = 125). The C10 products are omittedfor clarity. . . . . . . . . . . . . . . . . . . . . . . . . . . . . . . . . . . . 55
52 Product composition of test 0827B:D-A with the regenerated first batchof HY zeolite at a fuel flowrate of 10.6 g/hr (FP = 125). The C10 productsare omitted for clarity. . . . . . . . . . . . . . . . . . . . . . . . . . . . . 56
53 Comparison of product compositions between the first and second batchesof HY zeolite. Compositions are averaged over multiple samples per testand multiple tests. Fuel flowrate is 2.3 g/hr (FP = 25). The C10 productsare omitted for clarity. . . . . . . . . . . . . . . . . . . . . . . . . . . . . 56
54 Comparison of product compositions between the first batch and regener-ated first batch of HY zeolite. Compositions are averaged over multiplesamples per test and multiple tests. Fuel flowrate is 10.6 g/hr (FP = 125).The C10 products are omitted for clarity. . . . . . . . . . . . . . . . . . 57
55 Average mole balances of all HY zeolite batches at a reactor tempera-ture of 500◦C for fuel flowrates of 2.3 and 10.6 g/hr (FP = 25 and 125respectively). . . . . . . . . . . . . . . . . . . . . . . . . . . . . . . . . . 57
56 Ratio of product moles to injected moles for tests with HY zeolite. Theaverage ratio is denoted by a straight line. This data is not corrected forthermal cracking. . . . . . . . . . . . . . . . . . . . . . . . . . . . . . . . 58
57 Ratio of product moles to injected moles corrected for conversion due tothermal cracking for tests with HY zeolite. . . . . . . . . . . . . . . . . . 58
58 Averaged product composition as a function of liquid fuel flowrate for HYzeolite. The C10 products are omitted for clarity. . . . . . . . . . . . . . . 59
59 Ratio of product moles to injected moles for tests with different zeolites. 5960 Product composition of test 0922D:F-C with USY zeolite at a fuel flowrate
of 2.3 g/hr (FP = 25). The C10 products are omitted for clarity. . . . . . 60
vii
61 Product composition of test 0920B:D-A with Beta zeolite at a fuel flowrateof 2.3 g/hr (FP = 25). The C10 products are omitted for clarity. . . . . . 61
62 Average product composition comparing different zeolites at a fuel flowrateof 2.3 g/hr (FP = 25). The C10 products omitted for clarity. . . . . . . . 61
63 Average ratio of product moles to the injected moles for the thermal crack-ing and catalytic cracking tests at a fuel flowrate of 2.3 g/hr (FP = 25). 62
64 Average ratio of product moles to the injected moles for the thermal crack-ing and catalytic cracking tests at a fuel flowrate of 10.6 g/hr (FP = 125). 63
65 Overall average product distributions for tests with and without catalystinstalled in the reactor at a fuel flowrate of 2.3 g/hr (FP = 25). The C10
products are omitted for clarity. . . . . . . . . . . . . . . . . . . . . . . . 6366 Overall average product distributions for tests with and without catalyst
installed in the reactor at a fuel flowrate of 10.6 g/hr (FP = 125). TheC10 products are omitted for clarity. . . . . . . . . . . . . . . . . . . . . 64
67 Comparison of moles of product to moles of injected JP-10 in a systemwith HY zeolite at different system pressures. Fuel flowrate is 2.3 g/hr(FP = 25). . . . . . . . . . . . . . . . . . . . . . . . . . . . . . . . . . . . 64
68 Product composition of test 0913B:D-A with HY zeolite, a system pressureof 400 kPa, and a fuel flowrate of 2.3 g/hr (FP = 25). The C10 productsare omitted for clarity. . . . . . . . . . . . . . . . . . . . . . . . . . . . . 65
69 Overall average product composition to determine effect of system pressurewith HY zeolite at a fuel flowrate of 2.3 g/hr (FP = 25). The C10 productsare omitted for clarity. . . . . . . . . . . . . . . . . . . . . . . . . . . . . 65
70 Comparison of moles of product to moles of injected JP-10 in a system withHY zeolite at different reactor temperatures. Fuel flowrate is 10.6 g/hr (FP= 125). . . . . . . . . . . . . . . . . . . . . . . . . . . . . . . . . . . . . 66
71 Ratio of moles of products to injected moles as a function of reactor tem-perature. Fuel flowrate is 2.3 g/hr (FP = 25). . . . . . . . . . . . . . . . 66
72 Product composition of test 0924B:D-A with HY zeolite, a reactor tem-perature of 425◦C, and a fuel flowrate of 10.6 g/hr (FP = 125). The C10
products are omitted for clarity. . . . . . . . . . . . . . . . . . . . . . . . 6773 Product composition of test 0906B:D-A with HY zeolite, a reactor tem-
perature of 350◦C, and a fuel flowrate of 10.6 g/hr (FP = 125). The C10
products are omitted for clarity. . . . . . . . . . . . . . . . . . . . . . . . 6774 Product composition of test 0926B:D-A with HY zeolite, a reactor tem-
perature of 300◦C, and a fuel flowrate of 10.6 g/hr (FP = 125). The C10
products are omitted for clarity. . . . . . . . . . . . . . . . . . . . . . . 6875 Product composition of test 0909B:D-A with HY zeolite, a reactor tem-
perature of 250◦C, and a fuel flowrate of 10.6 g/hr (FP = 125). The C10
products are omitted for clarity. . . . . . . . . . . . . . . . . . . . . . . 6876 Averaged product distributions for tests with HY zeolite and different
reactor temperatures. The C10 products are omitted for clarity. . . . . . 69
viii
77 Measured mole ratio np/nf as a function of the mass conversion fractiony for the catalytic cracking tests. . . . . . . . . . . . . . . . . . . . . . . 72
78 Adiabatic flame temperatures for complete combustion of mixtures of JP-10 and air initially at 300◦C and 100 kPa. Equivalence ratio defines theinitial mixture as φC10H16 + 14O2 + 52.64N2 . . . . . . . . . . . . . . . . 79
79 Equilibrium product distribution for complete partial oxidation of JP-10mixed with air. Initial temperature is 300◦C and pressure is 100 kPa.Equivalence ratio defines the initial mixture as φC10H16 + 14O2 + 52.64N2 . 80
80 Estimated ratio of product to reactant mole amount as a function of equiv-alence ratio for JP-10-air mixtures. Equilibrium partial oxidation of JP-10-air mixtures, initial temperature of 300◦C, and pressure of 100 kPa.Equivalence ratio defines the initial mixture as φC10H16 + 14O2 + 52.64N2 . 81
81 Constant volume combustion vessel for pre-mixed partial oxidation exper-iments. . . . . . . . . . . . . . . . . . . . . . . . . . . . . . . . . . . . . . 86
82 Pressure histories of the first burn for φ equal to 1, 2, 3, 4, and 5. . . . . 8883 Pressure histories of the first burn for φ equal to 2.5, 3.5, and 4.5. . . . . 8984 Equilibrium predictions and experimental data for the peak pressure rise
in the first burn ∆P1 as a function of equivalence ratio. . . . . . . . . . 9085 Normalized moles of products for C10H16 + n(O2 + 3.76N2) as a function
of the equivalence ratio. N2 product moles are omitted for clarity. Equilib-rium computations under adiabatic, constant volume complete combustionconditions. . . . . . . . . . . . . . . . . . . . . . . . . . . . . . . . . . . . 91
86 Predicted and experimental values of P2/P1 as a function of equivalenceratio. . . . . . . . . . . . . . . . . . . . . . . . . . . . . . . . . . . . . . 91
87 Equilibrium predictions of the maximum temperature during the first burnas a function of equivalence ratio. Adiabatic, constant volume, completecombustion process. . . . . . . . . . . . . . . . . . . . . . . . . . . . . . . 92
88 Normalized moles of cooled products calculated with equilibrium concen-trations as a function of the first burn equivalence ratio. N2 product molesare omitted for clarity. . . . . . . . . . . . . . . . . . . . . . . . . . . . . 93
89 Pressure histories of the second burn for φ equal to 2.5, 3.5, and 4.5. . . . 9490 Pressure histories of the second burn for φ equal to 3 and 4. . . . . . . . 9491 Predicted and experimental values of ∆P2 as a function of equivalence
ratio. . . . . . . . . . . . . . . . . . . . . . . . . . . . . . . . . . . . . . 9592 Predicted and experimental effectiveness values as a function of the first
burn equivalence ratio. . . . . . . . . . . . . . . . . . . . . . . . . . . . 9593 Normalized product moles of second burn with reactants calculated using
equilibrium concentrations as a function of the first burn equivalence ratio.N2 product moles are omitted for clarity. . . . . . . . . . . . . . . . . . 96
94 Normalized product moles of second burn with reactants calculated usingfrozen chemistry as a function of the first burn equivalence ratio. N2
product moles are omitted for clarity. . . . . . . . . . . . . . . . . . . . 96
ix

95 Predictions of the maximum temperature during the second burn as afunction of equivalence ratio. . . . . . . . . . . . . . . . . . . . . . . . . 97
96 Burning velocity as a function of time for a stoichiometric mixture of JP-10in air at initial conditions of 100 kPa and 380 K. . . . . . . . . . . . . . . 98
97 Laminar burning velocity as a function of the flame stretch for a stoichio-metric mixture of JP-10 in air at initial conditions of 100 kPa and 380 K. 99
98 Mole ratio as a function of the mass conversion fraction for the catalyticcracking tests. . . . . . . . . . . . . . . . . . . . . . . . . . . . . . . . . 104
99 Successive images of first burn with an initial mixture of C10H16 + 14(O2
+ 3.76N2) at P1 = 96 kPa and initial temperature of 380 K. . . . . . . . 115100 Successive images of first burn with an initial mixture of 3C10H16 + 14(O2
+ 3.76N2) at P1 = 33 kPa and initial temperature of 380 K. . . . . . . . 116101 Successive images of second burn with an initial first-burn mixture of
3C10H16 + 14(O2 + 3.76N2) at P2 = 106.4 kPa and initial temperature of380 K. . . . . . . . . . . . . . . . . . . . . . . . . . . . . . . . . . . . . . 117
102 Successive images of first burn with an initial mixture of 5C10H16 + 14(O2
+ 3.76N2) at P1 = 20 kPa and initial temperature of 380 K. . . . . . . . 118
x

List of Tables
1 Pore diameters of common zeolites. . . . . . . . . . . . . . . . . . . . . . 42 Temperature distribution measured on accumulator surface after 280 min-
utes of heating time. . . . . . . . . . . . . . . . . . . . . . . . . . . . . . 133 Panel operating temperatures. . . . . . . . . . . . . . . . . . . . . . . . . 144 Edit Parameters - Valve Menu. . . . . . . . . . . . . . . . . . . . . . . . 205 Edit Parameters - Inlet Menu. . . . . . . . . . . . . . . . . . . . . . . . . 216 Edit Parameters - Column Menu. . . . . . . . . . . . . . . . . . . . . . . 227 Edit Parameters - Detector. . . . . . . . . . . . . . . . . . . . . . . . . . 238 Summary of all GC characterization tests with liquid injection. Tests with
specified dilutions were made with JP-10 in hexane. Refer to Tables 4 - 7for GC operating conditions not specified here. . . . . . . . . . . . . . . . 26
9 Boiling temperature and retention times of tested compounds. . . . . . . 2710 Region boundaries for peak summation of compounds with same carbon
number. . . . . . . . . . . . . . . . . . . . . . . . . . . . . . . . . . . . . 2811 Summary of all GC characterization tests with gas injection. Refer to
Tables 4 - 7 for GC operating conditions not specified here. . . . . . . . 2912 Reactor system temperature distribution in ◦C. Thermocouple positions
refer to numbers on Fig. 7. † For the Oct. 11 test, the thermocouple inposition 9a was moved to the connection between the reactor system andthe GC denoted by position 9b in Fig. 7. . . . . . . . . . . . . . . . . . . 30
13 Tabulated vapor pressure data using Eq. 12. . . . . . . . . . . . . . . . . 3214 Overall average percent conversion of all thermal decomposition tests for
the different liquid fuel flowrates. . . . . . . . . . . . . . . . . . . . . . . 4415 Summary of all thermal decomposition tests and corresponding GC sam-
ples. The reactor temperature in zone 2 was 500◦C. Estimated uncertaintyin np/nf is ±6.4% and uncertainty in Avg % wt. Conversion y is 12.5%. 49
16 Percent conversion as a function of reactor temperature. . . . . . . . . . 6917 Summary of all catalytic cracking tests and GC samples. Estimated un-
certainty in np/nf is ±6.4% and uncertainty in Avg % wt. Conversion yis 12.5%. . . . . . . . . . . . . . . . . . . . . . . . . . . . . . . . . . . . . 71
18 Predicted mass flowrates, m, for JP-10 mixtures. . . . . . . . . . . . . . . 8419 Partial pressures of the initial mixture of the first burn for varying equiv-
alence ratios. . . . . . . . . . . . . . . . . . . . . . . . . . . . . . . . . . 8720 Summary of the initial, maximum and final pressures for the first and
second burns . . . . . . . . . . . . . . . . . . . . . . . . . . . . . . . . . 8821 Major results of thermal cracking tests. . . . . . . . . . . . . . . . . . . . 10122 Effect of zeolite activity on conversion. . . . . . . . . . . . . . . . . . . . 10123 Effect of fuel flowrate on catalytic cracking tests with HY zeolite at a
reactor temperature of 500◦C. . . . . . . . . . . . . . . . . . . . . . . . . 10124 Effect of zeolite type on catalytic cracking tests at a reactor temperature
of 500◦C and fuel flowrate of 2.3 g/hr. . . . . . . . . . . . . . . . . . . . 102
xi

25 Effect of system pressure on catalytic cracking tests with HY zeolite at areactor temperature of 500◦C and a fuel flowrate of 10.6 g/hr. . . . . . . 102
26 Effect of reactor temperature on catalytic cracking tests with HY zeoliteat a fuel flowrate of 10.6 g/hr. . . . . . . . . . . . . . . . . . . . . . . . . 103
27 Effect of catalytic and thermal cracking on conversion. . . . . . . . . . . 103
xii
Nomenclature
A component amount from integrated detector signalC constant of integration for vapor pressure curveCM component concentration in the mobile phaseCS component concentration in the solid phaseD inner diameter of accumulatorE product expansion ratioHfg heat of vaporizationHpiston measured height of accumulator pistonK distribution coefficientKs flame stretch factorL length of capillary columnLM Markstein numberMf mass of liquid fuel injected into systemMp mass of products in systemnf moles of liquid fuel injected into systemnP moles of products in systemP pressureP1 initial pressure before first burnP2 initial pressure before second burn(Pmax)1 maximum pressure of first burn(Pmax)2 maximum pressure of second burn(Pp)1 final pressure of cooled products after first burnPsat saturation pressureQ heat release of mixtureR universal gas constantRc column resolutionRf instantaneous radius of spherical flameS detector signalSu laminar burning velocitySu
◦ unstretched laminar burning velocityt timeT temperaturetR component retention timeTsat saturation temperatureu linear velocity of mobile phaseuu fluid velocityU rate of travel for a component molecule through the capillary columnV volume of combustion vesselVf measured flame velocity
xiii
VM volume of mobile phase in the capillary columnVS volume of stationary phase in the capillary columnV 0
sys volume of system plumbing upstream of accumulator valvesVtotal total volume of system plumbing and instantaneous accumulator volumeWf molecular weight of liquid fuel∆Vf volume of liquid fuel injected into systemε effectiveness factorφ equivalence ratioρf density of liquid fuelσ detector signal peak width at half height divided by 2.357τM fraction of time a molecule spends in the mobile phase
xiv

1 Introduction
Pulse detonation engine (PDE) research has primarily been conducted with hydrocarbonfuels such as acetylene, ethylene, and propane due to their ease of use in laboratory exper-iments. These light gaseous fuels have lower boiling points and reduced critical energiesof initiation than storable liquid hydrocarbon fuels (i.e., JP-10 and Jet A) eliminatingthe need for high energy ignition systems and heated test facilities. However, storableliquid hydrocarbon fuels are probably a necessity in propulsive applications. Gaseousfuels require special storage and dispensing facilities which reduce the available payloadcapacity. Gaseous fuels can not meet the engine cooling requirements for operation atsupersonic flight speeds. Additionally, gaseous fuels pose severe explosion hazards incomparison with liquids. For all of these reasons, particularly the high energy densityand cooling capabilities, liquid hydrocabon fuels are essential for practical propulsionsystems. However, special techniques of initiation or fuel modification will be needed touse these fuels in PDE’s.
Previous experimental work [1, 2, 3] has been completed studying the detonationproperties of fuel additives such as methane, acetylene, ethers, and nitrates for sensitizingthe main fuel component. Other means of reducing the critical ignition energy for PDEapplications have included a separate driver section upstream of the main detonationtube. Under the correct conditions, a separate driver has enabled less sensitive mixturesto detonate; however, this method does not eliminate the need for a sensitive gaseous fueland oxidizer. This reduces the additional payload capacity gained by using the storableliquid hydrocarbon fuels with higher energy densities. If JP-10 is to be used directlyin hypersonic flight, temperatures are expected to be near or above the auto-ignitiontemperature of the fuel. Zhang et al. completed detonation studies of JP-10 vapordetonation near the auto-ignition temperature observing a significant increase in cell sizeand an increase in the initiation energy [4]. An alternative to pre-initiator systems ismodification of the fuel composition by catalytic cracking. This will produce a mixtureof molecules that are smaller than the parent molecule and hopefully, easier to detonate.
This research conducts experiments to thermally and catalytically crack JP-10 toquantify product species and concentrations. A chemical approach with respect to thereaction mechanisms and pathways is not studied here. Instead, these results determinethe feasibility of cracking reactions with JP-10 as a means of fuel sensitization for lowenergy detonation initiation in PDEs.
2 Hydrocarbon cracking
Hydrocarbon cracking (HC) is the process by which higher molecular weight hydrocar-bons are converted into lower molecular weight hydrocarbons through C-C bond fis-sion [5]. There are three types of HC, including thermal cracking or pyrolysis, catalyticcracking, and hydrocracking, which occur via different chemical pathways and reactionconditions. Pyrolysis typically occurs at temperatures greater than 1000 K [6]. Catalyticcracking occurs with a catalyst that comes into contact with the sample in a reactor.
1

There are many reactor types, including tubular, plug flow, mixed bed, and fluidizedbed. Reactor operating conditions can vary significantly depending on the catalyst andsample used. Most catalytic cracking reactions typically occur at temperatures between200 - 600◦C and pressures close to 1 atm. Hydrocracking occurs under high pressures,typically between 80 and 200 atm, in the presence of added hydrogen. Large pore zeoliteswith noble metals are used at operating temperatures between 270 and 450◦C [5].
JP-10, also called exo-tetrahydrodicyclopentadiene, is a single-component hydrocar-bon (Fig. 2) produced synthetically by the hydrogenation of dicyclopentadiene [7]. Itis a popular missile fuel because of its increased energy storage through strained cyclicgeometries [8] and is considered ideal for volume limited applications [7]. Little is knownof JP-10’s high temperature chemistry since few experiments identifying the crackingmechanisms have been completed. However, experiments on detonation pressure, deto-nation wave speed, and cell width have been completed in JP-10 mixtures and mixturesrepresentative of decomposed JP-10 [1]. Both the high initiation energy and large cellsize characteristic of JP-10 mixtures indicated low mixture sensitivity to detonation ini-tiation. JP-10 does have a similar cell size to propane (Fig. 1) with similar difficulties ininitiation. Schauer et al. [9] have achieved detonations in propane-air mixtures, but only
Equivalence ratio
Cel
lwid
th(m
m)
0.5 0.75 1 1.25 1.5
100
200
300
400
500
40
JP-10-air (100C): CIT ’00
JP-10-air (135C): Akbar et al. ’00C3H8-air (25C): Knystautas et al. ’84C3H8-air (25C): Tieszen et al. ’91C3H8-air (100C): Tieszen et al. ’91
Figure 1: Cell widths of JP-10 and propane mixtures as a function of equivalence ratio.
for a small range of equivalence ratios. For these reasons, we study hydrocarbon crackingas a method of increasing the mixture sensitivity and reducing the critical initiation en-ergy of JP-10 mixtures. Experimental capabilities of our system enable an investigationof HC by the thermal and catalytic cracking mechanisms. Hydrocracking was not studieddue to high reaction pressures and the need for excess hydrogen.
2.1 Thermal cracking
Thermal cracking of JP-10 can be split into two studies depending on the level of dissolvedoxygen in the fuel: oxidative and non-oxidative pyrolytic decomposition [7]. Experi-
2

Figure 2: Structure of JP-10 (C10H16) molecule.
ments [6] studying non-oxidative pyrolysis of JP-10 were completed in a flowing reactorwith residence times of approximately 2 ms and temperatures up to 1500 K. The exper-imental facility consisted of a heated quartz tube eliminating the possibility of surfacereactions. Product analysis with a GC-MS observed benzene at temperatures greaterthan 1250 K and cyclopentadiene below 1250 K [6]. Davidson et al. [8] investigatedJP-10 oxidative pyrolysis behind a reflected shock at conditions between 1.2 to 1.5 barand 1100 to 1700 K. The UV absorption cross-sections of the decomposition productsdid not show any benzene. This is possibly due to the short test time (∼50 µs) sincebenzene is expected to form through secondary chemical reactions at later times [8]. Theresults of these two studies are largely inconclusive due to varying test conditions andlittle knowledge of the radical reaction pathways.
Abbot and Wojciechowski illustrate the necessity of correcting catalytic cracking re-sults for thermal cracking as the chemical pathways may be affected [10]. Thus, wequantify JP-10 thermal cracking in our reactor for comparison with the catalytic crack-ing results.
2.2 Catalytic cracking with zeolites
The popularity of catalytic cracking increased during the 1960’s with the need to producehigh octane gasoline and hydrocarbons from methanol using synthetic zeolite catalysts.Those commercial processes that produce gasoline and high grade military fuels fromcrude oils typically use fluidized bed reactors containing a mixture of zeolite catalystand crude oil [5, 11]. The mixture passes through a heated reaction zone followed bya series of processes to recover the cracked products and zeolite. Because of significantcoke and deposit formation, the zeolite is regenerated under high temperatures between590 and 730◦C in an air purge before being mixed again with the crude oil feedstock atthe beginning of the process. Zeolite catalysts used in the harsh operating conditions ofheavy oil cracking are typically of the faujausite (FAU) structure [11].
Different zeolite types refer to a porous, crystalline alumniosilicate of a specific molec-ular structure. The HY zeolite is of the FAU structure. More generally, zeolites are
3

comprised of tetrahedral frameworks of AlO4 and SiO4 connected through shared oxygenatoms creating a secondary building unit. A zeolite unit cell is comprised of an integralnumber and a single type of these secondary building units [12]. The arrangement of thesecondary building units into rings results in the formation of channels, pores, and cageswith dimensions and orientations specific to a given zeolite type. These parameters thusdefine a zeolite’s reactivity and shape-selectivity. Because of the shared oxygen atoms,the framework possesses a net negative charge which is balanced by the addition of pro-tons. After proton addition, the zeolite becomes a strong Bronsted acid containing sitesfor hydrocarbon adsorption [13].
The channel dimensions are well-defined for such tetrahedrally-coordinated zeolitesenabling shape-selectivity of the cracking products. Molecules with dimensions largerthan the zeolite pore dimensions typically can not enter the channels and obtain accessto the internal active sites, but there are exceptions to this statement. Pore diametersof several common zeolite structures appear in Table 1. It is important to note thatthese dimensions can vary slightly depending on the zeolite’s hydration state and tem-perature [12]. FAU (Fig. 3) zeolites are commonly referred to as “large pore” zeolites
Zeolite Pore Diameter (A)Faujasite (FAU) 7.4
Beta (BEA) 7.6 to 5.5ZSM-5 (MFI) 5.1-5.6
Table 1: Pore diameters of common zeolites.
because they have supercages approximately 13 A in diameter which can accommodatelarge components [14]. ZSM-5 (Fig. 4) is referred to as an “intermediate pore” zeolite
Figure 3: Faujausite zeolite framework viewed along [111].
where the product distribution is restricted to compounds smaller than those of FAU,typically less than C11 [14]. Beta is an additional zeolite structure; however, there arefew documented experiments using Beta to catalytically crack hydrocarbons.
4
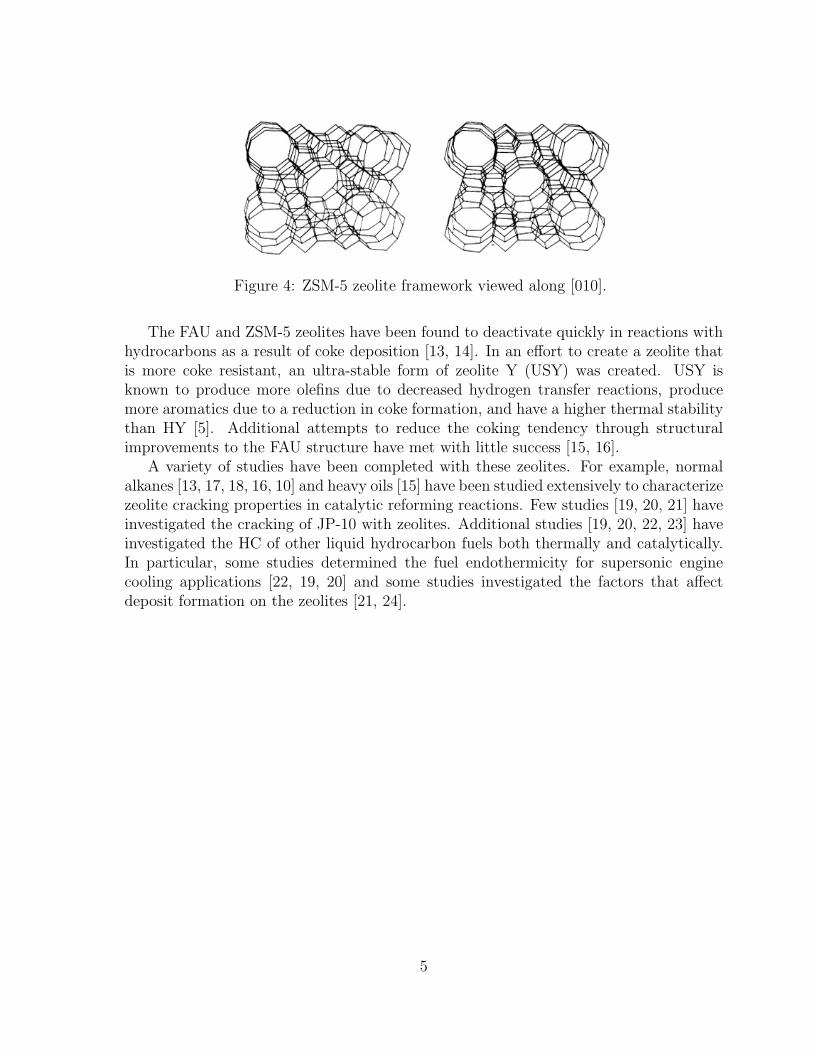
Figure 4: ZSM-5 zeolite framework viewed along [010].
The FAU and ZSM-5 zeolites have been found to deactivate quickly in reactions withhydrocarbons as a result of coke deposition [13, 14]. In an effort to create a zeolite thatis more coke resistant, an ultra-stable form of zeolite Y (USY) was created. USY isknown to produce more olefins due to decreased hydrogen transfer reactions, producemore aromatics due to a reduction in coke formation, and have a higher thermal stabilitythan HY [5]. Additional attempts to reduce the coking tendency through structuralimprovements to the FAU structure have met with little success [15, 16].
A variety of studies have been completed with these zeolites. For example, normalalkanes [13, 17, 18, 16, 10] and heavy oils [15] have been studied extensively to characterizezeolite cracking properties in catalytic reforming reactions. Few studies [19, 20, 21] haveinvestigated the cracking of JP-10 with zeolites. Additional studies [19, 20, 22, 23] haveinvestigated the HC of other liquid hydrocarbon fuels both thermally and catalytically.In particular, some studies determined the fuel endothermicity for supersonic enginecooling applications [22, 19, 20] and some studies investigated the factors that affectdeposit formation on the zeolites [21, 24].
5
3 Experimental setup
Design of the experimental facility began in the summer of 2000 and preliminary opera-tion began in the fall of 2001. Testing and modifications occurred from fall 2001 to fall2002. A timeline of activities is provided in Appendix A.
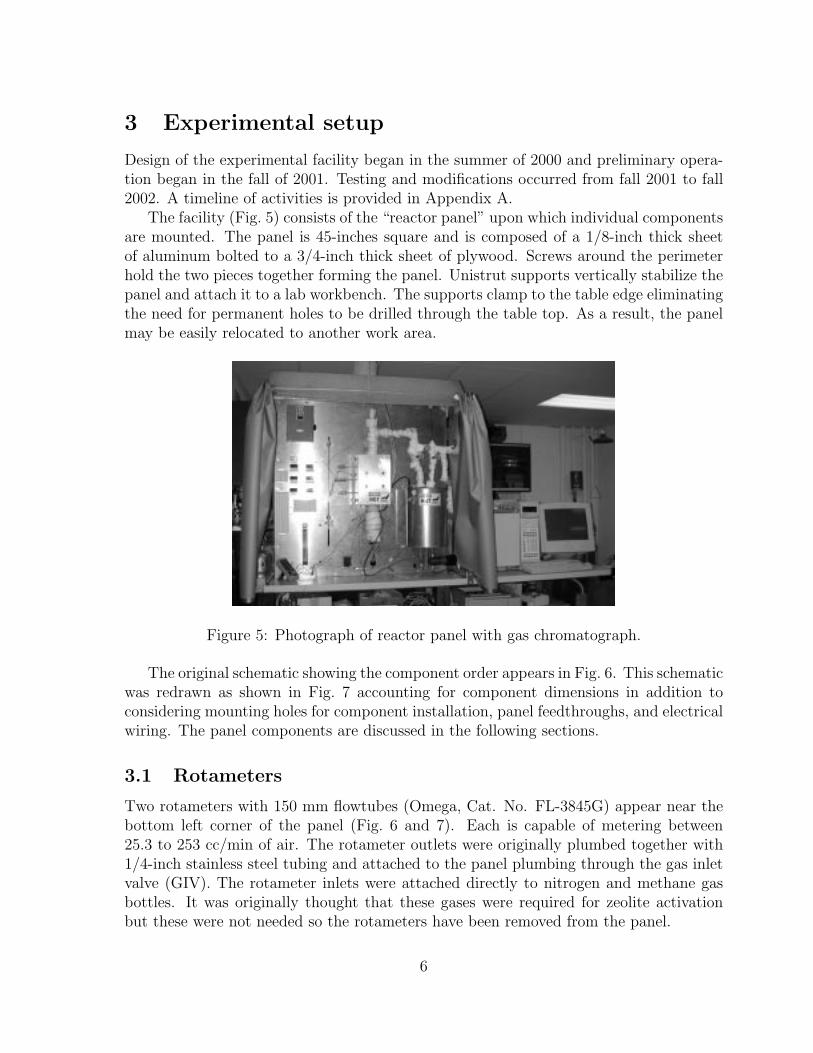
The facility (Fig. 5) consists of the “reactor panel” upon which individual componentsare mounted. The panel is 45-inches square and is composed of a 1/8-inch thick sheetof aluminum bolted to a 3/4-inch thick sheet of plywood. Screws around the perimeterhold the two pieces together forming the panel. Unistrut supports vertically stabilize thepanel and attach it to a lab workbench. The supports clamp to the table edge eliminatingthe need for permanent holes to be drilled through the table top. As a result, the panelmay be easily relocated to another work area.
Figure 5: Photograph of reactor panel with gas chromatograph.
The original schematic showing the component order appears in Fig. 6. This schematicwas redrawn as shown in Fig. 7 accounting for component dimensions in addition toconsidering mounting holes for component installation, panel feedthroughs, and electricalwiring. The panel components are discussed in the following sections.
3.1 Rotameters
Two rotameters with 150 mm flowtubes (Omega, Cat. No. FL-3845G) appear near thebottom left corner of the panel (Fig. 6 and 7). Each is capable of metering between25.3 to 253 cc/min of air. The rotameter outlets were originally plumbed together with1/4-inch stainless steel tubing and attached to the panel plumbing through the gas inletvalve (GIV). The rotameter inlets were attached directly to nitrogen and methane gasbottles. It was originally thought that these gases were required for zeolite activationbut these were not needed so the rotameters have been removed from the panel.
6
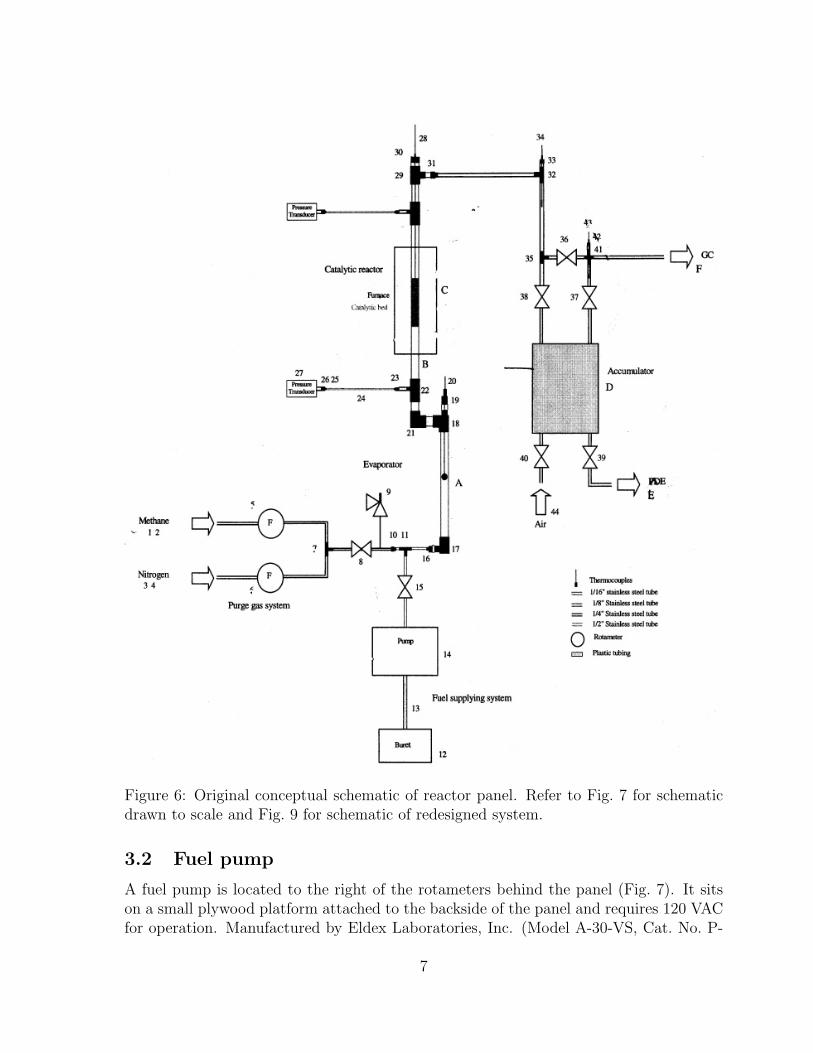
Figure 6: Original conceptual schematic of reactor panel. Refer to Fig. 7 for schematicdrawn to scale and Fig. 9 for schematic of redesigned system.
3.2 Fuel pump
A fuel pump is located to the right of the rotameters behind the panel (Fig. 7). It sitson a small plywood platform attached to the backside of the panel and requires 120 VACfor operation. Manufactured by Eldex Laboratories, Inc. (Model A-30-VS, Cat. No. P-
7

Figure 7: Schematic of reactor panel drawn to scale.
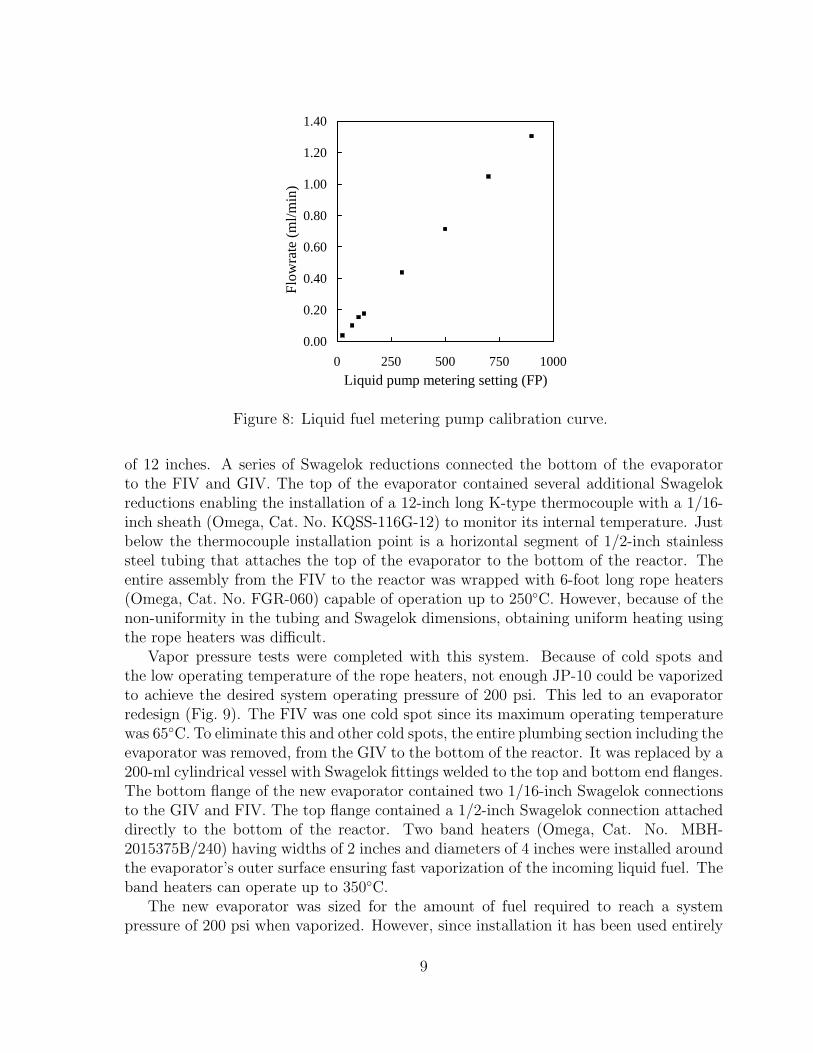
74450-00), the pump uses a sapphire piston to accurately meter liquids between 0.025and 1.5 ml/min. The liquid flowrate is controlled either manually by a dial, with settings(FP) between 000 and 999, or remotely via electrical connections. Manual operation wasused entirely throughout this study. Liquid fuel is supplied to the pump from a 25 mlglass buret (VWR, Cat. No. 17456-121) attached to the front of the panel. Flexibletubing provides the connection between the pump and the glass buret. The pump outletis attached to the fuel inlet valve (FIV) on the front of the panel with 1/16-inch stainlesssteel tubing. The FIV connects to the system between the GIV and the evaporator inlet.
If a liquid reservoir is applied to the pump inlet and no backpressure is supplied tothe pump outlet, the liquid will flow freely through the pump even when not poweredon. During testing, backpressure was supplied to the pump by pressurizing the systemwith nitrogen. It was determined that a pressure drop across the pump of at least 5 kPawas required to prevent unrestricted flow through the pump. Because the system mustbe pressurized with nitrogen, the product distributions are diluted.
Calibration of the pump was conducted by recording the change in the buret liquidlevel over time when attached to the system with an applied backpressure (Fig. 8).
3.3 Evaporator
The evaporator appears on the panel to the right of the FIV and vaporizes the liquid fuelmetered in by the fuel pump before it enters the reactor. In the original design (Fig. 6 and7), the evaporator consisted of single 1/2-inch diameter stainless steel tube with a length
8
0.00
0.20
0.40
0.60
0.80
1.00
1.20
1.40
0 250 500 750 1000
Liquid pump metering setting (FP)
Flo
wra
te (
ml/m
in)
Figure 8: Liquid fuel metering pump calibration curve.
of 12 inches. A series of Swagelok reductions connected the bottom of the evaporatorto the FIV and GIV. The top of the evaporator contained several additional Swagelokreductions enabling the installation of a 12-inch long K-type thermocouple with a 1/16-inch sheath (Omega, Cat. No. KQSS-116G-12) to monitor its internal temperature. Justbelow the thermocouple installation point is a horizontal segment of 1/2-inch stainlesssteel tubing that attaches the top of the evaporator to the bottom of the reactor. Theentire assembly from the FIV to the reactor was wrapped with 6-foot long rope heaters(Omega, Cat. No. FGR-060) capable of operation up to 250◦C. However, because of thenon-uniformity in the tubing and Swagelok dimensions, obtaining uniform heating usingthe rope heaters was difficult.
Vapor pressure tests were completed with this system. Because of cold spots andthe low operating temperature of the rope heaters, not enough JP-10 could be vaporizedto achieve the desired system operating pressure of 200 psi. This led to an evaporatorredesign (Fig. 9). The FIV was one cold spot since its maximum operating temperaturewas 65◦C. To eliminate this and other cold spots, the entire plumbing section including theevaporator was removed, from the GIV to the bottom of the reactor. It was replaced by a200-ml cylindrical vessel with Swagelok fittings welded to the top and bottom end flanges.The bottom flange of the new evaporator contained two 1/16-inch Swagelok connectionsto the GIV and FIV. The top flange contained a 1/2-inch Swagelok connection attacheddirectly to the bottom of the reactor. Two band heaters (Omega, Cat. No. MBH-2015375B/240) having widths of 2 inches and diameters of 4 inches were installed aroundthe evaporator’s outer surface ensuring fast vaporization of the incoming liquid fuel. Theband heaters can operate up to 350◦C.
The new evaporator was sized for the amount of fuel required to reach a systempressure of 200 psi when vaporized. However, since installation it has been used entirely
9

with the fuel pump under constant flowrate conditions.
Figure 9: Schematic of reactor panel with redesigned evaporator. Components drawn toscale.
3.4 Reactor
The reactor refers to the main component located in the center of the panel. The reactorcontains a 1/2-inch diameter stainless steel tube encased by two copper blocks. A totalof eight cartridge heaters (Omega, Cat. No. 3618K263) and three K-type thermocouplesare embedded in the copper blocks. This assembly is then enclosed in an aluminum boxpacked with insulation (Fig. 10). The vaporized JP-10 sample flows through the centraltube within which zeolite pellets may be installed.
The cartridge heaters can be connected such that operation at either 262 or 1028 Wwas possible. A switch enables the user to choose the desired operating power. Re-wiring inside the aluminum casing was required since the insulation on the ground wire,the insulation on the connections between the cartridge heater wires, and the power plugwere not rated for high temperature operation. Upon re-wiring, the reactor has operatedfor up to 36 continuous hours at 500◦C with the aluminum casing obtaining temperaturesof approximately 100◦C and significant surface oxidation occurring on the copper blocks.
The central tube of the reactor allows for the installation and interchanging of cat-alysts. The design to contain the catalyst consists of three tubes that fit within thecentral reactor tube. Spacers between the tubes hold porous metal disks which confinethe zeolite pellets inside the second spacer tube (Fig. 11). Stainless steel porous disks
10
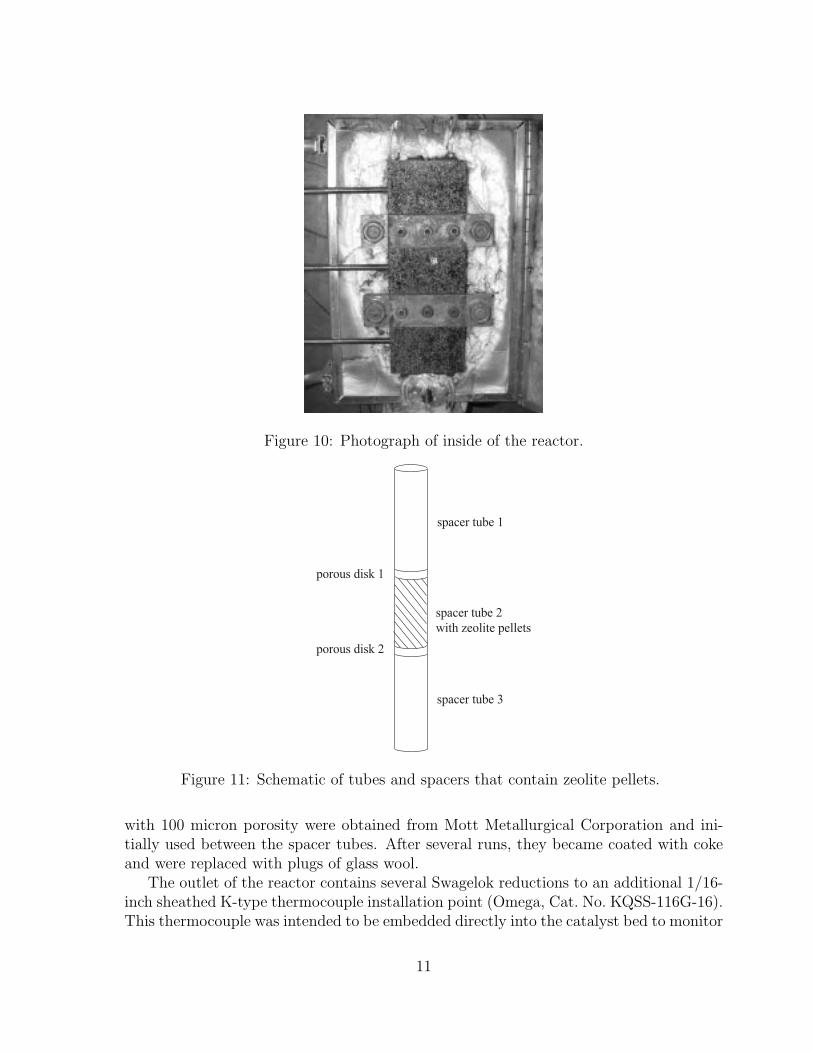
Figure 10: Photograph of inside of the reactor.
spacer tube 2
with zeolite pellets
spacer tube 1
spacer tube 3
porous disk 1
porous disk 2
Figure 11: Schematic of tubes and spacers that contain zeolite pellets.
with 100 micron porosity were obtained from Mott Metallurgical Corporation and ini-tially used between the spacer tubes. After several runs, they became coated with cokeand were replaced with plugs of glass wool.
The outlet of the reactor contains several Swagelok reductions to an additional 1/16-inch sheathed K-type thermocouple installation point (Omega, Cat. No. KQSS-116G-16).This thermocouple was intended to be embedded directly into the catalyst bed to monitor
11
reaction temperatures. However, because holes would have to be drilled into the porousmetal plates and the presence of the thermocouple made installation and removal of thecentral reactor tube difficult, it was removed. Since only a gram of zeolite pellets are usedand they are not tightly packed within the second spacer tube, a significant temperaturegradiant across the bed is not expected and the reactor wall temperature is monitoredinstead.
Two pressure gauges (Omega, Cat. No. PX302) were initially installed at the inlet andoutlet of the reactor (Fig. 7). Upon system redesign, the upstream gauge was removedbecause a negligibly small pressure drop was found to occur across the zeolite bed.
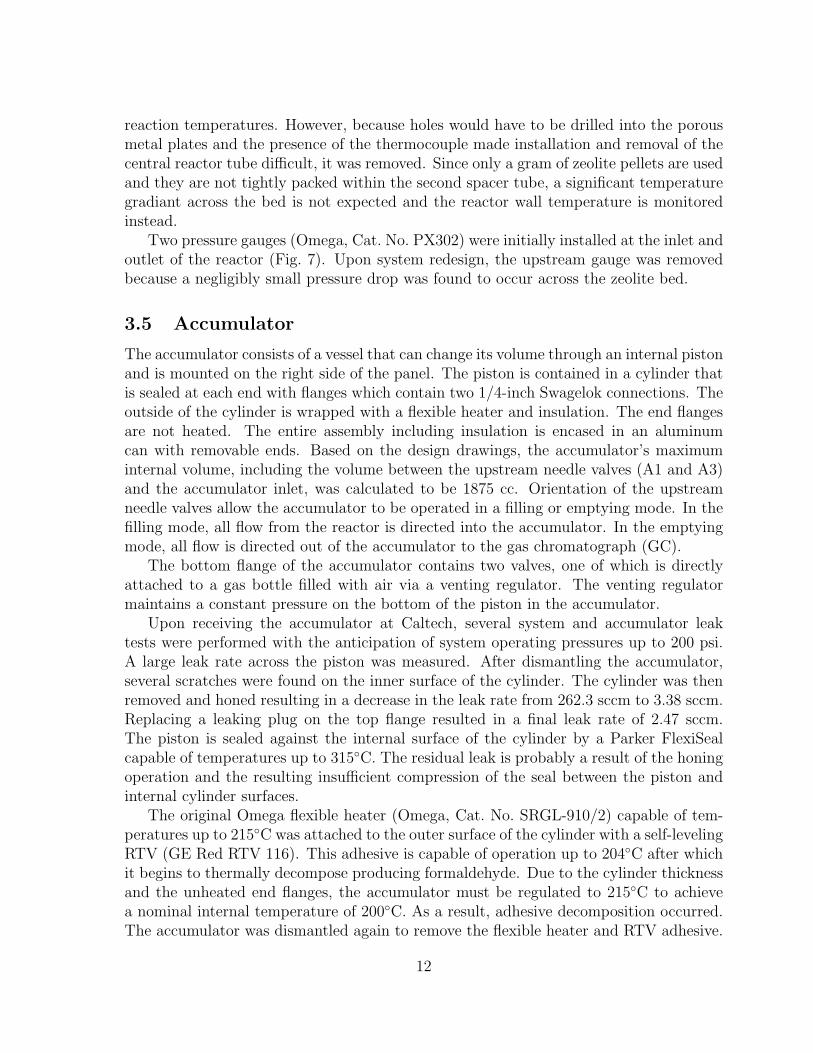
3.5 Accumulator
The accumulator consists of a vessel that can change its volume through an internal pistonand is mounted on the right side of the panel. The piston is contained in a cylinder thatis sealed at each end with flanges which contain two 1/4-inch Swagelok connections. Theoutside of the cylinder is wrapped with a flexible heater and insulation. The end flangesare not heated. The entire assembly including insulation is encased in an aluminumcan with removable ends. Based on the design drawings, the accumulator’s maximuminternal volume, including the volume between the upstream needle valves (A1 and A3)and the accumulator inlet, was calculated to be 1875 cc. Orientation of the upstreamneedle valves allow the accumulator to be operated in a filling or emptying mode. In thefilling mode, all flow from the reactor is directed into the accumulator. In the emptyingmode, all flow is directed out of the accumulator to the gas chromatograph (GC).
The bottom flange of the accumulator contains two valves, one of which is directlyattached to a gas bottle filled with air via a venting regulator. The venting regulatormaintains a constant pressure on the bottom of the piston in the accumulator.
Upon receiving the accumulator at Caltech, several system and accumulator leaktests were performed with the anticipation of system operating pressures up to 200 psi.A large leak rate across the piston was measured. After dismantling the accumulator,several scratches were found on the inner surface of the cylinder. The cylinder was thenremoved and honed resulting in a decrease in the leak rate from 262.3 sccm to 3.38 sccm.Replacing a leaking plug on the top flange resulted in a final leak rate of 2.47 sccm.The piston is sealed against the internal surface of the cylinder by a Parker FlexiSealcapable of temperatures up to 315◦C. The residual leak is probably a result of the honingoperation and the resulting insufficient compression of the seal between the piston andinternal cylinder surfaces.
The original Omega flexible heater (Omega, Cat. No. SRGL-910/2) capable of tem-peratures up to 215◦C was attached to the outer surface of the cylinder with a self-levelingRTV (GE Red RTV 116). This adhesive is capable of operation up to 204◦C after whichit begins to thermally decompose producing formaldehyde. Due to the cylinder thicknessand the unheated end flanges, the accumulator must be regulated to 215◦C to achievea nominal internal temperature of 200◦C. As a result, adhesive decomposition occurred.The accumulator was dismantled again to remove the flexible heater and RTV adhesive.
12
This heater was replaced with two 400 W flexible heaters (Watlow, Cat. No. 040200C1)capable of operation up to 260◦C and were clamped to the cylinder with a thin sheet ofaluminum, eliminating the need for any adhesive. The heater wire was replaced with hightemperature hookup wire capable of temperatures up to 250◦C (Omega, Cat. No. HTTG-1CU-314S). Since the end flanges are not directly heated, the steady state temperaturedistribution along the accumulator surface over time was measured. It was found thatthe end flanges were within 17◦C of the side wall temperature (Table 2).
Thermocouple position: Temperature (◦C)Top flange at r = 0 209Top flange at r = R 211
Bottom flange at r = 0 205Bottom flange at r = R 198Side wall at half height 215
Table 2: Temperature distribution measured on accumulator surface after 280 minutesof heating time.
The system plumbing connecting the reactor to the accumulator was 1/4-inch stainlesssteel tubing wrapped with rope heaters (Omega Cat. No. FGR-060) capable of operationup to 250◦C. A vacuum pump was attached to the system outlet in parallel with the GC(Fig. 9). A cold trap was installed to condense and recover the product gases.
3.6 Valves
Both needle valves and ball valves are used in the system. The ball valves originally usedwere Whitey, Cat. No. SS-42S4 and Whitey, Cat. No. SS-41S2 both capable of temper-atures up to 65◦C. These were later replaced with higher temperature valves (Swagelok,Cat. No. SS-60) at the vacuum pump isolation valve (VIV) except for the FIV which isnot heated. The needle valves (Whitey Cat. No. SS-1RS4) above the accumulator arecapable of operation up to 232◦C. The handles of the heated valves were replaced withphenolic valve stems preventing additional heat loss or cold spots.
3.7 Controllers and panel wiring
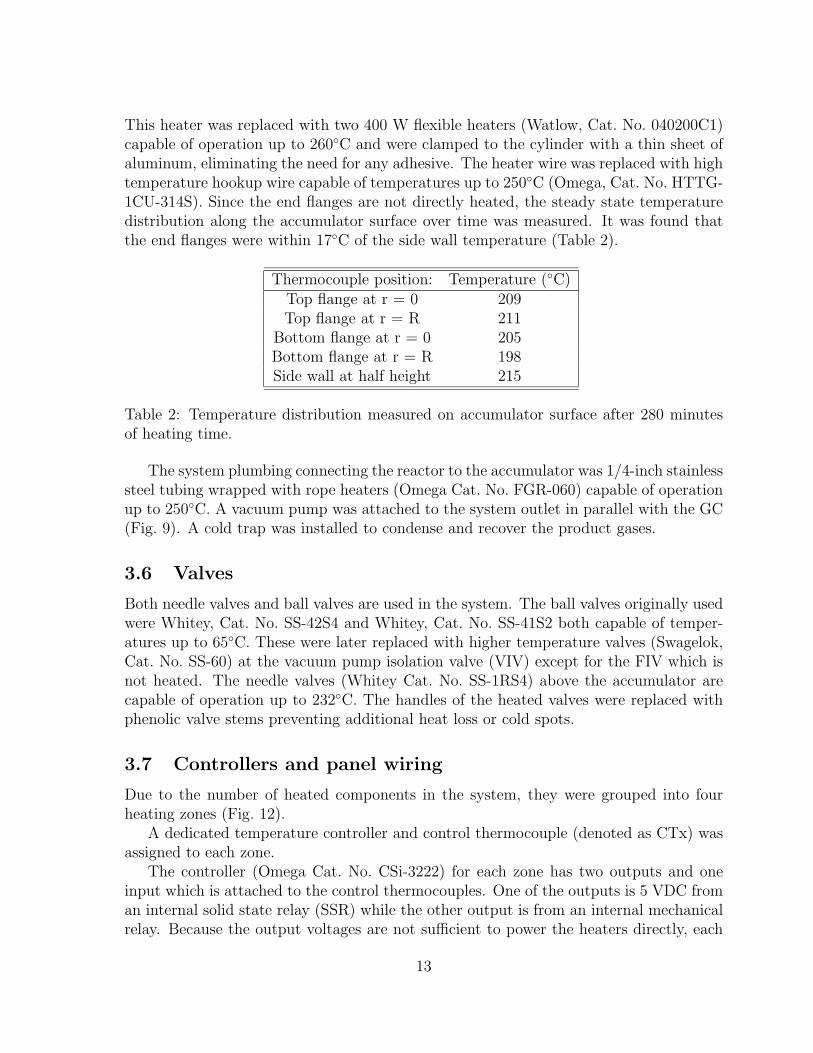
Due to the number of heated components in the system, they were grouped into fourheating zones (Fig. 12).
A dedicated temperature controller and control thermocouple (denoted as CTx) wasassigned to each zone.
The controller (Omega Cat. No. CSi-3222) for each zone has two outputs and oneinput which is attached to the control thermocouples. One of the outputs is 5 VDC froman internal solid state relay (SSR) while the other output is from an internal mechanicalrelay. Because the output voltages are not sufficient to power the heaters directly, each
13
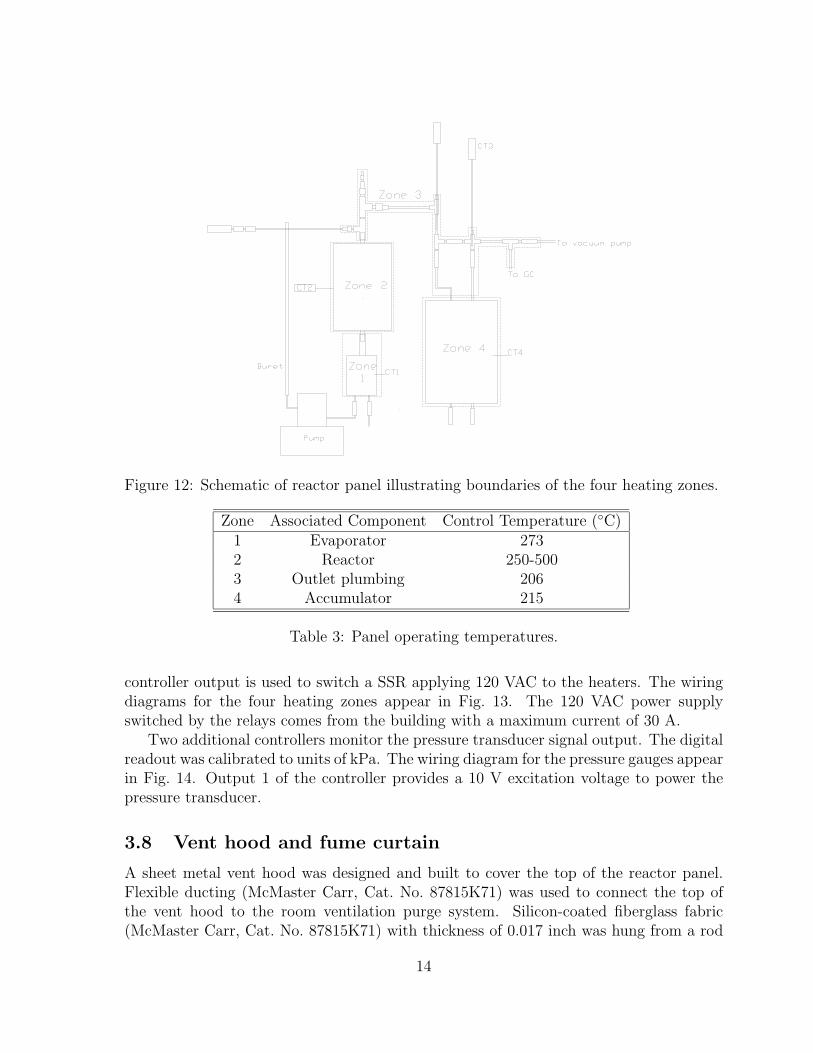
Figure 12: Schematic of reactor panel illustrating boundaries of the four heating zones.
Zone Associated Component Control Temperature (◦C)1 Evaporator 2732 Reactor 250-5003 Outlet plumbing 2064 Accumulator 215
Table 3: Panel operating temperatures.
controller output is used to switch a SSR applying 120 VAC to the heaters. The wiringdiagrams for the four heating zones appear in Fig. 13. The 120 VAC power supplyswitched by the relays comes from the building with a maximum current of 30 A.
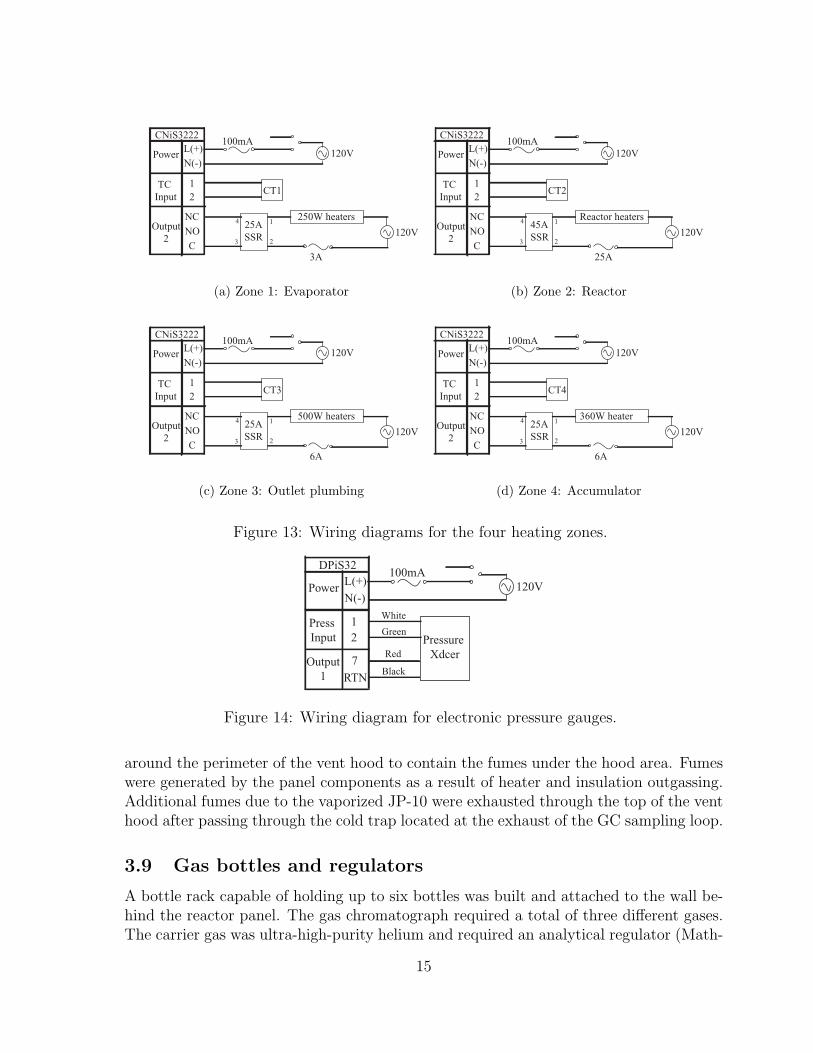
Two additional controllers monitor the pressure transducer signal output. The digitalreadout was calibrated to units of kPa. The wiring diagram for the pressure gauges appearin Fig. 14. Output 1 of the controller provides a 10 V excitation voltage to power thepressure transducer.
3.8 Vent hood and fume curtain
A sheet metal vent hood was designed and built to cover the top of the reactor panel.Flexible ducting (McMaster Carr, Cat. No. 87815K71) was used to connect the top ofthe vent hood to the room ventilation purge system. Silicon-coated fiberglass fabric(McMaster Carr, Cat. No. 87815K71) with thickness of 0.017 inch was hung from a rod
14
PowerN(-)L(+)
TC Input
Output2
NONC
C
21
CNiS3222
CT1
25ASSR
250W heaters
3A
120V1
23
4
100mA120V
(a) Zone 1: Evaporator
PowerN(-)L(+)
TC Input
Output2
NONC
C
21
CNiS3222
CT2
45ASSR
Reactor heaters
25A
120V1
23
4
100mA120V
(b) Zone 2: Reactor
PowerN(-)L(+)
TC Input
Output2
NONC
C
21
CNiS3222
CT3
25ASSR
500W heaters
6A
120V1
23
4
100mA120V
(c) Zone 3: Outlet plumbing
PowerN(-)L(+)
TC Input
Output2
NONC
C
21
CNiS3222
CT4
25ASSR
360W heater
6A
120V1
23
4
100mA120V
(d) Zone 4: Accumulator
Figure 13: Wiring diagrams for the four heating zones.
PowerN(-)L(+)
Press Input
Output1 RTN
7
21
DPiS32
Pressure Xdcer
100mA120V
Black
Red
Green
White
Figure 14: Wiring diagram for electronic pressure gauges.
around the perimeter of the vent hood to contain the fumes under the hood area. Fumeswere generated by the panel components as a result of heater and insulation outgassing.Additional fumes due to the vaporized JP-10 were exhausted through the top of the venthood after passing through the cold trap located at the exhaust of the GC sampling loop.
3.9 Gas bottles and regulators
A bottle rack capable of holding up to six bottles was built and attached to the wall be-hind the reactor panel. The gas chromatograph required a total of three different gases.The carrier gas was ultra-high-purity helium and required an analytical regulator (Math-
15

eson Cat. No. 3122-580) capable of supply pressures up to 200 psi. It was regulated toa pressure of 80 psi. An oxygen trap (Agilent, Cat. No. 3150-0414) was installed on thehelium line just upstream of the GC to remove water vapor which can damage the cap-illary column during high-temperature operation. The GC’s detector required a supplyof ultra-zero air and ultra-high-purity hydrogen each with regulators capable of supplypressures up to 200 psi (Matheson, Cat. No. 3122-580 and Matheson, Cat. No. 3120-350).The ultra-zero air was regulated to a pressure of 80 psi while the hydrogen was regulatedto a pressure of 60 psi. Specification of these pressures appears in the “Agilent Site Prepand Installation Guide” documentation. A Matheson flame arrestor was added to theultra-high-purity hydrogen line just downstream of the regulator.
A bottle of industrial nitrogen with a general purpose regulator (Matheson, Cat. No. 9-580) was attached directly to the system plumbing through the GIV. A bottle of industrialair with a general purpose regulator (Matheson, Cat. No. 19-590) was attached directlyto the bottom of the accumulator via a venting regulator as previously mentioned.
16
4 Gas chromatograph
The reactor panel outlet was connected to a capillary gas chromatograph (Agilent 6890Series) for product component analysis. Connections to the GC appear on the right sideof the reactor panel (Fig. 9) upstream of the VIV. The capillary column has a stationaryphase of HP-5 (crosslinked 5% Phenyl Methyl Siloxane, Model HP 19091J-433) withdimensions of 3 m × 0.32 mm × 0.25 µm column. The column temperature limits are-60 to 325◦C. A flame ionization detector quantified the column effluent.
4.1 GC theory
Chromatography [25] is the method of separating a volatile sample into its individualcomponents. Separation occurs due to variations in the individual component distribu-tions between two phases that are contained in the column. In capillary columns, thecarrier gas and sample constitute the mobile phase while the solid, stationary phase iscoated on the column’s inner surface. As the sample and carrier gas travel through thecolumn, the sample components are retarded due to their affinity for the stationary phase.This affinity is a dynamic process where the average concentrations of the componentmolecule in the mobile and stationary phase are defined by the distribution law.
K =CS
CM
(1)
This distribution coefficient K can be related to the fraction of time a molecule spendsin the mobile phase τM by considering the relative volumes of the two phases.
τM =CMVM
CMVM + CSVS
=1
1 + K(VS/VM)(2)
The linear velocity u of the mobile phase is an operating parameter specified by the user.Thus, the rate U at which a component molecule travels through the column varies withthis linear velocity of the mobile phase.
U = u τM (3)
From the above equations, the rate of travel of a sample component then depends onthree factors: the carrier gas velocity u, the volume ratio between the stationary andmobile phases VS/VM , and the distribution coefficient K. Only the distribution coef-ficient is different for each component in the same sample and is responsible for thecomponent’s varying rates of travel. For a constant length column, different componentselute at different times as a result of their varying rates of travel through the column.The component elution order is typically in the order of increasing boiling points whenRaoult’s law applies [26]. The time at which a sample component elutes from the columnis its retention time.
tR =L
U(4)
17
Ideally, at a component’s retention time, all of the sample component elutes in thesame volume or time interval as it was injected into the inlet [27].
A =
∫ II
I
Sdt (5)
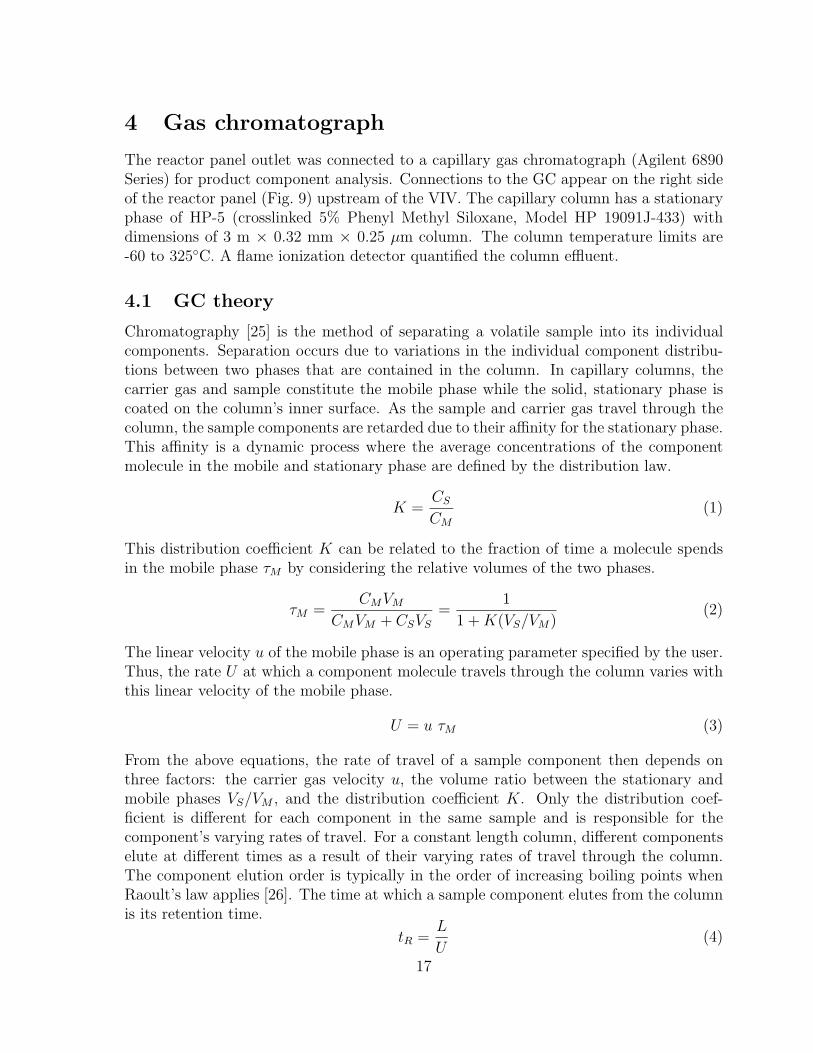
The detector records the component elution as a spike with height proportional to theinjected amount (Fig. 15a).
Signal
Time
Signal
Timea) b)
IIItR tR
Figure 15: Detector output for a) ideal operation and b) real operation with peak broad-ening.
However, in actual operation dispersion of the molecules causes deviations from thisideal behavior. As the component travels through the column, it diffuses causing a broad-ening of the detector signal (Fig. 15b). In cases of significant peak broadening, signalanalysis can be difficult because overlapping peaks at similar retention times preventaccurate integration of the area under each peak. The column resolution Rc refers to thedegree of separation of two components that leave the column shortly after each other.This can be quantified by comparing the two retention times and the variance of theeluted peak.
Rc =tR2 − tR1
4σ2
(6)
Where σ2 refers to the peak width at half height divided by 2.357 [25]. The resolutioncan be improved by decreasing the sample size. Suggested sample sizes for capillarycolumns should be smaller than 10−7 gr [25] corresponding to less than 7×10⁻⁶ µl ofJP-10. Many other parameters can be specified in capillary column operation such asseparation number, plate number, holdup time, etc. These have not been quantified inthis study as they are for a more theoretical study of the GC operation than is requiredto understand the measured results. Due to the size of our experimental facility, sampleinjections are often too large resulting in GC operation that is not optimal. The effect oflarge sample injections may be eliminated or reduced by increasing the sample dilutionor using a split injector. These methods were attempted with our system as is discussedin section 5.1 and 5.2.
18
4.2 Flame ionization detector
There are many detectors that may be used in conjuction with a gas chromatograph.After the sample components are separated, the detector that is attached to the end ofthe column provides the quantitative measurement of the sample amount. The detectorthen measures the time of elution from the sample injection and determines the quantityof the sample at each particular retention time.
There are two classes of detectors: those in which the detector response dependson the sample concentration and those in which the detector response depends on themass flowrate of the sample and is concentration independent [28]. Figures of merit forthe detectors include sensitivity, detectability, specificity, linearity, and response time.The two most popular detectors are the flame ionization detector (FID) and the thermalconductivity detector (TCD).
The FID is the universal detector of organic compounds and considered the mostversatile of the high sensitivity detectors [25]. A diffusion flame, created by burninghydrogen in air, burns the sample components as they elute from the column. Electronsand positive ions are produced by the process of chemi-ionization in which the majorion formed is the hydronium ion (H3O
+) [28]. By applying a voltage differential acrossthe flame, a measurement of the number of electrons can be made in units of pA. Manygenerations of FID configurations have resulted in the current configuration where aparallel plate electrode system is used with a non-conducting jet [25]. As a result, onlythe gas flowrates may be controlled by the users but suggested values appear in theAgilent support documentation.
The TCD detector is less sensitive but can be used with a wider range of speciesthan the FID. The sensitive element is a thin wire or filament that is operated in eithera constant current or constant temperature mode. Heat transfer from the wire to thesample eluting from the column will depend primarily on the thermal conductivity of thesample, which is a function of the sample molar mass and molecular structure. When thesample has a thermal conductivity significantly higher or lower than the carrier gas, thedetector filament resistance or current demand will change and this is registered by thebridge circuit and electronics connected to the detector. The response of the TCD at aspecific retention time to a given component is directly proportional to its concentration,velocity, and inversely proportional to its specific heat. Unlike the FID, the TCD issensitive to H2, O2, and N2 in addition to the organic compounds. One disadvantage ofthe TCD is that it is less sensitive than the FID by a factor of 105 [29].
Detector theory is described in a number of sources on chromatography and shouldbe referred to for a more detailed discussion of detector design and operation.
4.3 Agilent GC and associated hardware
This section discusses the hardware required for GC operation. The GC oven is fast-heating requiring a dedicated power supply of 240 V and 15 A. Plumbing for the helium,air, and hydrogen is attached to the connections on the back of the GC with 1/8-inch
19
refrigeration grade copper tubing. Building supply air regulated to 40 psi operated thegas sampling valve.
A Hewlett-Packard computer containing the ChemStation interfacing software wasconnected to the GC with a LAN connection. The network connection is establishedbetween the computer and GC with a “bootp” server which establishes the network IPaddress of the GC upon startup. A second network card was installed in the computerallowing it to be connected to the department computer network.
4.4 ChemStation software
The ChemStation software is a user interface enabling the GC operating parameters,system configuration, data analysis, and report generation properties to be specified.The software is organized into three main “views” that group common functions andoperations together.
4.4.1 Method and run control
Method and Run Control is the first view where the GC is configured, system operatingparameters are specified, runs are begun, and the data is acquired. The sum of thesesettings are stored into a file called a method. Thus, a method is comprised of all thedata acquisition and analysis parameters specific to a given sample. A description of theimportant submenus within the Method and Run Control view follow.
The sample name and filenames for the detector signal output are specificed in theSample Information menu. System operating parameters, specified in the submenus ofthe Edit Parameters menu, are discussed below.
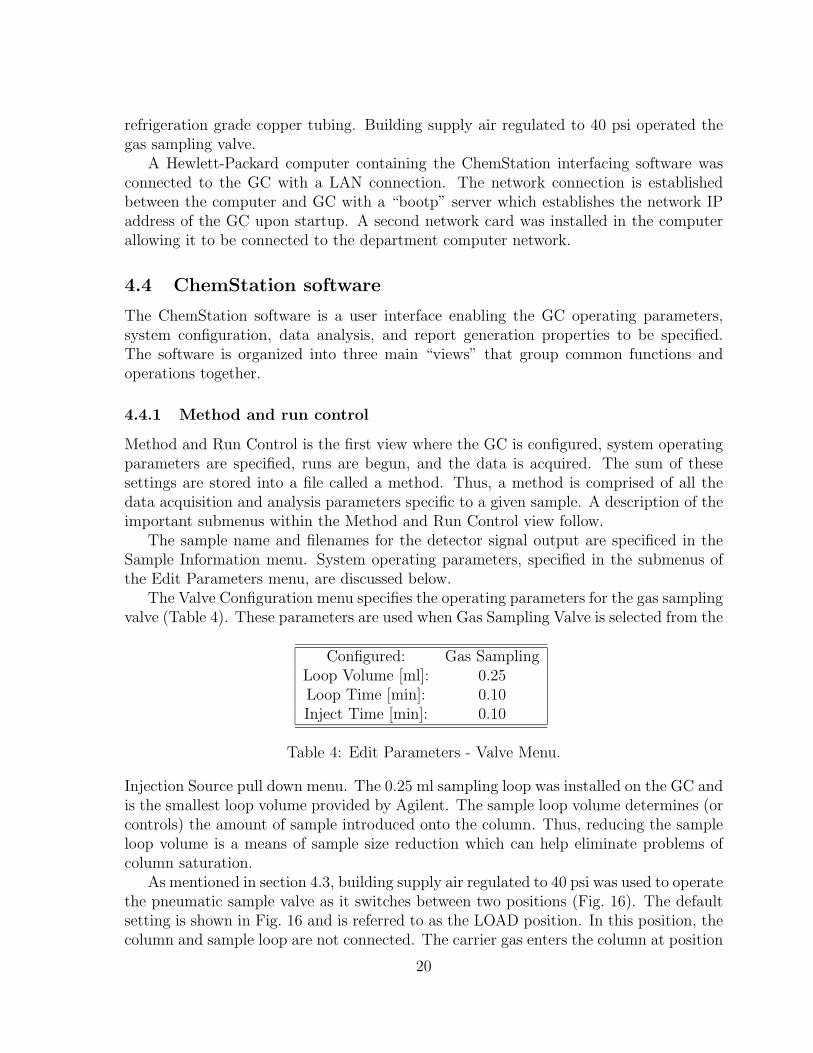
The Valve Configuration menu specifies the operating parameters for the gas samplingvalve (Table 4). These parameters are used when Gas Sampling Valve is selected from the
Configured: Gas SamplingLoop Volume [ml]: 0.25Loop Time [min]: 0.10Inject Time [min]: 0.10
Table 4: Edit Parameters - Valve Menu.
Injection Source pull down menu. The 0.25 ml sampling loop was installed on the GC andis the smallest loop volume provided by Agilent. The sample loop volume determines (orcontrols) the amount of sample introduced onto the column. Thus, reducing the sampleloop volume is a means of sample size reduction which can help eliminate problems ofcolumn saturation.
As mentioned in section 4.3, building supply air regulated to 40 psi was used to operatethe pneumatic sample valve as it switches between two positions (Fig. 16). The defaultsetting is shown in Fig. 16 and is referred to as the LOAD position. In this position, thecolumn and sample loop are not connected. The carrier gas enters the column at position
20

Figure 16: Agilent schematic of gas sampling valve in the LOAD position. Copied fromAgilent paperwork provided with the GC.
5 as denoted by the arrow and exits the valve through position 4 which leads to the inletand column. The isolated sample loop is located between positions 3 and 6. In thisconfiguration, the sample gas can be flushed through the sample loop without contactingthe column until the valve switches into the INJECT position. From the LOAD positionto the INJECT position, the valve moves such that the carrier gas inlet is now appliedto position 1 and exits through position 2 into the inlet and column. Thus, the samplegas contained in the sample loop volume just before the valve switches into the INJECTposition is trapped and injected onto the column by the redirected carrier gas. The gassampling valve is an easy way to produce repeatible injections of gaseous samples. Gassyringes, which inject the gas sample directly into the column as in a manner similar tothe liquid injections, may also be used. The results in this study with gas injection werecompleted using only the GC gas sampling valve.
Liquid samples are analyzed by specifying the Manual option from the InjectionSource pull down menu. A syringe injects the sample through a septum directly intothe inlet. The high temperature septum is self-sealing but should be replaced every10-15 injections. An Agilent syringe of 10 µl capacity was provided with the system.
Table 5 shows typical operating settings used in this study for the inlet while Table 6shows the column settings. These two sections are discussed together as some of thesettings are dependent.
Heater [◦C]: 250Pressure [psi]: 8.75Split Ratio: 400:1
Split Flow [ml/min]: 800Total Flow [ml/min]: 805
Table 5: Edit Parameters - Inlet Menu.
21
Mode: Constant PressurePressure [psi]: 8.75Flow [ml/min]: 2.0
Average Velocity [cm/sec]: 32
Table 6: Edit Parameters - Column Menu.
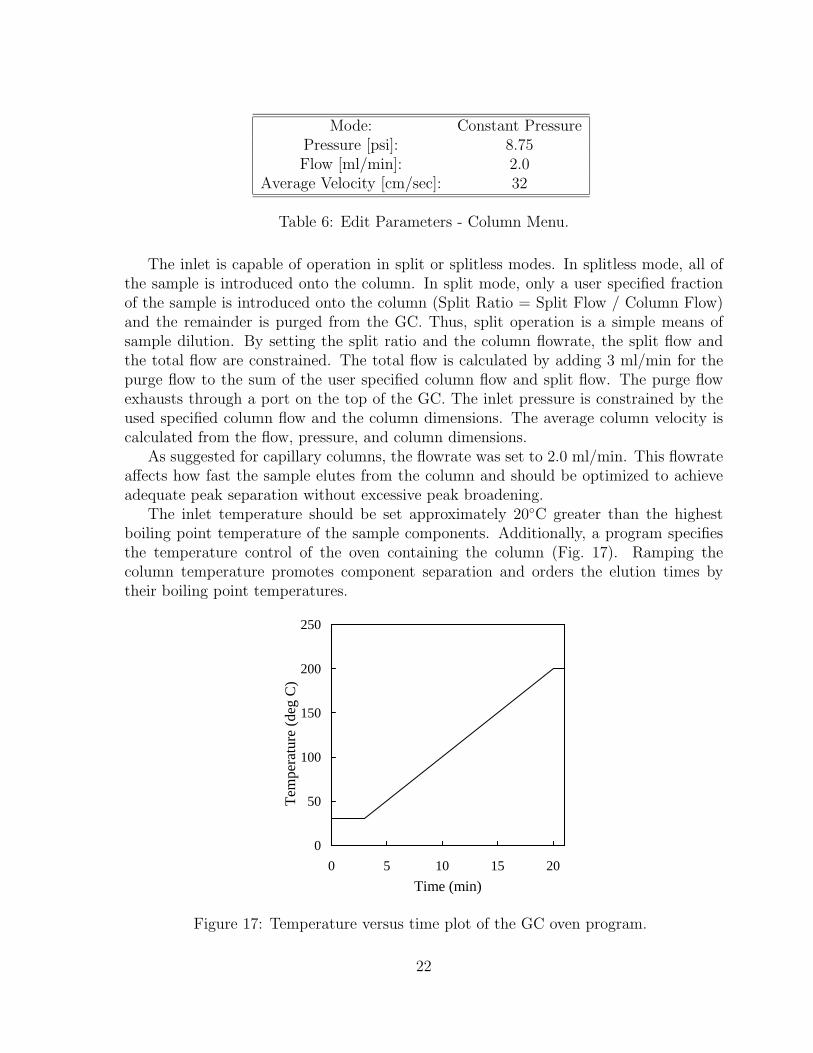
The inlet is capable of operation in split or splitless modes. In splitless mode, all ofthe sample is introduced onto the column. In split mode, only a user specified fractionof the sample is introduced onto the column (Split Ratio = Split Flow / Column Flow)and the remainder is purged from the GC. Thus, split operation is a simple means ofsample dilution. By setting the split ratio and the column flowrate, the split flow andthe total flow are constrained. The total flow is calculated by adding 3 ml/min for thepurge flow to the sum of the user specified column flow and split flow. The purge flowexhausts through a port on the top of the GC. The inlet pressure is constrained by theused specified column flow and the column dimensions. The average column velocity iscalculated from the flow, pressure, and column dimensions.
As suggested for capillary columns, the flowrate was set to 2.0 ml/min. This flowrateaffects how fast the sample elutes from the column and should be optimized to achieveadequate peak separation without excessive peak broadening.
The inlet temperature should be set approximately 20◦C greater than the highestboiling point temperature of the sample components. Additionally, a program specifiesthe temperature control of the oven containing the column (Fig. 17). Ramping thecolumn temperature promotes component separation and orders the elution times bytheir boiling point temperatures.
0
50
100
150
200
250
0 5 10 15 20
Time (min)
Tem
pera
ture
(de
g C
)
Figure 17: Temperature versus time plot of the GC oven program.
22

The Detector menu allows for specification of the flowrate for the supply gases to theFID (Table 7). These parameters were suggested by the Agilent support documentation.
Heater [◦C]: 250H2 Flow [ml/min]: 40Air Flow [ml/min]: 450
Makeup Flow [ml/min]: 45Flame: ON
Electrometer: ON
Table 7: Edit Parameters - Detector.
After flame ignition, a period of time (approximately 10 minutes) is required for signalstabilization to a baseline value of approximately 10-15 pA. It is possible for the flameto have ignition problems after periods of inoperation. In this case, the Lit Offset pa-rameter may be increased from its default of 2.0 pA to a higher value (i.e., 10 pA). Thisparameter is a signal threshold that the software uses to establish whether flame ignitionhas occurred.
In the Signal menu, it is specified that the FID output signal is to be recorded at asampling frequency of 20 Hz. The Aux menu specifies an auxiliary heater temperatureof 250◦C. This is the auxiliary heater for the gas sampling valve.
4.4.2 Data analysis and report generation
The auto-integrator in the ChemStation software was used to complete the signal inte-grations for each run. These results were tabulated into a report and printed out withthe chromatogram for each run. The reported data consist of the retention time, peakarea, and peak symmetry.
4.4.3 Column conditioning and maintence
Maintence procedures included ensuring there is a continuous supply of carrier gas flowingthrough the column, periodically conditioning the column, and replacing the inlet septumregularly.
The purpose of column conditioning is to clean the column at high temperature andto flush retained components out of the stationary phase. This is conducted by flowingonly the carrier gas through the column while ramping the oven temperature to themaximum column temperature and holding at this temperature for at least 30 minutes.The procedure to replace the inlet septum is found in the Agilent documentation.
23

5 Characterization tests
The following sections discuss the initial tests conducted to understand operation of theGC, the reactor panel, and the combined system. These characterization tests includeGC analysis with liquid and gas injection, quantification of system leak rates, and systemvapor pressure measurements with JP-10. The GC samples with liquid and gas injectionare referred to by a standardized naming convention as shown in Tables 8 and 11. Thetest ID consists of a number and letter. The numbers refer to the date of the test andthe letters refer to the order of samples taken that day. For example, test ID 011102Ameans it is the first sample taken on January 11, 2002.
5.1 Chromatography with liquid injection
Learning how to use the GC began by analyzing samples using liquid injection. Theeffect of changes in the operating parameters on the resulting signal were investigated.This primarily included the effect of sample dilution on peak width, peak separation, andpeak symmetry. Sample sizes of 1 µl can be injected with a syringe into the inlet withacceptable repeatibility. Injection procedure can significantly affect the time duration inwhich the sample is introduced to the inlet and is one of the biggest causes of error inpractice [26].
0
5
10
15
20
25
30
0 5 10 15 20 25Time (min)
FID
Sig
na
l (p
A/1
00
0)
Figure 18: GC chromatograph with liquid injection of 1µl of JP-10.
Liquid injection of 1 µl of JP-10 into the inlet resulted in significant peak frontingindicative of column saturation (Fig. 18). Such peak asymmetry causes a ficticious delayin the retention time. This retention time delay is most prominent in tests 011602Athrough F of Table 8. A series of tests was conducted to dilute the JP-10 sample in
24

hexane to obtain a symmetric chromatogram, thus obtaining an idea of the requireddilution for meaningful output signals. Required dilutions were on the order of 0.05% wtJP-10 in hexane in a 1µl sample. This is observed in the tests labeled 012102A and B ofTable 8.
5.2 Chromatography with gas injection
The initial GC tests using the gas sampling valve were completed by sampling from theclosed accumulator that was heated to approximately 90◦C and filled with a hydrocarbon-nitrogen mixture. The effect of loop and inject time were investigated (Table 11). Resid-ual hydrocarbon, especially JP-10, in the plumbing was observed and difficult to flushfrom the system as evidenced by tests where no hydrocarbon was injected. The systemwas flushed between each test.
Due to the length of line connecting the outlet of the reactor panel to the samplingvalve, the time required to flush the line was determined by measuring the flowrate outof the sample loop as a function of accumulator pressure (Fig. 19). This was done bymeasuring the water displaced from an overturned beaker.
0
10
20
30
40
50
60
70
80
90
100
0 250 500 750 1000Accumulator Pressure (kPa)
Flo
w R
ate
(m
l/se
c)
Figure 19: flowrate through the GC sampling valve as a function of accumulator pressure.
The alkanes between C5 and C12 in addition to JP-10 were analyzed to determinetheir retention times. An overlay of the output chromatograms appears in Fig. 20.
A list of the samples tested along with their boiling temperatures and measured reten-tion times appears in Table 9. The retention times are ordered by boiling temperatures(Fig. 21) as expected, which is a product of the oven program (Fig. 17).
Boundaries defining regions in which compounds with the same carbon number areexpected to elute from the column also appear in Fig. 20. The boundaries are listed in
25

Column Column Start End Ret.Compound Press Flow Split Temp Temp Time
Test ID Description (psi) (ml/min) Ratio (◦C) (◦C) (min)011102A 1µl JP-10 4.87 1.0 20:1 30 250 14.826011202A 0.5µl JP-10 4.87 1.0 20:1 30 250 14.544011202B 0.1µl JP-10 4.87 1.0 20:1 30 250 14.226011202C 0.1µl C5H12 4.87 1.0 20:1 30 250 3.384011202D 0.1µl C7H16 4.87 1.0 20:1 30 250 6.164011602A 0.5µl JP-10 8.75 2.0 10:1 30 250 12.097011602B 0.5µl JP-10 8.75 2.0 25:1 30 250 11.908011602C 0.5µl JP-10 8.75 2.0 75:1 30 250 11.697011602D 0.2µl JP-10 8.75 2.0 100:1 30 250 11.511011602E 0.2µl JP-10 8.75 2.0 88:1 30 250 11.513011602F 0.2µl JP-10 8.75 2.0 125:1 30 250 11.590011702A 1µl, 5% wt 8.75 2.0 25:1 30 230 11.657011702B 0.2µl, 5% wt 8.75 2.0 25:1 30 200 11.555011702C 0.2µl, 5% wt 8.75 2.0 40:1 30 200 11.543011702D 0.2µl, 1% wt 8.75 2.0 40:1 30 200 11.501011702E 0.2µl, 0.5% wt 8.75 2.0 40:1 30 200 11.502011702F 0.2µl, 0.3% wt 8.75 2.0 40:1 30 200 11.496011702G 0.2µl, 0.1% wt 8.75 2.0 40:1 30 200 11.492011702H 0.2µl, 0.3% wt 8.75 2.0 40:1 30 200 11.494011702I 0.2µl, 0.5% wt 8.75 2.0 40:1 30 200 11.494011702J 0.2µl, 1% wt 8.75 2.0 40:1 30 200 11.501012102A 1.1µl, 0.05% wt 8.75 2.0 40:1 30 200 11.496012102B 1.05µl, 0.05% wt 8.75 2.0 25:1 30 200 11.494012102C 1µl, 0.03% wt 8.75 2.0 25:1 30 200 11.491012102D 1µl, 0.01% wt 8.75 2.0 25:1 30 200 11.495012302A 1.05µl, 0.1% wt 8.75 2.0 25:1 30 200 11.496012302B 0.6µl, 0.3% wt 8.75 2.0 40:1 30 200 11.497012302C 0.8µl, 0.3% wt 8.75 2.0 40:1 30 200 11.501012302D 0.8µl, 0.3% wt 8.75 2.0 40:1 30 200 11.497012302E 0.8µl, 0.3% wt 9.14 2.0 40:1 40 200 10.280012302F 0.8µl, 0.1% wt 8.75 2.0 40:1 30 200 11.496012302G 0.6µl, 0.1% wt 8.75 2.0 50:1 30 200 11.502
Table 8: Summary of all GC characterization tests with liquid injection. Tests withspecified dilutions were made with JP-10 in hexane. Refer to Tables 4 - 7 for GC operatingconditions not specified here.
Table 10. Woodrow [30] used this technique as a means of quantifying product compo-sition since detailed component analysis is not possible with an FID. The FID gives a
26
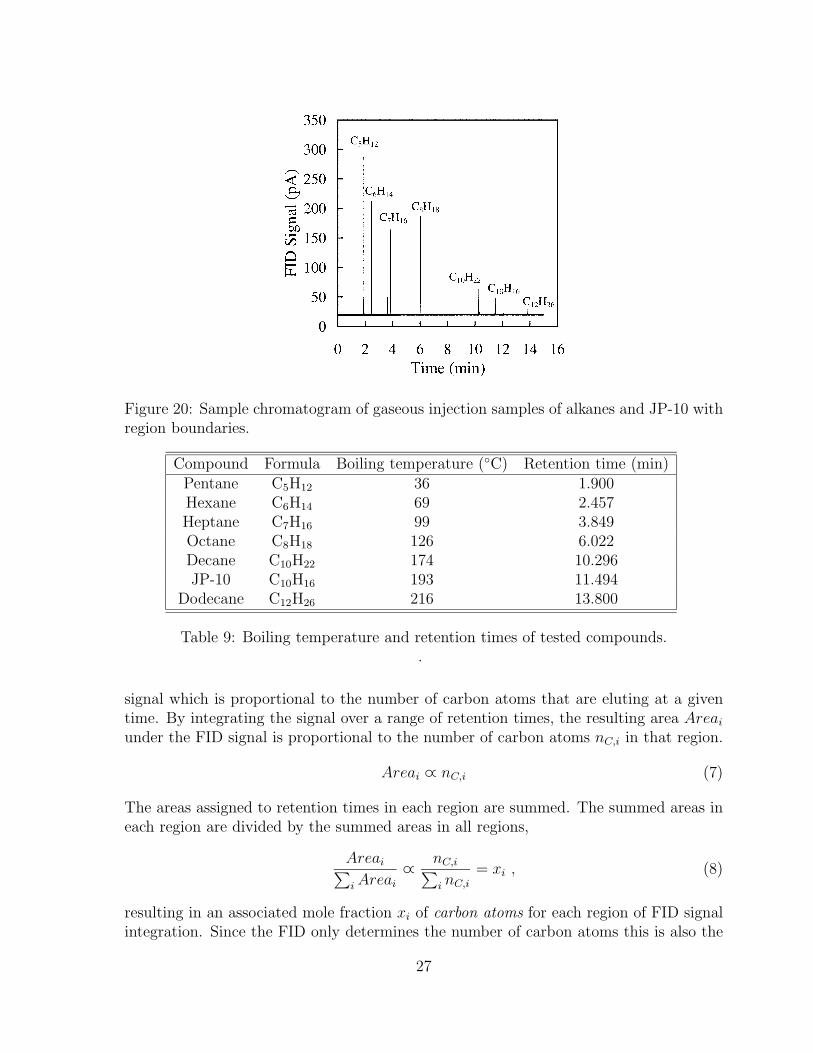
Figure 20: Sample chromatogram of gaseous injection samples of alkanes and JP-10 withregion boundaries.
Compound Formula Boiling temperature (◦C) Retention time (min)Pentane C5H12 36 1.900Hexane C6H14 69 2.457Heptane C7H16 99 3.849Octane C8H18 126 6.022Decane C10H22 174 10.296JP-10 C10H16 193 11.494
Dodecane C12H26 216 13.800
Table 9: Boiling temperature and retention times of tested compounds..
signal which is proportional to the number of carbon atoms that are eluting at a giventime. By integrating the signal over a range of retention times, the resulting area Areai
under the FID signal is proportional to the number of carbon atoms nC,i in that region.
Areai ∝ nC,i (7)
The areas assigned to retention times in each region are summed. The summed areas ineach region are divided by the summed areas in all regions,
Areai∑i Areai
∝ nC,i∑i nC,i
= xi , (8)
resulting in an associated mole fraction xi of carbon atoms for each region of FID signalintegration. Since the FID only determines the number of carbon atoms this is also the
27

0
50
100
150
200
250
0 2 4 6 8 10 12 14 16 18 20Retention time (min)
Bo
ilin
g te
mp
era
ture
(d
eg
C)
C6
C7
C8
C10
C5
<C5
C9
C12>C12
Figure 21: Boiling temperature of alkanes and JP-10 versus measured retention times.
Formula Start Time (min) End time (min)<C5 0 1.622C5 1.622 2.179C6 2.179 3.153C7 3.153 4.936C8 4.936 7.091C9 7.091 9.228C10 9.228 12.924C12 12.924 14.676
>C12 14.676 20
Table 10: Region boundaries for peak summation of compounds with same carbon num-ber.
mass fraction yi for that region.
yi =mC,i∑i mC,i
=12 g/mol · nC,i∑i 12 g/mol · nC,i
= xi (9)
The resulting carbon mass fraction is what is being reported in the subsequent sectionsof this report. We report this instead of number density or mass fraction of a particularspecies since since we don’t know exactly what the species are that are being eluted.Speciation would require further analysis by a GC/MS. Although we have calibratedthe retention times with pure hydrocarbon test species, the actual reactor products willinvolve species other than those used for calibration.
Reactor product species are not assured to be ordered in terms of the carbon numberin exactly the same fashion as the calibration species. Reducing the the FID output
28
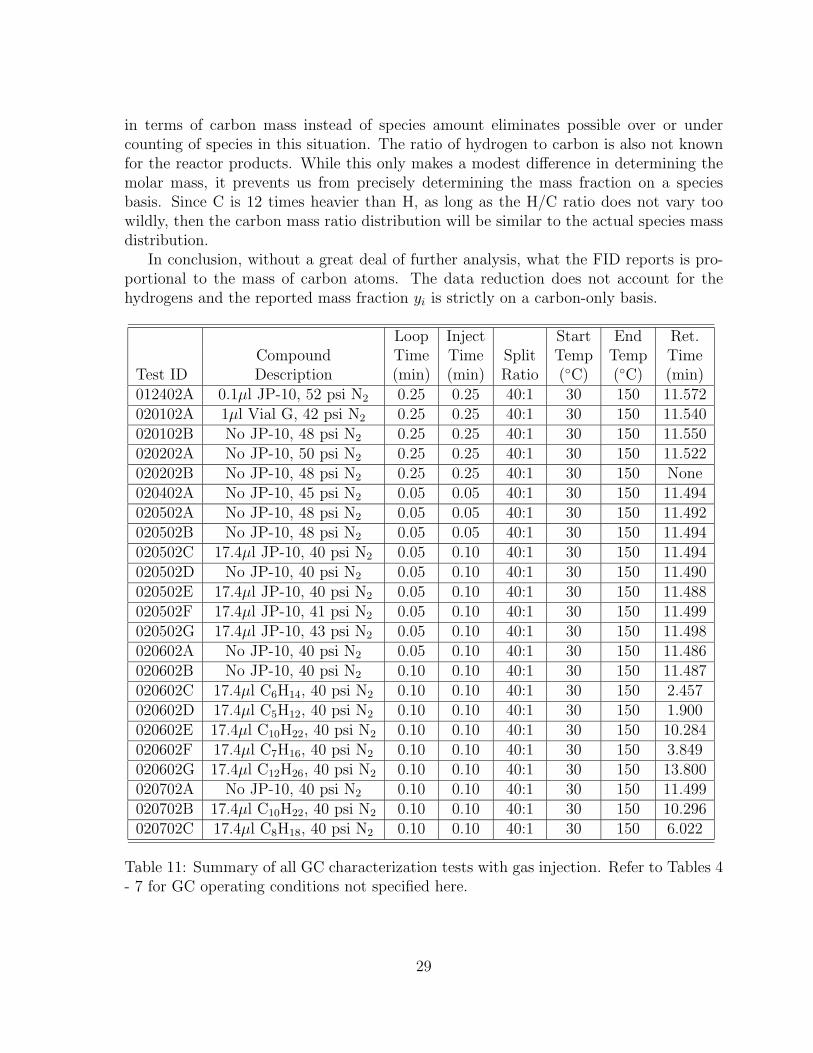
in terms of carbon mass instead of species amount eliminates possible over or undercounting of species in this situation. The ratio of hydrogen to carbon is also not knownfor the reactor products. While this only makes a modest difference in determining themolar mass, it prevents us from precisely determining the mass fraction on a speciesbasis. Since C is 12 times heavier than H, as long as the H/C ratio does not vary toowildly, then the carbon mass ratio distribution will be similar to the actual species massdistribution.
In conclusion, without a great deal of further analysis, what the FID reports is pro-portional to the mass of carbon atoms. The data reduction does not account for thehydrogens and the reported mass fraction yi is strictly on a carbon-only basis.
Loop Inject Start End Ret.Compound Time Time Split Temp Temp Time
Test ID Description (min) (min) Ratio (◦C) (◦C) (min)012402A 0.1µl JP-10, 52 psi N2 0.25 0.25 40:1 30 150 11.572020102A 1µl Vial G, 42 psi N2 0.25 0.25 40:1 30 150 11.540020102B No JP-10, 48 psi N2 0.25 0.25 40:1 30 150 11.550020202A No JP-10, 50 psi N2 0.25 0.25 40:1 30 150 11.522020202B No JP-10, 48 psi N2 0.25 0.25 40:1 30 150 None020402A No JP-10, 45 psi N2 0.05 0.05 40:1 30 150 11.494020502A No JP-10, 48 psi N2 0.05 0.05 40:1 30 150 11.492020502B No JP-10, 48 psi N2 0.05 0.05 40:1 30 150 11.494020502C 17.4µl JP-10, 40 psi N2 0.05 0.10 40:1 30 150 11.494020502D No JP-10, 40 psi N2 0.05 0.10 40:1 30 150 11.490020502E 17.4µl JP-10, 40 psi N2 0.05 0.10 40:1 30 150 11.488020502F 17.4µl JP-10, 41 psi N2 0.05 0.10 40:1 30 150 11.499020502G 17.4µl JP-10, 43 psi N2 0.05 0.10 40:1 30 150 11.498020602A No JP-10, 40 psi N2 0.05 0.10 40:1 30 150 11.486020602B No JP-10, 40 psi N2 0.10 0.10 40:1 30 150 11.487020602C 17.4µl C6H14, 40 psi N2 0.10 0.10 40:1 30 150 2.457020602D 17.4µl C5H12, 40 psi N2 0.10 0.10 40:1 30 150 1.900020602E 17.4µl C10H22, 40 psi N2 0.10 0.10 40:1 30 150 10.284020602F 17.4µl C7H16, 40 psi N2 0.10 0.10 40:1 30 150 3.849020602G 17.4µl C12H26, 40 psi N2 0.10 0.10 40:1 30 150 13.800020702A No JP-10, 40 psi N2 0.10 0.10 40:1 30 150 11.499020702B 17.4µl C10H22, 40 psi N2 0.10 0.10 40:1 30 150 10.296020702C 17.4µl C8H18, 40 psi N2 0.10 0.10 40:1 30 150 6.022
Table 11: Summary of all GC characterization tests with gas injection. Refer to Tables 4- 7 for GC operating conditions not specified here.
29

5.3 Leak testing
Initial leak testing was performed on the accumulator only, as mentioned above in theaccumulator discussion. As it was received from Advanced Projects Research, Inc., theleak rate was 262.3 sccm. Honing the internal cylinder surface and replacing a plug onthe top flange resulted in reducing the leak rate to 2.63 sccm.
Leak tests of the reactor panel plumbing without the accumulator yielded a leak rateof 0.39 sccm. This measurement was obtained by filling the system with helium to apressure of 200 psi and recording the pressure over time. The system was primarilyoperated at or near atmospheric pressure so this value is assumed to be an upper boundon the leak rate. However, due to repeated removal and replacement of the central reactortube, some variation in the leak rate is expected. The leak rate was not quantified beforeeach thermal and catalytic cracking test.
5.4 Temperature distribution
The temperature uniformity of the original system (Fig. 7) was monitored over timeon three separate days. The first two heating tests were at temperatures lower thanthe intended operating temperatures. A third heating test at operational temperatures
TC 1 2 3 4 5 6 7 8 9a 109/20/01 50 51 56 49 38 60 53 48 43 -9/28/01 68 67 63 65 45 104 93 96 58 -10/11/01 192 218 218 220 209 282 270 257 144† 70
Table 12: Reactor system temperature distribution in ◦C. Thermocouple positions referto numbers on Fig. 7. † For the Oct. 11 test, the thermocouple in position 9a was movedto the connection between the reactor system and the GC denoted by position 9b inFig. 7.
measured a maximum temperature difference in the evaporator section of 28◦C. Evenheating with the rope heaters over the smaller diameter tubing and many Swagelokconnections was difficult.
5.5 JP-10 Vapor Pressure
Previous experiments [31, 32, 33] have measured the vapor pressure of JP-10 over differenttemperature ranges. We have combined this data onto one graph as shown in Fig. 22.The data from Caltech was measured using documented methods that involve removingthe dissolved oxygen from the liquid fuel [34]. A linear correlation was derived based onthe approximate Clausius-Clapeyron equation.
(dP
P
)sat
=Hfg
R
(dT
T 2
)sat
(10)
30

-6
-4
-2
0
2
4
6
8
1 2 3 4 5
1/T (1000/K)
LN(P
)
CIT DataAviation Fuel PropertiesUSAF
Figure 22: Experimental JP-10 vapor pressure data with correlation given in Eq. 12.
This equation is integrated and the two unknowns (Hfg and integration constant C) arecalculated given the experimental data of Fig. 22.
Psat = C exp
(−∆Hfg
RTsat
)(11)
This yields the vapor pressure and temperature relation for JP-10 (Eq. 12). This relationis valid for temperatures between 5 and 315◦C based on the available experimental data.The correlation is extrapolated for temperatures outside this range.
Psat = 4.46 × 10⁶ exp
(−302
RTsat
)(12)
where Psat is in units of kPa, Tsat is in units of K, and R is 0.0611 kJ/kg · K for JP-10.This equation is tabulated showing the expected pressure rise for a range of tem-
peratures assuming the system contains enough JP-10 to reach the saturation point(Table 13). To reach the intended system operating pressure of 200 psi, the system mustbe heated to a minimum of 340◦C. Because the maximum operating temperature of mostpanel components is 200◦C, the maximum absolute operating pressure experimentallypossible in the system is 19 psi. For simplicity, the system (with a nominal temperatureof 200◦C) was operated at an absolute system pressure between 104 and 111 kPa (15.1and 16.1 psia). Since no back pressure was applied to the bottom of the accumulatorpiston (i.e. the venting regulator was set so that no additional pressure was applied tothe bottom of the accumulator), the system pressure increase over the ambient valueamounted to only 3 to 10 kPa (0.1 to 1.5 psi). This pressure increase is a result of theforce required to overcome the friction of the piston seal and force the piston down.
31
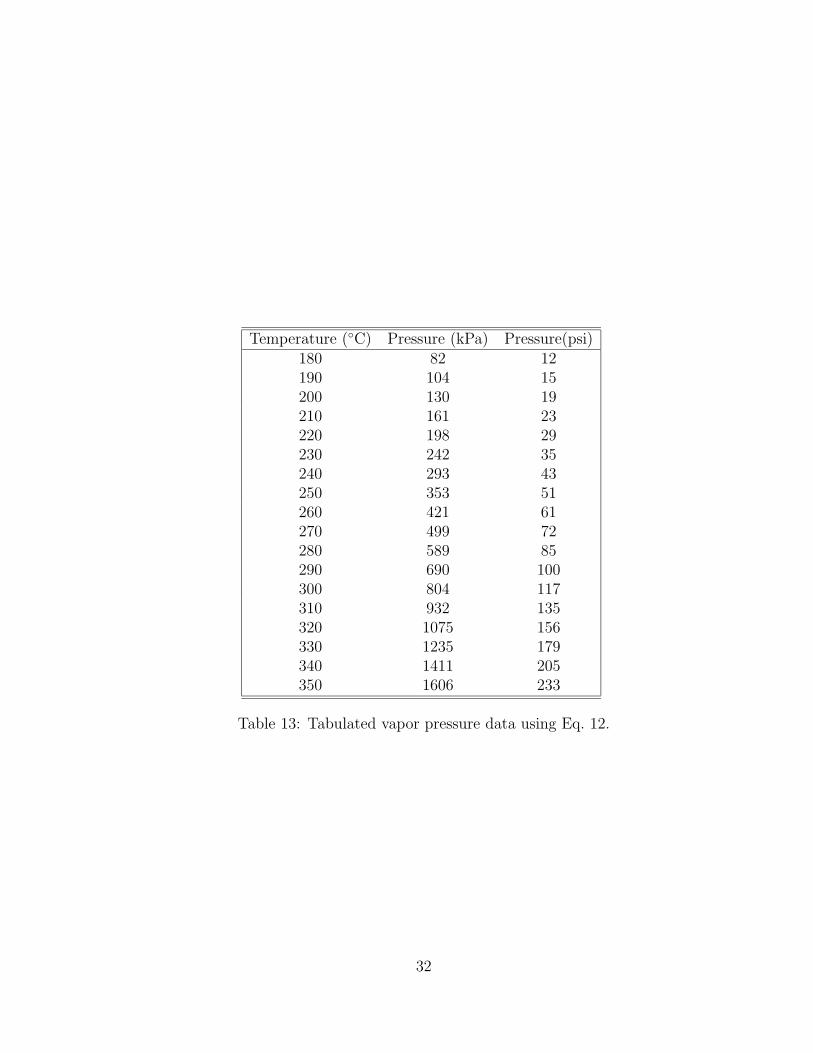
Temperature (◦C) Pressure (kPa) Pressure(psi)180 82 12190 104 15200 130 19210 161 23220 198 29230 242 35240 293 43250 353 51260 421 61270 499 72280 589 85290 690 100300 804 117310 932 135320 1075 156330 1235 179340 1411 205350 1606 233
Table 13: Tabulated vapor pressure data using Eq. 12.
32
6 Methods of data acquisition, analysis, and reduc-
tion
Running the reactor system and GC involve a standard set of operations described below.The data analysis is also described here as well as the methods applied to obtain the dataof the results sections which follow.
6.1 Test procedure
This section describes the test procedure for thermal or catalytic reaction of JP-10 andthe subsequent analysis by the GC. Generally, the test procedures are the same betweenthe two tests except for a few noted exceptions.
Preparations for testing primarily consisted of heating the reactor panel componentsto the desired operational temperatures (Table 3). The heating process for a thermalcracking test was different than a catalytic cracking test because of the installed zeolite.
Prior to a thermal cracking test, the temperature controllers for the four heatingzones were turned on and the desired set point entered. Constant power was supplied tothe heaters, bringing the system up to operating temperature (a reactor temperature of500◦C) in approximately 6 hours.
Prior to a catalytic cracking test, the zeolite was installed into the central reactor tube,and the temperature controllers for the four heating zones were turned on. The desired setpoint was entered for zones 1, 3, and 4. The RAMP function of the controller was used toheat zone 2 containing the reactor. The zeolite requires a temperature rate increase lessthan 5◦C/min to prevent destruction of the zeolite framework. Additionally, the zeoliteabsorbs water vapor from the environment which must be removed from the active sitesfreeing them for reaction with the sample hydrocarbon. This process is completed byholding the zeolite at an elevated temperature (250◦C) in a dry, inert environment for4 hours. Thus, the heating process for the catalytic cracking tests begins by flowingnitrogen through the system and ramping from room temperature to 250◦C at a rate of2.7◦C/min. This takes approximately 2.5 hours. Zone 2 is then held at 250◦C for 4 hoursfollowed by a second temperature increase at a rate less than 5◦C/min to the desiredoperating temperature. Because of heat loss from the reactor casing to the surroundings,it took 4 to 5 hours for the temperature to increase from 250 to 500◦C.
The controllers do not have the option of programming multiple temperature rampand soak routines. Thus, the second temperature ramp had to be manually initiated.After several long testing days, the first temperature ramp and soak was started atmidnight, and the second temperature ramp was started at 7:00 AM so the system wasready for testing by noon.
The GC was prepared once the reactor panel was close to its operating temperature.Preparing the GC consisted of specifying the run parameters as previously discussed andigniting the FID. The FID output was checked for baseline stability.
When both the reactor panel and GC were ready for testing, the system plumbingwas evacuated with the attached vacuum pump to eliminate as much residual JP-10
33
as possible. Valves A2 and A3 were closed (Fig. 9). Then nitrogen was added to thesystem through the GIV until a pressure of 104 kPa was obtained. This provided therequired backpressure on the fuel pump. The FIV was opened and stability in the buretliquid level was verified. Concurrent with starting the fuel pump, the time, buret liquidlevel, system pressure, and accumulator position were recorded. These parameters wererecorded throughout the duration of the test and comprise the results presented in a latersection.
Each test was stopped by taking a final record of the time, buret liquid level, systempressure, and accumulator pressure; then the fuel pump was shut off and the FIV closed.Valve A1 was then closed, isolating the products inside the accumulator. A baselinerun was conducted with the GC by taking a gas sample from the evacuated plumbingbetween the GC and valve A3. Prior to taking the first sample from the accumulator,approximately 240 kPa of backpressure was applied to the bottom side of the accumulator.This backpressure established flow through the sample loop once valve A3 was opened.Valve A3 was held open and the products were allowed to flow through the sample loopfor at least 3 seconds before the GC run was started. In the GC operating parameters,a sample loop load time of 0.10 minutes was specified. This results in a minimum of9 seconds in which products were allowed to flow through the sample loop. After the GCsample valve switched into the INJECT position, valve A3 was closed. This GC samplingprocedure was completed 3 times for most of the tests.
As for the liquid and gas characterization tests, the test and GC sample namingconvention has been standardized. The baseline GC samples have been subtracted fromthe samples of the accumulator products. Each test recording data from the reactor panelbegins with numbers for the date of the test (i.e. 0916 refers to Sept. 16). The letterscorrespond to the order of the GC samples taken that day. Thus, 0916B-A means thebaseline chromatogram 0916A is subtracted from the first sample chromatogram 0916Btaken from the accumulator. Typically, three samples were taken from the accumulatorfor a given test so samples 0916B-A, 0916C-A, and 0916D-A are referred to as a test IDof 0916B:D-A. This naming convention applies to all tests and GC samples.
Because of the run time determined by the oven program and subsequent cool down,samples from the accumulator were taken approximately 45 minutes apart. After allsamples had been taken of the accumulator products, the system was flushed with nitro-gen and the heaters turned off. The reactor panel typically required a day to cool downbefore the central reactor tube could be removed. The zeolite catalyst was observed tocoke significantly during a single test so that fresh catalyst was installed before each test.Thus, each catalytic cracking test represents two days of system preparation and dataacquisition.
A volume of approximately 4.8 ml of JP-10 was injected during each thermal andcatalytic test. Approximately 1 gram of zeolite was installed for the catalytic crackingtests. These values were calculated based on experiments by Lopes et al. [17] who useda WHSY (weight of component per hour per unit weight of zeolite) value equal to 6.9hr−1. The inverse of this value is referred to as the “time on stream”. Assuming 1 gramof zeolite is installed in our system, the fuel flowrate of 10.6 g/hr (FP = 125) corresponds
34
to a time on stream of approximately 330 s and the fuel flowrate of 2.3 g/hr (FP = 25)corresponds to a time on stream of approximately 1570 s. These time on stream valuescorrespond with other documented experiments [35, 21, 10, 36].
Thus, the system parameters tested to determine their effect on the cracking con-version rate and product composition were fuel flowrate (2.3, 6.2, 10.6 g/hr), reactortemperature (250, 300, 350, 425, 500◦C), system backpressure (104 and 400 kPa), andzeolite (HY, Beta, USY).
6.2 Mole balance calculations
We present the calculations used to analyze the data obtained during the tests. Anexample is presented for the purpose of illustration and the use of these calculations asa diagnostic tool is discussed.
In addition to the GC product analysis, a mole balance was completed for each test.The moles of liquid fuel injected were compared to the moles of product created. WhenJP-10 cracks into lower molecular weight components through the mechanisms of thermalor catalytic cracking, the number of product moles will increase. This can be observed byconsidering a balanced chemical reaction description of the cracking process. Experimentsby Green et al. [6] observed cyclopentadiene C5H6 and smaller compounds such as C3H4.While the exact cracking products are not known for all conditions, we will assume forthe purpose of illustration that the only cracking products are C5H5 and C3H5 resultingin the following balanced chemical reaction.
C10H16 → 0.2C5H5 + 3C3H5 or 3.2C3.125H5 (13)
Thus, 1 mole of JP-10 would yield 3.2 moles of products for this reaction. From theburet liquid level, system pressure, and accumulator position recorded during each test,the injected and product moles are calculated. We refer to these calculations as a molebalance.
As fuel is injected into the system, the buret liquid level changes over time. Thischange in the liquid level provides a measurement of the amount of liquid fuel ∆Vf
injected into the system. Alternatively, the mass Mf and moles nf of fuel injected canbe calculated with the fuel density and molecular weight.
Mf = ∆Vf · ρf (14)
nf =Mf
Wf
(15)
The density of JP-10 is 0.94 g/ml and the molecular weight is 136 g/mol. For an assumedliquid fuel flow rate of 10.6 g/hr, a plot of the injected moles over time appears in Fig. 23.
The moles of products in the system can be calculated with the ideal gas law giventhe instantaneous system pressure and volume. The volume of the accumulator withthe piston in the bottom position is calculated to be 1875 cc as discussed previously.
35
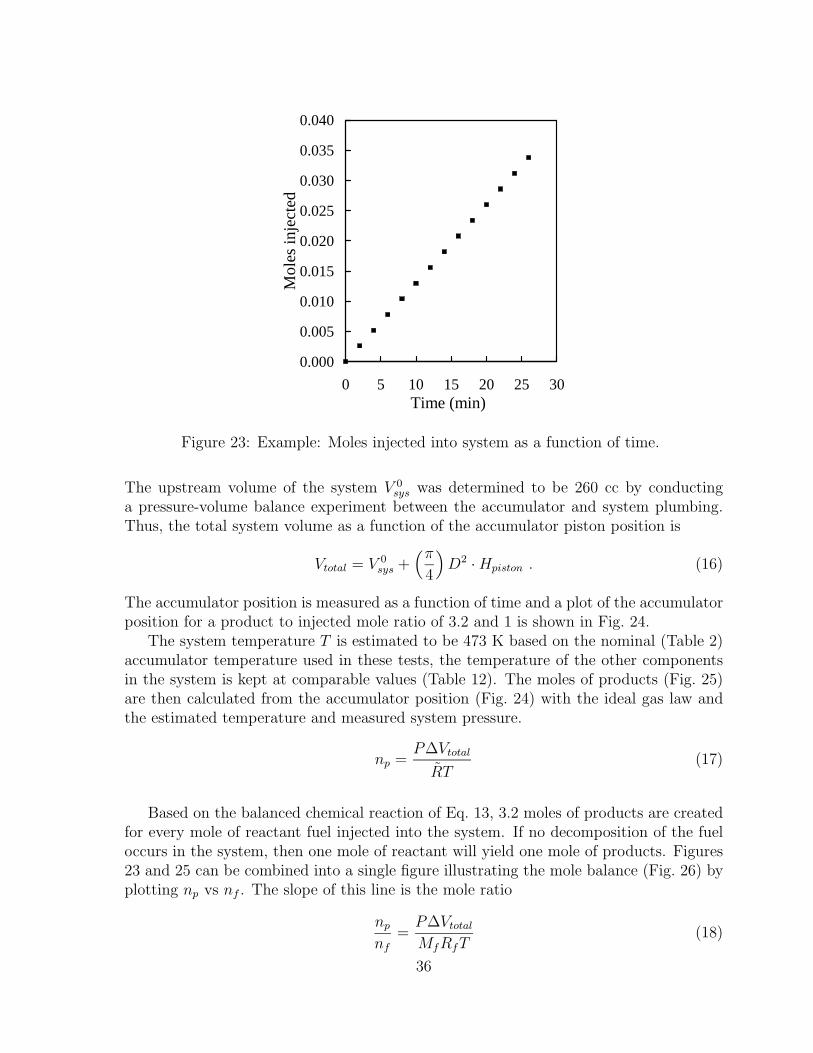
0.000
0.005
0.010
0.015
0.020
0.025
0.030
0.035
0.040
0 5 10 15 20 25 30Time (min)
Mo
les
inje
cte
d
Figure 23: Example: Moles injected into system as a function of time.
The upstream volume of the system V 0sys was determined to be 260 cc by conducting
a pressure-volume balance experiment between the accumulator and system plumbing.Thus, the total system volume as a function of the accumulator piston position is
Vtotal = V 0sys +
(π
4
)D2 · Hpiston . (16)
The accumulator position is measured as a function of time and a plot of the accumulatorposition for a product to injected mole ratio of 3.2 and 1 is shown in Fig. 24.
The system temperature T is estimated to be 473 K based on the nominal (Table 2)accumulator temperature used in these tests, the temperature of the other componentsin the system is kept at comparable values (Table 12). The moles of products (Fig. 25)are then calculated from the accumulator position (Fig. 24) with the ideal gas law andthe estimated temperature and measured system pressure.
np =P∆Vtotal
RT(17)
Based on the balanced chemical reaction of Eq. 13, 3.2 moles of products are createdfor every mole of reactant fuel injected into the system. If no decomposition of the fueloccurs in the system, then one mole of reactant will yield one mole of products. Figures23 and 25 can be combined into a single figure illustrating the mole balance (Fig. 26) byplotting np vs nf . The slope of this line is the mole ratio
np
nf
=P∆Vtotal
MfRfT(18)
36
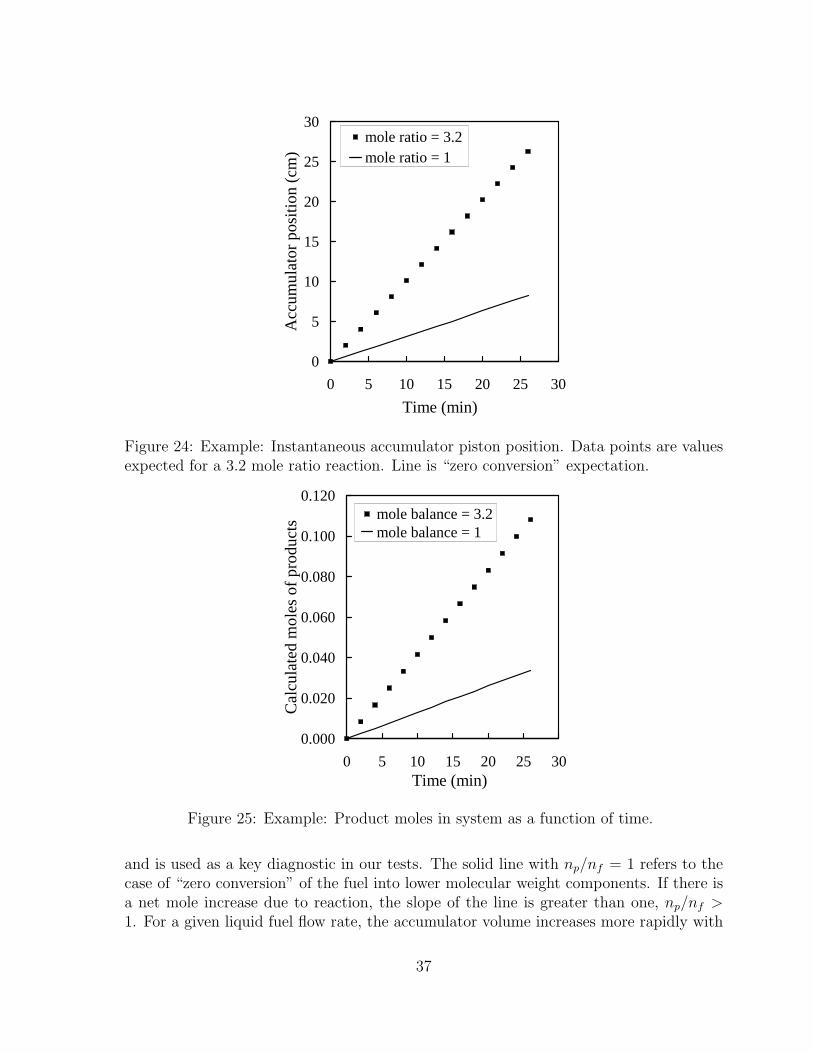
0
5
10
15
20
25
30
0 5 10 15 20 25 30
Time (min)
Acc
um
ula
tor
po
sitio
n (
cm) mole ratio = 3.2
mole ratio = 1
Figure 24: Example: Instantaneous accumulator piston position. Data points are valuesexpected for a 3.2 mole ratio reaction. Line is “zero conversion” expectation.
0.000
0.020
0.040
0.060
0.080
0.100
0.120
0 5 10 15 20 25 30Time (min)
Ca
lcu
late
d m
ole
s o
f pro
du
cts
mole balance = 3.2mole balance = 1
Figure 25: Example: Product moles in system as a function of time.
and is used as a key diagnostic in our tests. The solid line with np/nf = 1 refers to thecase of “zero conversion” of the fuel into lower molecular weight components. If there isa net mole increase due to reaction, the slope of the line is greater than one, np/nf >1. For a given liquid fuel flow rate, the accumulator volume increases more rapidly with
37
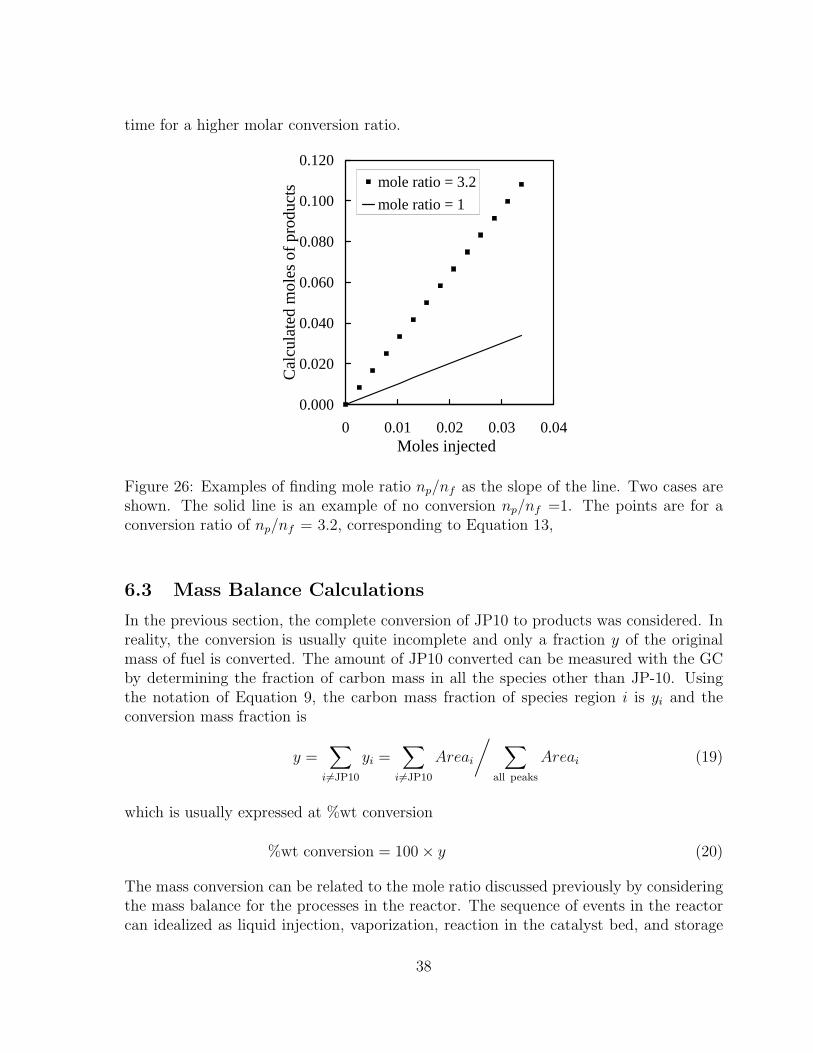
time for a higher molar conversion ratio.
0.000
0.020
0.040
0.060
0.080
0.100
0.120
0 0.01 0.02 0.03 0.04Moles injected
Ca
lcu
late
d m
ole
s o
f pro
du
cts
mole ratio = 3.2
mole ratio = 1
Figure 26: Examples of finding mole ratio np/nf as the slope of the line. Two cases areshown. The solid line is an example of no conversion np/nf =1. The points are for aconversion ratio of np/nf = 3.2, corresponding to Equation 13,
6.3 Mass Balance Calculations
In the previous section, the complete conversion of JP10 to products was considered. Inreality, the conversion is usually quite incomplete and only a fraction y of the originalmass of fuel is converted. The amount of JP10 converted can be measured with the GCby determining the fraction of carbon mass in all the species other than JP-10. Usingthe notation of Equation 9, the carbon mass fraction of species region i is yi and theconversion mass fraction is
y =∑
i6=JP10
yi =∑
i6=JP10
Areai
/ ∑all peaks
Areai (19)
which is usually expressed at %wt conversion
%wt conversion = 100 × y (20)
The mass conversion can be related to the mole ratio discussed previously by consideringthe mass balance for the processes in the reactor. The sequence of events in the reactorcan idealized as liquid injection, vaporization, reaction in the catalyst bed, and storage
38

in the accumulator. The partial reaction of nf moles of JP-10 vapor can be representedschematically as
nfC10H10 −→ nf (1 − y)C10H10 + (np − nf (1 − y)) Products (21)
The “Products” of catalytic cracking represent a notional species that has the averagemolar mass of the actual products and fictitious composition CmHn appropriate to themixture. The products have an average molar mass of WP = 12m + n, where m and nrepresent an empirical composition appropriate to the mixture and are not necessarilyintegers. For example, the reaction of equation 13 has a notional product species ofC3.125H5 which has a molar mass of 42.5 g/mol. If all of the product species are correctlyaccounted for, then the hydrogen-to-carbon ratio m/n must equal 1.6 if we consider thatthe JP-10 either reacts or remains in the original state. GC measurements indicate thatthis appears to be the case.
From the reaction equation given above, the mass balance will be
Mf = nfWf = nf (1 − y)Wf + (np − nf (1 − y))Wp (22)
where Wf = 136 g/mol is the molar mass of JP-10. This can be simplified to
Wp
Wf
=y
np/nf − (1 − y)(23)
This is the key relationship between mass conversion, mole conversion, and the averageproduct molar mass. Using values of the mass and mole conversion obtained from theexperiments, this enables us to predict the average product molar mass. Another wayto look at this is as relationship between molar conversion ratio and mass conversionfraction for a fixed average molar mass of the products.
np
nf
= 1 +
(Wf
Wp
− 1
)y (24)
Using this version of the relationship, the expected molar ratio can be predicted asa function of product molar mass and conversion ratio. The limiting cases are: noconversion, y = 0 and np/nf = 1; complete conversion, y = 1 and np/nf = Wf/Wp.These were illustrated in the previous section.
39

7 Thermal decomposition
We present all measured data obtained from 16 thermal decomposition tests and 25corresponding GC samples. The central reactor tube did not contain catalyst and thesystem was operated at the temperatures listed in Table 3 for heating zones 1, 3, and 4.The reactor in zone 2 was heated to 500◦C in all thermal decomposition tests. Severalrepeat tests were conducted to access the repeatibility in the reactor panel and systemdiagnostics.
The first series of tests varied the liquid fuel flowrate with experiments at threedifferent fuel pump settings. Tests were run at settings (FP) of 25, 70, and 125. Thesefuel pump settings correspond to liquid flowrates of 2.3 g/hr, 6.2 g/hr, and 10.6 g/hrrespectively (Fig. 8). Graphs of the calculated moles of product versus the injectedmoles of liquid fuel appear in Fig. 27, 28, and 29. In each graph, the solid line representsthe case of zero conversion.
0.000
0.005
0.010
0.015
0.020
0.025
0.030
0.035
0.040
0.045
0.050
0.000 0.010 0.020 0.030 0.040
Injected moles
Ca
lcu
late
d m
ole
s o
f pro
du
cts
0806D-C0806F-E0807C-B0819B:E-A1001B:D-A1001F:H-E
Figure 27: Calculated moles of products versus injected moles for thermal decompositiontests with a liquid fuel flow rate of 2.3 g/hr (FP = 25).
The results at the highest metering speed are the most consistent and repeatableover time. The results at each flowrate were averaged enabling a comparison shown inFig. 30. The slope of these mole balances correspond to the number of moles of productsdivided by the number of moles injected into the system (Fig. 31). There is substantialscatter in this plot for the lowest flow rate (2.3 g/hr), mole ratios varied between 0.975and 1.389. The scatter decreases for the intermediate flow rate (6.2 g/hr) and is minimalfor the highest flowrate (10.6 g/hr). The reasons for the scatter at low flow rates is notobvious but the condition of the stainless steel tubing and fittings used for the reactorchannel and plumbing are the obvious factors. It is known that stainless steel can exhibitcatalytic activity and the effectiveness of this action will be depend strongly on thesurface condition of the steel. No attempt was made to control the surface condition in
40
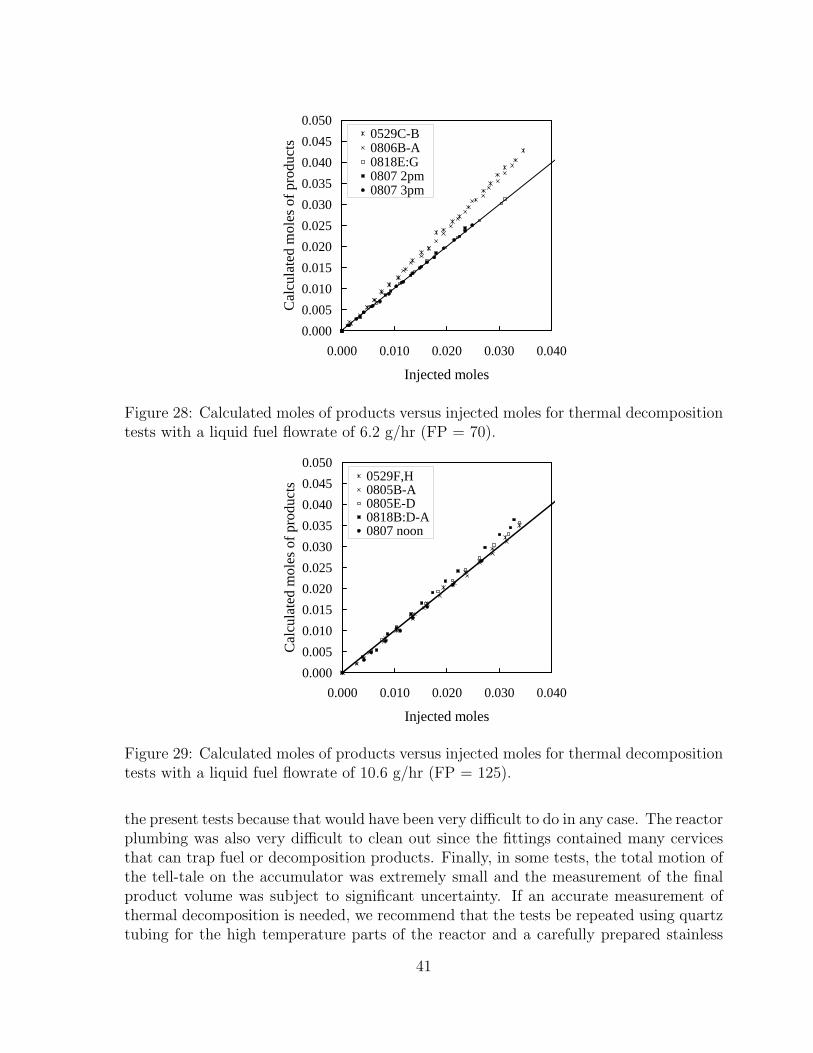
0.000
0.005
0.010
0.015
0.020
0.025
0.030
0.035
0.040
0.045
0.050
0.000 0.010 0.020 0.030 0.040
Injected moles
Ca
lcu
late
d m
ole
s o
f pro
du
cts
0529C-B0806B-A0818E:G0807 2pm0807 3pm
Figure 28: Calculated moles of products versus injected moles for thermal decompositiontests with a liquid fuel flowrate of 6.2 g/hr (FP = 70).
0.000
0.005
0.010
0.015
0.020
0.025
0.030
0.035
0.040
0.045
0.050
0.000 0.010 0.020 0.030 0.040
Injected moles
Ca
lcu
late
d m
ole
s o
f pro
du
cts
0529F,H0805B-A0805E-D0818B:D-A0807 noon
Figure 29: Calculated moles of products versus injected moles for thermal decompositiontests with a liquid fuel flowrate of 10.6 g/hr (FP = 125).
the present tests because that would have been very difficult to do in any case. The reactorplumbing was also very difficult to clean out since the fittings contained many cervicesthat can trap fuel or decomposition products. Finally, in some tests, the total motion ofthe tell-tale on the accumulator was extremely small and the measurement of the finalproduct volume was subject to significant uncertainty. If an accurate measurement ofthermal decomposition is needed, we recommend that the tests be repeated using quartztubing for the high temperature parts of the reactor and a carefully prepared stainless
41

0.000
0.005
0.010
0.015
0.020
0.025
0.030
0.035
0.040
0.045
0.050
0.000 0.010 0.020 0.030 0.040
Injected moles
Ca
lcu
late
d m
ole
s o
f pro
du
cts
FP = 25FP = 70FP = 125
Figure 30: Calculated moles of products versus injected moles averaged over all thermaldecomposition tests for the different liquid fuel flowrates.
steel sample.Despite the variability, the cases at the two higher flow rates yielded average molar
conversion ratios between 0.95 and 1.05 and mass conversion amounts of less than 3%(Table 15). Reducing the liquid fuel flowrate from 10.6 g/hr to 2.3 g/hr results inincreasing the average mass conversion up to 6% in the most extreme case (Table 14).The variability in the mass conversion ratios is probably associated with the difficulty influshing the JP-10 from the system between runs, condensation of JP-10 in cold spots,and the saturation of the column and detector due to the very high concentration ofJP-10.
As described in the test procedures section, the chromatograms were split into regionscorresponding to compounds with the same number of carbon atoms. The area underthe detector signal in each region is summed and divided by the total area under thesignal in all the regions. A representative GC sample of a thermal decomposition testappears in Fig. 32 and is very similar to the chromatogram of liquid JP-10 (Fig. 18).
For most tests, multiple GC samples were taken from the accumulator. The productcomposition for multiple GC samples taken during individual tests as a function of theliquid fuel flowrate appears in Fig. 33, 34, 35, 36, and 37. In the plots, the JP-10(C10) composition was not plotted for clarity. Table 15 contains the percent conversionscalculated for each GC sample and the average percent conversion of each test with thereactor panel. The mole ratio is plotted as a function of the mass conversion fraction inFig. 42. Clearly, the conversion amounts and the molar ratios have too much variabilityto be draw any conclusions about an average molar mass of the products.
The product composition of all tests at the same liquid fuel flowrate appears in Fig.38, 39, and 40. Tests in which multiple GC samples were taken were averaged. Finally,the product compositions were averaged enabling a direct comparison of the effect of fuel
42
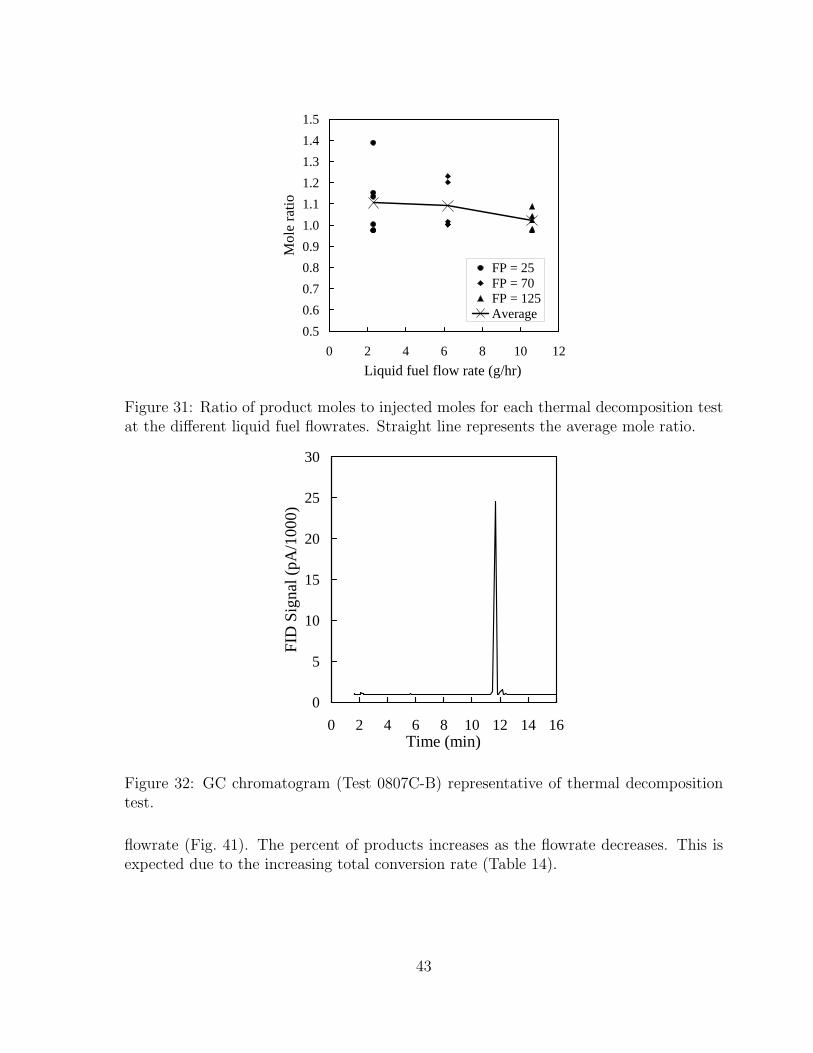
0.5
0.6
0.7
0.8
0.9
1.0
1.1
1.2
1.3
1.4
1.5
0 2 4 6 8 10 12
Liquid fuel flow rate (g/hr)
Mo
le r
atio
FP = 25FP = 70FP = 125Average
Figure 31: Ratio of product moles to injected moles for each thermal decomposition testat the different liquid fuel flowrates. Straight line represents the average mole ratio.
0
5
10
15
20
25
30
0 2 4 6 8 10 12 14 16Time (min)
FID
Sig
na
l (p
A/1
00
0)
Figure 32: GC chromatogram (Test 0807C-B) representative of thermal decompositiontest.
flowrate (Fig. 41). The percent of products increases as the flowrate decreases. This isexpected due to the increasing total conversion rate (Table 14).
43
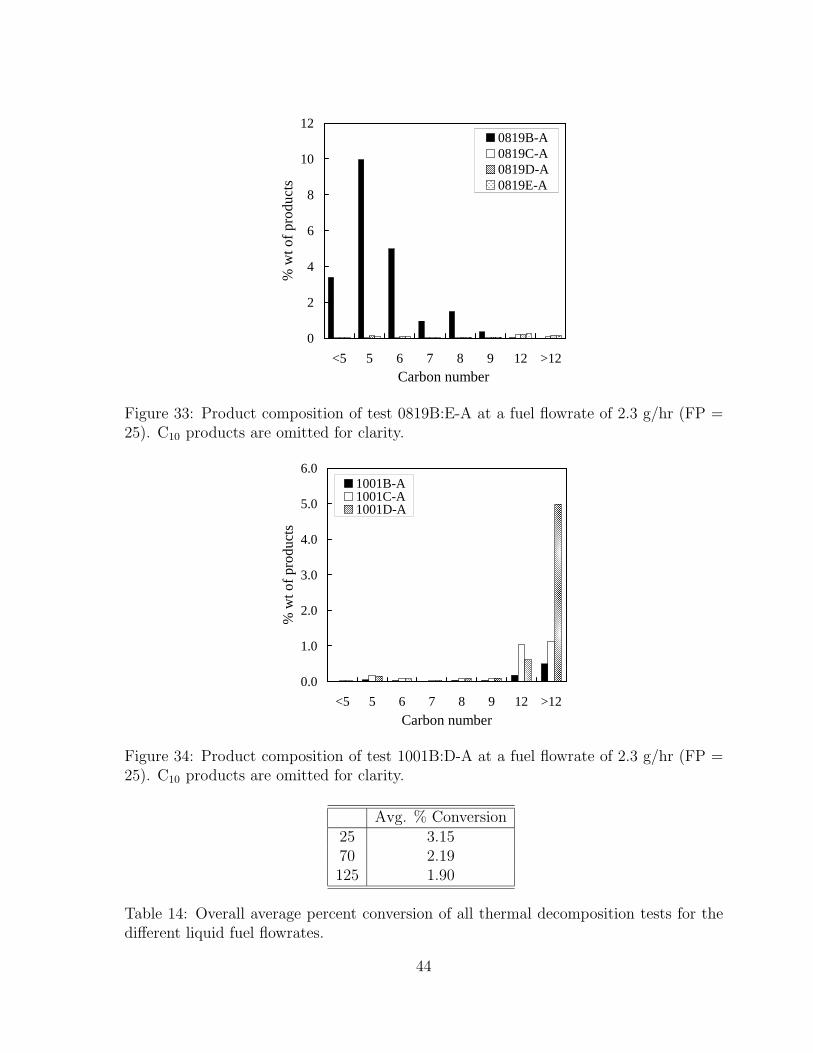
0
2
4
6
8
10
12
<5 5 6 7 8 9 12 >12Carbon number
% w
t of p
rod
uct
s
0819B-A0819C-A0819D-A0819E-A
Figure 33: Product composition of test 0819B:E-A at a fuel flowrate of 2.3 g/hr (FP =25). C10 products are omitted for clarity.
0.0
1.0
2.0
3.0
4.0
5.0
6.0
<5 5 6 7 8 9 12 >12
Carbon number
% w
t of p
rod
uct
s
1001B-A1001C-A1001D-A
Figure 34: Product composition of test 1001B:D-A at a fuel flowrate of 2.3 g/hr (FP =25). C10 products are omitted for clarity.
Avg. % Conversion25 3.1570 2.19125 1.90
Table 14: Overall average percent conversion of all thermal decomposition tests for thedifferent liquid fuel flowrates.
44
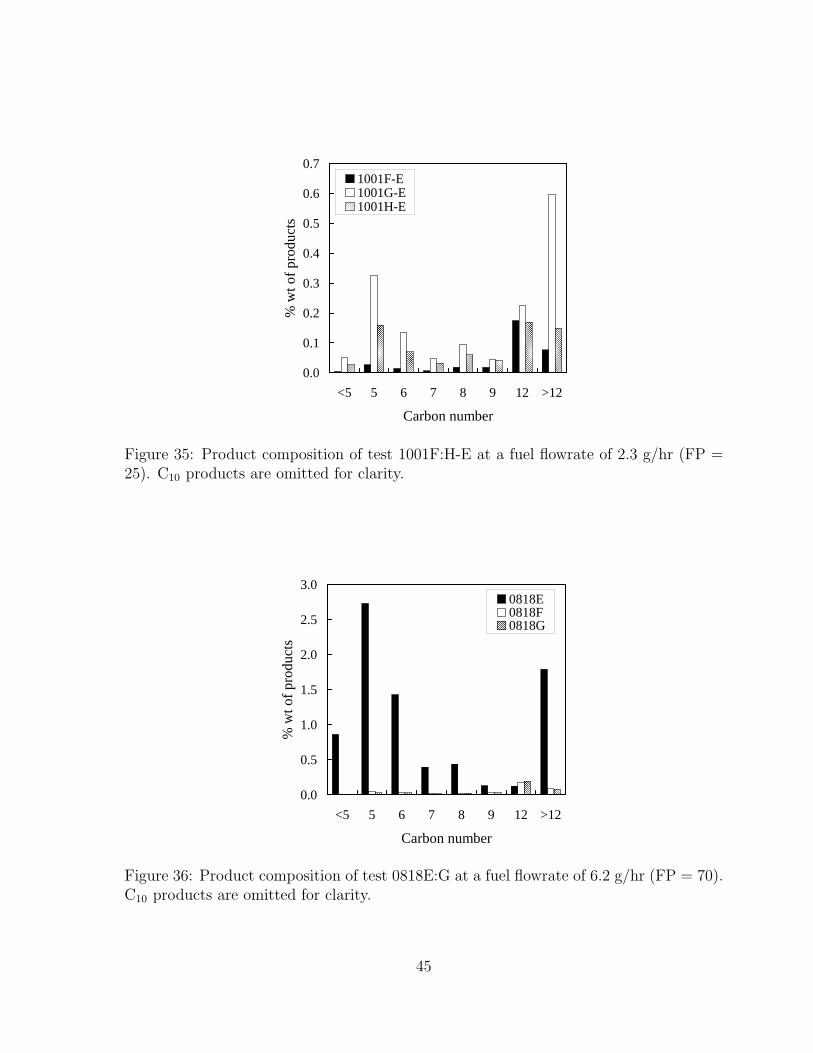
0.0
0.1
0.2
0.3
0.4
0.5
0.6
0.7
<5 5 6 7 8 9 12 >12
Carbon number
% w
t of p
rod
uct
s
1001F-E1001G-E1001H-E
Figure 35: Product composition of test 1001F:H-E at a fuel flowrate of 2.3 g/hr (FP =25). C10 products are omitted for clarity.
0.0
0.5
1.0
1.5
2.0
2.5
3.0
<5 5 6 7 8 9 12 >12
Carbon number
% w
t of p
rod
uct
s
0818E0818F0818G
Figure 36: Product composition of test 0818E:G at a fuel flowrate of 6.2 g/hr (FP = 70).C10 products are omitted for clarity.
45
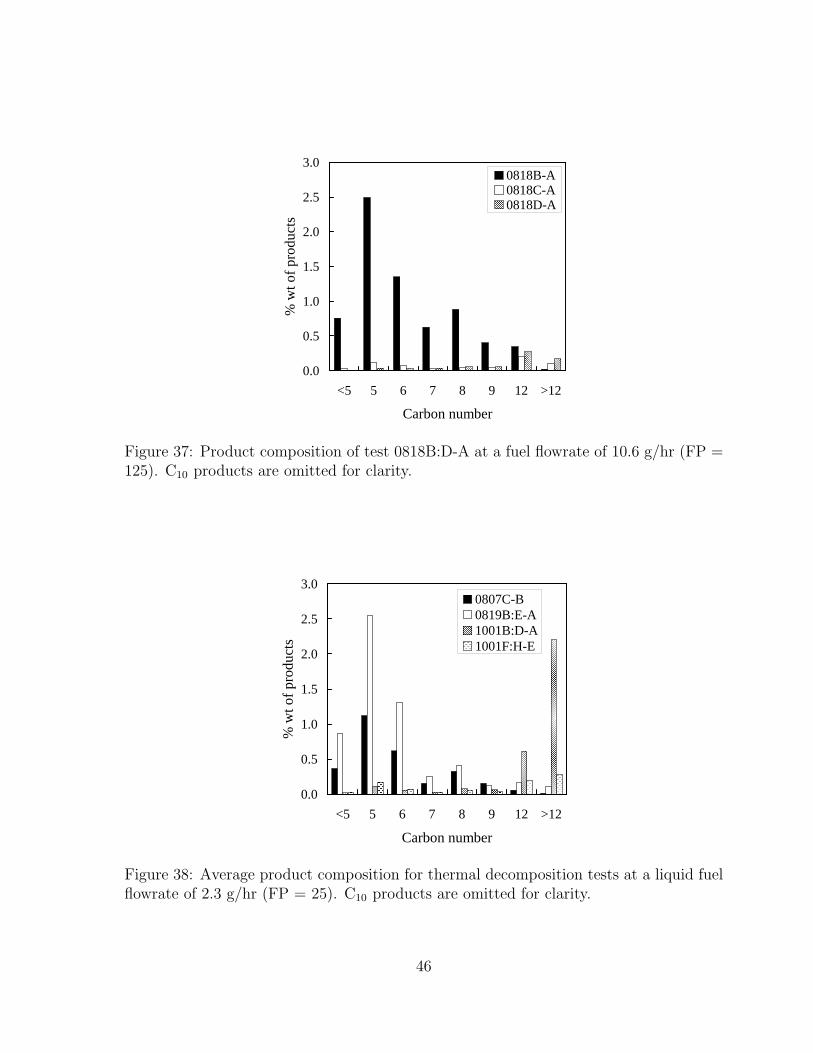
0.0
0.5
1.0
1.5
2.0
2.5
3.0
<5 5 6 7 8 9 12 >12
Carbon number
% w
t of p
rod
uct
s
0818B-A0818C-A0818D-A
Figure 37: Product composition of test 0818B:D-A at a fuel flowrate of 10.6 g/hr (FP =125). C10 products are omitted for clarity.
0.0
0.5
1.0
1.5
2.0
2.5
3.0
<5 5 6 7 8 9 12 >12
Carbon number
% w
t of p
rod
uct
s
0807C-B0819B:E-A1001B:D-A1001F:H-E
Figure 38: Average product composition for thermal decomposition tests at a liquid fuelflowrate of 2.3 g/hr (FP = 25). C10 products are omitted for clarity.
46
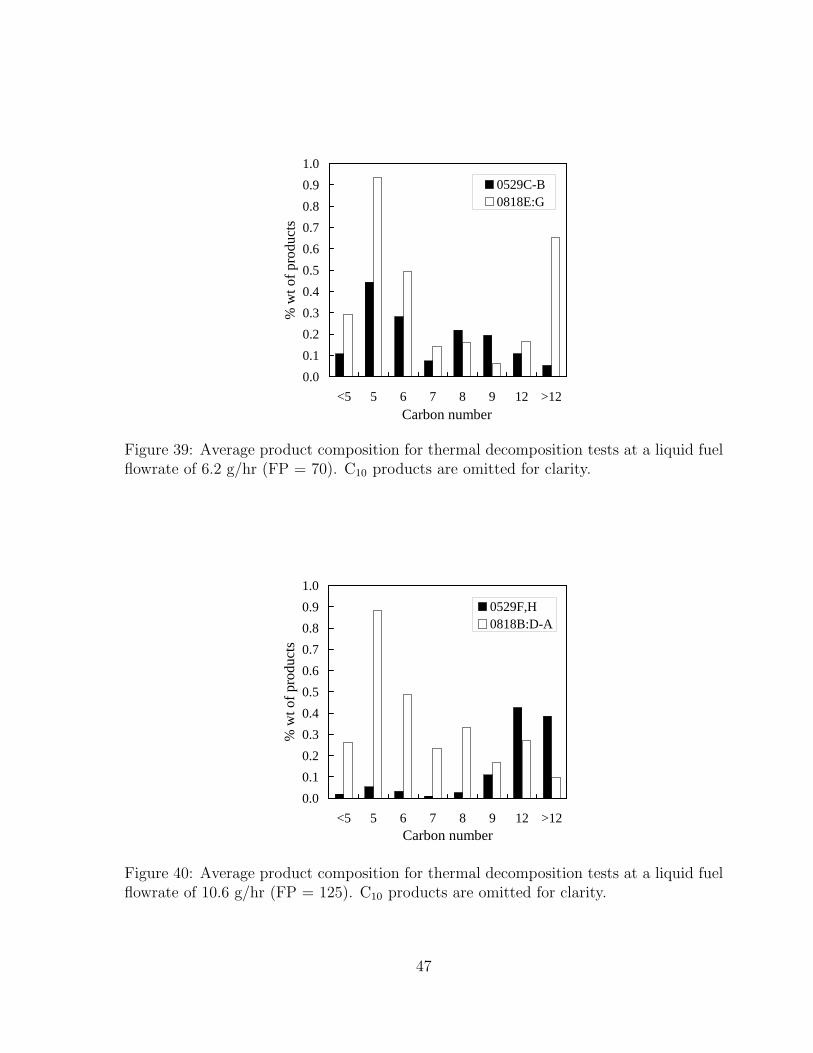
0.0
0.1
0.2
0.3
0.4
0.5
0.6
0.7
0.8
0.9
1.0
<5 5 6 7 8 9 12 >12Carbon number
% w
t of p
rod
uct
s
0529C-B0818E:G
Figure 39: Average product composition for thermal decomposition tests at a liquid fuelflowrate of 6.2 g/hr (FP = 70). C10 products are omitted for clarity.
0.0
0.1
0.2
0.3
0.4
0.5
0.6
0.7
0.8
0.9
1.0
<5 5 6 7 8 9 12 >12Carbon number
% w
t of p
rod
uct
s
0529F,H0818B:D-A
Figure 40: Average product composition for thermal decomposition tests at a liquid fuelflowrate of 10.6 g/hr (FP = 125). C10 products are omitted for clarity.
47
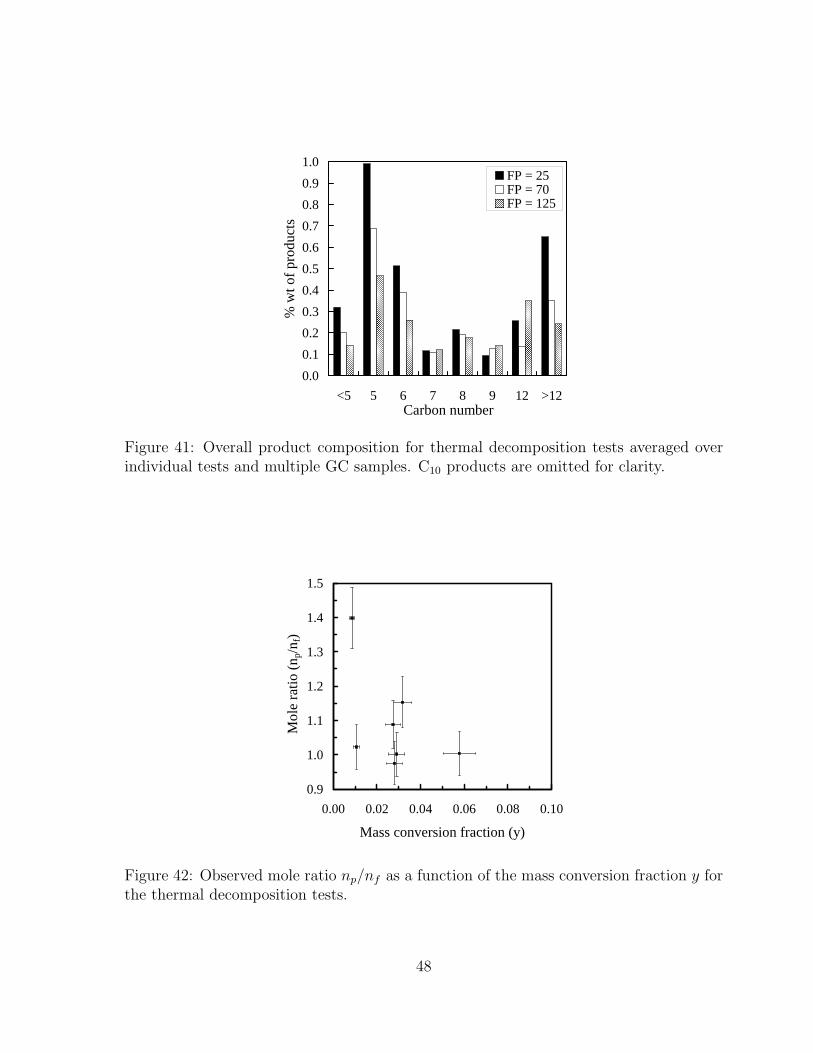
0.0
0.1
0.2
0.3
0.4
0.5
0.6
0.7
0.8
0.9
1.0
<5 5 6 7 8 9 12 >12Carbon number
% w
t of p
rod
uct
s
FP = 25FP = 70FP = 125
Figure 41: Overall product composition for thermal decomposition tests averaged overindividual tests and multiple GC samples. C10 products are omitted for clarity.
0.9
1.0
1.1
1.2
1.3
1.4
1.5
0.00 0.02 0.04 0.06 0.08 0.10
Mass conversion fraction (y)
Mo
le r
atio
(n p
/nf)
Figure 42: Observed mole ratio np/nf as a function of the mass conversion fraction y forthe thermal decomposition tests.
48
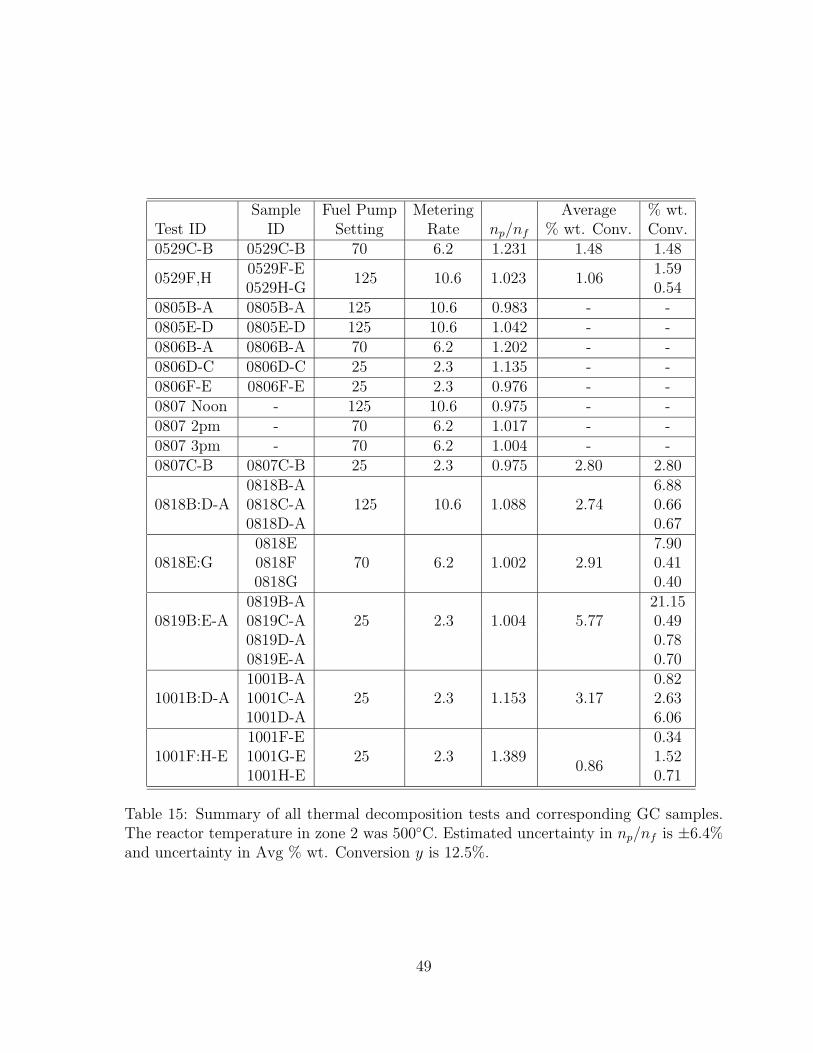
Sample Fuel Pump Metering Average % wt.Test ID ID Setting Rate np/nf % wt. Conv. Conv.0529C-B 0529C-B 70 6.2 1.231 1.48 1.48
0529F,H0529F-E
125 10.6 1.023 1.061.59
0529H-G 0.540805B-A 0805B-A 125 10.6 0.983 - -0805E-D 0805E-D 125 10.6 1.042 - -0806B-A 0806B-A 70 6.2 1.202 - -0806D-C 0806D-C 25 2.3 1.135 - -0806F-E 0806F-E 25 2.3 0.976 - -0807 Noon - 125 10.6 0.975 - -0807 2pm - 70 6.2 1.017 - -0807 3pm - 70 6.2 1.004 - -0807C-B 0807C-B 25 2.3 0.975 2.80 2.80
0818B:D-A0818B-A
125 10.6 1.088 2.746.88
0818C-A 0.660818D-A 0.67
0818E:G0818E
70 6.2 1.002 2.917.90
0818F 0.410818G 0.40
0819B:E-A0819B-A
25 2.3 1.004 5.7721.15
0819C-A 0.490819D-A 0.780819E-A 0.70
1001B:D-A1001B-A
25 2.3 1.153 3.170.82
1001C-A 2.631001D-A 6.06
1001F:H-E1001F-E
25 2.3 1.3890.86
0.341001G-E 1.521001H-E 0.71
Table 15: Summary of all thermal decomposition tests and corresponding GC samples.The reactor temperature in zone 2 was 500◦C. Estimated uncertainty in np/nf is ±6.4%and uncertainty in Avg % wt. Conversion y is 12.5%.
49

8 Catalytic cracking
8.1 Zeolite preparation
The zeolite Y powder with a Si/Al ratio (SAR) of 6.0 was obtained in sodium form. Itwas protonated by ion exchange with aluminum nitrate. A 1 M solution of ammoniumnitrate was made by mixing 80 g of solid NH4NO3 with 1 L of distilled water. Thesolution was stirred until it was completely mixed. The zeolite powder was then mixedat a ratio of 1 g of zeolite for every 100 ml of solution and allowed to stir for at least12 hours. The zeolite was then filtered from the solution using a flask with a faucetaspirator. A new solution of ammonium nitrate was made and the zeolite returned tothe flask for another 12 hours of mixing. This process was repeated 4 times.
After filtering the zeolite powder from the solution for the final time, the zeolite wasplaced in a ceramic crucible and calcined in a temperature controlled oven. The ovenfacility contained gas inlets which were connected to metered dry air and nitrogen forcontrol of the internal oven environment. For the calcination procedure, the zeolite inthe crucible was placed in the oven and dry nitrogen was allowed to flow through theoven. The oven temperature was increased at a rate of 5◦C/min from 30 to 250◦C. It washeld at 250◦C for 4 hrs and then increased at the same rate to a temperature of 500◦C.It was held at this temperature for approximately 6 hrs.
The zeolite powder is formed into pellets by first compressing the powder into smalldisks. Two meshes (#60 and #45) were used with a pestle to break the disks into pellets.The pellets on the #60 mesh were saved for installation into the reactor.
After each test, the zeolite was found to be coked and no longer effective in causingcracking reactions with the hydrocarbon sample. Regeneration of the zeolite could restorethe activity of the pellets. This was conducted by placing the coked zeolite into a crucibleand placing it into the oven. The dry nitrogen was allowed to flow through the oven whilethe temperature was increased from 30 to 200◦C at a rate of 1◦C/min. It was held at200◦C for 3 hrs. Then the nitrogen supply was turned off and the air supply turned on.The temperature was increased again at the same rate to 550◦C then allowed to cool toroom temperature in the air environment.
8.2 Test results
8.2.1 Effect of zeolite activity
For a zeolite to act as a catalyst in the HC reactions, it must have active sites. These arethe sites generated in the ion exchange and calcination procedures forming a Bronstedacid base. When a zeolite becomes coked, the active sites become clogged with carbondeposits preventing the sites from participating in reactions with the surrounding hy-drocarbon. During tests with the different zeolites, it was determined that the catalystbecame coked after a single test at the nominal test conditions of approximately 4.8 mlof JP-10 injected and a reactor temperature of 500◦C. This is observed by comparingthe conversion of two subsequent runs without zeolite replacement in between. The mole
50

balance for the first run with zeolite pellets containing active sites (test 0524D,G,I) andthe mole balance for the second run where the zeolite active sites have become blockedappear in Fig. 43. The ratio of product moles to injected moles for the active zeolite is
0.000
0.010
0.020
0.030
0.040
0.050
0.060
0.000 0.010 0.020 0.030 0.040Injected moles
Ca
lcu
late
d m
ole
s o
f pro
du
cts
0524D,G,I0524K-J
Figure 43: Comparison of moles of product to moles of injected JP-10 with HY zeolitewith active sites and coked HY zeolite. Fuel flowrate is 10.6 g/hr (FP = 125). Reactortemperature in zone 2 was 500◦C.
1.510 whereas the ratio for the coked zeolite is 1.026. This value compares to the thermalcracking runs which had an average mole ratio of 1.022 at a fuel flowrate of 10.6 g/hr(FP = 125) illustrating that a coked zeolite does not contribute to catalytic cracking ofthe sample hydrocarbon.
As mentioned above, the active sites of a zeolite may be regenerated by burningoff the coke deposits in an air environment at elevated temperatures. Throughout thecourse of testing with the reactor panel, the first batch of zeolite pellets was regeneratedin addition to making a second batch of HY zeolite pellets. To verify conversion ratesand zeolite reactivity between the different batches of zeolite pellets, repeat tests wereconducted. The mole balance results comparing the first and second zeolite batchesat a fuel flowrate of 2.3 g/hr (FP = 25) appear in Fig. 44. The reactivity of the twobatches appear similar except for test 0815B:E-A. The percent conversion of this testis an average of 55% greater than the other tests and may be due to installation of anew stainless steel central reactor tube instigating additional surface reactions increasingthe conversion rate. At the time of these initial tests, the effect of stainless steel surfacereactivity was not known nor accounted for.
The mole balance comparison between the first zeolite batch and the regenerated firstbatch appear in Fig. 45 at a fuel flowrate of 10.6 g/hr (FP = 125). The results are similarand the ratio of product moles to injected moles is an average of 1.472 and 1.583 for theoriginal and regenerated batches, respectively.
51
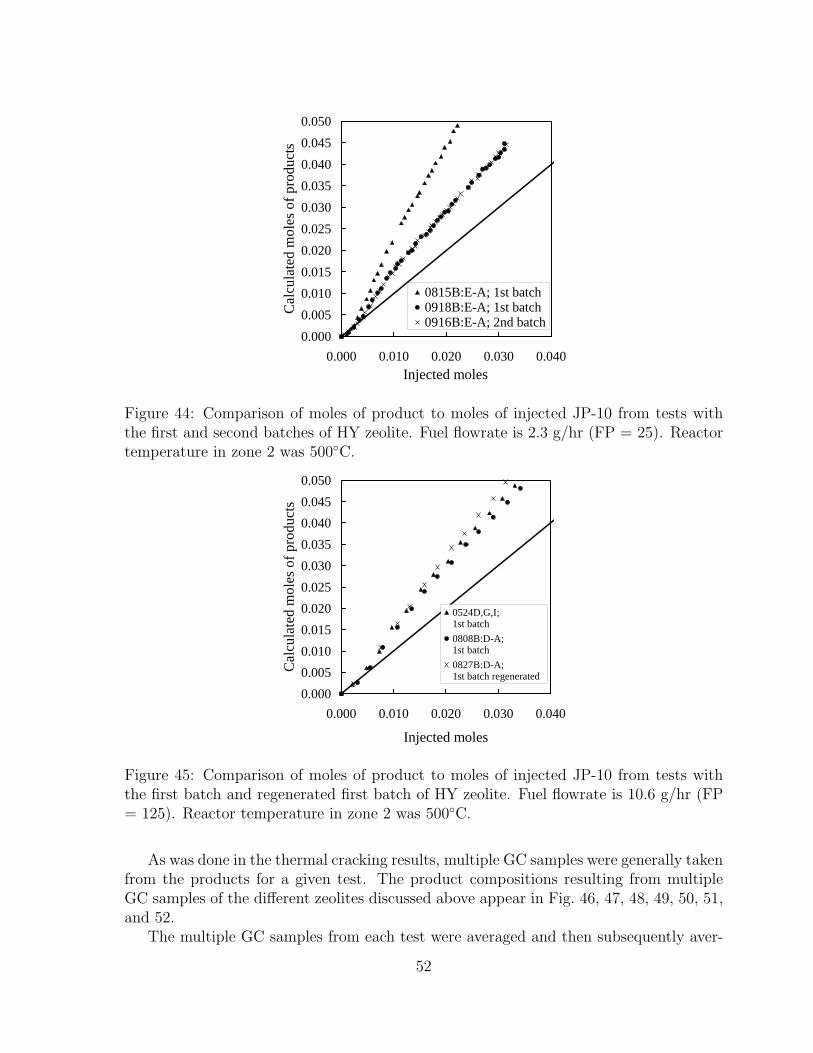
0.000
0.005
0.010
0.015
0.020
0.025
0.030
0.035
0.040
0.045
0.050
0.000 0.010 0.020 0.030 0.040Injected moles
Ca
lcu
late
d m
ole
s o
f pro
du
cts
0815B:E-A; 1st batch0918B:E-A; 1st batch0916B:E-A; 2nd batch
Figure 44: Comparison of moles of product to moles of injected JP-10 from tests withthe first and second batches of HY zeolite. Fuel flowrate is 2.3 g/hr (FP = 25). Reactortemperature in zone 2 was 500◦C.
0.000
0.005
0.010
0.015
0.020
0.025
0.030
0.035
0.040
0.045
0.050
0.000 0.010 0.020 0.030 0.040
Injected moles
Ca
lcu
late
d m
ole
s o
f pro
du
cts
0524D,G,I; 1st batch
0808B:D-A; 1st batch
0827B:D-A; 1st batch regenerated
Figure 45: Comparison of moles of product to moles of injected JP-10 from tests withthe first batch and regenerated first batch of HY zeolite. Fuel flowrate is 10.6 g/hr (FP= 125). Reactor temperature in zone 2 was 500◦C.
As was done in the thermal cracking results, multiple GC samples were generally takenfrom the products for a given test. The product compositions resulting from multipleGC samples of the different zeolites discussed above appear in Fig. 46, 47, 48, 49, 50, 51,and 52.
The multiple GC samples from each test were averaged and then subsequently aver-
52

0
2
4
6
8
10
12
<5 5 6 7 8 9 12 >12Carbon number
% w
t of p
rod
uct
s
0524D-C0524G-F0524I-H
Figure 46: Product composition of test 0524D,G,I with the first batch of HY zeolite at afuel flowrate of 10.6 g/hr (FP = 125). The C10 products are omitted for clarity.
0.0
0.1
0.2
0.3
0.4
0.5
0.6
0.7
0.8
0.9
1.0
<5 5 6 7 8 9 12 >12
Carbon number
% w
t of p
rod
uct
s
0524K-J
Figure 47: Product composition of test 0524K-J with the first batch of HY zeolite thatwas coked at a fuel flowrate of 6.2 g/hr (FP = 70). The C10 products are omitted forclarity.
aged across similar zeolite batches to generate the comparisons of Fig. 53 and 54. Theactivity between the first and second batches of HY zeolite is similar. The average percentconversion at a fuel flowrate of 2.3 g/hr for the first batch is 33.62% while the percentconversion for the second batch is 35.52%. Activity between the first batch and the re-generated first batch is not as similar. The average percent conversion at a fuel flowrateof 10.6 g/hr for the first batch is 31.45% while the conversion for the regenerated zeolite
53

0
2
4
6
8
10
12
14
<5 5 6 7 8 9 12 >12Carbon number
% w
t of p
rod
uct
s
0815B-A0815C-A0815D-A0815E-A
Figure 48: Product composition of test 0815B:E-A with the first batch of HY zeolite ata fuel flowrate of 2.3 g/hr (FP = 25). The C10 products are omitted for clarity.
0
5
10
15
20
25
30
35
40
45
50
<5 5 6 7 8 9 12 >12Carbon number
% w
t of p
rod
uct
s
0918B-A0918C-A0918D-A0918E-A
Figure 49: Product composition of test 0918B:E-A with the first batch of HY zeolite ata fuel flowrate of 2.3 g/hr (FP = 25). The C10 products are omitted for clarity.
is 61.41%. It is not understood why such a high conversion is observed in the regeneratedHY zeolite, especially since the mole balance results are very similar to the results of thefirst batch (Fig. 45). An error in the product composition analysis seems a likely causeof this discrepancy.
54
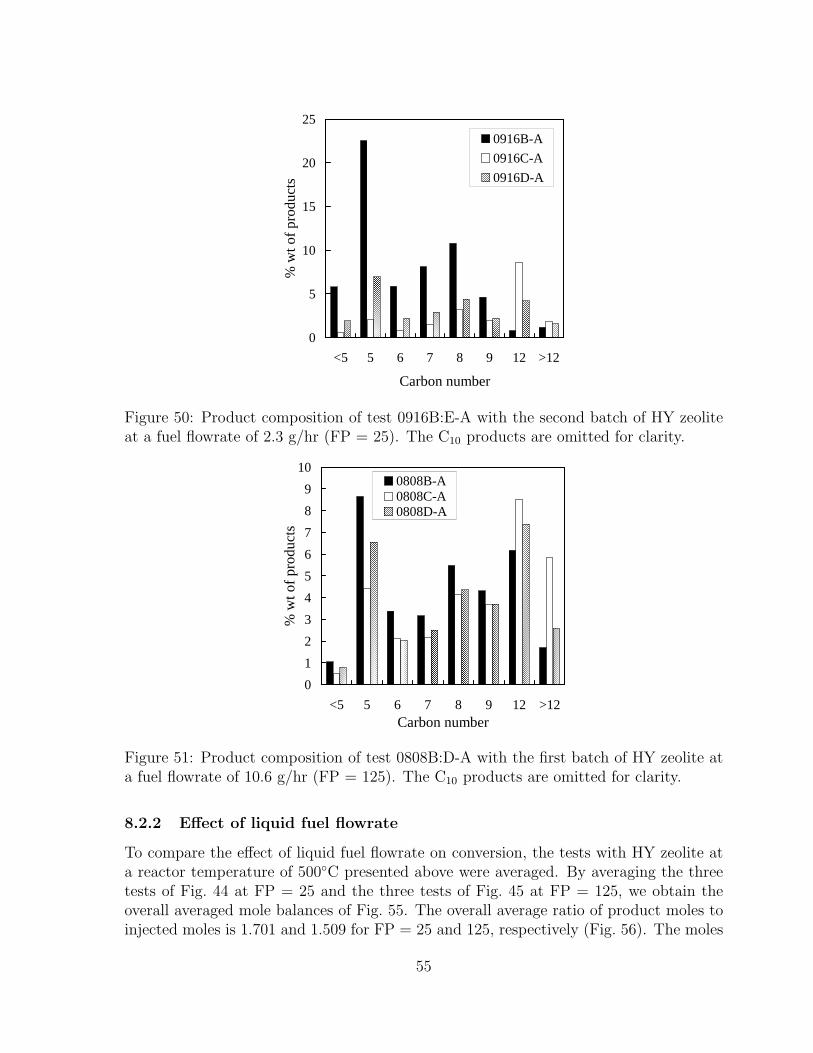
0
5
10
15
20
25
<5 5 6 7 8 9 12 >12
Carbon number
% w
t of p
rod
uct
s
0916B-A
0916C-A
0916D-A
Figure 50: Product composition of test 0916B:E-A with the second batch of HY zeoliteat a fuel flowrate of 2.3 g/hr (FP = 25). The C10 products are omitted for clarity.
0
1
2
3
4
5
6
7
8
9
10
<5 5 6 7 8 9 12 >12Carbon number
% w
t of p
rod
uct
s
0808B-A0808C-A0808D-A
Figure 51: Product composition of test 0808B:D-A with the first batch of HY zeolite ata fuel flowrate of 10.6 g/hr (FP = 125). The C10 products are omitted for clarity.
8.2.2 Effect of liquid fuel flowrate
To compare the effect of liquid fuel flowrate on conversion, the tests with HY zeolite ata reactor temperature of 500◦C presented above were averaged. By averaging the threetests of Fig. 44 at FP = 25 and the three tests of Fig. 45 at FP = 125, we obtain theoverall averaged mole balances of Fig. 55. The overall average ratio of product moles toinjected moles is 1.701 and 1.509 for FP = 25 and 125, respectively (Fig. 56). The moles
55

0
5
10
15
20
25
<5 5 6 7 8 9 12 >12Carbon number
% w
t of p
rod
uct
s
0827B-A0827C-A0827D-A
Figure 52: Product composition of test 0827B:D-A with the regenerated first batch ofHY zeolite at a fuel flowrate of 10.6 g/hr (FP = 125). The C10 products are omitted forclarity.
0
2
4
6
8
10
12
<5 5 6 7 8 9 12 >12Carbon number
% w
t of p
rod
uct
s
1st batch2nd batch
Figure 53: Comparison of product compositions between the first and second batches ofHY zeolite. Compositions are averaged over multiple samples per test and multiple tests.Fuel flowrate is 2.3 g/hr (FP = 25). The C10 products are omitted for clarity.
of products increase 11.3% as the fuel flow rate decreases from 10.6 to 2.3 g/hr.Because these data were obtained at a reactor temperature of 500◦C, thermal cracking
reactions are expected as shown in the previous section. These thermal reactions result ina small conversion (Table 14). Thus, we correct the catalytic cracking data by subtractingthe product moles created due to the thermal cracking reactions (Fig. 57). However,
56
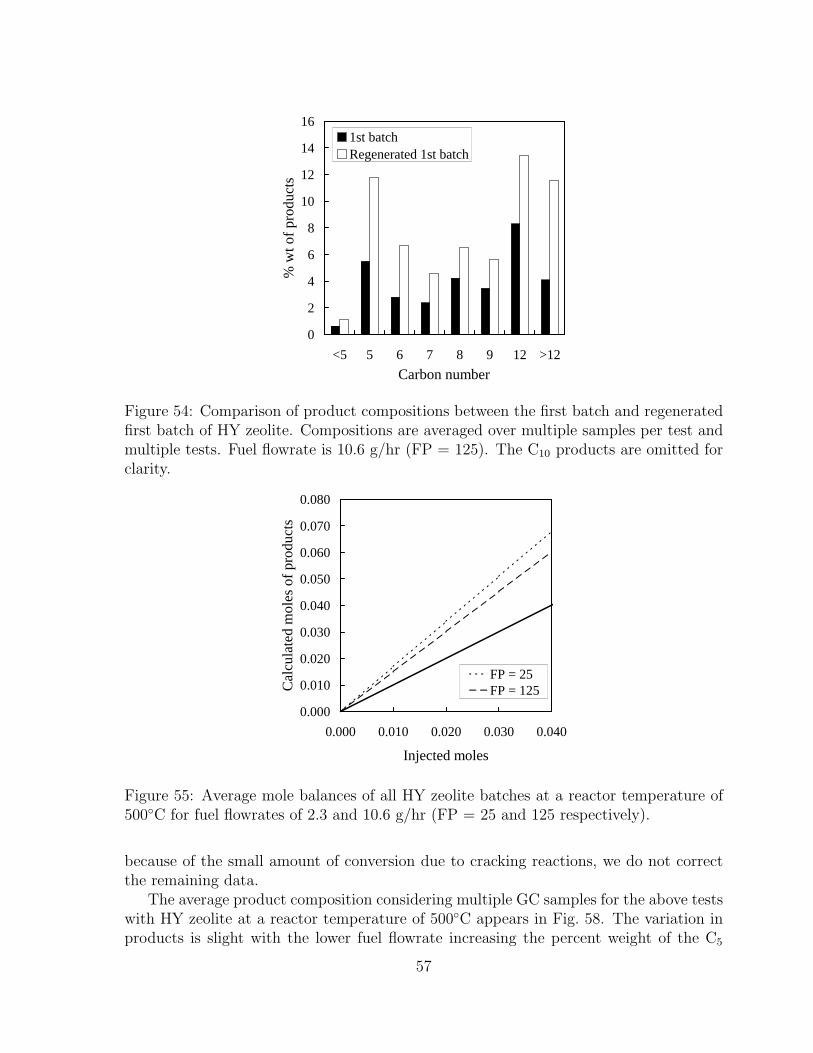
0
2
4
6
8
10
12
14
16
<5 5 6 7 8 9 12 >12
Carbon number
% w
t of p
rod
uct
s
1st batchRegenerated 1st batch
Figure 54: Comparison of product compositions between the first batch and regeneratedfirst batch of HY zeolite. Compositions are averaged over multiple samples per test andmultiple tests. Fuel flowrate is 10.6 g/hr (FP = 125). The C10 products are omitted forclarity.
0.000
0.010
0.020
0.030
0.040
0.050
0.060
0.070
0.080
0.000 0.010 0.020 0.030 0.040
Injected moles
Ca
lcu
late
d m
ole
s o
f pro
du
cts
FP = 25FP = 125
Figure 55: Average mole balances of all HY zeolite batches at a reactor temperature of500◦C for fuel flowrates of 2.3 and 10.6 g/hr (FP = 25 and 125 respectively).
because of the small amount of conversion due to cracking reactions, we do not correctthe remaining data.
The average product composition considering multiple GC samples for the above testswith HY zeolite at a reactor temperature of 500◦C appears in Fig. 58. The variation inproducts is slight with the lower fuel flowrate increasing the percent weight of the C5
57

0.0
0.5
1.0
1.5
2.0
2.5
0 2 4 6 8 10 12Liquid fuel flow rate (g/hr)
Mo
le r
atio
FP = 25FP = 125Average
Figure 56: Ratio of product moles to injected moles for tests with HY zeolite. The averageratio is denoted by a straight line. This data is not corrected for thermal cracking.
0.000
0.010
0.020
0.030
0.040
0.050
0.060
0.070
0.080
0.000 0.010 0.020 0.030 0.040Injected moles
Ca
lcu
late
d m
ole
s o
f pro
du
cts
(co
rre
cte
d)
FP = 25FP = 125
Figure 57: Ratio of product moles to injected moles corrected for conversion due tothermal cracking for tests with HY zeolite.
components approximately 2% and decreasing the coking products (>C10) by a total of9%. These large carbon number compounds are indicative of coke and coke precursors.The formation of these deposits is known to be accelerated at higher flowrates whichcorrespond to higher Reynolds numbers [24, 21]. From Table 17, the overall averageconversion of HY zeolite at a fuel flowrate of 2.3 g/hr (FP = 25) is 34% while the overallaverage conversion at a fuel flowrate of 10.6 g/hr (FP = 125) is 41%.
58

0
2
4
6
8
10
12
<5 5 6 7 8 9 12 >12Carbon number
% w
t of p
rod
uct
s
FP = 25FP = 125
Figure 58: Averaged product composition as a function of liquid fuel flowrate for HYzeolite. The C10 products are omitted for clarity.
8.2.3 Effect of zeolite type
Zeolites Beta and ultrastable-Y (USY) were also tested at the nominal reactor conditionsof 500◦C and a fuel flowrate of 2.3 g/hr (FP = 25). A single test was conducted witheach zeolite and the mole balance results are compared with the overall average HY dataat the same fuel flowrate (Fig. 59). The USY had a much lower activity observed by a
0.000
0.010
0.020
0.030
0.040
0.050
0.060
0.070
0.000 0.010 0.020 0.030 0.040
Injected moles
Ca
lcu
late
d m
ole
s o
f pro
du
cts
Average HY0920B:D-A, Beta0922D:F-C, USY
Figure 59: Ratio of product moles to injected moles for tests with different zeolites.
mole ratio of 1.137. The Beta and HY zeolites had similar activities as observed by moleratios of 1.667 and 1.701, respectively. It should be noted that the pore diameters of HY
59
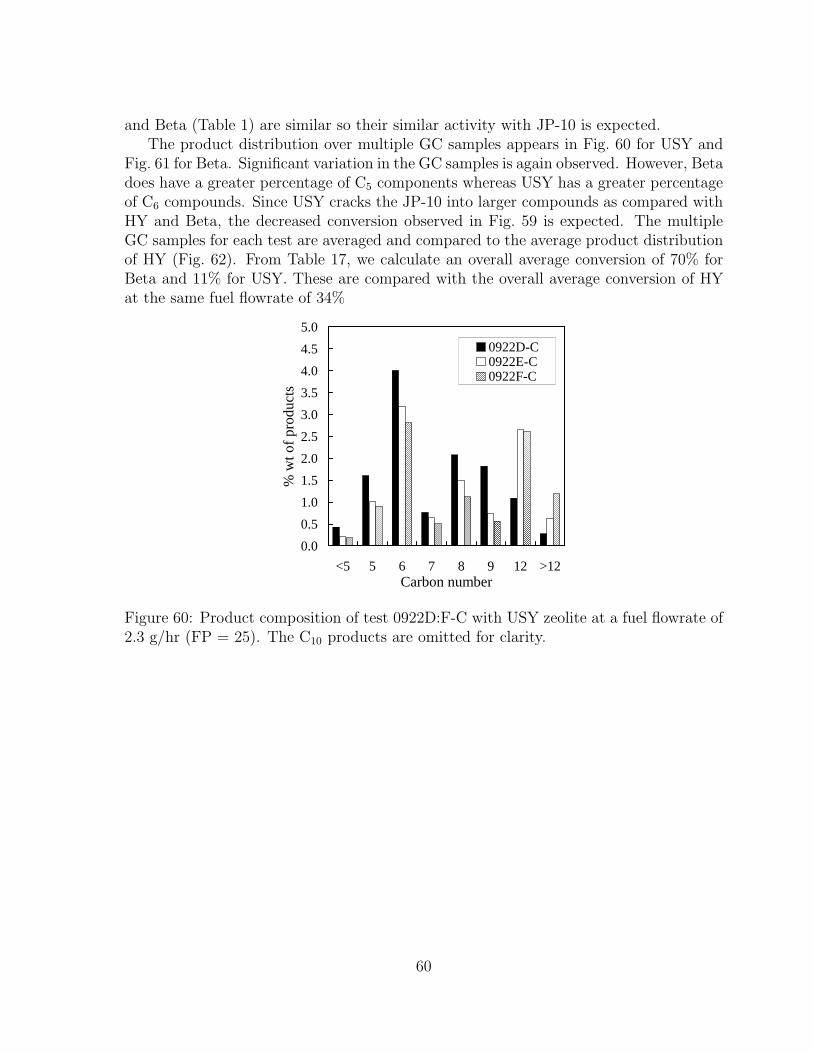
and Beta (Table 1) are similar so their similar activity with JP-10 is expected.The product distribution over multiple GC samples appears in Fig. 60 for USY and
Fig. 61 for Beta. Significant variation in the GC samples is again observed. However, Betadoes have a greater percentage of C5 components whereas USY has a greater percentageof C6 compounds. Since USY cracks the JP-10 into larger compounds as compared withHY and Beta, the decreased conversion observed in Fig. 59 is expected. The multipleGC samples for each test are averaged and compared to the average product distributionof HY (Fig. 62). From Table 17, we calculate an overall average conversion of 70% forBeta and 11% for USY. These are compared with the overall average conversion of HYat the same fuel flowrate of 34%
0.0
0.5
1.0
1.5
2.0
2.5
3.0
3.5
4.0
4.5
5.0
<5 5 6 7 8 9 12 >12Carbon number
% w
t of p
rod
uct
s
0922D-C0922E-C0922F-C
Figure 60: Product composition of test 0922D:F-C with USY zeolite at a fuel flowrate of2.3 g/hr (FP = 25). The C10 products are omitted for clarity.
60

0
10
20
30
40
50
60
<5 5 6 7 8 9 12 >12Carbon number
% w
t of p
rod
uct
s
0920B-A0920C-A0920D-A
Figure 61: Product composition of test 0920B:D-A with Beta zeolite at a fuel flowrateof 2.3 g/hr (FP = 25). The C10 products are omitted for clarity.
0
5
10
15
20
25
30
35
<5 5 6 7 8 9 12 >12Carbon number
% w
t of p
rod
uct
s
HYBetaUSY
Figure 62: Average product composition comparing different zeolites at a fuel flowrateof 2.3 g/hr (FP = 25). The C10 products omitted for clarity.
61
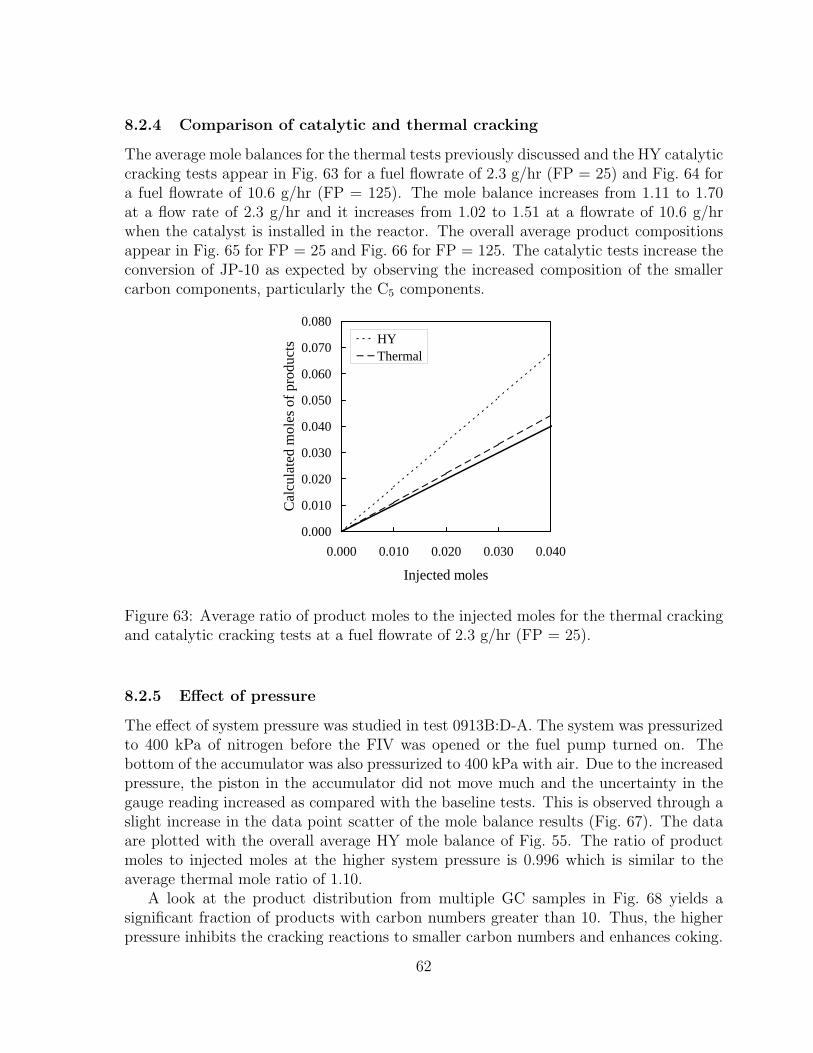
8.2.4 Comparison of catalytic and thermal cracking
The average mole balances for the thermal tests previously discussed and the HY catalyticcracking tests appear in Fig. 63 for a fuel flowrate of 2.3 g/hr (FP = 25) and Fig. 64 fora fuel flowrate of 10.6 g/hr (FP = 125). The mole balance increases from 1.11 to 1.70at a flow rate of 2.3 g/hr and it increases from 1.02 to 1.51 at a flowrate of 10.6 g/hrwhen the catalyst is installed in the reactor. The overall average product compositionsappear in Fig. 65 for FP = 25 and Fig. 66 for FP = 125. The catalytic tests increase theconversion of JP-10 as expected by observing the increased composition of the smallercarbon components, particularly the C5 components.
0.000
0.010
0.020
0.030
0.040
0.050
0.060
0.070
0.080
0.000 0.010 0.020 0.030 0.040
Injected moles
Ca
lcu
late
d m
ole
s o
f pro
du
cts
HYThermal
Figure 63: Average ratio of product moles to the injected moles for the thermal crackingand catalytic cracking tests at a fuel flowrate of 2.3 g/hr (FP = 25).
8.2.5 Effect of pressure
The effect of system pressure was studied in test 0913B:D-A. The system was pressurizedto 400 kPa of nitrogen before the FIV was opened or the fuel pump turned on. Thebottom of the accumulator was also pressurized to 400 kPa with air. Due to the increasedpressure, the piston in the accumulator did not move much and the uncertainty in thegauge reading increased as compared with the baseline tests. This is observed through aslight increase in the data point scatter of the mole balance results (Fig. 67). The dataare plotted with the overall average HY mole balance of Fig. 55. The ratio of productmoles to injected moles at the higher system pressure is 0.996 which is similar to theaverage thermal mole ratio of 1.10.
A look at the product distribution from multiple GC samples in Fig. 68 yields asignificant fraction of products with carbon numbers greater than 10. Thus, the higherpressure inhibits the cracking reactions to smaller carbon numbers and enhances coking.
62
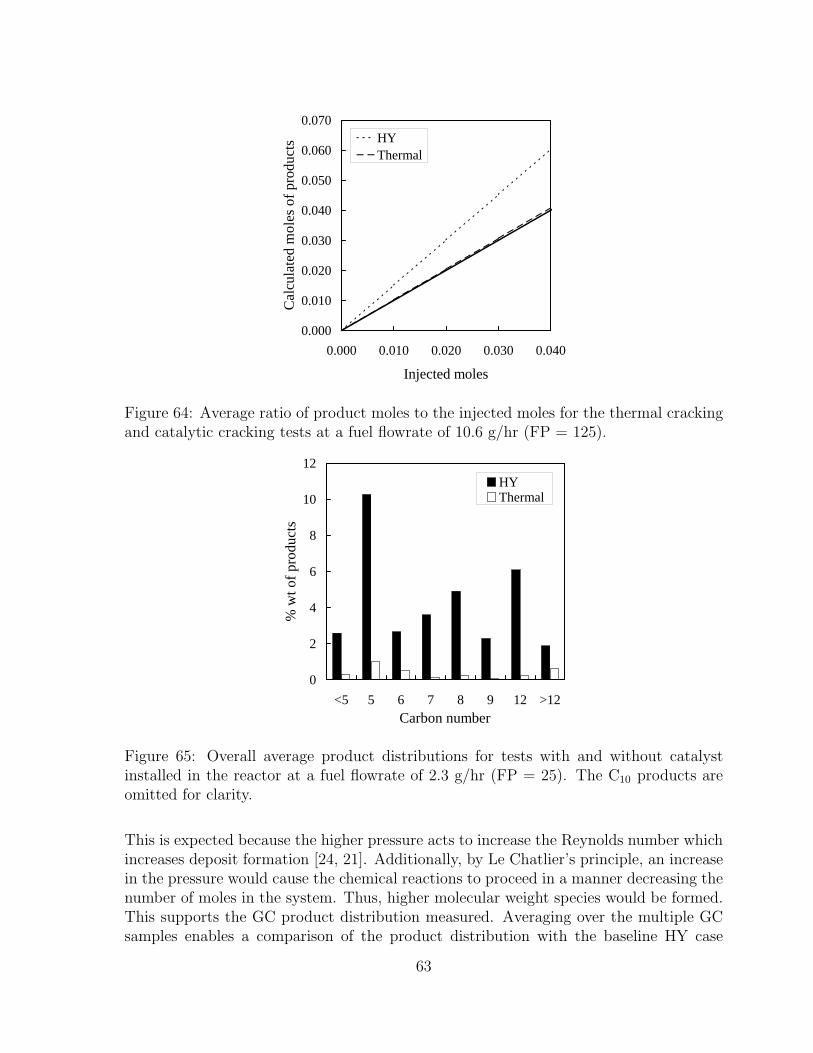
0.000
0.010
0.020
0.030
0.040
0.050
0.060
0.070
0.000 0.010 0.020 0.030 0.040
Injected moles
Ca
lcu
late
d m
ole
s o
f pro
du
cts
HYThermal
Figure 64: Average ratio of product moles to the injected moles for the thermal crackingand catalytic cracking tests at a fuel flowrate of 10.6 g/hr (FP = 125).
0
2
4
6
8
10
12
<5 5 6 7 8 9 12 >12Carbon number
% w
t of p
rod
uct
s
HYThermal
Figure 65: Overall average product distributions for tests with and without catalystinstalled in the reactor at a fuel flowrate of 2.3 g/hr (FP = 25). The C10 products areomitted for clarity.
This is expected because the higher pressure acts to increase the Reynolds number whichincreases deposit formation [24, 21]. Additionally, by Le Chatlier’s principle, an increasein the pressure would cause the chemical reactions to proceed in a manner decreasing thenumber of moles in the system. Thus, higher molecular weight species would be formed.This supports the GC product distribution measured. Averaging over the multiple GCsamples enables a comparison of the product distribution with the baseline HY case
63

0
2
4
6
8
10
12
<5 5 6 7 8 9 12 >12
Carbon number
% w
t of p
rod
uct
s
HYThermal
Figure 66: Overall average product distributions for tests with and without catalystinstalled in the reactor at a fuel flowrate of 10.6 g/hr (FP = 125). The C10 products areomitted for clarity.
0.000
0.005
0.010
0.015
0.020
0.025
0.030
0.035
0.040
0.045
0.050
0.000 0.010 0.020 0.030 0.040
Injected moles
Ca
lcu
late
d m
ole
s o
f pro
du
cts
Avg, 100 kPa
0913B:D-A, 400 kPa
Figure 67: Comparison of moles of product to moles of injected JP-10 in a system withHY zeolite at different system pressures. Fuel flowrate is 2.3 g/hr (FP = 25).
(Fig. 69). The increase in higher carbon components at the higher pressure is easilyobserved. The overall average conversion at a system pressure of 400 kPa is 53% versusthe conversion at atmospheric pressure of 34%.
64
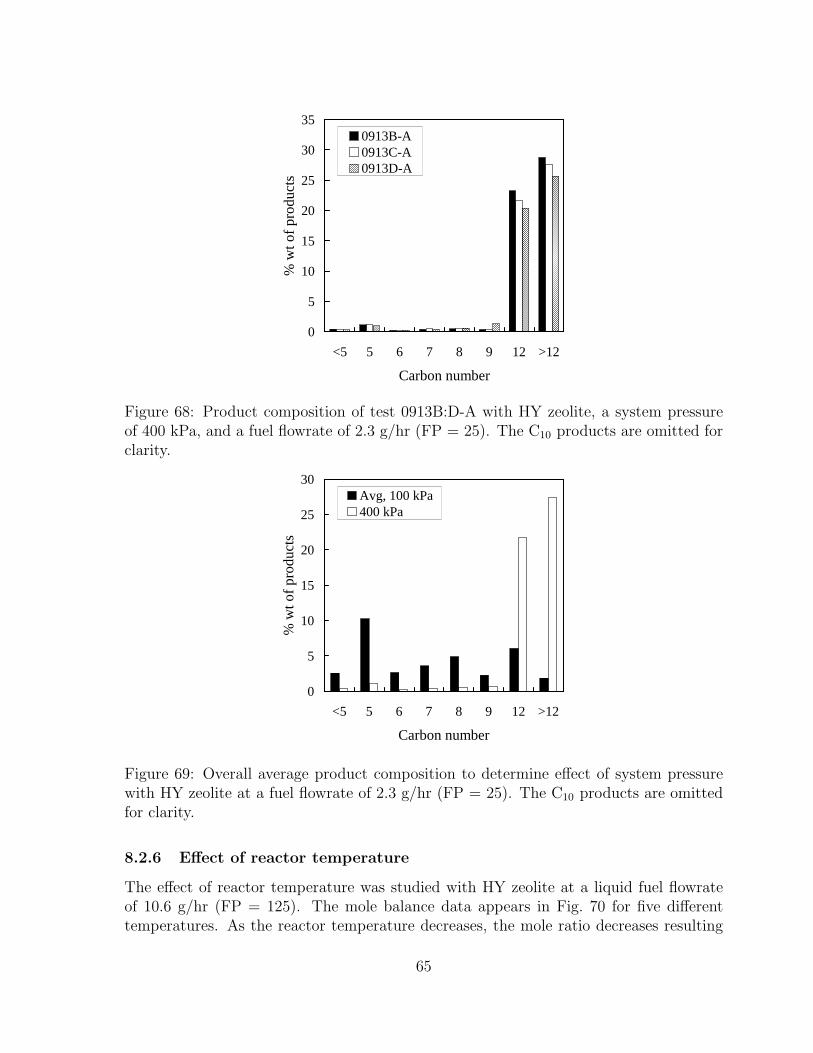
0
5
10
15
20
25
30
35
<5 5 6 7 8 9 12 >12
Carbon number
% w
t of p
rod
uct
s
0913B-A0913C-A0913D-A
Figure 68: Product composition of test 0913B:D-A with HY zeolite, a system pressureof 400 kPa, and a fuel flowrate of 2.3 g/hr (FP = 25). The C10 products are omitted forclarity.
0
5
10
15
20
25
30
<5 5 6 7 8 9 12 >12
Carbon number
% w
t of p
rod
uct
s
Avg, 100 kPa400 kPa
Figure 69: Overall average product composition to determine effect of system pressurewith HY zeolite at a fuel flowrate of 2.3 g/hr (FP = 25). The C10 products are omittedfor clarity.
8.2.6 Effect of reactor temperature
The effect of reactor temperature was studied with HY zeolite at a liquid fuel flowrateof 10.6 g/hr (FP = 125). The mole balance data appears in Fig. 70 for five differenttemperatures. As the reactor temperature decreases, the mole ratio decreases resulting
65
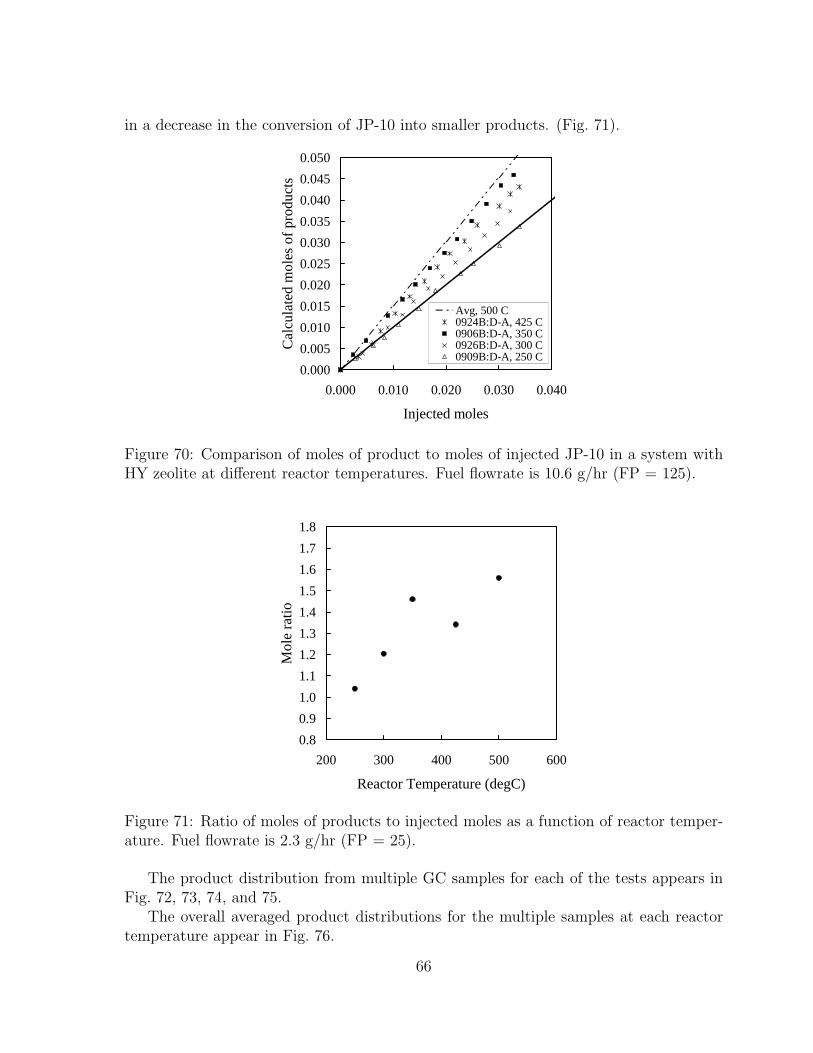
in a decrease in the conversion of JP-10 into smaller products. (Fig. 71).
0.000
0.005
0.010
0.015
0.020
0.025
0.030
0.035
0.040
0.045
0.050
0.000 0.010 0.020 0.030 0.040
Injected moles
Ca
lcu
late
d m
ole
s o
f pro
du
cts
Avg, 500 C0924B:D-A, 425 C0906B:D-A, 350 C0926B:D-A, 300 C0909B:D-A, 250 C
Figure 70: Comparison of moles of product to moles of injected JP-10 in a system withHY zeolite at different reactor temperatures. Fuel flowrate is 10.6 g/hr (FP = 125).
0.8
0.9
1.0
1.1
1.2
1.3
1.4
1.5
1.6
1.7
1.8
200 300 400 500 600
Reactor Temperature (degC)
Mo
le r
atio
Figure 71: Ratio of moles of products to injected moles as a function of reactor temper-ature. Fuel flowrate is 2.3 g/hr (FP = 25).
The product distribution from multiple GC samples for each of the tests appears inFig. 72, 73, 74, and 75.
The overall averaged product distributions for the multiple samples at each reactortemperature appear in Fig. 76.
66
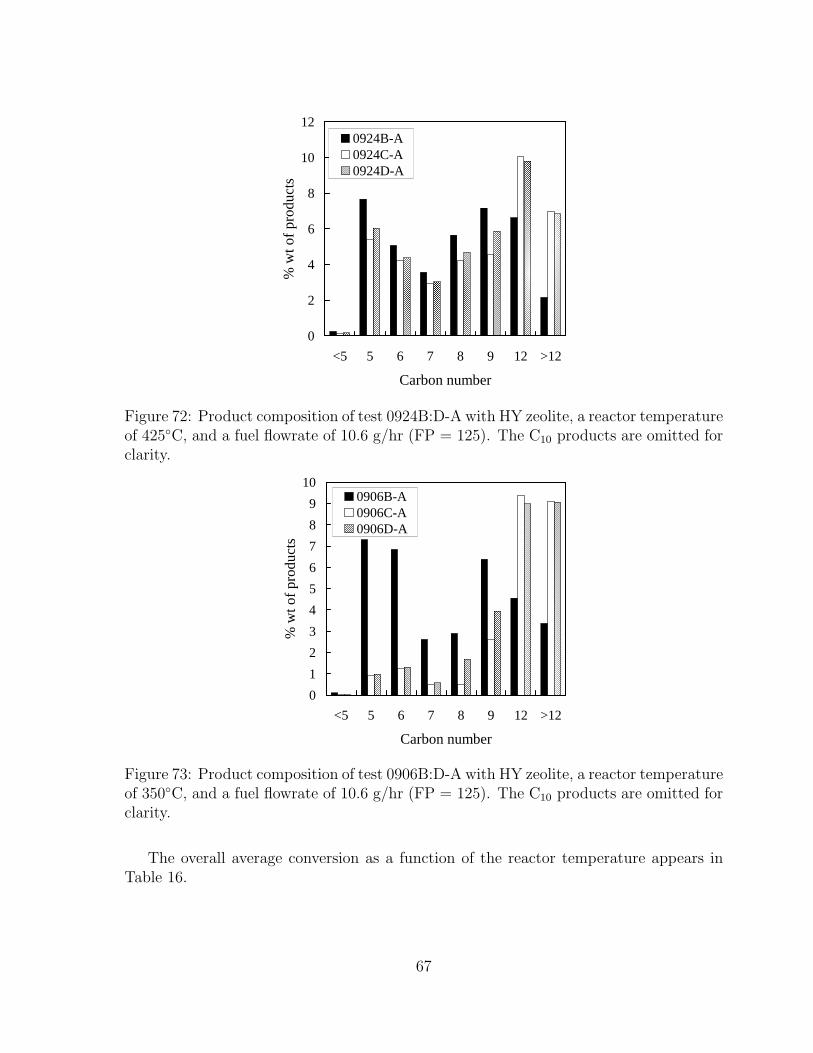
0
2
4
6
8
10
12
<5 5 6 7 8 9 12 >12
Carbon number
% w
t of p
rod
uct
s
0924B-A0924C-A0924D-A
Figure 72: Product composition of test 0924B:D-A with HY zeolite, a reactor temperatureof 425◦C, and a fuel flowrate of 10.6 g/hr (FP = 125). The C10 products are omitted forclarity.
0
1
2
3
4
5
6
7
8
9
10
<5 5 6 7 8 9 12 >12
Carbon number
% w
t of p
rod
uct
s
0906B-A0906C-A0906D-A
Figure 73: Product composition of test 0906B:D-A with HY zeolite, a reactor temperatureof 350◦C, and a fuel flowrate of 10.6 g/hr (FP = 125). The C10 products are omitted forclarity.
The overall average conversion as a function of the reactor temperature appears inTable 16.
67
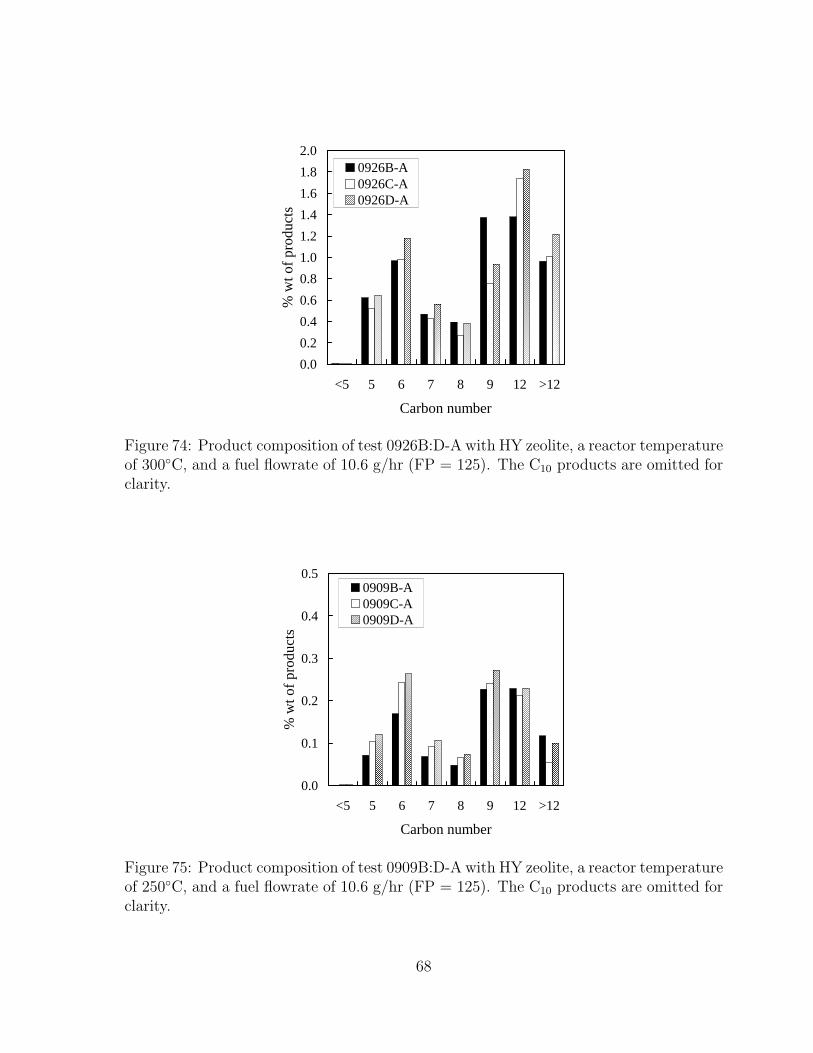
0.0
0.2
0.4
0.6
0.8
1.0
1.2
1.4
1.6
1.8
2.0
<5 5 6 7 8 9 12 >12
Carbon number
% w
t of p
rod
uct
s
0926B-A0926C-A0926D-A
Figure 74: Product composition of test 0926B:D-A with HY zeolite, a reactor temperatureof 300◦C, and a fuel flowrate of 10.6 g/hr (FP = 125). The C10 products are omitted forclarity.
0.0
0.1
0.2
0.3
0.4
0.5
<5 5 6 7 8 9 12 >12
Carbon number
% w
t of p
rod
uct
s
0909B-A0909C-A0909D-A
Figure 75: Product composition of test 0909B:D-A with HY zeolite, a reactor temperatureof 250◦C, and a fuel flowrate of 10.6 g/hr (FP = 125). The C10 products are omitted forclarity.
68
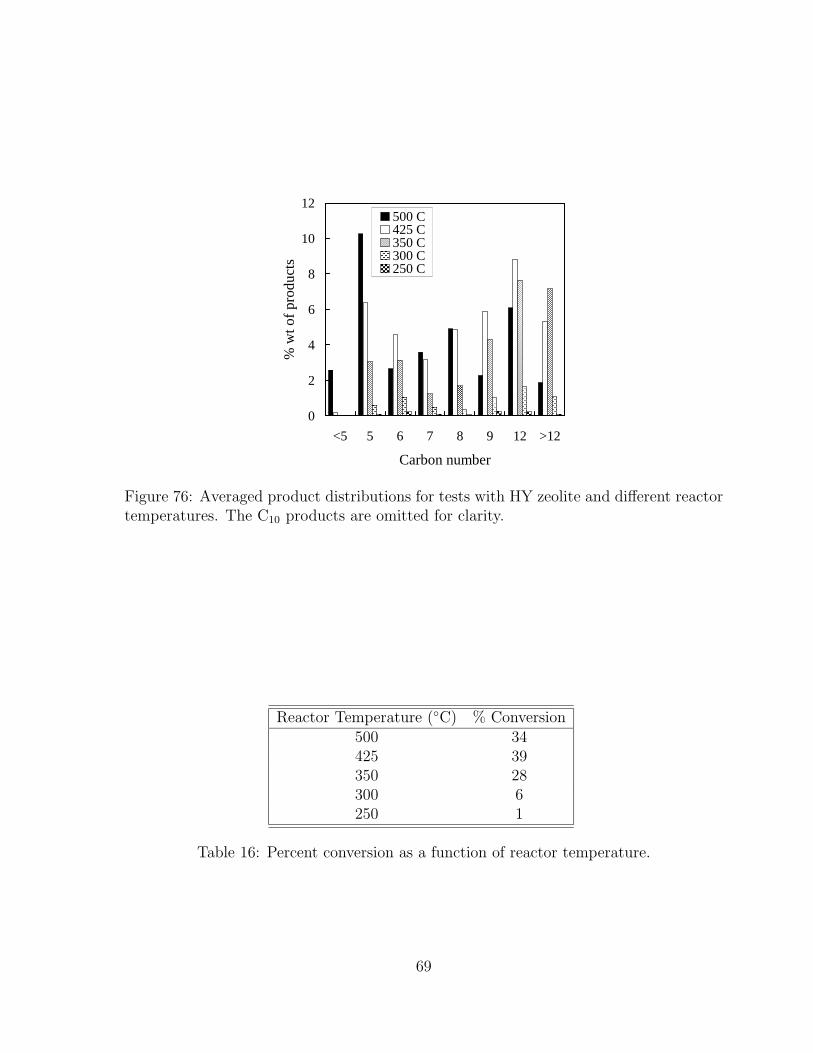
0
2
4
6
8
10
12
<5 5 6 7 8 9 12 >12
Carbon number
% w
t of p
rod
uct
s
500 C425 C350 C300 C250 C
Figure 76: Averaged product distributions for tests with HY zeolite and different reactortemperatures. The C10 products are omitted for clarity.
Reactor Temperature (◦C) % Conversion500 34425 39350 28300 6250 1
Table 16: Percent conversion as a function of reactor temperature.
69
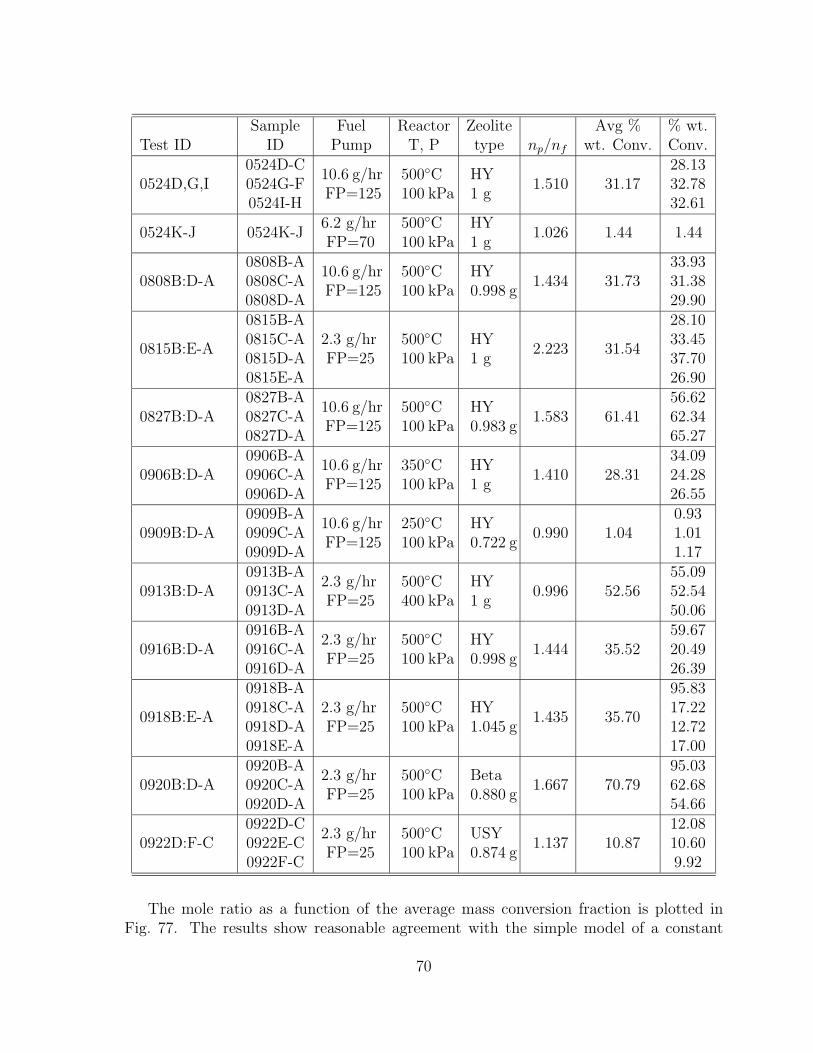
Sample Fuel Reactor Zeolite Avg % % wt.Test ID ID Pump T, P type np/nf wt. Conv. Conv.
0524D,G,I0524D-C
10.6 g/hrFP=125
500◦C100 kPa
HY1 g
1.510 31.1728.13
0524G-F 32.780524I-H 32.61
0524K-J 0524K-J6.2 g/hrFP=70
500◦C100 kPa
HY1 g
1.026 1.44 1.44
0808B:D-A0808B-A
10.6 g/hrFP=125
500◦C100 kPa
HY0.998 g
1.434 31.7333.93
0808C-A 31.380808D-A 29.90
0815B:E-A
0815B-A2.3 g/hrFP=25
500◦C100 kPa
HY1 g
2.223 31.54
28.100815C-A 33.450815D-A 37.700815E-A 26.90
0827B:D-A0827B-A
10.6 g/hrFP=125
500◦C100 kPa
HY0.983 g
1.583 61.4156.62
0827C-A 62.340827D-A 65.27
0906B:D-A0906B-A
10.6 g/hrFP=125
350◦C100 kPa
HY1 g
1.410 28.3134.09
0906C-A 24.280906D-A 26.55
0909B:D-A0909B-A
10.6 g/hrFP=125
250◦C100 kPa
HY0.722 g
0.990 1.040.93
0909C-A 1.010909D-A 1.17
0913B:D-A0913B-A
2.3 g/hrFP=25
500◦C400 kPa
HY1 g
0.996 52.5655.09
0913C-A 52.540913D-A 50.06
0916B:D-A0916B-A
2.3 g/hrFP=25
500◦C100 kPa
HY0.998 g
1.444 35.5259.67
0916C-A 20.490916D-A 26.39
0918B:E-A
0918B-A2.3 g/hrFP=25
500◦C100 kPa
HY1.045 g
1.435 35.70
95.830918C-A 17.220918D-A 12.720918E-A 17.00
0920B:D-A0920B-A
2.3 g/hrFP=25
500◦C100 kPa
Beta0.880 g
1.667 70.7995.03
0920C-A 62.680920D-A 54.66
0922D:F-C0922D-C
2.3 g/hrFP=25
500◦C100 kPa
USY0.874 g
1.137 10.8712.08
0922E-C 10.600922F-C 9.92
The mole ratio as a function of the average mass conversion fraction is plotted inFig. 77. The results show reasonable agreement with the simple model of a constant
70

Sample Fuel Reactor Zeolite Avg % % wt.Test ID ID Pump T, P type np/nf wt. Conv. Conv.
0924B:D-A0924B-A
10.6 g/hrFP=125
425◦C100 kPa
HY1.002 g
1.291 39.2038.18
0924C-A 38.570924D-A 40.84
0926B:D-A0926B-A
10.6 g/hrFP=125
300◦C100 kPa
HY1.000 g
1.154 6.206.17
0926C-A 5.690926D-A 6.75
Table 17: Summary of all catalytic cracking tests and GC samples. Estimated uncertaintyin np/nf is ±6.4% and uncertainty in Avg % wt. Conversion y is 12.5%.
product average molar mass and indicate a reasonable correlation between observed massconversion fraction and molar ratio. Three conditions (0815B, 0909B, 0913B) from thedataset are not visible on this plot because the results are so extreme. We conclude thatthese points are suspect and should not be used in the overall correlation process. Theseconditions are set aside and the remainder of the data has been considered as acceptable.
The acceptable data can be fit to a line through the origin to obtain a slope of1.07 with a regression coefficient of 0.75. Using the analysis of Section 6.3, the averagemolar mass of the products is estimated to be 0.48·136 g/mol or 65 ± 11 g/mol. Thus,the average number of carbon atoms is 4.8 ± 0.8 assuming a H/C ratio of 1.6. This isreasonable considered the actual distribution of product species and the expectation thatbreaking the JP-10 rings to form C5 and C6 species is the initial path of decompositionunder these conditions.
71
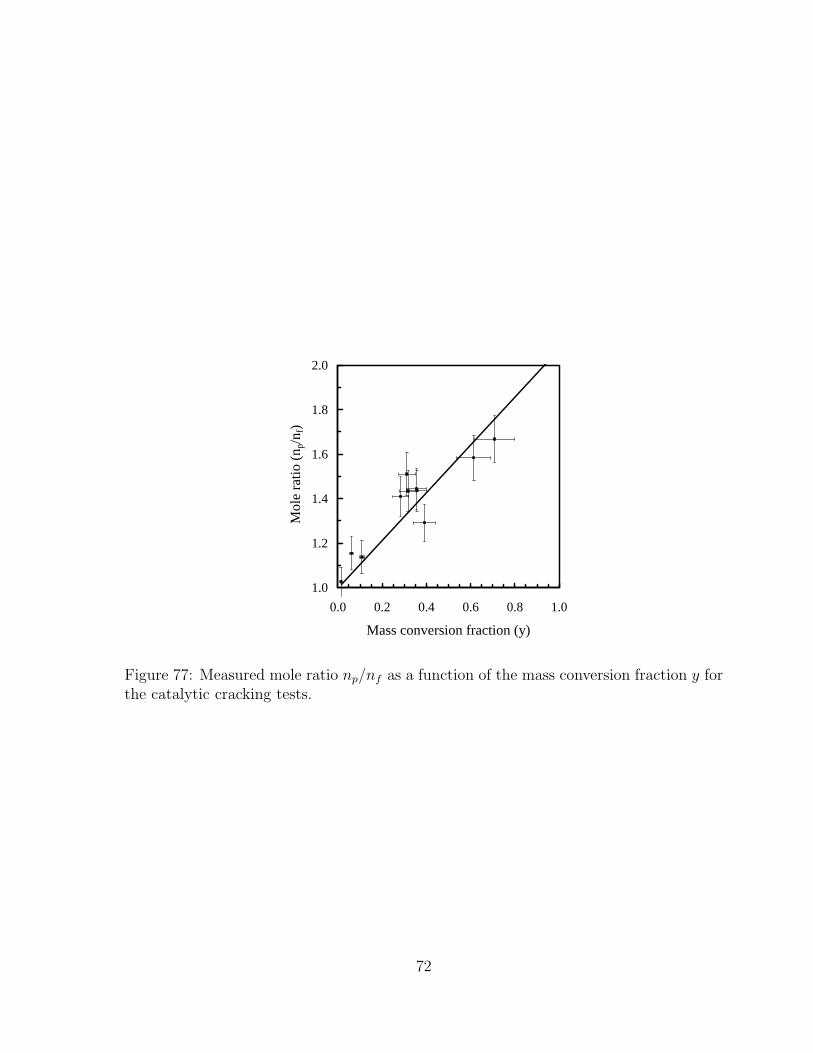
1.0
1.2
1.4
1.6
1.8
2.0
0.0 0.2 0.4 0.6 0.8 1.0
Mass conversion fraction (y)
Mo
le r
atio
(n p
/nf)
Figure 77: Measured mole ratio np/nf as a function of the mass conversion fraction y forthe catalytic cracking tests.
72
9 Sources of uncertainty
Chemical experiments require careful design to eliminate sources of uncertainty. If theexperiment and reaction conditions are not carefully controlled, chemical reaction ratesand product composition can be significantly affected. By studying the results of thisexperiment and actually operating the system, many experimental uncertainties havebeen identified and attempts have been made to quantify their effect when possible.
9.1 Fuel pump flowrate
The fuel pump calibration appears in Fig. 8. This rate was measured by determining thevolume change in the buret over time.
RFP =∆V
∆t=
Vf − Vi
tf − ti(25)
The uncertainty in the time measurement σt is 1 second and the uncertainity in theburet level σV is 0.05 ml. Using the standard method for the propagation of error [37]the uncertainty in the flow rate measurements is determined.
σ2RFP
=
(∂RFP
∂V
)2
σ2V +
(∂RFP
∂t
)2
σ2t (26)
This yields an average uncertainty of ±5% in the fuel flowrate measurements. The Eldexmetering pump documentation lists a reproducibility of ±0.3% where the unit operatesmore reproducibly if operated at a higher backpressure (greater than 25 psi). In ourtests, the backpressure rarely exceeded 1 psi so reproducibility may be an issue. Theburet liquid level was observed after opening the FIV and before the pump was startedto ensure no movement of the level occurred.
Unexpected increases in the fuel flowrate would result in a higher Reynolds numberin the system. Coking and deposition processes would be accelerated resulting in morerapid zeolite deactivation. A higher percentage of larger molecule weight compounds(> C10) would be observed.
9.2 Pressure gauge calibration
The pressure gauges have a documented accuracy of 0.25% of full scale. These pressuregauges with output in units of kPa were calibrated against professionally calibrated dialgauges in units of psi. The dial gauge could be read to an uncertainty of ±1 psi resultingin an uncertainty for the electronic gauge of ±7 kPa equal to ±7%.
9.3 Accumulator height reading
The ruler attached to the accumulator indicator can be read within 0.05 mm. However,after completing a number of tests with the system, the accumulator piston did not
73
maintain a smooth motion as observed during the first several tests. The piston begansticking resulting in jumps in the accumulator height up to 0.3 cm at a time. Thus, theuncertainty in the accumulator height has been estimated to be ±0.3 cm.
9.4 Measurement of accumulator volume
The design drawings were used to calculate the internal volume of the accumulator includ-ing the plumbing up to the inlet valves of the accumulator (Valves A1 and A3 of Fig. 9).Propagation of error yields an uncertainty of the volume estimate equal to ±0.05%.
9.5 Upstream volume measurement
The upstream system volume was determined with a pressure-volume test based on thecalculated volume of the accumulator. Using the ideal gas law,
V 0sys =
PaccumVaccum
Psys
. (27)
The uncertainties for the pressure and accumulator volume are listed above. Theseare used in the standard equation for the propagation of error [37] the uncertainty in theupstream system volume. This yields an average uncertainty of ±2.2% in the upstreamsystem volume measurement.
9.6 Temperature distribution within a zone
Due to the uneven heating of the rope heaters (as a result of tubing and Swagelok con-nections of varying dimensions), there is some variation in the temperature distribution(Table 12). The reactor itself has even heating within 2◦C over the copper blocks.
The variation in temperature of the system will result in an uncertainty in the com-puted moles of product obtained from the accumulator position. A variation of ±10 Kwill cause an uncertainty of ±2% in the computed moles of product np at a nominalsystem temperature of 200◦C.
9.7 Purity of JP-10 and N2
The liquid JP-10 contained dissolved oxygen that likely contributed to the coking prob-lems within the system. No attempt was made to remove the dissolved oxygen duringtesting.
Industrial nitrogen was used to provide backpressure on the fuel metering pumpresulting in a dilution of the cracking products. The requirements on the contaminantsare the least restrictive for the bottled gases. These contaminants could affect the reactioninitiation and mechanisms, yet the magnitude of this effect is unknown since the crackingmechanisms were not determined.
74

9.8 Buret level reading
The buret may be read to an uncertainty of 0.05 ml. This has a minor effect on the molebalance calculations (less than 1%).
9.9 Tubing surface reactivity
Stainless steel components are used in the system. At elevated temperatures, hydrocar-bons are known to react with these metals. Throughout the operation with the system,most of the components were not changed but the central reactor tube was changed pe-riodically and modifications were made to the section upstream of the reactor. Differentmole balance results were observed for clean reactor tubes and reactor tubes coated withcarbon deposits.
9.10 Number of active sites due to ion exchange and regenera-tion
Tests such as MAT or heptane reactivity tests were not completed with any of the zeolitesused in this study to quantify the number of active sites based on the completed ionexchange. This was considered out of scope of the project. However, repeat mole balancecalculations were similar indicating a similar number of active sites and zeolite activity.
9.11 Variation in zeolite bed height and corresponding level ofpacking
Initially, as described in the experimental setup of the reactor, the zeolite pellets wereconstrained in the second spacer tube between two porous disks. The disks were held aconstant distance apart (approximately 5 inches). In this orientation, the zeolite pelletswere poured into the spacer tube. They filled a length of approximately 3 inches withinthe second spacer tube and received no additional compaction.
As the porous disks became filled with carbon deposition, they were replaced withplugs of glass wool. In this case, a plug of glass wool was pushed into the second tubethen the zeolite pellets were poured in. A second plug of glass wool was pushed into thetube above the pellets. It was pushed down until it stopped against the zeolite. Thus,the pellets did receive additional compaction.
It is unknown exactly how much this could affect the conversion ratio. However,one method to attempt to reduce coking is to mix pellets of an unreactive material (i.e.sand) with the zeolite. This seems to imply that tighter packing of the zeolite reducesthe conversion ratio.
75
9.12 Distance from fuel inlet to beginning of zeolite bed
When the porous disks were used to contain the zeolite bed, the distance from the fuelinlet to the beginning of the bed was constant. However, when the plugs of glass woolreplaced the disks, it was more difficult to maintain a constant distance to the beginningof the zeolite bed.
It was also observed that the procedure of using the vacuum pump to complete afinal system cleaning could dislodge the plugs of glass wool such that they moved upwardwithin the central reactor tube increasing the distance between the fuel inlet and thebottom of the zeolite bed.
Increases in this distance would result in more time for thermal cracking reactionsto take place. Especially if the fuel travels through part of the reactor tube which wastypically at 500◦C where conversion on the order of 1-3% is expected. Cracking of the JP-10 before coming into contact with the zeolite could increase the conversion of crackingsince the smaller molecules would have greater accessibility to the active sites of thezeolite, especially those within the large supercages of the HY zeolite.
Because reaction mechanisms are not known, quantifying this effect is not possible.
9.13 Leakage between accumulator wall and internal piston
Although honing the internal surface of the accumulator significantly reduced the leakrate, a residual leak was present. After testing with the system on a regular basis, apool of liquid was observed below the accumulator in a line attached to the system fumehood. This suggests that vaporized products were leaking from the system across theaccumulator piston and subsequently condensing outside the piston. This effect wouldact to reduce the number of product moles captured in the accumulator and may actto reduce the movement of the piston. Thus, it is possible to be making more moles ofproducts than are being measured in the piston due to the leak. Based on the maximumleak rate of 2.47 sccm measured previously, a loss of 0.0078% of the mass in the systemis expected at a fuel flowrate of 10.6 g/hr, a loss of 0.0190% of the mass in the system isexpected at a fuel flowrate of 6.2 g/hr, and a loss of 0.038% of the mass in the system isexpected at a fuel flowrate of 2.3 g/hr.
9.14 Residual JP-10 in system
This is expected to be the largest source of error in the system. Due to the large amount ofstainless steel plumbing and the many area changes because of the Swagelok components,there is a significant amount of surface area upon which the JP-10 molecules may adhere.Between tests, nitrogen flowed through the hot system plumbing to flush the residual JP-10 out through the vent hood. The vacuum pump was also used to remove any residualproducts. However, sampling with the GC immediately after flushing the system typicallyresulted in JP-10 peaks that were still saturating the column.
76
9.15 Mass conversion fraction
The uncertainty in the mass conversion fraction y was estimated from the GC analysisat the same operating conditions. For the thermal tests, an average y of 0.02985 was cal-culated from tests 0807C-B, and 1001B:D-A. The ∆y for these tests was 0.0037 resultingin an uncertainty of ±12.4%. For the catalytic cracking tests, an average y of 0.3425 wascalculated from tests 0815B:E-A, 0916B:D-A, and 0918B:D-A. The ∆y for these testswas 0.0416 resulting in an uncertainty of ±12.1%. We use an uncertainty of ±12.5% asan upper bound on the mass conversion fraction.
9.16 Mole ratio
The uncertainty in the mole ratio is determined based on the measured liquid fuel injectedinto the system and the calculated product moles based on the accumulator position.Thus, the uncertainty in the mole ratio depends on the uncertainty in the accumulatorheight measurement, temperature estimation, liquid height in the buret, and the pressuremeasurement. These uncertainty values are discussed above and when the propagationof error analysis is applied to Eq. 18, this results in a maximum uncertainty in the moleratio of ±6.4
9.17 Average molar mass of products
The propagation of error analysis was applied to Eq. 23 to determine the uncertainty ofthe average molar mass of the products. This was evaluated to be ±17% for the catalyticcracking tests.
77

10 Feasibility of partial oxidation studies
Two techniques have been proposed for carrying out fuel modification. One was catalyticpartial oxidation and the other was catalytic cracking. At the outset of this project, wedid not have any experience with these processes so we carried out literature researchand also had discussions with Prof. Davis’ research group at Caltech. After examiningthe options, Caltech selected catalytic cracking as being the most worthwhile process toinvestigate. The technical grounds for this decision are that
a. Catalytic cracking is easier to implement, requiring a less complex and lowertemperature reactor. The operating regime is also simpler to define - depend-ing primarily only on temperature and mass flowrate of fuel for the crackingreactor. Since there is no oxidizer in the fuel stream, there are also no issuesabout flashback or explosion, which are potential problems with partial oxi-dation. Reactor startup and control is simpler for a catalytic cracking reactorsince the catalyst does not have to be “lit” and there is no danger of a run-away reaction or catalyst melting, as can happen in partial oxidation underhigh temperature conditions.
b. Partial oxidation with air results in a high gaseous nitrogen concentrationin the fuel stream. This reduces the energy content of the fuel stream on amass basis and necessitates a high flowrate fuel injection system in order tocompensate for the dilution. This places partial oxidation at a considerabledisadvantage to catalytic thermal decomposition, which does not dilute thefuel stream.
c. Experiments [1] in our laboratory on detonation properties of synthetic par-tial oxidation products have shown that there is no significant improvementin fuel detonation characteristics obtained by partial oxidation. Detonationcell widths for partially oxidized fuel (synthetic mixture) mixed with a stoi-chiometric amount of air were found to have essentially the same detonationcell width as the parent fuel JP-10. In addition, the energy content of thepartially oxidized fuel is lower than the parent fuel, which also makes it lessuseful for propulsion.
Despite these drawbacks, partial oxidation may still be of interest since the cokingproblem is so severe for zeolite catalysts. A brief study was carried out on the feasibilityof converting the existing catalytic reactor to partial oxidation operation. The results ofthat study are reported below.
10.1 Required reactor modifications
The current reactor design is appropriate for catalytic cracking (referred to in the test planas catalytically cracked fuel) using a bed of zeolites as the catalyst with maximum reactor
78

temperatures of 500◦C and downstream temperatures of 200◦C. The GC analysis systemwith a FID is also set up only for hydrocarbons. Reacting and analyzing partial oxidationproducts will require significant modifications to the existing reactor and instrumentation.It is not simply a matter of introducing air into the feedstream and changing the catalystin the existing reactor.
10.1.1 Temperature limitations
Partial oxidation, particularly at high oxygen concentrations, results in a high temper-ature product stream. The actual temperature has to be determined experimentally,but since there is no actual data available, we have used equilibrium computations toestimate the maximum temperature of the product stream. The results for a mixture ofJP-10 and air at various equivalence ratios are shown in Fig. 78.
0
500
1000
1500
2000
2500
0 2 4 6Equivalence ratio
Ad
iab
atic
re
act
ion
tem
pe
ratu
re (
K)
Figure 78: Adiabatic flame temperatures for complete combustion of mixtures of JP-10and air initially at 300◦C and 100 kPa. Equivalence ratio defines the initial mixture asφC10H16 + 14O2 + 52.64N2 .
The optimum operating conditions are not known but are expected to be at an equiv-alence ratio greater than 2.8 and possibly as high as 5. The goal is to optimize theenergy content of the product stream. The actual products for a given reactor can bedetermined only by experiment but the equilibrium distributions (corresponding to thetemperatures in Fig. 78) can be estimated and are given in Fig. 79. As indicated, theequivalence ratio has to be at least 2.8 so that CO2 and H2O are not formed.
From these considerations, we see that the reactor and the region downstream willbe operating at temperatures up to 1300 K or about 1000◦C. At present, the maximumoperating temperature of the reactor is 500◦C and the downstream components, valves,
79
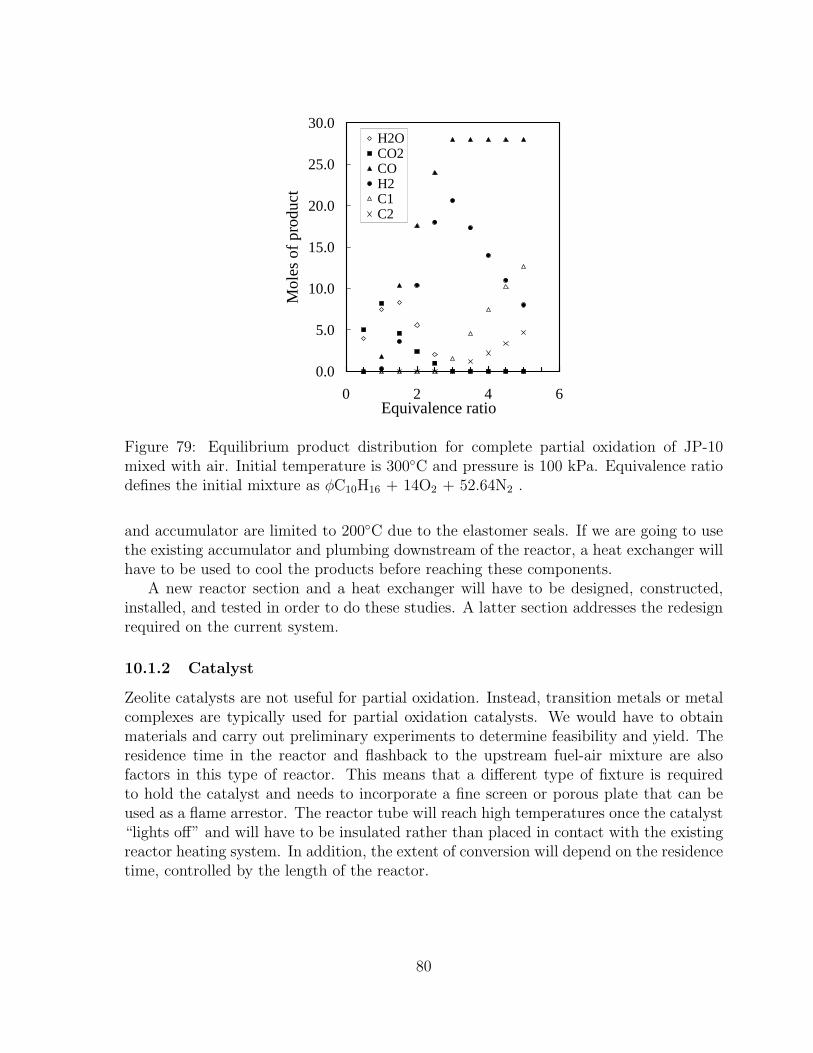
0.0
5.0
10.0
15.0
20.0
25.0
30.0
0 2 4 6Equivalence ratio
Mo
les
of p
rod
uct
H2OCO2COH2C1C2
Figure 79: Equilibrium product distribution for complete partial oxidation of JP-10mixed with air. Initial temperature is 300◦C and pressure is 100 kPa. Equivalence ratiodefines the initial mixture as φC10H16 + 14O2 + 52.64N2 .
and accumulator are limited to 200◦C due to the elastomer seals. If we are going to usethe existing accumulator and plumbing downstream of the reactor, a heat exchanger willhave to be used to cool the products before reaching these components.
A new reactor section and a heat exchanger will have to be designed, constructed,installed, and tested in order to do these studies. A latter section addresses the redesignrequired on the current system.
10.1.2 Catalyst
Zeolite catalysts are not useful for partial oxidation. Instead, transition metals or metalcomplexes are typically used for partial oxidation catalysts. We would have to obtainmaterials and carry out preliminary experiments to determine feasibility and yield. Theresidence time in the reactor and flashback to the upstream fuel-air mixture are alsofactors in this type of reactor. This means that a different type of fixture is requiredto hold the catalyst and needs to incorporate a fine screen or porous plate that can beused as a flame arrestor. The reactor tube will reach high temperatures once the catalyst“lights off” and will have to be insulated rather than placed in contact with the existingreactor heating system. In addition, the extent of conversion will depend on the residencetime, controlled by the length of the reactor.
80
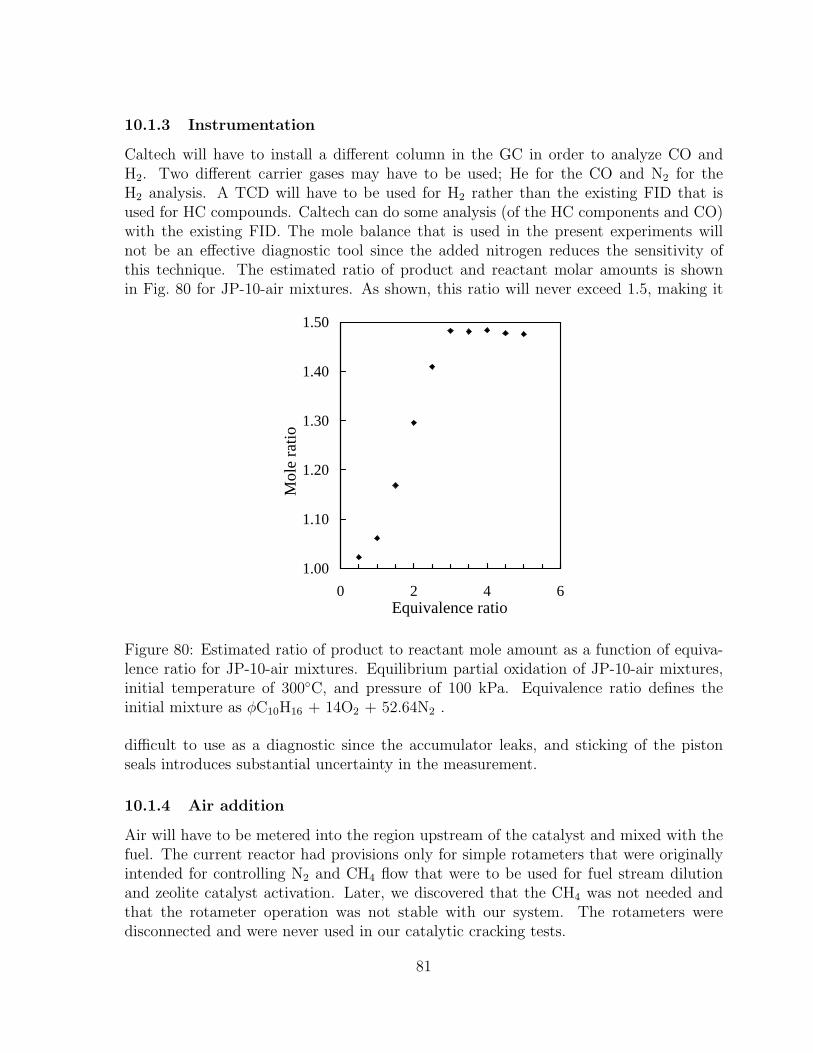
10.1.3 Instrumentation
Caltech will have to install a different column in the GC in order to analyze CO andH2. Two different carrier gases may have to be used; He for the CO and N2 for theH2 analysis. A TCD will have to be used for H2 rather than the existing FID that isused for HC compounds. Caltech can do some analysis (of the HC components and CO)with the existing FID. The mole balance that is used in the present experiments willnot be an effective diagnostic tool since the added nitrogen reduces the sensitivity ofthis technique. The estimated ratio of product and reactant molar amounts is shownin Fig. 80 for JP-10-air mixtures. As shown, this ratio will never exceed 1.5, making it
1.00
1.10
1.20
1.30
1.40
1.50
0 2 4 6Equivalence ratio
Mo
le r
atio
Figure 80: Estimated ratio of product to reactant mole amount as a function of equiva-lence ratio for JP-10-air mixtures. Equilibrium partial oxidation of JP-10-air mixtures,initial temperature of 300◦C, and pressure of 100 kPa. Equivalence ratio defines theinitial mixture as φC10H16 + 14O2 + 52.64N2 .
difficult to use as a diagnostic since the accumulator leaks, and sticking of the pistonseals introduces substantial uncertainty in the measurement.
10.1.4 Air addition
Air will have to be metered into the region upstream of the catalyst and mixed with thefuel. The current reactor had provisions only for simple rotameters that were originallyintended for controlling N2 and CH4 flow that were to be used for fuel stream dilutionand zeolite catalyst activation. Later, we discovered that the CH4 was not needed andthat the rotameter operation was not stable with our system. The rotameters weredisconnected and were never used in our catalytic cracking tests.
81

The air flow and fuel flowrate will have to be controlled in order to have a knownequivalence ratio within the reactor. The existing fuel pump can be used to control thefuel flowrate. Several possibilities exist for controlling the air flowrate. One is the verysimple technique of using a choked flow orifice in the line coming from the air bottle.This will work for only a fixed number of fuel flowrates and stoichiometries. The orificewill also have to be extremely small since the liquid fuel flowrates are very low accordingto our experience with the existing reactor. Small orifices can get clogged easily by thesoot and coking products that are always present in very rich oxidation processes. Inthis case, a mass flow controller may have to be used in order to regulate the air flowrateproperly.
10.2 Design constraints and preliminary design of partial oxi-dation reactor
The reactor must be redesigned to operate at temperatures associated with catalystignition and exothermic oxidation reactions during continuous operation. As shownin Fig. 78, temperatures greater than 1000◦C have been predicted assuming completecombustion of JP-10 mixtures. The range of variation between these adiabatic flametemperatures and the actual temperature produced by catalytic combustion is unknown.Due to the lack of experimental information, we have used the conservative equilibriumtemperature in developing a design.
The existing reactor tube consists of a 1/2-inch OD, 15-inch long stainless steel tubewith the zeolite section encased in two heated copper blocks. The maximum operatingtemperature is 500◦C. Quartz tubing is commonly used in partial oxidation microreac-tors [38, 39, 40] due to the high operating temperatures observed in experiments withalkanes and cyclohexane and the known surface reactivity of metal tubing. A wire gauzecatalyst is typically used in syngas production, oxidation of cyclohexane, and olefin for-mation. One common metal is 90% Platinum-10% Rhodium by mass. The gauze isfixed within the quartz reactor tube by clamping it between two quartz tubes and wrap-ping with a fiber woven with Al2O3-SiO2 fibers as described in O’ Connor and Schmidt[38]. New fittings will be required in order to connect the quartz tube to the existingSwagelok plumbing. To monitor reaction progress, a quartz-enclosed thermocouple mustbe installed in the region downstream of the catalyst. The location must be adjustableso that the position relative to the catalyst is known.
The oxidation reactions are initiated spontaneously in the presence of the catalystat sufficiently high temperatures. However, new catalysts will require activation beforereproducibility in the temperatures, conversion rates, and selectivities of the feed areachieved [38]. For experiments with 90% Pt-10% Rh wire gauze, activation was achievedby reaction in high purity n-butane-oxygen with molar ratios between 1.4-2.0 for approx-imately 10 hours [38]. Activation with cyclohexane-oxygen alone was not obtained in asimilar length of time.
The existing preheat section (referred to as the evaporator section) is capable oftemperatures up to 350◦C; however, it is currently a significant distance upstream of
82

the catalyst location. If the preheat temperature of the feed gases is greater than theignition temperature, no external heater on the catalyst is required [39]. Otherwise, anexternal heater must be applied to the catalyst and quickly removed after surface ignitionor the temperature will rise to unacceptable values within a few seconds (or less) in atransition mode [39]. This process is not well documented and ignition temperatures onsuch catalysts are not well defined. Cyclohexane-oxygen mixtures in the 0.4-5 molar feedratios ignite at 200-250◦C [38]. Ignition in methane was experimentally measured to be>600◦C and ignition in butane was measured to be around 300◦C [39]. Because ignitionin methane is difficult, it is possible to initiate ignition with NH3-air and then replace NH3
with CH4 and air and O2 [39]. The catalyst type appears to affect the surface ignitiontemperature and values of 300 - 400◦C for methane, ethane, propane, and isobutane wereexperimentally measured with resistively heated platinum foil [40]. Due to the lack ofdata for ignition temperatures of JP-10 mixtures on the catalyst, the ignition temperaturewill have to be experimentally determined. The ignition temperature is expected to besimilar to that of the higher carbon number alkanes and cyclohexane.
Although the existing catalyst heater can achieve the ignition temperatures for thehigher carbon number compounds, it is not an acceptable type to use since it is notpossible to quickly remove the heat source from the catalyst once ignition is achieved.The steady-state operation or “autothermal” temperatures were measured to be between400-1000◦C for methane, ethane, propane, and isobutane [40]. It is important not to allowthe temperature to go too high or a flame may propagate upstream into the reactants.Veser and Schmidt measured catalyst temperatures of between 1000-1500◦C immediatelybefore observing a flame [40].
The most likely heater types would utilize radiant heat or hot air. Ignition withan external heater requires careful system operation because a suitable path must befound from ambient temperature to steady state operation that avoids the possibility ofexplosive ignition (a serious safety hazard), catalyst melting, or the formation of cokedeposits [39]. This path of ignition is not known for JP-10 mixtures and will requiresignificant experimental testing. Schmidt et al. warns that small thermal time constantsin such micro-reactors prevent the standard feedback procedure that utilizes temperaturesensing devices in the reactor bed and manual adjustment of preheat temperatures orwall heat transfer. This manual interaction becomes extremely difficult or impossibleduring transients of startup (ignition) and shutdown (extinction) [39]. In some cases, thereactor may be destroyed [39].
Fuel and oxidizer must be accurately metered into the system to maintain the desiredmolar ratios and operate the reactor safely. Previously employed flow rates of JP-10 inthe catalytic cracking experiments were 10.6, 6.2, and 2.3 g/hr. These values are usedalong with the reaction equation of Fig. 80 to predict the required mass flowrates ofoxygen and nitrogen for two different equivalence ratios (Table 18).
After catalyst light off, the product stream resulting from the oxidation of JP-10mixtures is likely to be in excess of 1000◦C (Fig. 78). Due to the downstream temperaturelimits of the existing system components, the product gases should be cooled to at least200◦C. This could be accomplished with a counterflow heat exchanger. Based on the
83
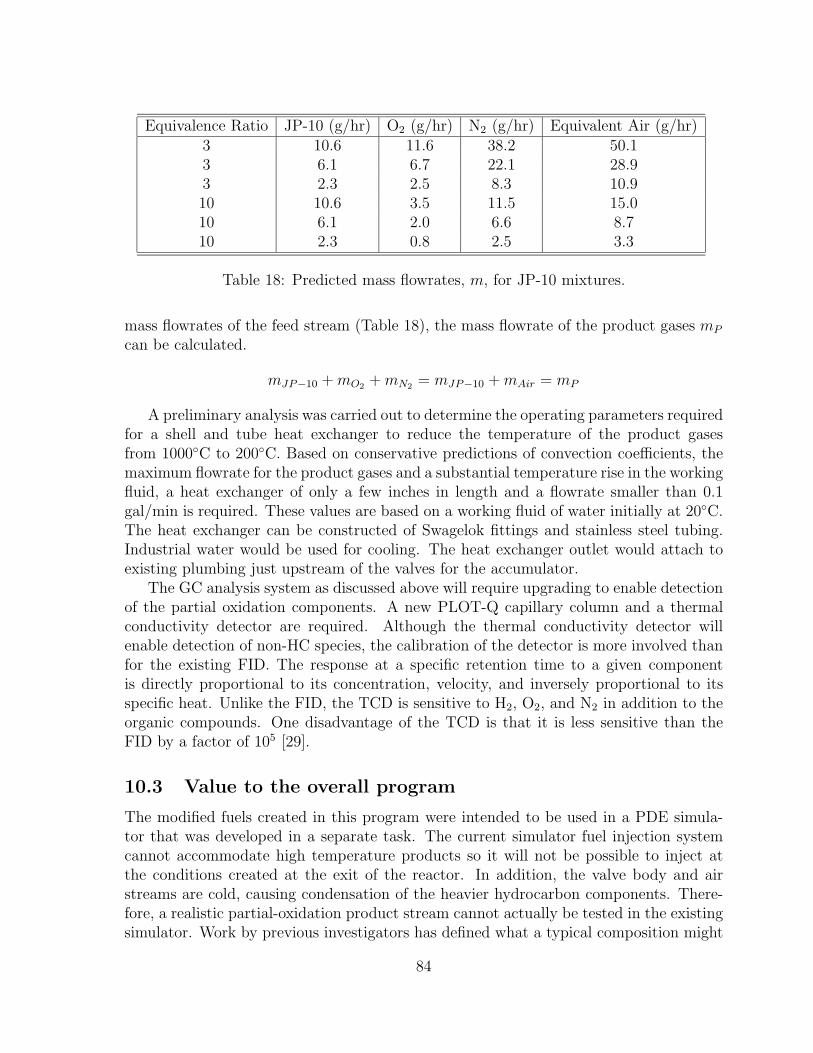
Equivalence Ratio JP-10 (g/hr) O2 (g/hr) N2 (g/hr) Equivalent Air (g/hr)3 10.6 11.6 38.2 50.13 6.1 6.7 22.1 28.93 2.3 2.5 8.3 10.910 10.6 3.5 11.5 15.010 6.1 2.0 6.6 8.710 2.3 0.8 2.5 3.3
Table 18: Predicted mass flowrates, m, for JP-10 mixtures.
mass flowrates of the feed stream (Table 18), the mass flowrate of the product gases mP
can be calculated.
mJP−10 + mO2 + mN2 = mJP−10 + mAir = mP
A preliminary analysis was carried out to determine the operating parameters requiredfor a shell and tube heat exchanger to reduce the temperature of the product gasesfrom 1000◦C to 200◦C. Based on conservative predictions of convection coefficients, themaximum flowrate for the product gases and a substantial temperature rise in the workingfluid, a heat exchanger of only a few inches in length and a flowrate smaller than 0.1gal/min is required. These values are based on a working fluid of water initially at 20◦C.The heat exchanger can be constructed of Swagelok fittings and stainless steel tubing.Industrial water would be used for cooling. The heat exchanger outlet would attach toexisting plumbing just upstream of the valves for the accumulator.
The GC analysis system as discussed above will require upgrading to enable detectionof the partial oxidation components. A new PLOT-Q capillary column and a thermalconductivity detector are required. Although the thermal conductivity detector willenable detection of non-HC species, the calibration of the detector is more involved thanfor the existing FID. The response at a specific retention time to a given componentis directly proportional to its concentration, velocity, and inversely proportional to itsspecific heat. Unlike the FID, the TCD is sensitive to H2, O2, and N2 in addition to theorganic compounds. One disadvantage of the TCD is that it is less sensitive than theFID by a factor of 105 [29].
10.3 Value to the overall program
The modified fuels created in this program were intended to be used in a PDE simula-tor that was developed in a separate task. The current simulator fuel injection systemcannot accommodate high temperature products so it will not be possible to inject atthe conditions created at the exit of the reactor. In addition, the valve body and airstreams are cold, causing condensation of the heavier hydrocarbon components. There-fore, a realistic partial-oxidation product stream cannot actually be tested in the existingsimulator. Work by previous investigators has defined what a typical composition might
84

be for partial oxidation at various equivalence ratios for JP-10. These data can be usedto create a synthetic mixture that could be purchased from a commercial gas supplierand used to fuel the simulator. This would be more controlled and quite a bit more costeffective than attempting to create these mixtures with a new reactor facility.
85
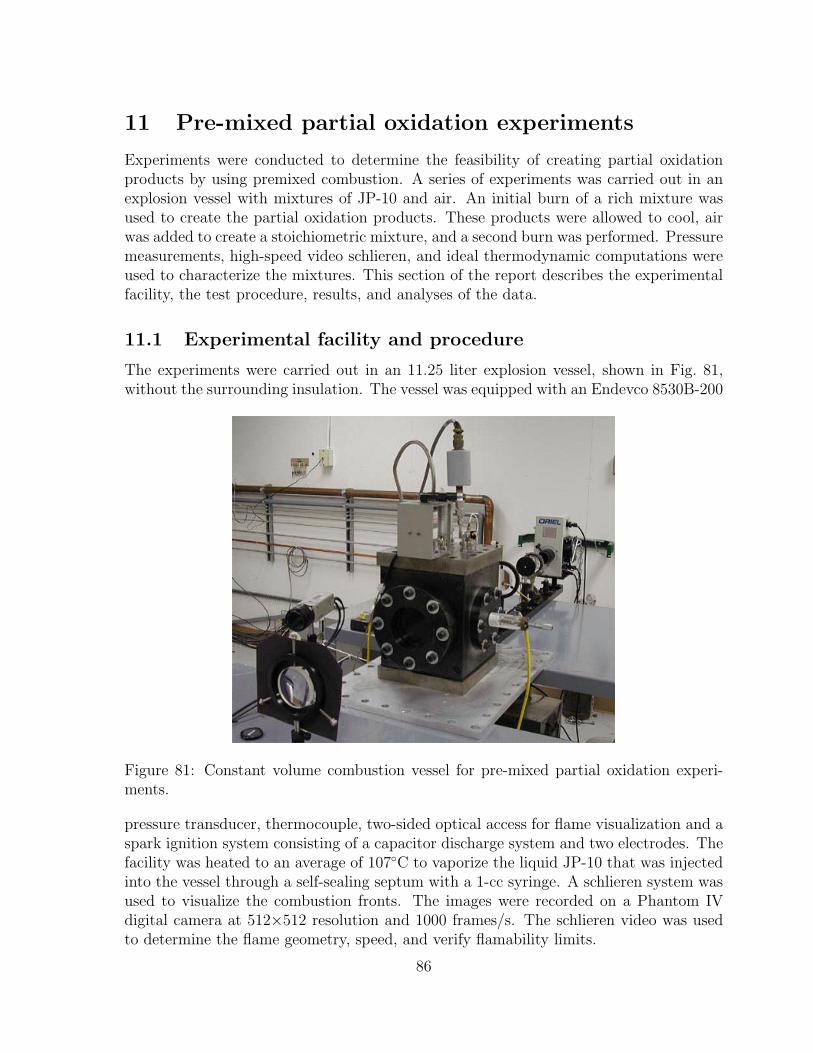
11 Pre-mixed partial oxidation experiments
Experiments were conducted to determine the feasibility of creating partial oxidationproducts by using premixed combustion. A series of experiments was carried out in anexplosion vessel with mixtures of JP-10 and air. An initial burn of a rich mixture wasused to create the partial oxidation products. These products were allowed to cool, airwas added to create a stoichiometric mixture, and a second burn was performed. Pressuremeasurements, high-speed video schlieren, and ideal thermodynamic computations wereused to characterize the mixtures. This section of the report describes the experimentalfacility, the test procedure, results, and analyses of the data.
11.1 Experimental facility and procedure
The experiments were carried out in an 11.25 liter explosion vessel, shown in Fig. 81,without the surrounding insulation. The vessel was equipped with an Endevco 8530B-200
Figure 81: Constant volume combustion vessel for pre-mixed partial oxidation experi-ments.
pressure transducer, thermocouple, two-sided optical access for flame visualization and aspark ignition system consisting of a capacitor discharge system and two electrodes. Thefacility was heated to an average of 107◦C to vaporize the liquid JP-10 that was injectedinto the vessel through a self-sealing septum with a 1-cc syringe. A schlieren system wasused to visualize the combustion fronts. The images were recorded on a Phantom IVdigital camera at 512×512 resolution and 1000 frames/s. The schlieren video was usedto determine the flame geometry, speed, and verify flamability limits.
86

The test procedure began by evacuating the vessel and gas handling system with thevacuum pump. Liquid JP-10 was injected into the vessel to achieve a partial pressure of1.4 kPa. Oxygen and nitrogen were then added to the vessel by the method of partialpressures (Table 19) to obtain the desired equivalence ratio.
φC10H14 + 14(O2 + 3.76N2) (28)
Equivalence Ratio PJP−10 PO2 PN2 P1
φ (kPa) (kPa) (kPa) (kPa)1 1.4 19.9 74.7 96
1.5 1.4 13.1 49.4 642 1.4 9.8 36.8 48
2.5 1.4 7.9 29.7 393 1.4 6.6 24.9 33
3.5 1.4 5.8 21.8 294 1.4 5.0 18.6 25
4.5 1.4 4.3 16.3 225 1.4 3.9 14.7 20
Table 19: Partial pressures of the initial mixture of the first burn for varying equivalenceratios.
A fan stirred the mixture for 5 minutes to ensure mixture homogeneity. A LabViewprogram was used to synchronize ignition with recording the pressure signals, including(Pmax)1, and the schlieren images.
After combustion, the products quickly cooled to the vessel temperature (average of380 K) and the final pressure of the products (Pp)1 was recorded. Additional oxygen andnitrogen were then added to achieve an equivalent stoichiometric mixture at 100 kPa and380 K. The amount of air added to the mixture was
(φ − 1)14(O2 + 3.76N2) . (29)
The mixture was again stirred and the initial pressure P2 recorded before the secondburn was completed. Pressure histories and schlieren video were recorded.
11.2 Pressure and product composition results
A summary of the recorded pressures for the first and second burn at each initial equiv-alence ratio appears in Table 20.
The recorded pressure histories for the first burn appear in Fig. 82 and 83. As theequivalence ratio increases and the mixture becomes increasingly richer, the maximumpressure decreases. The flame develops very slowly and then is observed to extinguish in
87

Burn 1 Burn 1 Burn 1 Burn 2 Burn 2φ P1 (Pmax)1 (Pp)1 P2 (Pmax)2
(kPa) (kPa) (kPa) (kPa) (kPa)1 96.01 644.43 95.04 95.04 -2 48.15 430.6 50.8 97.86 -2.5 39.03 367.73 46.2 102.9 432.73 32.91 316.01 43.03 106.4 560.543.5 29.03 272.5 39.93 108.3 577.364 24.98 191.54 37.31 109.34 624.454.5 21.99 94.19 31.63 106.34 623.25 20.1 68.96 28.08 - -
Table 20: Summary of the initial, maximum and final pressures for the first and secondburns
0
100
200
300
400
500
600
0 0.2 0.4 0.6 0.8
Time (s)
P-P
1 (k
Pa)
φ = 5φ = 4
φ = 3
φ = 2
φ = 1
Figure 82: Pressure histories of the first burn for φ equal to 1, 2, 3, 4, and 5.
the schlieren images for the case of φ equal to 5 which explains the small pressure rise ofonly 8 kPa.
Equilibrium predictions of mole concentrations and pressures for the first burn weremade with STANJAN [41]. Adiabatic, constant volume, complete-combustion calcula-tions were performed for each equivalence ratio at an initial temperature of 380 K and atinitial pressures P1 corresponding to the experimental conditions. The numbers of moleshave been normalized by the initial moles of JP-10.
C10H14 + n(O2 + 3.76N2) (30)
88

0
50
100
150
200
250
300
350
0 0.2 0.4 0.6 0.8
Time (s)
P-P
1 (k
Pa) φ = 2.5
φ = 3.5
φ = 4.5
Figure 83: Pressure histories of the first burn for φ equal to 2.5, 3.5, and 4.5.
where n is 14/φ. Comparison between the equilibrium predictions and experimentalvalues of ∆P1 appear in Fig. 84. Using the ideal gas law with the first law of thermody-namics, the maximum pressure rise during the combustion event can be related to theequivalent chemical energy release Q of the mixture.
Q = Umax − U1 (31)
=nmaxRTmax
γ − 1− n1RT1
γ − 1(32)
=(Pmax) − P1
(γ − 1)V(33)
As the equivalence ratio φ is increased, the effective energy release Q decreases since theC and H atoms are only partially oxidized.
The corresponding normalized moles of products for the first burn of JP-10 and airat different equivalence ratios appear in Fig. 85. At the stoichiometric condition (φ=1),the approximate reaction predicted by the equilibrium calculations is
C10H14 +14(O2 +3.76N2) → 2.2CO+7.8CO2 +7.4H2O+52.64N2 +traces(O2, H2) (34)
All of the fuel is oxidized completely to major products, mostly CO2 and H2O. At anequivalence ratio of 2.5, the approximate reaction predicted by the equilibrium calculationis
C10H16 + 5.6(O2 + 3.76N2) → 9.6CO + 7H2 + 21N2 + traces(CO2, H2O) (35)
89

0
100
200
300
400
500
600
700
1 2 3 4 5Equivalence ratio
∆P1
= (
P ma
x) 1 -
P 1
Equilibrium calculation
Experiment
Figure 84: Equilibrium predictions and experimental data for the peak pressure rise inthe first burn ∆P1 as a function of equivalence ratio.
The fuel is oxidized to only CO and H2. There is not enough O2 to create H2O or CO2
for φ ≥ 2.5. At an equivalence ratio of 4, an approximate reaction is
C10H16 + 3.5(O2 + 3.76N2) → 7CO + 4H2 + 13N2 + 1.6CH4 + traces(C2Hx) . (36)
The excess fuel forms CH4 and trace amounts of higher hydrocarbons. The H2, CO,CH4, and other hydrocarbons act as the fuel for the second burn when air is added tothe system.
After the first burn with JP-10 and air, the products were allowed to cool to thevessel temperature of 380 K. The ratio of initial and final pressures is equal to the ratioof product moles to the reactant moles since the volume is constant. The ideal gas lawrelates these two ratios.
(Pp)1
P1
=
((np)1RT
V
)(V
n1RT
)=
(np)1
n1
(37)
Two predictions of the cooling process to the initial temperature of 380 K were con-ducted with STANJAN. The equilibrium case calculates the concentrations assumingthe reactions progress extremely quickly and the composition is at equilibrium at 380 K.The frozen case calculates the concentrations assuming the reactions progress extremelyslowly and the composition is fixed at that found for the adiabatic conditions associatedwith the first burn (Fig. 85). The two predictions are compared with the experimentaldata in Fig. 86.
The experimental data generally lie between the two limiting predictions of equi-librium and frozen product concentrations. The dependence of maximum temperature
90
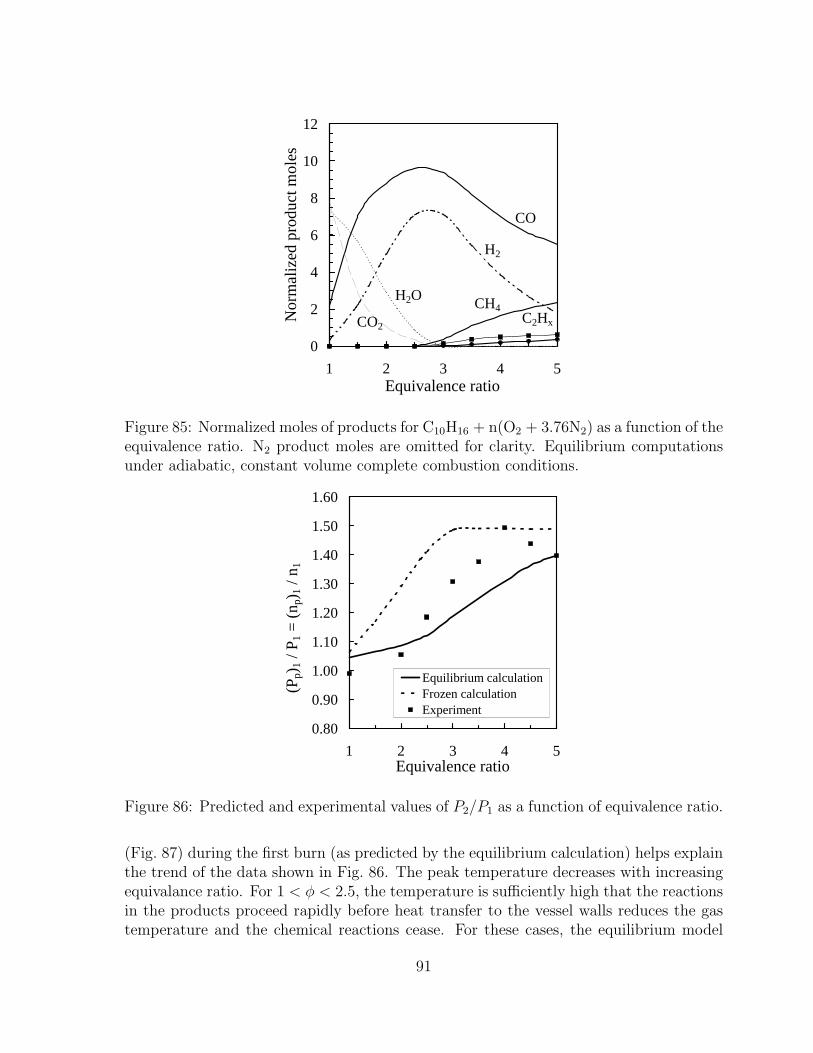
0
2
4
6
8
10
12
1 2 3 4 5Equivalence ratio
No
rma
lize
d p
rod
uct
mo
les
CO
H2
H2O
CO2
CH4C2Hx
Figure 85: Normalized moles of products for C10H16 + n(O2 + 3.76N2) as a function of theequivalence ratio. N2 product moles are omitted for clarity. Equilibrium computationsunder adiabatic, constant volume complete combustion conditions.
0.80
0.90
1.00
1.10
1.20
1.30
1.40
1.50
1.60
1 2 3 4 5Equivalence ratio
(Pp)
1 / P
1 =
(n p
) 1 /
n 1
Equilibrium calculationFrozen calculationExperiment
Figure 86: Predicted and experimental values of P2/P1 as a function of equivalence ratio.
(Fig. 87) during the first burn (as predicted by the equilibrium calculation) helps explainthe trend of the data shown in Fig. 86. The peak temperature decreases with increasingequivalance ratio. For 1 < φ < 2.5, the temperature is sufficiently high that the reactionsin the products proceed rapidly before heat transfer to the vessel walls reduces the gastemperature and the chemical reactions cease. For these cases, the equilibrium model
91

0
500
1000
1500
2000
2500
3000
1 2 3 4 5Equivalence ratio
(Tm
ax) 1
(K
)
Equilibrium calculation
Figure 87: Equilibrium predictions of the maximum temperature during the first burnas a function of equivalence ratio. Adiabatic, constant volume, complete combustionprocess.
appears to be appropriate. As the equivalence ratio increases, φ > 2.5, the peak temper-ature drops and the rate of the chemical reactions decreases. The reaction apparentlydoes not have time to take place before the gas cools to the vessel temperature. For thesecases, the frozen model appears to be appropriate.
For equivalence ratios greater than 4, combustion produces a significant amount ofsoot, decreasing the final pressure relative to the predictions which do not account forthe formation of carbon-containing solids. In addition, incomplete combustion occurs,resulting in a lower pressure rise in comparison to the complete combustion prediction.For equivalence ratios greater than 5, the combustion could not be initiated. This isconsistent with the very low pressure rise observed at φ=5 (Fig. 82).
The normalized product distributions for the cool gas assuming equilibrium compo-sition appear in Fig. 88. For equivalence ratios near stoichiometric, the products arecomposed almost entirely of H2O and CO2. For the higher equivalence ratios, the prod-ucts are composed almost entirely of CO and CH4. The product distribution for thecooled gas assuming a frozen composition is the same as in Fig. 85.
After the products have cooled to the initial temperature of the vessel, oxygen andnitrogen are added to form an equivalent stoichiometric mixture. The mixture is ignitedand the pressure histories are recorded. The initial pressure for the second burn after theaddition of the oxygen and nitrogen is approximately 100 kPa, refer to Table 20 for theactual values. The recorded pressure histories for the second burn appear in Fig. 89 and90. As the first burn equivalence ratio increases, the maximum pressure of the secondburn at an equivalent stoichiometric condition increases. This is a result of the partial
92
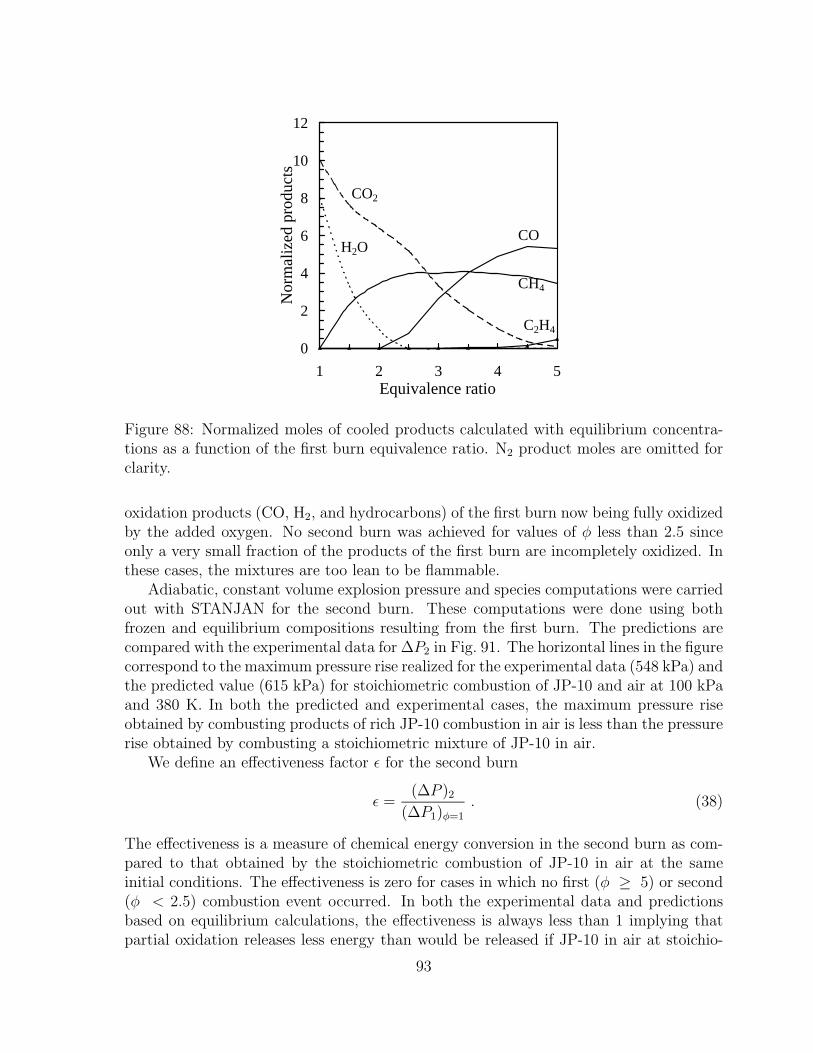
0
2
4
6
8
10
12
1 2 3 4 5Equivalence ratio
Nor
mal
ized
pro
duct
sCH4
COH2O
CO2
C2H4
Figure 88: Normalized moles of cooled products calculated with equilibrium concentra-tions as a function of the first burn equivalence ratio. N2 product moles are omitted forclarity.
oxidation products (CO, H2, and hydrocarbons) of the first burn now being fully oxidizedby the added oxygen. No second burn was achieved for values of φ less than 2.5 sinceonly a very small fraction of the products of the first burn are incompletely oxidized. Inthese cases, the mixtures are too lean to be flammable.
Adiabatic, constant volume explosion pressure and species computations were carriedout with STANJAN for the second burn. These computations were done using bothfrozen and equilibrium compositions resulting from the first burn. The predictions arecompared with the experimental data for ∆P2 in Fig. 91. The horizontal lines in the figurecorrespond to the maximum pressure rise realized for the experimental data (548 kPa) andthe predicted value (615 kPa) for stoichiometric combustion of JP-10 and air at 100 kPaand 380 K. In both the predicted and experimental cases, the maximum pressure riseobtained by combusting products of rich JP-10 combustion in air is less than the pressurerise obtained by combusting a stoichiometric mixture of JP-10 in air.
We define an effectiveness factor ε for the second burn
ε =(∆P )2
(∆P1)φ=1
. (38)
The effectiveness is a measure of chemical energy conversion in the second burn as com-pared to that obtained by the stoichiometric combustion of JP-10 in air at the sameinitial conditions. The effectiveness is zero for cases in which no first (φ ≥ 5) or second(φ < 2.5) combustion event occurred. In both the experimental data and predictionsbased on equilibrium calculations, the effectiveness is always less than 1 implying thatpartial oxidation releases less energy than would be released if JP-10 in air at stoichio-
93

0
100
200
300
400
500
600
0 0.1 0.2 0.3 0.4
Time (s)
P-P
2 (k
Pa)
φ = 4.5
φ = 3.5
φ = 2.5
Figure 89: Pressure histories of the second burn for φ equal to 2.5, 3.5, and 4.5.
0
100
200
300
400
500
600
0 0.1 0.2 0.3 0.4
Time (s)
P-P
2 (k
Pa)
φ = 3
φ = 4
Figure 90: Pressure histories of the second burn for φ equal to 3 and 4.
metric conditions was burned directly (Fig. 92).The equilibrium product distributions have been computed for the second burn. The
case of starting with the frozen composition (Fig. 85) for the first burn is shown in Fig. 94.The case of starting with the equilibrium composition (Fig. 88) for the first burn is shownin Fig. 93. In both cases, the results have been normalized to one mole of fuel and the
94
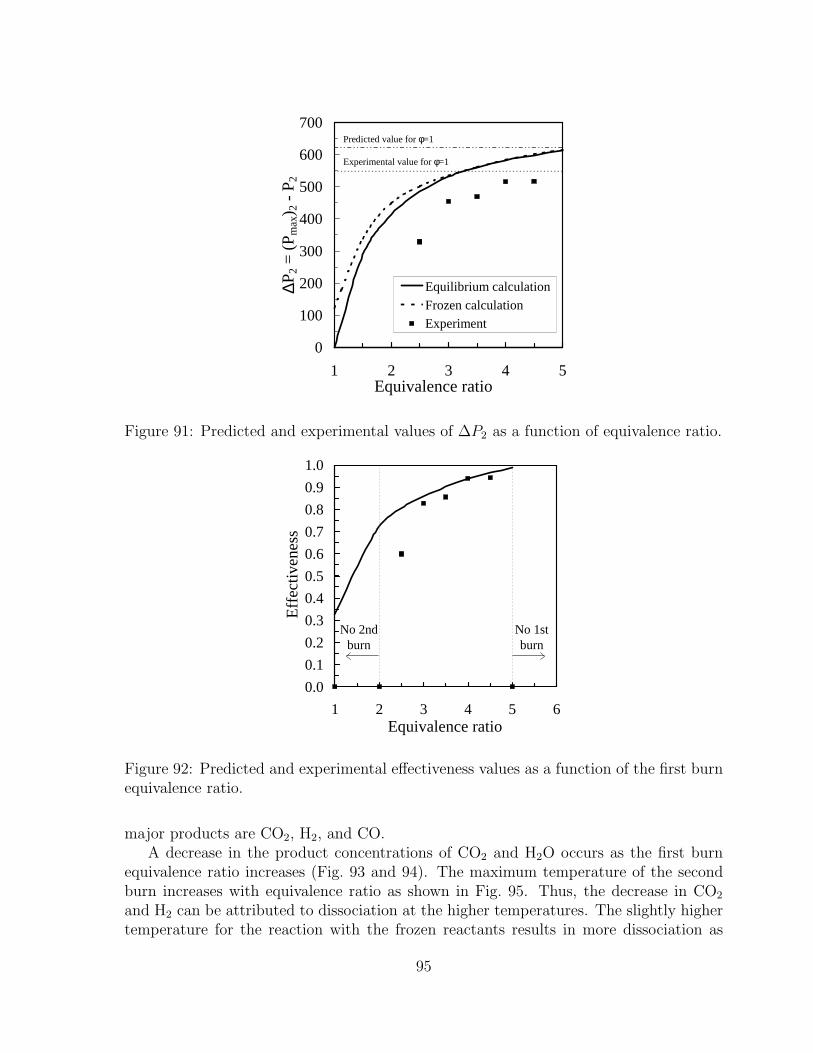
0
100
200
300
400
500
600
700
1 2 3 4 5Equivalence ratio
∆P2
= (
P ma
x) 2 -
P2
Equilibrium calculation
Frozen calculationExperiment
Experimental value for φ=1
Predicted value for φ=1
Figure 91: Predicted and experimental values of ∆P2 as a function of equivalence ratio.
0.0
0.1
0.2
0.3
0.4
0.5
0.6
0.7
0.8
0.9
1.0
1 2 3 4 5 6Equivalence ratio
Eff
ect
ive
ne
ss
No 2nd burn
No 1stburn
Figure 92: Predicted and experimental effectiveness values as a function of the first burnequivalence ratio.
major products are CO2, H2, and CO.A decrease in the product concentrations of CO2 and H2O occurs as the first burn
equivalence ratio increases (Fig. 93 and 94). The maximum temperature of the secondburn increases with equivalence ratio as shown in Fig. 95. Thus, the decrease in CO2
and H2 can be attributed to dissociation at the higher temperatures. The slightly highertemperature for the reaction with the frozen reactants results in more dissociation as
95

0
2
4
6
8
10
12
1 2 3 4 5Equivalence ratio
No
rma
lize
d p
rod
uct
mo
les
CO2
H2O
CO O2
Figure 93: Normalized product moles of second burn with reactants calculated usingequilibrium concentrations as a function of the first burn equivalence ratio. N2 productmoles are omitted for clarity.
0
2
4
6
8
10
12
1 2 3 4 5Equivalence ratio
No
rma
lize
d p
rod
uct
mo
les
CO2H2O
COO2
Figure 94: Normalized product moles of second burn with reactants calculated usingfrozen chemistry as a function of the first burn equivalence ratio. N2 product moles areomitted for clarity.
compared to the reactants from the equilibrium case.
96
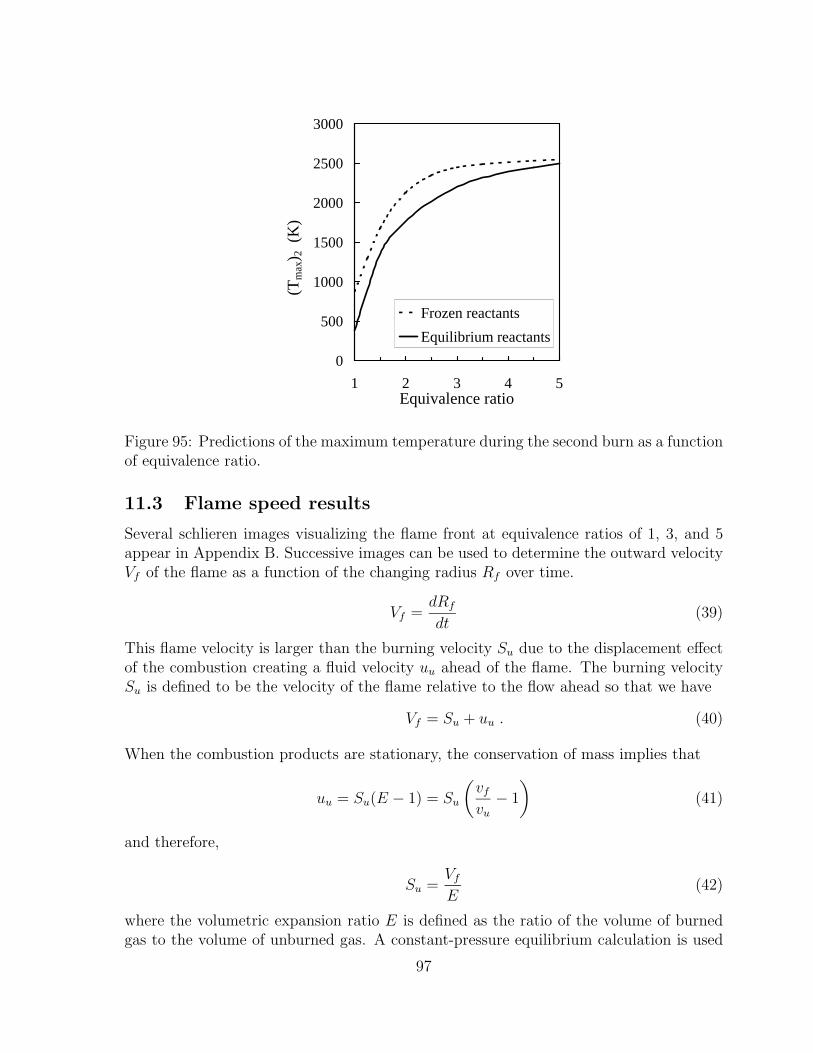
0
500
1000
1500
2000
2500
3000
1 2 3 4 5Equivalence ratio
(Tm
ax) 2
(K
)Frozen reactants
Equilibrium reactants
Figure 95: Predictions of the maximum temperature during the second burn as a functionof equivalence ratio.
11.3 Flame speed results
Several schlieren images visualizing the flame front at equivalence ratios of 1, 3, and 5appear in Appendix B. Successive images can be used to determine the outward velocityVf of the flame as a function of the changing radius Rf over time.
Vf =dRf
dt(39)
This flame velocity is larger than the burning velocity Su due to the displacement effectof the combustion creating a fluid velocity uu ahead of the flame. The burning velocitySu is defined to be the velocity of the flame relative to the flow ahead so that we have
Vf = Su + uu . (40)
When the combustion products are stationary, the conservation of mass implies that
uu = Su(E − 1) = Su
(vf
vu
− 1
)(41)
and therefore,
Su =Vf
E(42)
where the volumetric expansion ratio E is defined as the ratio of the volume of burnedgas to the volume of unburned gas. A constant-pressure equilibrium calculation is used
97
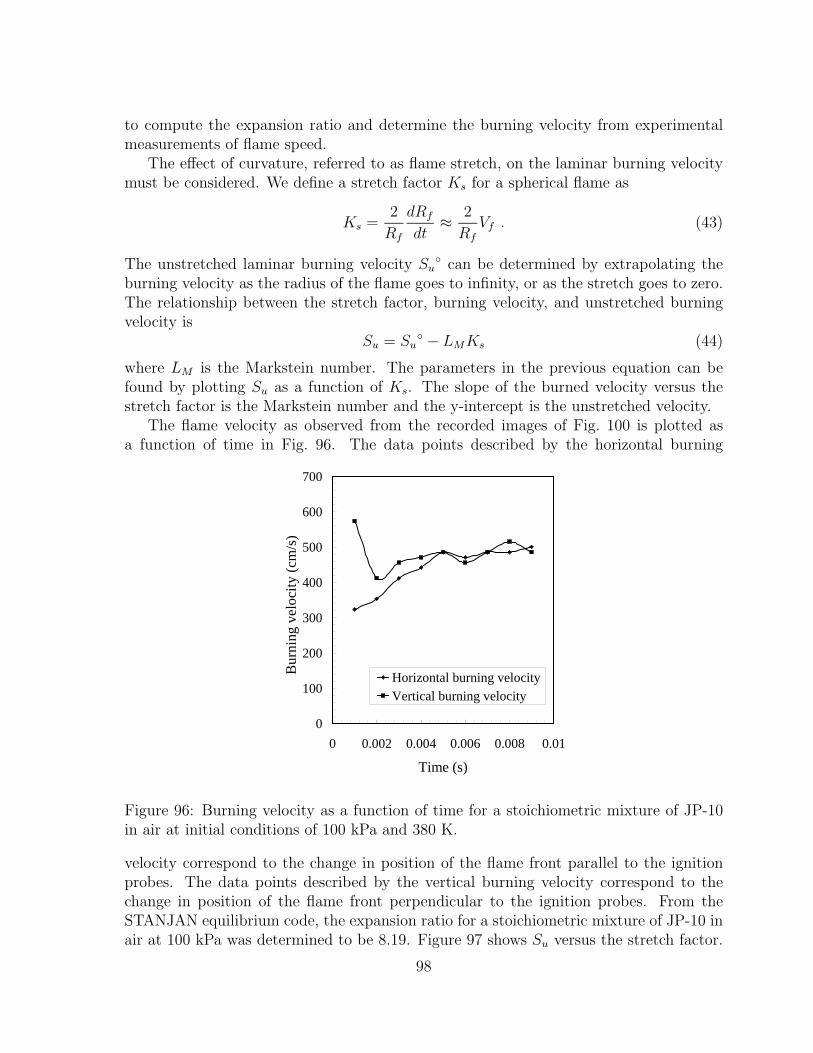
to compute the expansion ratio and determine the burning velocity from experimentalmeasurements of flame speed.
The effect of curvature, referred to as flame stretch, on the laminar burning velocitymust be considered. We define a stretch factor Ks for a spherical flame as
Ks =2
Rf
dRf
dt≈ 2
Rf
Vf . (43)
The unstretched laminar burning velocity Su◦ can be determined by extrapolating the
burning velocity as the radius of the flame goes to infinity, or as the stretch goes to zero.The relationship between the stretch factor, burning velocity, and unstretched burningvelocity is
Su = Su◦ − LMKs (44)
where LM is the Markstein number. The parameters in the previous equation can befound by plotting Su as a function of Ks. The slope of the burned velocity versus thestretch factor is the Markstein number and the y-intercept is the unstretched velocity.
The flame velocity as observed from the recorded images of Fig. 100 is plotted asa function of time in Fig. 96. The data points described by the horizontal burning
0
100
200
300
400
500
600
700
0 0.002 0.004 0.006 0.008 0.01
Time (s)
Bu
rnin
g v
elo
city
(cm
/s)
Horizontal burning velocityVertical burning velocity
Figure 96: Burning velocity as a function of time for a stoichiometric mixture of JP-10in air at initial conditions of 100 kPa and 380 K.
velocity correspond to the change in position of the flame front parallel to the ignitionprobes. The data points described by the vertical burning velocity correspond to thechange in position of the flame front perpendicular to the ignition probes. From theSTANJAN equilibrium code, the expansion ratio for a stoichiometric mixture of JP-10 inair at 100 kPa was determined to be 8.19. Figure 97 shows Su versus the stretch factor.
98
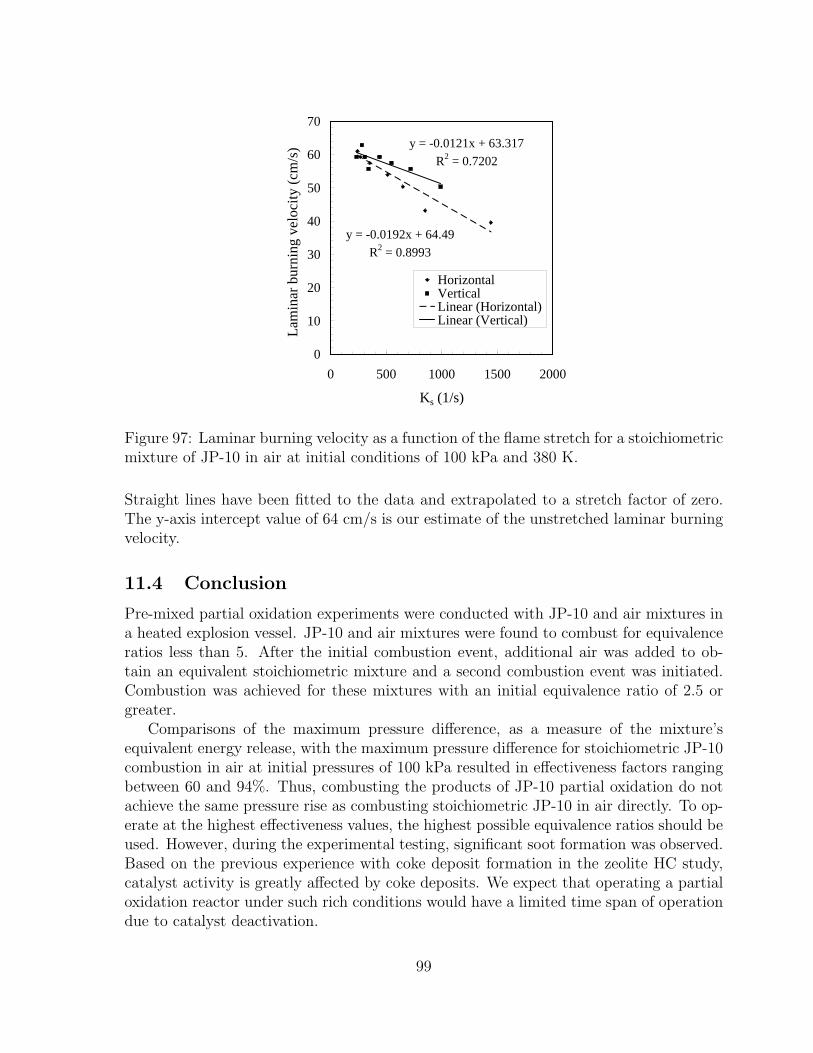
y = -0.0192x + 64.49
R2 = 0.8993
y = -0.0121x + 63.317
R2 = 0.7202
0
10
20
30
40
50
60
70
0 500 1000 1500 2000
Ks (1/s)
Lam
ina
r b
urn
ing
ve
loci
ty (
cm/s
) HorizontalVerticalLinear (Horizontal)Linear (Vertical)
Figure 97: Laminar burning velocity as a function of the flame stretch for a stoichiometricmixture of JP-10 in air at initial conditions of 100 kPa and 380 K.
Straight lines have been fitted to the data and extrapolated to a stretch factor of zero.The y-axis intercept value of 64 cm/s is our estimate of the unstretched laminar burningvelocity.
11.4 Conclusion
Pre-mixed partial oxidation experiments were conducted with JP-10 and air mixtures ina heated explosion vessel. JP-10 and air mixtures were found to combust for equivalenceratios less than 5. After the initial combustion event, additional air was added to ob-tain an equivalent stoichiometric mixture and a second combustion event was initiated.Combustion was achieved for these mixtures with an initial equivalence ratio of 2.5 orgreater.
Comparisons of the maximum pressure difference, as a measure of the mixture’sequivalent energy release, with the maximum pressure difference for stoichiometric JP-10combustion in air at initial pressures of 100 kPa resulted in effectiveness factors rangingbetween 60 and 94%. Thus, combusting the products of JP-10 partial oxidation do notachieve the same pressure rise as combusting stoichiometric JP-10 in air directly. To op-erate at the highest effectiveness values, the highest possible equivalence ratios should beused. However, during the experimental testing, significant soot formation was observed.Based on the previous experience with coke deposit formation in the zeolite HC study,catalyst activity is greatly affected by coke deposits. We expect that operating a partialoxidation reactor under such rich conditions would have a limited time span of operationdue to catalyst deactivation.
99
12 Conclusions
Thermal and catalytic cracking of JP-10 has been investigated in a flowing reactor.
Chromatography with liquid injection Gas chromatography with liquid injectionstudied the effect of sample dilution. A dilution of 0.05% wt of JP-10 in hexane in a 1 µlsample was required to obtain symmetric chromatograms. Symmetric chromatograms arenecessary for accurate quantitative measurements of the sample amount and retentiontime.
Chromatography with gaseous injection Gas chromatography with gaseous injec-tion quantified the retention time of the major alkanes from C5 to C12. These retentiontimes established the region boundaries of signal integration so the product distributionsfrom the HC reactions could be quantified.
JP-10 vapor pressure A correlation for the vapor pressure of JP-10 was generatedfrom experimental data. It was determined that the reactor panel could not obtain thetemperatures necessary to vaporize JP-10 to achieve a rise in the system pressure greaterthan approximately 130 kPa. As a result, most tests were completed at atmosphericpressure.
Data analysis procedure A procedure to analyze the conversion of JP-10 into smallermolecular weight compounds enabled conclusions to be made regarding the effect ofoperating conditions. The major system diagnostic was the instantaneous accumulatorposition. A relationship developed between the accumulator position and the numberof moles of products in the system. This was related to the number of moles injectedof liquid JP-10 to conduct a mole balance. The data obtained with this method aresummarized below.
Samples taken from the accumulator with the gas chromatograph yielded the distri-bution of the product gas retention times. The individual signal peaks were split intoregions corresponding to compounds with the same carbon number. This allowed a qual-itative measurement of the product distribution and enabled comparisons between tests.Although saturation of the GC column occurred due to the large sample sizes, trends arestill observed.
Thermal cracking Tests with the heated reactor panel were completed to determinethe effect of thermal reactions on the hydrocarbon cracking of JP-10. Liquid JP-10 wasmetered into the system and allowed to flow through the reactor which was at 500◦C.Conversion ratios of approximately 3% and less were observed. The GC chromatogramsdid show a slight increase in C5 and C6 compounds in addition to higher molecular weightcompounds (> C12).
Thermal reactions were not found to be significant for JP-10 at 500◦C. Increasing thereactor temperature may cause these reactions to be of more importance.
100

Fuel Flowrate (g/hr) mole ratio % conversion2.3 1.11 3.156.2 1.09 2.1910.6 1.02 1.90
Table 21: Major results of thermal cracking tests.
Effect of zeolite type Throughout the course of testing using zeolite pellets installedin the reactor, two separate batches were prepared. Since the zeolite activity was notverified by standard tests before installation, the conversion ratios were compared. Thiswas the only available means with which to verify similar zeolite activity. Additionally,after the zeolite had become coked through testing in the reactor panel, its activity wasrestored by a regeneration process. The activity as measured by the mole balance seemedto be more consistent than the GC percent conversion.
2.3 g/hr 10.6 g/hrmole ratio % conv. mole ratio % conv.
1st batch 1.826 34 1.472 311st batch regenerated 1.583 61
2nd batch 1.444 36
Table 22: Effect of zeolite activity on conversion.
The number of times the same zeolite pellets may be regenerated and still maintainhigh activity should be investigated. The regeneration process is an acceptable meansto restore zeolite activity but over time the molecular structure degrades, ultimately de-stroying the zeolite. Because of the significant coking observed in our tests, a higherregeneration temperature than values used in the heavy oil cracking industry was re-quired. Holding the zeolite within this high temperature environment acts to acceleratethe structural degradation of the zeolite.
Effect of fuel flowrate The effect of the liquid fuel flowrate on the catalytic crackingtests was measured by comparing the conversion ratios at three different metering speeds.As in the thermal tests, a decrease in the fuel flowrate results in converting more JP-10into smaller compounds.
Fuel Flowrate (g/hr) mole ratio % conversion2.3 1.70 3410.6 1.51 41
Table 23: Effect of fuel flowrate on catalytic cracking tests with HY zeolite at a reactortemperature of 500◦C.
101
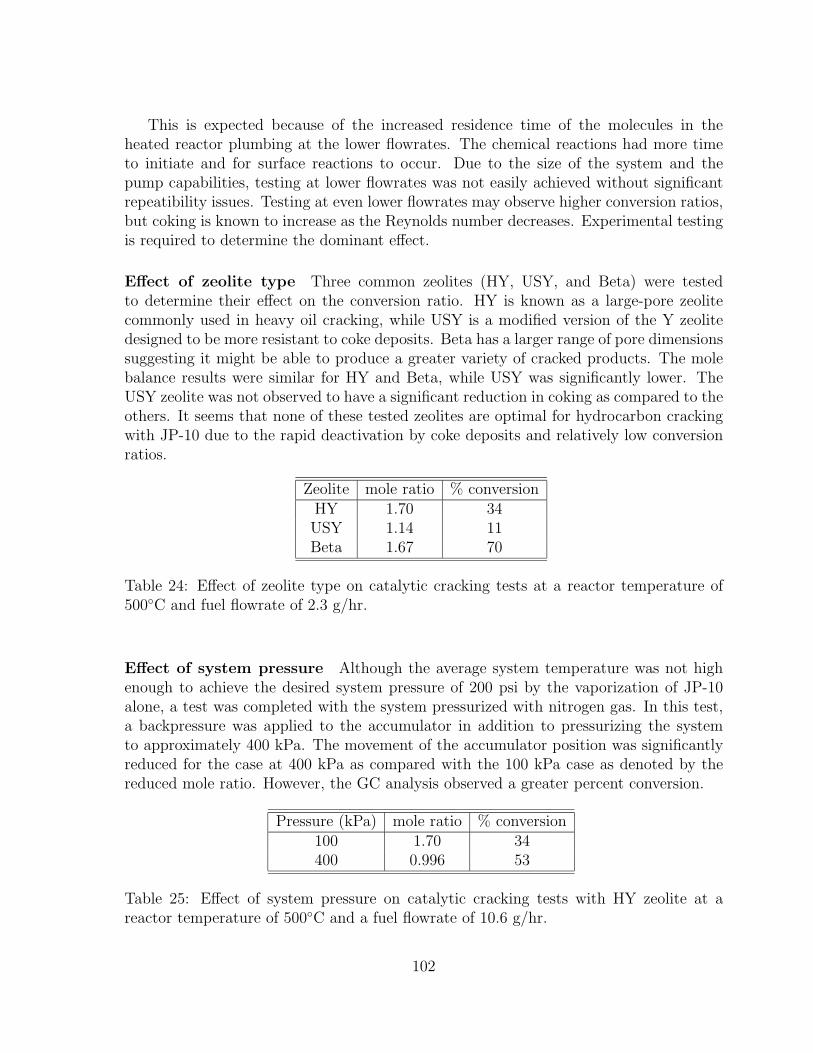
This is expected because of the increased residence time of the molecules in theheated reactor plumbing at the lower flowrates. The chemical reactions had more timeto initiate and for surface reactions to occur. Due to the size of the system and thepump capabilities, testing at lower flowrates was not easily achieved without significantrepeatibility issues. Testing at even lower flowrates may observe higher conversion ratios,but coking is known to increase as the Reynolds number decreases. Experimental testingis required to determine the dominant effect.
Effect of zeolite type Three common zeolites (HY, USY, and Beta) were testedto determine their effect on the conversion ratio. HY is known as a large-pore zeolitecommonly used in heavy oil cracking, while USY is a modified version of the Y zeolitedesigned to be more resistant to coke deposits. Beta has a larger range of pore dimensionssuggesting it might be able to produce a greater variety of cracked products. The molebalance results were similar for HY and Beta, while USY was significantly lower. TheUSY zeolite was not observed to have a significant reduction in coking as compared to theothers. It seems that none of these tested zeolites are optimal for hydrocarbon crackingwith JP-10 due to the rapid deactivation by coke deposits and relatively low conversionratios.
Zeolite mole ratio % conversionHY 1.70 34USY 1.14 11Beta 1.67 70
Table 24: Effect of zeolite type on catalytic cracking tests at a reactor temperature of500◦C and fuel flowrate of 2.3 g/hr.
Effect of system pressure Although the average system temperature was not highenough to achieve the desired system pressure of 200 psi by the vaporization of JP-10alone, a test was completed with the system pressurized with nitrogen gas. In this test,a backpressure was applied to the accumulator in addition to pressurizing the systemto approximately 400 kPa. The movement of the accumulator position was significantlyreduced for the case at 400 kPa as compared with the 100 kPa case as denoted by thereduced mole ratio. However, the GC analysis observed a greater percent conversion.
Pressure (kPa) mole ratio % conversion100 1.70 34400 0.996 53
Table 25: Effect of system pressure on catalytic cracking tests with HY zeolite at areactor temperature of 500◦C and a fuel flowrate of 10.6 g/hr.
102
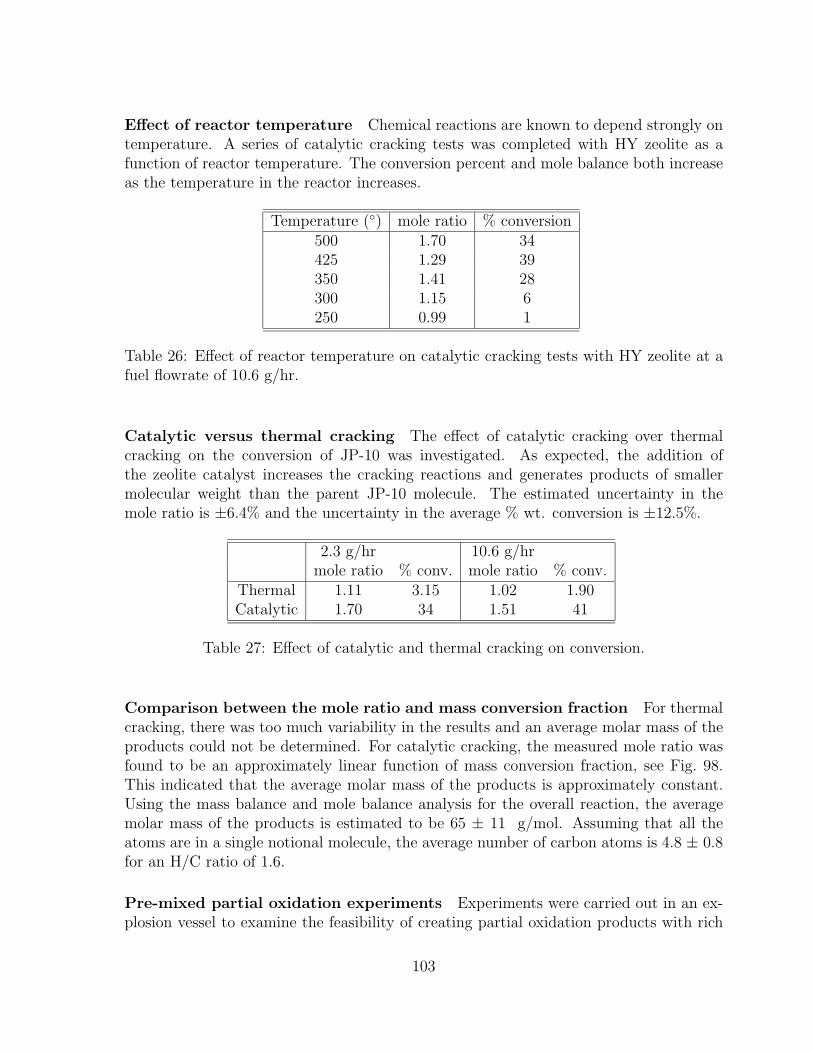
Effect of reactor temperature Chemical reactions are known to depend strongly ontemperature. A series of catalytic cracking tests was completed with HY zeolite as afunction of reactor temperature. The conversion percent and mole balance both increaseas the temperature in the reactor increases.
Temperature (◦) mole ratio % conversion500 1.70 34425 1.29 39350 1.41 28300 1.15 6250 0.99 1
Table 26: Effect of reactor temperature on catalytic cracking tests with HY zeolite at afuel flowrate of 10.6 g/hr.
Catalytic versus thermal cracking The effect of catalytic cracking over thermalcracking on the conversion of JP-10 was investigated. As expected, the addition ofthe zeolite catalyst increases the cracking reactions and generates products of smallermolecular weight than the parent JP-10 molecule. The estimated uncertainty in themole ratio is ±6.4% and the uncertainty in the average % wt. conversion is ±12.5%.
2.3 g/hr 10.6 g/hrmole ratio % conv. mole ratio % conv.
Thermal 1.11 3.15 1.02 1.90Catalytic 1.70 34 1.51 41
Table 27: Effect of catalytic and thermal cracking on conversion.
Comparison between the mole ratio and mass conversion fraction For thermalcracking, there was too much variability in the results and an average molar mass of theproducts could not be determined. For catalytic cracking, the measured mole ratio wasfound to be an approximately linear function of mass conversion fraction, see Fig. 98.This indicated that the average molar mass of the products is approximately constant.Using the mass balance and mole balance analysis for the overall reaction, the averagemolar mass of the products is estimated to be 65 ± 11 g/mol. Assuming that all theatoms are in a single notional molecule, the average number of carbon atoms is 4.8 ± 0.8for an H/C ratio of 1.6.
Pre-mixed partial oxidation experiments Experiments were carried out in an ex-plosion vessel to examine the feasibility of creating partial oxidation products with rich
103
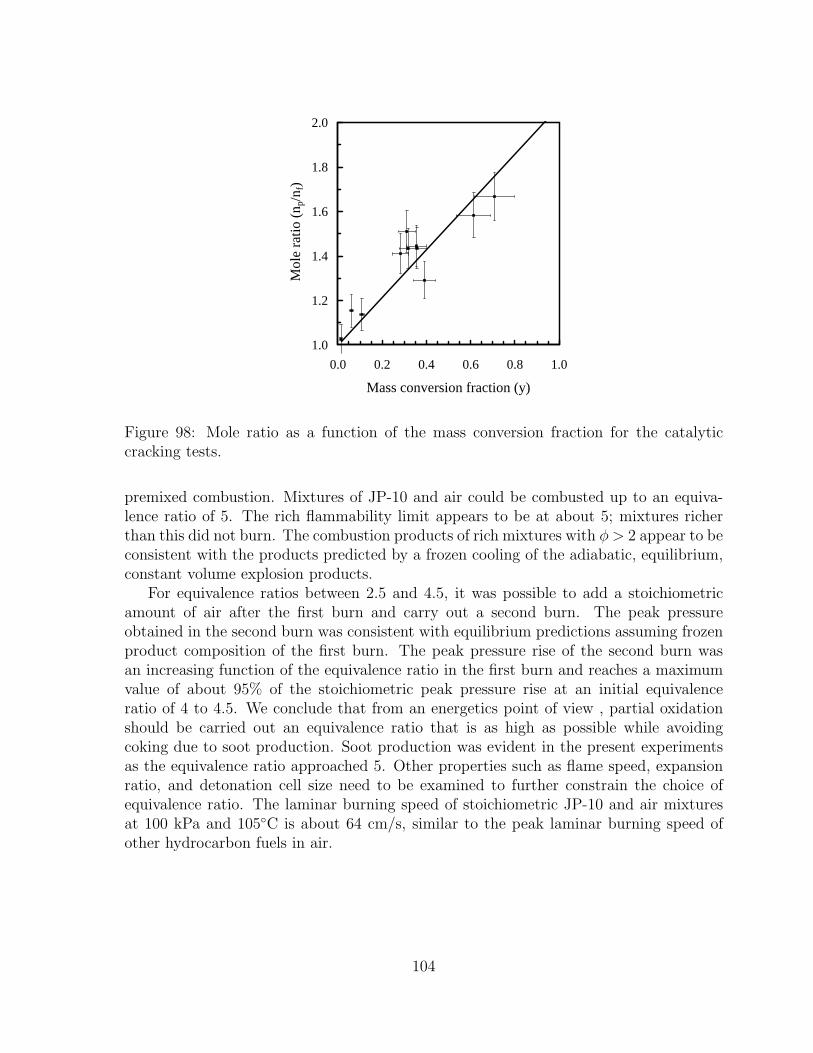
1.0
1.2
1.4
1.6
1.8
2.0
0.0 0.2 0.4 0.6 0.8 1.0
Mass conversion fraction (y)
Mo
le r
atio
(n p
/nf)
Figure 98: Mole ratio as a function of the mass conversion fraction for the catalyticcracking tests.
premixed combustion. Mixtures of JP-10 and air could be combusted up to an equiva-lence ratio of 5. The rich flammability limit appears to be at about 5; mixtures richerthan this did not burn. The combustion products of rich mixtures with φ > 2 appear to beconsistent with the products predicted by a frozen cooling of the adiabatic, equilibrium,constant volume explosion products.
For equivalence ratios between 2.5 and 4.5, it was possible to add a stoichiometricamount of air after the first burn and carry out a second burn. The peak pressureobtained in the second burn was consistent with equilibrium predictions assuming frozenproduct composition of the first burn. The peak pressure rise of the second burn wasan increasing function of the equivalence ratio in the first burn and reaches a maximumvalue of about 95% of the stoichiometric peak pressure rise at an initial equivalenceratio of 4 to 4.5. We conclude that from an energetics point of view , partial oxidationshould be carried out an equivalence ratio that is as high as possible while avoidingcoking due to soot production. Soot production was evident in the present experimentsas the equivalence ratio approached 5. Other properties such as flame speed, expansionratio, and detonation cell size need to be examined to further constrain the choice ofequivalence ratio. The laminar burning speed of stoichiometric JP-10 and air mixturesat 100 kPa and 105◦C is about 64 cm/s, similar to the peak laminar burning speed ofother hydrocarbon fuels in air.
104

Acknowledgement
This work was carried out under P.O. No. 00-592 for Advanced Projects Research, Inc.under AF contract F04611-99-C-0017. Contract administration, mechanical design andfabrication of two components of the facility: the reactor heater and accumulator, werecarried out by Advanced Projects Research, Inc. Key participants from APRI includedToby Rossmann, Jay Marsh, Kevin Moore, and Tom Sobota.
We acknowledge Kathia Devouge for her preliminary design work. Special thanksto Nathan Dalleska, Director of the Environmental Analysis Center at Caltech, for hisimmensely valuable lessons on the theory and operation of the gas chromatograph. Prof.Mark Davis of Chemical Engineering at Caltech and members of his research group werevery helpful with sharing their expertise in zeolite chemistry. In particular, we thankAndrea Wight, Ph.D. student in Chemical Engineering at Caltech, for providing notonly many zeolite samples and use of her chemical laboratory but also many helpfuldiscussions on zeolite structure, preparation, and handling procedures. We thank DanielLieberman for his contributions to the pre-mixed partial oxidation experiments.
105
References
[1] Austin, J. M. and Shepherd, J. E., “Detonation in Hydrocarbon Fuel Blends,” Ac-cepted for publication in Combustion and Flame.
[2] Hitch, B., “The Effect of Autoignition-Promoting Additives on Deflagration-to-Detonation Transition,” 38th AIAA/ASME/SAE/ASEE Joint Propulsion Confer-ence and Exhibit, July 7–10, 2002, Indianapolis, IN, AIAA 2002–3719.
[3] Akbar, R., Thibault, P. A., Harris, P. G., Lussier, L. S., Zhang, F., Murray, S. B.,and Gerrard, K., “Detonation Properties of Unsensitized and Sensitized JP-10 andJet-A Fuels in Air for Pulse Detonation Engines,” 36th AIAA/ASME/SAE/ASEEJoint Propulsion Conference and Exhibit, July 16–19, 2000, Huntsville, AL, AIAA2000–3592.
[4] Zhang, F., Murray, S. B., and Gerrard, K. B., “JP-10 Vapour Detonation at ElevatedPressures and Temperatures,” 18th ICDERS, Seattle, WA, July 29 – August 3, 2001.
[5] Olah, G. A. and Molnar, A., Hydrocarbon Chemistry , John Wiley and Sons, Inc.,New York, NY, 1995.
[6] Green, R. J., Nakra, S., and Anderson, S. L., “Breakdown Behavior of Fuels for PulseDetonation Engines,” Office of Naval Research, Energy Conversion and PropulsionProgram.
[7] Li, S. C., Varatharajan, B., and Williams, F. A., “The Chemistry of JP-10 Ignition,”39th AIAA Aerospace Sciences Meeting and Exhibit, January 8–11, 2001, Reno, NV,AIAA 2001–1074.
[8] Davidson, D. F., Horning, D. C., Oehlschlaeger, M. A., and Hanson, R. K., “The De-composition Products of JP-10,” 37th AIAA/ASME/SAE/ASEE Joint PropulsionConference and Exhibit, July 8–11, 2001, Salt Lake City, UT, AIAA 2001–3707.
[9] Schauer, F., Stutrud, J., and Bradley, R., “Detonation Initiation Studies and Per-formance Results for Pulsed Detonation Engines,” 39th AIAA Aerospace SciencesMeeting and Exhibit, January 8–11, 2001, Reno, NV, AIAA 2001-1129.
[10] Abbot, J. and Wojciechowski, B. W., “Catalytic Reactions of n-hexane on HYZeolite,” The Canadian Journal of Chemical Engineering , Vol. 66, October 1988,pp. 825–829.
[11] Dyer, A., An Introduction to Zeolite Molecular Sieves , John Wiley and Sons, Inc.,New York, NY, 1988.
[12] Meier, W. M. and Olson, D. H., Atlas of Zeolite Structure Types , Butterworth-Heinemann, London, 3rd ed., 1992.
106
[13] van Santen, R. A. and Niemantsverdriet, J. W., Chemical Kinetics and Catalysis ,Plenum Press, NY, 1995.
[14] Chang, C. D., Hydrocarbons from Methanol , Marcel Dekker, Inc., NY, 1983.
[15] Honna, K., Sato, K., Araki, Y., Miki, Y., Matsubayashi, N., and Shimada, H.,“HY zeolite-based catalyst for hydrocracking heavy oils,” Hydrotreatment and Hy-drocracking of Oil Fractions , edited by B. Delmon, G. F. Froment, and P. Grange,Elsevier Science, B.V., Amsterdam, 1999, pp. 427–430.
[16] Dwyer, J., Dewing, J., Karim, K., Ojo, A. F., Garforth, A. A., and Rawlence, D. J.,“Hydrocarbon Transformations over Analogues and Derivatives of Zeolite Y,” ZeoliteChemistry and Catalysis , edited by P. A. Jacobs, Elsevier Science Publishers, B.V.,Amsterdam, 1991, pp. 1–23.
[17] Lopes, J. M., Lemos, F., Ribeiro, F. R., and Derouane, E. G., “A comparison of thecatalytic properties of SAPO-37 and HY zeolite in the cracking of n-heptane and2,2,4-trimethylpentane,” Zeolite Chemistry and Catalysis , edited by P. A. Jacobs,Elsevier Science Publishers, B.V., Amsterdam, 1991, pp. 365–371.
[18] Paal, Z. and Xu, X. L., “Reactions of n-Hexane over Pt-HZSM-5 Catalyst,” Studiesin Surface Science and Catalysis , edited by H. K. Beyer, H. G. Karge, I. Kiricsi, andJ. B. Nagy, No. 94 in Catalysis by Microporous Materials, Elsevier Science, B. V.,Amsterdam, 1995, pp. 590–597.
[19] Sobel, D. R. and Spadaccini, L. J., “Hydrocarbon Fuel Cooling Technologies for Ad-vanced Propulsion,” Journal of Engineering for Gas Turbines and Power , Vol. 119,April 1997, pp. 344–351.
[20] H. Huang, D. R. S. and Spadaccini, L. J., “Endothermic Heat-Sink of Hydrocar-bon Fuels for Scramjet Cooling,” 38th AIAA/ASME/SAE/ASEE Joint PropulsionConference and Exhibit, July 7–10, 2001, Indianapolis, IN, AIAA 2002–3871.
[21] Spadaccini, L. J., Sobel, D. R., and Huang, H., “Deposit Formation and Mitigationin Aircraft Fuels,” Journal of Engineering for Gas Turbines and Power , Vol. 123,October 2001, pp. 741–746.
[22] Edwards, T., “Storable Fuels and Connected Issues of Hypersonic Flight,” FutureAerospace Technology in the Service of the Alliance: Sustained Hypersonic Flight ,NATO RTO, December 1997, AGARD-CP-600-03-Vol 3.
[23] Lander, H. and Nixon, A. C., “Endothermic Fuels for Hypersonic Vehicles,” Journalof Aircraft , Vol. 8, No. 4, 1971, pp. 200–207.
[24] Chin, J. S. and Lefebvre, A. H., “Influence on Flow Conditions on Deposits FromHeated Hydrocarbon Fuels,” Journal of Engineering for Gas Turbines and Power ,Vol. 115, July 1993, pp. 433–438.
107
[25] Condon, R. D., Instrumentation in Gas Chromatography , Eindhoven, Centrex, 1968.
[26] Grant, D. W., Capillary Gas Chromatography , John Wiley and Sons Ltd, New York,NY, 1996.
[27] Pecsok, R. L. and Shields, L. D., Modern Methods of Chemical Analysis , John Wileyand Sons Ltd, New York, NY, 1968.
[28] David, D. J., Gas Chromatographic Detectors , John Wiley and Sons Ltd, New York,NY, 1974.
[29] Braithwaite, A. and Smith, F. J., editors, Chromatographic Methods , Blackie Aca-demic and Professional, Bishopbriggs, Glasgow, 5th ed., 1996.
[30] Woodrow, J. E., “The Laboratory Characterization of ARCO Jet Fuel Vapor andLiquid,” Report prepared for the National Transportation Safety Board, June 2000.
[31] Shepherd, J. E., Austin, J., Chao, T., Pintgen, F., Wintenberger, E., Jackson, S.,and Cooper, M., “Detonation Initiation, Propagation, and Structural Response,”Fourteenth ONR Propulsion Meeting , edited by G. D. Roy and F. Mashayek, De-partment of Mechanical & Industrial Engineering, University of Illinois at Chicago,Chicago, August 2001, pp. 148–153, Office of Naval Research, Energy Conversionand Propulsion Program.
[32] Anonymous, “Handbook of Aviation Fuel Properties,” CRC Report 530, Society ofAutomotive Engineers, Warrendale, PA, 1983.
[33] Anonymous, “High Temperature JP-10 Vapor Pressure Data,” Data from USAFWright-Patterson AFB and Adroit Systems, Inc.
[34] Shepherd, J. E., Krok, J. C., and Lee, J. J., “Jet A Explosion Experiments: Lab-oratory Testing,” Explosion Dynamics Laboratory Report FM97-5, November 21,1997.
[35] Townsend, A. T. and Abbot, J., Catalytic cracking of tetralin on HY zeolite, Vol. 90of Applied Catalysis A: General , Elseview Science Publishers, B.V., Amsterdam,1991, pp. 97–115.
[36] Pickard, J. A., “Kinetics of the Autoxidation of a Jet-A Fuel,” Energy and Fuels ,Vol. 10, 1996, pp. 1074–1077.
[37] Bevington, P. R., Data Reduction and Error Analysis in the Physical Sciences ,McGraw-Hill, 1969.
[38] O’Connor, R. P. and Schmidt, L. D., “Catalytic Partial Oxidation of Cyclohexanein a Single-Gauze Reactor,” Journal of Catalysis , Vol. 191, 2000, pp. 245–256.
108

[39] Schmidt, L. D., Huff, M., and Bharadwaj, S. S., “Catalytic Partial OxidationReactions and Reactors,” Chemical Engineering Science, Vol. 49, No. 25A, 1994,pp. 3981–3994.
[40] Veser, G. and Schmidt, L. D., “Ignition and Extinction in the Catalytic Oxidation ofHydrocarbons over Platinum,” AIChE Journal , Vol. 42, No. 4, 1996, pp. 1077–1087.
[41] Reynolds, W. C., “The Element Potential Method for Chemical Equilibrium Anal-ysis: Implementation in the Interactive Program STANJAN, Version 3,” Tech. rep.,Dept. of Mechanical Engineering, Stanford University, Stanford, CA, January 1986.
109

A Timeline
Following is a timeline of major accomplishments in constructing and running the exper-iments of the reactor panel. After May 2002, many similar experimental tests were run.The type of test and important test parameters are listed. If not specified, the operatingparameters consisted of a reactor temperature equal to 500◦C and a system pressure of101 kPa. It should be noted that the system required approximately 6 hrs and 12 hrs toreach operational temperatures for the thermal and catalytic tests respectively. The timeof fuel injection was approximately 2 hrs, 1 hr and 30 min for the fuel pump meteringsettings (FP) of 125, 70 and 25 respectively. An additional time of 45 min per sampletaken by the GC out of the accumulator was required.
Date DescriptionSept. 20, 2000 Received ordered components for reactor panel.Oct. 4, 2000 Completed schematic of reactor panel with dimensions.
Designed panel support system. Purchased plywood andsheet metal for panel.
Oct. 17 and 20, 2000 Obtained information from Chemical Engineering de-partment regarding packed beds of zeolite pellets.
Dec. 12, 2000 Obtained porous disks for zeolite bed.Dec. 14, 2000 Machine shop finished construction of accumulator indi-
cator.Dec., 2000 Reactor panel constructed.Jan. 4, 2001 Designed and completed Autocad schematic of zeolite
bed containment device.Jan.-Feb. 2001 Assembly of components onto reactor panel and panel
supports.Mar. 12, 2001 Received accumulator. Replaced internal wiring with
high temperature heater hook-up wire.May-Jun., 2001 Completed wiring design of controllers, fuses, power sup-
ply, thermocouples and pressure transducers. Electri-cians installed dedicated wall plug for the reactor panel.
Jun. 15, 2001 Ordered rope heaters for system plumbing.Jul.-Aug., 2001 Installation of Swagelok connections and plumbing on re-
actor panel. Initial leak testing.Aug. 16, 2001 Ordered controllers for heating zones.Aug. 22, 2001 Tested rotometer operation.Aug. 26, 2001 Replace GC tubing with copper refrigeration tubing. Or-
dered analytical grade regulators for GC. Met director ofEnvironmental Analysis Center for tutorial on GC oper-ation.
110

continuedSept. 4-9, 2001 Completed 8 separate leak tests with and without ac-
cumulator. Replaced leaking Swagelok components andidentified leak across piston in accumulator.
Sept. 10, 2001 Built phenolic supports of reactor plumbing and standfor fuel pump on back of panel.
Sept. 13. 2001 Verified operation of reactor heaters. Took apart accu-mulator to be honed.
Sept. 16, 2001 Installed vacuum pump at system outlet. Calibrated fuelpump. Began learning GC ChemStation software.
Sept. 17, 2001 Calibrated pressure gauges to calibration panel pressuretransducers.
Sept. 20, 2001 Installed thermocouples on system tubing. Conductedtemperature distribution test. Reassembled accumulatorafter honing procedure.
Sept. 28, 2001 Leak test with accumulator. Tested system with fuelpump and discovered backpressure is required for opera-tion.
Oct. 4, 2001 Vent hood design completed.Oct. 10, 2001 Combined vapor pressure curves to determine correlation
between 1.5 and 4.0 T−1 (1000/K).Oct.-Nov., 2001 Injected JP-10 in heated system with fuel pump. Ob-
served lower pressure rise than predicted by vapor pres-sure curve.
Nov. 8, 2001 Additional supports added to bottle rack. Venting regu-lator installed on accumulator.
Dec. 19, 2001 Began GC analysis of normal alkanes to determine reten-tion times. Studied effect of GC operating parameters ondetector output.
Jan. 9, 2002 Replaced inoperational network card. Added a secondnetwork card into computer.
Jan.-Mar., 2002 Learned techniques of liquid injection from Environmen-tal Analysis Center. Conducted a total of 39 tests withliquid injection. Conducted a total of 51 tests withgaseous injection. Made dilution samples of alkanes.
Feb. 2, 2002 Conducted experiments to determine flowrate throughsample loop versus accumulator pressure.
Mar. 12, 2002 Calculated volumes of system plumbing.Apr. 9, 2002 Remove heater and adhesive from accumulator. Replace
with new flexible heater.
111
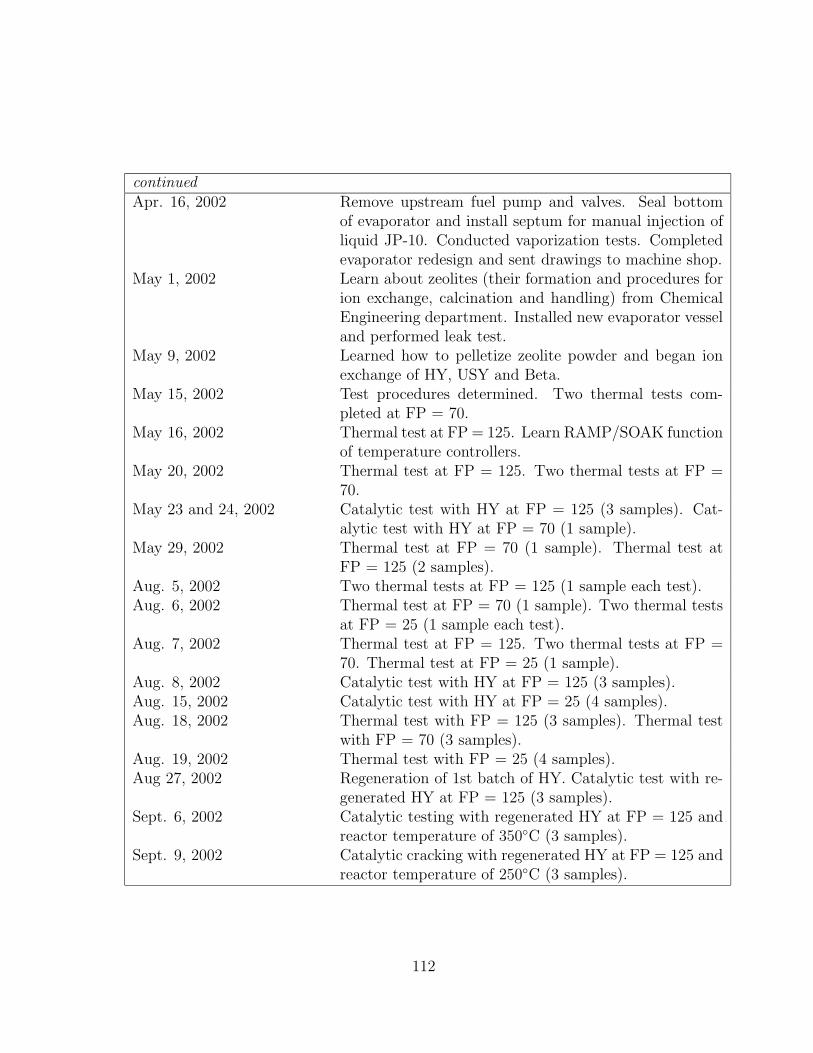
continuedApr. 16, 2002 Remove upstream fuel pump and valves. Seal bottom
of evaporator and install septum for manual injection ofliquid JP-10. Conducted vaporization tests. Completedevaporator redesign and sent drawings to machine shop.
May 1, 2002 Learn about zeolites (their formation and procedures forion exchange, calcination and handling) from ChemicalEngineering department. Installed new evaporator vesseland performed leak test.
May 9, 2002 Learned how to pelletize zeolite powder and began ionexchange of HY, USY and Beta.
May 15, 2002 Test procedures determined. Two thermal tests com-pleted at FP = 70.
May 16, 2002 Thermal test at FP = 125. Learn RAMP/SOAK functionof temperature controllers.
May 20, 2002 Thermal test at FP = 125. Two thermal tests at FP =70.
May 23 and 24, 2002 Catalytic test with HY at FP = 125 (3 samples). Cat-alytic test with HY at FP = 70 (1 sample).
May 29, 2002 Thermal test at FP = 70 (1 sample). Thermal test atFP = 125 (2 samples).
Aug. 5, 2002 Two thermal tests at FP = 125 (1 sample each test).Aug. 6, 2002 Thermal test at FP = 70 (1 sample). Two thermal tests
at FP = 25 (1 sample each test).Aug. 7, 2002 Thermal test at FP = 125. Two thermal tests at FP =
70. Thermal test at FP = 25 (1 sample).Aug. 8, 2002 Catalytic test with HY at FP = 125 (3 samples).Aug. 15, 2002 Catalytic test with HY at FP = 25 (4 samples).Aug. 18, 2002 Thermal test with FP = 125 (3 samples). Thermal test
with FP = 70 (3 samples).Aug. 19, 2002 Thermal test with FP = 25 (4 samples).Aug 27, 2002 Regeneration of 1st batch of HY. Catalytic test with re-
generated HY at FP = 125 (3 samples).Sept. 6, 2002 Catalytic testing with regenerated HY at FP = 125 and
reactor temperature of 350◦C (3 samples).Sept. 9, 2002 Catalytic cracking with regenerated HY at FP = 125 and
reactor temperature of 250◦C (3 samples).
112
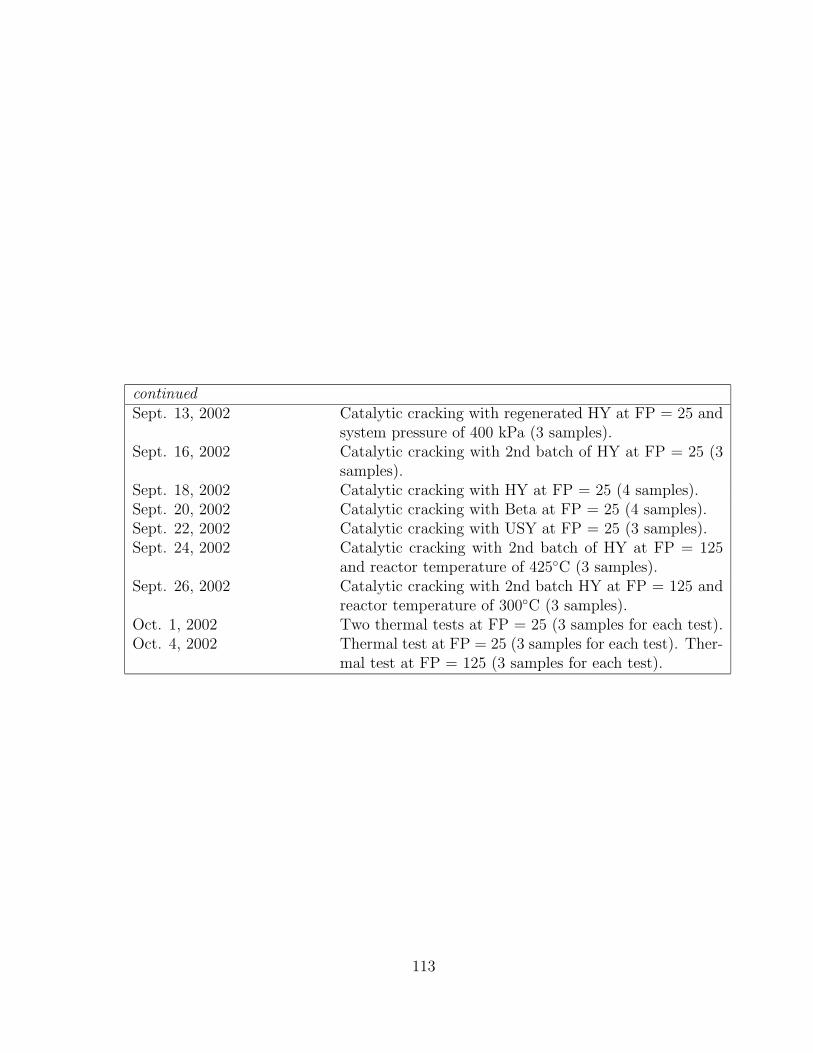
continuedSept. 13, 2002 Catalytic cracking with regenerated HY at FP = 25 and
system pressure of 400 kPa (3 samples).Sept. 16, 2002 Catalytic cracking with 2nd batch of HY at FP = 25 (3
samples).Sept. 18, 2002 Catalytic cracking with HY at FP = 25 (4 samples).Sept. 20, 2002 Catalytic cracking with Beta at FP = 25 (4 samples).Sept. 22, 2002 Catalytic cracking with USY at FP = 25 (3 samples).Sept. 24, 2002 Catalytic cracking with 2nd batch of HY at FP = 125
and reactor temperature of 425◦C (3 samples).Sept. 26, 2002 Catalytic cracking with 2nd batch HY at FP = 125 and
reactor temperature of 300◦C (3 samples).Oct. 1, 2002 Two thermal tests at FP = 25 (3 samples for each test).Oct. 4, 2002 Thermal test at FP = 25 (3 samples for each test). Ther-
mal test at FP = 125 (3 samples for each test).
113

B Schlieren images of flames in partial oxidation study
114

Figure 99: Successive images of first burn with an initial mixture of C10H16 + 14(O2 +3.76N2) at P1 = 96 kPa and initial temperature of 380 K.
115

Figure 100: Successive images of first burn with an initial mixture of 3C10H16 + 14(O2
+ 3.76N2) at P1 = 33 kPa and initial temperature of 380 K.
116
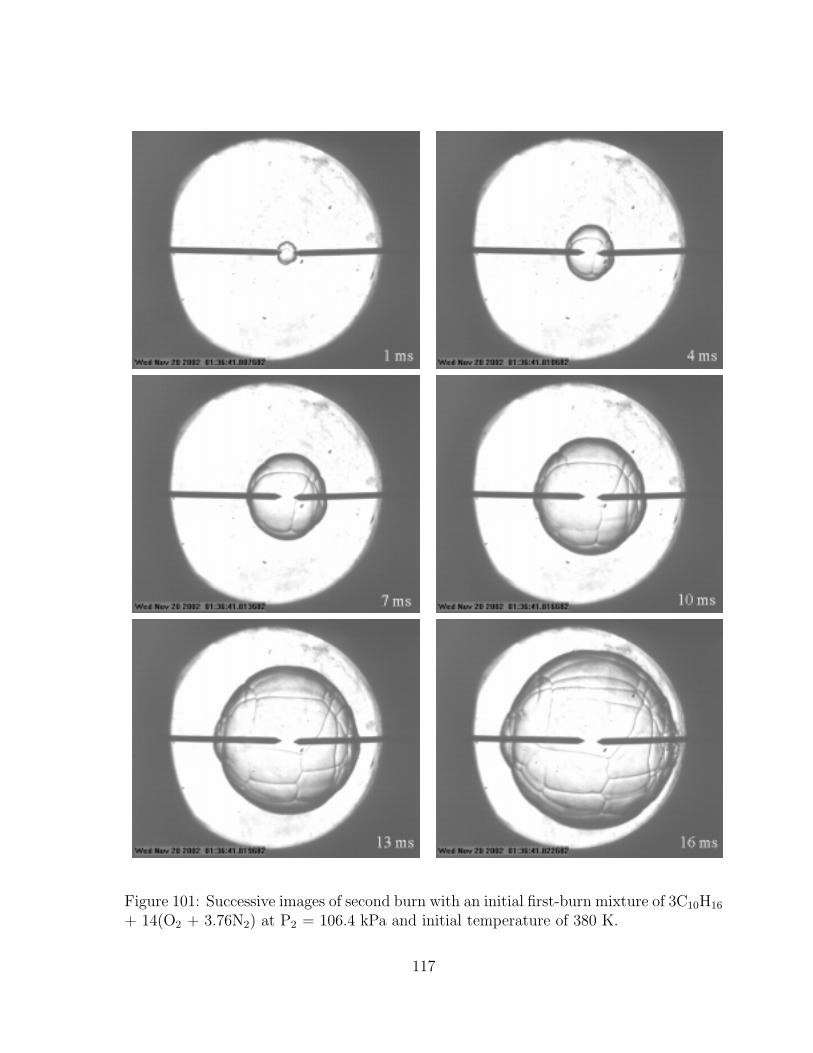
Figure 101: Successive images of second burn with an initial first-burn mixture of 3C10H16
+ 14(O2 + 3.76N2) at P2 = 106.4 kPa and initial temperature of 380 K.
117
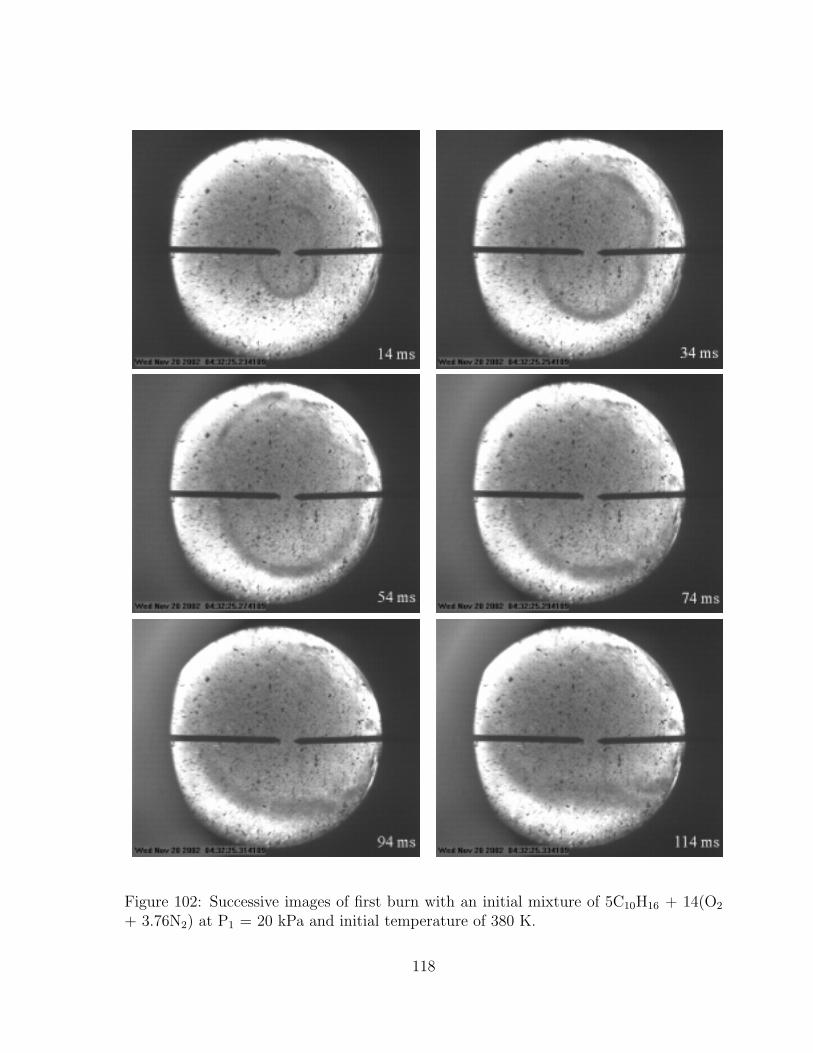
Figure 102: Successive images of first burn with an initial mixture of 5C10H16 + 14(O2
+ 3.76N2) at P1 = 20 kPa and initial temperature of 380 K.
118