thermal conductivity of silicone rubber …electrostaticanswers.com/2009esjc/session06/2009 ramirez...
TRANSCRIPT

Conf Presentation - 6.1 1
Abstract—The erosion resistance of a microfilled silicone
rubber composite, to dry band arcing, which is simulated by heat from an infrared laser, is shown to increase with the reinforcement of the composite with nanofiller. The thermal conductivity of the composite plays an important role in improving the resistance to pyrolysis and it is demonstrated that the addition of nanofillers into the silicone matrix increases the thermal conductivity of the composite. The thermal conductivity of silicone rubber composites is measured in microfilled, nanofilled, and micro-nanofilled composites using a standard method. An increase in the thermal conductivity is shown when the nanofiller is well dispersed, otherwise there is not such improvement. Also, the thermal conductivity was calculated using different theoretical models; in addition a model in COMSOL MultiphysicsTM was implemented and solved by a finite element method (FEM).
Index Terms— Composite, filler, surfactant, thermal conductivity.
I. INTRODUCTION HE reinforcing of a silicone rubber matrix was
successfully done with the mixture of a type of microsilica, nanofumed silica, and a surfactant was used to enhance dispersion of the nanofiller [1].
The addition of microfillers in silicone elastomer have been well investigated and has been proved that different kind of microfillers enhance thermal conductivity (TC). Meyer et al [2] found a sound correlation between thermal conductivity and microfillers. The higher the filler concentration in the polymeric matrix, the greater the thermal conductivity, and thus the higher the resistance to dry band arcing erosion [3].
Rätzke et al [4] have found a rise approximately linear to the filler concentration good correlation between TC and filler concentration that improves the resistance to erosion. The previous research does not mention whether the analyzed
Manuscript received April 17, 2009. I. Ramirez is with the University of Waterloo, Waterloo, Ontario, N2L
3G1 Canada. The financial support provided by NSERC of Canada is appreciated. I. Ramirez gratefully acknowledges the Instituto de Investigaciones Eléctricas for a study leave and the Mexican Science Council (CONACYT) for financial support of his graduate studies. (phone: 519 888 4567 ext 37057; e-mail: i2ramire@ engmail.uwaterloo.ca).
S. Jayaram is with the Electrical and Computer Engineering Department, University of Waterloo, Waterloo, Ontario, N2L 3G1 Canada (e-mail: jayaram@ ecemail.uwaterloo.ca).
E. A. Cherney is with the Electrical and Computer Engineering Department, University of Waterloo, Waterloo, Ontario, N2L 3G1 Canada (e-mail: [email protected]).
samples are close to the percolation limit of the fillers. Up to now, there are different theoretical, semi-theoretical,
and empirical models to calculate TC; however, none considers particle size resulting in different thermal conductivity estimates [5]. Thus, it is important to investigate the role of the nanofillers on the thermal conductivity.
In this paper, thermal conductivity was measured using a standard method and was calculated using theoretical models. In addition, a model in COMSOL MultiphysicsTM is developed and solved by a finite element method (FEM); however, the thermal resistance between the silicone rubber matrix and the filler particles is not included in the model. Moreover, the heating and cooling thermal profiles during laser ablation tests were measured with an infrared camera and simulated in COMSOL. A comparison of the temperature profile of various silicone rubber composites in the laser ablation tests shows some difference in the maximum temperature developed in the composites. The experimental measurements and modeling are discussed in the following sections.
II. METHODOLOGY
A. Sample Preparation Nanofumed silica (nfs) and microsilica (m) are the fillers
used in this research. The matrix material is a two-part addition cure silicone rubber (SiR), RTV 615, manufactured by the General Electric Company. TritonTM X-100, a commercial surfactant, was used in the dispersion of the nanofillers.
The composites were prepared by a method described in a previous paper and briefly described here for clarity [1]. The composites were prepared using fillers either as supplied or calcinated at a temperature of 1173 K and various amounts of Triton surfactant in RTV 615 silicone rubber. A high shear force Ross laboratory mixer, model HSM-100LSK equipped with a high shear blade, was used in mixing the composites.
After mixing, the composite was degassed under vacuum, poured into molds, allowed to cure at room temperature for 24 h, and post-cured at 360 K for 4 h. The characteristics of the fillers are summarized in Table I.
TABLE I CHARACTERISTICS OF THE FILLERS USED
Filler Average particle
size (nm)
Surface area per gram
(m2/g, BET)
Density (kg/m3)
@ 298 K Nanofumed Silica 7 390±40 2200
Microsilica 5000 5 2650
Thermal Conductivity of Silicone Rubber Nanocomposites
Isaias Ramirez, Shesha Jayaram, and Edward A. Cherney
T

Conf Presentation - 6.1 2
For the laser test, the composites require a darker color to ensure identical spectral absorption of the laser radiation; this was achieved by including 2.5% weight of iron oxide in the mixture for all composites.
B. Measurement of Thermal Conductivity B.1 Based on ASTM D5470 Thermal conductivity measurements were performed based
on the ASTM D5470 standard [6]. Bond-line thickness measurements were performed during the test using a Mitutoyo laser scan micrometer, LSM 503H. Tests were performed under atmospheric conditions for a mean joint temperature of 373 K. The temperature readings from the resistance temperature detectors in the heat flux meters were used to calculate two quantities, the total heat flow rate through the joint, Q, and the temperature drop across the joint, ΔT. From these two quantities namely, the joint resistance was calculated:
QTRj
Δ= (1)
Thermal conductivity is calculated from the overall joint
resistance using the relationship:
ARtk
j
BLT= (2)
where A=625 mm2 and tBLT is the measured bond-line thickness from the laser micrometer. The composite size for this measurement was 25 mm x 25 mm with a thickness of 3 mm.
B.2 Based on Temperature Profile The surface thermal measurements were conducted with an
infrared camera, FLIR SC500, and thermo vision acquisition software. The detector emissivity is between 7.5 and 13 µm, and the temperature image is displayed in a 320 x 240 pixel array. The thermal sensitivity of the detector is 273.07 K at a temperature of 303 K with an accuracy of ±275 K up to 1773 K. The emissivity calibration was adjusted to 0.98 due to the color of the composites. The emissivity was determined by comparing the temperature reading of the camera of composites heated to 360 K in an oven to the temperature measurement of a thermocouple.
The laser, set at 0.24 W, irradiated the surface of the composite for 3 minutes after which the laser was switched off. The temperature heating and cooling profiles were measured using the infrared camera for a total of 5 minutes- 3 minutes of heating and 2 minutes of cooling. The composites were located 50 mm from the laser source in all tests. The temperature profile for each formulation was recorded and analyzed for the determination of the thermal conductivity.
The cooling or decay profile was fitted to calculate the thermal conductivity following the technique developed by Luiz Meyer et al [2]. The principle is based on a known thermal conductivity of the unfilled sample and on the assumption that the heat transfer is mainly by conduction, so
the heat transfer due to radiation and convection is neglected. The fitting was done according to the equation:
tR eTTT α−+= 0 (3)
where TR is the room temperature, To is the initial temperature, α =C k, C is a proportionality constant, and k is the thermal conductivity.
C. Calculation of Thermal Conductivity C.1 Based on Existing Models The initial model selected was the rule of the mixtures. In
this model, the thermal conductivities and volume fractions of the filler and the matrix are used to calculate the thermal conductivity of the composite. However, this model does not consider particle size [3].
In order to consider the packing fraction and shape of the filler particles, the semi-theoretical model developed by Lewis and Nielsen was used [5] as the second model.
C.2 Using a Simplified Steady State Model of Dispersed
Composites A sphere in a cube was considered for this steady state
model. A filler particle was introduced in the center of a cube according to the approach suggested by Karayacoubian et al [7] and Araki et al [8]. Perfect thermal contact between the filler and the matrix is assumed.
The volume of one microsilica particle, assuming that it is a sphere, is 65.45 μm3. In a formulation of 20% weight of microsilica (8.8% volume), the calculation of the cell resulted in 9.06 μm each side as shown in Figure 1. Similarly, for a composition of 2.5% nanofumed silica (1.85% volume), each side of a unit cell is calculated to be 0.64 μm.
Fig. 1. A simplified three dimensional model for dispersed composites. It is assumed that the fillers and the SiR matrix are isotropic
and that their thermal conductivities are constant. The boundary conditions for the four faces of the cell that are parallel to the axis “z” are adiabatic. The other 2 faces are isothermal, and the heat goes from the upper face to the bottom. The heat conduction through the cubic cell is given by

Conf Presentation - 6.1 3
Fourier’s law as:
LTAkQ e
Δ= (4)
The thermal conductivity of the cell is Ke, A is the cross-sectional area, L is the distance between isothermal boundaries, ΔT is the temperature drop across the cell, and Rj is the total resistance of the cell.
The boundary conditions on the four adiabatic boundaries are:
02/
=⎟⎠⎞
⎜⎝⎛
∂∂
±= Lxm
xT
(5)
02/
=⎟⎟⎠
⎞⎜⎜⎝
⎛∂
∂±= Ly
m
yT
(6)
and in the two isothermal boundaries:
12
,, =⎟⎠⎞
⎜⎝⎛ LyxTm (7)
02
,, =⎟⎠⎞
⎜⎝⎛ −
LyxTm (8)
The total heat flow into or out of the cell is obtained by Fourier’s law across either of the isothermal boundaries [7]:
dydxz
TkQLz
L
L
L
L
mm
2/
2/
2/
2/
2/ =− −∫ ∫ ⎥
⎦
⎤⎢⎣
⎡⎟⎠⎞
⎜⎝⎛
∂∂
= (9)
For the above problem a simple analytical solution is
unavailable, and a numerical method is required to determine the temperature. The finite element method in COMSOL was used to solve the problem [9].
D. Temperature Profile in the Composites Using a Simplified Transient Model The temperature profile of the different formulations was
simulated assuming a 3D transient model using the heat transfer module in COMSOL. The equation solved in the software using FEM technique is [9]:
( ) QTktTC p =Δ−⋅Δ+
∂∂ρ (10)
where ρ is the density, Cp is the heat capacity, k is the thermal conductivity, and Q is the heat source. The heat generation is defined as a function of the laser power, and an inward heat flux of 19,100 W/m2 was calculated and used in the analysis [10]. The considered geometry was a cylinder of 36 mm of diameter with 7 layers of filler intercalated between 8 layers of silicone rubber matrix according to the volume fraction of each component in the formulation. It was not possible to simulate any more layers due to restrictions in the memory of the computer and the selected size of the mesh.
III. RESULTS A. Measurement of Thermal Conductivity
A.1 Based on ASTM D5470 The results for the thermal conductivity of the composites
are shown in Table II. A lower thermal conductivity is obtained in the pure silicone rubber matrix. It is seen that the thermal conductivity increases as various amounts and types of filler are introduced into the matrix. In the same way, the addition of surfactant increases the thermal conductivity; a higher effect is particularly noticed in the composite with 28 pph of surfactant, as shown in Table II.
A.2 Based on Temperature Profile Figure 2 shows temperature profiles for each formulation
during the laser ablation test as measured with the infrared camera. As expected, the unfilled silicone rubber sample reached the highest temperature during the test (482 K) whereas the maximum temperature for the nanofilled composite was somewhat lower at 475 K. However, for the 20%m+2.5%nfs composite the temperature was 8% lower than the unfilled sample, which is 445 K. The same temperature profile was obtained for all the formulations with 14 pph and 28 pph of surfactant.
TABLE II
MEASURED AND CALCULATED THERMAL CONDUCTIVITY OF DIFFERENT FORMULATIONS Thermal conductivity (W/m K)
Measured Calculated Formulation ASTM
D5470 Rule of
mixtures Nielsen method
COMSOLTM (steady state )
100% SiR 0.195 * * * 2.5% nfs 0.220 0.217 0.202 0.202 20% m 0.280 0.309 0.234 0.233 20%m+2.5% nfs 0.329 0.336 * 0.245a
0.247b
20%m+2.5% nfs+14 pph T 0.330 * * *
20%m+2.5% nfs+28 pph T 0.350 * * *
Notes: * Not possible to calculate. (a) 3x3x3 cells, 1 microparticle and 8 nanoparticles in each cell. (b) Circular arc with 1 microparticle and 29 nanospherical particles.
Time (s)
0 50 100 150 200 250 300
Tem
pera
ture
(K)
250
300
350
400
450
500
100% SiR 20%m+2.5%nfs(1173 K) 20%m 20%m+2.5%nfs 2.5%nfs
Fig. 2. Temperature profile during laser test for composites without surfactant (nfs is calcinated at 1173 K in one formulation).

Conf Presentation - 6.1 4
For space and clarity reasons, only the profile for the composite 20%m+2.5%nfs is shown in Figure 3. It was observed that in all the cases where the surfactant was included, the maximum temperature reached by the composite during the laser ablation test was always lower than the same composite without surfactant. This performance is believed to be due to better filler dispersion in the silicone rubber matrix.
Time (s)
0 50 100 150 200 250 300
Tem
pera
ture
(K)
280
300
320
340
360
380
400
420
440
460
20%m+2.5%nfs 20%m+2.5%nfs+14pphT 20%m+2.5%nfs+28pphT
Fig. 3. Temperature profile during laser test for composites 20%m+2.5%nfs with 14 pph and 28 pph of surfactant.
The spatial temperature profiles are shown in Figure 4 for
the various composites on the surface on both sides of the laser beam. As expected, the maximum temperature was obtained in the unfilled sample and the lowest temperature was measured in the micro-nano filled composite.
The fitting of the temperature decay profile was done for each composite according to the procedure described in section II.B.2. The obtained results are shown in Table III.
Position
P1 P2 P3 P4 P5 P6 P7 P8
Tem
pera
ture
(K)
300
320
340
360
380
400
420
440
460
480
500
100%SiR 2.5%nfs 20%m+2.5%nfs(1173 K) 20%m 20%m+2.5%nfs
Fig. 4. Maximum temperature along a line passing through the center of the composites and perpendicular to the laser beam (composites without surfactant).
It is evident that the thermal conductivity of the composites
increases as the addition of the surfactant increases. This behavior is likely due to the improved distribution of filler that comes about with surfactant. The composites with the combination of micro and nanofiller (20%m+2.5%nfs) had the
highest thermal conductivity of all the composites. This trend agrees with the results obtained the ASTM D5470 standard as shown in Table II.
TABLE III
THERMAL CONDUCTIVITY USING DECAY PROFILE Thermal conductivity (TC)
(W/m K)
Surfactant (pph)
Formulation
0 14 28
TC
Average
(W/m K)
2.5% nfs 0.197 0.209 0.229 0.212
20% m 0.229 0.301 0.300 0.277
20%m+2.5%nfs 0.255 0.401 0.440 0.365
20%m+2.5%nfs(1173 K) 0.254 0.373 0.361 0.329
Another measured temperature profile is shown in Figure 5
for the formulation 20%m+2.5%nfs with two concentrations of surfactant and without surfactant. The lowest temperature profile is obtained when 14 pph and 28 pph of surfactant is used, confirming the obtained values of thermal conductivity calculated with the decay method.
Position
P1 P2 P3 P4 P5 P6 P7 P8
Tem
pera
ture
(K)
300
320
340
360
380
400
420
440
460
20%m+2.5%nfs 20%m+2.5%nfs+14pphT 20%m+2.5%nfs+28pphT
Fig. 5. Maximum temperature along a line passing through the center of the composites and perpendicular to the laser beam (composites 20%m+2.5%nfs without and with surfactant).
B. Calculation of Thermal Conductivity
B.1 Based on Existing Models As a comparison with measured values, the results for the
rule of mixtures, and Lewis and Nielsen models are included in Table II.
For both models, the TC of the 2.5% nfs composite is very close to the value obtained using the ASTM D5470 standard; however, for the 20%m formulation, the Lewis and Nielsen model resulted in lower TC. For the combination of nanofiller and microfiller (20%m+2.5%nfs), only the rule of mixtures was possible to use due to the variables in the model and the calculation resulted in a slightly higher value when it is compared to the experimental value.
Conf Presentation - 6.1 5
B.1Using a Simplified Steady State Model of Dispersed Composites
The TC obtained for the nanofilled composite in the steady state model solved with COMSOL shows good agreement with the rule of mixtures, with the Lewis and Nielsen model, and with the measured values.
For the microfilled composite, the computed value with COMSOL shows good agreement with Lewis and Nielsen model but not with the measured value and the rules of mixture model; the measured value was 16% higher than the modelled result. Whereas for the micro-nanofilled composite (20%m+2.5%nfs), it was not possible to model all the nanoparticles in the cubic cell. Therefore, two 3D case studies were simulated, the first one with 1 microsilica particle in the centre of the cube and 8 nanofumed silica particles with a volume equivalent to the 2.5% weight of nanofiller aligned in the direction of each vertex. After that, 3 x 3 x 3 cubic cells were stacked and analyzed as shown in Figure 6.
Fig. 6. Temperature distribution in 3x3x3 cells (one microsilica particle and 8 nanosilica particles in each cell of 9.06 μm side).
In the second case study, axial symmetry in the geometry
was considered, and a cylindrical arc (3.6°) containing one slice of the microsilica particle in the center and 29 nanosilica particles distributed randomly in the arc were included in the simulation as illustrated in Figure 7.
In both case studies, the thermal conductivity obtained was approximately the same with a variation less than 1%. However, the value obtained with COMSOL resulted 25% lower than the measured value.
It is important to remark that in this modelling, the bonding between the matrix and filler could not be incorporated for the steady state model, although it is an important aspect of heat transfer. Without considering bonding, the interface between the filler and the matrix is basically a thin air space, thereby reducing the effective thermal conductivity of the particle [3].
C. Temperature Profile in the Composites Using a Simplified Transient Model
In this model, the heat transfer in a highly conductive layer
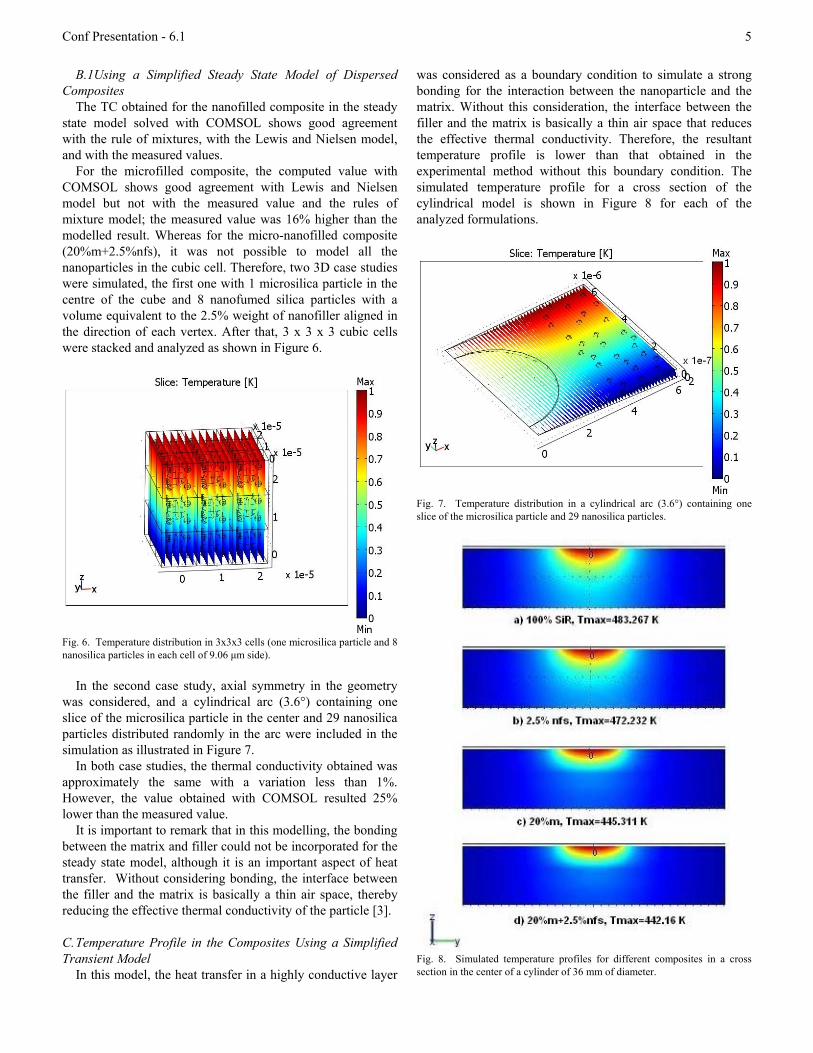
was considered as a boundary condition to simulate a strong bonding for the interaction between the nanoparticle and the matrix. Without this consideration, the interface between the filler and the matrix is basically a thin air space that reduces the effective thermal conductivity. Therefore, the resultant temperature profile is lower than that obtained in the experimental method without this boundary condition. The simulated temperature profile for a cross section of the cylindrical model is shown in Figure 8 for each of the analyzed formulations.
Fig. 7. Temperature distribution in a cylindrical arc (3.6°) containing one slice of the microsilica particle and 29 nanosilica particles.
Fig. 8. Simulated temperature profiles for different composites in a cross section in the center of a cylinder of 36 mm of diameter.

Conf Presentation - 6.1 6
It is evident that the heat penetration into the composite is reduced with the introduction of filler, and the minimum temperature is obtained when the composite has microfiller and nanofiller.
The steepness and decay of the temperature profile was also obtained from the temperature profile simulation as well. Figure 9 shows the heating and cooling profile of the different composites.
Time (s)
0 50 100 150 200 250 300
Tem
pera
ture
(K)
250
300
350
400
450
500
100% SiR 20%m 20%m+2.5%nfs 2.5%nfs
Fig. 9. Simulated temperature profile in the center of the cylindrical model.
From the temperature profile simulation, the temperature
across a line passing through the center of the samples is shown in Figure 10. The maximum developed temperature is obtained in the non-filled sample. The effect of the filler is demonstrated as the temperature is decreased in the filled formulations, as can be seen in Figure 10, and the lower temperature is obtained in the micro-nanofilled composite.
Position
0.012 0.014 0.016 0.018 0.020 0.022 0.024
Tem
pera
ture
(K)
250
300
350
400
450
500
100%SiR 20%m 20%m+2.5%nfs 2.5%nfs
Fig. 10. Simulated maximum temperatures along a line passing through the center of the cylindrical model.
IV. CONCLUSION A thermal model developed in COMSOL and solved using
a finite element method shows a temperature distribution in the modelled nanocomposites which is comparable to the measured temperature distribution by infrared camera under
laser heating. When the composite is subjected to intense heat from dry band arcing as simulated by infrared laser, the impinged region undergoes thermal degradation. The reinforcement of a microcomposite with nanofiller and surfactant resulted in an improved composite with better thermal properties. The improvement was verified from the thermal conductivity measurements and from the thermal simulation profiles of the composites.
ACKNOWLEDGMENT Our appreciation to Dr. Fermín Espino from IPN-México is
acknowledged for his help in the thermal modelling.
REFERENCES [1] I. Ramirez, E. A. Cherney, S. Jayaram, and M. Gauthier, “Nanofilled
silicone dielectrics prepared with surfactant for outdoor insulation applications”, IEEE Transactions on Dielectrics and Electrical Insulation, Vol. 15, pp. 228-235, February 2008.
[2] L. Meyer, S. H. Jayaram, and E. A. Cherney, “Thermal conductivity of filled silicone rubber and its relationship to erosion resistance in the inclined plane test”, IEEE Transactions on Dielectrics and Electrical Insulation, Vol. 11, pp. 620-630, 2004.
[3] E. A Cherney., "Silicone rubber dielectrics modified by inorganic fillers for outdoor high voltage insulation applications," , IEEE Transactions on Dielectrics and Electrical Insulation, vol.12, no.6, pp. 1108-1115, Dec. 2005.
[4] S. Rätzke and J. Kindersberger, “Erosion behaviour of nanofilled silicone elastomers”, XIVth International Symposium on High Voltage Engineering, (ISH), Tsinghua University, Beijing, China, pp C-09 1-6, 2005.
[5] R. C. Progelhof, J. L. Throne and R. R. Ruetsch, “Methods for predicting the thermal conductivity of composite systems: A review”, Polymer Engineering and Science, Vol. 16, pp. 615-625, 1976.
[6] Standard test method for thermal transmission properties of thermally conductive electrical insulation materials, ASTM Standard D5470, 2006.
[7] P. Karayacoubian, M. M. Yovanovich, J. R. Culham, "Thermal resistance-based bounds for the effective conductivity of composite thermal interface materials," IEEE Twenty-Second Annual Semiconductor Thermal Measurement and Management Symposium, 2006, pp. 28-36, March 14-16, 2006.
[8] N. Araki, D. W. Tang, A. Makino, M. Hashimoto, T. Sano, “Transient characteristics of thermal conduction in dispersed composites”, International Journal of Thermophysics, Volume 19, Number 4, pp. 1239-1251, July 1998.
[9] User’s Guide of the heat transfer module, COMSOL Multiphysics, Version 3.4, October 2007.
[10] L. S. Mayboudi, A. M. Birk, G. Zak, and P. J. Bates, “Laser transmission welding of a lap-joint: Thermal imaging observations and three–dimensional finite element modeling”, Journal of Heat Transfer, Vol. 129, pp. 1177-1186, September 2007.
Isaias Ramirez-Vazquez (S’05) received the B.S. degree from the Facultad de Ingeniería Mecánica Eléctrica y Electrónica (FIMEE), Salamanca, Gto, México, in 1990 and the M.S. degree from FIMEE in 1999. He is currently working toward the Ph.D. degree at the University of Waterloo, Ontario, Canada. He is a researcher in the Instituto de Investigaciones Eléctricas en Cuernavaca, Morelos, México. His current research interests include outdoor insulation, insulation
coordination, and electromagnetic transients in power systems.

Conf Presentation - 6.1 7
Shesha Jayaram (M’87-SM’97,F’08) received the B.A.Sc. degree in electrical engineering from the Bangalore University, M.A.Sc. in high voltage engineering from the Indian Institute of Science, Bangalore, India, and the Ph.D. degree in electrical engineering from the University of Waterloo, in 1980, 1983, and 1990, respectively. She is a Professor in the Electrical and Computer Engineering Dept, University of Waterloo, Waterloo, and an Adjunct Professor at the University of Western Ontario, London. Prof. Jayaram’s
research interests are developing diagnostics to analyze insulating materials, industrial applications of high voltage engineering, and applied electrostatics. Prof. Jayaram has been an active member of the IEEE Dielectrics and Electrical Insulation Society and the Electrostatic Processes Committee (EPC) of the IEEE Industry Applications Society. In both, she has contributed as a board member, chair of EPC during 1998-99, session organizer/chair and as a member of the paper review process committee. She is a registered professional engineer in the province of Ontario, Canada, and a Fellow of the IEEE.
Edward A. Cherney (M’73-SM’83-LF’09) received the B.Sc. degree in physics and chemistry from the University of Waterloo, the M.Sc. degree in physics from McMaster University, Hamilton, and the Ph.D. degree in electrical engineering from the University of Waterloo in 1967, 1969 and 1974, respectively. In 1968 he joined the Research Division of Ontario Hydro and in 1988 he went into the insulator industry, first with a manufacturer of insulators and then later with a manufacturer of silicone materials. Since 1998 he has
been an international consultant in the outdoor insulation field and an adjunct professor at the University of Waterloo. He has published extensively on outdoor insulation, holds several patents, co-authored one book on outdoor insulators, involved in several IEEE working groups on insulators and a registered engineer in the province of Ontario.