thermal management of concentrated multi-...
TRANSCRIPT

Appl. Sci. 2017, 7, x; doi: FOR PEER REVIEW www.mdpi.com/journal/applsci
Article
Thermal Management of Concentrated Multi-Junction Solar Cells with Graphene-Enhanced Thermal Interface Materials
Mohammed Saadah 1,2, Edward Hernandez 2,3 and Alexander A. Balandin 1,2,3,*
1 Nano-Device Laboratory (NDL), Department of Electrical and Computer Engineering, University of
California, Riverside, CA 92521, USA; [email protected] 2 Phonon Optimized Engineered Materials (POEM) Center, Bourns College of Engineering, University of
California, Riverside, CA 92521, USA; [email protected] 3 Materials Science and Engineering Program, University of California, Riverside, CA 92521, USA
* Correspondence: [email protected]; Tel.: +1-951-827-2351
Academic Editor: Philippe Lambin
Received: 20 May 2017; Accepted: 3 June 2017; Published: 7 June 2017
Abstract: We report results of experimental investigation of temperature rise in concentrated multi-
junction photovoltaic solar cells with graphene-enhanced thermal interface materials. Graphene and
few-layer graphene fillers, produced by a scalable environmentally-friendly liquid-phase
exfoliation technique, were incorporated into conventional thermal interface materials. Graphene-
enhanced thermal interface materials have been applied between a solar cell and heat sink to
improve heat dissipation. The performance of the multi-junction solar cells has been tested using an
industry-standard solar simulator under a light concentration of up to 2000 suns. It was found that
the application of graphene-enhanced thermal interface materials allows one to reduce the solar cell
temperature and increase the open-circuit voltage. We demonstrated that the use of graphene helps
in recovering a significant amount of the power loss due to solar cell overheating. The obtained
results are important for the development of new technologies for thermal management of
concentrated photovoltaic solar cells.
Keywords: graphene; thermal interface materials; solar cells; thermal management
1. Introduction
The interest to photovoltaic (PV) solar cells as a source of energy for a variety of applications has
been rapidly increasing in recent years [1–10]. Improving solar cell performance is an important issue,
and the efforts have been mostly aimed at increasing power conversion efficiency and reducing
manufacturing costs. Crystalline silicon (Si) is the most commonly used material in manufacturing
solar cells, occupying more than 90% of the market [10,11]. Conventional solar cells, manufactured
using two-decades-old technology, are capable of converting about 20% of absorbed light energy into
electricity [11,12]. Solar cell panels that employ optical concentrators can convert more than ~30% of
absorbed light into electricity [13]. Most of the remaining 70% of absorbed energy is turned into heat
inside the solar cell [14]. While Si PV cells remain the most common and affordable for commercial
use for power generation, there is a strong motivation for development of higher efficiency multi-
junction PV cells with concentrators. The concentrator multi-junction solar cells can find applications
in aerospace and other technologies where efficiency and smaller size are more important
considerations than cost [15].
One of the problems in developing the concentrator multi-junction PV technology is thermal
management of the solar cells. Concentration of solar light into a small area, increase in the energy
absorption, and layered structure of the multi-junction cells result in significant temperature increase

Appl. Sci. 2017, 7, x FOR PEER REVIEW 2 of 13
during the cell’s operation [16]. The increase in the PV cell temperature negatively affects its power
conversion efficiency, and it can damage the solar cell over time [17]. Therefore, it is important to
control solar cell temperature by effectively removing the unwanted heat. Temperature effects on
performance of conventional solar cells have been the subject of many reported studies [18–27]. One
can distinguish two main methods of thermal management of solar cells: active cooling and passive
cooling. The active cooling involves a cooling medium, e.g., air or water, and uses fans or water
pumps to push the medium through the heated surfaces. Passive cooling uses a heat sink that
dissipates heat without pushing a cooling medium through it. Most solar cells utilize passive cooling
technologies [28,29]. A basic heat sink can reduce the temperature of a standard Si solar cell, under
one sun illumination, by about 15 °C, which increases the output power by 6% [30]. When a heat sink
is attached to a solar cell, a thermal resistance between the two interfaces can limit the amount of heat
transferred between the solar cell and the heat sink [31]. This resistance is a result of small air gaps
between the two joined surfaces, which are caused by the surfaces microscopic imperfections [32].
Since air is a poor thermal conductor, it must be replaced by a material that has better thermal
conductivity (see Figure 1). The thickness of this material, referred to as bond line thickness (BLT),
should be kept small to minimize the overall thermal resistance of the connected surfaces. One should
note that, even if the joined surfaces are polished to perfection, the thermal boundary resistance (TBR)
will still exist at the interface of two materials owing to the mismatch in their acoustic phonon
properties. Thermal interface materials (TIMs) or thermal phase change materials (PCMs) perform
the task of reducing thermal resistance between two surfaces and facilitating heat transfer between
the heat generating device and a heat sink [33–40].
Figure 1. Illustration of the function of the thermal interface materials for heat removal from the solar
cell under concentrated light.
In this paper, we demonstrate that the thermal management of concentrator multi-junction solar
cells can be substantially improved by enhancing properties of TIMs via incorporation of graphene
[41]. Conventional TIMs are typically made of polymeric or grease base material loaded with
conductive materials such as silver or ceramic particles [42]. The amount of various fillers in the
commercial TIMs can be high, reaching the loading volume fractions f ~ 70% [43]. The approach of
increasing the filler loading fraction f for higher thermal conductivity of the resulting composite has
limitations. Higher loadings may result in the uneven dispersion of the fillers, their agglomeration,
air gaps, and increases in the TIM cost [44,45]. Our results indicate that the use of low loading
fractions of graphene as an additional filler to commercial TIMs can be an effective strategy for
decreasing the operation temperature of multi-junction PV cells under high concentrations of solar
energy.
Graphene is a single layer of carbon atoms that are strongly bonded in a hexagonal honeycomb
lattice. This material has proven to have an unusually high thermal conductivity with intrinsic values
Appl. Sci. 2017, 7, x FOR PEER REVIEW 3 of 13
in the range of 2000 to 5000 W/mK near room temperature [46]. This is an order of magnitude larger
than pure silver [33–35]. The thermal conductivity of graphene flakes reduces with decreasing lateral
dimensions of the flakes and upon contact with the base or matrix material. However, it still remains
high compared to many other filler materials used previously. It has been found that there is an
optimum distribution of graphene fillers in terms of their size and thickness [45]. Few-layer graphene
(FLG) flakes can be more efficient as fillers because their thermal conductivity is less subject to
degradation upon surface exposure to the base material of the composite [43,45]. However, when
FLG thickness becomes too large, the thermal coupling of the fillers to the base material may suffer.
From these considerations, one should determine the optimum FLG characteristics for a given base
material, range of the loading, and applications. Given a strong current interest to the concentrator
solar cells [47–55] and the problems with their thermal management, in this work we examine a
feasibility of using graphene and FLG fillers for heat removal from advanced photovoltaic solar cells.
2. Material Preparation and Characterization
The thermal composites tested in this research were prepared from several common commercial
TIMs (e.g., “Ice Fusion” and “Arctic Alumina”). These composite materials use silver, aluminum
oxide, and aluminum nitrite particles—or combinations of thereof—as fillers to enhance the thermal
conductivity of TIM. As an additional filler, we have utilized commercial liquid phase exfoliated
(LPE) graphene and FLG mixture (Graphene Supermarket, Graphene Laboratories Inc., Calverton,
NY, USA). The mixture had a large concentration of FGL flakes with the thickness between three and
eight monolayers (total thickness below 3 nm) and lateral dimension in the range of 2–8 μm. The
quality of material has been verified with Raman spectroscopy, optical and scanning electron
microscopy (SEM) following the procedures reported by some of us earlier [41,43,45]. One should
note that LPE is a scalable method for producing inexpensive graphene—FLG solution with the
quality sufficient for thermal applications. We used a microscale to weigh the TIM and LPE graphene
with ±0.01% accuracy. The mixture of commercial TIMs with added graphene fillers was placed in a
vial to the two-axis rotating mixer. The composite was mixed at 2500 rpm for three minutes. A
vacuum pump was used to eliminate the bubbles in the composite for two minutes. This mixing and
vacuuming process was repeated three to four times to ensure uniform filler dispersion with
minimum concentration and size of air pockets. The percentage of additional graphene fillers in TIMs
is calculated as 𝑤𝑡 % = 𝑊𝑔/(𝑊𝐵 + 𝑊𝑔) , where Wg and WB are the weights of graphene—FLG fillers
and base material, respectively. In this case, the base material is the initial commercial TIM. The
volume loading fraction of graphene fillers was determined from the equation: 𝑣𝑜𝑙 % =
(𝑊𝑔/𝜌𝑔)/((𝑊𝑔/𝜌𝑔) + (𝑊𝐵/𝜌𝐵)), where ρg and ρB are the mass density of graphene and base material,
respectively.
In order to make sure that addition of graphene—FLG fillers was done successfully and the
thermal conductivity of TIMs increased, we conducted measurements of the apparent thermal
conductivity of the resulting composite between two metal plates. The measurements were
conducted using the industry standard TIM tester method (Analysis Tech TIM Tester, Boston, MA,
USA) with the software-controlled contact pressure and temperature. The electronic ‘in situ thickness
measurement’ function provided accurate values of the thickness of the composite layer for further
analysis. It is important to note here that the TIM tester values of the apparent thermal conductivity
are lower than the bulk values owing to the effect of the thermal resistance with the contacting
surfaces. However, the TIM tester thermal conductivity is more relevant for practical applications of
TIMs. Figure 2 shows representative results of the thermal measurements for two commercial TIMs
with added graphene fillers. The thermal conductivity data are presented for graphene filler loading
of up to 6 wt %. The sample temperature was fixed at 50 °C while the pressure maintained at 100 kPa.
One can see that, in one composite, the thermal conductivity increases by 130% as compared to
commercial TIM without extra graphene fillers. In another composite, the thermal conductivity
increases by 77% and starts to saturate gradually for the loading fractions above 4 wt %. It is
interesting to note that a stronger enhancement due to graphene was observed in the least expensive
commercial TIM. The fact that higher loading fraction of additional graphene fillers does not improve

Appl. Sci. 2017, 7, x FOR PEER REVIEW 4 of 13
thermal conductivity of some TIMs is not surprising. Commercial TIMs already have high loading of
other fillers and the addition of graphene fillers above certain fraction (~4 wt % in this case) can
degrade viscosity and other parameters. For these reasons, in our solar cell testing, we used
commercial TIMs enhanced with graphene fillers of the loading fraction of up to 4 wt %. The low
loading of graphene is also beneficial from the practical material cost considerations.
Figure 2. Measured apparent thermal conductivity of two representative commercial thermal
interface materials, denoted as “sample A” and “sample B”, with added graphene fillers. The data are
presented as a function of the graphene loading weight fraction. The measurements were conducted
at T = 50 °C and pressure of 100 kPa. Note that the apparent thermal conductivity values include the
effects of the thermal contact resistance.
In the present and previous studies of graphene-enhanced TIMs, we verified that mixing and
vacuuming of commercial TIMs without addition of graphene have not improved their thermal
conductivity [34,37,41,43]. These tests have been performed to establish that graphene fillers are
responsible for the improved apparent thermal conductivity rather than additional mixing and
vacuuming processing steps by themselves. At the small loading fractions used, graphene fillers are
not forming the percolation network as confirmed by the microscopy and electrical resistivity
measurements [41,43,45]. The increase in the thermal conductivity of the resulting composite can
come owing to two possible mechanisms. The first one is related to very high intrinsic thermal
conductivity of graphene [46] and its good coupling to the matrix materials [41,43,45]. The heat
propagates partially via graphene fillers and partially via the matrix material. Even if the thermal
conductivity of graphene–FLG fillers is reduced due to the exposure to the matrix, the effective
medium approximation (EMA) predicts a large increase in the thermal conductivity of the composite
(larger than the measured one) [45]. The second possible mechanism of enhancement is the action of
graphene fillers as connecting thermal links among existing larger scale fillers in the commercial
TIMs. Such a mechanism has been known and studied for other fillers with different aspect ratios,
e.g., spherical metal particles and carbon nanotubes [56,57].
3. Testing of the Photovoltaic Solar Cells
To investigate the effects of graphene fillers on the performance of TIMs with the concentrated
photovoltaic solar cells, we applied graphene-enhanced TIMs between the solar cell (acting as a heat
source) and an aluminum heat sink (see Figure 1). The TIM layer enhances the thermal contact
between the two surfaces by replacing the air gaps with thermally conductive paste. The pressure
between the two surfaces was fixed at 100 kPa in all measurements. The TIM function is reducing the

Appl. Sci. 2017, 7, x FOR PEER REVIEW 5 of 13
thermal resistance, RTIM, between two adjoining surfaces. This resistance is affected by several factors,
including TIM thermal conductivity, KTIM, thermal contact resistances, RC, between the TIM layer and
the two surfaces, and the distance between the two surfaces or BLT. These factors are related to RTIM
by the equation
𝑅TIM =𝐵𝐿𝑇
𝐾TIM+ 𝑅𝐶1 + 𝑅𝐶2 (1)
The graphene enhanced TIMs and reference TIMs without graphene were carefully spread on
the back surface of the solar cell panels to ensure uniform and complete coverage, and to avoid
excessive amount of material, which would negatively affect RTIM via large BLT (see Equation (1)).
Figure 3 shows the back side of the solar cell with TIM before and after the attachment of two surfaces.
Figure 3. Image of the actual photovoltaic cells with the dispersed thermal interface material.
The photovoltaic solar cell with different TIMs has been tested by placing it under a solar
simulator (Sol1A Class, Newport Corporation, in Irvine, CA, USA) as shown in Figure 4. The solar
simulator uses a xenon lamp that produces a 6 × 6″ size beam that emits the 5800 K blackbody-like
spectrum. The simulator uses a special power supply to maintain a strictly constant level of
illumination. The light produced by the xenon lamp is reflected by a mirror to pass through a spectral
correction filter that simulate the AM1.5 G solar spectra. The light beam then passes through a
collimating lens that emulate the 0.5° angle that the sun light has when it reaches the earth. The open
circuit voltage is recorded every second using a voltage logger and the temperature of the solar cell
is measured using a multi-channel temperature logger. A large convex lens is placed between the
solar simulator and solar cell. By varying the distance between the lens and the solar cell, one
increases or decreases the light concentration on the solar cell (simulating 500–2000 suns). In high
concentration experiments we employed two lenses: a large convex lens and a small lens placed on
the solar cell. All experiments were taken at a room temperature of 25 °C (± 2 °C).

Appl. Sci. 2017, 7, x FOR PEER REVIEW 6 of 13
Figure 4. Schematic of the testing procedures for solar cells attached to the heat sink. The lenses
allowed to test the performance under concentrated light conditions corresponding to up to 2000 suns.
4. Results and Discussion
Before presenting the results of the tests, we briefly outline the expected effects of temperature
on the PV cell performance from the theoretical point of view. The increase in temperature leads to a
decrease in the band gap energy, Eg, of a semiconductor [3]
𝐸g(𝑇) = 𝐸g(0) −𝛼𝑇2
𝑇 + β (2)
Here Eg(T) is the band gap of a semiconductor at temperature T, α and β are material constants,
and Eg(0) is the band gap value at zero Kelvin. The decrease in the band gap leads to a slight increase
in the short-circuit current, ISC, owing to the enhanced absorption and photocurrent. However, the
heating results in a more pronounced detrimental effect on the open-circuit voltage, VOC, defined as
the maximum voltage when the PV cell is open and zero current is flowing. The open-circuit voltage
is given as [3]
𝑉OC =𝑘𝑇
𝑞ln(
𝐼𝑆𝐶
𝐼0+ 1) (3)
where I0 is the reverse saturation current, q is electron charge, and k is the Boltzmann constant.
Many parameters in equations governing PV cell performance depend on temperature,
including band gap, diffusion coefficients, built-in voltage, intrinsic carrier concentration, and
depletion region width. It is challenging to disentangle the effect of temperature on each of them term
by term. However, computational studies for different material systems predict a linear decrease in
the open-circuit voltage and the fill factor (FF), slightly offset by the linear increase in the short-circuit
current. The result of these trends is a linear decrease in the power conversion efficiency, η, which
determines how much of the input solar energy is converted into electricity
𝜂 =𝑃𝑚𝑝
𝑃𝑖𝑛=
𝐹𝐹 · 𝐼𝑆𝐶𝑉𝑂𝐶
𝑃𝑖𝑛 (4)
Here, the maximum power output, Pmp, corresponds to the point in the current-voltage characteristic
where the current is at maximum, Imp, and voltage, Vmp, is maximum. These parameters define the fill
factor: 𝐹𝐹 = 𝐼mp𝑉mp/(𝐼SC𝑉OC) = 𝑃mp/(𝐼SC𝑉OC). For crystalline Si, FF is in the range of 0.7 to 0.85, and
the efficiency ranges from 13% to 16%. According to the theory, the maximum power output for
crystalline solar cell decreases by 0.4%–0.5% per every 1 °C increase in the cell temperature [58–61].
Appl. Sci. 2017, 7, x FOR PEER REVIEW 7 of 13
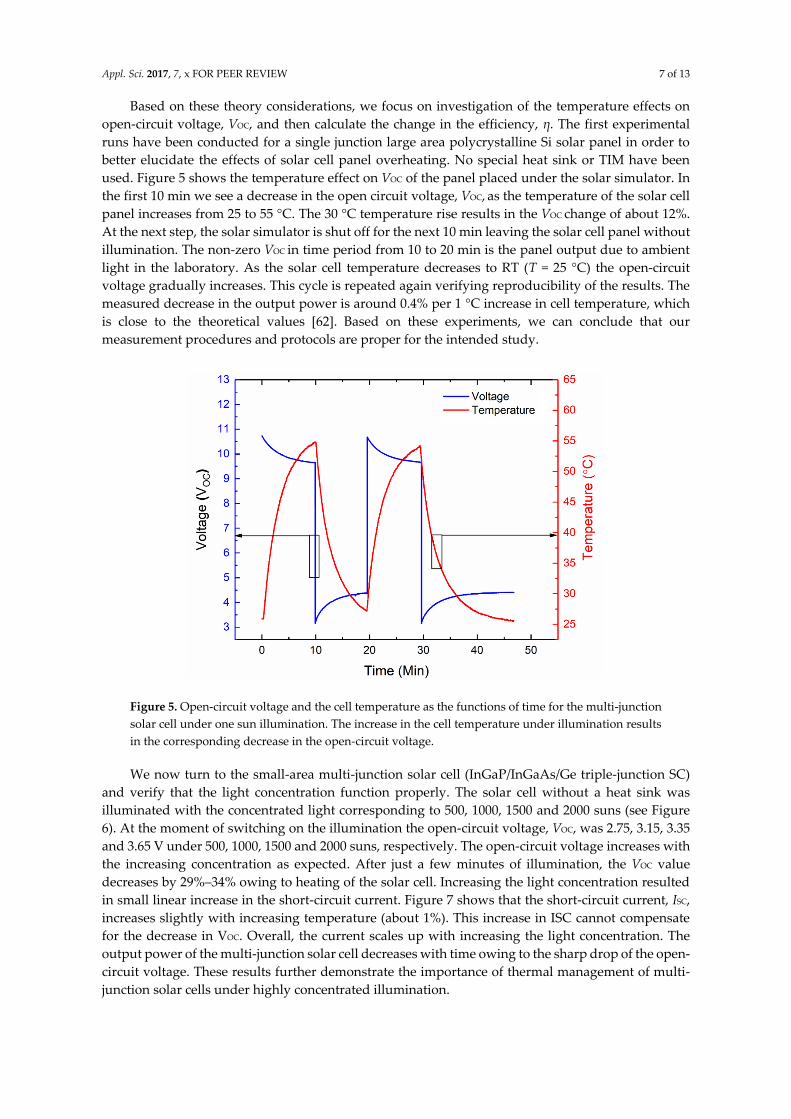
Based on these theory considerations, we focus on investigation of the temperature effects on
open-circuit voltage, VOC, and then calculate the change in the efficiency, η. The first experimental
runs have been conducted for a single junction large area polycrystalline Si solar panel in order to
better elucidate the effects of solar cell panel overheating. No special heat sink or TIM have been
used. Figure 5 shows the temperature effect on VOC of the panel placed under the solar simulator. In
the first 10 min we see a decrease in the open circuit voltage, VOC, as the temperature of the solar cell
panel increases from 25 to 55 °C. The 30 °C temperature rise results in the VOC change of about 12%.
At the next step, the solar simulator is shut off for the next 10 min leaving the solar cell panel without
illumination. The non-zero VOC in time period from 10 to 20 min is the panel output due to ambient
light in the laboratory. As the solar cell temperature decreases to RT (T = 25 °C) the open-circuit
voltage gradually increases. This cycle is repeated again verifying reproducibility of the results. The
measured decrease in the output power is around 0.4% per 1 °C increase in cell temperature, which
is close to the theoretical values [62]. Based on these experiments, we can conclude that our
measurement procedures and protocols are proper for the intended study.
Figure 5. Open-circuit voltage and the cell temperature as the functions of time for the multi-junction
solar cell under one sun illumination. The increase in the cell temperature under illumination results
in the corresponding decrease in the open-circuit voltage.
We now turn to the small-area multi-junction solar cell (InGaP/InGaAs/Ge triple-junction SC)
and verify that the light concentration function properly. The solar cell without a heat sink was
illuminated with the concentrated light corresponding to 500, 1000, 1500 and 2000 suns (see Figure
6). At the moment of switching on the illumination the open-circuit voltage, VOC, was 2.75, 3.15, 3.35
and 3.65 V under 500, 1000, 1500 and 2000 suns, respectively. The open-circuit voltage increases with
the increasing concentration as expected. After just a few minutes of illumination, the VOC value
decreases by 29%–34% owing to heating of the solar cell. Increasing the light concentration resulted
in small linear increase in the short-circuit current. Figure 7 shows that the short-circuit current, ISC,
increases slightly with increasing temperature (about 1%). This increase in ISC cannot compensate
for the decrease in VOC. Overall, the current scales up with increasing the light concentration. The
output power of the multi-junction solar cell decreases with time owing to the sharp drop of the open-
circuit voltage. These results further demonstrate the importance of thermal management of multi-
junction solar cells under highly concentrated illumination.

Appl. Sci. 2017, 7, x FOR PEER REVIEW 8 of 13
Figure 6. Open-circuit voltage as the function of time for the multi-junction solar cell under
concentrated illumination corresponding to 500, 1000, 1500, and 2000 suns.
Figure 7. Short-circuit current as the function of time for the multi-junction solar cell under
concentrated illumination corresponding to 500, 1000, 1500 and 2000 suns.
To prevent or reduce the power loss, we attached the multi-junction solar cell to an aluminum
heat sink with the graphene-enhanced TIMs. For comparison, we also run experiments for the solar
cell on a heat sink without TIM and on a heat sink with commercial TIM. Figure 8 shows VOC of the
multi-junction solar cell under 1000 sun concentrated light. One can see a significant positive effect
of additional graphene fillers for heat removal from the cell. The decrease in voltage becomes less
than 12% when TIM with 4 wt % of graphene is used as compared to 29% decrease in the cell
operating without TIM. This translates to recovery of about 60% of the power loss. Figure 9 presents
results for the same type of testing but with the 2000 sun light concentration. One can see that the
open-circuit voltage drop went from 0.9 V in case of 1000 suns to 1.2 V for 2000 sun concentration
due to overheating. The use of the graphene enhanced TIMs allows one to decrease the VOC
degradation from 34% to about 12% of the initial value. This constitutes a recovery of about 65% of
the energy lost due to overheating. In both cases, TIMs with graphene perform substantially better
than conventional commercial TIMs. It is also important to note that improvement in TIMs
performance comes at a very low loading fraction of graphene.

Appl. Sci. 2017, 7, x FOR PEER REVIEW 9 of 13
Figure 8. Open-circuit voltage of the solar cell under concentrated illumination corresponding to 1000
suns. The results are shown for the cell without thermal interface material, for the same cell with
commercial thermal interface materials, and for the same cell with graphene-enhanced thermal
interface materials. Note that the use of 4% graphene fillers added to commercial thermal paste allows
for substantial increase in the open-circuit voltage.
Figure 9. Open-circuit voltage of the solar cell under concentrated illumination corresponding to 2000
suns. The results are shown for the cell without thermal interface material, for the same cell with
commercial thermal interface materials, and for the same cell with graphene-enhanced thermal
interface materials. Note that the use of 4% graphene fillers added to commercial thermal paste allows
for substantial increase in the open-circuit voltage.
The obtained values for reduction in the temperature of the cell and saved output power are
specific for the tested multi-junction cell and depend on many parameters, e.g., the heat sink used,
ambient temperature cell design, and others. The performance of graphene-enhanced TIMs with
other PV cells may vary. The present research succeeded in demonstration of a principal possibility
of decreasing the PV cell temperature with commercial TIMs enhanced with a small loading fraction
of LPE graphene. Our proposed method can complement the existing technologies for passive
thermal management of solar cells [63,64], particularly for the countries with a high average
temperature, and contribute to the development of more sustainable approaches of energy supply
[65].
Appl. Sci. 2017, 7, x FOR PEER REVIEW 10 of 13
5. Conclusions
We reported results of an investigation of temperature increase in concentrated multi-junction
solar cells with thermal interface materials enhanced by addition of a small loading fraction (below 4
wt %) of graphene. Graphene and few-layer graphene fillers, produced by a scalable liquid-phase
exfoliation technique, were incorporated into commercial thermal interface materials. Graphene-
enhanced thermal interface materials have been applied between a solar cell and heat sink to improve
heat dissipation. It was found that the application of graphene-enhanced thermal interface materials
allows one to reduce the solar cell temperature and increase the open-circuit voltage. Graphene fillers
help in recovering a significant amount of power loss due to overheating. The obtained results can
lead to the development of new technologies for thermal management of concentrated photovoltaic
solar cells.
Acknowledgments: Mohammed Saadah acknowledges financial support for his dissertation research at UC
Riverside from The King Abdullah Scholarship Program (KASP) and the Saudi Arabian Cultural Mission, Los
Angeles, CA, USA. Alexander A. Balandin acknowledges partial support from the National Science Foundation
(NSF) awards 1404967 and 1549942.
Author Contributions: Mohammed Saadah prepared the composites, conducted photovoltaic solar cell testing
and processed the experimental data; Edward Hernandez assisted with thermal measurements and solar cell
testing. Alexander A. Balandin coordinated the project, contributed to data analysis. Mohammed Saadah and
Alexander A. Balandin wrote the manuscript. Edward Hernandez created original art figures 1 and 4.
Conflicts of Interest: The authors declare no conflict of interest.
References
1. Sohrabi, F.; Nikniazi, A.; Movla, H. Optimization of Third Generation Nanostructured Silicon-Based Solar Cells.
In Solar Cells—Research and Application Perspectives; Morales-Acevedo, A., Ed.; In Tech: Rijeka, Croatia, 2013;
pp. 1–26.
2. Nalwa, H.S. Encyclopedia of Nanoscience and Nanotechnology; American Scientific Publishers: California, CA,
USA, 2004; pp. 727.
3. Masuko, K.; Shigematsu, M.; Hashiguchi, T.; Fujishima, D.; Kai, M.; Yoshimura, N.; Yamaguchi, T.;
Ichihashi, Y.; Mishima, T.; Matsubara, N.; et al. Achievement of More Than 25% Conversion Efficiency With
Crystalline Silicon Heterojunction Solar Cell. Photovoltaics, IEEE J. 2014, 4, 1433–1435.
doi:10.1109/JPHOTOV.2014.2352151.
4. Van Sark, W.; Korte, L.; Roca, F. Introduction—Physics and Technology of Amorphous-Crystalline
Heterostructure Silicon. In Physics and Technology Amorphous-Crystalline Heterostructure Silicon Solar Cells;
Springer-Verlag: Berlin/Heidelberg, Germany, 2012; pp. 1–12. doi:10.1007/978-3-642-22275-7.
5. Glunz, S.W. High-efficiency crystalline silicon solar cells. Adv. Optoelectron. 2007. doi:10.1155/2007/97370.
6. Snaith, H.J. Perovskites: The Emergence of a New Era for Low-Cost, High-Efficiency Solar Cells. J. Phys.
Chem. Lett. 2013, 4, 3623–3630. doi:10.1021/jz4020162.
7. Becker, C.; Amkreutz, D.; Sontheimer, T.; Preidel, V.; Lockau, D.; Haschke, J.; Jogschies, L.; Klimm, C.;
Merkel, J.J.; Plocica, P.; et al. Polycrystalline silicon thin-film solar cells: Status and perspectives. Sol. Energy
Mater. Sol. Cells. 2013, 119, 112–123. doi:10.1016/j.solmat.2013.05.043.
8. Konagai, M. Present status and future prospects of silicon thin-film solar cells. Jpn. J. Appl. Phys. 2011, 50.
doi:10.1143/JJAP.50.030001.
9. Avrutin, V.; Izyumskaya, N.; Morko, H. Semiconductor solar cells: Recent progress in terrestrial
applications. Superlattices Microstruct. 2011, 49, 337–364. doi:10.1016/j.spmi.2010.12.011.
10. Tyagi, V.V.; Rahim, N.A.A.; Rahim, N.A.; Selvaraj, J.A.L. Progress in solar PV technology: Research and
achievement. Renew. Sustain. Energy Rev. 2013, 20, 443–461. doi:10.1016/j.rser.2012.09.028.
11. Lee, H.S. Thermal Design: Heat Sinks, Thermoelectrics, Heat Pipes, Compact Heat Exchangers, and Solar Cells;
John Wiley & Sons: New York, NY, USA. 2010; pp. 482. doi:10.1002/9780470949979.
12. Green, M.A.; Emery, Y.; Hishikawa, W.; Warta, E.D. Dunlop, Solar cell efficiency tables (version 47). Prog.
Photovolt. Res. Appl. 2016, 24, 3–11. doi:10.1002/pip.2728.
13. Xie, W.T.; Dai, Y.J.; Wang, R.Z.; Sumathy, K. Concentrated solar energy applications using Fresnel lenses:
A review. Renew. Sustain. Energy Rev. 2011, 15, 2588–2606. doi:10.1016/j.rser.2011.03.031.
Appl. Sci. 2017, 7, x FOR PEER REVIEW 11 of 13
14. Huang, B.J.; Yang, P.E.; Lin, Y.P.; Lin, B.Y.; Chen, H.J.; Lai, R.C.; Cheng, J.S. Solar cell junction temperature
measurement of PV module. Sol. Energy. 2011, 85. doi:10.1016/j.solener.2010.11.006.
15. McConnell, R.; Symko-Davies, M. Multijunction photovoltaic technologies for high-performance
concentrators. In Proceedings of the Conference Record of the 2006 IEEE 4th World Conference on
Photovoltaic Energy Conversion (WCPEC-4), Waikoloa, HI, USA, 7–12 May 2006; pp. 733–736.
doi:10.1109/WCPEC.2006.279560.
16. Baig, H.; Heasman, K.C.; Mallick, T.K. Non-uniform illumination in concentrating solar cells. Renew.
Sustain. Energy Rev. 2012, 16, 5890–5909. doi:10.1016/j.rser.2012.06.020.
17. Saga, T. Advances in crystalline silicon solar cell technology for industrial mass production. NPG Asia
Mater. 2010, 2, 96–102. doi:10.1038/asiamat.2010.82.
18. Chander, S.; Purohit, A.; Sharma, A.; Arvind; Nehra, S.P.; Dhaka, M.S. A study on photovoltaic parameters
of mono-crystalline silicon solar cell with cell temperature. Energy Rep. 2015, 1, 104–109.
doi:10.1016/j.egyr.2015.03.004.
19. Rahman, M.M.; Hasanuzzaman, M.; Rahim, N.A. Effects of various parameters on PV-module power and
efficiency. Energy Convers. Manag. 2015, 103, 348–358. doi:10.1016/j.enconman.2015.06.067.
20. Meneses-Rodríguez, D.; Horley, P.P.; González-Hernández, J.; Vorobiev, Y.V.; Gorley, P.N. Photovoltaic
solar cells performance at elevated temperatures. Sol. Energy 2005, 78, 243–250.
doi:10.1016/j.solener.2004.05.016.
21. Radziemska, E. Thermal performance of Si and GaAs based solar cells and modules: A review. Prog. Energy
Combust. Sci. 2003, 29, 407–424. doi:10.1016/S0360-1285(03)00032-7.
22. Skoplaki, E.; Palyvos, J.A. On the temperature dependence of photovoltaic module electrical performance:
A review of efficiency/power correlations. Sol. Energy 2009, 83, 614–624. doi:10.1016/j.solener.2008.10.008.
23. El-Adawi, M.K.; Al-Nuaim, I.A. The temperature functional dependence of VOC for a solar cell in relation
to its efficiency new approach. Desalination 2007, 209, 91–96. doi:10.1016/j.desal.2007.04.014.
24. Radziemska, E.; Klugmann, E. Thermally affected parameters of the current-voltage characteristics of
silicon photocell. Energy Convers. Manag. 2002, 43, 1889–1900. doi:10.1016/S0196-8904(01)00132-7.
25. Cuce, E.; Bali, T. Variation of cell parameters of a p-Si PV cell with different solar irradiances and cell
temperatures in humid climates. In Proceedings of the 4th International Energy, Exergy and Environment
Symposium, Sharjah, UAE, 19–23 April 2009.
26. Cuce, E.; Bal, T. A Comparison of Energy and Power Conversion Efficiencies of m-Si and p-Si PV Cells in
Trabzon. In Proceedings of the 5th International Advanced Technologies Symposium, Karabuk, Turkey,
15–19 May 2009.
27. Natarajan, S.K.; Mallick, T.K.; Katz, M.; Weingaertner, S. Numerical investigations of solar cell temperature
for photovoltaic concentrator system with and without passive cooling arrangements. Int. J. Therm. Sci.
2011, 50, 2514–2521. doi:10.1016/j.ijthermalsci.2011.06.014.
28. Ye, Z.; Li, Q.; Zhu, Q.; Pan, W. The cooling technology of solar cells under concentrated system. In
Proceedings of the 2009 IEEE 6th International Power Electronics and Motion Control Conference
(IPEMC’09), Wuhan, China, 17–20 May 2009; pp. 2193–2197. doi:10.1109/IPEMC.2009.5157766.
29. Bojanampati, S.; Rodgers, P. Experimental assessment of flat-type photovoltaic module thermal behavior.
In Proceedings of the 13th International Conference on Thermal, Mechanical and Multi-Physics Simulation
and Experiments in Microelectronics and Microsystems (EuroSimE), Cascais, Portugal, 16–18 April 2012.
doi:10.1109/ESimE.2012.6191695.
30. Tong, X.C. Advanced Materials for Thermal Management of Electronic Packaging. Adv. Mater. 2011, 30,
201–232. doi:10.1007/978-1-4419-7759-5.
31. Gwinn, J.P.; Webb, R.L. Performance and testing of thermal interface materials. Microelectron. J. 2003, 34,
215–222. doi:10.1016/S0026-2692(02)00191-X.
32. Prasher, R. Thermal Interface Materials: Historical Perspective, Status, and Future Directions. Proc. IEEE
2006, 94, 1571–1586. doi:10.1109/JPROC.2006.879796.
33. Renteria, J.D.; Nika, D.L.; Balandin, A.A. Graphene Thermal Properties: Applications in Thermal
Management and Energy Storage. Appl. Sci. 2014, 4, 525–547. doi:10.3390/app4040525.
34. Goli, P.; Legedza, S.; Dhar, A.; Salgado, R.; Renteria, J.; Balandin, A.A. Graphene-enhanced hybrid phase
change materials for thermal management of Li-ion batteries. J. Power Sources 2014, 248, 37–43.
doi:10.1016/j.jpowsour.2013.08.135.
Appl. Sci. 2017, 7, x FOR PEER REVIEW 12 of 13
35. Yan, Z.; Nika, D.L.; Balandin, A.A. Special Issue on Graphene Electronics Thermal properties of graphene
and few-layer graphene: Applications in electronics. IET Circuits Devices Syst. 2014, 9, 4–12. doi:10.1049/iet-
cds.2014.0093.
36. Malekpour, H.; Chang, K.H.; Chen, J.C.; Lu, C.Y.; Nika, D.L.; Novoselov, K.S.; Balandin, A.A. Thermal
conductivity of graphene laminate. Nano Lett. 2014, 14, 5155–5161. doi:10.1021/nl501996v.
37. Renteria, J.; Legedza, S.; Salgado, R.; Balandin, M.P.; Ramirez, S.; Saadah, M.; Kargar, F.; Balandin, A.A.
Magnetically-functionalized self-aligning graphene fillers for high-efficiency thermal management
applications. Mater. Des. 2015, 88, 214–221. doi:10.1016/j.matdes.2015.08.135.
38. Khandelwal, R.; Kishen, J.M.C. Thermal weight functions for bi-material interface crack system using
energy principles. Int. J. Solids Struct. 2008, 45, 6157–6176. doi:10.1016/j.ijsolstr.2008.07.013.
39. Memon, M.O.; Haillot, S.; Lafdi, K. Carbon nanofiber based buckypaper used as a thermal interface
material. Carbon 2011, 49, 3820–3828. doi:10.1016/j.carbon.2011.05.015.
40. Li, X.; Yang, R. Effect of lattice mismatch on phonon transmission and interface thermal conductance across
dissimilar material interfaces. Phys. Rev. B Condens. Matter Mater. Phys. 2012, 86.
doi:10.1103/PhysRevB.86.054305.
41. Shahil, K.M.F.; Balandin, A.A. Thermal properties of graphene and multilayer graphene: Applications in
thermal interface materials. Solid State Commun. 2012, 152, 1331–1340. doi:10.1016/j.ssc.2012.04.034.
42. Sarvar, F.; Whalley, D.; Conway, P. Thermal Interface Materials—A Review of the State of the Art. In
Proceedings of the 2006 1st Electronics Systemintegration Technology Conference, Dresden, Germany, 5–
7 September 2006; pp. 1292–1302. doi:10.1109/ESTC.2006.280178.
43. Goyal, V.; Balandin, A.A. Thermal properties of the hybrid graphene-metal nano-micro-composites:
Applications in thermal interface materials. Appl. Phys. Lett. 2012, 100, 073113. doi:10.1063/1.3687173.
44. McNamara, A.J.; Joshi, Y.; Zhang, Z.M. Characterization of nanostructured thermal interface materials—A
review. Int. J. Therm. Sci. 2012, 62, 2–11. doi:10.1016/j.ijthermalsci.2011.10.014.
45. Shahil, K.M.F.; Balandin, A.A. Graphene-multilayer graphene nanocomposites as highly efficient thermal
interface materials. Nano Lett. 2012, 12, 861–867. doi:10.1021/nl203906r.
46. Nika, D.L.; Balandin, A.A. Phonons and thermal transport in graphene and graphene-based materials. Rep.
Prog. Phys. 2017, 80, 36502. doi:10.1088/1361-6633/80/3/036502.
47. Guter, W.; Schöne, J.; Philipps, S.P.; Steiner, M.; Siefer, G.; Wekkeli, A.; Welser, E.; Oliva, E.; Bett, A.W.;
Dimroth, F. Current-matched triple-junction solar cell reaching 41.1% conversion efficiency under
concentrated sunlight. Appl. Phys. Lett. 2009, 94. doi:10.1063/1.3148341.
48. Dimroth, F.; Grave, M.; Beutel, P.; Fiedeler, U.; Karcher, C.; Tibbits, T.N.D.; Oliva, E.; Siefer, G.; Schachtner,
M.; Wekkeli, A.; et al. Wafer bonded four-junction GaInP/GaAs//GaInAsP/GaInAs concentrator solar cells
with 44.7% efficiency. Prog. Photovolt. Res. Appl. 2014, 22, 277–282. doi:10.1002/pip.2475.
49. Dahal, R.; Li, J.; Aryal, K.; Lin, J.Y.; Jiang, H.X. InGaN/GaN multiple quantum well concentrator solar cells.
Appl. Phys. Lett. 2010, 97. doi:10.1063/1.3481424.
50. Wheeldon, J.F.; Valdivia, C.E.; Walker, A.W.; Kolhatkar, G.; Jaouad, A.; Turala, A.; Riel, B.; Masson, D.;
Puetz, N.; Fafard, S.; et al. Performance comparison of AlGaAs, GaAs and InGaP tunnel junctions for
concentrated multijunction solar cells. Prog. Photovolt. Res. Appl. 2011, 19, 442–452. doi:10.1002/pip.1056.
51. Lee, S. Thermal challenges and opportunities in concentrated photovoltaics. In Proceedings of the 12th
Electronics Packaging Technology Conference (EPTC), Singapore, 8–10 December 2010; pp. 608–613.
doi:10.1109/EPTC.2010.5702711.
52. Buljan, M.; Mendes-Lopes, J.; Benítez, P.; Miñano, J.C. Recent trends in concentrated photovoltaics
concentrators’ architecture. J. Photonics Energy 2014, 4, 40995. doi:10.1117/1.JPE.4.040995.
53. Tromholt, T.; Katz, E.A.; Hirsch, B.; Vossier, A.; Krebs, F.C. Effects of concentrated sunlight on organic
photovoltaics. Appl. Phys. Lett. 2010, 96. doi:10.1063/1.3298742.
54. Barlev, D.; Vidu, R.; Stroeve, P. Innovation in concentrated solar power. Sol. Energy Mater. Sol. Cells 2011,
95, 2703–2725. doi:10.1016/j.solmat.2011.05.020.
55. Chemisana, D. Building integrated concentrating photovoltaics: A review. Renew. Sustain. Energy Rev. 2011,
15, 603–611. doi:10.1016/j.rser.2010.07.017.
56. Gulotty, R.; Castellino, M.; Jagdale, P.; Tagliaferro, A.; Balandin, A.A. Effects of Functionalization on
Thermal Properties of Single-Wall and Nanotube À Polymer Nanocomposites. ACS Nano. 2013, 7, 5114–
5121. doi:10.1021/Nn400726g.

Appl. Sci. 2017, 7, x FOR PEER REVIEW 13 of 13
57. Ramirez, S.; Chan, K.; Hernandez, R.; Recinos, E.; Hernandez, E.; Salgado, R.; Khitun, A.G.; Garay, J.E.;
Balandin, A.A. Thermal and magnetic properties of nanostructured densified ferrimagnetic composites
with grapheme-graphite fillers. Mater. Des. 2017, 118, 75–80. doi:10.1016/j.matdes.2017.01.018.
58. Kinsey, G.S.; Hebert, P.; Barbour, K.E.; Krut, D.D.; Cotal, H.L.; Sherif, R.A. Concentrator multijunction solar
cell characteristics under variable intensity and temperature. Prog. Photovolt. Res. Appl. 2008, 16, 503–508.
doi:10.1002/pip.834.
59. Chen, C.J. Physics of Solar Energy; Wiley: New York, NY, USA, 2011. doi:10.1002/9781118172841.
60. Markvart, T.; Castañer, L. Practical Handbook of Photovoltaics: Fundamentals and Applications. Elsevier:
Amsterdam. Netherlands, 2003. doi:10.1016/B978-1-85617-390-2.X5000-4.
61. Radziemska, E. The effect of temperature on the power drop in crystalline silicon solar cells. Renew. Energy
Int. J. 2003, 28, 1. doi:org/10.1016/S0960-1481(02)00015-0.
62. Singh, P.; Ravindra, N.M.; Temperature dependence of solar cell performance—an analysis. Sol. Energy
Mater. Sol. Cells. 2012, 101, 36–45. doi:10.1016/j.solmat.2012.02.019.
63. Cheknane, A.; Benyoucef, B.; Chaker, A. Performance of concentrator solar cells with passive cooling.
Semicond. Sci. Technol. 2006, 21, 144–147. doi:10.1088/0268-1242/21/2/007.
64. Anderson, W.G.; Dussinger, P.M.; Sarraf, D.B.; Tamanna, S. Heat Pipe Cooling of Concentrating
Photovoltaic Cells. In Proceedings of the Photovoltaic Specialists Conference, PVSC ’08, San Diego, CA,
USA, 11–16 May 2008. doi:10.1109/PVSC.2008.4922577.
65. Yue, D.; You, F.; Darling, S.B. Domestic and overseas manufacturing scenarios of silicon-based
photovoltaics: Life cycle energy and environmental comparative analysis. Sol. Energy 2014, 105, 669–678.
doi:10.1016/j.solener.2014.04.008.
© 2017 by the authors. Submitted for possible open access publication under the
terms and conditions of the Creative Commons Attribution (CC BY) license
(http://creativecommons.org/licenses/by/4.0/).