thermal maturation regime revisited in the dongying
TRANSCRIPT

Research ArticleThermal Maturation Regime Revisited in the DongyingDepression, Bohai Bay Basin, East China
Haiping Huang ,1,2,3 Hong Zhang,1 Zheng Li,4 and Mei Liu2
1School of Geosciences, Yangtze University, Wuhan, 430100 Hubei, China2School of Energy Resource, China University of Geosciences (Beijing), Beijing 100083, China3Department of Geoscience, University of Calgary, Calgary, Alberta, Canada T2N 1N44Geology Scientific Research Institute of Shengli Oilfield Company, Sinopec, Dongying 257015, China
Correspondence should be addressed to Haiping Huang; [email protected]
Received 20 July 2021; Accepted 7 September 2021; Published 24 September 2021
Academic Editor: Lanxiao Hu
Copyright © 2021 Haiping Huang et al. This is an open access article distributed under the Creative Commons AttributionLicense, which permits unrestricted use, distribution, and reproduction in any medium, provided the original work isproperly cited.
To the accurate reconstruction of the hydrocarbon generation history in the Dongying Depression, Bohai Bay Basin, East China,core samples of the Eocene Shahejie Formation from 3 shale oil boreholes were analyzed using organic petrology and organicgeochemistry methods. The shales are enriched in organic matter with good to excellent hydrocarbon generation potential. Thematurity indicated by measured vitrinite reflectance (%Ro) falls in the range of 0.5–0.9% and increases with burial depth ineach well. Changes in biomarker and aromatic hydrocarbon isomer distributions and biomarker concentrations are alsounequivocally correlated with the thermal maturity of the source rocks. Maturity/depth relationships for hopanes, steranes, andaromatic hydrocarbons, constructed from core data indicate different well locations, have different thermal regimes. Asystematic variability of maturity with geographical position along the depression has been illustrated, which is a dependenceon the distance to the Tanlu Fault. Higher thermal gradient at the southern side of the Dongying Depression results in thesame maturity level at shallower depth compared to the northern side. The significant regional thermal regime change fromsouth to north in the Dongying Depression may exert an important impact on the timing of hydrocarbon maturation andexpulsion at different locations. Different exploration strategies should be employed accordingly.
1. Introduction
Determining the thermal maturity of source rocks is crucialfor the prediction of petroleum generation time and theexploration potential in a sedimentary basin. Various petro-logical and geochemical methods can be applied for thermalhistory reconstruction, which include vitrinite reflectance(%Ro), Rock-Eval, Tmax, kerogen H/C ratio, degree of bio-marker isomerization, homogenization temperature in fluidinclusions, apatite fission track analysis, and many othermaturity indicators [1–5]. Widely applied petroleum systemmodeling techniques largely rely on the reaction kinetics ofkerogens and thermal maturity of source rocks to predictthe timing of oil and gas generation and identify hydrocar-bon production targets [6–8]. Vitrinite reflectance is consid-ered the most suitable and widely used tool for such purposes
as it can be universally applied in strata deposited after thelate Devonian [9]. Oil and gas generation stages are usuallyclassified on the basis of %Ro values even though the kineticsof kerogen thermal cracking differs from vitrinite particlerearrangement [6–8]. Tmax of the Rock-Eval pyrolysis offersthe easiest way to assess source rock maturity levels [10];however, Tmax suppression may occur in some liptiniteenriched kerogens [11, 12].
The molecular markers present in the extractableorganic matter (EOM) reflect different aspects of source rockthermal evolution during diagenetic and catagenetic pro-cesses. The relative abundance of thermally unstable biolog-ical isomers to the thermally stable geological isomers canindicate the thermal maturity levels of organic matter. Thereare numerous maturity parameters available in the literature,which have been applied for thermal history reconstruction
HindawiGeofluidsVolume 2021, Article ID 6020850, 17 pageshttps://doi.org/10.1155/2021/6020850

and maturity level assessment [2, 13–15]. However, the reac-tion mechanisms of molecular parameters are much morecomplex than this generally assumed and no universallyvalid maturity scale that is available [2]. Most molecularratios are governed by the rates of generation and/ordestruction of isomers of kerogen during catagenesis ratherthan pure isomerization [16, 17]. Meanwhile, the molecularratios are highly susceptible to variations in organofacies,kerogen type, and migration effects [18–20]. Caution shouldbe taken when molecular ratios are used in maturity levelassessment. van Graas suggested that absolute concentra-tions of molecular components especially biomarkers ratherthan isomer ratios are more reliable to indicate the maturitylevel in the oil generation window (0.6–1.0% Ro) [21]. Nev-ertheless, to integrate molecular compositions with petrolog-ical information is the only way to make the most reasonableinterpretation possible [15].
Dongyong Depression, situated at south of the Bohai BayBasin in eastern China, is a prolific region for oil and gasproduction. A substantial amount of data becomes availableregarding the tectonic framework and structural evolution,depositional systems and stratigraphic records, oil and gasgeneration potential, and oil family classification [22–26].Surprisingly, the basic petroleum geological issues such asoil generation threshold depth and thermal maturity schemeof the depression have rarely been acquiescent. Very differ-ent oil generation threshold depths have been recognizedin the Dongying Depression. Some studies regarded2,000m as the top of oil generation window [27–30], whileother studies settled the oil generation threshold depth at2,500m [31–33] or 3,000m [34]. The discrepancy in thethreshold depth not only results in very different petroleumgenerations and accumulation times but also substantiallydifferent exploration perspectives. Variable vitrinite reflec-tance measurements from different locations and lithologiesmight cause such discrepancy, but intrinsic constraints suchas variable heat flow may play a more important role. How-ever, no systematic investigation has not been performed.This paper integrates vitrinite reflectance measurement withmolecular composition in 3 shale oil exploration wells (FY1,NY1, and LY1) drilled in the Dongying Depression to eval-uate the regional thermal maturity variation within strati-graphic units. Systematic differences observed frommolecular compositions and vitrinite reflectance measure-ments at different locations might be rooted from thermalregime variation throughout the depression. The mainobjectives of the study by characterizing the thermal evolu-tion of organic matter to assess the thermal regime of theDongying Depression in explaining variable oil generationthreshold depths. The integration of two thermal maturityindicator types leads to a better definition of the petroleumsystem.
2. Geological Background
Dongying Depression with an area of roughly 5,700 km2 is atypical asymmetric half graben in the Bohai Bay Basin, EastChina. It is bounded by the Chenjiazhuang High to thenorth, the Qingtuozi High to the east, the Qingcheng and
Binxian highs to the west, and the Luxi Uplift to the south.The depression can be subdivided into four sags (Boxing,Niuzhuang, Lijin, and Minfeng) by several normal faults,one uplift (Central Anticlinal Belt), southern gentle slope,and northern steep slope (Figure 1(a)). Sedimentarysequence filled in the depression is mainly developed in theCenozoic age as a result of a dextral movement along theTanlu Fault. Tectonic evolution of the depression can bedivided into three stages: (1) the prerift stage of the Mesozoicto Paleozoic basement, (2) the rift stage of the Paleogene flu-vial lacustrine sediments, and (3) depression stage of theNeogene fluvial sediments [22]. The thickness of the Ceno-zoic lacustrine deposits exceeds 5,000m in some subsidingcenters. It consists of the Kongdian, Shahejie, Dongying,Guantao, Minghuazhen, and Pingyuan formations(Figure 1(b)). The Shahejie Formation (Es) contains themain source rocks and sandstone reservoirs in the wholebasin and can be further divided into four members, Es1,Es2, Es3, and Es4 (from top to bottom). The Es4 memberwas developed in saline to hypersaline lacustrine environ-ment. The lower part of the Es4 member consists of mud-stones, siltstones, and fine sandstones interbedded withgypsum and halite, while the upper part of the Es4 memberconsists of grey to black shale, calcareous shale, and mud-stone, dolomite as well as marlstone. The Es3 member wasformed in a brackish to freshwater lacustrine environment,which is mainly composed of deep lacustrine dark mud-stones and calcareous shales. Both members contain impor-tant source rocks within the depression, which aredominated by type I-II kerogens with TOC contents up to18.6% [24, 27, 34]. The reservoirs occur in variable strati-graphic units, which are controlled by faults connected tothe source rocks [31, 32].
3. Samples and Methods
Twenty-seven core samples from three shale oil explora-tion wells in the Dongying Depression were collected inthe present study. Fourteen samples were from the Es3member, and thirteen samples were from the Es4 member.The analytical methods are the same as our previous stud-ies [35, 36]. Briefly, standard Rock-Eval pyrolysis was per-formed on Rock-Eval VI apparatus with a flame ionizationdetector [37]. The vitrinite reflectance measurement wascarried out in Shengli Oilfield Company by using theMSP-400 microscopic fluorescence spectrometer with atemperature of 22°C and a relative humidity of 20%. Min-imum 50 points were measured, and an averaged valuewas recorded.
The extractable organic matter (EOM) was obtained usingSoxhlet extraction for 72h with dichloromethane (DCM) andmethanol (93 : 7 v/v). The EOMwas weighed using an inhousemethod. About 50mg of EOM was transferred to a vial and asuite of internal standards (cholestane-d4, adamantane-d16,phenyldodacane-d30, naphthalene-d8, phenanthrene-d10and 1,1-binaphthalene) that were added, and then the samplewas separated into the saturated and aromatic hydrocarbonfractions.
2 Geofluids

The saturated and aromatic hydrocarbon fractionswere analyzed using GC–MS in both selected ion monitor-ing and full scan mode (SIM/SCAN) on an Agilent 7890Bgas chromatograph linked to an Agilent 5977A MSD sys-tem. The DB–1MS fused silica capillary column(60m × 0:32mm i:d: × 0:25 μm film thickness) was usedfor separation. The GC oven temperature for the saturatedhydrocarbon fraction was programmed from 50 °C (1min)to 120 °C at 20 °C/min, then increased to 310 °C at 3 °C/min,which was held for 25min. The GC oven temperature for thearomatic hydrocarbon fraction was set at 40 °C initially for5min, programmed to 325 °C at 4 °C/min, and lasted for20min. Heliumwas used as the carrier gas, and a constant flowrate of 1ml/min was applied. The temperature of the injectorand interface was set at 300 °C. The ion source was operatedin the electron ionization (EI) mode at 70 eV. Peak identifica-tion and quantitation were performed by comparison of MSstandard library in this system and the aforementioned inter-nal standards with known quantities, respectively. Noresponse factor calibration has been performed.
4. Results
4.1. Bulk Geochemistry of Source Rocks. Basic geochemicaldata of the studied source rocks are listed in Table 1. Pyrol-ysis results indicate that the Shahejie Formation has excel-lent organic matter quality, quantity, and hydrocarbongeneration potential. The total organic carbon (TOC) con-tents vary in the range of 1.44–7.66wt% with an averagevalue of 3.62wt%, indicating high petroleum generationpotential. S1 and S2 values that range from 2.1 to 14.6mgHC/g rock and 5.0 to 48.3mg HC/g rock, respectively, arerecorded in this formation, with S3 documented to be from0.1 to 1.1mg HC/g rock. The calculated hydrogen indices(HI = S2/TOC × 100) for the studied samples vary in therange of 266–630mg HC/g TOC, with an average of 415,491 and 338mg HC/g TOC in wells FY1, NY1, and LY1,respectively. The oxygen indices (OI = S3/TOC × 100) varyin the range of 2–35mg CO2/g TOC, with an average of13mg CO2/g TOC. While the HI is fluctuated in each well,it decreases with increasing burial depth due to hydrocarbon
Figure 1: Location map of the study area. (a) Schematic map of the Bohai Bay Basin and its location in China. (b) Tectonic setting map ofthe Dongying Depression showing the uplift, sags, main faults, and shale oil well locations where the samples were obtained. (c) Generalstratigraphy column of the Dongying Depression (after Zhang et al. [35]).
3Geofluids

generation and expulsion. Cross correlation between HI andOI suggests that the organic matter of the Shahejie Forma-tion comprises primarily of oil-prone kerogen type I-II atthe immature stage.
Thermal maturity is an important characteristic that hasto be analyzed in a source rock, and it is usually determinedby using Ro, Tmax, and production index [PI = S1/ðS1 + S2Þ].The vitrinite reflectance values of the studied sample inter-vals from FY1 range from 0.48% to 0.74%, these in wellNY1 from 0.44% to 0.67%, and these in well LY1 from0.51% to 0.86% (Figure 2(a)). A gradual increase trend withincreasing depth of burial can be clearly observed in eachwell. All source rocks are in early mature to mature condi-tions with respect to hydrocarbon generation. However,the threshold depth of oil generation (assumed as Ro = 0:5%) in well LY1 is about 500m deeper than that in wellFY1. Tmax (temperature corresponding to the S2 peak max-imum of Rock-Eval pyrolysis) values of the Es3 samples inFY1 range from 439 °C to 447 °C, while one Es4 sample
has a lower Tmax value of 433 °C. Tmax values of one Es3sample and four Es4 samples in the shallower part of NY1increase from 439 °C to 446 °C, but the one deeper Es4 sam-ples have much lower Tmax value of 430 °C. Tmax values inLY1 vary from 429 °C to 445 °C without a depth-relatedtrend (Figure 2(b)). The Tmax values of > 430 °C in sourcerocks from both Es3 and Es4 suggest that they are thermallymature; however, the correlation between Tmax and burialdepth is poor, likely caused by facies variation or immigratedhydrocarbons [38, 39].
The PI is defined as the free hydrocarbons measured rel-ative to the total hydrocarbon generated during pyrolysis. PIvalues in wells FY1, NY1, and LY1 vary in the range of 0.11–0.35, 0.13–0.40, and 0.33–0.50, respectively (Table 1), sug-gesting that the maturities of these source rock intervalsare in the early oil window or greater. A general increasetrend of the PI values with increasing depth suggests thatthe burial of organic matter plays the dominant role inhydrocarbon generation (Figure 2(c)). Interestingly, PI
Table 1: Results of Rock-Eval analysis and vitrinite reflectance measurement of studied samples from the Dongying Depression.
Well AgeDepth Ro TOC S1 S2 S3 Tmax HI OI
PI(m) (%) (%) (mg/g rock) (mg/g rock) (mg/g rock) (°C) (mg/gTOC) (mg/gTOC)
FY1 Es3 3031.5 0.51 1.89 2.09 7.09 0.16 439 375 8 0.23
FY1 Es3 3059.92 0.48 3.4 4.43 16.36 0.26 443 481 8 0.21
FY1 Es3 3125.65 0.54 1.98 2.88 8.86 0.25 445 447 13 0.25
FY1 Es3 3170.14 0.58 7.22 4.58 35.55 0.31 447 492 4 0.11
FY1 Es3 3233.29 0.65 2.17 2.68 7.58 0.23 445 349 11 0.26
FY1 Es4 3316.23 0.76 1.44 2.67 4.97 0.2 433 345 14 0.35
NY1 Es3 3304.1 0.44 2.81 2.49 16.51 0.52 440 588 19 0.13
NY1 Es4 3333.04 0.47 2.5 3.4 12.85 0.56 439 514 22 0.21
NY1 Es4 3372.9 0.53 1.99 3.19 9.98 0.56 443 502 28 0.24
NY1 Es4 3377.84 2.59 3.12 11.46 0.27 445 442 10 0.21
NY1 Es4 3402.73 0.57 7.66 8.69 48.27 0.47 446 630 6 0.15
NY1 Es4 3462.58 0.67 1.88 3.44 5.09 0.66 430 271 35 0.40
LY1 Es3 3582.14 0.51 3.36 6.26 12.54 0.18 443 373 5 0.33
LY1 Es3 3586.16 0.52 3.79 6.93 13.53 0.19 439 357 5 0.34
LY1 Es3 3593.01 0.53 4.51 7.46 17.61 0.09 445 390 2 0.30
LY1 Es3 3598.15 0.53 4.77 8.18 18.08 0.19 443 379 4 0.31
LY1 Es3 3601.21 4.82 9.65 18.73 0.34 442 389 7 0.34
LY1 Es3 3658.46 0.6 5.63 14.64 20.74 0.6 442 368 11 0.41
LY1 Es3 3672.38 0.62 3.27 8.47 11.65 0.41 433 356 13 0.42
LY1 Es3 3674.34 0.62 4.54 8.83 17.88 0.45 442 394 10 0.33
LY1 Es4 3751.14 0.73 3.08 4.93 9.88 0.59 431 321 19 0.33
LY1 Es4 3768.15 0.76 5.05 10.41 13.52 1.13 431 268 22 0.44
LY1 Es4 3771.81 0.76 2.77 4.77 9.37 0.45 434 338 16 0.34
LY1 Es4 3786.16 0.78 2.97 7.14 8.38 0.46 442 282 15 0.46
LY1 Es4 3803.65 4.49 13.25 13.44 0.52 436 299 12 0.50
LY1 Es4 3815.76 0.83 3.63 5.88 9.66 0.61 429 266 17 0.38
LY1 Es4 3830.45 0.86 3.57 5.68 10.36 0.57 441 290 16 0.35
Ro: measured vitrinite reflectance; TOC: total organic carbon; S1: the amount of free hydrocarbons released before 300°C; S2: the amount of hydrocarbonsgenerated from kerogen cracking between 300 to 650°C; S3: the amount of CO2 detected at 390°C; Tmax: the temperature at which the maximum amountof hydrocarbon is generated from the sample; HI: hydrogen index (= S2/TOC × 100); OI: oxygen index (= S3/TOC × 100); PI: production index [= S1/ðS1+ S2Þ].
4 Geofluids

values show a weak inverse correlation to Tmax, further ver-ifying that Tmax value is a poor maturity indicator in the cur-rent study case.
4.2. Maturity Indicators Derived from SaturatedHydrocarbons. Partial mass chromatograms at m/z 191 dis-play the distribution of tri- and pentacyclic terpanes fromwells FY1 and LY1 (Figure 3). Samples shallower than3200m in well FY1 and the top sample in well LY1 at3582m show very similar distribution patterns, which con-sist primarily of the ubiquitous hopane series, with the C3017α, 21β(H)-hopane (C30H) predominating. Tricyclic ter-panes (TT) from C19 to C30 and C24 tetracyclic terpane showtrace amount compared to the pentacyclic terpanes (PT).With increasing burial depth, the dominance of pentacyclicterpanes is diminished, while the relative proportion of tricy-clic terpanes increases consequently. Changes in the penta-cyclic terpane region are characterized by the depletion ofC29–C35 regular hopanes and relative enrichment of rear-ranged hopanes. The relative abundance of 18α(H)-22,29,30-trisnorneohopane (Ts) increases continuously withburial depth and becomes the dominant peak of the m/z 191mass chromatogram in the deepest section of LY1. The18α(H)-30-norneohopane (C29Ts) and C30-diahopane(15α-methyl-17α(H)-27-norhopane, C30D) have also beenrelatively concentrated (Figure 3).
Classical biomarker maturity parameters measured fromGC-MS analyses are listed in Table 2. Isomerization ratios ofC31-homohopane 22S/ð22S + 22RÞ have approached theequilibrium values (0.57–0.60) and are no longer sensitiveto maturity variation (Table 2). However, it indicates that
all samples are at least in the oil generation window sincethis parameter reaches its equilibrium value prior to themain hydrocarbon generation threshold [2]. The ratio ofC30 17β,21α(H)-hopane (moretane, C30M) to C30Hdecreases with increasing thermal maturity from values ofabout 0.8 for immature bitumen to values less than 0.15for mature samples [2]. Samples in the present study havetheir C30M/C30H ratio < 0:15, suggesting that all samplesare mature (Table 2). Again, this ratio has also reached itsequilibrium value and cannot be used to differentiate thematurity differences for the studied samples.
The relative abundance of Ts and 17α(H)-22,29,30-tris-norhopane (Tm) has been widely employed as a maturityparameter in a similar organofacies system [2, 15]. The Ts/ðTs + TmÞ ratios vary in the range of 0.51–0.86 in FY1,0.43–0.75 in well NY1, and 0.75–0.95 in well NY1, respec-tively, showing an increasing trend with increasing burialdepth in each well (Figure 4(a)). Evolution profiles of theTs/ðTs + TmÞ ratio in the studied wells suggest a relativeconsecutive maturity regime at each well location. Ts/ðTs+ TmÞ ratio values in LY1 approach the maximum valueof 1.0, indicating a highly mature status due to deep burial.However, the ratio values in well NY1 are slightly lower thanthese in well FY1, which is about 300m shallower at thesame ratio value.
C30-diahopane is characterized by high thermal stability,which is even more stable than that of the 18α-neohopaneseries [40]. Ratios of C30-diahopane to C30 hopane[C30D/ðC30D + C30HÞ] increase steadily from 0.05 at thetop sample to 0.18 at the bottom in the samples of FY1,and the ratio values increase from 0.15 to 0.63 with
3000
3100
3200
3300
3400
3500
3600
3700
3800
3900
0.4 0.6 0.8 1
Dep
th (m
)
Ro (%)
420 430 440 450 0 0.2 0.4 0.6
PI
FY1NY1LY1
(b) (c)(a)
Tmax (°C)
Figure 2: Depth profile of maturity indicators at wells FY1, NY1, and LY1 in the Dongying Depression. (a) Measured vitrinite reflectance.(b) Rock-Eval Tmax. (c) Production index.
5Geofluids

increasing burial depth in well LY1; however, ratio values aregenerally <0.05 in well NY1 and show no depth correlation(Figure 4(b)). Likewise, the C29Ts/(C29Ts+C29H) ratiovalues show a marked increase in wells FY1 (0.26–0.57)and LY1 (0.44–0.81) but less dramatic change and lowerratio values in NY1 (0.23–0.39) (Table 2).
Tricyclic terpanes are generally more abundant in highlymature oils and/or source rocks because they are thermallymore stable than other terpanes, and thus the ratio of tricy-clic terpanes to pentacyclic terpanes will rise with increasingmaturity [15, 21]. The TT/ðTT + PTÞ ratio values increasefrom 0.04 to 0.19 in FY1, from 0.04 to 0.13 in NY1, and from0.08 to 0.46 in LY1, respectively (Figure 4(c)). Their evolu-tion profiles are generally consistent with other maturityindicators, representing a successive maturity sequence ineach well. This maturity indicator seems more useful for rel-atively mature bitumen than any of the others used in thisstudy, as this ratio increases continuously during advancedstages of thermal maturation.
Distributions of steranes arranged by depth in wells FY1and LY1 are shown in m/z 217 mass chromatograms(Figure 5). The regular steranes are dominated in majoritysamples, while pregnanes and diasteranes increase graduallywith depth, especially in LY1. Similar to the response ofhopanoids to increasing thermal stress, the stereochemicalconfiguration of steranes departs from its biological configu-ration 5α(H),14α(H), 17α(H)-20R (ααα-20R) to a mixture ofααα-20S and αββ-20R+20S [13]. On the basis of such evolu-tion, two commonly used maturity parameters can be
derived, i.e., ααα 20S/ð20S + 20RÞ and ββ/ðββ + ααÞ. TheC29 steranes are normally selected to avoid coelution issues.C29ααα 20S/ð20S + 20RÞ ratio in FY1 increases from 0.58 to0.72 with increasing depth for the Es3 sample subset, while aslightly lower value of 0.70 occurs in one Es4 sample. OneEs3 sample in NY1 has a C29ααα 20S/ð20S + 20RÞ ratio of0.57, while these from the Es4 show a revered trend withdepths decreasing from 0.67 to 0.47. Interestingly, theC29ααα 20S/ð20S + 20RÞ ratio values increase from 0.61 to0.75 for the Es3 samples in LY1, but decrease from 0.70 to0.55 for the Es4 samples (Figure 6(a)). The C29ααα 20S/ð20S + 20R) ratio values in the studied samples are mostlyapproaching the equilibrium values (ca. 0.6 at Ro of 0.7%,Mackenzie, 1984). The C29ααα 20S/ð20S + 20RÞ ratio haslost the sensitivity as a maturity indicator in the studiedsample suite.
The C29ββ/ðββ + ααÞ ratios in FY1 vary from 0.41 to0.49 without depth correlation, while the ratio valuesincrease consecutively from 0.35 to 0.59 in well NY1. TheC29ββ/ðββ + ααÞ ratios for LY1 samples decreases from0.51 to 0.49 in the Es3 source rocks but increases from0.51 to 0.59 in the Es4, showing the opposite trend toC29ααα 20S/ð20S + 20RÞ ratios (Figure 6(b)). TheC29ββ/ðββ + ααÞ ratio reaches the equilibrium point at aslightly higher maturity level (at Ro of 0.8%, Mackenzie[2]) than ααα 20S/ð20S + 20RÞ. However, the depth correla-tion of C29ββ/ðββ + ααÞ ratio has only been observed in wellNY1, suggesting that samples from the other two wells havepassed the equilibrium point. Both 20S/ð20S + 20RÞ and β
3031.5 m
3125.65 m
3233.29 m
3316.23 m
3582.14 m
3658.46 m
3751.14 m
3830.45 m
Well FY1 Well LY1
Ts
Ts
Ts
Ts
Ts
Ts
Ts
Ts
Tm
19TT 20TT 21TT
22TT 23
TT24
TT
25TT
24T4
T26
TT
28TT
29TT
29H
29Ts
Tm 30D
30M
30H31
H
G 32H
33H
34H
35H
29H
29H
29H
30H
30H
30H
29H
29H
29H
30H
30H
30H
19TT 20TT 21
TT22
TT23
TT24
TT25
TT24
T4T
26TT 28
TT 29TT
29H
29Ts
30D
30M 31
H
G
32H 33
H34
H 35H
30H
m/z = 191m/z = 191
Figure 3: Mass chromatograms of m/z = 191 of the saturated hydrocarbon fraction showing the typical distribution of terpanes withincreasing burial depth in wells FY1 and LY1. 19-29TT: C19-C29 tricyclic terpanes; Ts:18α(H)-trisnorneohopane; Tm: 17α(H)-trisnorhopane; 29-35H: C29-C35 17α(H),21β(H) hopanes; 29Ts: 8α(H)-30-norneohopane; 30D: C30-diahopane (15α-methyl-17α(H)-27-norhopane); 30M: C30 17β(H),21α(H)-hopane (moretane).
6 Geofluids
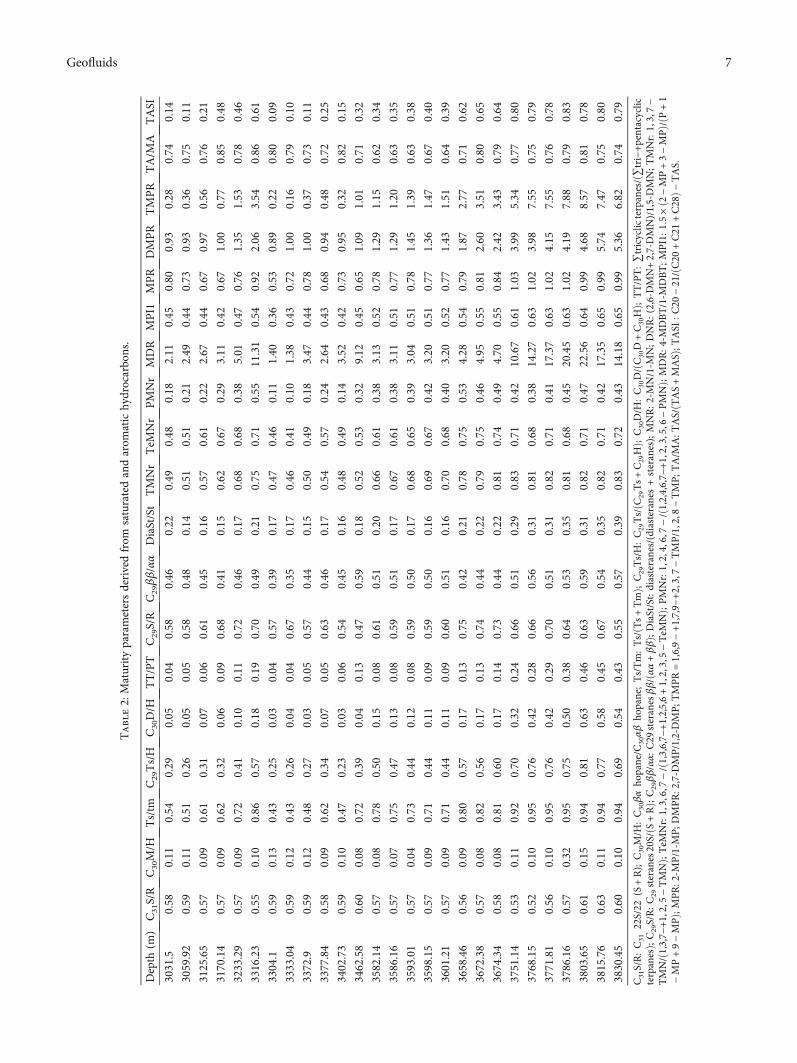
Table2:Maturityparametersderivedfrom
saturatedandarom
atichydrocarbons.
Depth
(m)
C31S/R
C30M/H
Ts/tm
C29Ts/H
C30D/H
TT/PT
C29S/R
C29ββ/αα
DiaSt/St
TMNr
TeM
Nr
PMNr
MDR
MPI1
MPR
DMPR
TMPR
TA/M
ATASI
3031.5
0.58
0.11
0.54
0.29
0.05
0.04
0.58
0.46
0.22
0.49
0.48
0.18
2.11
0.45
0.80
0.93
0.28
0.74
0.14
3059.92
0.59
0.11
0.51
0.26
0.05
0.05
0.58
0.48
0.14
0.51
0.51
0.21
2.49
0.44
0.73
0.93
0.36
0.75
0.11
3125.65
0.57
0.09
0.61
0.31
0.07
0.06
0.61
0.45
0.16
0.57
0.61
0.22
2.67
0.44
0.67
0.97
0.56
0.76
0.21
3170.14
0.57
0.09
0.62
0.32
0.06
0.09
0.68
0.41
0.15
0.62
0.67
0.29
3.11
0.42
0.67
1.00
0.77
0.85
0.48
3233.29
0.57
0.09
0.72
0.41
0.10
0.11
0.72
0.46
0.17
0.68
0.68
0.38
5.01
0.47
0.76
1.35
1.53
0.78
0.46
3316.23
0.55
0.10
0.86
0.57
0.18
0.19
0.70
0.49
0.21
0.75
0.71
0.55
11.31
0.54
0.92
2.06
3.54
0.86
0.61
3304.1
0.59
0.13
0.43
0.25
0.03
0.04
0.57
0.39
0.17
0.47
0.46
0.11
1.40
0.36
0.53
0.89
0.22
0.80
0.09
3333.04
0.59
0.12
0.43
0.26
0.04
0.04
0.67
0.35
0.17
0.46
0.41
0.10
1.38
0.43
0.72
1.00
0.16
0.79
0.10
3372.9
0.59
0.12
0.48
0.27
0.03
0.05
0.57
0.44
0.15
0.50
0.49
0.18
3.47
0.44
0.78
1.00
0.37
0.73
0.11
3377.84
0.58
0.09
0.62
0.34
0.07
0.05
0.63
0.46
0.17
0.54
0.57
0.24
2.64
0.43
0.68
0.94
0.48
0.72
0.25
3402.73
0.59
0.10
0.47
0.23
0.03
0.06
0.54
0.45
0.16
0.48
0.49
0.14
3.52
0.42
0.73
0.95
0.32
0.82
0.15
3462.58
0.60
0.08
0.72
0.39
0.04
0.13
0.47
0.59
0.18
0.52
0.53
0.32
9.12
0.45
0.65
1.09
1.01
0.71
0.32
3582.14
0.57
0.08
0.78
0.50
0.15
0.08
0.61
0.51
0.20
0.66
0.61
0.38
3.13
0.52
0.78
1.29
1.15
0.62
0.34
3586.16
0.57
0.07
0.75
0.47
0.13
0.08
0.59
0.51
0.17
0.67
0.61
0.38
3.11
0.51
0.77
1.29
1.20
0.63
0.35
3593.01
0.57
0.04
0.73
0.44
0.12
0.08
0.59
0.50
0.17
0.68
0.65
0.39
3.04
0.51
0.78
1.45
1.39
0.63
0.38
3598.15
0.57
0.09
0.71
0.44
0.11
0.09
0.59
0.50
0.16
0.69
0.67
0.42
3.20
0.51
0.77
1.36
1.47
0.67
0.40
3601.21
0.57
0.09
0.71
0.44
0.11
0.09
0.60
0.51
0.16
0.70
0.68
0.40
3.20
0.52
0.77
1.43
1.51
0.64
0.39
3658.46
0.56
0.09
0.80
0.57
0.17
0.13
0.75
0.42
0.21
0.78
0.75
0.53
4.28
0.54
0.79
1.87
2.77
0.71
0.62
3672.38
0.57
0.08
0.82
0.56
0.17
0.13
0.74
0.44
0.22
0.79
0.75
0.46
4.95
0.55
0.81
2.60
3.51
0.80
0.65
3674.34
0.58
0.08
0.81
0.60
0.17
0.14
0.73
0.44
0.22
0.81
0.74
0.49
4.70
0.55
0.84
2.42
3.43
0.79
0.64
3751.14
0.53
0.11
0.92
0.70
0.32
0.24
0.66
0.51
0.29
0.83
0.71
0.42
10.67
0.61
1.03
3.99
5.34
0.77
0.80
3768.15
0.52
0.10
0.95
0.76
0.42
0.28
0.66
0.56
0.31
0.81
0.68
0.38
14.27
0.63
1.02
3.98
7.55
0.75
0.79
3771.81
0.56
0.10
0.95
0.76
0.42
0.29
0.70
0.51
0.31
0.82
0.71
0.41
17.37
0.63
1.02
4.15
7.55
0.76
0.78
3786.16
0.57
0.32
0.95
0.75
0.50
0.38
0.64
0.53
0.35
0.81
0.68
0.45
20.45
0.63
1.02
4.19
7.88
0.79
0.83
3803.65
0.61
0.15
0.94
0.81
0.63
0.46
0.63
0.59
0.31
0.82
0.71
0.47
22.56
0.64
0.99
4.68
8.57
0.81
0.78
3815.76
0.63
0.11
0.94
0.77
0.58
0.45
0.67
0.54
0.35
0.82
0.71
0.42
17.35
0.65
0.99
5.74
7.47
0.75
0.80
3830.45
0.60
0.10
0.94
0.69
0.54
0.43
0.55
0.57
0.39
0.83
0.72
0.43
14.18
0.65
0.99
5.36
6.82
0.74
0.79
C31S/R:C31
22S/22
(S+R);
C30M/H
:C30βαho
pane/C
30αβ
hopane;Ts/Tm:Ts/ðT
s+Tm
Þ;C29Ts/H:C 2
9Ts/ðC
29Ts
+C 2
9HÞ;
C30D/H
:C 3
0D/ðC
30D+C 3
0HÞ;
TT/PT:∑tricyclicterpanes/ð∑
tri−+
pentacyclic
terpanesÞ;C29S/R:C 2
9ste
ranes2
0S/ðS
+RÞ
;C29ββ/αα:
C29s
teranesβ
β/ðα
α+ββÞ;DiaSt/St:diasteranes/(diasteranes
+steranes);MNR:2-MN/1-M
N;DNR:(2,6-D
MN+2,7-DMN)/1,5-DMN;T
MNr:1,3,7−
TMN/ð1
,3,7−+
1,2,5−
TMNÞ;TeM
Nr:1,3,6,7−/ð1
,3,6,7−+
1,2,5,6+1,2,3,5−Te
MNÞ;PMNr:1,2,4,6,7−/ð1
,2,4,6,7−+
1,2,3,5,6−
PMNÞ;MDR:4
-MDBT/1-M
DBT;MPI1:1:5×ð2
−MP+3−
MPÞ/ðP
+1
−MP+9−MPÞ;M
PR:2-M
P/1-M
P;D
MPR:2,7-D
MP/1,2-D
MP;T
MPR
=1,6,9−+1
,7,9−+
2,3,7−
TMP/1,2,8−TM
P;TA/M
A:T
AS/ðTAS+
MASÞ;
TASI
:C2
0−21/ðC
20+C2
1+C2
8Þ−TA
S:
7Geofluids

β/ðββ + ααÞ ratios will be reversed at the peak oil generationstage [15] and are not sensitive to maturity variation in thestudied samples.
The diasteranes/steranes ratio is also maturity-relatedindicator as diasteranes are thermally more stable than reg-ular steranes, which increases after the peak oil generationwindow [13]. The ratios C27-29 diasteranes to C27-29 regular
steranes [DiaSt/(DiaSt+St)] vary in a narrow range of 0.14–0.25 in wells FY1 and NY1 without a clear depth trend,but increase continuously from 0.17 to 0.39 in well LY1(Figure 6(c)), suggesting that the diasteranes/steranes ratiois a valid maturity indicator for studied sample suite.
Concentrations of all biomarkers decrease with increas-ing maturity and can more accurately reflect maturity
3000
3100
3200
3300
3400
3500
3600
3700
3800
3900
0.2 0.4 0.6 0.8 1
Ts/ (Ts+Tm)
0 0.2 0.4 0.6 0.8
(b) (c)
0 0.2 0.4 0.6
TT/ (TT+PT)C30D/ (C30D+C30H)
FY1NY1LY1
Dep
th (m
)
(a)
Figure 4: Maturity profile derived from terpanes in the 3 studied wells. (a) Ts/ðTs + TmÞ. (b) C30D/ðC30D + C30HÞ. (c) TT/ðTT + PTÞ.
20P Diasteranes
21P
S R SR
S
R
20P
20P
20P
20PDiasteranes
21P
20P
20P
20P
Diasteranes
Diasteranes
Diasteranes
Diasteranes
Diasteranes
Diasteranes
m/z = 217 m/z = 217
3031.5 m
3125.65 m
3233.29 m
3316.23 m
3582.14 m
3658.46 m
3751.14 m
3830.45 m
Well FY1 Well LY1
RSS SR
R
S R S RS
R
RS
S SRR
ααα
ααα
ααα
ααα ααα
ααα ααα
ααα
ααα
ααα
ααα
αββ
αββαββ
αββ
αββ
αββ
C27
C28
C29C27
C28
C29
C27
C28
C29
C27
C28
C29C27
C28
C29
C27
C28
C29
Figure 5: Mass chromatograms of m/z = 217 of the saturated hydrocarbon fraction showing the typical distribution of steranes withincreasing burial depth in wells FY1 and LY1. 20-21P: C20-C21 pregnanes; αααS: 5α(H),14α(H),21α(H),20S; αββR:5α(H),14β(H),21β(H),20R; αββS: 5α(H),14β(H),21β(H),20S; αααR: 5α(H),14α(H),21α(H),20R.
8 Geofluids

variation [21]. Summed concentrations of three typical bio-marker compound classes, expressed relative to the mass ofextractable organic matter, were plotted in Figure 7. Concen-trations of C19-30 tricyclic terpanes vary from 470 to1100μg/g EOM (ppm) in well FY1 and these in wells NY1and LY1 from 650 to 1330 ppm and from 160 to 770 ppm,respectively. While the data are scattered and fluctuated ineach well, a clear decrease trend with increasing depth canbe illustrated (Figure 7(a)). More dramatic concentrationvariations can be observed in the pentacyclic terpanes, whichdecrease from 18,700 to 1,900 ppm, from 27,000 to4,200 ppm, and from 8,200 to <300 ppm with increasingburial depths in wells FY1, NY1, and LY1, respectively(Figure 7(b)). Clearly, the concentrations of both tri- andpentacyclic terpanes decrease with increasing depth (thermalmaturity) but at different rates. More abrupt depletion ofpentacyclic terpanes than tricyclic terpanes results in the riseof TT/PT ratio rather than a formation of tricyclic terpanesfrom pentacyclic terpanes.
Concentrations of C27-29 regular steranes decrease fromabout 3,000 ppm to 600 ppm with increasing depth in wellFY1 and from 1,700 ppm to 150 ppm in well LY1. However,no depletion trend with increasing depth has been observedin NY1 with the highest amount of 4,100 ppm occurring inthe deepest sample (Figure 7(c)). This further verifies thatwell NY1 suffers less extensive thermal stress than wellsFY1 and LY1.
4.3. Maturity Indicators Derived from AromaticHydrocarbons. Occurrence and behavior of polyaromatichydrocarbons (PAHs) have been thoroughly investigated inorganic geochemistry. It has long been recognized that theabundance and distribution of PAHs and their structural
isomers can be used to assess the maturation of source rock,bitumens, and oils, especially at high maturity levels [41–43].The alkylated naphthalenes, phenanthrenes, and diben-zothiophenes are common constituents of oils and sourcerock extracts. During maturation, thermally less stable formsin the α-position will be transferred to thermally more stableforms in the β-position, and the β/α ratio for particulargroups of compounds can be used as a maturity indicator[42–45]. Numerous maturity parameters based on thesecompounds are available in literature, but only a few com-monly used ones have been explored in the present study.
Representative mass chromatograms of m/z = 170 + 184+ 198 show the distributions of C3-, C4-, and C5-alkyl-naphthalenes, dibenzothiophene and methyldibenzothio-phenes in source rock extracts at wells FY1 and LY1(Figure 8). Based on thermodynamic considerations, themost thermally stable trimethylnaphthalene (TMN) isomeris 2,3,6-TMN, and one of the least stable isomers is 1,2,5-TMN, which is often abundant in low maturity oil samples.The depletion of the relative abundance of 1,2,5-TMN canbe visually observed from both columns. van Aarssen et al.[45] defined trimethylnaphthalene ratio (TMNr) as 1, 3, 7− TMN/ð1,3,7−+1, 2, 5 − TMNÞ. The ratio values increasealmost linearly with depth from 0.49 to 0.75 in FY1, from0.46 to 0.54 in well NY1, and from 0.66 to 0.83 in LY1(Figure 9(a), Table 2).
Among the tetramethylnaphthalenes (TeMN), 1,3,6,7-TeMN is the most thermally stable isomer, whereas 1,2,5,6-TeMN is the least thermally stable and usually the mostabundant isomer in samples of low maturity. Decrease of1,2,5,6-TeMN against other tetramethylnaphthalenes withincreasing depth can be clearly seen in both wells. Underthe chromatographic conditions used in the present study,
3000
3100
3200
3300
3400
3500
3600
3700
3800
3900
0.4 0.5 0.6 0.7 0.8
Dep
th (m
)
0.3 0.4 0.5 0.6 0.1 0.2 0.3 0.4
DiaSt/(DiaSt+St)C29 20S/(20S+20R) C29 ββ/(αα+ββ)
(b) (c)(a)
FY1NY1LY1
Figure 6: Maturity profile derived from steranes in the 3 studied wells. (a) C29ααα 20S/ð20S + 20RÞ. (b) C29αββ/ðαββ + αααÞ. (c)Diasteranes/(diasteranes + regular steranes).
9Geofluids

1,2,5,6-TeMN is coeluted with 1,2,3,5-TeMN, which is verysimilar in stability to each other. van Aarssen et al. [45]defined the ratio of 1,3,6,7-TeMN to the sum of 1,3,6,7-TeMN and (1,2,5,6 + 1,2,3,5)-TeMN as tetramethylnaphtha-lene ratio (TeMNr). Ratio values of TeMNr increase from0.48 to 0.71 in FY1, from 0.41 to 0.57 in NY1, and from
0.61 to 0.75 in LY1 (Figure 9(b), Table 2). Both TMNr andTeMNr have high coefficient with Ts/ðTs + TmÞ (> 0.75)(Table 2), therefore to be the most suitable maturity indica-tors among alkylnaphthalenes.
The thermal stability of alkyldibenzothiophenes varieswith the position of substitution. A shift from a thermally
3000
3100
3200
3300
3400
3500
3600
3700
3800
3900
0 500 1000 1500
Dep
th (m
)
0 10000 20000 30000 0 1500 3000 4500
ΣTT (μg/g EOM) ΣPT (μg/g EOM) ΣSt (μg/g EOM)
FY1NY1LY1
(b) (c)(a)
Figure 7: Biomarker concentration variations in the 3 studied wells. (a) Summed tricyclic terpanes (TT). (b) Summed pentacyclic terpanes(PT). (c) Summed regular steranes (St).
1 , 2 , 5–
1 , 3 , 7–
1 , 3
, 6
, 7
1 , 3
, 6
, 7
1 , 2
, 5
, 6 +
1
, 2 ,
3 , 5
DBT
4-MD
BT
1-MD
BT 1 , 2 , 5–
1 , 3 , 7–
DBT 4-M
DBT
1-MD
BT
1 , 2 , 5–
1 , 3 , 7–
1 , 2
, 5
, 6 +
1
, 2 ,
5 , 6
+
1 , 2
, 5
, 6 +
1 , 2
, 5
, 6 +
1
, 2 ,
5 , 6
+
1 , 2
, 5
, 6 +
1
, 2 ,
5 , 6
+
1 , 2
, 3
, 5–
1 , 2
, 3
, 5–
1 , 2
, 3
, 5–
1 , 2
, 3
, 5–
1 , 2
, 3
, 5–
1 , 2
, 3
, 5–
1 , 2
, 3
, 5–
DBT 4-M
DBT
1-MD
BT
1 , 2 , 5–
1 , 3 , 7–
4-MD
BT
1-MD
BT
1 , 2 , 5–
1 , 3 , 7–
DBT 4-M
DBT
1-MD
BT
1 , 2 , 5–
1 , 3 , 7–4-M
DBT
1-MD
BT
1 , 2 , 5–
1 , 3 , 7–
DBT 4-M
DBT
1-MD
BT
1 , 2 , 5–
1 , 3 , 7–
4-MD
BT
1-MD
BT
DBT
DBT
DBT
m/z = 170 + 184 + 198m/z = 170 + 184 + 198
3031.5 m
3125.65 m
3233.29 m
3316.23 m
3582.14 m
3658.46 m
3751.14 m
3830.45 m
Well FY1 Well LY1
1 , 3
, 6
, 7–
1 , 3
, 6
, 7–
1 , 3
, 6
, 7–
1 , 3
, 6
, 7–
1 , 3
, 6
, 7–
1 , 3
, 6
, 7–
Figure 8: Mass chromatograms of m/z = 170 + 184 + 198 of the aromatic hydrocarbon fraction showing the typical distribution of C3–C5-alkylnaphthalenes, dibenzothiophene (DBT), and methyldibenzothiophenes (MDBT) with increasing burial depth in wells FY1 and LY1.
10 Geofluids

less stable 1-methyldibenzothiophene (1-MDBT) towards amore stable 4-MDBT on maturation forms another com-monly used maturity indicator, methyldibenzothiopheneratio (MDR = 4 −MDBT/1 −MDBT, Radke et al. [46]).The MDR values increase from 2.1 to 11.3 in FY1, from1.4 to 9.1 in NY1, and from 3.1 to 22.6 in LY1, respectively(Figure 9(c), Table 2). Lower MDR value in NY1 than theother two wells indicates lower maturity levels.
Representative mass chromatograms of m/z = 178 + 192+ 206 + 220 show the distribution of C0-3-alkylphenanthrenes in wells FY1 and LY1 (Figure 10). Whileless dramatic than alkylnaphthalenes, systematic changes inalkylphenanthrene composition with increasing burial depthstill can be observed. Radke and Welte [41] observed that therelative amounts of 2- and 3-methylphenanthrene (MP)increase compared to the 1- and 9-MP isomers with increas-ing burial depth and proposed the methylphenanthreneindex[MPI1 = 1:5 × ð2 −MP + 3 −MPÞ/ðP + 1 −MP + 9 −MPÞ].The MPI1 values in wells FY1, NY1, and LY1 are in therange of 0.42–0.54, 0.36–0.45, and 0.51–0.65, respectively,and increase with burial depth (Figure 11(a), Table 2). Sim-ilar change can be observed in methylphenanthrene ratio(MPR = 2 −MP/1 −MP), which increased from 0.67 to0.92, 0.53 to 0.78, and 0.77 to 1.03 in wells FY1, NY1, andLY1, respectively (Table 2).
Distribution of C2-alkylphenanthrene isomers is alsosensitive to thermal maturation. 2,7-dimethylphenanthrene(DMP) is one of the most stable isomers, while 1,2-DMP isone of the least stable isomers. Ratio of 2,7-DMP/1,2-DMPproposed as dimethylphenanthrene ratio (DMPR, Radke[43]) in the present study, which increase linearly with
depths from 0.93 to 2.06 in FY1, from 0.89 to 1.09 in wellNY1, and from 1.29 to 5.74 in well LY1, respectively(Figure 11(b), Table 2).
Maturity influence on the distribution of C3-alkylphenanthrene isomers has not been illustrated in the lit-erature. The correlation of the relative abundance of individ-ual isomers with burial depth suggests that the coeluted peakcontaining 1,6,9- + 1,7,9- + 2,3,7-trimethylphenanthrene(TMP) is the most stable one while 1,2,8-TMP is the leaststable one. The trimethylphenanthrene ratio(TMPR = 1,6,9−+1,7,9−+2, 3, 7 − TMP/1, 2, 8 − TMP) showsvery similar trend as MDR and can be served as novel matu-rity parameter. The lowest TMPR value in NY1 is consistentwith many other maturity parameters and suggests the low-est maturity level in the three studied wells (Figure 11(c),Table 2).
The m/z = 253 and 231 mass chromatograms display thedistributions of mono- and triaromatic steroids identifiedfrom the aromatic fraction of the studied source rocks. Themonoaromatic steroids appear in relatively low abundancecompared to triaromatic steroids (Figure 12). The formeris mainly present in immature organic matter, while the lat-ter may form in organic matter at a later stage of diagenesis.Under thermal stress, steroids undergo irreversible aromati-zation and side chain cleavage, and their distribution andconcentrations are commonly used to assess the thermalmaturity of sedimentary organic matter [47].
Two widely used parameters can be derived from aro-matic steroids. The degree of steroid hydrocarbon aromati-zation [TA/ðTA +MAÞ] (TA is total triaromatic steroidhydrocarbons, and MA is total monoaromatic steroidhydrocarbons) is one of the commonly used maturity
3000
3100
3200
3300
3400
3500
3600
3700
3800
3900
0.2 0.4 0.6 0.8 1
Dep
th (m
)
TMNr
0.2 0.4 0.6 0.8
TeMNr
0 10 20 30
MDR
(b) (c)(a)
FY1NY1LY1
Figure 9: Maturity profile derived from alkylnaphthalenes and alkyldibenzothiophenes in the 3 studied wells. (a) Trimethylnaphthaleneratio (TMNr). (b) Tetramethylnaphthalene ratio (TeMNr). (c) Methyldibenzothiophene ratio (MDR).
11Geofluids

parameters. Monoaromatic steroid hydrocarbons arebelieved to be converted to triaromatic steroid hydrocarbonsduring maturation. However, the TA/ðMA+ TAÞ ratio didnot change accordingly in the studied wells (Table 2). Thisparameter seems only valid at the early oil generation win-dow, but the present studied samples are already in the oil
generation window. Another widely used parameter is theratio of short side-chain triaromatic steroid hydrocarbonsto long side-chain components, which increase with increas-ing maturity [47]. The long-chain triaromatic steroids areextremely enriched in low mature samples, while the short-chained ones are gradually enriched in the highly matured
2,7-
P
P
P
P
3–
3–
3– 3–
3–
3–
3–3–
1–
1–
1–1–
1–
1–
1–1–
P
P
P
P
1 , 2
, 8–
1 , 2
, 8–
1 , 2
, 8–
1 , 2
, 8–
1 , 2
, 8–
1 , 2
, 8–
1 , 2
, 8–
1 , 2
, 8–
1 , 2
, 8–
m/z = 178 + 192 + 206 +220 m/z = 178 + 192 + 206 +220
3031.5 m
3125.65 m
3233.29 m
3316.23 m
3582.14 m
3658.46 m
3751.14 m
3830.45 m
Well FY1 Well LY1
169–
+179
–+23
7–16
9–+1
79–+
237–
169–
+179
–+23
7–16
9–+1
79–+
237–
169–
+179
–+23
7–16
9–+1
79–+
237–
169–
+179
–+23
7–16
9–+1
79–+
237–
1 , 2
–1
, 2–
1 , 2
–1
, 2–
2–
2–
2–2–
2–
2–
2–2–
9–
9–
9–9–
9–
9–
9–
9–
1 , 2
–1
, 2–
1 , 2
–1
, 2–
2 , 7
–
2 , 7
–2
, 7–
2 , 7
–2
, 7–
2 , 7
–2
, 7–
Figure 10: Mass chromatograms of m/z = 178 + 192 + 206 + 220 of the aromatic hydrocarbon fraction showing the typical distribution ofC0-C3-alkylphenanthrenes with increasing burial depth in wells FY1 and LY1.
3000
3100
3200
3300
3400
3500
3600
3700
3800
3900
0.2 0.4 0.6 0.8
Dep
th (m
)
MPI1
0.2 2.2 4.2 6.2
DMPR
0 5 10
TMPR
(b) (c)(a)
FY1NY1LY1
Figure 11: Maturity profile derived from alkylphenanthrenes in the 3 studied wells. (a) Methylphenanthrene Index 1 (MPI1). (b)Dimethylphenanthrene ratio (DMPR). (c) Trimethylphenanthrene ratio (TMPR).
12 Geofluids

samples. The ratios of short chain triaromatic steroids (C20–C21) to the sum of short plus C28 triaromatic steroids[C20−21/ðC20 + C21 + C28Þ − TAS] increase from 0.11 to 0.61in FY1, from 0.09 to 0.32 in well NY1, and from 0.34 to0.83 in well LY1 (Figure 13(a), Table 2).
The concentrations of monoaromatic steroids decreasesharply from 450ppm at the top to < 10 ppm at the bottomin FY1. However, only a gentle decrease has been observedin NY1 where the concentrations of monoaromatic steroidsvary between 210 and 470ppm. The concentrations ofmonoaromatic steroids decreases sharply from 165ppm at3582m to less than 10 ppm at 3672m LY1, and no reliablemonoaromatic steroids can be quantified in samples deeperthan 3672m (Figure 13(b)). Concentrations of triaromaticsteroids show the same evolution trajectories as these ofmonoaromatic steroids (Figure 13(c)).
5. Discussion
In the case of the Dongying Depression, the measured vitri-nite reflectance values may not represent the actual maturitylevel due to suppression [27, 30], while the degree of sup-pression has not been elucidated [48]. Similarly, the molecu-lar maturity parameters are also not universally validbecause the relative roles of time and temperature can varyamong the various biomarker transformations [2], and theyare susceptible to variation in organofacies [15]. They permitthe recognition and definition of maturity levels in a relativesense. Nevertheless, both vitrinite reflectance and molecularparameters illustrated the same maturity discrepancy in dif-ferent wells. The assumption of a uniform thermal gradientacross the whole depression needs revisit.
Actually, a variable maturity-depth trend has beennoticed by previous investigations. Rock-Eval pyrolysis pro-duction index and borehole temperatures of well FY1 deviat-ing from the average geothermal gradient have been noticedby Ping et al. [30], and they suggested that the source rock inwell FY1 started oil generation earlier than that of otherwells. Similarly, Guo et al. [27] recognized that the oil gener-ation related overpressured zone top in the southern part ofthe Dongying Depression is shallower than that in thenorthern part. However, those phenomena have beenignored in their regional studies. Samples in the presentstudy show a systematic maturity-depth correlation in eachwell. The maturity differences at the same depth in differentwells are most likely caused by different thermal regimes atdifferent sags where 3 wells are situated. Variable thresholddepths in different studies likely echo the variable thermalgradients, while different methods inevitably exert someimpact on the evaluation results. Geothermal gradientand/or temperature variation in space and time dependson both the heat flow and thermal conductivity of the basin,which are functions of tectonic settings and lithology [49].While lithology variation results in variable conductivity indifferent depositional systems, the samples studied here arelargely from the same stratigraphic unit and have very sim-ilar lithologies. No robust evidence indicates that large litho-logical facies variations occurs in the Dongying Depression,which can result in the observed maturity-depth trend, whilefurther investigation is still called for. We suggest that thevariation of heat flow plays a critical role for variable matu-rity levels across depression.
Early measurements have illustrated that heat flow variesfrom 60mW/m2 in the deep depocentres to > 70mW/m2 in
28R
26S
26R+27S28S
27R 28R
26S
26R+
27S
28S27Rsd
sd
21M
22M 20
T21
T MAS
21M
22M
20T
21T MAS
m/z = 231 + 253 m/z = 231 + 253
3031.5 m
3125.65 m
3233.29 m
3316.23 m
3582.14 m
3658.46 m
3751.14 m
3830.45 m
Well FY1 Well LY1
Figure 12: Mass chromatograms of m/z = 231 + 253 of the aromatic hydrocarbon fraction showing the typical distribution of mono- andtriaromatic steroid hydrocarbons with increasing burial depth in wells FY1 and LY1. 21-22M: C21-C22 monoaromatic steroids; 20-21 T:C20-C21 triaromatic steroids; 26-28R/S: C26-C28 triaromatic steroids; sd: internal standard.
13Geofluids

the uplifts in the Jiyang subbasin [50]. Geographically, thehighest thermal gradient occurs in the Dongying Depres-sion, followed by the Zhanhua and Huimin depressions,and the lowest in the Chezhen Depression [51]. Therefore,the threshold depth of hydrocarbon generation in the Don-gying Depression is shallower than other depressions.Within the Dongying Depression, current heat flow valuesin wells Liang-70 and Shi-115 are 65.2mW/m2 and59.5mW/m2, respectively [28]. While variable heat flow isa common phenomenon in the Bohai Bay Basin [52] andit occurs in the Dongying Depression, a uniform thermalgradient has been assumed with an average geothermal gra-dient of 36.0°C/km and a constant heat flow of 60mW/m2
[28] or an average geothermal gradient of 35.0°C/km and aconstant heat flow of 61mW/m2 [32] in practical applica-tions. Indeed, the assumption of a uniform geothermal gra-dient across the whole depression conflicts with theabovementioned observations.
Heat flow variation exerts a variable impact on the ther-mal evolution of organic matter in sedimentary basins [53].The Bohai Bay Basin was formed as a typical rift basin butwas modified by synchronous strike-slip deformation. Thestrike-slip of the Tanlu Fault began at the middle stage ofdeposition of the Shahejie Formation and reached its climaxduring deposition of the Dongying Formation, which exertssignificant impacts on the structural framework of the BohaiBay Basin [31, 54]. While the hydrothermal fluid interfer-ence is difficult to verify in the present study due to limiteddata availability, the heat transport along basement faultsduring the rift stage creates different thermal regimes in dif-ferent depressions. Higher thermal gradient in the DongyingDepression than other depressions in the Jiyang subbasin isdue to its relative shorter distance to the Tanlu Fault. The
dependence on the distance to the Tanlu Fault plays a rolewithin the Dongying Depression as well. Higher levels ofmaturity could be reached at the southern side of the Dongy-ing Depression than those at the northern side due to thevariable distance towards the Tanlu Fault. Well FY1 is situ-ated mostly close to the Tanlu Fault while well LY1 is locatedmostly away from the Tanlu Fault. Therefore, the samematurity level indicated by vitrinite reflectance and variousmolecular parameters in well FY1 is about 300m shallowerthan that in well NY1 and 500m shallower than that in wellLY1. Variable geothermal gradients rather than an overallaverage gradient should be used for the respective unit inter-vals. The variable hydrocarbon generation threshold depthsdefined by previous studies can partially be attributed to var-iable thermal gradients at different locations. Wide rangevariations of measured vitrinite reflectance (0.2–0.3%)within short burial depth (200–300m) may reflect eitherhydrothermal fluid interference or the transition from sup-pressed interval to the normal trend line [30]. Variablehydrocarbon generation thresholds illustrated by molecularcompositions and petrological measurement in the presentstudy provide a practical guideline for exploration perspec-tive within the Dongying Depression, especially shale oiland sweetspot assessment.
6. Conclusion
Core samples from the Eocene Shahejie Formation in wellsFY1, NY1, and LY1 of the Dongying Depression show sys-tematical burial depth-related maturity trends. The molecu-lar compositions derived from extractable organic matteryield internally consistent thermal maturity with vitrinitereflectance (%Ro). The measured Ro values lie in the range
3000
3100
3200
3300
3400
3500
3600
3700
3800
3900
0 0.2 0.4 0.6 0.8 1
Dep
th (m
)
0 200 400 600 0 1000 2000 3000
C20–21/ (C20+C21+C28)–TAS ΣMAS (μg/g EOM) ΣTAS (μg/g EOM)
(b) (c)(a)
FY1NY1LY1
Figure 13: Thermal evolution of mono- and triaromatic steroid hydrocarbons in the 3 studied wells. (a) C20−21/ðC20 + C21 + C28Þ − TAS. (b)Summed concentration of C27-C29 monoaromatic steroids. (c) Summed concentration of C26-C28 triaromatic steroids.
14 Geofluids

of 0.5–0.9%, indicating early mature to moderately matureconditions, while molecular ratios including hopane andsterane rearrangement, aromatic hydrocarbon isomerization,and steroid thermal cracking suggest a slightly higher matu-rity level. The same maturity appearance in well FY1 situatedat the southern side of the Dongying Depression is about300m shallower than that in well NY1 located at the middleof the depression and 500m shallower than that in well LY1located at the northern side of the depression. The variationin hydrocarbon generation threshold depth across the Don-gying Depression is caused by the different thermal regimesthat each well has experienced. The systematic variability ofmaturity with geographic position along the depression is adependence on the distance towards the Tanlu Fault frontin the south of the Dongying Depression. Sufficiently highheat flow in the southern side of the depression may haveimportant implications for the timing of hydrocarbon matu-ration and expulsion, particularly for the shale oil intervalwhere maturity plays a critical role for the mobility of oil.
Data Availability
Most data are already included in the text. More detailsregarding GC-MS raw data are avaiable upon request.
Conflicts of Interest
The authors declare that they have no conflicts of interest.
Acknowledgments
This study is supported by the National Natural ScienceFoundation of China (Grant Number 41873049). Prof. SteveLarter from University of Calgary and two anonymousreviewers are acknowledged for their constructive com-ments, which improve the quality of this manuscriptsubstantially.
References
[1] D. K. Baskin, “Atomic H/C ratio of kerogen as an estimate ofthermal maturity and organic matter conversion,” AAPG Bul-letin, vol. 81, pp. 1437–1450, 1997.
[2] A. S. Mackenzie, “Application of biological markers in petro-leum geochemistry,” in Advances in Petroleum GeochemistryI, J. Brooks and D. Welte, Eds., pp. 115–214, Academic Press,London, 1984.
[3] I. Atwah, S. Sweet, J. Pantano, and A. Knap, “Light hydrocar-bon geochemistry: insight into Mississippian crude oil sourcesfrom the Anadarko Basin, Oklahoma, USA,” Geofluids,vol. 2019, Article ID 2795017, 15 pages, 2019.
[4] R. Bertrand and Y. Heroux, “Chitinozoan, graptolite, and sco-lecodont reflectance as an alternative to vitrinite and pyrobitu-men reflectance in Ordovician and Silurian strata, AnticostiIsland, Quebec, Canada,” AAPG Bulletin, vol. 71, pp. 951–957, 1987.
[5] C. E. Barker and M. J. Pawlewicz, “Calculation of vitrinitereflectance from thermal histories and peak temperatures: acomparison of methods,” in Vitrinite Reflectance as a MaturityParameter, Applications and Limitations, P. K. Mukhopadhyay
and W. G. Dow, Eds., vol. 570, pp. 216–229, American Chem-ical Society Symposium Series, Washington, DC, 1994.
[6] J. J. Sweeney and A. K. Burnham, “Evaluation of a simplemodel of vitrinite reflectance based on chemical kinetics,”AAPG Bulletin, vol. 74, pp. 1559–1570, 1990.
[7] S. Jiang, Y. Zuo, M. Yang, and R. Feng, “Reconstruction of theCenozoic tectono-thermal history of the Dongpu Depression,Bohai Bay Basin, China: Constraints from apatite fission trackand vitrinite reflectance data,” Journal of Petroleum Scienceand Engineering, vol. 205, article 108809, 2021.
[8] S. Kumar and K. Ojha, “Reaction kinetic, maturity, burial andthermal histories modelling of cambay shale source rocks,Cambay Basin, Western India,” Journal of Petroleum Scienceand Engineering, vol. 202, article 108543, 2021.
[9] P. K. Mukhopadhyay, “Vitrinite reflectance as maturityparameter – petrographic and molecular characterizationand its applications to basin modeling,” in ACS SymposiumSeries, vol. 570, pp. 1–24, American Chemical Society, 1994.
[10] K. E. Peters, “Guidelines for evaluating petroleum source Rockusing programmed pyrolysis,” AAPG Bulletin, vol. 70,pp. 318–329, 1986.
[11] L. R. Snowdon, “Rock–Eval Tmax suppression: documenta-tion and amelioration,” AAPG Bulletin, vol. 79, pp. 1337–1348, 1995.
[12] Z. Chen, K. Dewing, D. P. Synnott, and X. Liu, “CorrectingTmax Suppression: a numerical model for removing adsorbedheavy oil and bitumen from upper Ordovician source rocks,Arctic Canada,” Energy & Fuels, vol. 33, no. 7, pp. 6234–6246, 2019.
[13] W. K. Seifert and J. M. Moldowan, “Use of biological markersin petroleum exploration,” in Biological Markers in the Sedi-mentary Record 24, Methods in Geochemistry and Geophysics,R. B. Johns, Ed., pp. 261–290, Elsevier, 1986.
[14] Q.Wang, H. Huang, Z. Li, and Z. X. Li, “Novel thermal maturityparameters derived from alkylbiphenyls and alkyldiphenyl-methanes,” Energy & Fuels, vol. 33, no. 9, pp. 8491–8502, 2019.
[15] D. W. Waples and T. Machihara, “Application of sterane andtriterpane biomarkers in petroleum exploration,” Bulletin ofCanadian Petroleum Geology, vol. 38, pp. 357–380, 1990.
[16] A. N. Bishop and G. D. Abbott, “Vitrinite reflectance andmolecular geochemistry of Jurassic sediments: the influenceof heating by Tertiary dykes (northwest Scotland),” OrganicGeochemistry, vol. 22, no. 1, pp. 165–177, 1995.
[17] P. Farrimond, A. Taylor, and N. Telnaes, “Biomarker maturityparameters: the role of generation and thermal degradation,”Organic Geochemistry, vol. 29, no. 5-7, pp. 1181–1197, 1998.
[18] C. He, H. Huang, Q. Wang, and Z. Li, “Correlation of maturityparameters derived fromMethylphenanthrenes and Methyldi-benzothiophenes in the carboniferous source rocks from Qai-dam Basin, NW China,” Geofluids, vol. 2019, Article ID5742902, 12 pages, 2019.
[19] J. M. Moldowan, P. Sundararaman, and M. Schoell, “Sensitiv-ity of biomarker properties to depositional environmentand/or source input in the Lower Toarcian of SW-Germany,”Organic Geochemistry, vol. 10, no. 4-6, pp. 915–926, 1986.
[20] H. Zhang, H. Huang, Z. Li, and M. Liu, “Impact of maturationon the validity of paleoenvironmental indicators: implicationfor discrimination of oil genetic types in lacustrine shale sys-tems,” Energy & Fuels, vol. 34, no. 6, pp. 6962–6973, 2020.
[21] G. W. van Graas, “Biomarker maturity parameters for highmaturities: Calibration of the working range up to the
15Geofluids

oil/condensate threshold,” Organic Geochemistry, vol. 16,no. 4-6, pp. 1025–1032, 1990.
[22] M. B. Allen, D. I. M. Macdonald, Z. Xun, S. J. Vincent, andC. Brouet-Menzies, “Early Cenozoic two-phase extension andlate Cenozoic thermal subsidence and inversion of the BohaiBasin, northern China,” Marine and Petroleum Geology,vol. 14, no. 7-8, pp. 951–972, 1997.
[23] B. Ma, Q. Hu, S. Yang et al., “Multiple approaches to quantify-ing the effective porosity of lacustrine shale oil reservoirs inBohai Bay Basin, East China,” Geofluids, vol. 2020, Article ID8856620, 13 pages, 2020.
[24] S. Li, X. Pang, M. Li, and Z. Jin, “Geochemistry of petroleumsystems in the Niuzhuang South Slope of Bohai Bay Basin–part 1: source rock characterization,” Organic Geochemistry,vol. 34, no. 3, pp. 389–412, 2003.
[25] Z. Shen, B. Yu, C. Bai, S. Han, and H. Liu, “Origin of bedding-parallel calcite veins from lacustrine shale in the Eocene Don-gying Depression, Bohai Bay Basin, China,” Geofluids,vol. 2020, Article ID 8883297, 23 pages, 2020.
[26] Z. Zhan, X. Lin, Y. Zou et al., “Chemometric differentiation ofcrude oil families in the southern Dongying Depression, BohaiBay Basin, China,” Organic Geochemistry, vol. 127, pp. 37–49,2019.
[27] X. Guo, S. He, K. Liu, G. Song, X. Wang, and Z. Shi, “Oil gen-eration as the dominant overpressure mechanism in the Ceno-zoic Dongying depression, Bohai Bay basin, China,” AAPGBulletin, vol. 94, no. 12, pp. 1859–1881, 2010.
[28] X. Guo, K. Liu, S. He et al., “Petroleum generation and chargehistory of the northern Dongying depression, Bohai Bay basin,China: insight from integrated fluid inclusion analysis andbasin modelling,” Marine and Petroleum Geology, vol. 32,no. 1, pp. 21–35, 2012.
[29] H. Ping, H. Chen, and G. Jia, “Petroleum accumulation in thedeeply buried reservoirs in the northern Dongying Depression,Bohai Bay Basin, China: new insights from fluid inclusions,natural gas geochemistry, and 1-D basin modeling,” Marineand Petroleum Geology, vol. 80, pp. 70–93, 2017.
[30] H. Ping, H. Chen, S. C. George, C. Li, and S. Hu, “Relationshipbetween the fluorescence colour of oil inclusions and thermalmaturity in the Dongying Depression, Bohai Bay Basin, China:part 2. Fluorescence evolution of oil in the context of petro-leum generation, expulsion and cracking under geological con-ditions,”Marine and PetroleumGeology, vol. 103, pp. 306–319,2019.
[31] P. Li, “Oil/gas distribution patterns in Dongying depression,Bohai Bay basin,” Journal of Petroleum Science and Engineer-ing, vol. 41, no. 1-3, pp. 57–66, 2004.
[32] C. Lampe, G. Song, L. Cong, and X. Mu, “Fault control onhydrocarbon migration and accumulation in the tertiary Don-gying depression, Bohai Basin, China,” AAPG Bulletin, vol. 96,no. 6, pp. 983–1000, 2012.
[33] D. Zhu, Z. Jin, W. Hu, Y. Song, and X. Gao, “Effect of igneousactivity on hydrocarbon source rocks in Jiyang sub-basin, east-ern China,” Journal of Petroleum Science and Engineering,vol. 59, no. 3-4, pp. 309–320, 2007.
[34] L. Zhang, Q. Liu, R. Zhu, Z. Li, and X. Lu, “Source rocks inMesozoic-Cenozoic continental rift basins, east China: a casefrom Dongying Depression, Bohai Bay Basin,” Organic Geo-chemistry, vol. 40, no. 2, pp. 229–242, 2009.
[35] H. Zhang, H. Huang, Z. Li, and M. Liu, “Oil physical status inlacustrine shale reservoirs - a case study on Eocene Shahejie
Formation shales, Dongying Depression, East China,” Fuel,vol. 257, p. 116027, 2019.
[36] H. Zhang, H. Huang, Z. Li, and M. Liu, “Comparative studybetween sequential solvent-extraction and multiple isothermalstages pyrolysis: a case study on Eocene Shahejie Formationshales, Dongying Depression, East China,” Fuel, vol. 263, arti-cle 116591, 2020.
[37] E. Lafargue, F. Marquis, and D. Pillot, “Rock–Eval 6 applica-tions in hydrocarbon exploration, production, and soil con-tamination studies,” Revue de l'institut Français du Pétrole,vol. 53, no. 4, pp. 421–437, 1998.
[38] B. P. Tissot, R. Pelet, and P. H. Ungerer, “Thermal history ofsedimentary basins, maturation indices, and kinetics of oil andgas generation,” AAPG Bulletin, vol. 71, pp. 1445–1466, 1987.
[39] X. Xie, M. Li, R. Littke et al., “Petrographic and geochemicalcharacterization of microfacies in a lacustrine shale oil systemin the Dongying Sag, Jiyang Depression, Bohai Bay Basin, east-ern China,” International Journal of Coal Geology, vol. 165,pp. 49–63, 2016.
[40] J. M. Moldowan, F. J. Fago, R. M. K. Carlson et al., “Rearrangedhopanes in sediments and petroleum,” Geochimica et Cosmo-chimica Acta, vol. 55, no. 11, pp. 3333–3353, 1991.
[41] M. Radke and D. H. Welte, “The methylphenanthrene index,MPI: a maturity parameter based on aromatic hydrocarbons,”in Advances in Organic Geochemistry 1981, M. Bjoroy, Ed.,pp. 504–512, Wiley, Chichester, UK, 1983.
[42] R. Alexander, R. I. Kagi, S. J. Rowland, P. N. Sheppard, andT. V. Chirila, “The effects of thermal maturity on distributionsof dimethylnaphthalenes and trimethylnaphthalenes in someancient sediments and petroleums,” Geochimica et Cosmochi-mica Acta, vol. 49, no. 2, pp. 385–395, 1985.
[43] M. Radke, “Application of aromatic compounds as maturityindicators in source rocks and crude oils,” Marine and Petro-leum Geology, vol. 5, no. 3, pp. 224–236, 1988.
[44] M. Radke, D. H. Welte, and H. Willsch, “Geochemical studyon a well in the Western Canada Basin: relation of the aro-matic distribution pattern to maturity of organic matter,” Geo-chimica et Cosmochimica Acta, vol. 46, no. 1, pp. 1–10, 1982.
[45] B. G. K. van Aarssen, T. P. Bastow, R. Alexander, and R. I.Kagi, “Distributions of methylated naphthalenes in crude oils:indicators of maturity, biodegradation and mixing,” OrganicGeochemistry, vol. 30, no. 10, pp. 1213–1227, 1999.
[46] M. Radke, D. H. Welte, and H. Willsch, “Maturity parametersbased on aromatic hydrocarbons: Influence of the organicmatter type,” Organic Geochemistry, vol. 10, no. 1-3, pp. 51–63, 1986.
[47] A. S. Mackenzie, C. F. Hoffmann, and J. R. Maxwell, “Molecu-lar parameters of maturation in the Toarcian shales, ParisBasin, France –III. Changes in aromatic steroid hydrocar-bons,” Geochimica et Cosmochimica Acta, vol. 45, no. 8,pp. 1345–1355, 1981.
[48] H. B. Lo, “Correction criteria for the suppression of vitrinitereflectance in hydrogen- rich kerogens: preliminary guide-lines,” Organic Geochemistry, vol. 20, no. 6, pp. 653–657, 1993.
[49] G. I. Unomah and C. M. Ekweozor, “Application of vitrinitereflectance in reconstruction of tectonic features in AnambraBasin, Nigeria: implication for petroleum potential,” AAPGBulletin, vol. 77, pp. 436–451, 1993.
[50] Y. Gong, L. Wang, and S. Liu, “Heat flow pattern of the JiyangDepression,” Science in China Series D-Earth Sciences, vol. 33,pp. 384–391, 2003.
16 Geofluids

[51] N. S. Qiu, X. G. Su, Z. Y. LI, Z. Q. Liu, and Z. Li, “The Cenozoictectono-thermal evolution of Jiyang Depression, Bohai BayBasin, East China,” Chinese Journal of Geophysics, vol. 49,no. 4, pp. 1015–1024, 2006.
[52] Y. Zuo, N. Qiu, Y. Zhang et al., “Geothermal regime andhydrocarbon kitchen evolution of the offshore Bohai Baybasin, North China,” AAPG Bulletin, vol. 95, no. 5, pp. 749–769, 2011.
[53] J. Teng, M. Mastalerz, B. Liu, T. Gognat, E. Hauser, andP. McLaughlin, “Variations of organic matter transformationin response to hydrothermal fluids: example from the Indianapart of the Illinois Basin,” International Journal of Coal Geol-ogy, vol. 219, article 103410, 2020.
[54] C. Teng, F. Hao, H. Zou, X. Zhou, and C. Xu, “Tan–Lu faultsystem and its significance in oil accumulation in the centralLiaodong Bay subbasin, Bohai Bay Basin, China,” AAPG Bulle-tin, vol. 100, no. 2, pp. 289–314, 2016.
17Geofluids