thermal performance of engineered assemblies thermal clips
TRANSCRIPT

Presented to: Engineered Assemblies 6535 Millcreek Drive, Unit 76 Mississauga, Ontario, L5N2M2
REPORT Report Number: 5123226.00 March 22, 2012
Thermal Performance of Engineered Assemblies Thermal Clips

TABLE OF CONTENTS
Page
1. INTRODUCTION 1
2. MODELING PROCEDURES 1
3. THERMAL ANALYSIS 1
3.1 Clear Field Thermal Performance 1
3.2 Slab Edge Linear Transmittance 2
3.3 Impact of Batt Insulation in Steel Stud Cavity 3
4. SENSITIVITY ANALYSIS 5
4.1 Insulation Type 5
4.2 Clip Spacing 6
5. BUILDING ENVELOPE REQUIREMENTS IN CANADA 7
6. CONCLUSION 10
APPENDIX A – CLIP SYSTEM DETAILS AND MATERIAL PROPERTIES A1
APPENDIX B – ASHRAE 1365-RP METHODOLOGY B1
APPENDIX C – EFFECTIVE ASSEMBLY R-VALUES C1
APPENDIX D – EXAMPLE SIMULATED TEMPERATURE DISTRIBUTION D1
- 1 -
1. INTRODUCTION
The Engineered Assemblies Thermal Clip System is an aluminum thermal clip system for attaching rain-screen cladding systems for steel stud wall assemblies with exterior insulation. Morrison Hershfield was contracted by Engineered Assemblies Inc. (E.A.I) to provide an overview of the energy codes in the major markets in Canada and evaluate the thermal performance of their thermal clip system for various scenarios.
The aluminum clips are connected to horizontal and vertical sub-girts that support rain-screen panel cladding. The clips are attached to a steel stud back-up wall. Thermal breaks are provided at the connection between the sub-girt and clips via a cork/neoprene pad and between the clips and exterior sheathing via an aerogel insulation pad. A summary of the components for the evaluated system follows and detailed drawings can be found in Appendix A.
2. MODELING PROCEDURES Modeling was done using the Nx software package from Siemens, which is a general purpose computer aided design (CAD) and finite element analysis (FEA) package. The thermal solver and modeling procedures utilized for this study were extensively calibrated and validated for ASHRAE Research Project 1365-RP “Thermal Performance of Building Envelope Details for Mid- and High-Rise Construction (1365-RP)1. The thermal transmittance (U-Value) or “effective R-value” was determined using the methodology presented in 1365-RP and is summarized in Appendix B.
3. THERMAL ANALYSIS
The following section provides U-Value results for both the clear field area and an assembly including a typical floor slab detail. For effective assembly R-Values please see Appendix C.
3.1 Clear Field Thermal Performance
Three clear field assemblies were evaluated; the T100, T125 and T150 clip systems, which accommodate 4”, 5”, and 6” of exterior insulation respectively. Drawings for these systems, including dimensions and material properties are shown in Appendix A.
Each of these systems was modeled for three vertical clip spacings and girt/sub girt arrangements as summarized in Table 1. The spacings are based on structural loading information provided by Engineered Assemblies Inc. Semi-rigid mineral wool, R-4.2 per inch (RSI-0.74 per 25 mm), was modeled outboard the exterior sheathing with 90 mm steel studs in the back-up wall spaced at 16” o.c.. A sensitivity analysis using other insulation types can be found in section 4 of this report. Table 2 shows the clear field U-values of the three clip systems and clip/girt spacing arrangements (Effective R-values are given in Table C.1). The horizontal spacing for the clips is always 16” o.c., since the clips are attached to the steel studs.
1 http://www.morrisonhershfield.com/ashrae1365research/Pages/Insights-Publications.aspx

- 2 -
Table 1: Horizontal Girt and Vertical Girt Spacing
Structural
Loading
Scenario
Vertical
Spacing of
Clips (Inches)
Horizontal Girt
Spacing (In)
Vertical Girt
Spacing
(Inches)
+/- 25 psf 48 48 23.5
+/- 35 psf 41 41 20.5
+/- 45 psf 34 34 17.5
Table 2: Clear Field Thermal Transmittance
Clip
System
Exterior
Insulation
Nominal R-
Value
hr·ft2·oF/BTU
(m2K/W)
Assembly U-Value
BTU/hr·ft2·oF (W/m2K)
34” Vertical
Clip Spacing
41” Vertical
Clip Spacing
48” Vertical
Clip Spacing
T100 16.8 (3.0) 0.061 (0.346) 0.059 (0.336) 0.058 (0.329)
T125 21.0 (3.7) 0.051 (0.288) 0.049 (0.278) 0.048 (0.272)
T150 25.2 (4.4) 0.044 (0.251) 0.042 (0.241) 0.041 (0.235)
The “effective R-value” of the clip systems are over 80% effective compared to the assembly nominal thermal resistance for all the clip systems. As with all systems with thermal bridging, the assembly is less effective with increasing insulation, but the diminishing returns is minor. The results show that increasing the vertical spacing from 34 to 48 inches results in no more than a 7% reduction in the U-value (R-1.7 gain).
The vertical girts were spaced at specific intervals as determined by the structural loading. However, the difference in positioning of the vertical girts between 15 to 25 inches for any of the scenarios has negligible effect on the overall thermal performance (less than 1%).
The temperature distribution for the T125 system at the horizontal sub-girt spaced at 41 inches is found in Appendix C. The absolute values are presented using temperature indices as defined in Appendix B.
3.2 Slab Edge Linear Transmittance
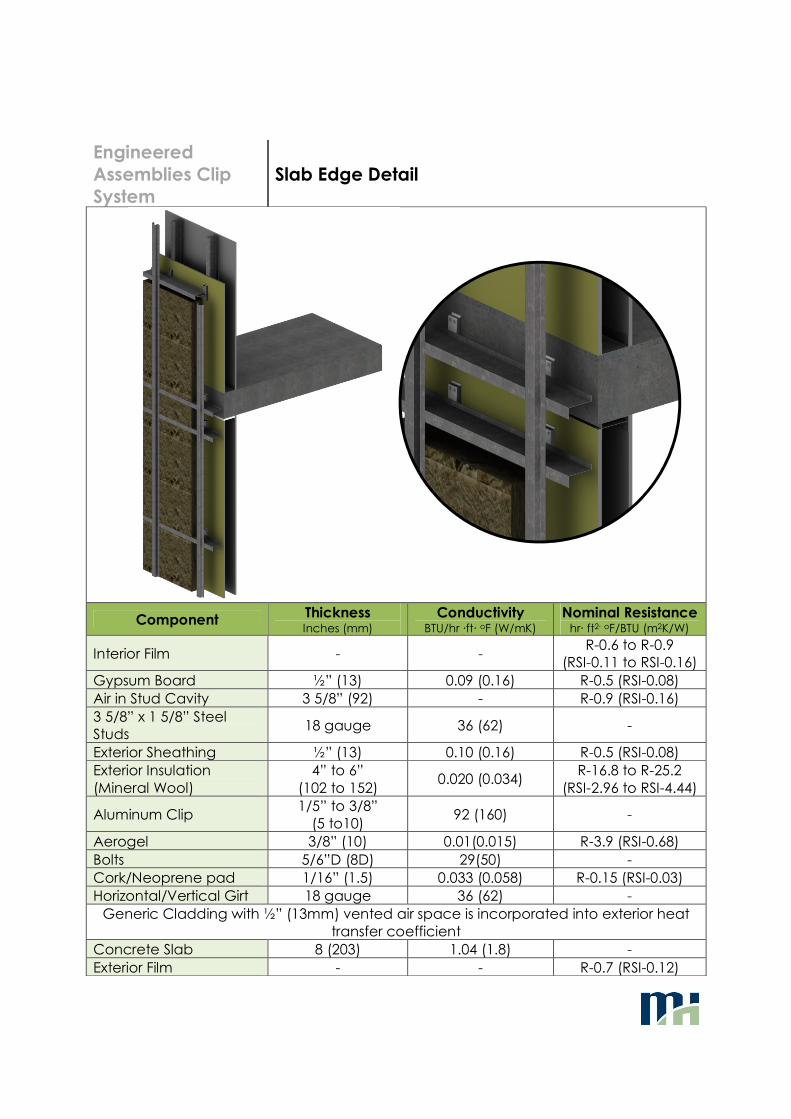
The slab edge detail evaluated for the thermal clip system has aluminum clips fastened to the slab and directly beneath the slab fastened to the steel stud wall. Drawings for this detail showing dimensions and material properties are found in Appendix A.
The slab edge detail was modeled in the same manner as the previous section for three clip/girt arrangements. Table 3 summarizes the thermal performance values for a 9 foot floor
- 3 -
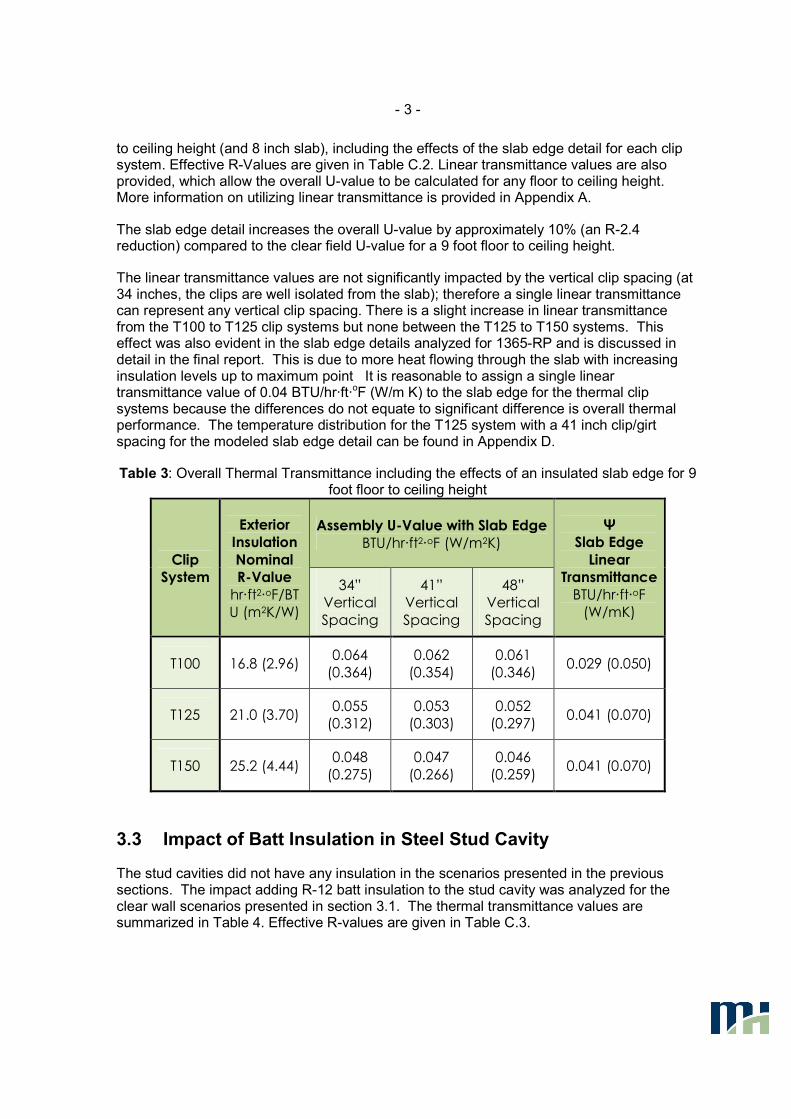
to ceiling height (and 8 inch slab), including the effects of the slab edge detail for each clip system. Effective R-Values are given in Table C.2. Linear transmittance values are also provided, which allow the overall U-value to be calculated for any floor to ceiling height. More information on utilizing linear transmittance is provided in Appendix A.
The slab edge detail increases the overall U-value by approximately 10% (an R-2.4 reduction) compared to the clear field U-value for a 9 foot floor to ceiling height.
The linear transmittance values are not significantly impacted by the vertical clip spacing (at 34 inches, the clips are well isolated from the slab); therefore a single linear transmittance can represent any vertical clip spacing. There is a slight increase in linear transmittance from the T100 to T125 clip systems but none between the T125 to T150 systems. This effect was also evident in the slab edge details analyzed for 1365-RP and is discussed in detail in the final report. This is due to more heat flowing through the slab with increasing insulation levels up to maximum point It is reasonable to assign a single linear transmittance value of 0.04 BTU/hr·ft·oF (W/m K) to the slab edge for the thermal clip systems because the differences do not equate to significant difference is overall thermal performance. The temperature distribution for the T125 system with a 41 inch clip/girt spacing for the modeled slab edge detail can be found in Appendix D.
Table 3: Overall Thermal Transmittance including the effects of an insulated slab edge for 9 foot floor to ceiling height
Clip
System
Exterior
Insulation
Nominal
R-Value
hr·ft2·oF/BT
U (m2K/W)
Assembly U-Value with Slab Edge
BTU/hr·ft2·oF (W/m2K)
ΨΨΨΨ Slab Edge
Linear
Transmittance
BTU/hr·ft·oF
(W/mK)
34”
Vertical
Spacing
41”
Vertical
Spacing
48”
Vertical
Spacing
T100 16.8 (2.96) 0.064
(0.364)
0.062
(0.354)
0.061
(0.346) 0.029 (0.050)
T125 21.0 (3.70) 0.055
(0.312)
0.053
(0.303)
0.052
(0.297) 0.041 (0.070)
T150 25.2 (4.44) 0.048
(0.275)
0.047
(0.266)
0.046
(0.259) 0.041 (0.070)
3.3 Impact of Batt Insulation in Steel Stud Cavity
The stud cavities did not have any insulation in the scenarios presented in the previous sections. The impact adding R-12 batt insulation to the stud cavity was analyzed for the clear wall scenarios presented in section 3.1. The thermal transmittance values are summarized in Table 4. Effective R-values are given in Table C.3.

- 4 -
Table 4: Clear Field Thermal Transmittance with Batt Insulation in the Stud Cavity
Clip
System
Exterior
Insulation
Nominal R-
Value
hr·ft2·oF/BTU
(m2K/W)
Assembly U-Value with interior
insulation
BTU/hr·ft2·oF (W/m2K)
34” Vertical
Spacing
41” Vertical
Spacing
48” Vertical
Spacing
T100 16.8 (2.96) 0.045
(0.258)
0.044
(0.253)
0.044
(0.249)
T125 21.0 (3.70) 0.040
(0.225)
0.039
(0.220)
0.038
(0.215)
T150 25.2 (4.44) 0.036
(0.202)
0.035
(0.196)
0.034
(0.191)
Adding batt insulation to the stud steel cavity is often considered for during the design based on design constraints (cost or overall thickness) to meet specific building envelope thermal transmittance targets. However, adding batt insulation in the stud cavity is not as effective as adding insulation to the exterior for a clip system and the condensation resistance of the assembly will be greatly reduced. Table 5 summarizes the temperature indices (see appendix B) for the three clip systems with and without batt insulation in the stud cavity for 41” clip spacing. The significance of this is that split insulated assemblies have marginal condensation resistance compared to fully exterior insulated assembly2. The temperature distribution profile for the T125 system with a 41 inch clip/girt spacing with R-12 batt insulation in the steel stud cavity is found in Appendix D.
Table 5: Minimum temperature indices for interior face of sheathing, with and without batt for 41” clip spacing
Clip
System
Without Batt
Insulation
With Batt
Insulation
T100 0.81 0.57
T125 0.83 0.64
T150 0.84 0.69
2 A thorough discussion on how to evaluate condensation resistance using temperature indices is available upon request

- 5 -
4. SENSITIVITY ANALYSIS
A sensitivity analysis of the modeled systems was performed to allow designers to interpolate the thermal performance values for others insulation levels and clip spacing.
4.1 Insulation Type
The base modeling assumed semi-rigid insulation (R 4.2 / inch) for the exterior insulation. Other conductivities were evaluated to allow the thermal transmittance values for the thermal clip system to be utilized for other types of insulation. In order to characterize the range of exterior insulation values, the modeled assemblies in section 3.1 were re-calculated using a low end of R-3.5 per inch (RSI-0.62 per inch) to a high end of R-6.5 per inch (RSI-1.14 per inch). Figure 1 shows the graphical results for effective assembly R-Value for a clip spacing of 41 inch for the varying R-per inch materials. The case of continuous exterior insulation as assumed in energy standard ASHRAE 90.1-2007 is also graphed as a reference.
Figure 1: Effective Assembly R-Value vs Nominal Insulation R-Value for a variety of insulation materials for 41 in clip spacing
The results show that the thickness of the insulation (and length of the clip) for a given nominal thermal resistance is largely independent of the effective R-value. Therefore, the results can be characterized by the R-value of the exterior insulation and can be applied to any material. The results from Table 2 can be re-arranged and additional R-values can be interpolated with the results from the sensitivity analysis. The U-value results are presented in Table 6. Effective R-Values are given in Table C.4.
0.0
5.0
10.0
15.0
20.0
25.0
30.0
35.0
40.0
45.0
0.0 10.0 20.0 30.0 40.0
Eff
ect
ive
Ass
em
bly
R-V
alu
e (
hr∙
ft2∙o
F/B
TU
)
Nominal R-Value of Exterior Insulation (hr∙ft2∙oF/BTU)
R-3.5 per inch R- 4.2 per inch
R- 6.5 per inch Continuous Insulation

- 6 -
As an example of how to use Table 6, look at a design that uses the T100 system with exterior sprayfoam and 41” clip spacing. 4” of sprayfoam (R-6.5 per inch) is equivalent to an exterior insulation nominal value of R-26 (RSI-4.58). Interpolating from Table 6 results in an assembly U-value of approximately U-0.042 (USI-0.237).
Table 6: Clip System Thermal Performance Per Exterior Insulation Level
Exterior
Insulation
Nominal R-
Value
hr·ft2·oF/BTU
(m2K/W)
Assembly U-Value
BTU/hr·ft2·oF (W/m2K)
34” Clip
Spacing
41” Clip
Spacing
48” Clip
Spacing
15 (2.64) 0.066 (0.373) 0.064 (0.363) 0.063 (0.356)
20 (3.52) 0.053 (0.300) 0.051 (0.291) 0.050 (0.284)
25 (4.40) 0.045 (0.254) 0.043 (0.244) 0.042 (0.238)
30 (5.28) 0.039 (0.221) 0.037 (0.212) 0.036 (0.206)
35 (6.16) 0.035 (0.198) 0.033 (0.189) 0.032 (0.183)
40 (7.04) 0.032 (0.180) 0.030 (0.171) 0.029 (0.165)
4.2 Clip Spacing
Several vertical clip spacing was analyzed for the T100 clip system for the base case of semi-rigid insulation with vertical spacing of the clips ranging from 27 to 55 inches. The U-value results are presented in Table 7. Effective R-values are given in Table C.5.
Table 7: T100 Clip Thermal Transmittance for Alternative Vertical Clip Spacing
Exterior
Insulation
Nominal R-
Value
hr·ft2·oF/BTU
(m2K/W)
Assembly U-Value
BTU/hr·ft2·oF (W/m2K)
27” Clip
Spacing
34” Clip
Spacing
41” Clip
Spacing
48” Clip
Spacing
55” Clip
Spacing
16.8 (2.96) 0.064
(0.365)
0.061
(0.346)
0.059
(0.336)
0.058
(0.329)
0.058
(0.329)
There is less than an R-2 difference in the effective R-value over the range of 27 in spacing to 55 in spacing. Increasing the spacing of the clips has a diminishing return and vertical clip spacing greater than 41 inches has a minimal impact.
- 7 -
5. BUILDING ENVELOPE REQUIREMENTS IN CANADA
For most provinces, the National Building Code of Canada is used as the basis for their respective building codes, with changes and implementations tailored for each province. For single family or low-rise (Part 9) buildings, provincial codes typically have their requirements for building envelope minimum insulation levels, however, for commercial or mid and high rise construction (non Part 9), many codes reference existing standards from national and international organizations. In regards to the building envelope, the most commonly referenced standards across Canada are ASHRAE 90.1 “Energy Standard for Buildings Except Low-Rise Residential Buildings” and the Model National Energy Code for Buildings
(MNECB) 1997. The National Energy Code for Buildings (NECB) 2011 has recently been issued to replace MNECB 1997; however it has not yet been adopted by any authority.
While these two standards differ in their specific requirements, they both employ three options for showing compliance: Prescriptive, Trade-off and Performance.
The prescriptive path awards compliance for explicitly meeting all provisions of the code relevant to the project in question. For the building envelope, assemblies must be lower than a given maximum thermal transmittance U-value or must meet or exceed insulation values in a prescribed assembly. These requirements can be based on climate region, building type/principal heating source and framing type, depending on the standard. The prescriptive path is widely used as it is fairly straight forward and building components need only be assessed individually. However, some of the prescriptive requirements may be difficult to achieve due to design trends. For example, in ASHRAE 90.1-2007, the prescriptive path requires a glazing to wall ratio of less than 40%. If these prescriptive requirements cannot be met, then another compliance path must be used.
The trade-off path allows for projects to trade-off the performance of building envelope components (i.e. roofs, walls, and windows) when the prescriptive requirements are not met for each and every item. With this approach, the performance of some envelope components may be lower than the prescribed values in the standard as long as other components exceed the requirements so that the overall building envelope is deemed to be equal or better than the standard. For example, this allows for low thermally performing walls if the roof sufficiently compensates above its prescriptive values. The trade-off method allows for some flexibility with the prescriptive values. This approach can be demonstrated using either specific calculations (provided in the standards) or through computer software that is typically provided by the authors of the standard.
The performance path requires an evaluation of the annual energy use of the whole building. This must be done using computer simulation, where the proposed building and its systems are modeled and compared to a compliance building. The compliance building contains the same shape, size, occupancy and scheduling of proposed building, but all of its systems and individual components meet the minimum requirements of the standard. For example, for the compliance building, the thermal performance of the walls of the compliance building must match the prescriptive U-values of the standard. The proposed design is acceptable if the annual energy use is less than or equal to that of the compliance building. Energy certification programs, such as Leadership in Energy and Environmental Design (LEED), have used MNECB and ASHRAE performance paths as this can allow for
- 8 -
much greater flexibility in design. The performance path takes into account other variables such as building orientation, higher efficiency HVAC systems and lighting controls, which would not give any benefit with the other two compliance paths. Each standard gives requirements that specify what can and cannot be included with the energy model and which energy modeling programs can be used.
The Ontario Building Code (OBC) contains a supplementary standard SB-10 to deal with energy in non-Part 9 buildings. As of January 1st, 2012, SB-10 incorporates ASHRAE 90.1-2010; however the prescriptive path is modified by including the values from ASHRAE 189.1 “Standard for the Design of High Performance, Green Buildings” for envelope requirements. For the performance path, compliance can be achieved by modeling energy savings 5% better than ASHRAE 90.1-2010, 25% better than MNECB 1997 or meeting ASHRAE 90.1-2010 modified by ASHRAE 189.1.
Currently, both the Alberta Building Code (ABC) and the Quebec Construction Code (CCQ) only have prescriptive values for minimum insulation levels in Part 9 buildings; however it does not contain any requirements for non Part 9 buildings. It is our understanding that both provinces are considering adopting NECB 2011 in order to assist in meeting their energy efficiency targets.
In British Columbia there are two governing documents. The majority of the province falls under the British Columbia Building Code (BCBC), while Vancouver follows the Vancouver Building Bylaw (VBBL). For non-Part 9 buildings, BCBC references ASHRAE 90.1-2004, while VBBL references the more recent ASHRAE 90.1-2007. The 90.1-2007 requirements are more stringent than 90.1-2004 (lower allowable glazing ratios, lower U-values, higher efficiency systems etc.), however the approach remains the same. Currently, there is debate whether BCBC should adopt a more recent ASHRAE 90.1 standard, either 2007 or 2010. If either case happens, VBBL will also update to 2010.
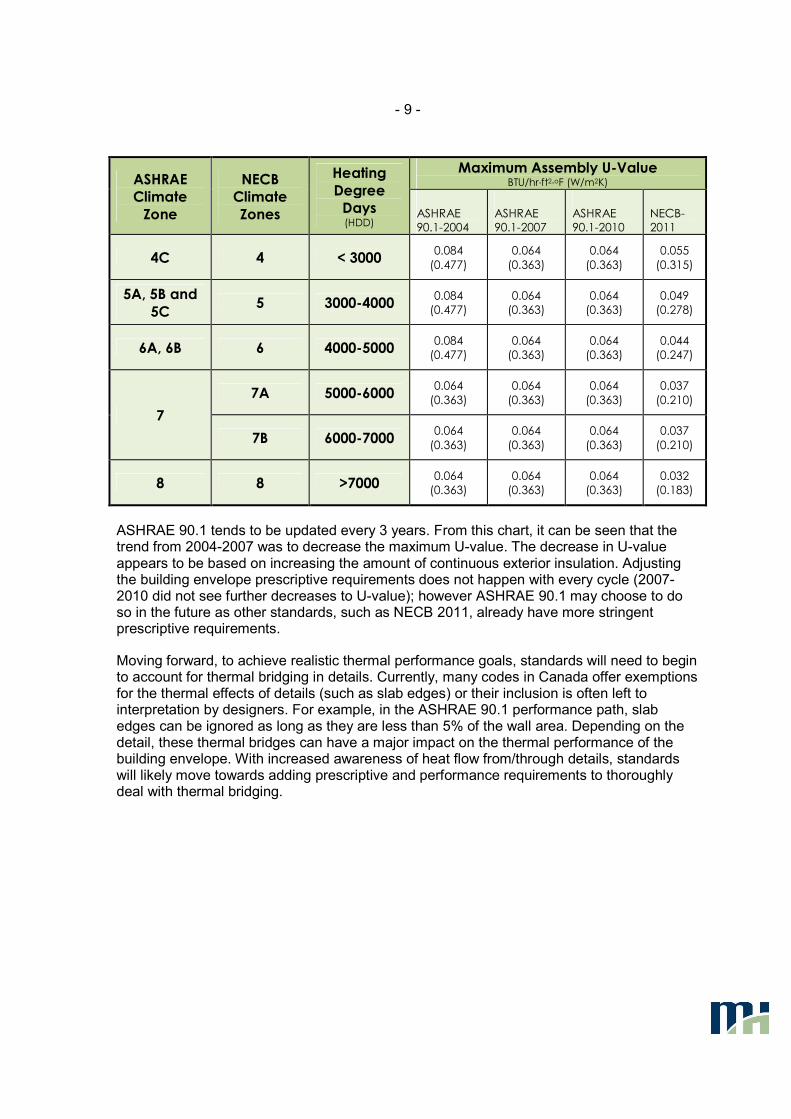
Below is a summary of the prescriptive wall assembly requirements from ASHRAE 90.1 2004, 2007 and 2010 for steel framed buildings along with wall assembly requirements from NECB 2011. Canadian climate zones in both ASHRAE and NECB are divided by heating degree days (HDD). NECB divides zones every 1000 HDD, however ASHRAE groups climate zones by 1000 or 2000 HDD. Both zone types are included.
- 9 -
ASHRAE
Climate
Zone
NECB
Climate
Zones
Heating
Degree
Days (HDD)
Maximum Assembly U-Value BTU/hr∙ft2∙oF (W/m2K)
ASHRAE
90.1-2004
ASHRAE
90.1-2007
ASHRAE
90.1-2010
NECB-
2011
4C 4 < 3000 0.084
(0.477)
0.064
(0.363)
0.064
(0.363)
0.055
(0.315)
5A, 5B and
5C 5 3000-4000
0.084
(0.477)
0.064
(0.363)
0.064
(0.363)
0.049
(0.278)
6A, 6B 6 4000-5000 0.084
(0.477)
0.064
(0.363)
0.064
(0.363)
0.044
(0.247)
7
7A 5000-6000 0.064
(0.363)
0.064
(0.363)
0.064
(0.363)
0.037
(0.210)
7B 6000-7000 0.064
(0.363)
0.064
(0.363)
0.064
(0.363)
0.037
(0.210)
8 8 >7000 0.064
(0.363)
0.064
(0.363)
0.064
(0.363)
0.032
(0.183)
ASHRAE 90.1 tends to be updated every 3 years. From this chart, it can be seen that the trend from 2004-2007 was to decrease the maximum U-value. The decrease in U-value appears to be based on increasing the amount of continuous exterior insulation. Adjusting the building envelope prescriptive requirements does not happen with every cycle (2007-2010 did not see further decreases to U-value); however ASHRAE 90.1 may choose to do so in the future as other standards, such as NECB 2011, already have more stringent prescriptive requirements.
Moving forward, to achieve realistic thermal performance goals, standards will need to begin to account for thermal bridging in details. Currently, many codes in Canada offer exemptions for the thermal effects of details (such as slab edges) or their inclusion is often left to interpretation by designers. For example, in the ASHRAE 90.1 performance path, slab edges can be ignored as long as they are less than 5% of the wall area. Depending on the detail, these thermal bridges can have a major impact on the thermal performance of the building envelope. With increased awareness of heat flow from/through details, standards will likely move towards adding prescriptive and performance requirements to thoroughly deal with thermal bridging.

- 10 -
6. CONCLUSION
From this report, the following conclusions can be made:
• For mineral wool insulation and the modeled thickness and clip spacing, the clip system assembly U-values range between 0.041 BTU/hr∙ft2∙oF - 0.061 BTU/hr∙ft2∙oF
(0.235 W/m2K - 0.346 W/m2K).
• With the inclusion of the proposed slab edge, the wall U-value is increased by, at most, 10% for the same range of clip size and spacing.
• With the inclusion of interior R-12 batt, the clear wall thermal resistance gains approximately an effective R-5.5.
• From the sensitivity analysis there is negligible effect of the insulation type on thermal resistance with the same the nominal R-value of the insulation. The results can be used for any type of insulation as long as the nominal R-value is known.
• The clip spacing has a small effect on the thermal performance under 41”. Higher than 41”, the increase in thermal resistance is minor.
In terms of code compliance, the values given in this report can be used with all three compliance paths. For designers who are concerned with energy efficiency, beyond compliance, or as building codes change to include thermal bridging in details, the slab edge transmittance provided will assist in calculating a more accurate thermal performance of the building envelope.
Morrison Hershfield
Neil Norris, M.A.Sc. Building Science Consultant
Patrick Roppel, P.Eng. Associate, Building Science Specialist
APPENDIX A – CLIP SYSTEM DETAILS AND
MATERIAL PROPERTIES

Engineered
Assemblies Clip
System
Clear Wall Assembly
Component Thickness Inches (mm)
Conductivity BTU/hr ·ft· oF (W/mK)
Nominal Resistance hr· ft2· oF/BTU (m2K/W)
Interior Film - - R-0.7 (RSI-0.12)
Gypsum Board ½” (13) 0.09 (0.16) R-0.5 (RSI-0.08)
Air in Stud Cavity 3 5/8” (92) - R-0.9 (RSI-0.16)
3 5/8” x 1 5/8” Steel
Studs 18 gauge 36 (62) -
Exterior Sheathing ½” (13) 0.10 (0.16) R-0.5 (RSI-0.08)
Exterior Insulation
(Mineral Wool)
4” to 6”
(102 to 152) 0.020 (0.034)
R-16.8 to R-25.2
(RSI-2.96 to RSI-4.44)
Aluminum Clip 1/5” to 3/8”
(5 to10) 92 (160) -
Aerogel 3/8” (10) 0.01(0.015) R-3.9 (RSI-0.68)
Bolts 5/6”D (8D) 29(50) -
Cork/Neoprene pad 1/16” (1.5) 0.033 (0.058) R-0.15 (RSI-0.03)
Horizontal/Vertical Girt 18 gauge 36 (62) -
Generic Cladding with ½” (13mm) vented air space is incorporated into exterior heat
transfer coefficient
Exterior Film - - R-0.7 (RSI-0.12)

Alternate Insulation Values
Component Thickness Inches (mm)
Conductivity BTU/hr ·ft· oF (W/mK)
Nominal Resistance hr· ft2· oF/BTU (m2K/W)
R-12 Batt Insulation 3 5/8” (92) 0.025 (0.044) R-12.0 (RSI-2.11)
EPS 4” to 6”
(102 to 152) 0.024 (0.041)
R-14.0 to R-21.0
(RSI-2.47 to RSI-3.70)
Sprayfoam 4” to 6”
(102 to 152) 0.013 (0.022)
R-26.0 to R-39.0
(RSI-4.58 to RSI-6.87)
Engineered
Assemblies Clip
System
Slab Edge Detail
Component Thickness Inches (mm)
Conductivity BTU/hr ·ft· oF (W/mK)
Nominal Resistance hr· ft2· oF/BTU (m2K/W)
Interior Film - - R-0.6 to R-0.9
(RSI-0.11 to RSI-0.16)
Gypsum Board ½” (13) 0.09 (0.16) R-0.5 (RSI-0.08)
Air in Stud Cavity 3 5/8” (92) - R-0.9 (RSI-0.16)
3 5/8” x 1 5/8” Steel
Studs 18 gauge 36 (62) -
Exterior Sheathing ½” (13) 0.10 (0.16) R-0.5 (RSI-0.08)
Exterior Insulation
(Mineral Wool)
4” to 6”
(102 to 152) 0.020 (0.034)
R-16.8 to R-25.2
(RSI-2.96 to RSI-4.44)
Aluminum Clip 1/5” to 3/8”
(5 to10) 92 (160) -
Aerogel 3/8” (10) 0.01(0.015) R-3.9 (RSI-0.68)
Bolts 5/6”D (8D) 29(50) -
Cork/Neoprene pad 1/16” (1.5) 0.033 (0.058) R-0.15 (RSI-0.03)
Horizontal/Vertical Girt 18 gauge 36 (62) -
Generic Cladding with ½” (13mm) vented air space is incorporated into exterior heat
transfer coefficient
Concrete Slab 8 (203) 1.04 (1.8) -
Exterior Film - - R-0.7 (RSI-0.12)
APPENDIX B – ASHRAE 1365-RP METHODOLOGY
B.1 General Modeling Approach
For this report, a steady-state conduction model was used. Air cavities were assumed to have an effective thermal conductivity which includes the effects of cavity convection. Interior/exterior air films were taken from Table 1, p. 26.1 of 2009 ASHRAE Handbook – Fundaments depending on surface orientation. From the calibration in 1365-RP, contact resistances between materials were modeled. The temperature difference between interior and exterior was modeled as a dimensionless temperature index between 0 and 1 (see Appendix B.3). These values, along with other modeling parameters, are given in ASHRAE 1365-RP, Chapter 5.
B.2 Thermal Transmittance
The methodology presented in ASHRAE 1365-RP separates the thermal performance of assemblies and details in order to simplify heat loss calculations. For the assemblies, a characteristic area is modeled and the heat flow through that area is found. To find the effects of thermal bridges in details (such as slab edges), the assembly is modeled with and without the detail. The difference in heat loss between the two models is then prescribed to that detail. This allows the thermal transmittances to be divided into three categories: clear field, linear and point transmittances.
The clear field transmittance is the heat flow from the wall or roof assembly, including uniformly distributed thermal bridges that are not practical to account for on an individual basis, such as structural framing, brick ties and cladding supports. This is treated the same as in standard practice, defined as a U-value, Uo (heat flow per area). For a specific area of opaque wall, this can be converted into an overall heat flow per temperature difference, Qo.
The linear transmittance is the additional heat flow caused by details that can be defined by a characteristic length, L. This includes slab edges, corners, parapets, and transitions between assemblies. The linear transmittance is a heat flow per length, and is represented by psi (Ψ).
The point transmittance is the heat flow caused by thermal bridges that occur only at single, infrequent locations. This includes building components such as pipe penetrations and intersections between linear details. The point transmittance is a single additive amount of heat, represented by chi (χ).
With these thermal quantities the overall heat flow can be found simple by adding all the components together, as given in equation 1.
oodgethermalbri QLQQQ
EQ 1
Equation 1 gives the overall heat flow for a given building size. For energy modeling, or comparisons to standards and codes, often it is more useful to present equation 1 as a heat flow per area. Knowing that the opaque wall area is Atotal, and U=Q/Atotal, equation 2 can be derived.
o
Total
UA
LU
EQ 2

Since the linear and point transmittances are simply added amounts of heat flow, they can be individually included or excluded depending on design requirements. The clear field analysis for R100, R125 and R150 clip systems is shown in Section 3.1. The linear transmittance analysis for the Engineered Assemblies clip system slab edge detail is shown in Section 3.2. For this report, no point transmittance details were analyzed.
B.2 Temperature Index
For condensation concerns, the thermal model can also provide surface temperatures of assembly components to help locate potential areas of risk. In order to be applicable for any climate (varying indoor and outdoor temperatures), the temperatures can been non-dimensionalized into a temperature index, Ti, as shown below in Equation 3.
EQ 3
The index is the ratio of the surface temperature relative to the interior and exterior temperatures. The temperature index has a value between 0 and 1, where 0 is the exterior temperature and 1 is the interior temperature. If Ti is known, Equation 3 can be rearranged for Tsurface.
Example temperature profiles for the assemblies and details modeled in this report are shown in Appendix C.
APPENDIX C – EFFECTIVE ASSEMBLY R-VALUES
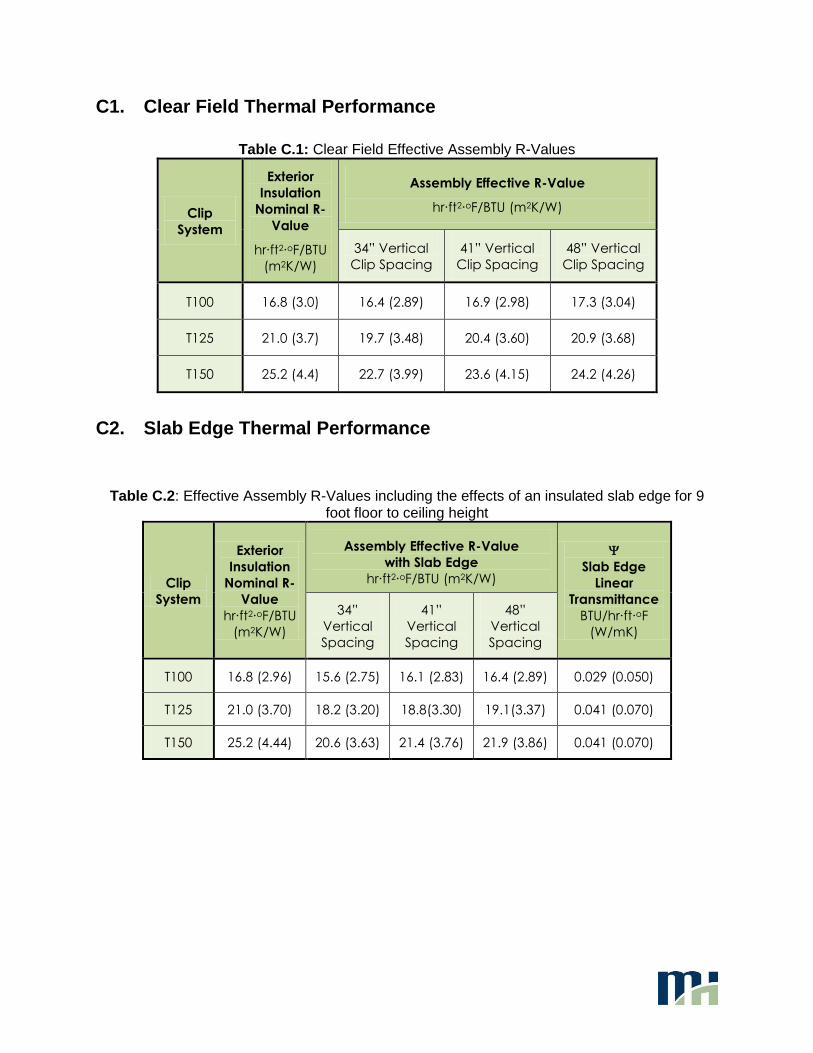
C1. Clear Field Thermal Performance
Table C.1: Clear Field Effective Assembly R-Values
Clip
System
Exterior
Insulation
Nominal R-
Value
hr∙ft2∙oF/BTU
(m2K/W)
Assembly Effective R-Value
hr∙ft2∙oF/BTU (m2K/W)
34” Vertical
Clip Spacing
41” Vertical
Clip Spacing
48” Vertical
Clip Spacing
T100 16.8 (3.0) 16.4 (2.89) 16.9 (2.98) 17.3 (3.04)
T125 21.0 (3.7) 19.7 (3.48) 20.4 (3.60) 20.9 (3.68)
T150 25.2 (4.4) 22.7 (3.99) 23.6 (4.15) 24.2 (4.26)
C2. Slab Edge Thermal Performance
Table C.2: Effective Assembly R-Values including the effects of an insulated slab edge for 9 foot floor to ceiling height
Clip
System
Exterior
Insulation
Nominal R-
Value
hr∙ft2∙oF/BTU
(m2K/W)
Assembly Effective R-Value
with Slab Edge
hr∙ft2∙oF/BTU (m2K/W)
Slab Edge
Linear
Transmittance
BTU/hr∙ft∙oF
(W/mK)
34”
Vertical
Spacing
41”
Vertical
Spacing
48”
Vertical
Spacing
T100 16.8 (2.96) 15.6 (2.75) 16.1 (2.83) 16.4 (2.89) 0.029 (0.050)
T125 21.0 (3.70) 18.2 (3.20) 18.8(3.30) 19.1(3.37) 0.041 (0.070)
T150 25.2 (4.44) 20.6 (3.63) 21.4 (3.76) 21.9 (3.86) 0.041 (0.070)

C3. Impact of Batt Insulation in Steel Stud Cavity
Table C.3: Clear Field Effective Assembly R-Values with Batt Insulation in the Stud Cavity
Clip
System
Exterior
Insulation
Nominal R-
Value
hr∙ft2∙oF/BTU
(m2K/W)
Assembly Effective R-Value
with interior insulation
hr∙ft2∙oF/BTU (m2K/W)
34” Vertical
Spacing
41” Vertical
Spacing
48” Vertical
Spacing
T100 16.8 (2.96) 22.0 (3.87) 22.5 (3.96) 22.8 (4.02)
T125 21.0 (3.70) 25.2 (4.44) 25.8 (4.55) 26.4 (4.65)
T150 25.2 (4.44) 28.1 (4.95) 28.9 (5.09) 29.7 (5.23)
C4. Sensitivity Analysis
Table C.4: Clip System Effective Assembly R-Value Per Exterior Insulation Level
Exterior
Insulation
Nominal R-
Value
hr∙ft2∙oF/BTU
(m2K/W)
Assembly Effective R-Value
hr∙ft2∙oF/BTU (m2K/W)
34” Clip
Spacing
41” Clip
Spacing
48” Clip
Spacing
15 (2.64) 15.2 (2.68) 15.7 (2.76) 16.0 (2.81)
20 (3.52) 18.9 (3.33) 19.5 (3.44) 20.0 (3.52)
25 (4.40) 22.4 (3.94) 23.2 (4.09) 23.8 (4.20)
30 (5.28) 25.6 (4.52) 26.8 (4.71) 27.5 (4.84)
35 (6.16) 28.7 (5.05) 30.1 (5.30) 31.0 (5.46)
40 (7.04) 31.5 (5.56) 33.2 (5.85) 34.3 (6.04)
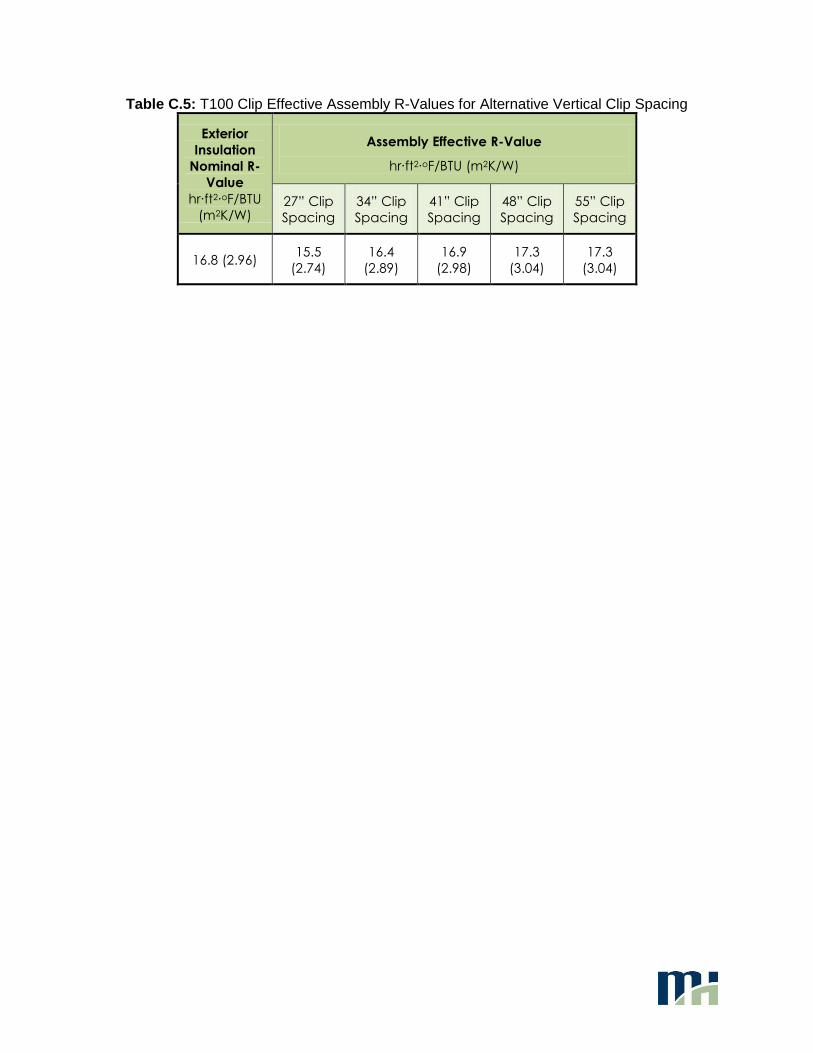
Table C.5: T100 Clip Effective Assembly R-Values for Alternative Vertical Clip Spacing
Exterior
Insulation
Nominal R-
Value
hr∙ft2∙oF/BTU
(m2K/W)
Assembly Effective R-Value
hr∙ft2∙oF/BTU (m2K/W)
27” Clip
Spacing
34” Clip
Spacing
41” Clip
Spacing
48” Clip
Spacing
55” Clip
Spacing
16.8 (2.96) 15.5
(2.74)
16.4
(2.89)
16.9
(2.98)
17.3
(3.04)
17.3
(3.04)

APPENDIX D – EXAMPLE SIMULATED TEMPERATURE DISTRIBUTION

Figure D1: Temperature profile for R125 clip system with clips spaced vertically at 41 inches
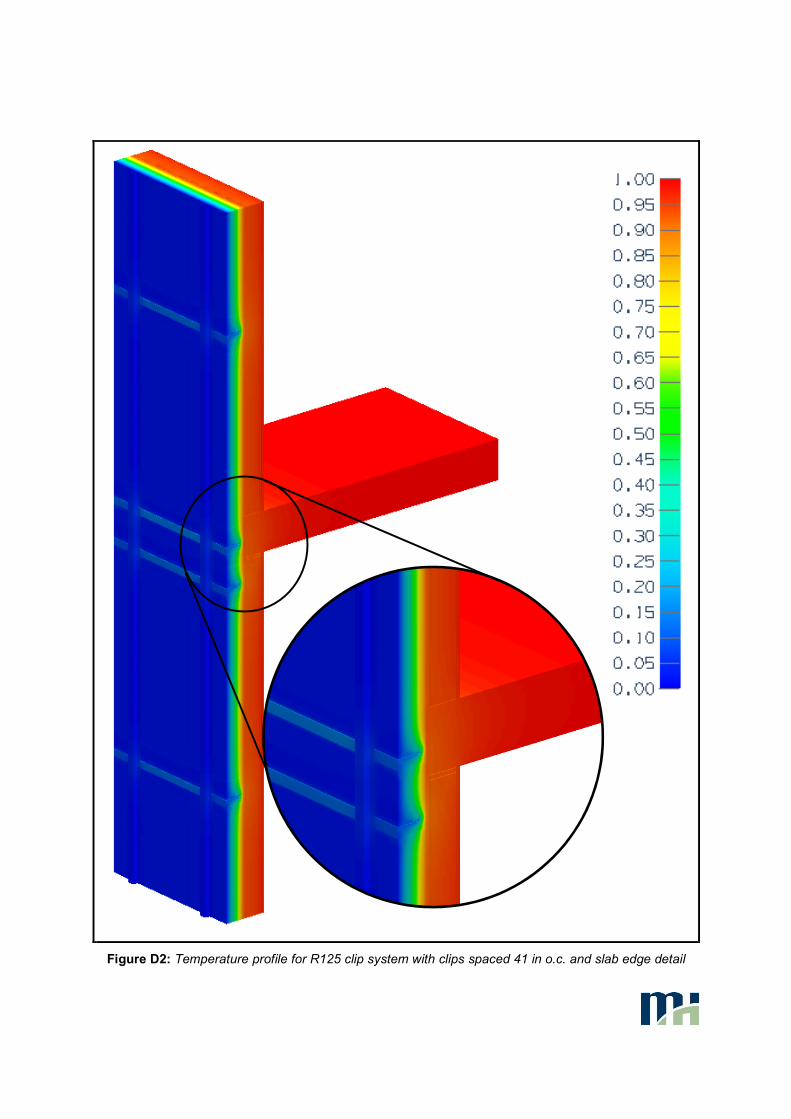
Figure D2: Temperature profile for R125 clip system with clips spaced 41 in o.c. and slab edge detail

Figure D3: Temperature Distribution for the R125 clip system with interior insulation and clips vertically
spaced at 41 inch.

Morrison Hershfield Suite 310, 4321 Still Creek Drive, Burnaby, BC V5C 6S7, Canada Tel 604 454 0402 | Fax 604 454 0403 | morrisonhershfield.com