thermo acoustic study of carbon nanotubes in near …sina.sharif.edu/~moosavi/jap_2015.pdf ·...
TRANSCRIPT

Thermo acoustic study of carbon nanotubes in near and far field: Theory, simulation,and experimentS. S. Asadzadeh, A. Moosavi, C. Huynh, and O. Saleki Citation: Journal of Applied Physics 117, 095101 (2015); doi: 10.1063/1.4914049 View online: http://dx.doi.org/10.1063/1.4914049 View Table of Contents: http://scitation.aip.org/content/aip/journal/jap/117/9?ver=pdfcov Published by the AIP Publishing Articles you may be interested in PECVD growth of carbon nanotubes: From experiment to simulation J. Vac. Sci. Technol. B 30, 030803 (2012); 10.1116/1.3702806 1/f noise, transport and percolation in carbon nanotube film field‐effect transistors: simulation and experiments AIP Conf. Proc. 1129, 85 (2009); 10.1063/1.3140564 Simulation studies of self-focusing carbon nanotube field emitter J. Vac. Sci. Technol. B 25, 484 (2007); 10.1116/1.2539586 Wave propagation of carbon nanotubes embedded in an elastic medium J. Appl. Phys. 97, 044307 (2005); 10.1063/1.1849823 Simulation study of carbon nanotube field emission display with under-gate and planar-gate structures J. Vac. Sci. Technol. B 22, 1244 (2004); 10.1116/1.1710488
[This article is copyrighted as indicated in the article. Reuse of AIP content is subject to the terms at: http://scitation.aip.org/termsconditions. Downloaded to ] IP:
81.31.178.57 On: Sat, 07 Mar 2015 07:13:37
Thermo acoustic study of carbon nanotubes in near and far field: Theory,simulation, and experiment
S. S. Asadzadeh,1 A. Moosavi,1,a) C. Huynh,2 and O. Saleki11Center of Excellence in Energy Conversion (CEEC), School of Mechanical Engineering,Sharif University of Technology, Azadi Avenue, P. O. Box 11365-9567, Tehran, Iran2CSIRO Materials Science and Engineering, Bayview Ave, Clayton Vic 3168, Australia
(Received 9 December 2014; accepted 22 February 2015; published online 6 March 2015)
Carbon nanotube webs exhibit interesting properties when used as thermo-acoustic projectors. This
work studies thermo-acoustic effect of these sound sources both in near and far field regions. Based
on two alternative forms of the energy equation, we have developed a straightforward formula for
calculation of pressure field, which is consistent with experimental data in far field. Also we have
solved full 3-D governing equations using numerical methods. Our three-dimensional simulation
and experimental data show pressure waves are highly affected by dimensions of sound sources
in near field due to interference effects. However, generation of sound waves in far field is
independent of projectors area surface. Energy analysis for free standing Thermo-Acoustic (TA)
sound sources show that aerogel TA sound sources like CNT based projectors could act more
efficiently compared to the other sources in delivering more than 75% of alternative input energy
to the medium gas up to a frequency of 1 MHz. VC 2015 AIP Publishing LLC.
[http://dx.doi.org/10.1063/1.4914049]
I. INTRODUCTION
Thermo-acoustic effect for sound generation has been
known for near a century. In 1917, Arnold and Crandall1
examined 700 nm platinum foils and observed as alternative
electrical current passes through the foil, a weak sound
would be generated. They correctly attributed this phenom-
enon to the small Heat Capacity Per Unit Area (HCPUA) of
Pl foils and their ability to rapidly conduct heat to the
medium; and concluded if the HCPUA of sound source is
too small, alternative current results in a periodic tempera-
ture oscillation in near medium and consequently a periodic
pressure wave. Using Super-aligned Carbon Nanotube with
ultra small HCPUA,2 Xiao et al.3 reported that these CNTs
are able to produce sound in wideband frequencies and also
in underwater, as reported by Aliev et al.4 Thermo acoustic
effect has also been observed in other materials with ultra
small HCPUA.5–9 By making different kind of super-aligned
CNTs, Suziki et al.10 examined sound generation of CNTs
from a structural web morphology viewpoint and reported no
change in sound intensity. It has been reported lower heat
capacity of medium11,12 and encapsulating CNTs based
source13 could increase sound intensity of these sources.
Theories developed in the field of thermo acoustic
mostly tried to solve coupled temperature and pressure equa-
tions for one dimensional planar or spherical on substrate
sources14–16 and arbitrary source taking advantages of point
sources.17 Some have used temperature variations of either
sound source or medium in one dimensional domain
and then have ascribed the pressure to the temperature
variations,1,3 which requires some assumptions and
simplifications.
In the present study, to avoid dealing with difficulty of
solving governing equations for the Thermo-Acoustic (TA)
source and medium fluid at the same time, sound generation
of source is considered as two parts: first, neglecting heat
capacity of heat source and based on two alternative forms
of energy equation, we derive a straightforward differential
equation which, in contrast with other theories, is decoupled
from temperature variations and directly relates pressure to
the heat delivered to the fluid. Thus, no assumption is needed
to relate temperature variation to the pressure variations.
Using this equation, a formula is derived for sound genera-
tion of small TA projectors as a function of energy received
by fluid. Then, applying energy balance and considering
temperature distribution in finite TA source and medium
fluid, another formula for energy delivered to the fluid as a
function of input energy is calculated. This formula takes
into account contribution of sound source in conducting heat
to the medium fluid. Combining these two formulas, an ana-
lytical model is derived for TA sound sources, which could
accurately predict sound pressure in far field. In addition,
analyzing the portion of energy delivered to the fluid at dif-
ferent frequency shows CNT based sound sources are nearly
perfect materials because of their aerogel nature as well as
their ultra small HCPUA, for TA sound generation up to
1 MHz frequency domain which could open their usage in
ultrasonic devices for industrial and medical applications
like non-destructive testing, drug delivery, and eye surgery.
Although reaching an analytical solution for 3-D gov-
erning equations are difficult and, to the best of our knowl-
edge, no attempt to solve these equations has been reported,
herein, we solved these equations numerically by finite dif-
ference method and obtained pressure field in near and far
field regions for different sizes of sound sources at different
frequencies. Simulation results for different sound projectorsa)Email: [email protected]
0021-8979/2015/117(9)/095101/9/$30.00 VC 2015 AIP Publishing LLC117, 095101-1
JOURNAL OF APPLIED PHYSICS 117, 095101 (2015)
[This article is copyrighted as indicated in the article. Reuse of AIP content is subject to the terms at: http://scitation.aip.org/termsconditions. Downloaded to ] IP:
81.31.178.57 On: Sat, 07 Mar 2015 07:13:37
show that sound pressure in near field is extremely depend-
ent on the size of TA source and sound frequency.
Experimental measurements using CNT sheets are conducted
to verify theoretical and simulation results.
The remainder of the research is organized as follows:
Section II develops a theory which is applicable for calcula-
tion of pressure in far field. In Sec. III, the numerical method
is illustrated. Section IV describes experimental setup.
Section V presents theoretical, numerical, and experimental
results and discusses the findings. This paper ends in Sec. V
by proper conclusions.
II. THEORY
Sound generation of a TA source could be considered as
two parts:18 ability of sound source in conducting heat to the
medium gas and pressure variation of medium due to this
periodic heat. First, we deal with pressure variation as a
function of periodic heat delivered to the medium. Because
pressure field emitted from an arbitrary source is highly
affected by its dimensions, here we consider a point source
which its result is applicable for a general source in far field.
However, to calculate the ability of sound source in deliver-
ing heat to medium, we take into account TA source shape.
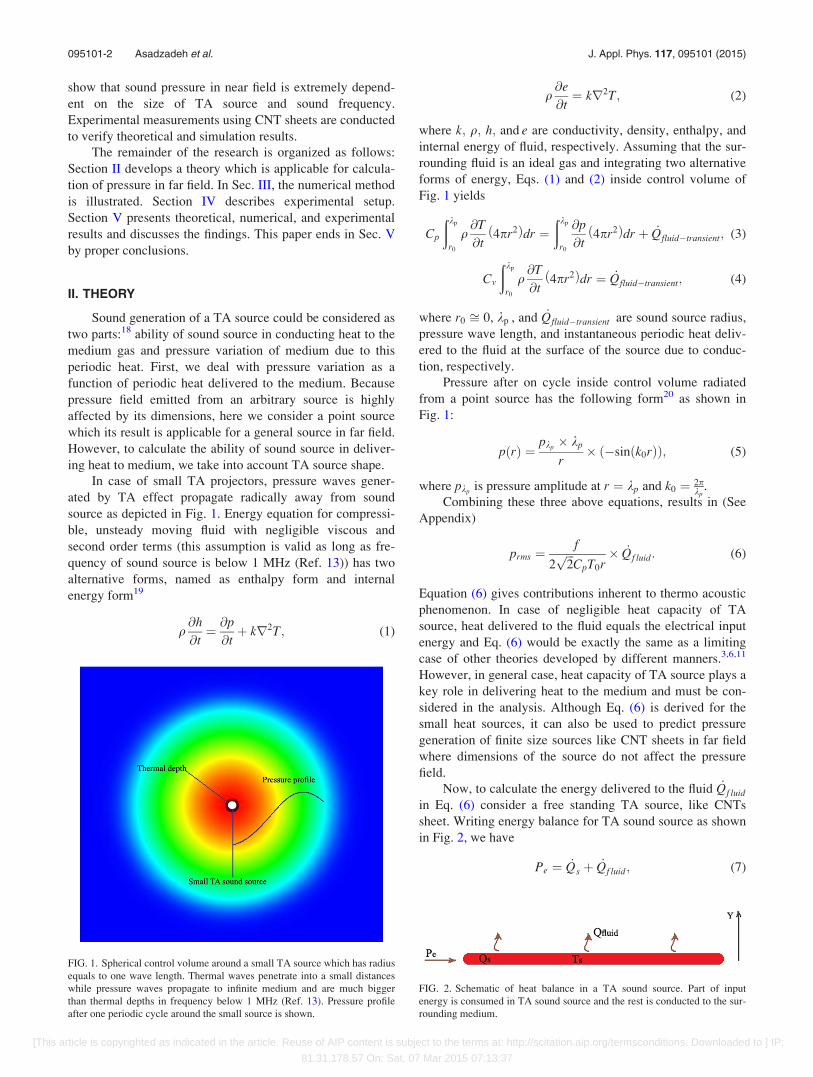
In case of small TA projectors, pressure waves gener-
ated by TA effect propagate radically away from sound
source as depicted in Fig. 1. Energy equation for compressi-
ble, unsteady moving fluid with negligible viscous and
second order terms (this assumption is valid as long as fre-
quency of sound source is below 1 MHz (Ref. 13)) has two
alternative forms, named as enthalpy form and internal
energy form19
q@h
@t¼ @p
@tþ kr2T; (1)
q@e
@t¼ kr2T; (2)
where k; q; h; and e are conductivity, density, enthalpy, and
internal energy of fluid, respectively. Assuming that the sur-
rounding fluid is an ideal gas and integrating two alternative
forms of energy, Eqs. (1) and (2) inside control volume of
Fig. 1 yields
Cp
ðkp
r0
q@T
@t4pr2ð Þdr ¼
ðkp
r0
@p
@t4pr2ð Þdr þ _Qfluid�transient; (3)
Cv
ðkp
r0
q@T
@t4pr2ð Þdr ¼ _Qfluid�transient; (4)
where r0 ffi 0, kp , and _Qfluid�transient are sound source radius,
pressure wave length, and instantaneous periodic heat deliv-
ered to the fluid at the surface of the source due to conduc-
tion, respectively.
Pressure after on cycle inside control volume radiated
from a point source has the following form20 as shown in
Fig. 1:
p rð Þ ¼pkp� kp
r� �sin k0rð Þð Þ; (5)
where pkpis pressure amplitude at r ¼ kp and k0 ¼ 2p
kp.
Combining these three above equations, results in (See
Appendix)
prms ¼f
2ffiffiffi2p
CpT0r� _Qf luid: (6)
Equation (6) gives contributions inherent to thermo acoustic
phenomenon. In case of negligible heat capacity of TA
source, heat delivered to the fluid equals the electrical input
energy and Eq. (6) would be exactly the same as a limiting
case of other theories developed by different manners.3,6,11
However, in general case, heat capacity of TA source plays a
key role in delivering heat to the medium and must be con-
sidered in the analysis. Although Eq. (6) is derived for the
small heat sources, it can also be used to predict pressure
generation of finite size sources like CNT sheets in far field
where dimensions of the source do not affect the pressure
field.
Now, to calculate the energy delivered to the fluid _Qf luid
in Eq. (6) consider a free standing TA source, like CNTs
sheet. Writing energy balance for TA sound source as shown
in Fig. 2, we have
Pe ¼ _Qs þ _Qf luid; (7)
FIG. 1. Spherical control volume around a small TA source which has radius
equals to one wave length. Thermal waves penetrate into a small distances
while pressure waves propagate to infinite medium and are much bigger
than thermal depths in frequency below 1 MHz (Ref. 13). Pressure profile
after one periodic cycle around the small source is shown.
FIG. 2. Schematic of heat balance in a TA sound source. Part of input
energy is consumed in TA sound source and the rest is conducted to the sur-
rounding medium.
095101-2 Asadzadeh et al. J. Appl. Phys. 117, 095101 (2015)
[This article is copyrighted as indicated in the article. Reuse of AIP content is subject to the terms at: http://scitation.aip.org/termsconditions. Downloaded to ] IP:
81.31.178.57 On: Sat, 07 Mar 2015 07:13:37

where _Pe and _Qs are electrical power input and heat con-
sumed in sound source, respectively.
Equation (7) states that part of the input energy is con-
sumed by the sound source as _Qs and the rest is conducted to
the adjacent fluid as _Qf luid which contribute in thermo-
acoustic effect.
In case of thin sound sources like CNT sheet, temperature
across the source is assumed to be uniform and one direc-
tional (this assumption is true for sources like CNTs sheet
which CNTs are uniformly distributed inside the sheet.).
Internal form of energy Eq. (2) in one dimensional form is
qCv@T
@t¼ k
@2T
@y2; (8)
T ¼ Ts ¼ T0 sinðxtÞ at y ¼ 0 ðB:CÞ; (9)
where Ts and T0 are temperature and amplitude of tempera-
ture in TA sound source. Alternative input energy leads to a
periodic temperature variation of source as a boundary con-
dition. Solution of Eq. (8) is21
T ¼ T0 expð�k1yÞ � sinðxt� k1yÞ; (10)
where k1 ¼ffiffiffiffiffiffiffiffiqCvx
2k
q¼
ffiffiffiffipfav
qand av ¼ k
qCv. Now, having tem-
perature distribution in fluid we can calculate _Qf luid and _Qs.
By substituting them in Eq. (7), energy reached to the fluid is
calculated (See Appendix)
_Qfluid aerogel ¼1
1þ HCPUA
qCvf luid
ffiffiffiffiffiffiffi2av
pf
rþ dsf
! :Pe: (11)
In the above equation, _Qfluid aerogel is for general case where
sound source has thickness of dsf with aerogel nature like
CNTs sheet sources. For non-aerogel sound sources dsf van-
ishes in above equation. Note the above equation is expressed
as thermal diffusivity and specific heat capacity at constant
volume for the medium gas. Equation (11) measures ability
of TA source in delivering heat to the surrounding fluid.
Now substituting value of _Qf luid from Eq. (11) in
Eq. (6), pressure value can be expressed as
prms ¼1
1þ HCPUA
qCvf luid
ffiffiffiffiffiffiffi2av
pf
rþ dsf
! :f
2ffiffiffi2p
CpT0r:Pe
" #: (12)
Equation (12) explicitly separates the contributions inherent
to thermo-acoustics (terms inside brackets) and those specific
to the sound source (first term in above equation) where
combining these two effects together gives sound generation
of TA sources.
III. NUMERICAL
Consider a TA sound source is producing sound in open
space. Figure 3 shows schematic of propagation of sound
from this sound source in one eighth of space. Governing
equations for thermo-acoustic effect, in addition of energy
equation (1) and equation of state ðP ¼ qRTÞ, are continuity
and momentum equations for compressible, unsteady mov-
ing fluid with negligible viscous and second order terms19
DqDtþ qr:V ¼ 0; (13)
qDV
Dt¼ �rP: (14)
With the following boundary conditions:
qgen ¼ _Qfluid aerogel at y ¼ 0; (15)
p ¼ psur ¼ cte at r !1: (16)
Note that taking advantages of Eq. (11), we could avoid
modeling of carbon nanotube sheet which is composed of
many Multi Wall Carbon Nanotubes (MWCNTs).
Microscopic picture of these webs shows that these sheets
are approximately 90% porous, that is, only about 10% of
the volume of this aerogel sheet is occupied by CNTs and
the CNT sheet is impregnated with surrounding fluid. So we
can assume periodic heat is generated within a rectangular
cubic of fluid with height of 20 lm. The only effect of CNTs
is that they consume a portion of input electrical energy
because of their heat capacity which Eq. (11) accounts for
this energy wasted at TA source. Equation (15) shows this
heat generation as a boundary condition at y¼ 0.
Using second order finite difference method for time
and spatial derivatives, governing Eqs. (1), (13), and (14) are
solved in a cubic domain in which the pressure waves are
propagated. Because of rectangular shape Of TA sound
source in this problem, here instead of using sphere domain
around TA sound source, a cubic domain is used to avoid
high skewness of meshes. For a rectangular cubic TA source
inserted in open space (Fig. 3), the domain of solution is
symmetric respect to the x-y, x-z, and y-z planes.
Consequently, three symmetry boundary conditions are used
FIG. 3. Schematic of propagation of waves from a TA sound source in
eighth of space. Sound generation is symmetric respected to the x-y, x-z, and
y-z planes.
095101-3 Asadzadeh et al. J. Appl. Phys. 117, 095101 (2015)
[This article is copyrighted as indicated in the article. Reuse of AIP content is subject to the terms at: http://scitation.aip.org/termsconditions. Downloaded to ] IP:
81.31.178.57 On: Sat, 07 Mar 2015 07:13:37
which lead to a domain size of one eighth of the main
domain size. To satisfy boundary condition stated in
Eq. (16), a constant pressure (ambient pressure) is considered
on outer surfaces of the domain. Note that here dimensions
of solution are big enough where waves do not reach outer
surfaces during solution. In vicinity of TA source where ther-
mal waves are generated, size of grids is kT=32 and in the
rest of the domain where pressure waves are propagated,
sizes of grid is kp=16 where kT and kp are thermal and pres-
sure wave length, respectively.21
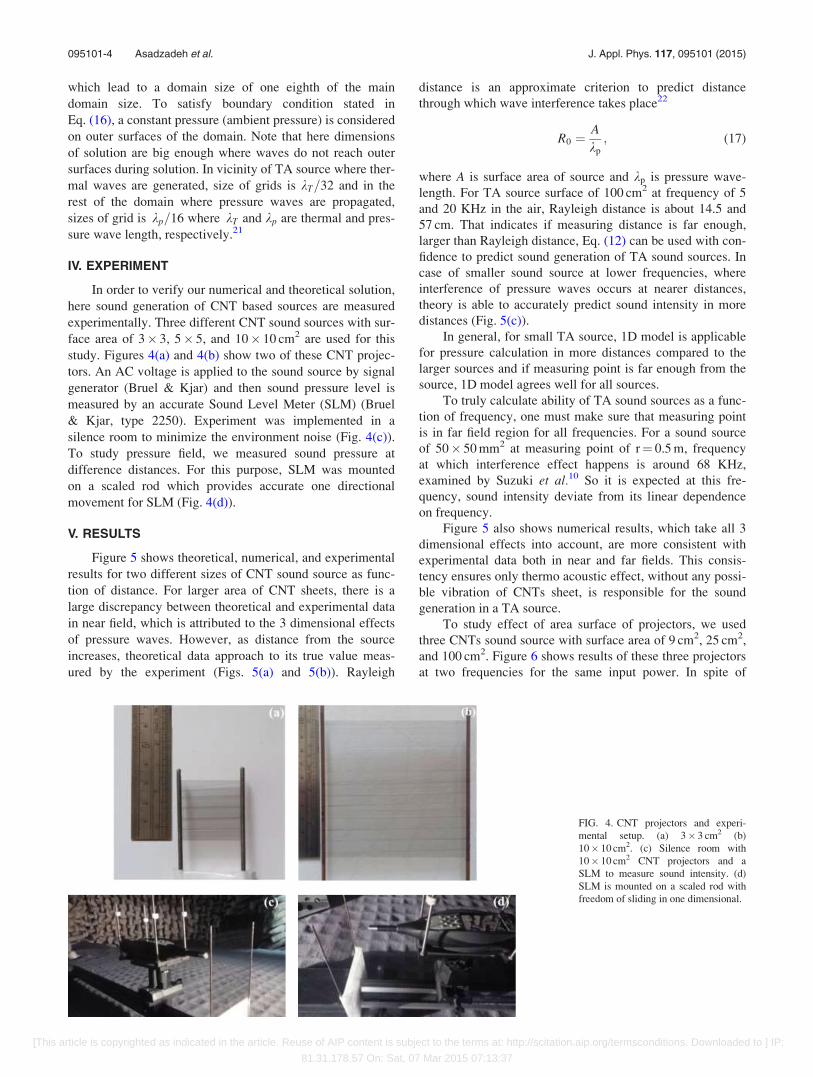
IV. EXPERIMENT
In order to verify our numerical and theoretical solution,
here sound generation of CNT based sources are measured
experimentally. Three different CNT sound sources with sur-
face area of 3� 3, 5� 5, and 10� 10 cm2 are used for this
study. Figures 4(a) and 4(b) show two of these CNT projec-
tors. An AC voltage is applied to the sound source by signal
generator (Bruel & Kjar) and then sound pressure level is
measured by an accurate Sound Level Meter (SLM) (Bruel
& Kjar, type 2250). Experiment was implemented in a
silence room to minimize the environment noise (Fig. 4(c)).
To study pressure field, we measured sound pressure at
difference distances. For this purpose, SLM was mounted
on a scaled rod which provides accurate one directional
movement for SLM (Fig. 4(d)).
V. RESULTS
Figure 5 shows theoretical, numerical, and experimental
results for two different sizes of CNT sound source as func-
tion of distance. For larger area of CNT sheets, there is a
large discrepancy between theoretical and experimental data
in near field, which is attributed to the 3 dimensional effects
of pressure waves. However, as distance from the source
increases, theoretical data approach to its true value meas-
ured by the experiment (Figs. 5(a) and 5(b)). Rayleigh
distance is an approximate criterion to predict distance
through which wave interference takes place22
R0 ¼A
kp
; (17)
where A is surface area of source and kp is pressure wave-
length. For TA source surface of 100 cm2 at frequency of 5
and 20 KHz in the air, Rayleigh distance is about 14.5 and
57 cm. That indicates if measuring distance is far enough,
larger than Rayleigh distance, Eq. (12) can be used with con-
fidence to predict sound generation of TA sound sources. In
case of smaller sound source at lower frequencies, where
interference of pressure waves occurs at nearer distances,
theory is able to accurately predict sound intensity in more
distances (Fig. 5(c)).
In general, for small TA source, 1D model is applicable
for pressure calculation in more distances compared to the
larger sources and if measuring point is far enough from the
source, 1D model agrees well for all sources.
To truly calculate ability of TA sound sources as a func-
tion of frequency, one must make sure that measuring point
is in far field region for all frequencies. For a sound source
of 50� 50 mm2 at measuring point of r¼ 0.5 m, frequency
at which interference effect happens is around 68 KHz,
examined by Suzuki et al.10 So it is expected at this fre-
quency, sound intensity deviate from its linear dependence
on frequency.
Figure 5 also shows numerical results, which take all 3
dimensional effects into account, are more consistent with
experimental data both in near and far fields. This consis-
tency ensures only thermo acoustic effect, without any possi-
ble vibration of CNTs sheet, is responsible for the sound
generation in a TA source.
To study effect of area surface of projectors, we used
three CNTs sound source with surface area of 9 cm2, 25 cm2,
and 100 cm2. Figure 6 shows results of these three projectors
at two frequencies for the same input power. In spite of
FIG. 4. CNT projectors and experi-
mental setup. (a) 3� 3 cm2 (b)
10� 10 cm2. (c) Silence room with
10� 10 cm2 CNT projectors and a
SLM to measure sound intensity. (d)
SLM is mounted on a scaled rod with
freedom of sliding in one dimensional.
095101-4 Asadzadeh et al. J. Appl. Phys. 117, 095101 (2015)
[This article is copyrighted as indicated in the article. Reuse of AIP content is subject to the terms at: http://scitation.aip.org/termsconditions. Downloaded to ] IP:
81.31.178.57 On: Sat, 07 Mar 2015 07:13:37

different pressure amplitude in the near field, sound pressure
in the far field for these three sources reach to the same
amount. This means that using large surface area projectors
does not affect pressure amplitude in the far field. However,
maximum input power applied per unit area of these sound
projectors (about 50 kw/m2 for one layer CNTs sheet3) is a
barrier to reach small size TA sources especially at high-
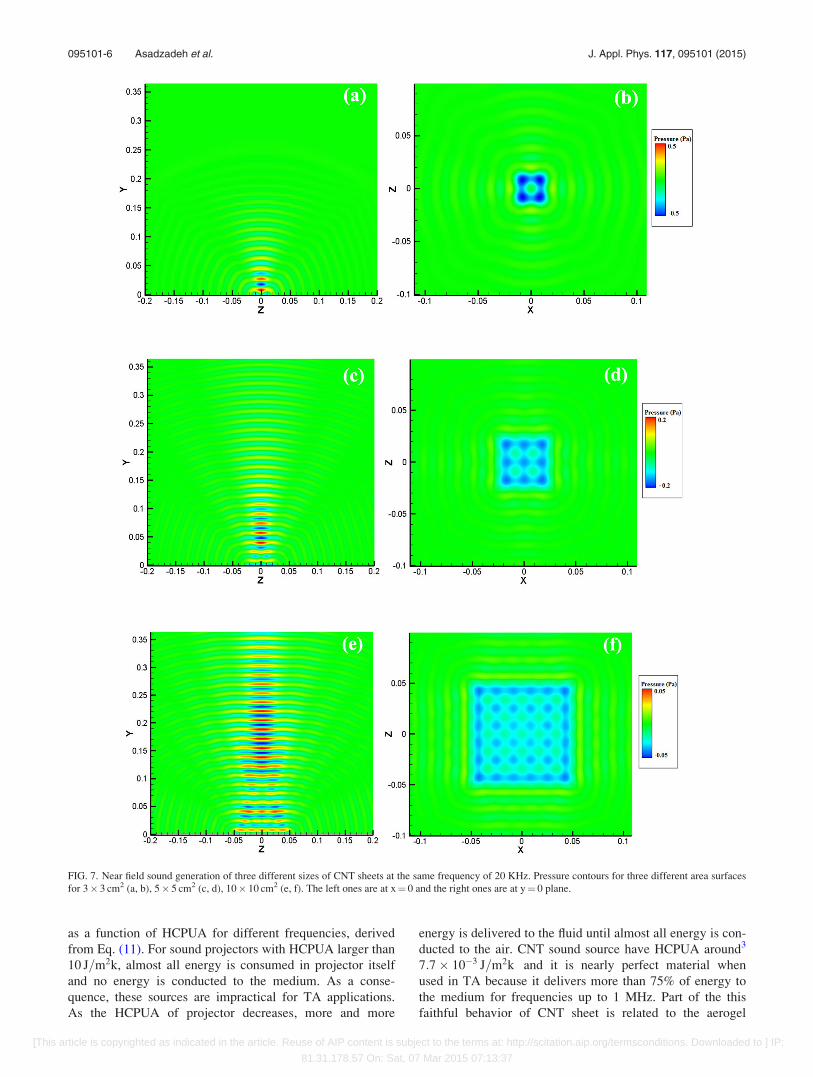
powered applications. Figure 7 shows contour of pressure at
frequency of 20 KHz for these three different sources. At the
same frequency and input power, maximum of SPL
generated by these TA sources occur at different distances
with different magnitudes. In case of CNTs sheet, this is of
special importance because these sound sources are flexible
and could take many shapes and forms. At higher frequen-
cies, this could help focusing of pressure field at a specified
location to reach higher sound intensity at desired point
which could be applicable in some medical applications like
lithotripsy for breaking of kidney stones.
Figure 8(a) shows portion of energy transferred to the
air by aerogel TA sources (with typical thickness of 20 lm)
FIG. 5. Theoretical, simulation and experimental results of TA projectors for. (a) Surface area of 100 cm2 at frequency of 20 KHz. (b) Surface area of 100 cm2
at frequency of 5 KHz. (c) Surface area of 9 cm2 at frequency of 5 KHz. Power input for (a), (b), and (c) is 0.6, 0.6, and 0.5 W, respectively.
FIG. 6. Sound pressure of different sizes of CNT sheet. (a) At frequency of 20 KHz. (b) At frequency of 5 KHz. Input power for all samples is 0.6 W.
095101-5 Asadzadeh et al. J. Appl. Phys. 117, 095101 (2015)
[This article is copyrighted as indicated in the article. Reuse of AIP content is subject to the terms at: http://scitation.aip.org/termsconditions. Downloaded to ] IP:
81.31.178.57 On: Sat, 07 Mar 2015 07:13:37
as a function of HCPUA for different frequencies, derived
from Eq. (11). For sound projectors with HCPUA larger than
10 J=m2k, almost all energy is consumed in projector itself
and no energy is conducted to the medium. As a conse-
quence, these sources are impractical for TA applications.
As the HCPUA of projector decreases, more and more
energy is delivered to the fluid until almost all energy is con-
ducted to the air. CNT sound source have HCPUA around3
7:7� 10�3 J=m2k and it is nearly perfect material when
used in TA because it delivers more than 75% of energy to
the medium for frequencies up to 1 MHz. Part of the this
faithful behavior of CNT sheet is related to the aerogel
FIG. 7. Near field sound generation of three different sizes of CNT sheets at the same frequency of 20 KHz. Pressure contours for three different area surfaces
for 3� 3 cm2 (a, b), 5� 5 cm2 (c, d), 10� 10 cm2 (e, f). The left ones are at x¼ 0 and the right ones are at y¼ 0 plane.
095101-6 Asadzadeh et al. J. Appl. Phys. 117, 095101 (2015)
[This article is copyrighted as indicated in the article. Reuse of AIP content is subject to the terms at: http://scitation.aip.org/termsconditions. Downloaded to ] IP:
81.31.178.57 On: Sat, 07 Mar 2015 07:13:37

nature of these webs. In these sound sources, medium fluid
could permeate into empty space inside CNT sheet. As a
consequence, heat transferred to the medium fluid is a volu-
metric phenomenon that enhances thermo acoustic effect.
This is especially important at higher frequencies where ther-
mal depth is smaller. In other non-aerogel sound sources,
heat conduction to the medium only occurs in the surfaces of
source. Figure 8(b) shows portion of energy reached to the
medium fluid for these sound sources at free standing state.
It can be seen if the HCPUA of source get bigger, their per-
formance at higher frequencies degrades and sound genera-
tion ability of TA sources decreases more rapidly compared
to the aerogel TA sources at the same magnitude of HCPUA.
Therefore, one way for efficient behavior of TA sources at
higher frequencies is to make sound sources with aerogel na-
ture. That is why far field frequency response of CNT sound
sources shows no obvious decrease, up to frequency of 100
KHz.11
Upper limit of frequency response of CNT projector is
still unknown and to determine their ability for sound gener-
ation at frequencies of MHz domains, attenuation of sound
due to viscosity effects should also be considered.18
However, energy analysis of these sources indicates their
faithful behavior in delivering energy to medium gas in these
frequencies.
Equation (12) indicates that in addition of dependence
of pressure to the inverse heat capacity of surrounding gas,
pressure is also dependent on ability of the gas in receiving
energy from sound source. This ability relates to the thermal
properties of fluid. Here, we also solved governing 3-D equa-
tions for Xenon and Argon numerically. Figure 9 shows a
snapshot of simulation result at t¼ 0.002 s for these two
gases and the air at distance of 20 cm far from origin with
coordinates of (0, 0.2, 0). Note that because sound speed dif-
fers for different gases, it took about twice time for Xenon
(compared to the air) until pressure wave reaches to the
measuring point from its generation location. That is in good
agreement with sound speed in air and Xenon which is 345
and 169 m/s, respectively. Table I compares results of pres-
sure ratio predicted by Eq. (12), FD simulation, and experi-
mental data.13
As a final point, here temperature field around TA sound
source with surface area of 25 cm2 at 5 KHz are depicted in
Fig. 10. It can be seen that temperature wave permeate into
small distance through medium and by rapid variation of
these temperatures, pressure waves are generated and propa-
gated in medium. In calculation of portion of energy deliv-
ered to the fluid, we assumed temperature distribution is
uniform across CNT sheet and its variation is just in one
directional. Figure 10 which is a three dimensional solution
of the governing equations confirms the fact that temperature
variation, with acceptable approximation, could be consid-
ered one-directional.
FIG. 8. Portion of input energy delivered to the medium fluid by free standing TA sources for. (a) Aerogel TA sound sources (thickness of 20 lm). CNT based
projectors deliver more than 75% of input energy to the surrounding medium in frequencies below 1 MHz. (b) Non-aerogel TA sound sources. At a given
HCPUA, ability of non-aerogel TA sources degrades more rapidly at higher frequencies compared to the aerogel sources.
FIG. 9. Snapshot of pressure variation at location of (0, 0.2, 0) for three dif-
ferent gases. Because sound speed in air and Argon is more than sound
speed of Xenon, pressure pulses in these gases arrive much sooner to the
measuring point.
TABLE I. Results of pressure ratio for Argon and Xenon compared to the
air.
Cp�air
Cgas
Pgas
Pair(Eq. (12))
Pgas
PairFDÞð Pgas
Pair(Exp13)
Argon 1.92 1.81 1.76 1.50
Xenon 6.32 5.54 5.41 5.21
095101-7 Asadzadeh et al. J. Appl. Phys. 117, 095101 (2015)
[This article is copyrighted as indicated in the article. Reuse of AIP content is subject to the terms at: http://scitation.aip.org/termsconditions. Downloaded to ] IP:
81.31.178.57 On: Sat, 07 Mar 2015 07:13:37

VI. CONCLUSION
We derived a formula for sound generation of small
TA sound sources using two alternative forms of energy in
terms of energy conducted to the fluid. Using energy equa-
tion for source and medium fluid, the energy transferred to
the fluid by finite free standing TA source is calculated,
which lead to a model for prediction of sound generation of
TA projectors which could accurately predict sound genera-
tion in far field. To study pressure in near field, full 3-D
governing equations are solved by a numerical method
which is able to account for all three dimensional thermal
and pressure wave interactions near sound source.
Although near field pressure is highly affected by sizes of
TA projectors, far field pressure is independent of sound
source dimensions.
Analyzing the ability of TA sound sources in faithfully
delivering input energy to the medium fluid shows CNT
based projectors are almost optimum material for TA sound
generation in ultra sound region, thanks to their aerogel na-
ture in addition of their ultra-small HCPUA.
Temperature contour around TA source shows tempera-
ture variation is approximately one dimensional.
Ability of CNT based projectors in producing sound in
ultra sound range, together with their flexibility to take many
shapes and forms, may be beneficial in manufacturing devi-
ces that could be useful in industrial and medical
applications.
ACKNOWLEDGMENTS
We thank Dr. Ahmad Amjadi and Nima Jafari (Physics
Department of Sharif University of Technology) for
providing experimental setup and their helpful advice for
conducting experiments. Solution steps to derive sound
generation of small TA source are provided as below:
APPENDIX: DETERMINATION OF SOUND PRESSUREAND HEAT DELIVERED TO MEDIUM
Calculation of Eq. (6):
CalculatingÐ kp
r0q @T@t 4pr2ð Þdr from Eq. (4) and substitut-
ing it in Eq. (3) yields
c� 1ð Þ _Qfluid transient ¼ðkp
r0
@p
@t4pr2ð Þdr;
where c ¼ Cp
Cv: Integrating above equation in one period of
input energy yields
ðc� 1Þ _Qf luid � 1=f ¼ðkp
r0ffi0
pðrÞ � ð4pr2Þdr;
where _Qf luid and f are mean value of heat generation and fre-
quency, respectively. The right side of this equation is equal
to mean heat generation in one periodic cycle.
Now substituting magnitude pðrÞ from Eq. (5) in above
equation yields
c� 1ð Þ _Qf luid �1
f¼ 4p� pkp
� kp
ðkp
0
�r � sin k0rð Þdr
¼ 4p� pkp� kp �
kp2
2p:
Pressure value at r ¼ kp is calculated as
pkp¼ c� 1ð Þ
2k3p
�_Qf luid
f:
Multiplying this equation bykp
r and considering kp ¼ v0
fyields
p ¼ c� 1ð Þ2r � k2
p
�_Qf luid
f¼ c� 1ð Þ � f
2r � v20
� _Qf luid:
For ideal gases, v20 ¼ cRT0 and R ¼ Cp � Cv. Substituting
these terms in above equation results in Eq. (6).
Calculation of Eq. (11):
To derive energy transferred to the fluid as in Eq. (7),
we can write
_Qfluid transient¼ 2
ðqACvf luid
T0x:exp �k1xð Þ� sin xt� k1xð Þdx
¼ 2qACvf luidT0x
ðexp �k1xð Þ� sin xt�k1xð Þdx
¼ 2qACvf luidT0x�
exp �k1xð Þffiffiffi2p
k1
� sin xt�k1x�p4
� � 10
(
¼ 2qACvf luidT0x�
1ffiffiffi2p
k1
sin xt�p4
� �;
FIG. 10. Snapshot of temperature con-
tours around a TA source with dimen-
sions of 5� 5 cm2 at frequency of 5
KHz. The left one is at x¼ 0 plane
which shows temperature variation
approximately take place in one direc-
tion. The right one is at y¼ 0 plane
indicating uniform distribution of tem-
perature in most area of TA surface.
095101-8 Asadzadeh et al. J. Appl. Phys. 117, 095101 (2015)
[This article is copyrighted as indicated in the article. Reuse of AIP content is subject to the terms at: http://scitation.aip.org/termsconditions. Downloaded to ] IP:
81.31.178.57 On: Sat, 07 Mar 2015 07:13:37

considering k1 ¼ffiffiffiffipfav
q, effective value of _Qfluid transient is
calculated
_Qf luid ¼ qACvf luidT0x�
ffiffiffiffiffiav
pf
r:
In case of aerogel sound sources like CNTs sheet, the fluid
inside the aerogel sheet is also heated with uniform tempera-
ture variation equal to temperature variation of source and
this heat must be added to the _Qf luid. Effective value of this
heat is
_Qinside ¼ qACvf luidT0x
dsfffiffiffi2p ;
where dsf is thickness of aerogel sound source. For one layer
CNTs sheet, its value is typically about 20 lm and it van-
ishes for other sources without having porous property.
Adding to above equations gives energy delivered to the
fluid by an aerogel TA sound source
_Qfluid aerogel ¼ qACvf luidT0x�
ffiffiffiffiffiav
pf
rþ qACvf luid
T0xdsfffiffiffi
2p
¼ qACvf luidT0x
ffiffiffiffiffiav
pf
rþ dsfffiffiffi
2p
!:
Portion of energy consumed in sound sources is
_Qs ¼ qsACsT0xdsfffiffiffi
2p :
Now having Q_fluid aerogel and _Qs and substituting them into
Eq. (7), Q_fluid aerogel is calculated
_Qfluid aerogel¼_Qfluid aerogel
_Qsþ _Qfluid aerogel
:Pe
¼qACvf luid
T0xffiffiffiffiffiav
pf
rþ dsfffiffiffi
2p
!
qACvf luidT0x
ffiffiffiffiffiav
pf
rþ dsfffiffiffi
2p
!þqsACsT0x
dsfffiffiffi2p
:Pe
_Qfluid aerogel ¼1
1þ qsCsdsf
qCvf luid
ffiffiffiffiffiffiffi2av
pf
rþ dsf
! :Pe:
1H. D. Arnold and I. B. Crandall, “The thermophone as a precision source
of sound,” Phys. Rev. 10, 22–38 (1917).2X. Zhang et al., “Spinning and processing continuous yarns from 4-inch
wafer scale super-aligned carbon nanotube arrays,” Adv. Mater. 18,
1505–1510 (2006).3L. Xiao et al., “Flexible, stretchable, transparent carbon nanotube thin film
loudspeakers,” Nano Lett. 8, 4539–4545 (2008).4A. E. Aliev, M. D. Lima, S. Fang, and R. H. Baughman, “Underwater
sound generation using carbon nanotube projectors,” Nano Lett. 10,
2374–2380 (2010).5A. O. Niskanen et al., “Suspended metal wire array as a thermoacoustic
sound source,” Appl. Phys. Lett. 95, 163102 (2009).6V. Vesterinen, A. O. Niskanen, J. Hassel, and P. Helisto, “Fundamental ef-
ficiency of nanothermophones: Modeling and experiments,” Nano Lett.
10, 5020–5024 (2010).7H. Tian et al., “Transparent, flexible, ultrathin sound source devices using
indium tin oxide films,” Appl. Phys. Lett. 99, 043503 (2011).8H. Tian et al., “Graphene-on-paper sound source devices,” ACS Nano 5,
4878–4885 (2011).9G. Ghitnis et al., “A thermophone on porous polymeric substrate,” Appl.
Phys. Lett. 101, 021911 (2012).10K. Suzuki et al., “Study of carbon-nanotube web thermoacoustic loud-
speakers,” Jpn. J. Appl. Phys. Part 1 50, 01BJ10 (2011).11L. Xiao et al., “High frequency response of carbon nanotube thin film
speaker in gases,” J. Appl. Phys. 110, 084311 (2011).12A. R. Barnard et al., “Feasibility of a high-powered carbon nanotube thin-
film loudspeaker,” J. Acoust. Soc. Am. 134, EL276–EL281 (2013).13A. E. Aliev, Y. N. Gartstein, and R. H. Baughman, “Increasing the effi-
ciency of thermo-acoustic carbon nanotube sound projectors,”
Nanotechnology 24, 235501 (2013).14H. Hu, Y. Wang, and Z. Wang, “Wideband flat frequency response of
thermo-acoustic emission,” J. Phys. D: Appl. Phys. 45, 345401 (2012).15H. Hu, T. Zhu, and J. Xu, “Model for thermoacoustic emission from sol-
ids,” Appl. Phys. Lett. 96, 214101 (2010).16H. Hu et al., “Analysis of spherical thermo-acoustic radiation in gas,” AIP
Adv. 2, 032106 (2012).17H. Hu, Y. Wang, and Z. Wang, “Solution for acoustic field of thermo-
acoustic emission from arbitrary source,” AIP Adv. 4, 107114 (2014).18M. Daschewski et al., “Physics of thermo-acoustic sound generation,”
J. Appl. Phys. 114, 114903 (2013).19J. D. Anderson, Modern Compressible Flow with Historical Perspective
(McGraw-Hill, 2003).20P. M. Morse, Theoretical Acoustics (Princeton University Press, 1986).21M. N. Ozisik, Heat Conduction (John Wiley & Sons, 1993).22D. Ensminger and L. J. Bond, Ultrasonics: Fundamentals, Technologies,
and Applications (CRC Press, 2011).
095101-9 Asadzadeh et al. J. Appl. Phys. 117, 095101 (2015)
[This article is copyrighted as indicated in the article. Reuse of AIP content is subject to the terms at: http://scitation.aip.org/termsconditions. Downloaded to ] IP:
81.31.178.57 On: Sat, 07 Mar 2015 07:13:37