thermo electric generators in the backyard tim kelly... · thermo electric generators in the...
TRANSCRIPT

Physics Scientific Method Mr Bunn
Tim Kelly Page 1
Thermo Electric Generators in the Backyard
Scientific Method
Tim Kelly

Physics Scientific Method Mr Bunn
Tim Kelly Page 2
Abstract
To investigate how the temperature difference between two points affects how much power a
thermo electric generator can produce, and then to use this information to determine whether using
such devices in a household environment could be a viable power source. Research indicates that
thermo electric generators have been used in many applications, and that they have rapidly
improved over time. This leads to the hypothesis that they could be used around the house to
produce electricity. Research further indicates that thermo electric generators create more power at
higher temperature differences, so the use of solar-heated pool water versus the water in the body of
a swimming pool, appeared to present a worthwhile avenue for investigation. Thermometers and a
temperature gun were used to determine how much electricity a thermo electric generator could
produce at varying temperature differences, and then this data was used to evaluate how much
electricity could be produced by a thermo electric generator located between the body of pool water
and water pumped through a solar heater. A comparison was also made against the power that
could be produced by having a thermo electric generator imbedded in the side of a compost bin, with
one side exposed to air temperature and the other side in contact with the compost. Graphs of
temperature differences versus wattage were produced from these results, including variances over 2
separate days. The conclusion reached was that thermo electric generators (TEGs) are inefficient at
low temperature differences and (hence) are not practical for viable household power generation.
Further research could be undertaken, such as attempting to use a thermo electric generator with a
much hotter heat source (such as a stove or heater) to obtain much higher efficiencies and hence
higher power output.

Physics Scientific Method Mr Bunn
Tim Kelly Page 3
Background Information
In today’s world reducing our power
consumption has become very important.
As electricity prices increase, oil and coal
become scarcer, and the world energy
crisis sets in (PlanetforLife.com, 2010,
main page), finding alternative power
sources that don’t create such a large and
costly carbon footprint will become one
of the world’s top priorities. Several
alternatives have already been produced,
such as Nuclear, Biomass, Solar and Wind
(PlanetforLif.com, 2010, main page).
However, these have proven to be costly
and ineffective. Hydrogen power has
become another option; this has proven
to have a little more promise, with no
greenhouse gases, and some development of hydrogen producing methods, such as algae farms. But
it is still costly to store in compressed tanks, and does not have a high energy output
(PlanetforLife.com, 2010, Hydrogen Economy Article). An area which has not yet been widely
explored is thermoelectricity.
Thermoelectric coolers are used in electric
refrigerators to keep the inside cool
(Thermoelectric effect.wiki, 2013, first paragraph),
and these have been used for many years. But
when a temperature difference is deliberately
placed upon the two sides of a thermoelectric
cooler, it begins to generate electricity; this is a
thermoelectric generator. This effect can also be
described as the Seeback effect,
(Thermoelectriceffect.wiki, 2013, Seeback Effect)
named after German physicist Thomas Johann
Seeback, who discovered the effect in 1821. This
effect and several others (Peltier, Thomson)
dictate the way in which the thermo-generator
produces power depending on heat differences.
A Thermoelectric generator Thermoelectric Generators, Wikipedia

Physics Scientific Method Mr Bunn
Tim Kelly Page 4
The main effect that explains why
electricity is produced by a heat
difference is the Charge Carrier
diffusion effect
(Thermoelectriceffect.wiki, 2013,
Charge-carrier diffusion). Which
states that the same rules of heat
diffusion also apply to the thermo-
generator. As a heat difference is
produced between the two sides,
heat energy wants to move from one
side to the other, the materials inside
the generator are special in that they
can allow electrons to act as charge
carriers (Thermoelectriceffect.wiki,
2013, Charge-carrier diffusion). So
this means that all the electrons on
one side of the generator begin to move to the other side. Once they have reached the other side,
and loaded off their heat, they wish now to move back to the previous side, because there is a
shortage of electrons on that end. But they cannot move back the way they came because their path
is hindered by the charge-carrying electrons, so a circuit is produced to allow them to move back,
which is where we may use the electrons. This is the main effect on which thermoelectric generators
are based.
Several uses have already been discovered for Thermoelectric generators such as on space probes:
by piggybacking the heat coming off a radioactive material; in cars: to harvest waste heat from
engines; and from waste in several other places like large rubbish dumps and large compost bins. In
most cases thermoelectric generators are quite inefficient, with efficiencies of about 5-8%
(Thermoelectric generator, 2013, first paragraph) but have greater efficiencies at higher
temperatures. This can be a great hindrance to their use with small temperature differences,
because they are only capable of producing milliwatts of power (Small Thermoelectric Generators,
2008, p2). But they have been proven to be quite effective in small applications such as watches,
because they are compact, inexpensive and scalable. Several people on the Internet have used
thermoelectric generators to power some or all of their homes, when connected to a heat source
such as a wood burner or stove. This leads to the possibility that although thermoelectric generators
are costly and inefficient, they may have a place as a household power generator. So, the aim in this
experiment will be to test thermoelectric generators in situations which do not require a commercial
resource (i.e. wood, oil) to produce electricity. Such situations may include hot water solar pool
heaters that produce heat from the sun and require no additional needs; compost bins, which do
require a commercial resource (food scraps, mulch) but are much cheaper than wood or gas. Both of
these situations will be tested to determine which could use a thermoelectric generator to produce
the most electricity for the lowest cost. It must be said that the temperature differences experienced
in these situations will be far less than thermoelectric generators are really effective for, but it will
still be worth testing.
New Horizon Space Probe, in assembly before launch. The black
tube is the thermoelectric-radioisotope generator. NASA

Physics Scientific Method Mr Bunn
Tim Kelly Page 5
This experiment cannot be conducted without first determining the amount of power (Volts, Amps,
and hence Watts) that the obtained thermoelectric generator (TEG) can produce (Tegpower.com,
2013, products page). Different TEGs react differently, and the behaviour of various types of TEG is
not easily determined from documents on the Internet. Experiments will need to be conducted to
see at what rate the particular TEGs produce power as temperature increases, so that estimates can
be made of how much power will be produced (theoretically) in the different circumstances.
Research indicates that as temperature difference increases, thermoelectric generators produce
volts in a linear pattern (if a trend line was fitted to the graphed results from the experiment)
(Thermoelectricgenerator.com, 2012, brief explanation of thermoelectric power generation), and
produce an exponential line when the power output (in watts) is measured. These findings shall be
used to crosscheck that the TEGs under test exhibit the same behaviour.
The final aim is to find whether thermoelectric generators, in the situations under test, are
theoretically capable of producing a normal household's power supply (which is estimated at a
minimum of 20 kilowatts from a typical household electricity bill). If the cost or the amount of space
needed to produce such power in the abovementioned situations is too large, then the only
conclusion shall be to classify TEGs as being impractical for the envisaged purpose.

Physics Scientific Method Mr Bunn
Tim Kelly Page 6
Aim
To investigate whether using thermo electric generators (TEGs) in a household environment could
prove to be a viable power source for a typical home, with particular reference to solar-heated pool
water and compost material.
Hypothesis
That a practical (in terms of cost and surface area) number of TEGs can be used in certain household
environments to generate a substantial amount of the home’s power requirements. (For example,
that TEGs can provide similar cost and benefits as solar panels.)
In the two scenarios that will be measured, the expectation is that the thermo-electric generator
inside the pool water heater will create more electricity in a day (9:00am to 5:00pm) than the other
generator in the side of the compost bin. This expectation arises because sources (see page 2), state
that a TEG creates more electricity at higher heat differences, and it is likely that the temperature
difference will be greatest between the solar-heated pool water and the cooler water within the
swimming pool.

Physics Scientific Method Mr Bunn
Tim Kelly Page 7
Materials used and cost
Amount Notes Cost
3 TEGgenerator 40x40x3.5mm $22.50
1 Infra-redthermometer $40.00
1 DigitalMultimeter Existingequipment $0.00
1 GasBBQ Existingequipment $0.00
2 DigitalThermometers Withsensorsonlongleads $12.95
1 CompostHeap healthyandofmoderatesize $0.00
1 Solarpoweredwaterheater Existingequipment $0.00
1 Largeelectricfan Existingequipment $0.00
1 penandpaper Existingequipment $0.00
TotalCost: $75.45
Material
Specifications of the TEGs used (taken from description of item on eBAY): o 40mm x 40mm x 3.3mm o Operates from 0-16 volts DC and 0-10.5 amps o Operates from -60 deg C to +180 deg C o Fitted with 6-inch insulated leads o Perimeter sealed for moisture protection o 3 x TEGs purchased on eBay at $22.50 each
Comment: It would be beneficial if you used the same model teg we have, but this experiment is designed to tailor all types of TEGs.
Infra-red Thermometer
Digital Multimeter

Physics Scientific Method Mr Bunn
Tim Kelly Page 8
2 x Digital Thermometers (with sensors on long leads)
BBQ and induction cooktop (as heat sources – see pictures later in my report)
Ice (to cool one side of a TEG when it is on a heat source)
Electric fan (to dispel hot air from top of TEG whilst on BBQ/cooktop)
A swimming pool, and roof-top solar-heated pool water
Compost Heap
Pen and paper (to record measurements)
Physics Scientific Method Mr Bunn
Tim Kelly Page 9
Risks/Hazards/Precautions
Personal risks:
1. Risk of being burnt by heat sources. Initial verification of how much electricity a TEG can generate, was conducted by placing a
TEG on a hot surface (BBQ and cook top) and testing its performance across a range of
temperatures, including up to around 150 degrees Celcius.
Precaution taken:
Temperature readings were made using a infrared thermometer, so that no direct contact
with the hot surfaces were required.
Experimental risks:
1. Accuracy of Infrared Thermometer temperature readings. The Infrared Thermometer came with a note that says it assumes that any material whose
temperature is to be measured, has an emissivity (the relative ability of its surface to emit
energy by radiation) of 0.95. This is typical for organic and painted or oxidized surfaces.
Precaution taken:
Avoid using the Infrared Thermometer to take the temperature of any shiny or polished
surfaces (especially metal). The used BBQ surface was heavily oxidized to a black colour, and
the experiment that used the cooktop as a heat source had the TEG positioned in a flat
frypan with a dark-coloured coating (see the picture, later). Each TEG is cream/light-grey in
colour and is non-reflective, so I assumed it was close to the typical emissivity.
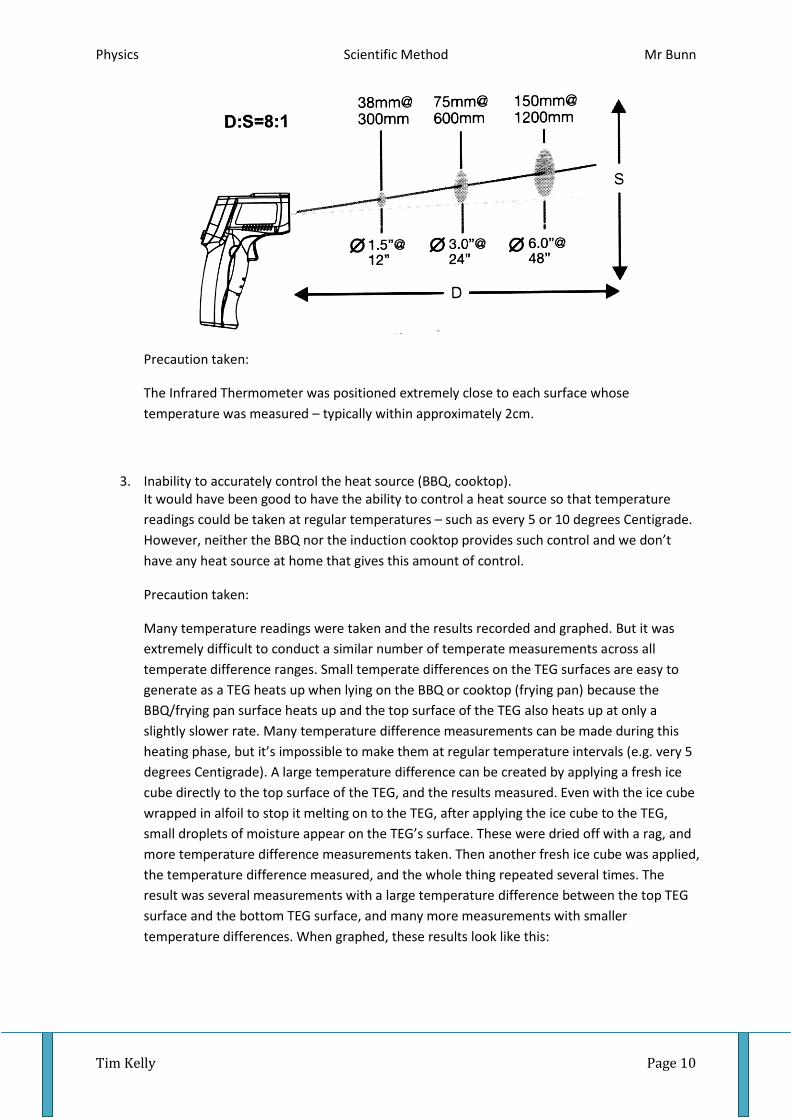
2. Accuracy of Infrared Thermometer temperature readings. The Infrared Thermometer measures the temperature of a “spot” in front of the device. The
size of the measured “spot” increases with increasing distance from the Infrared
Thermometer, with the ratio of distance to “spot size” being 8:1. So if the surface to be
measured is 16cm from the Infrared Thermometer, the device measures the temperature of
a spot 2cm in diameter. This is significant because each TEG is only 40mm (4cm) square and I
wanted to be sure to only measure the temperature of the surface of the TEG and not
include surrounding surfaces or objects.
Physics Scientific Method Mr Bunn
Tim Kelly Page 10
Precaution taken:
The Infrared Thermometer was positioned extremely close to each surface whose
temperature was measured – typically within approximately 2cm.
3. Inability to accurately control the heat source (BBQ, cooktop). It would have been good to have the ability to control a heat source so that temperature
readings could be taken at regular temperatures – such as every 5 or 10 degrees Centigrade.
However, neither the BBQ nor the induction cooktop provides such control and we don’t
have any heat source at home that gives this amount of control.
Precaution taken:
Many temperature readings were taken and the results recorded and graphed. But it was
extremely difficult to conduct a similar number of temperate measurements across all
temperate difference ranges. Small temperate differences on the TEG surfaces are easy to
generate as a TEG heats up when lying on the BBQ or cooktop (frying pan) because the
BBQ/frying pan surface heats up and the top surface of the TEG also heats up at only a
slightly slower rate. Many temperature difference measurements can be made during this
heating phase, but it’s impossible to make them at regular temperature intervals (e.g. very 5
degrees Centigrade). A large temperature difference can be created by applying a fresh ice
cube directly to the top surface of the TEG, and the results measured. Even with the ice cube
wrapped in alfoil to stop it melting on to the TEG, after applying the ice cube to the TEG,
small droplets of moisture appear on the TEG’s surface. These were dried off with a rag, and
more temperature difference measurements taken. Then another fresh ice cube was applied,
the temperature difference measured, and the whole thing repeated several times. The
result was several measurements with a large temperature difference between the top TEG
surface and the bottom TEG surface, and many more measurements with smaller
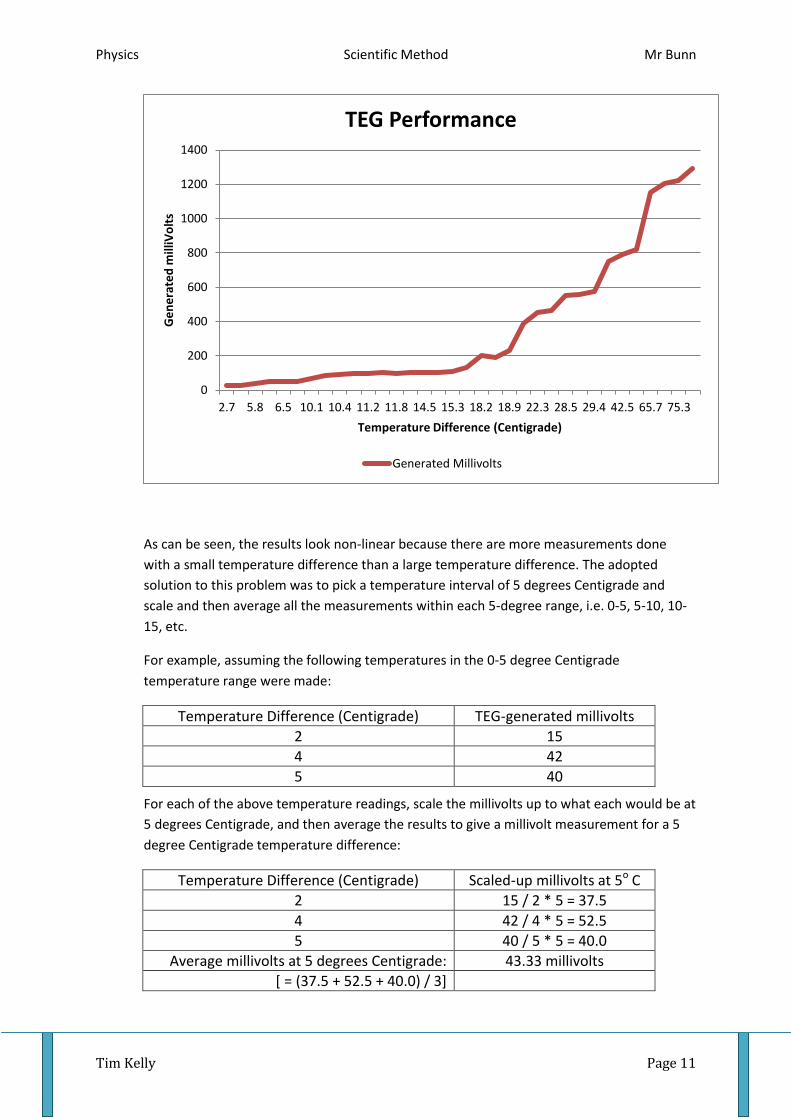
temperature differences. When graphed, these results look like this:
Physics Scientific Method Mr Bunn
Tim Kelly Page 11
As can be seen, the results look non-linear because there are more measurements done
with a small temperature difference than a large temperature difference. The adopted
solution to this problem was to pick a temperature interval of 5 degrees Centigrade and
scale and then average all the measurements within each 5-degree range, i.e. 0-5, 5-10, 10-
15, etc.
For example, assuming the following temperatures in the 0-5 degree Centigrade
temperature range were made:
Temperature Difference (Centigrade) TEG-generated millivolts
2 15
4 42
5 40
For each of the above temperature readings, scale the millivolts up to what each would be at
5 degrees Centigrade, and then average the results to give a millivolt measurement for a 5
degree Centigrade temperature difference:
Temperature Difference (Centigrade) Scaled-up millivolts at 5o C
2 15 / 2 * 5 = 37.5
4 42 / 4 * 5 = 52.5
5 40 / 5 * 5 = 40.0
Average millivolts at 5 degrees Centigrade: 43.33 millivolts
[ = (37.5 + 52.5 + 40.0) / 3]
0
200
400
600
800
1000
1200
1400
2.7 5.8 6.5 10.1 10.4 11.2 11.8 14.5 15.3 18.2 18.9 22.3 28.5 29.4 42.5 65.7 75.3
Ge
ne
rate
d m
illiV
olt
s
Temperature Difference (Centigrade)
TEG Performance
Generated Millivolts
Physics Scientific Method Mr Bunn
Tim Kelly Page 12
Doing this to all the millivolt measurements for each 5-degree temperature range makes a
single millivolt result for each 5-degree range. These can then be graphed with a 5-degree
temperature interval on the X-Axis, and the generated millivolts on the Y-Axis. No alternative
method presented itself for overcoming this problem without having equipment to
accurately control the heat applied to one side of the TEG and the cold applied to the other
side of the TEG.
Another problem with using a BBQ and a cooktop as heat sources is that the rate of heat
increase or decrease cannot be finely controlled. Both sources heat up very quickly, even
when using “low” heat settings. This means that measurements of surface temperature, TEG
temperature, and generated Volts or Amps, must be taken very quickly. Sometimes it was
impossible to make all the measurements quickly enough and so there are some
measurements with a gap between measured temperatures (i.e. a few 5-degree
temperature points on the X-Axis do not have corresponding points on the graph because
there were no measurements made during the short time that the 5-degree temperature
change happened).
Physics Scientific Method Mr Bunn
Tim Kelly Page 13
Labelled, Scientific diagram
In order to see if the hypothesis was correct, two sets of experiments were required. Firstly, the
amount of power generated by a TEG under various temperature difference needed to be
determined. This was the Precursor Experiment.
Then it was necessary to measure the temperature differences in the two scenarios that were
proposed – using heated pool water versus the main body of pool water, and inside a compost heap
versus the outside air temperature.
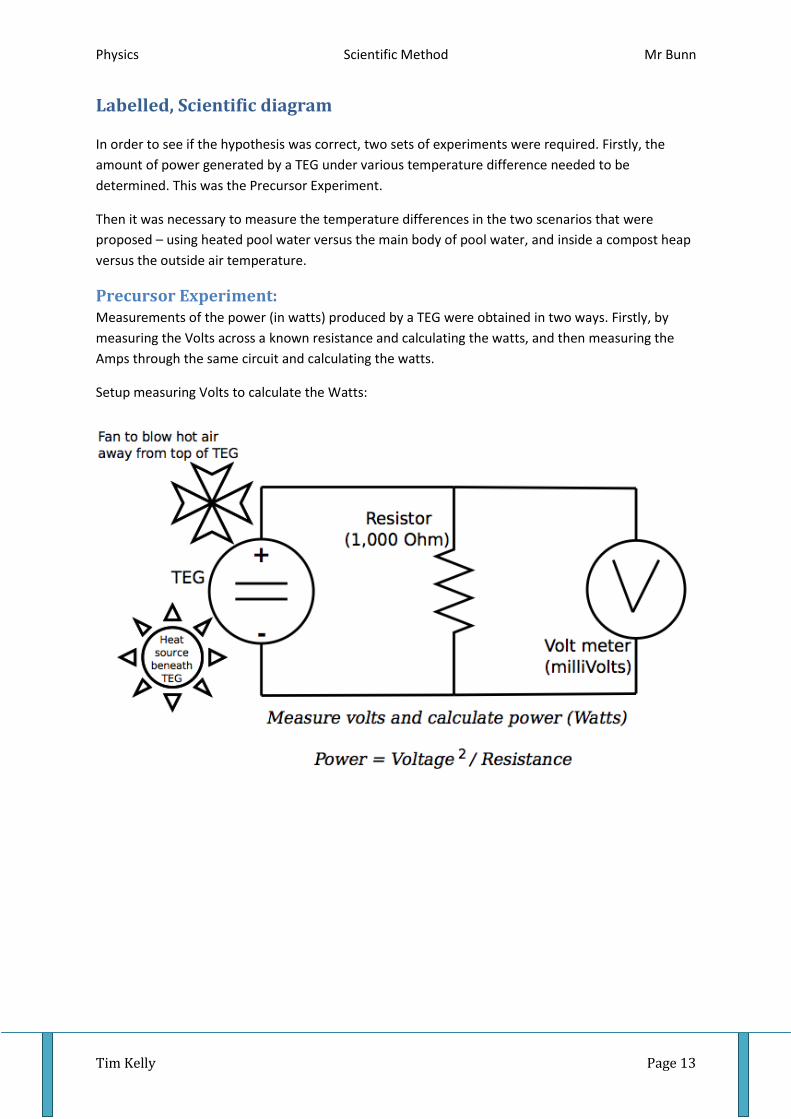
Precursor Experiment: Measurements of the power (in watts) produced by a TEG were obtained in two ways. Firstly, by
measuring the Volts across a known resistance and calculating the watts, and then measuring the
Amps through the same circuit and calculating the watts.
Setup measuring Volts to calculate the Watts:
Physics Scientific Method Mr Bunn
Tim Kelly Page 14
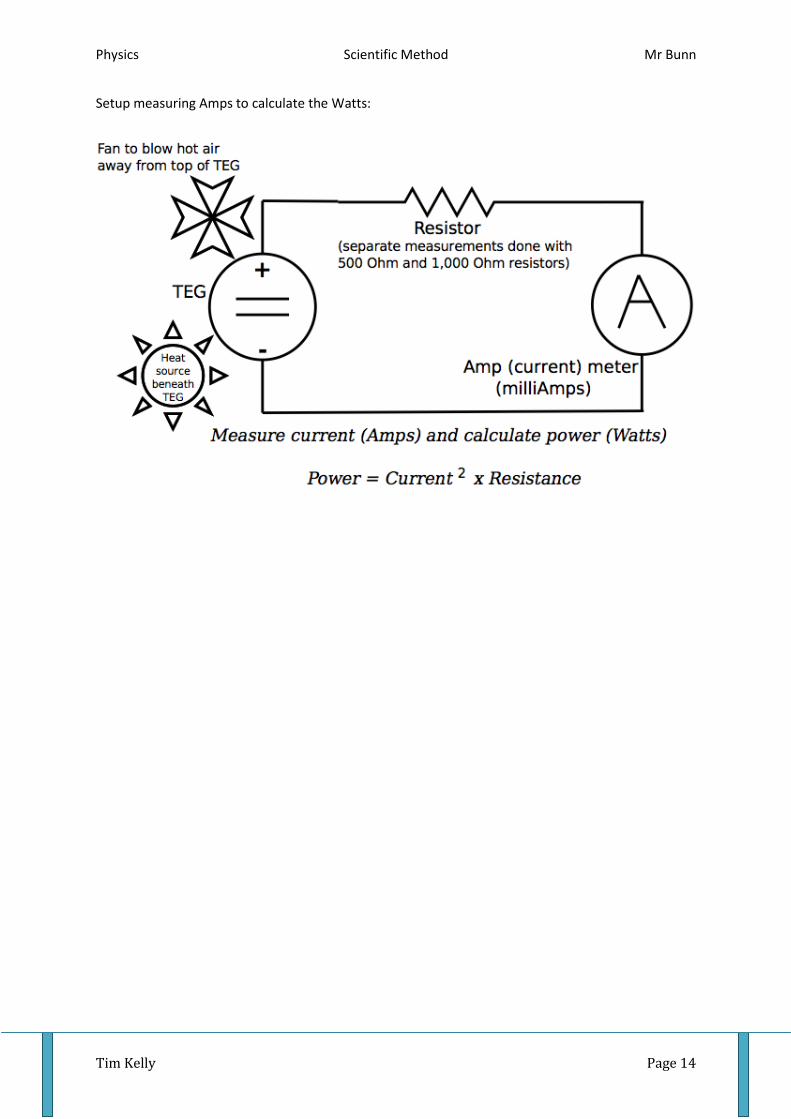
Setup measuring Amps to calculate the Watts:

Physics Scientific Method Mr Bunn
Tim Kelly Page 15
Main (Temperature Difference) Experiment:
Setup to measure heated pool water versus main pool water:
Setup to measure centre of compost heap versus air temperature:
Physics Scientific Method Mr Bunn
Tim Kelly Page 16
Method
Comment: Two experiments were used in this report, a precursor which explored the mean power
(in Watts) output of a TEG depending on temperature difference, and a main experiment that
measures temperature differences in two household scenarios (solar heated pool water versus pool
water, and the inside versus outside of a compost heap). The measured temperature differences in
the main experiment are then used with the measured TEG power outputs at those temperature
differences to work out how much power a TEG could generate in those situations. Then it is
possible to determine how many TEGs would be required to generate power for a typical house,
such as 20 kilo watts.
The precursor experiment was first done a couple of times to measure the Volts generated by the
TEG and to check that they rose linearly with increasing temperature, as research about TEGs
indicated. This was done using a BBQ as a heat source. The results of this first experiment were not
good and destroyed a TEG, as will be described later in the Discussion section.
A fan was added to the experiment and the experiment was retried. The experiment was later
repeated using the kitchen cooktop as a heat source. This was done to show repeatability.
After checking that the TEG produced volts that increased linearly with the temperature difference
between the two sides of the TEG, the next step was to measure how much power (in Watts) that
the TEG produces. To do this, a resistor was added and 3 further sets of measurements were made.
The method for these measurements is what is described below.
Precursor Experiment
1. The TEG was wired to the digital multimeter with a 1,000 (1K) Ohm resistor included in the
circuit (as shown in the diagram on pages 13 and 14).
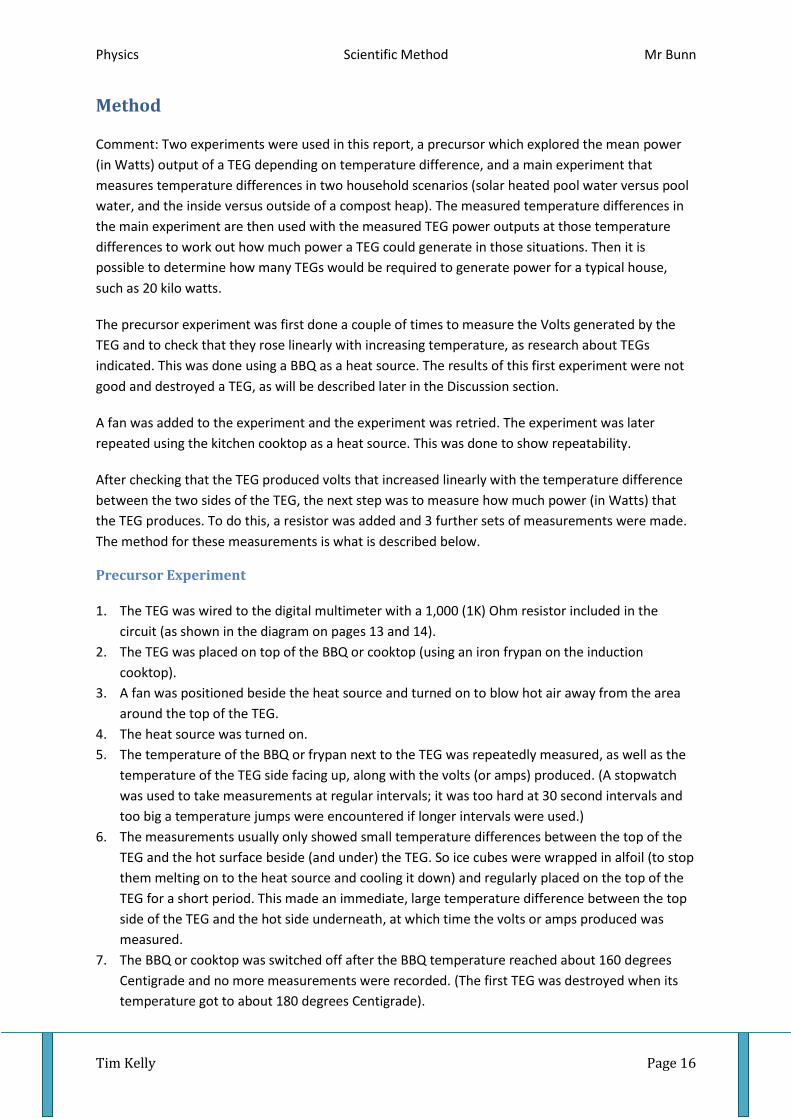
2. The TEG was placed on top of the BBQ or cooktop (using an iron frypan on the induction
cooktop).
3. A fan was positioned beside the heat source and turned on to blow hot air away from the area
around the top of the TEG.
4. The heat source was turned on.
5. The temperature of the BBQ or frypan next to the TEG was repeatedly measured, as well as the
temperature of the TEG side facing up, along with the volts (or amps) produced. (A stopwatch
was used to take measurements at regular intervals; it was too hard at 30 second intervals and
too big a temperature jumps were encountered if longer intervals were used.)
6. The measurements usually only showed small temperature differences between the top of the
TEG and the hot surface beside (and under) the TEG. So ice cubes were wrapped in alfoil (to stop
them melting on to the heat source and cooling it down) and regularly placed on the top of the
TEG for a short period. This made an immediate, large temperature difference between the top
side of the TEG and the hot side underneath, at which time the volts or amps produced was
measured.
7. The BBQ or cooktop was switched off after the BBQ temperature reached about 160 degrees
Centigrade and no more measurements were recorded. (The first TEG was destroyed when its
temperature got to about 180 degrees Centigrade).

Physics Scientific Method Mr Bunn
Tim Kelly Page 17
8. The temperature difference between the TEG side facing up and the BBQ or frypan was taken by
subtracting the recorded TEG surface temperature from the recorded BBQ or frypan
temperature. This was done for all results.
9. Wattage calculations were taken by squaring the measured Amps and then multiplying this by
the value of the resistor (500 Ohms in one experiment and 1,000 in another). A third experiment
measured Volts, so the Wattage was calculated by squaring the Volts and dividing by the value
of the resistor (1,000) Ohms).
10. All the measurements from each experiment were placed in pages of an Excel spreadsheet and
then mapped on a graph where the Temperature Difference was placed on the X-Axis in
ascending order, and the Watts (MilliWatts) were placed on the Y-Axis. Excel trend lines were
added to each graph to see which one was closest to the measured results and it turned out that
an Exponential trend line was the closest match for the measured power (Watts/MilliWatts)
output. This was checked by having Excel graph the results with a Logarithmic scale and seeing
that the trend line then looked linear.
11. The early experiment to check that the generated TEG voltage was linear, was done twice. The
experiment to measure the wattage was done three times, twice measuring the Amps and once
measuring the Volts. For each of these three experiments the power (watts) was calculated from
the Amps and resistance or the Volts and resistance.
Physics Scientific Method Mr Bunn
Tim Kelly Page 18
Main Experiment
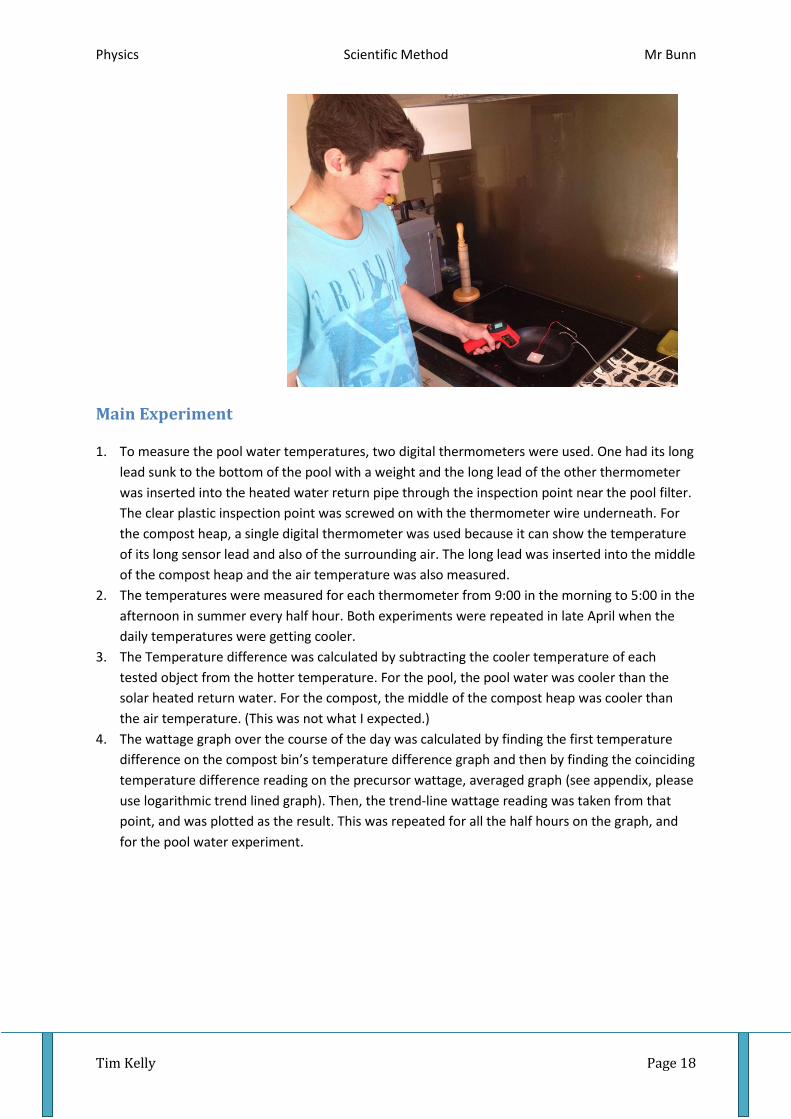
1. To measure the pool water temperatures, two digital thermometers were used. One had its long
lead sunk to the bottom of the pool with a weight and the long lead of the other thermometer
was inserted into the heated water return pipe through the inspection point near the pool filter.
The clear plastic inspection point was screwed on with the thermometer wire underneath. For
the compost heap, a single digital thermometer was used because it can show the temperature
of its long sensor lead and also of the surrounding air. The long lead was inserted into the middle
of the compost heap and the air temperature was also measured.
2. The temperatures were measured for each thermometer from 9:00 in the morning to 5:00 in the
afternoon in summer every half hour. Both experiments were repeated in late April when the
daily temperatures were getting cooler.
3. The Temperature difference was calculated by subtracting the cooler temperature of each
tested object from the hotter temperature. For the pool, the pool water was cooler than the
solar heated return water. For the compost, the middle of the compost heap was cooler than
the air temperature. (This was not what I expected.)
4. The wattage graph over the course of the day was calculated by finding the first temperature
difference on the compost bin’s temperature difference graph and then by finding the coinciding
temperature difference reading on the precursor wattage, averaged graph (see appendix, please
use logarithmic trend lined graph). Then, the trend-line wattage reading was taken from that
point, and was plotted as the result. This was repeated for all the half hours on the graph, and
for the pool water experiment.
Physics Scientific Method Mr Bunn
Tim Kelly Page 19
Results
All the measurements and graphs from all experiments are in the Appendix.
Precursor
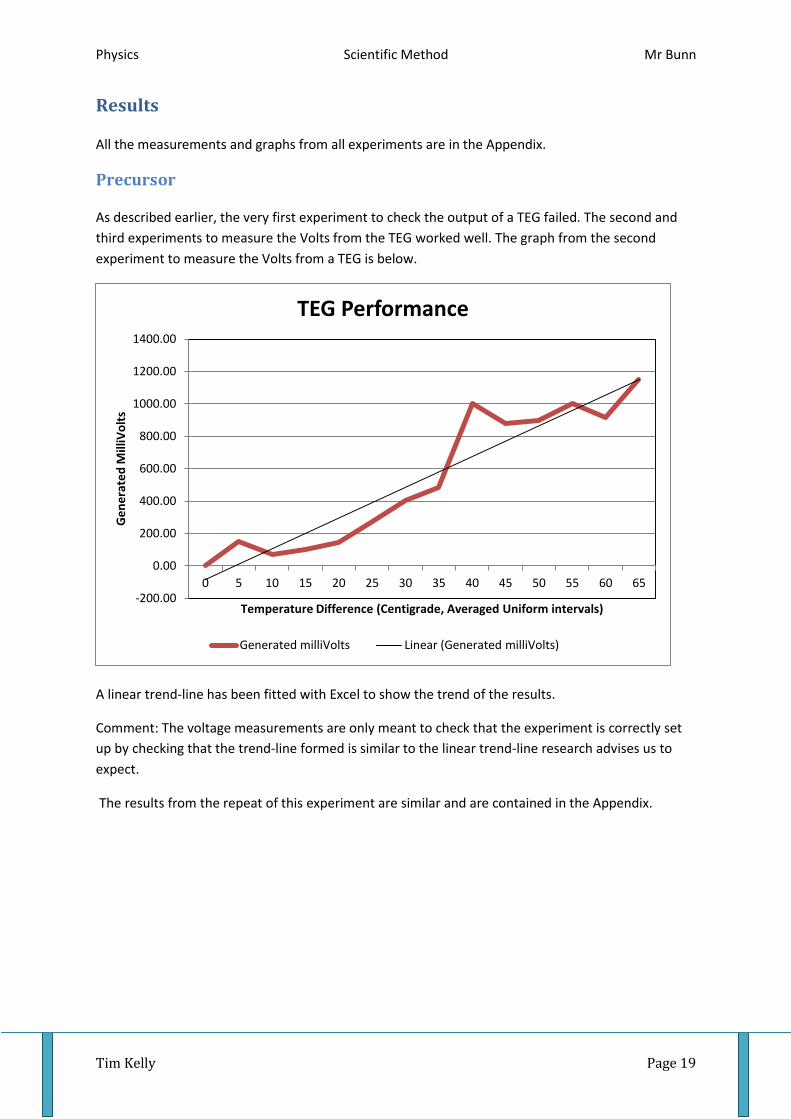
As described earlier, the very first experiment to check the output of a TEG failed. The second and
third experiments to measure the Volts from the TEG worked well. The graph from the second
experiment to measure the Volts from a TEG is below.
A linear trend-line has been fitted with Excel to show the trend of the results.
Comment: The voltage measurements are only meant to check that the experiment is correctly set
up by checking that the trend-line formed is similar to the linear trend-line research advises us to
expect.
The results from the repeat of this experiment are similar and are contained in the Appendix.
-200.00
0.00
200.00
400.00
600.00
800.00
1000.00
1200.00
1400.00
0 5 10 15 20 25 30 35 40 45 50 55 60 65
Ge
ne
rate
d M
illiV
olt
s
Temperature Difference (Centigrade, Averaged Uniform intervals)
TEG Performance
Generated milliVolts Linear (Generated milliVolts)

Physics Scientific Method Mr Bunn
Tim Kelly Page 20
Precursor Wattage
The first experiment to calculate the power from the TEG was done with a 500 Ohm resistor and
measuring the Amps. The graph of the results is below and it looks flat at first and then it looks linear.
Research had indicated that the power should increase in a gentle exponential graph.
Below is the same graph done with a Logarithmic scale.
0.0000
5.0000
10.0000
15.0000
20.0000
25.0000
30.0000
35.0000
40.0000
45.0000
5 15 25 35 45 55 65 75 85 95 105 115 125 135 145 155
Po
we
r (M
illiw
atts
)
Temperature Difference (Centigrade)
TEG Power (MilliWatts)
Power (MilliWatts)
0.0010
0.0100
0.1000
1.0000
10.0000
100.0000
1000.0000
5 15 25 35 45 55 65 75 85 95 105 115 125 135 145 155
Po
we
r (M
illiW
atts
, Lo
gari
thm
ic S
cale
)
Temperature Difference (Centigrade)
TEG Power (MilliWatts)
Power (MilliWatts) Expon. (Power (MilliWatts))

Physics Scientific Method Mr Bunn
Tim Kelly Page 21
The results from the two repeats of this experiment (one measuring Volts and another measuring
Amps) are contained in the Appendix. The shape of their results looks pretty similar to the graphs
above.
However, the two repeats used 1,000 Ohm resistors and the calculated watts is much lower in both
cases – less than half the power produced when a 500 Ohm resistor was used.

Physics Scientific Method Mr Bunn
Tim Kelly Page 22
Main Experiment
Compost:
Measurements were conducted over two separate days.
The temperature in the middle of the compost heap, and the outside air temperature, were
measured every half an hour from 9am to 5pm. The graph from the first experiment is below:
0
5
10
15
20
25
30
35
Tem
pe
ratu
re (
Ce
nti
grad
e)
Time of Day
Compost vs Air Temperature
Air Inside Compost Temperature Difference

Physics Scientific Method Mr Bunn
Tim Kelly Page 23
The experiment was repeated in late April and its results look like this:
0
5
10
15
20
25
30
Tem
pe
ratu
re (
Ce
nti
grad
e)
Time of Day
Compost vs Air Temperature
Air Inside Compost Temperature Difference

Physics Scientific Method Mr Bunn
Tim Kelly Page 24
Pool Water:
Measurements were conducted over two separate days – the same days as the Compost bin
measurements.
Like the compost heap, the temperature of the pool water and the solar heated pool water, were
measured every half hour from 9am to 5pm. All the measurements and graphs are in the Appendix,
with the graph of the first experiment in late summer, and then the repeat in April, are both below:
0
5
10
15
20
25
30
35
40
45
50
Tem
pe
ratu
re (
Ce
nti
grad
e)
Time of Day
Solar-Heated Pool Water versus Pool Temperature
Swimming Pool Water Solar heated water Temperature Difference

Physics Scientific Method Mr Bunn
Tim Kelly Page 25
0
5
10
15
20
25
30
35
40
Tem
pe
ratu
re (
Ce
nti
grad
e)
Time of Day
Solar-Heated Pool Water versus Pool Temperature
Swimming Pool Water Solar Heated Water Temperature Difference

Physics Scientific Method Mr Bunn
Tim Kelly Page 26
Compost Bin Wattage
The following table was made by listing the temperature differences from the first set of compost
temperatures, and then using the temperature differences to calculate the wattage that the TEG
could generate (see the Appendix). The first set of compost measurements were used because they
showed the biggest temperature differences. The wattage estimates were taken from the first TEG
wattage graph in the precursor experiment because it showed the most watts generated (because it
used a 500 Ohm resistor not a 1,000 Ohm resistor).
Wattage Calculation
Time Temperature
difference Resistance
(ohms)
Corresponding Wattage (in MilliWatts)
9:00:00 AM 0 500 0.0000
9:30:00 AM 0.9 500 0.0009
10:00:00 AM 2.2 500 0.0021
10:30:00 AM 4.1 500 0.0222
11:00:00 AM 4.8 500 0.0260
11:30:00 AM 5.9 500 0.0302
12:00:00 PM 6.2 500 0.0318
12:30:00 PM 7.6 500 0.0390
1:00:00 PM 8.7 500 0.0446
1:30:00 PM 8.3 500 0.0425
2:00:00 PM 9.3 500 0.0477
2:30:00 PM 9.7 500 0.0497
3:00:00 PM 7.3 500 0.0374
3:30:00 PM 6.7 500 0.0343
4:00:00 PM 5.8 500 0.0297
4:30:00 PM 6.1 500 0.0313
5:00:00 PM 3.8 500 0.0195

Physics Scientific Method Mr Bunn
Tim Kelly Page 27
Pool Water Wattage
The following table was made the same way as the table above for the Compost Bin, but using the
set of temperature differences from the first set of pool water measurements (because these
showed the biggest temperature differences).
Wattage Calculation
Time Temperature
difference Resistance
(ohms)
Corresponding Wattage (in MilliWatts)
9:00:00 AM 4.4 500 0.0239
9:30:00 AM 5.4 500 0.0277
10:00:00 AM 7 500 0.0359
10:30:00 AM 9.4 500 0.0482
11:00:00 AM 11 500 0.0564
11:30:00 AM 12.3 500 0.0711
12:00:00 PM 13.4 500 0.0774
12:30:00 PM 15.1 500 0.1190
1:00:00 PM 16.6 500 0.1308
1:30:00 PM 17 500 0.1339
2:00:00 PM 19.2 500 0.3013
2:30:00 PM 20.2 500 0.3170
3:00:00 PM 18.9 500 0.2295
3:30:00 PM 18.2 500 0.2210
4:00:00 PM 16.6 500 0.1308
4:30:00 PM 15 500 0.1182
5:00:00 PM 12.2 500 0.0705
Physics Scientific Method Mr Bunn
Tim Kelly Page 28
Discussion
Precursor Experiment:
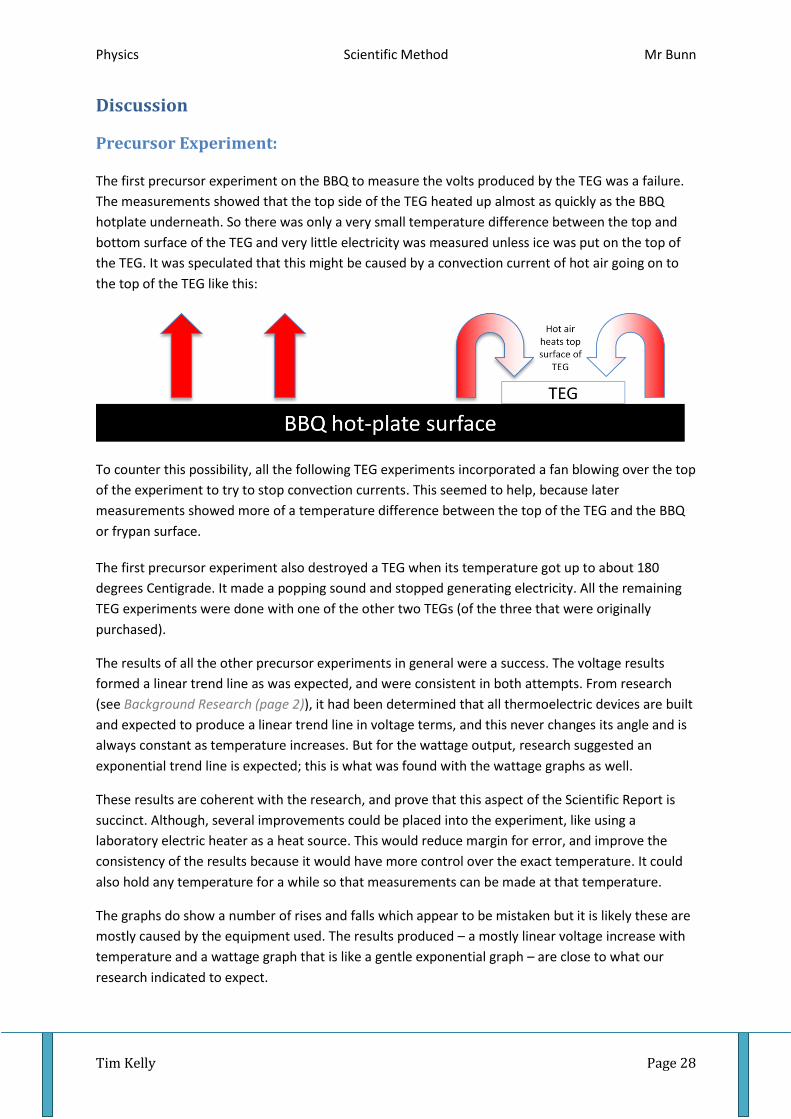
The first precursor experiment on the BBQ to measure the volts produced by the TEG was a failure.
The measurements showed that the top side of the TEG heated up almost as quickly as the BBQ
hotplate underneath. So there was only a very small temperature difference between the top and
bottom surface of the TEG and very little electricity was measured unless ice was put on the top of
the TEG. It was speculated that this might be caused by a convection current of hot air going on to
the top of the TEG like this:
To counter this possibility, all the following TEG experiments incorporated a fan blowing over the top
of the experiment to try to stop convection currents. This seemed to help, because later
measurements showed more of a temperature difference between the top of the TEG and the BBQ
or frypan surface.
The first precursor experiment also destroyed a TEG when its temperature got up to about 180
degrees Centigrade. It made a popping sound and stopped generating electricity. All the remaining
TEG experiments were done with one of the other two TEGs (of the three that were originally
purchased).
The results of all the other precursor experiments in general were a success. The voltage results
formed a linear trend line as was expected, and were consistent in both attempts. From research
(see Background Research (page 2)), it had been determined that all thermoelectric devices are built
and expected to produce a linear trend line in voltage terms, and this never changes its angle and is
always constant as temperature increases. But for the wattage output, research suggested an
exponential trend line is expected; this is what was found with the wattage graphs as well.
These results are coherent with the research, and prove that this aspect of the Scientific Report is
succinct. Although, several improvements could be placed into the experiment, like using a
laboratory electric heater as a heat source. This would reduce margin for error, and improve the
consistency of the results because it would have more control over the exact temperature. It could
also hold any temperature for a while so that measurements can be made at that temperature.
The graphs do show a number of rises and falls which appear to be mistaken but it is likely these are
mostly caused by the equipment used. The results produced – a mostly linear voltage increase with
temperature and a wattage graph that is like a gentle exponential graph – are close to what our
research indicated to expect.
Physics Scientific Method Mr Bunn
Tim Kelly Page 29
In the wattage experiment it was found that the trend line formed by the results was an exponential
curve. This means that as the temperature difference increased, not only did the wattage output
increase, but it increased in greater amounts with higher temperatures. This indicates that greater
efficiency may be taken from the TEGs when using them at higher temperatures. Note that some
measurement gaps exist in the results tables. This is because it was impossible to take this many
readings quickly enough across all temperature ranges, and this error may be unavoidable unless
better equipment is used such as a laboratory electric heater that was mentioned before.
Main Experiment:
These experiments were also consistent across all attempts and do not exhibit any bumps or dips in
the graph that might look like mistakes in the thermometer readings.
The compost bin experiment was surprising, as it was believed that the inside of the compost bin
would heat up as the day progressed because of the heat the bacteria inside the soil would be giving
off. But in fact the compost bin stayed at a very steady temperature of about 22 degrees centigrade,
and only rose very slightly to 23 degrees by the end of the day, and would no doubt fall back down
to 22 degrees over night. (After this was discovered, further research revealed that for compost to
get hot in the middle it has to be fresh and loose. The compost in the test bin was mostly old and dry,
except for the current new layer at the top.) When the ambient air temperature rose to about 32
degrees, this caused a peak temperature difference of about 10 degrees. This is not an ideal
temperature difference for generating electricity. At its peak point of a ten degree difference, the
TEG would only be capable of producing 0.05 milliwatts of power with the measured 500 Ohm
resistance. With 1 Ohm of resistance it should produce 500 times this amount, which is still only 25
milliwatts. This not nearly enough to produce 20 kilowatts of power. By dividing 20,000 watts by
0.025 watts (which is 25 milliwatts), we find we shall need 800,000 of these TEGs to produce 20
kilowatts of power. That's about 1,280m2 of TEGs. So using TEGs with a typical household compost
heap is not a practical house power generating method.
The pool water had better results, with the first set of measurements rising throughout the day until
about 3 o'clock and then began to fall back. The peak temperature difference here was twice that of
the compost, so about 20 degrees, and therefore capable of producing about 0.31 milliwatts with a
50 Ohm resistance. With a 1 Ohm resistance it should produce 500 times this amount, which is
about 155 milliwatts. This is better than with the compost bin, needing about 129,032 to produce 20
kilowatts, but this is still a rather impractical number. Using the TEGs bought for this experiment at a
price of $22 each, getting this many TEGs at this current time would cost about $2.8 million. No
doubt buying in large bulk would cost significantly less, but there is still the problem of fitting this
volume of TEGs into a space. Each TEG is 40mm square. So, 129,032 x 0.04m2 x 0.04m2 = 206m2
which is the total surface area of TEG that is needed to produce 20 kilowatts of electricity. Again this
is not a very practical number. However, the pool water experiment uses a liquid (water) to
transport the heat, so TEGs could be arranged in many ingenious ways to reduce their size, such as
making them into twin pipes that carry warm water in one direction and cool pool water in the other
direction. Even so, it is still impractical. Attempting to build a version of this type of device might be

Physics Scientific Method Mr Bunn
Tim Kelly Page 30
an interesting area to experiment in, to test whether these devices may be practical for producing
smaller amounts of power.
Another point to note about this experiment is that the weather and season in which the experiment
is conducted will change the result. This was part of the test; to see whether our house and the
climate surrounding it is capable of making practical use of these TEGs.
The precursor experiment and research has shown that as temperature increases, the wattage a TEG
produces increases in an exponential way, meaning it increases at a greater rate at higher
temperatures. This shows that TEGs are more efficient at greater temperatures.
Conclusion
In conclusion, the overall experiment was quite accurate with no mistakes of significant errors
hindering results. All results were consistent and coincided with what research (see page 2)
suggested. From a practical point of view the experiment proved that TEGs are not a viable power
source when running off small temperature differences such as 10 or 20 degrees Centigrade. They
require too large a surface area of TEGs to produce a typical household power of about 20 kilowatts,
and so the total cost is far too high. However, in the precursor experiment (see page 28) it was
discovered that a TEG gives much more output at higher temperatures. Therefore, it is suggested
that using TEGs in a higher temperature environment, such as in the sides of an oven, a wood-
burning heater, or a hot water heater, or anything with high temperatures, would be a much more
practical use. This could be an effective further field of experimentation. In comparison, the pool
water, as predicted in the hypothesis, did have a greater temperature difference, and therefore
produce more power than the compost bin.
References and Bibliography
Basford, L 1968, ELECTRICITY Made Simple, William Heinemann Ltd, 10 Upper Grosvenor Street, London.
How thermo-electric Teg generators work, 2012, TecTeg MFR., accessed 22 April 2013, <http://www.thermoelectric-
generator.com/brief_explaination_of_thermoelectric_power_generation.htm>..
Snyder, G 2008, Small Thermoelectric Generators, 1st edn, The electro Chemical Society, England, accessed 20 February 2013,
<http://www.electrochem.org/dl/interface/fal/fal08/fal08_p54-56.pdf>
Thermoelectric effect 17 February 2013, Wikipedia, accessed 20 February 2013,
<http://en.wikipedia.org/wiki/Seebeck_effect#Device_efficiency>.
Thermoelectric Generator 19 February 2013, Wikipedia, accessed 20 February 2013,
<http://en.wikipedia.org/wiki/Thermoelectric_generator>.
Thermoelectric TEG 2013, TEG, accessed 20 February 2013, <http://tegpower.com/>.
World Energy Crisis, 2010, Tax Payers, accessed 29 April 2013, <http://planetforlife.com/>