thermodynamic analysis of different configurations of
TRANSCRIPT

Mechanical Engineering Research; Vol. 5, No. 2; 2015 ISSN 1927-0607 E-ISSN 1927-0615
Published by Canadian Center of Science and Education
89
Thermodynamic Analysis of Different Configurations of Combined Cycle Power Plants
Munzer S. Y. Ebaid1 & Qusai Z. Al-hamdan2 1 Department of Mechanical engineering, Philadelphia University, Amman, Jordan 2 Perth College, University of the Highlands and Islands, Scotland, UK Correspondence: Munzer S. Y. Ebaid, Department of Mechanical engineering, Philadelphia University, P. O. Box 1, Amman, Jordan. Tel: 962-796-013-220 E-mail: [email protected] Received: August 15, 2015 Accepted: August 27, 2015 Online Published: November 12, 2015 doi:10.5539/mer.v5n2p89 URL: http://dx.doi.org/10.5539/mer.v5n2p89 Abstract Several modifications have been made to the simple gas turbine cycle in order to increase its thermal efficiency but within the thermal and mechanical stress constrain, the efficiency still ranges between 38 and 42%. The concept of using combined cycle power or CPP plant would be more attractive in hot countries than the combined heat and power or CHP plant. The current work deals with the performance of different configurations of the gas turbine engine operating as a part of the combined cycle power plant. The results showed that the maximum CPP cycle efficiency would be at a point for which the gas turbine cycle would have neither its maximum efficiency nor its maximum specific work output. It has been shown that supplementary heating or gas turbine reheating would decrease the CPP cycle efficiency; hence, it could only be justified at low gas turbine inlet temperatures. Also it has been shown that although gas turbine intercooling would enhance the performance of the gas turbine cycle, it would have only a slight effect on the CPP cycle performance. Keywords: gas turbines, steam turbines, CPP power plants, thermal efficiency 1. Introduction 1.1 Energy Scenario Energy is one of the primary needs of human societies for their survival. It is needed for growing food, providing comfort and catering for a host of other application in all fields of activity such as agriculture, industry, transportation. The main sources of energy are fossil fuels, solar radiation fall out, winds, tidal, and geothermal. The conversion, distribution and utilisation of energy are the domain of engineering. The demand for energy throughout the world is increasing sharply because of growing world population, rising living standards and emphasis on developing energy intensive industries in almost all newly emerging countries to boost their economies in order to combat poverty and hardship. Fossil fuels, coal, oil and gas, currently, provide more than 95% of the world’s energy need. However, the reserves of fossil fuels on planet earth are finite and they are depleting rapidly. It should be noted also that the use of fossil fuels through combustion pollutes the environmental with toxic gases and contributes to global warming. Hence the continuing use of fossil fuels is undesirable both for energy conservation as well as for environmental protection. Although sources of renewable energies appear to offer a promising alternative, their contribution to the world’s total energy demand is still less than 10% and it is unlikely to change substantially in the near future. Hence, in order to conserve fossil fuels, increasing the efficiency of the current power generation systems is of paramount importance. This may be achieved either by modifying the thermal plant configuration or by using advanced thermodynamic cycles for power generation. 1.2 Review of Previous Work Combined cycle researches dates back to the early part of the 20th century, however, research and development work on the combined gas turbine and steam turbine power generating plants started only in the late 1960s. Kehlhofer (1991) studied gas turbine power plant as a part of the combined cycle power plant and concluded that raising the gas turbine efficiency would not necessarily produce the best overall efficiency of the combined
www.ccsenet.org/mer Mechanical Engineering Research Vol. 5, No. 2; 2015
90
power plant. El-Masri (1985); El-Masri (1987) used the second law of thermodynamics and exergy analysis to locate and quantify the irreversibilities that cause loss of work output and of thermal efficiency of the gas turbine operating as a part of the combined power plant. He concluded that compressor inter-cooling will lead to an increase in specific work output, but this will happen with some reduction in thermal efficiency. Also, the dominant influence on cycle efficiency as turbine inlet temperature is raised will be the trade off between decreased combustion exergy losses and increased turbine blade cooling losses. Kail [5] analysed and evaluated different trends in combined cycle gas turbine power plant configurations. The various configurations have been compared with the simple cycle combined gas turbine/steam turbine power plant. The studied configurations were a combined reheat gas turbine/simple steam turbine power plant, a combined inter-cooled gas turbine/steam turbine power plant, a combined steam-cooled turbine blades gas turbine/steam turbine power plant, and a combined gas turbine/simple steam turbine power plant where the gas turbine has a closed-loop combustion chamber cooling system. In comparison with the 'simple' gas turbine, Kail concluded the followings:
i. Reheat of the gas turbine cannot transform its efficiency and output advantages into a lower cost of electrical power. The additional investments and higher maintenance costs overwhelm the thermodynamic advantages.
ii. Inter-cooling improves the efficiency and power output of the combined power plant. iii. The concept of steam-cooled turbine blades places very stringent requirements on the blade materials,
on the quality of the cooling steam and on the design of the closed cooling system. iv. The gas turbine with a closed combustion chamber cooling system is less problematic than the gas
turbine with a closed blade cooling system. v. The simple combined gas turbine/steam turbine power plant achieves the lowest costs of electrical
power and is therefore the best plant from an economic point of view. Cerri (1987) studied the CPP plant and proposed thermodynamic parameters or indices to quantify the plant performance. He varied the maximum gas turbine inlet temperature between 800o C and 1400o C, at the same time gas turbine pressure ratio was varied between 2 to 24. Afterburning was also taken into consideration. His calculations produced both the CPP plant thermal efficiency and the specific work output. Cerri summarised his findings in the form of the following conclusions.
i. The thermal efficiency of the CPP plant is independent of the gas turbine pressure ratio but it would be influenced slightly by the steam pressure if it was sufficiently high.
ii. The thermal efficiency of the CPP plant would be positively influenced by adding an afterburner only if the turbine inlet temperature was significantly low.
Rufli (1987) analysed the CPP plant also by using the basic thermodynamic calculations for both the gas turbine and the steam turbine cycles. The maximum gas turbine inlet temperature was varied between 900 oC to 1350 oC, at the same time the gas turbine pressure ratio was varied from 8 to 22. Afterburning was also taken into consideration. Rufli’s calculations produced values of the CPP plant thermal efficiency and of the total heat transfer area of the heat recovery steam generator. These calculations were simple and straightforward. Rufli presented a simple method for selecting the optimum parameters for the steam operating in a combined power and power plant cycle at any given gas turbine operating conditions. Bhinder and Mango (1995) used thermodynamics analysis to study the CPP plant performance. They concluded that the combined plant efficiency would be significantly higher than either the gas turbine efficiency or the steam turbine efficiency. The overall efficiency value of 60% for the CPP plant was shown to be achievable. In addition the thermal load on the environment was reduced to 59% of the gas turbine load working alone. The cycle calculations were simple and many of the losses were not included in the calculations. It would be difficult to achieve 60% thermal efficiency if all the losses were included in the calculations. Horloock (1995, 1997) carried out an extensive study of combined power plants. The early history and recent developments and future prospects for the combined gas turbine/steam turbine plant were described. He adopted a graphical method of predicting the performance of the gas turbine cycle, developed by Hawthorne and Davis (1956) to determine the optimum pressure ratio of the gas turbine that would give maximum overall efficiency of the combined power and power plant. Bannister, Cheruvu, Little, & McQuiggan (1995) considered the techniques required to achieve energy conversion efficiencies greater than 60%. Their recommendations were improvements in operating process parameters for both gas turbine power plant and steam power plant by raising the gas turbine inlet temperature to 1427o C, introducing advanced cooling techniques in the gas turbine, utilisation of both cycles heat losses through greater integration between the two plants, and improving

www.ccsenet.org/mer Mechanical Engineering Research Vol. 5, No. 2; 2015
91
component efficiencies. Sarabchi and Polley (1994) examined the effect of key operating variables like compressor pressure ratio, turbine inlet temperature and heat recovery boiler pressure on the performance parameters of a simple combined cycle and comparison was made to a simple gas turbine cycle. Both thermal efficiency and specific net work output were examined as compressor pressure ratio and recovery boiler pressure were varied for each turbine inlet temperature. They concluded the followings: For any given gas turbine inlet temperature, combined cycle maximum efficiency occurred at pressure ratios which were considerably less than those suitable for corresponding simple gas turbine maximum efficiency.
i. The combined cycle optimum pressure ratio is almost equal to the simple gas turbine optimum pressure ratio for maximum work output.
ii. The values of optimum pressure ratio and heat recovery boiler pressure for a combined cycle increased by increasing the gas turbine inlet temperature.
Shi, Agnew, and She (2011) presented a liquefied natural gas (LNG) gasification and power generation system integrated with a combined cycle power plant. A parametric analysis has been performed for the proposed combined system and they claimed that the net electrical efficiency and the work output of the proposed combined cycle can be increased by 3.8 per cent and 15.6 MW above those of the conventional combined cycle. Da Cunha Alves, De Franca Mendes Carneiro, Barbosa, Travieso, Pilidis, and Ramsden (2001) presented the concepts of intercooling and reheat for gas turbines, in a systematic way, using a model that includes the losses arised from turbomachinery and blades cooling, in order to evaluate their effects on the engine performance. They concluded that Intercooling promises large improvements in efficiency over the simple cycle, especially at high pressure ratios. Reheat on the other hand is much more suited to combined cycles. Chodkiewicz, Krysinski, and Porochnicki (2002) presented two examples of applications of a recuperated gas turbine incorporating external heat sources in the combined gas-turbine cycle and have been analyzed from the economic and ecological viewpoint. Andreades, Dempsey, and Peterson (2014) discussed the necessary modifications and issues for coupling an external heat source to reheat air combined cycles (RACC). With the open-air configuration used in RACC power conversion, the ability to also inject natural gas or other fuel to boost power at times of high demand provides the electric grid with contingency and flexible capacity while also increasing revenues for the operator. This combination provided several distinct benefits over conventional stand-alone natural gas combined cycle and peaking plants. Korakianitis, Grantstrom, Wassingbo, and Massardo (2005) used a computer program to evaluate the performance of various combined power plants using standard inputs for component efficiencies, and the design point for these plants is computed. It was found that the performance of the simple cycle gas turbine dominates the overall plant performance (plant efficiency and power). Furthermore, optimum parameters for the power plant based on design point power, hot water demand, and efficiency were shown. Gülen and Joseph (2011) described a simple, physics-based calculation method to estimate the off-design performance of a combined cycle power plant. A second law based approach to off-design performance estimation is found to be a highly viable tool for plant engineers and operators in cases where calculation speed with a small sacrifice in fidelity is of prime importance. Bassily (2015) studied the impacts of varying ambient temperature and relative humidity on the performance of the commercial combined cycle with the different gas turbine inlet-cooling techniques. The results indicated that the introduced innovative techniques for gas turbine inlet-cooling were the most suitable for hot and humid climates with improvements of up to 1.2 percentage point in the combined cycle efficiency and 1.4% in the power output when compared with the refrigeration and absorption gas turbine inlet-cooling systems. Chiesa and Macchi (2005) investigated three different approaches to break 60% efficiency in combined cycle power plants. These are the conventional open-loop air cooling; the closed-loop steam cooling for stator vanes and blades; and the use of two independent closed-loop circuits (steam for stator vanes and air for rotor blades). Thermodynamic analysis showed that efficiency higher than 61% can be achieved in the frame of current available technologies. Bianci, Melino, and Peretto (2006) presented a study on the effect of both inlet evaporative and overspray fogging on a wide range of combined power plants utilizing gas turbines. Results showed that high pressure inlet fogging influences performance of a combined cycle power plant. Palestra, Barigozzi, and Perdichizzi (2008) studied the effect of air inlet cooling systems based on cool thermal storage, applied to a combined power cycles. They investigated two systems, namely, ice harvester and stratified chilled water, and considering different plant location sites to investigate the influence of climatic conditions. Their results showed that both systems performed similarly in terms of gross extra production of energy. However, the ice harvester showed higher parasitic load due to chiller consumption, and warmer climates of the plant site
www.ccsenet.org/mer Mechanical Engineering Research Vol. 5, No. 2; 2015
92
resulted in a greater increase in the amount of operational hours than power output augmentation. Rahim (2012) carried out a performance analysis of a combined cycle gas turbine power plant with various inlet air-cooling systems, such as evaporative cooling, fogging, mechanical (electric) chiller cooling, and absorption cooling. The performance characteristics were determined for a set of actual operational parameters including ambient conditions (temperature and relative humidity), turbine inlet temperature, pressure ratio, etc. The results showed that power and efficiency improvements depend on ambient air temperature. In addition, by decreasing the ambient temperature and increasing the humidity of the air, the output power can be increased. Gülen and Smith (2010) carried out a study on the Rankin bottoming cycle (RBC) efficiency of the combined cycle (CC). They developed a CC_RBC performance model based on the second law and exergy concept. This model can enable the engineers to accurately estimate the performance that can be expected from a RBC for a given gas turbine exhaust gas temperature. Further work by Gulen S. C. (2011) to investigate the effect of auxiliary power consumption on combined cycle power plant efficiency. The results showed that the two largest contributors of auxiliary systems that effects the thermal efficiency of the combined plant are the boiler feed pumps and the heat rejection system. The different combined cycle parametric studies, reviewed in the literature, gave different conclusions about the optimum conditions for the gas turbine cycle as part of the combined power and power cycle. Therefore, the choice of optimum parameters for the gas turbine plant operating in the CPP plant environment appears to be a matter of personal preference. Also, the range of gas turbine power plant design parameters, particularly cycle pressure ratio, depends whether the plant is to be designed for maximum thermal efficiency or maximum specific work output. Therefore, the choice of optimum parameters between the maximum efficiency and the maximum specific work depends on the application. The main aim of the work reported in this paper was to investigate the potential gains that might be made in the overall efficiency of electrical power generation by combining gas turbine and steam turbine driven plants. Generally, the power generating plants efficiencies can be increased either by the utilization of cogeneration cycle (power and heat (CHP) plants or by combined cycle power (CPP) plants. Although the former is of simple structure and of higher thermal efficiency than the latter, this study is concerned mainly with latter type of plants (CPP). This is mainly due to the need for electricity and the hot climate nature of the developing countries. 2. Thermodynamic Analysis The gas and steam turbine plants (CCP) represent a complex system consisting of a number of rotational and stationary parts, each part is characterised by its own behaviour. The overall performance of these plants depends on the performance of its individual components and component matching. In a combined cycle power CPP plant, the gas turbine power plant produces electricity as well as exhaust heat that can be used to produce high pressure steam to operate a steam turbine plant and thus generate more electricity. Therefore, the design of a CPP plant will involve greater complexity especially because of the coupling between the two different types of power producing systems. Obviously the parametric study of the combined plant will be the first step in deciding the design criteria of both plants by understanding the influence of the main parameters on the CPP plant. Different configurations of CPP plant can be constructed as described hereafter:
i. Simple gas turbine cycle combined with simple steam cycle. ii. Simple gas turbine cycle combined with dual pressure steam cycle.
iii. Simple gas turbine cycle combined with dual pressure steam cycle. iv. Reheat gas turbine cycle combined with simple steam cycle. v. Gas turbine Intercooling cycle combined with simple steam cycle.
vi. Gas turbine Intercooling cycle combined with dual pressure steam cycle. In the current parametric study different configurations for the combined cycle were investigated. The combined simple gas turbine with single pressure steam cycle was thermodynamically analysed. The same analysis procedure may be applied to any of the configurations listed above. It should be noted here that the analysis presented in the following sections is for the completeness of the work and for comparison purposes. 2.1 Gas Turbine Power Plant Cycle Analysis A simple gas turbine plant was depicted schematically in Figure 1. This operates on the Joule/Brayton cycle and represented on the temperature-entropy diagram as shown in Figure 2.

www.ccsenet.org/mer Mechanical Engineering Research Vol. 5, No. 2; 2015
93
Figure 1. Schematic diagram of a simple gas turbine power plant
Figure 2. Temperature-Entropy diagram of the gas turbine cycle
2.1.1 Specific Heats of Air and Combustion Gases The thermodynamic properties of combustion gases and air at various stages throughout the gas turbine cycle are calculated by considering variation of temperature but without dissociation. Tables containing the values of the specific heats against temperature variation have been published in many references such as Chappel and Cockshutt (1974). In the present work, to compute the values of specific heats at constant pressure and various temperatures for air and combustion gases, data from the tables were fitted with polynomial curves to obtain Equations 1 to 5. These equations provide details of the polynomials. Here aT and gT refer to the average temperatures during the compression and expansion processes in the compressor and turbine respectively. For air at low temperature range of 200 to 800 K 41037243 107632.3102399.4109843.113784.0100189.1 aaaaPa TTTTC −−− ×−×+×+−×= (1) For air at high temperature range of 800 to 2200 K 38242 107421.3102882.25339.0109865.7 aaaPa TTTC −− ×+×−+×= (2) For specific heats of products of combustion TPaPg BffCC ))1/(( ++= (3) Where BT at low temperature range of 200 to 800 K 5114835232 102263.1108689.2101709.2108116.25164.41059494.3 gggggT TTTTTB −−−− ×−×+×−×++×−= (4) and BT at high temperature range of 800 to 2200 K 51441036233 10206117100669.3102401.110916.11416.0100888.1 gggggT TTTTTB −−−− ×−×+×−×+−×= (5) 2.1.2 Thermodynamic Governing Equations i. Air intake Process atmlosso PP )1(1 ξ−= (6) ii. Air Compression Process Compression work is given by:
−
=
−
1
1
1
21 aa
o
o
c
oPaac P
PTCmW
γγ
η (7)
Where the final stagnation temperature in the compression process ( 2oT ) equal
−
+=
−
1
1
1
2112
aa
o
o
c
ooo P
PTTT
γγ
η (8)
Similarly the final stagnation temperature 2oT at the end of the compression process cannot be computed directly from Equation 8. This is because the air specific heat ratio aγ is a function of the mean stagnation temperature across the compression process. Therefore, in order to compute 2oT , an iterative method was used.
Compressor Gas TurbineCombustion Chamber
1
2 3
Fuel
4
Generator
+
-
T
S
1
2
3
4rt=Po3/Po4
rc=Po2/Po1
0
Isentropic
www.ccsenet.org/mer Mechanical Engineering Research Vol. 5, No. 2; 2015
94
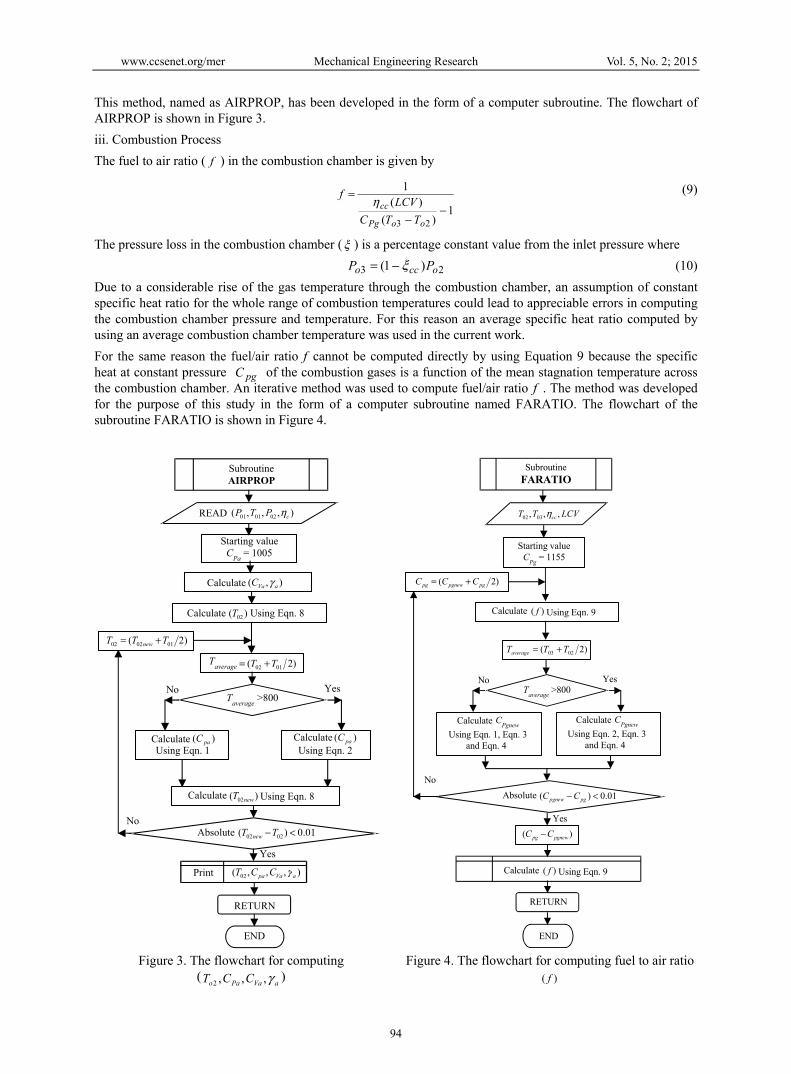
This method, named as AIRPROP, has been developed in the form of a computer subroutine. The flowchart of AIRPROP is shown in Figure 3. iii. Combustion Process The fuel to air ratio ( f ) in the combustion chamber is given by
1
)()(
1
23−
−
=
ooPg
ccTTC
LCVf
η (9)
The pressure loss in the combustion chamber (ξ ) is a percentage constant value from the inlet pressure where 23 )1( occo PP ξ−= (10) Due to a considerable rise of the gas temperature through the combustion chamber, an assumption of constant specific heat ratio for the whole range of combustion temperatures could lead to appreciable errors in computing the combustion chamber pressure and temperature. For this reason an average specific heat ratio computed by using an average combustion chamber temperature was used in the current work. For the same reason the fuel/air ratio f cannot be computed directly by using Equation 9 because the specific heat at constant pressure pgC of the combustion gases is a function of the mean stagnation temperature across the combustion chamber. An iterative method was used to compute fuel/air ratio f . The method was developed for the purpose of this study in the form of a computer subroutine named FARATIO. The flowchart of the subroutine FARATIO is shown in Figure 4.
Figure 3. The flowchart for computing ( aVaPao CCT γ,,,2 )
Figure 4. The flowchart for computing fuel to air ratio )( f
SubroutineAIRPROP
READ
Calculate
Using Eqn. 2
Calculate Using Eqn. 8
RETURN
END
Yes
No
YesNo
Starting valueCPa = 1005
),,,( 020101 cPTP η
),( aVaC γ
Calculate Using Eqn. 8)( 02T
Taverage )2( 0102 TT +=
)2( 010202 TTT new +=
Taverage >800
Using Eqn. 1Calculate )( paC Calculate )( paC
)( 02newT
01.0)( 0202 <−TT newAbsolute
),,,( 02 aVapa CCT γPrint
SubroutineFARATIO
RETURN
END
Yes
No
YesNo
Starting valueCPg = 1155
LCVTT cc ,,, 0302 η
)2( pgpgnewpg CCC +=
Taverage >800
)2( 0203 TTTaverage +=
Using Eqn. 1, Eqn. 3and Eqn. 4
Calculate CPgnewUsing Eqn. 2, Eqn. 3
and Eqn. 4
Calculate CPgnew
01.0)( <− pgpgnew CCAbsolute
)( pgnewpg CC −
Calculate Using Eqn. 9)( f
Calculate Using Eqn. 9)( f
www.ccsenet.org/mer Mechanical Engineering Research Vol. 5, No. 2; 2015
95
iv. Gas Expansion Process The turbine power ( tW ) can be described as
−+=
−g
g
o
ootPgat P
PTCmfW
γγ
η
1
3
43 1)1( (11)
Where the exhaust stagnation temperature in the expansion process ( 4oT ) equal
−−=
−g
g
o
ootoo P
PTTT
γγ
η
1
3
4334 1 (12)
For the reasons explained earlier in this section, the values of the variable specific heat ratio were computed by using the mean temperature across the turbine. A computer subroutine named GASPROP was developed to calculate mean specific heat. The flowchart of subroutine GASPROP is similar to subroutine AIRPROP. Thermal efficiency of the gas turbine cycle gtη and work output gtW can be calculated from Equation 13a and Equation 13b ctgt WWW −= (13a) agtgt mWW = (13b) ( )LCVmfWW actgt −=η (14) For the reasons explained earlier in this section, the values of the variable specific heat ratio were computed by using the mean temperature across the turbine. A computer subroutine named GASPROP was developed to calculate mean specific heat. The flowchart of subroutine GASPROP is similar to subroutine AIRPROP. 2.2 Steam Turbine Power Plant Cycle Analysis The schematic diagram of a simple steam power plant operating on Rankine cycle is depicted in Figure 5, and its corresponding cycle on the temperature entropy diagram is presented in Figure 6. 2.2.1 Thermodynamic Governing Equations a. Heat recovery steam generator (HRSG) The energy balance in the steam generator can be expressed as follows: )hh(m)TT(C)f(m )st()st(stB)gt(o)gt(oPga 12641 −=−+ η (15) The gas stack temperature )( )(6 gtoT should be kept as low as possible, but at the same time condensation should be avoided. The lowest stack temperature is determined by the fuel type used, for instance sulfuric fuels should have a higher stack temperature. The temperature-heat diagram of the heat recovery steam generator is shown in Figure 7. The heat added to the water or the steam was supplied in three steps:
i. The economizing step where the temperature of water rises from )(1 stT to the saturation liquid temperature at that boiler pressure.
ii. The evaporation step where the water absorbs heat at constant temperature.
iii. The superheating step where the temperature of steam increases from the saturation temperature to the
desired maximum superheated temperature )( )(2 stT .

www.ccsenet.org/mer Mechanical Engineering Research Vol. 5, No. 2; 2015
96
Figure 5. Schematic diagram of a simple steam power plant
Figure 6. Temperature-Entropy diagram of the simple steam turbine cycle
Figure 7. Temperature variation in the heat recovery boiler
satstsatstgtost TTTT )(2)(2)(4sup)(2 )( +−= ε (16) Where satstT )(2 is the saturated temperature at the )(2 stP
Steam Turbine
Condenser
Pump1
34
Generator
+
-
Boiler
Fuel
Air
Exhaust gases
2
Gas side
Steam sideEconomizing
Evaporation
SuperheatingPP
0 100
(sup)0T04T
)(0 stT
satstT )(2)(0 evpT06T
)(1 stT
TEM
PERA
TURE
HEAT SUPPLIED (%)Q
)(T
www.ccsenet.org/mer Mechanical Engineering Research Vol. 5, No. 2; 2015
97
The enthalpy of the steam at the exit of the boiler )( )(2 sth is ),( )(2)(2)(2 ststst PTfh = (17) and satstevpo TPPT )(2)( += (18) where )(evpoT is the gas temperature at the exit of the evaporator.
sat(lg))st(
)evp(ooPgBast hh
)TT(C)f(mm
22
41−
−+=
η
sat(lg))st(
)evp(ooPgBast hh
)TT(C)f(mm
22
41−
−+=
η (19)
Where sath (lg)2 is the saturated liquid enthalpy at )(2 stP . The enthalpy of the water at the exit of the pump )( )(1 sth is ),( 4)(1)(1 SPfh stst = (20) And
Pga
)st(sat)lq(st)evp(oo C)f(m
)hh(mTT
+
−−=
112
6
(21)
The enthalpy of the steam at the exit of the steam turbine ( )(3 sth ) is ),( 3)(4)(3 SPfh stst = (22) The enthalpy of the water at the exit of the condenser ( )(4 sth ) is )( )(4)(4 stst Pfh = (23)
i. The heat exchange process in a counter flow heat recovery steam generator must satisfy the following conditions:
ii. The gas stack temperature )( )(6 gtoT must be greater than the inlet water temperature )T( )st(1 at least
by C10 .
iii. The gas temperature at the outlet of the evaporator )T( )evp(o must be greater than the liquid
saturation temperature of the steam )( )(2 satstT by a minimum value (pinch point temperature
difference (PP).
iv. The superheated steam temperature )( )(2 stT must be less than the gas turbine exhaust temperature
)(4( gtoT ).
The gas loss in the heat recovery steam generator is a percentage value from the atmospheric pressure where the heat recovery steam generator inlt could be expressed as a function of the atmospheric pressure as: atmHRSG PP )1(04 ξ−= (24) b. Feed Water Pump Power The feed water pump power ( PW ) can be described as
www.ccsenet.org/mer Mechanical Engineering Research Vol. 5, No. 2; 2015
98
( ))(4)(1 ststP
stP hhmW −=
η
(25)
Where, the entropy at state 1 equals the entropy at state 4. c. Steam Expansion The steam turbine power ( )(sttW ) can be described as ( ))(3)(2)()( stststtststt hhmW −= η (26) Where the entropy at state 2 equals the entropy at state 3. The efficiency of the steam turbine cycle ( stη ) can be described as:
)()1( 64
)(
oopga
Pstt
B
stst TTCfm
WWQW
−+−
==
η (27)
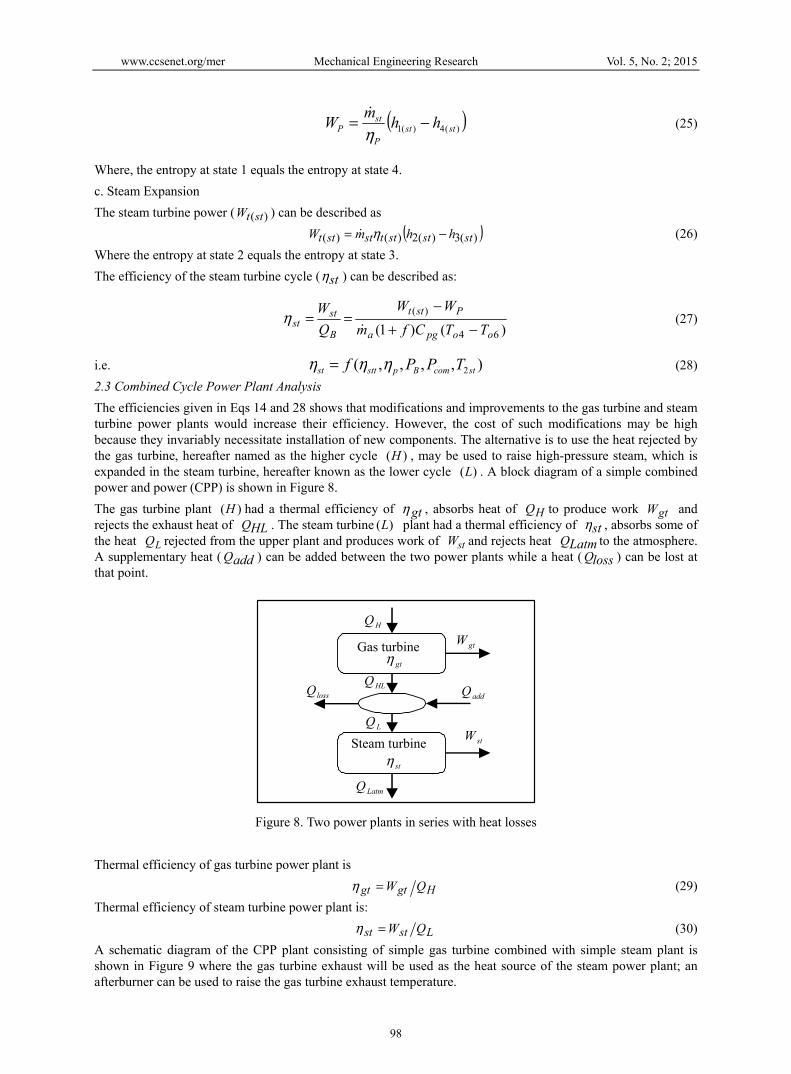
i.e. ),,,,( 2stcomBpsttst TPPf ηηη = (28) 2.3 Combined Cycle Power Plant Analysis The efficiencies given in Eqs 14 and 28 shows that modifications and improvements to the gas turbine and steam turbine power plants would increase their efficiency. However, the cost of such modifications may be high because they invariably necessitate installation of new components. The alternative is to use the heat rejected by the gas turbine, hereafter named as the higher cycle )(H , may be used to raise high-pressure steam, which is expanded in the steam turbine, hereafter known as the lower cycle )(L . A block diagram of a simple combined power and power (CPP) is shown in Figure 8. The gas turbine plant )(H had a thermal efficiency of gtη , absorbs heat of HQ to produce work gtW and rejects the exhaust heat of HLQ . The steam turbine )(L plant had a thermal efficiency of stη , absorbs some of the heat LQ rejected from the upper plant and produces work of stW and rejects heat LatmQ to the atmosphere. A supplementary heat ( addQ ) can be added between the two power plants while a heat ( lossQ ) can be lost at that point.
Figure 8. Two power plants in series with heat losses
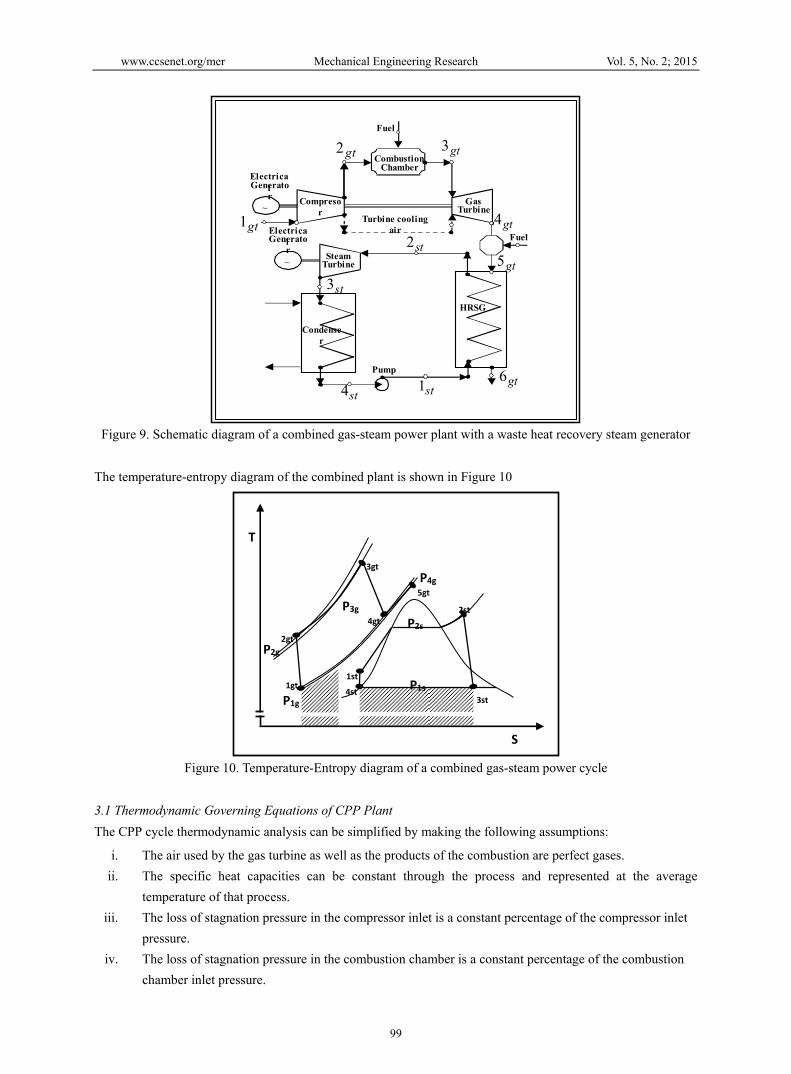
Thermal efficiency of gas turbine power plant is Hgtgt QW=η (29) Thermal efficiency of steam turbine power plant is: Lstst QW=η (30) A schematic diagram of the CPP plant consisting of simple gas turbine combined with simple steam plant is shown in Figure 9 where the gas turbine exhaust will be used as the heat source of the steam power plant; an afterburner can be used to raise the gas turbine exhaust temperature.
Gas turbine
Steam turbine
gtη
LQ
gtW
stW
stη
HQ
HLQ
LatmQ
addQlossQ
www.ccsenet.org/mer Mechanical Engineering Research Vol. 5, No. 2; 2015
99
Figure 9. Schematic diagram of a combined gas-steam power plant with a waste heat recovery steam generator
The temperature-entropy diagram of the combined plant is shown in Figure 10
Figure 10. Temperature-Entropy diagram of a combined gas-steam power cycle
3.1 Thermodynamic Governing Equations of CPP Plant The CPP cycle thermodynamic analysis can be simplified by making the following assumptions:
i. The air used by the gas turbine as well as the products of the combustion are perfect gases. ii. The specific heat capacities can be constant through the process and represented at the average
temperature of that process. iii. The loss of stagnation pressure in the compressor inlet is a constant percentage of the compressor inlet
pressure. iv. The loss of stagnation pressure in the combustion chamber is a constant percentage of the combustion
chamber inlet pressure.
~ Compresor
GasTurbine
Turbine coolingair
HRSG.
~ SteamTurbine
Condenser
Pump
CombustionChamber
Fuel
Fuelgt1
ElectricalGenerator
ElectricalGenerator
gt2 gt3
gt4
gt5
gt6
st2
st3
st4 st1
T
3gt
1gt
P2g
P1g
P4g
P3g
1st
P2s
P1s
2gt
4st 3st
2st
5gt
4gt
S

www.ccsenet.org/mer Mechanical Engineering Research Vol. 5, No. 2; 2015
100
The specific work of the gas turbine cycle gtW can be described as
am
cWtW
amgtW
gtW
−== (31)
And the heat supplied to the steam power plant is given by: lossaddHLL QQQQ −+= (32) Thermal efficiency of the combined power plant is given by:
addH
stgtCPP QQ
WW++
=η (33)
or
)()( LCVfm
WWLCVm
WW
a
stgt
f
stgtCPP
+=
+=η (34)
Using Esq. 29, 30, 31 and 32, ccη can be developed to
Hadd
Hloss
gtH
addstgt
CPP
+
−−++
=1
1 ηηηη (35)
If there isn’t any supplementary heating ( )0=addQ and no heat loss ( )0=lossQ then
stgtstgtCPP ηηηηη −+= (36) Also, the specific work of the combined cycle CPPW can be described as
a
stgt
a
CPPCPP m
WWm
WW
+== (37)
Based on the previous thermodynamic analysis, it can be concluded that the thermal efficiency and specific work of the CPP plant are functions of many parameters as described by Equation 38 and Equation 39 where for each set of values of the parameters in these equations, there is only one solution for the CPPη and only one solution for CPPW .
,....),,
,,,,,,,,,(
)(2
2)(
psttst
stconmechgtcccpCPP
P
TPCrfW
ηηηηηηθ=
(38)
,....),,
,,,,,,,,(
)(2
2)(
psttst
stconmechgtcccpCPPP
TPCrf
ηηηηηηθη =
(39)
There are many gas turbine /steam turbine combined cycle configurations, therefore studying the effect of each parameter on each configuration performance will be very difficult and tedious to achieve. Simultaneous variations of the main parameters in both cycles would show the effect of these parameters on the combined cycle (CPP) performance. Calculations were made by varying some parameters and holding others constant. However, precautions for the current parametric analysis were taken into consideration as stated hereafter 2.4 Precautions for Using the Parametric Analysis The parameters can be varied within the following thermodynamic, technological and physical constraints:
www.ccsenet.org/mer Mechanical Engineering Research Vol. 5, No. 2; 2015
101
i. The temperature ratio θ can have any value starting from the ratio of )T/T( oo 12 to a maximum value
limited by the metallurgical consideration. ii. The pressure ratio (r) can have any value starting from one to a maximum value determind by
mechnical and aerodynamic factors such as stress and Mach number. iii. The steam temperature can be assumed all the values from the saturation temperature at that pressure to
a maximum value where the maximum value is tied to technological factors. iv. The steam pressure in the boiler and the condenser pressure are related to the wetness of the steam at
the exit of the steam turbine, which should lie between 0.9 and 1.0. this is because wet steam can have detrimental effect on turbine blades.
v. The exhaust gas temperature in the boiler should be higher than the temperature of the steam by a minimum value where this value is dependent on the economic and the design parameters.
vi. The stack exhaust temperature should be higher than the condensation temperature of water vapour in exhaust gas in order to prevent corrosive
Table 1. Assumed parameters’ values used in the parametric study
Parameter Assumed Values Parameter Assumed Values
1oT ( )K 293 )(gttη 0.88
1oP ( )kPa 101.3 )(gttη 0.88
3oT ( )K (1100 - 1700) )(sttη 0.87r (4 – 32) Bη 0.85
)(2 stP ( )bar 60 - 150 Pη 0.85
)(1 stP ( )bar 0.05 - 0.5 mecη 0.98
max)(3 stT ( )K 800 ξ 7%PP ( )K 15 erheatersupε 0.9
minD 0.88 LCV ( )kgkJ 42400
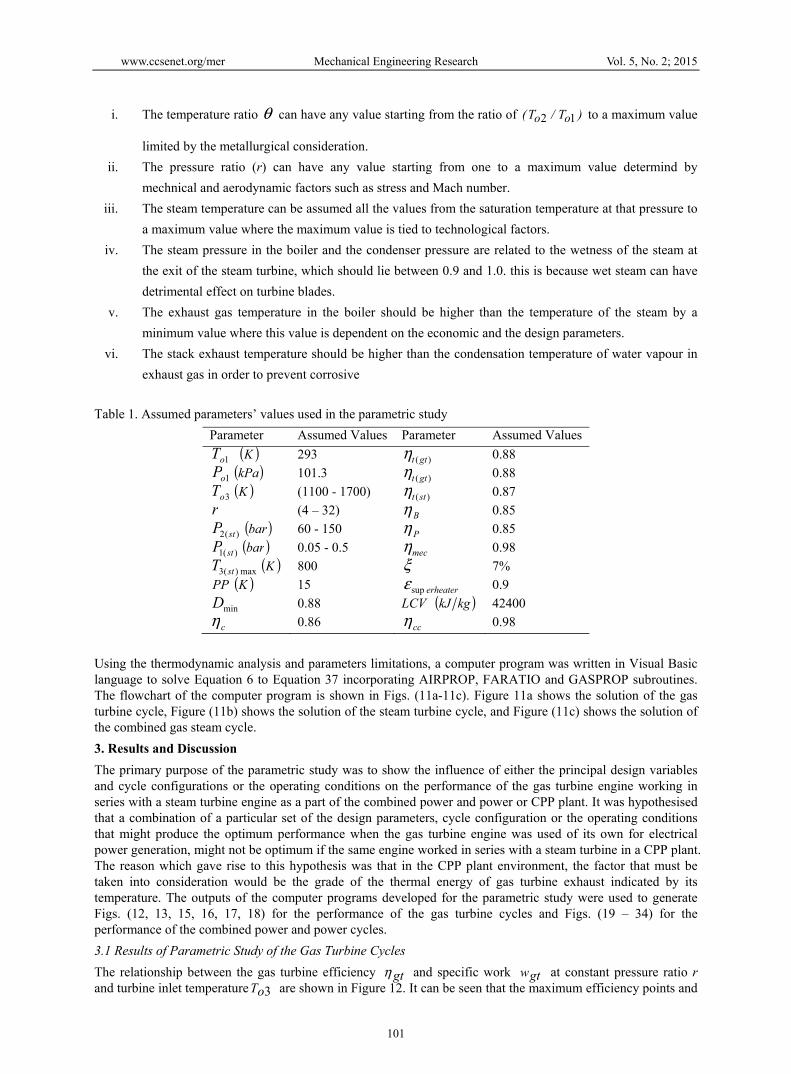
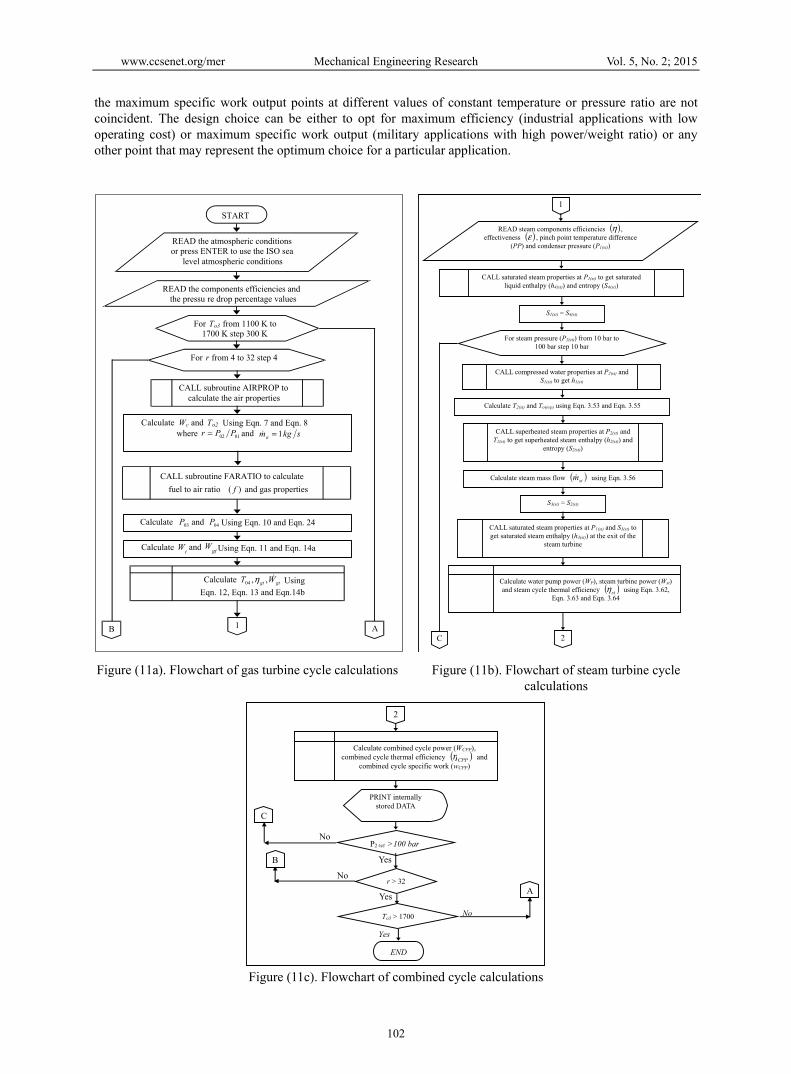
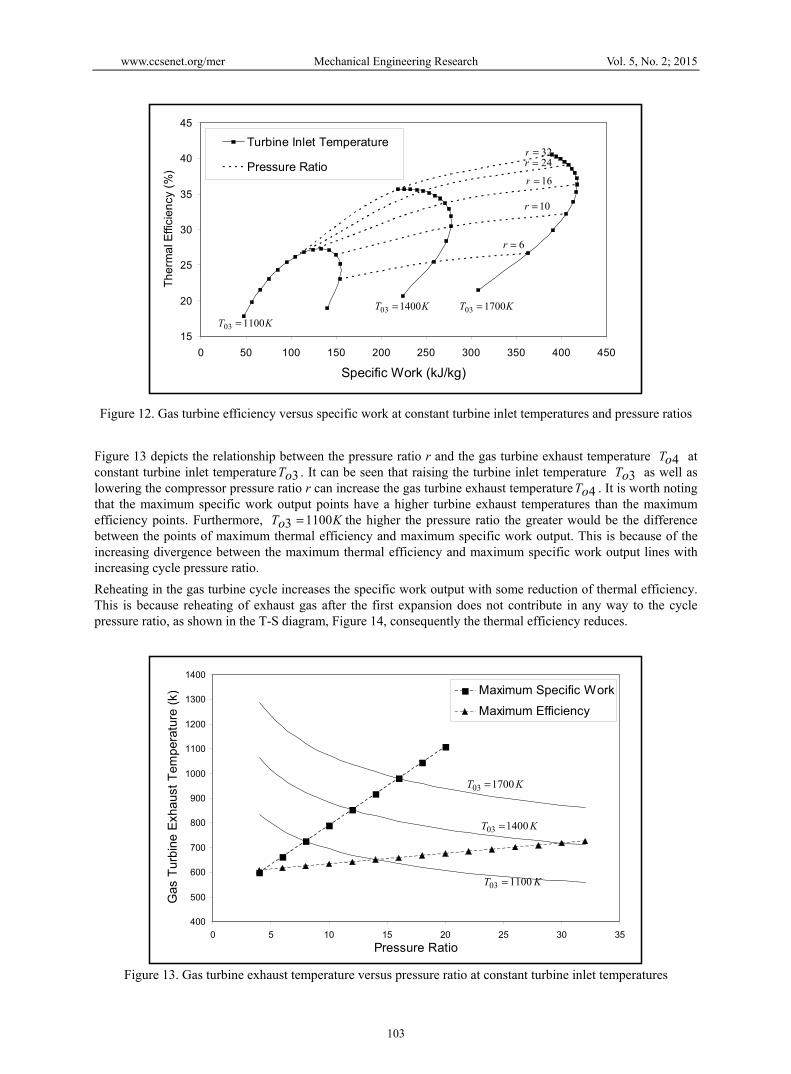
cη 0.86 ccη 0.98 Using the thermodynamic analysis and parameters limitations, a computer program was written in Visual Basic language to solve Equation 6 to Equation 37 incorporating AIRPROP, FARATIO and GASPROP subroutines. The flowchart of the computer program is shown in Figs. (11a-11c). Figure 11a shows the solution of the gas turbine cycle, Figure (11b) shows the solution of the steam turbine cycle, and Figure (11c) shows the solution of the combined gas steam cycle. 3. Results and Discussion The primary purpose of the parametric study was to show the influence of either the principal design variables and cycle configurations or the operating conditions on the performance of the gas turbine engine working in series with a steam turbine engine as a part of the combined power and power or CPP plant. It was hypothesised that a combination of a particular set of the design parameters, cycle configuration or the operating conditions that might produce the optimum performance when the gas turbine engine was used of its own for electrical power generation, might not be optimum if the same engine worked in series with a steam turbine in a CPP plant. The reason which gave rise to this hypothesis was that in the CPP plant environment, the factor that must be taken into consideration would be the grade of the thermal energy of gas turbine exhaust indicated by its temperature. The outputs of the computer programs developed for the parametric study were used to generate Figs. (12, 13, 15, 16, 17, 18) for the performance of the gas turbine cycles and Figs. (19 – 34) for the performance of the combined power and power cycles. 3.1 Results of Parametric Study of the Gas Turbine Cycles The relationship between the gas turbine efficiency gtη and specific work gtw at constant pressure ratio r and turbine inlet temperature 3oT are shown in Figure 12. It can be seen that the maximum efficiency points and
www.ccsenet.org/mer Mechanical Engineering Research Vol. 5, No. 2; 2015
102
the maximum specific work output points at different values of constant temperature or pressure ratio are not coincident. The design choice can be either to opt for maximum efficiency (industrial applications with low operating cost) or maximum specific work output (military applications with high power/weight ratio) or any other point that may represent the optimum choice for a particular application.
Figure (11a). Flowchart of gas turbine cycle calculations Figure (11b). Flowchart of steam turbine cycle calculations
Figure (11c). Flowchart of combined cycle calculations
START
READ the atmospheric conditionsor press ENTER to use the ISO sea
level atmospheric conditions
READ the components efficiencies andthe pressu re drop percentage values
For To3 from 1100 K to1700 K step 300 K
For r from 4 to 32 step 4
CALL subroutine AIRPROP tocalculate the air properties
Calculate Wc and To2 Using Eqn. 7 and Eqn. 8where and
CALL subroutine FARATIO to calculatefuel to air ratio and gas properties
Calculate and Using Eqn. 10 and Eqn. 24
Calculate and
1 AB
03P 04P
Eqn. 12, Eqn. 13 and Eqn.14b
Using Eqn. 11 and Eqn. 14a
0102 PPr = skgma 1=
)( f
WgtWt
Calculate Usinggtgt WT ,,04 η
1
READ steam components efficiencies ( )η , effectiveness ( )ε , pinch point temperature difference
(PP) and condenser pressure (P1(st))
CALL saturated steam properties at P1(st) to get saturated liquid enthalpy (h4(st)) and entropy (S4(st))
CALL compressed water properties at P2(st) and S1(st) to get h1(st)
For steam pressure (P2(st)) from 10 bar to 100 bar step 10 bar
Calculate T2(st) and To(evp) using Eqn. 3.53 and Eqn. 3.55
CALL superheated steam properties at P2(st) and T2(st) to get superheated steam enthalpy (h2(st)) and
entropy (S2(st))
Calculate steam mass flow ( )stm using Eqn. 3.56
CALL saturated steam properties at P1(st) and S3(st) to get saturated steam enthalpy (h3(st)) at the exit of the
steam turbine
S1(st) = S4(st)
S3(st) = S2(st)
Calculate water pump power (WP), steam turbine power (Wst) and steam cycle thermal efficiency ( )stη using Eqn. 3.62,
Eqn. 3.63 and Eqn. 3.64
2 C
2
PRINT internally stored DATA
END
Calculate combined cycle power (WCPP), combined cycle thermal efficiency ( )CPPη and
combined cycle specific work (wCPP)
r > 32
Yes
No
To3 > 1700
Yes
No
P2 (st) >100 bar
Yes
No
C
B
A
www.ccsenet.org/mer Mechanical Engineering Research Vol. 5, No. 2; 2015
103
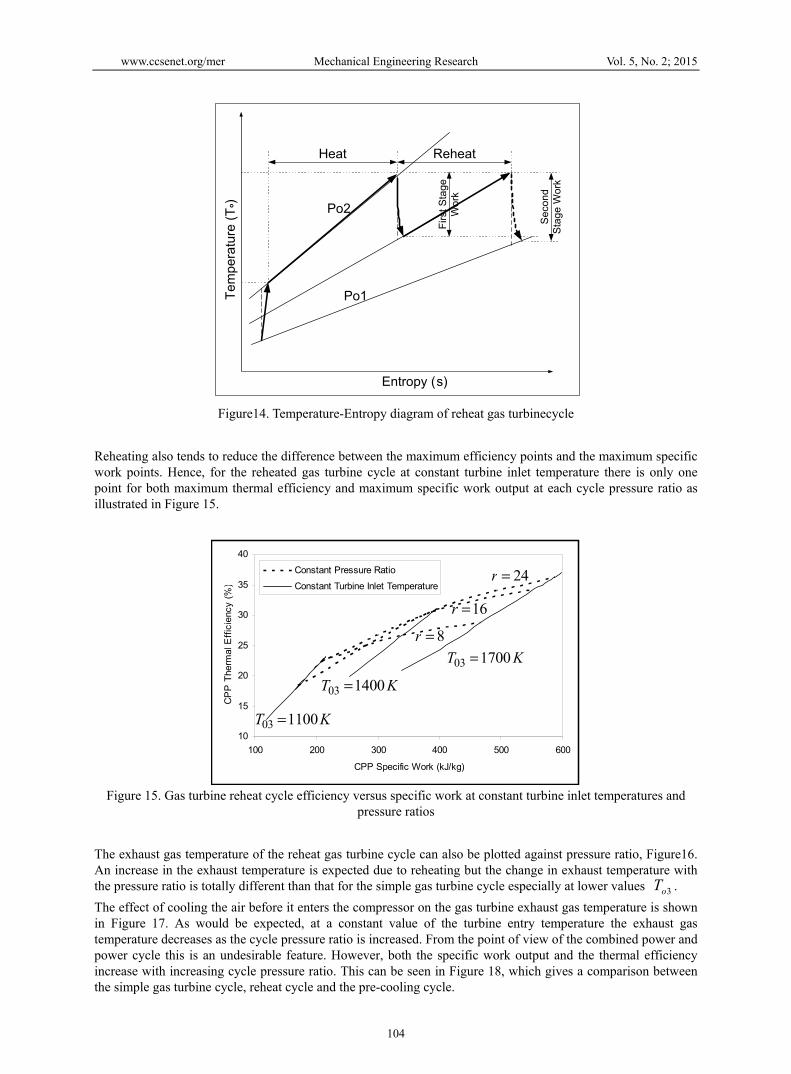
Figure 12. Gas turbine efficiency versus specific work at constant turbine inlet temperatures and pressure ratios Figure 13 depicts the relationship between the pressure ratio r and the gas turbine exhaust temperature 4oT at constant turbine inlet temperature 3oT . It can be seen that raising the turbine inlet temperature 3oT as well as lowering the compressor pressure ratio r can increase the gas turbine exhaust temperature 4oT . It is worth noting that the maximum specific work output points have a higher turbine exhaust temperatures than the maximum efficiency points. Furthermore, KoT 11003 = the higher the pressure ratio the greater would be the difference between the points of maximum thermal efficiency and maximum specific work output. This is because of the increasing divergence between the maximum thermal efficiency and maximum specific work output lines with increasing cycle pressure ratio. Reheating in the gas turbine cycle increases the specific work output with some reduction of thermal efficiency. This is because reheating of exhaust gas after the first expansion does not contribute in any way to the cycle pressure ratio, as shown in the T-S diagram, Figure 14, consequently the thermal efficiency reduces.
Figure 13. Gas turbine exhaust temperature versus pressure ratio at constant turbine inlet temperatures
KT 110003 =KT 140003 = KT 170003 =
6=r
10=r
15
20
25
30
35
40
45
0 50 100 150 200 250 300 350 400 450
Specific Work (kJ/kg)
Ther
mal
Effi
cien
cy (%
)
Turbine Inlet Temperature
Pressure Ratio16=r
24=r32=r
400
500
600
700
800
900
1000
1100
1200
1300
1400
0 5 10 15 20 25 30 35Pressure Ratio
Gas
Tur
bine
Exh
aust
Tem
pera
ture
(k) Maximum Specific Work
Maximum Efficiency
KT 170003 =
KT 140003 =
KT 110003 =
www.ccsenet.org/mer Mechanical Engineering Research Vol. 5, No. 2; 2015
104
Figure14. Temperature-Entropy diagram of reheat gas turbinecycle
Reheating also tends to reduce the difference between the maximum efficiency points and the maximum specific work points. Hence, for the reheated gas turbine cycle at constant turbine inlet temperature there is only one point for both maximum thermal efficiency and maximum specific work output at each cycle pressure ratio as illustrated in Figure 15.
Figure 15. Gas turbine reheat cycle efficiency versus specific work at constant turbine inlet temperatures and
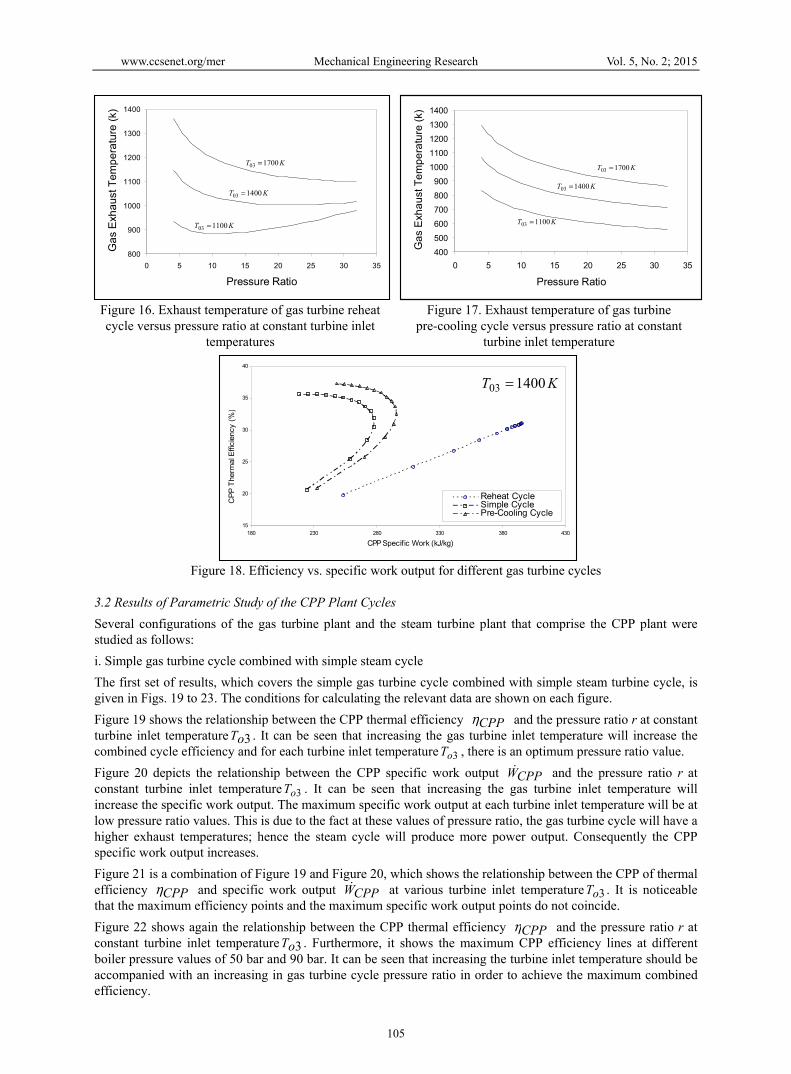
pressure ratios The exhaust gas temperature of the reheat gas turbine cycle can also be plotted against pressure ratio, Figure16. An increase in the exhaust temperature is expected due to reheating but the change in exhaust temperature with the pressure ratio is totally different than that for the simple gas turbine cycle especially at lower values 3oT . The effect of cooling the air before it enters the compressor on the gas turbine exhaust gas temperature is shown in Figure 17. As would be expected, at a constant value of the turbine entry temperature the exhaust gas temperature decreases as the cycle pressure ratio is increased. From the point of view of the combined power and power cycle this is an undesirable feature. However, both the specific work output and the thermal efficiency increase with increasing cycle pressure ratio. This can be seen in Figure 18, which gives a comparison between the simple gas turbine cycle, reheat cycle and the pre-cooling cycle.
Tem
pera
ture
(To )
Entropy (s)
Po2
Po1
Seco
ndSt
age
Wor
k
Firs
t Sta
geW
ork
Heat Reheat
KT 110003 =
KT 140003 =
8=rKT 170003 =
10
15
20
25
30
35
40
100 200 300 400 500 600
CPP Specific Work (kJ/kg)
CP
P T
herm
al E
ffici
ency
(%)
Constant Pressure RatioConstant Turbine Inlet Temperature
16=r
24=r
www.ccsenet.org/mer Mechanical Engineering Research Vol. 5, No. 2; 2015
105
Figure 16. Exhaust temperature of gas turbine reheat cycle versus pressure ratio at constant turbine inlet
temperatures
Figure 17. Exhaust temperature of gas turbine pre-cooling cycle versus pressure ratio at constant
turbine inlet temperature
Figure 18. Efficiency vs. specific work output for different gas turbine cycles
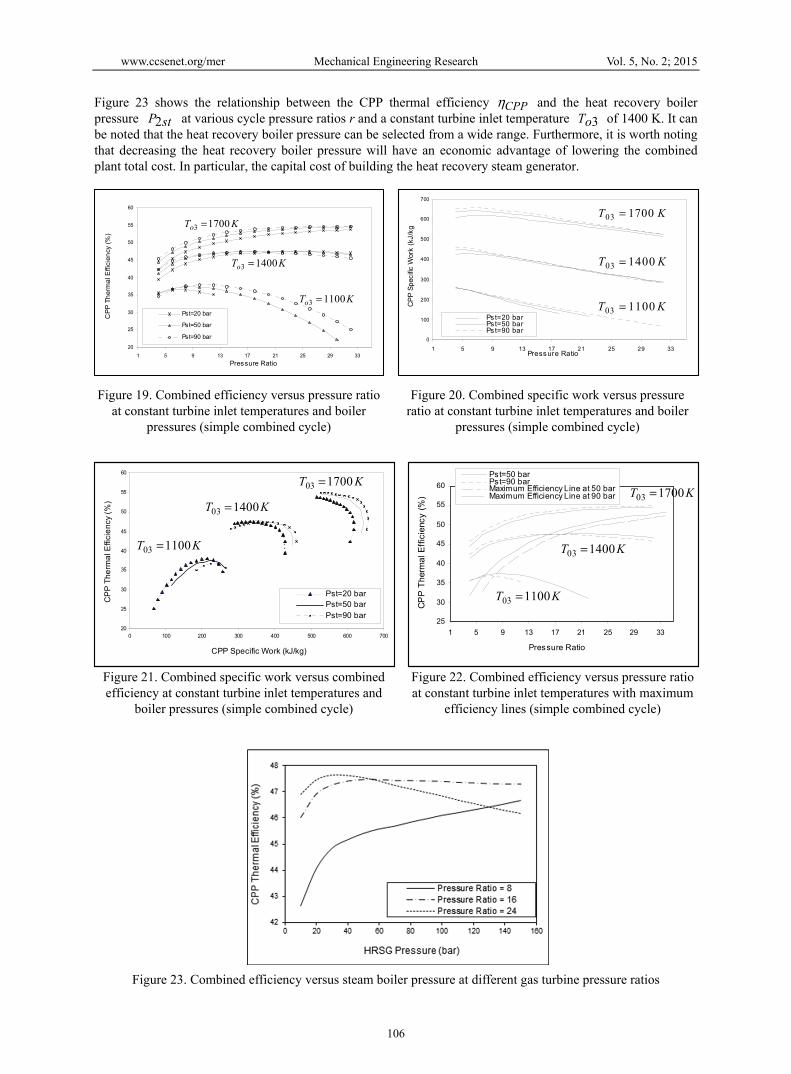
3.2 Results of Parametric Study of the CPP Plant Cycles Several configurations of the gas turbine plant and the steam turbine plant that comprise the CPP plant were studied as follows: i. Simple gas turbine cycle combined with simple steam cycle The first set of results, which covers the simple gas turbine cycle combined with simple steam turbine cycle, is given in Figs. 19 to 23. The conditions for calculating the relevant data are shown on each figure. Figure 19 shows the relationship between the CPP thermal efficiency CPPη and the pressure ratio r at constant turbine inlet temperature 3oT . It can be seen that increasing the gas turbine inlet temperature will increase the combined cycle efficiency and for each turbine inlet temperature 3oT , there is an optimum pressure ratio value. Figure 20 depicts the relationship between the CPP specific work output CPPW and the pressure ratio r at constant turbine inlet temperature 3oT . It can be seen that increasing the gas turbine inlet temperature will increase the specific work output. The maximum specific work output at each turbine inlet temperature will be at low pressure ratio values. This is due to the fact at these values of pressure ratio, the gas turbine cycle will have a higher exhaust temperatures; hence the steam cycle will produce more power output. Consequently the CPP specific work output increases. Figure 21 is a combination of Figure 19 and Figure 20, which shows the relationship between the CPP of thermal efficiency CPPη and specific work output CPPW at various turbine inlet temperature 3oT . It is noticeable that the maximum efficiency points and the maximum specific work output points do not coincide. Figure 22 shows again the relationship between the CPP thermal efficiency CPPη and the pressure ratio r at constant turbine inlet temperature 3oT . Furthermore, it shows the maximum CPP efficiency lines at different boiler pressure values of 50 bar and 90 bar. It can be seen that increasing the turbine inlet temperature should be accompanied with an increasing in gas turbine cycle pressure ratio in order to achieve the maximum combined efficiency.
800
900
1000
1100
1200
1300
1400
0 5 10 15 20 25 30 35
Pressure Ratio
Gas
Exh
aust
Tem
pera
ture
(k)
KT 110003 =
KT 140003 =
KT 170003 =
400500600700800900
10001100120013001400
0 5 10 15 20 25 30 35
Pressure Ratio
Gas
Exh
aust
Tem
pera
ture
(k)
KT 110003 =
KT 140003 =
KT 170003 =
15
20
25
30
35
40
180 230 280 330 380 430
CPP Specific Work (kJ/kg)
CPP
The
rmal
Effi
cien
cy (%
)
Reheat CycleSimple CyclePre-Cooling Cycle
KT 140003 =
www.ccsenet.org/mer Mechanical Engineering Research Vol. 5, No. 2; 2015
106
Figure 23 shows the relationship between the CPP thermal efficiency CPPη and the heat recovery boiler pressure stP2 at various cycle pressure ratios r and a constant turbine inlet temperature 3oT of 1400 K. It can be noted that the heat recovery boiler pressure can be selected from a wide range. Furthermore, it is worth noting that decreasing the heat recovery boiler pressure will have an economic advantage of lowering the combined plant total cost. In particular, the capital cost of building the heat recovery steam generator.
Figure 19. Combined efficiency versus pressure ratio at constant turbine inlet temperatures and boiler
pressures (simple combined cycle)
Figure 20. Combined specific work versus pressure ratio at constant turbine inlet temperatures and boiler
pressures (simple combined cycle)
Figure 21. Combined specific work versus combined efficiency at constant turbine inlet temperatures and
boiler pressures (simple combined cycle)
Figure 22. Combined efficiency versus pressure ratio at constant turbine inlet temperatures with maximum
efficiency lines (simple combined cycle)
Figure 23. Combined efficiency versus steam boiler pressure at different gas turbine pressure ratios
20
25
30
35
40
45
50
55
60
1 5 9 13 17 21 25 29 33Pressure Ratio
CPP
The
rmal
Effi
cien
cy (%
)
Pst=20 bar
Pst=50 bar
Pst=90 bar
KTo 11003 =
KTo 17003 =
KTo 14003 =
KT 110003 =
0
100
200
300
400
500
600
700
1 5 9 13 17 21 25 29 33Press ure Ratio
CPP
Spe
cific
Wor
k (k
J/kg
Ps t=20 barPs t=50 barPs t=90 bar
KT 140003 =
KT 170003 =
KT 110003 =
KT 140003 =
KT 170003 =
20
25
30
35
40
45
50
55
60
0 100 200 300 400 500 600 700
CPP Specific Work (kJ/kg)
CPP
The
rmal
Effi
cien
cy (%
)
Pst=20 barPst=50 barPst=90 bar
KT 110003 =
KT 140003 =
KT 170003 =
25
30
35
40
45
50
55
60
1 5 9 13 17 21 25 29 33
Pressure Ratio
CPP
The
rmal
Effi
cien
cy (%
)
Pst=50 barPst=90 barMaximum Efficiency Line at 50 barMaximum Efficiency Line at 90 bar
www.ccsenet.org/mer Mechanical Engineering Research Vol. 5, No. 2; 2015
107
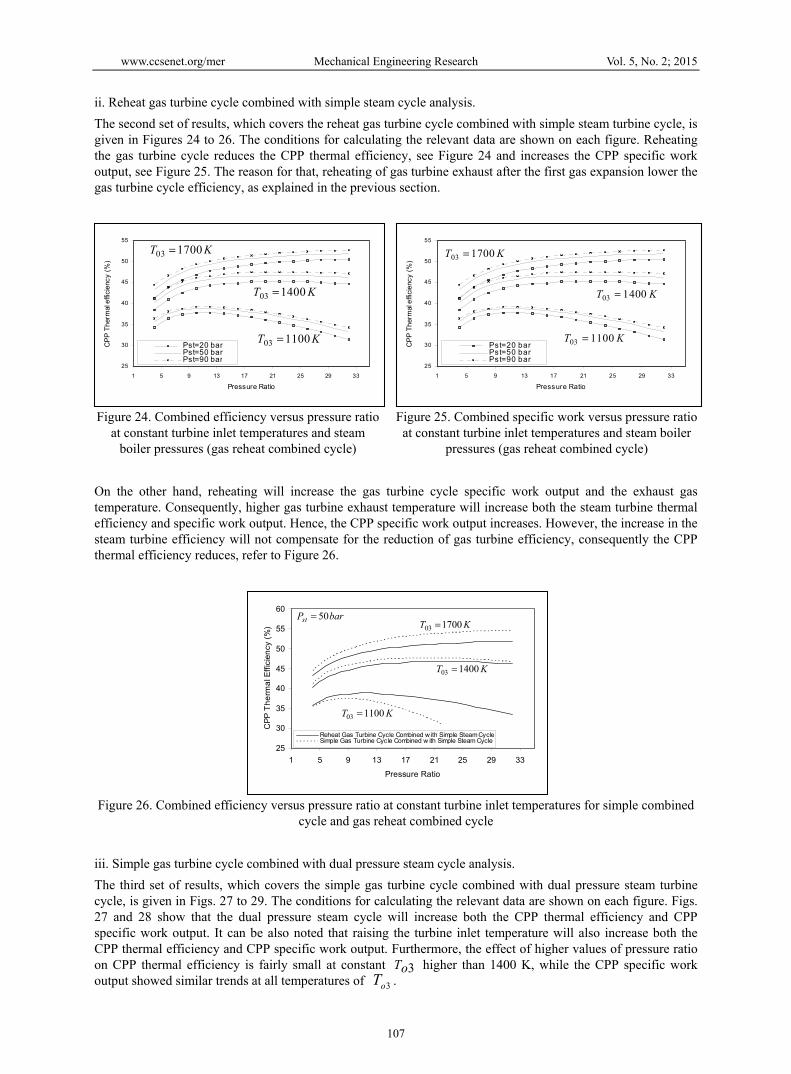
ii. Reheat gas turbine cycle combined with simple steam cycle analysis. The second set of results, which covers the reheat gas turbine cycle combined with simple steam turbine cycle, is given in Figures 24 to 26. The conditions for calculating the relevant data are shown on each figure. Reheating the gas turbine cycle reduces the CPP thermal efficiency, see Figure 24 and increases the CPP specific work output, see Figure 25. The reason for that, reheating of gas turbine exhaust after the first gas expansion lower the gas turbine cycle efficiency, as explained in the previous section.
Figure 24. Combined efficiency versus pressure ratio at constant turbine inlet temperatures and steam
boiler pressures (gas reheat combined cycle)
Figure 25. Combined specific work versus pressure ratio at constant turbine inlet temperatures and steam boiler
pressures (gas reheat combined cycle) On the other hand, reheating will increase the gas turbine cycle specific work output and the exhaust gas temperature. Consequently, higher gas turbine exhaust temperature will increase both the steam turbine thermal efficiency and specific work output. Hence, the CPP specific work output increases. However, the increase in the steam turbine efficiency will not compensate for the reduction of gas turbine efficiency, consequently the CPP thermal efficiency reduces, refer to Figure 26.
Figure 26. Combined efficiency versus pressure ratio at constant turbine inlet temperatures for simple combined
cycle and gas reheat combined cycle iii. Simple gas turbine cycle combined with dual pressure steam cycle analysis. The third set of results, which covers the simple gas turbine cycle combined with dual pressure steam turbine cycle, is given in Figs. 27 to 29. The conditions for calculating the relevant data are shown on each figure. Figs. 27 and 28 show that the dual pressure steam cycle will increase both the CPP thermal efficiency and CPP specific work output. It can be also noted that raising the turbine inlet temperature will also increase both the CPP thermal efficiency and CPP specific work output. Furthermore, the effect of higher values of pressure ratio on CPP thermal efficiency is fairly small at constant 3oT higher than 1400 K, while the CPP specific work output showed similar trends at all temperatures of 3oT .
KT 110003 =
KT 140003 =
KT 170003 =
25
30
35
40
45
50
55
1 5 9 13 17 21 25 29 33
Pressure Ratio
CPP
The
rmal
effi
cien
cy (%
)
Pst=20 barPst=50 barPst=90 bar
KT 110003 =
KT 140003 =
KT 170003 =
25
30
35
40
45
50
55
1 5 9 13 17 21 25 29 33
Pressure Ratio
CPP
The
rmal
effi
cien
cy (%
)
Ps t=20 barPst=50 barPst=90 bar
KT 110003 =
KT 140003 =
KT 170003 =
25
30
35
40
45
50
55
60
1 5 9 13 17 21 25 29 33
Pressure Ratio
CPP
The
rmal
Effi
cien
cy (%
)
Reheat Gas Turbine Cycle Combined w ith Simple Steam CycleSimple Gas Turbine Cycle Combined w ith Simple Steam Cycle
barPst 50=

www.ccsenet.org/mer Mechanical Engineering Research Vol. 5, No. 2; 2015
108
Figure 27. Combined efficiency versus pressure ratio at constant turbine inlet temperatures (simple gas and
dual pressure steam combined cycle)
Figure 28. Combined specific work versus pressure ratio at constant turbine inlet temperatures (simple gas
and dual pressure steam combined cycle) Figure 29 shows the comparison of various cycles; (a) Simple gas turbine cycle combined with simple steam cycle; (b) Simple gas turbine cycle combined with dual pressure steam cycle; and (c) Reheat gas turbine cycle combined with simple steam cycle. The trends of CPP thermal efficiency lines for theses cycles are similar. It also shows that Simple gas turbine cycle combined with simple steam cycle has the highest thermal efficiency.
Figure 29. Combined efficiency versus pressure ratio for simple combined cycle, simple gas combined with dual
pressure steam cycle and gas reheat combined cycle vi. Gas turbine Intercooling cycle combined with dual pressure steam cycle analysis. The fourth set of results, which covers the pre-cooling gas turbine cycle combined with dual pressure steam turbine cycle, is given in Figs. 30 and 31. The conditions for calculating the relevant data are shown on each figure. Figures 30 to 31 show that the pre-cooling gas turbine cycle combined with dual pressure steam turbine cycle will have a slight increase on both the CPP thermal efficiency and CPP specific work output. The trends of CPP for efficiency and specific work output are similar to the other combined cycles, i.e. increasing 3oT will increase both the CPP for thermal efficiency and specific work output. For comparison purposes of various studied cycles, Figure 33 above was drawn at 3oT of 1400 K and steam boiler pressure stP2 of 50 bar. It shows that the maximum efficiency can be attained with the gas turbine pre-cooling cycle combined with dual pressure steam cycle. However, it is worth mentioning that pre-cooling cycles require the addition of new component, this means adding complexity to the system as well as increasing the capital cost of the plant. Therefore, the selection of such a cycle might incur a heavy economic penalty.
KT 110003 =
KT 140003 =
KT 170003 =
20
25
30
35
40
45
50
55
60
1 5 9 13 17 21 25 29 33
Pressure Ratio
CPP
The
rmal
Effi
cien
cy (%
)
Pst=20 barPst=50 barPst=90 bar
KT 110003 =
KT 140003 =
KT 170003 =
0
100
200
300
400
500
600
700
800
1 5 9 13 17 21 25 29 33
Pressure Ratio
CPP
Spe
cific
Wor
k (k
J/kg
)
Pst=20 barPst=50 barPst=90 bar
KT 110003 =
KT 140003 =
KT 170003 =barPst 50=
25
30
35
40
45
50
55
60
1 5 9 13 17 21 25 29 33
Pressure Ratio
CPP
The
rmal
Effi
cien
cy (%
)
Simple Gas Turbine Cycle Combined w ith Dual Pressure Steam CycleSimple Gas Turbine Cycle Combined w ith Simple Steam CycleGas Turbine Reheat Cycle Combine w ith Simple Steam Cycle

www.ccsenet.org/mer Mechanical Engineering Research Vol. 5, No. 2; 2015
109
Figure 30. Combined efficiency versus pressure ratio at constant turbine inlet temperatures (gas turbine
intercooling cycle combined with dual pressure steam cycle)
Figure 31. Combined specific work versus pressure ratio at constant turbine inlet temperatures (gas turbine intercooling cycle combined with dual
pressure steam cycle)
Figure 32. Combined efficiency versus pressure ratio for simple combined cycle, gas intercooling combined
with dual pressure steam cycle and gas reheat cycle
Figure 33. Efficiency versus specific work for different gas turbine cycles at 1400 K turbine inlet temperature
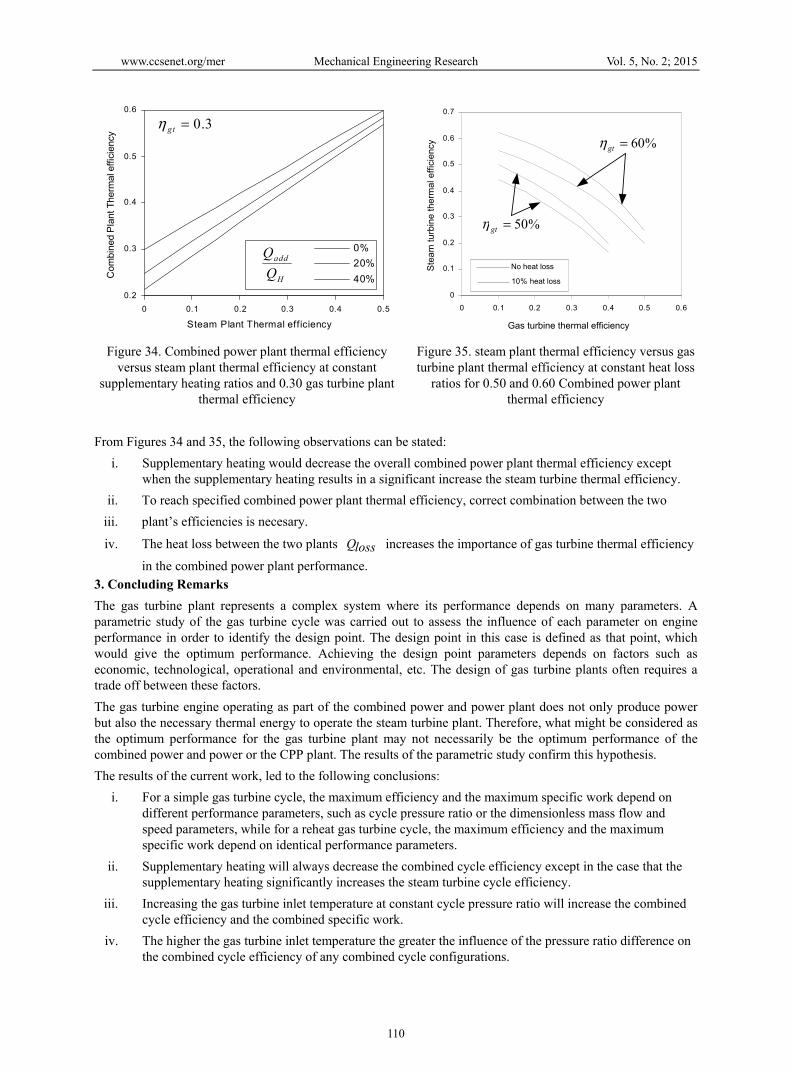
and 50 bar steam boiler pressure v. The Effect of Supplementary Heating on CPP Plant From Eq. 35 and with a constant higher cycle efficiency Hη of 0.3, the values of the combined efficiency
CPPη were calculated for a range of values of the lower cycle efficiency Lη at different values of supplementary heat ratios AHadd QQ . The results have plotted in Figure 34. Without supplementary heating
)QQ( Hadd 0= and by varying the gas turbine thermal efficiency gtη between 0.5 and 0.6, Equation 35 has been used to calculate the steam turbine thermal efficiency stη at two constant combined cycle efficiencies
CPPη of 0.5 and 0.6. The calculated results versus the gas turbine thermal efficiency is plotted in Figure 35 at two constant heat loss percentages of 0% and 10%.
KT 110003 =
KT 140003 =
KT 170003 =
25
30
35
40
45
50
55
60
1 5 9 13 17 21 25 29 33
Pressure Ratio
CPP
The
rmal
Effi
cien
cy
Pst=20 barPst=50 barPst=90 bar
KT 110003 =
KT 140003 =
KT 170003 =
0
100
200
300
400
500
600
700
800
1 5 9 13 17 21 25 29 33
Pressure Ratio
CPP
Spe
cific
Wor
k (k
J/kg
)
Pst=20 barPst=50 barPst=90 bar
KT 110003 =
KT 140003 =
KT 170003 =
25
30
35
40
45
50
55
60
1 5 9 13 17 21 25 29 33
Pressure Ratio
CPP
The
rmal
Effi
cien
cy (%
)
Simple Gas Turbine Cy cle Combined with Dual Pressure Steam Cy cleSimple Gas Turbine Cy cle Combined with Simple Steam CycleGas Turbine Reheat Cy cle Combine with Simple Steam Cy cle
barPst 50=
15
20
25
30
35
40
45
50
200 300 400 500 600
Specific Work (kJ/kg)
Ther
mal
Effi
cien
cy (%
)
Gas Turbine Reheat Cy cle
Gas Turbine Simple Cy cleCPP with Dual Pressure Steam Cy cle
CPP with Gas Turbine Reheat Cy cleCPP with Single Pressure Steam Cy cle
CPP with Gas Turbine Intercooling Cy cle
www.ccsenet.org/mer Mechanical Engineering Research Vol. 5, No. 2; 2015
110
Figure 34. Combined power plant thermal efficiency versus steam plant thermal efficiency at constant
supplementary heating ratios and 0.30 gas turbine plant thermal efficiency
Figure 35. steam plant thermal efficiency versus gas turbine plant thermal efficiency at constant heat loss
ratios for 0.50 and 0.60 Combined power plant thermal efficiency
From Figures 34 and 35, the following observations can be stated:
i. Supplementary heating would decrease the overall combined power plant thermal efficiency except when the supplementary heating results in a significant increase the steam turbine thermal efficiency.
ii. To reach specified combined power plant thermal efficiency, correct combination between the two iii. plant’s efficiencies is necesary. iv. The heat loss between the two plants lossQ increases the importance of gas turbine thermal efficiency
in the combined power plant performance. 3. Concluding Remarks The gas turbine plant represents a complex system where its performance depends on many parameters. A parametric study of the gas turbine cycle was carried out to assess the influence of each parameter on engine performance in order to identify the design point. The design point in this case is defined as that point, which would give the optimum performance. Achieving the design point parameters depends on factors such as economic, technological, operational and environmental, etc. The design of gas turbine plants often requires a trade off between these factors. The gas turbine engine operating as part of the combined power and power plant does not only produce power but also the necessary thermal energy to operate the steam turbine plant. Therefore, what might be considered as the optimum performance for the gas turbine plant may not necessarily be the optimum performance of the combined power and power or the CPP plant. The results of the parametric study confirm this hypothesis. The results of the current work, led to the following conclusions:
i. For a simple gas turbine cycle, the maximum efficiency and the maximum specific work depend on different performance parameters, such as cycle pressure ratio or the dimensionless mass flow and speed parameters, while for a reheat gas turbine cycle, the maximum efficiency and the maximum specific work depend on identical performance parameters.
ii. Supplementary heating will always decrease the combined cycle efficiency except in the case that the supplementary heating significantly increases the steam turbine cycle efficiency.
iii. Increasing the gas turbine inlet temperature at constant cycle pressure ratio will increase the combined cycle efficiency and the combined specific work.
iv. The higher the gas turbine inlet temperature the greater the influence of the pressure ratio difference on the combined cycle efficiency of any combined cycle configurations.
0.2
0.3
0.4
0.5
0.6
0 0.1 0.2 0.3 0.4 0.5
Steam Plant Thermal efficiency
Com
bine
d Pl
ant T
herm
al e
ffici
ency
0%20%40%
3.0=gtη
H
add
0
0.1
0.2
0.3
0.4
0.5
0.6
0.7
0 0.1 0.2 0.3 0.4 0.5 0.6
Gas turbine thermal efficiency
Stea
m tu
rbin
e th
erm
al e
ffici
ency
10% heat loss
No heat loss
%50=gtη
%60=gtη

www.ccsenet.org/mer Mechanical Engineering Research Vol. 5, No. 2; 2015
111
v. Gas turbine reheating can be justified only if the turbine inlet temperature is low (low gas exhaust temperatures) and/or higher combined specific work output.
vi. Although gas turbine pre-cooling improves the gas turbine performance, it has a slight effect on the combined cycle efficiency and the combined specific work output.
vii. In the combined power and power cycle, the combined cycle maximum efficiency depends on neither the gas turbine maximum efficiency parameters nor the gas turbine maximum specific work parameters, but on new parameters that are closer to the gas turbine maximum specific work parameters.
viii. Increasing the gas turbine inlet temperature will always increase the combined cycle efficiency and the combined specific work.
Nomenclature AIRPROP Air properties FARATIO Fuel to air ratio GASPROP Gas properties HRSG Heat recovery steam generator
PC Specific heat at constant pressure ( )KkgkJ .
VC Specific heat at constant volume ( )KkgkJ . γ Ratio of specific heats m Mass flow rate ( )skg Q Heat supplied or rejected ( )kJ q Specific heat supplied or rejected ( )kgkJ W Work output ( )kJ w Specific work output ( )kgkJ
P Pressure ( )kPa T Temperature ( )K S Entropy ( )KkgkJ . r Pressure ratio η Efficiency θ Ratio of maximum to minimum temperature h Enthalpy ( )kgkJ LCV Lower calorific value ( )kgkJ PP Pinch point temperature difference f Fuel to air ratio, function ε Effectiveness D Dryness factor ξ Pressure loss in combustion chamber
Subscripts 1, 2, 3 State points in the cycles gt Gas turbine st Steam turbine s Isentropic o Stagnation g Gas a Air c Compressor t Turbine cc Combustion chamber P Pump B Boiler (Heat recovery steam generator)
H Higher plant (Gas turbine) HL Higher to lower (Gas turbine) L Lower plant( Steam plant) Latm Lower to atmosphere evp Evaporator sup Super heater sat Saturation CPP Combined cycle power plant max Maximum min Minimum atm Minimum
Superscripts . Rate References Andreades C., Dempsey L., & Peterson P. F. (2014), Reheat Air–Brayton combined cycle power conversion
off-nominal and transient performance. J. Eng. Gas Turbines Power, 136(7), 11 pages. http://dx.doi.org/ 10.1115/1.4026612
www.ccsenet.org/mer Mechanical Engineering Research Vol. 5, No. 2; 2015
112
Bannister, R. L., Briesch, M. S., Diakunchak, I. S., & Huber, D. J. (1995). A combined cycle designed to achieve greater than 60 % efficiency. Trans. ASME Journal of Engineering for gas turbines and power, 117(4), 734-741. http://dx.doi.org/10.1115/1.2815459.
Bannister, R. L., Cheruvu, N. S., Little, D. A., & McQuiggan, G. (1995). Development requirements for an advanced gas turbine system. Trans. ASME Journal of Engineering for gas turbines and power, 117(4), 724-733. http://dx.doi.org/10.1115/1.2815458
Bassily A. M. (2015). The application of novel techniques for gas turbine inlet-cooling that improve both the power and efficiency of the modern commercial steam-air-cooled gas turbine combined cycle power plants in hot and humid climates. Proceedings of the Institution of Mechanical Engineers, Part A: Journal of Power and Energy, 229(4), 406-430. http://dx.doi.org/10.1177/0957650915570348
Bhinder, F. S., & Mango, O. I. K. (1995). A parametric study of the combined power and power (CPP) plant for generating electricity. ASME Turbo Cogeneration. Vienna, Austria.
Bianci, M., Melino, F., & Peretto, A. (20060. Parametric studies of combined cycles equipped with inlet fogging. J. Eng. Gas Turbines Power, 128(2), 326-335. http://dx.doi.org/ 10.1115/1.1765122
Cerri, G. (1987). Parametric analysis of combined gas-steam cycles. Trans. ASME Journal of Engineering for gas turbines and power, 109(1), 46-55. http:// dx.doi:10.1115/1.3240005
Chappel, M. S., & Cockshutt, E. P. (1974). Gas turbine cycle calculations: Thermodynamic data tables for air and combustion products for three systems of units. NRC No. 14300, Ottawa.
Chiesa P., & Macchi E. (2004). A thermodynamic analysis of different options to break 60% electric efficiencies in combined cycle power plant. J. Eng. Gas Turbines Power, 126(4), 770-785. http://dx.doi.org/10.1115/1.1771684
Chin, W. W., & El-Masri, M. A. (1987). Exergy analysis of combined cycles: Part 2 –Analysis and optimisation of two-pressure steam bottoming cycles. Trans. ASME Journal of Engineering for gas turbines and power, 109(2), 237-243. http:// dx.doi:10.1115/1.3240030.
Chodkiewicz R., Krysinski J., & Porochnicki J., (2002). A recuperated gas turbine incorporating external heat sources in the combined gas-turbine cycle. J. Eng. Gas Turbines Power, 124(2), 263-269. http://dx.doi.org/10.1115/1.1448325
Da Cunha Alves, M. A., de Franca Mendes Carneiro, H. F., Barbosa, J. R., Travieso, L. E., Pilidis, P., & Ramsden, K. W. (2001). An insight on intercooling and reheat gas turbine cycles. Proceedings of the IMechE, Part A: Journal of Power and Energy, 215(2), 163-171. http://dx.doi.org/10.1243/0957650011538433
El-Masri, M. A. (1985). On thermodynamics of gas turbine cycles: Part 1 –Second law analysis of combined cycles. Trans. ASME Journal of Engineering for gas turbines and power, 107(4), 880-236. http://dx.doi.org/10.1115/1.3239832
El-Masri, M. A. (1987). Exergy Analysis of Combined Cycles: Part 1 –Air cooled Brayton cycle gas turbines. Trans. ASME Journal of Engineering for gas turbines and power, 109(2), 228-236. http://dx.doi.org/10.1115/1.3240029
Gülen S. C. (2011). Importance of auxiliary power consumption for combined cycle performance. J. Eng. Gas Turbines Power, 133(4). http://dx.doi.org/10.1115/1.4002254
Gülen S. C., & J Joseph, J. (2011). Combined cycle off-design performance estimation: A second law perspective. J. Eng. Gas Turbines Power, 134(1). http://dx.doi.org/ 10.1115/1.4004179
Gülen S. C., & Smith, R. W. (2010). Second law efficiency of the Rankine bottoming cycle of a combined power plant. J. Eng. Gas Turbines Power, 132(1). http://dx.doi.org/ 10.1115/1.3124787
Hawthorne, W. R., & Davis, G. de V. (1956). Calculating gas turbine performance. Engineering, 181, 461. Horlock, J. H. (1995). Combined power plants: past, present and future. Trans. ASME Journal of Engineering for
gas turbines and power, 117(4), 608-616. http:// dx.doi.org/10.1115/1.2815448 Horlock, J. H. (1997). Aero-engine derivative gas turbines for power generation: Thermodynamic and economic
perspectives. Trans. ASME Journal of Engineering for gas turbines and power, 119(1), 119-123, http://dx.doi.org/10.1115/1.2815534
Kehlhofer, R. (1991). Combined cycle gas turbine and steam turbine power plants. Lilburn GA: Fairmont Press.

www.ccsenet.org/mer Mechanical Engineering Research Vol. 5, No. 2; 2015
113
Korakianitis T., Grantstrom J., Wassingbo P., & Massardo, A. F. (2005). Parametric performance of combined –cogeneration power plants with various power and efficiency enhancements. J. Eng. Gas Turbines Power, 127127(1), 65-72. http://dx.doi.org/10.1115/1
Palestra, N., Barigozzi G., & Perdichizzi A., (2008). Inlet air cooling applied to combined cycle power plants: Influence of site climate and thermal storage systems. J. Eng. Gas Turbines Power, 130(2). http://dx.doi.org/ 10.1115/1.2771570
Rahim, M. A. (2012). Performance and sensitivity analysis of a combined cycle gas turbine power plant by various inlet air-cooling systems. Proceedings of the Institution of Mechanical Engineers, Part A: Journal of Power and Energy, 226(7), 922-931. http://dx.doi.org/10.1177/0957650912456657
Ruffled, P. (1987). A systematic analysis of the combined gas/steam cycle. ASME COGEN-TURBO: International Symposium on Turbomachinery, Combined-Cycle Technologies and Cogeneration held in Montreux, Switzerland (IGTI).
Sarabchi, K. & Polley, G. T. (1994). Thermodynamical optimisation of a combined cycle plant performance. ASME paper 94-GT-304.
Shi, X., Agnew, B., & She, D. (2011). Analysis of a combined power plant integrated with a liquid natural gas gasification and power generation system. Proceedings of the IMechE, part A: Journal of Power and Energy, 225(1), 1-11. http://dx.doi.org/10.1243/09576509JPE805
Copyrights Copyright for this article is retained by the author(s), with first publication rights granted to the journal. This is an open-access article distributed under the terms and conditions of the Creative Commons Attribution license (http://creativecommons.org/licenses/by/3.0/).