thermodynamic assessment of the cu–fe–cr phase …chemetal-journal.org/ejournal7/cma0132.pdf ·...
TRANSCRIPT

Chem. Met. Alloys 3 (2010) 132
Chem. Met. Alloys 3 (2010) 132-139 Ivan Franko National University of Lviv
www.chemetal-journal.org
Thermodynamic assessment of the Cu–Fe–Cr phase diagram Liya A. DREVAL’ 1*, Mikhail A. TURCHANIN1, Alexander R. ABDULOV1, Anatolii A. BONDAR2 1 Metallurgical Department, Donbass State Engineering Academy, Shkadinova St. 72, 84313 Kramatorsk, Ukraine 2 Department of Physical Chemistry of Inorganic Materials, Institute for Problems of Materials Science, Krzhyzhanivskiy St. 3, 03680 Kiev, Ukraine * Corresponding author. Tel.: +380-62-6416701; e-mail: [email protected] Received May 31, 2010; accepted October 29, 2010; available on-line March 2, 2011 Thermodynamic assessment of the Cu–Fe–Cr system was undertaken within the framework of the CALPHAD method. A set of self-consistent thermodynamic parameters was obtained taking into account new experimental data on the mixing enthalpy of liquid ternary alloys and literature information on the phase transitions. Isothermal sections, isopleths, projections of the liquidus and solidus surfaces and cupola of stable and metastable immiscibility of liquid alloys were calculated. The magnitudes of supercooling required for metastable immiscibility of liquid phases were estimated. Phase diagram / Immiscible liquid alloys / Metastable phase transformations 1. Introduction The Cu–Fe–Cr system is of interest for the development of casting composites [1,2] and powder materials [3] with core-type structure, as well as dispersion-hardened alloys with a droplet-like structure [4]. Alloys with these types of macro- and microstructure combine high thermal and electrical conductivity of copper with the high strength of chromium steel and chromium and have good prospects for practical use (primarily as electric contacts and antifriction materials). Design and production of new materials need clear understanding of the stable equilibria and metastable transformations in the system. Such information can be obtained as a result of thermodynamic calculations performed within the framework of the thermodynamic assessment of experimental data. The Cu–Fe–Cr system was thermodynamically assessed [5,6] in the spirit of the CALPHAD method. The parameters describing the ternary interaction of the components in the liquid phase were taken equal to zero in both works owing to lack of experimental information. Therefore, a new thermodynamic assessment of the Cu–Fe–Cr system taking into account recent experimental data [7] on the mixing enthalpies of liquid alloys was the aim of the present work.
2. Experimental information for the ternary system The phase diagrams of the constituent binary Cu–Fe and Cu–Cr systems have flat parts of the liquidus lines. Metastable liquid-phase separation has been established for these systems. The mutual solubility of the components in the solid terminal solutions γ(Cu), α(Cr), δ(Fe), γ(Fe), and α(Fe) is limited, especially in the Cu–Cr system. In the Fe–Cr system complete solubility of components is observed in the liquid and bcc α(Fe,Cr) phase. Formation of the intermetallic σ-phase has been established experimentally for this system. The mixing enthalpies of ternary Cu–Fe–Cr liquid alloys were studied using a high-temperature isoperibolic calorimeter along the sections with xCu/xFe = 3, 1, 1/3 at xCr = 0-0.45 and 1873 K [7]. The device, the measurement procedure, and the processing of the experimental results have been described in our earlier work [8]. The starting materials used were electrolytic copper and nickel (99.99 wt.%), A-2 carbonyl iron (99.95 wt.%), and A-2 tungsten (99.96 wt.%). The experiments were carried out in stabilized zirconia crucibles under spectrally pure argon (99.997 vol.%) atmosphere. The initial weight of the metallic solvent placed in the crucible was 1.7-2.4 g. In the course of the measurements, 70 metallic samples were added to the crucible; their interaction with the melt was accompanied by thermal effects recorded in the form

L.A. Dreval’ et al., Thermodynamic assessment of the Cu–Fe–Cr phase diagram
Chem. Met. Alloys 3 (2010) 133
Table 1 Partial mixing enthalpy of chromium and integral mixing enthalpy of liquid Cu–Fe–Cr alloys (kJ/mol).
∆ CrH ± 2σ ∆Н ± 2σ ∆ CrH ± 2σ ∆Н ± 2σ ∆ CrH ± 2σ ∆Н ± 2σ xCr
Section xCu/xFe = 3 Section xCu/xFe = 1 Section xCu/xFe = 1/3 0 14.5 ± 4.0 9.2 ± 0.4 –3.5 ± 4.2 10.9 ± 0.6 –4.6 ± 4.5 7.5 ± 0.5
0.1 14.6 ± 3.6 9.7 ± 0.7 4.9 ± 3.9 10.0 ± 1.2 1.4 ± 3.3 6.6 ± 0.8 0.2 13.8 ± 2.2 10.2 ± 0.8 10.0 ± 3.5 9.7 ± 1.4 2.4 ± 2.6 6.1 ± 1.0 0.3 12.3 ± 2.0 10.6 ± 1.1 12.4 ± 2.6 9.9 ± 1.6 0.8 ± 2.1 5.6 ± 1.3 0.4 10.3 ± 2.1 10.7 ± 1.6 12.5 ± 2.5 10.3 ± 2.1 –1.8 ± 1.4 4.7 ± 1.3 0.5 8.1 ± 2.0 10.4 ± 2.3 11.1 ± 2.4 10.6 ± 2.8 –3.9 ± 1.5 3.4 ± 1.8 0.6 5.7 ± 1.6 9.7 ± 2.7 8.6 ± 2.0 10.4 ± 3.4 –4.9 ± 1.9 1.8 ± 3.0
0xCr
∆H1873
, kJ/mol Cr
0.2 0.4 0.6 0.8 Cr−40
0
0
−40
0
−40
0
0
40
40
40
Cu−Cr [27]
Fe−Cr [17]
xCu/xFe=3
xCu/xFe=1
xCu/xFe=1/3
0xCr
∆H, kJ/mol
0.2 0.4 0.6 0.8 Cr-10
0
10
0
10
0
0
10
0
10
xCu/xFe=3
xCu/xFe=1
xCu/xFe=1/3
Cu-Cr [27]
Fe-Cr [17]
a b
Fig. 1 Mixing enthalpies of liquid Cu–Fe–Cr alloys at 1873 K: (a) partial mixing enthalpy of chromium
CrH∆ along the investigated sections and in binary liquid alloys; (b) integral mixing enthalpy along the investigated sections and in binary liquid alloys.
of heat-exchange curves by a differential thermopile. To determine the calorimeter constant and its dependence on the alloy weight, the device was calibrated at the beginning and the end of the experiment. The partial mixing enthalpy of chromium
CrH∆ was calculated using the area s under the heat-exchange curve
sn
KHH T
CrCr,Cr 298 −∆−=∆ (1)
where TH Cr,298∆ is the high-temperature component of
the enthalpy of liquid chromium upon heating from the thermostat temperature (298 K) to the measurement temperature (1873 K) [9], K is the calorimeter constant, and nCr is the number of moles of chromium. For the sections the integral mixing enthalpy of the ternary liquid alloys was calculated by integrating the Gibbs-Duhem equation:
FeCu
Cr
/0
Cr2Cr
Cr0Cr d
)(1)(1
xx
x
x
Cr
xx
HHxH
−∆+∆⋅−=∆ ∫= (2)
Here ∆Н is the integral mixing enthalpy along the section with constant molar ratio of copper and iron;
CrH∆ is the partial mixing enthalpy of chromium;
0Cr =∆ xH is the integral mixing enthalpy in the Cu–Fe
system at a given ratio xCu/xFe. The values of 0Cr =∆ xH
were accepted according to the thermodynamic assessment in [10]. Experimental points of partial mixing enthalpy of liquid chromium supercooled to the temperature of the experiment, CrH∆ and calculated values of molar integral mixing enthalpy ∆H are shown in Fig. 1 and presented in Table 1. The integral function has positive values in the investigated composition range and exhibit positive deviations from the ideal curve. These characteristics indicate repulsive interaction of particles in the liquid phase.
L.A. Dreval’ et al., Thermodynamic assessment of the Cu–Fe–Cr phase diagram
Chem. Met. Alloys 3 (2010) 134
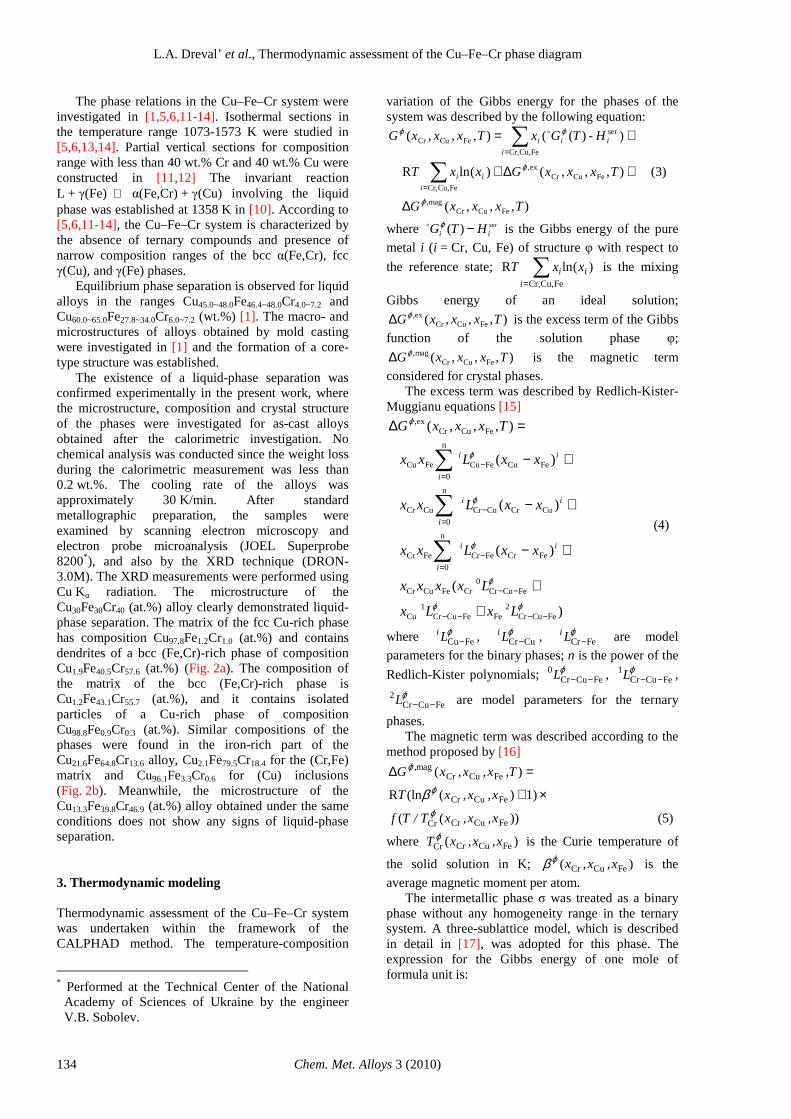
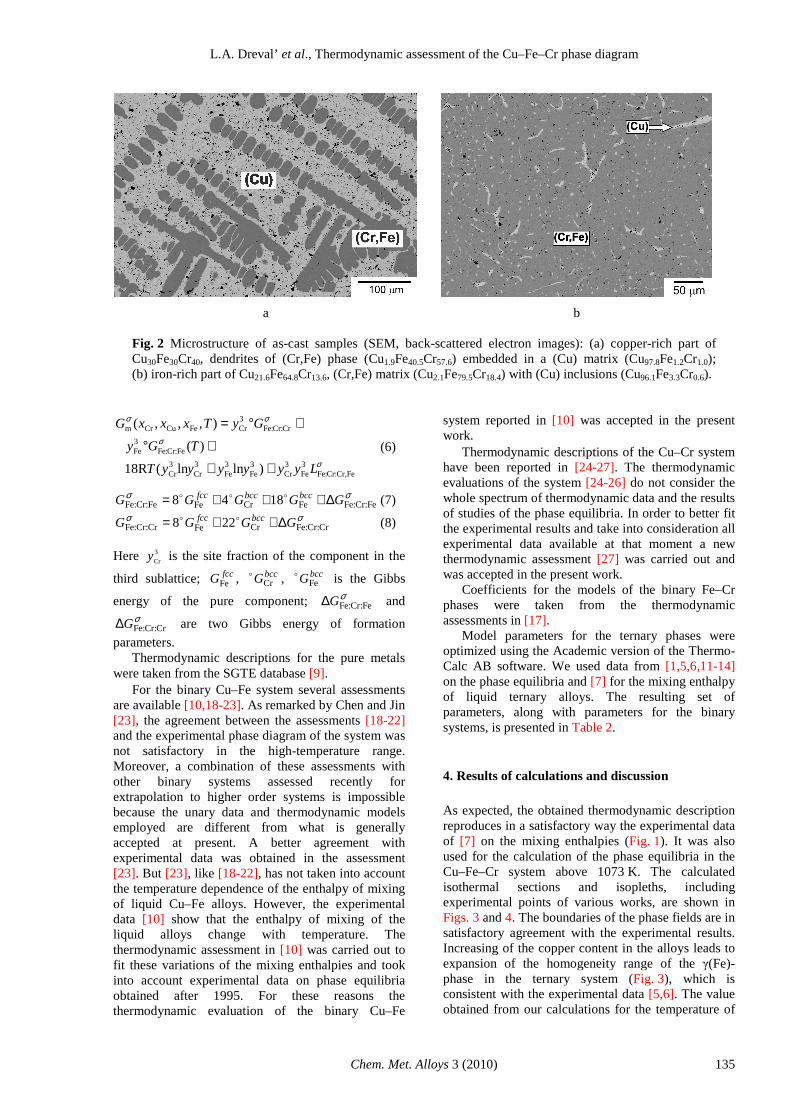
The phase relations in the Cu–Fe–Cr system were investigated in [1,5,6,11-14]. Isothermal sections in the temperature range 1073-1573 K were studied in [5,6,13,14]. Partial vertical sections for composition range with less than 40 wt.% Cr and 40 wt.% Cu were constructed in [11,12] The invariant reaction L + γ(Fe) ⇔ α(Fe,Cr) + γ(Cu) involving the liquid phase was established at 1358 K in [10]. According to [5,6,11-14], the Cu–Fe–Cr system is characterized by the absence of ternary compounds and presence of narrow composition ranges of the bcc α(Fe,Cr), fcc γ(Cu), and γ(Fe) phases. Equilibrium phase separation is observed for liquid alloys in the ranges Cu45.0~48.0Fe46.4~48.0Cr4.0~7.2 and Cu60.0~65.0Fe27.8~34.0Cr6.0~7.2 (wt.%) [1]. The macro- and microstructures of alloys obtained by mold casting were investigated in [1] and the formation of a core-type structure was established. The existence of a liquid-phase separation was confirmed experimentally in the present work, where the microstructure, composition and crystal structure of the phases were investigated for as-cast alloys obtained after the calorimetric investigation. No chemical analysis was conducted since the weight loss during the calorimetric measurement was less than 0.2 wt.%. The cooling rate of the alloys was approximately 30 K/min. After standard metallographic preparation, the samples were examined by scanning electron microscopy and electron probe microanalysis (JOEL Superprobe 8200*), and also by the XRD technique (DRON-3.0M). The XRD measurements were performed using Cu Kα radiation. The microstructure of the Cu30Fe30Cr40 (at.%) alloy clearly demonstrated liquid-phase separation. The matrix of the fcc Cu-rich phase has composition Cu97.8Fe1.2Cr1.0 (at.%) and contains dendrites of a bcc (Fe,Cr)-rich phase of composition Cu1.9Fe40.5Cr57.6 (at.%) (Fig. 2a). The composition of the matrix of the bcc (Fe,Cr)-rich phase is Cu1.2Fe43.1Cr55.7 (at.%), and it contains isolated particles of a Cu-rich phase of composition Cu98.8Fe0.9Cr0.3 (at.%). Similar compositions of the phases were found in the iron-rich part of the Cu21.6Fe64.8Cr13.6 alloy, Cu2.1Fe79.5Cr18.4 for the (Cr,Fe) matrix and Cu96.1Fe3.3Cr0.6 for (Cu) inclusions (Fig. 2b). Meanwhile, the microstructure of the Cu13.3Fe39.8Cr46.9 (at.%) alloy obtained under the same conditions does not show any signs of liquid-phase separation. 3. Thermodynamic modeling Thermodynamic assessment of the Cu–Fe–Cr system was undertaken within the framework of the CALPHAD method. The temperature-composition
* Performed at the Technical Center of the National
Academy of Sciences of Ukraine by the engineer V.B. Sobolev.
variation of the Gibbs energy for the phases of the system was described by the following equation:
),,,(
),,,()(lnR
)-)((),,,(
FeCuCrmag,
FeCuCrex,
FeCu,Cr,
ser
FeCu,Cr,
FeCuCr
TxxxG
TxxxGxxT
HTGxTxxxG
i
i
i
ii
i
i
ϕ
ϕ
ϕϕ
∆
+∆+
+=
∑
∑
=
=
o
(3)
where ser)( ii HTG −ϕo is the Gibbs energy of the pure
metal i (i = Cr, Cu, Fe) of structure φ with respect to
the reference state; )(lnRFeCu,Cr,
ii
i xxT ∑=
is the mixing
Gibbs energy of an ideal solution;
),,,( FeCuCrex, TxxxGϕ∆ is the excess term of the Gibbs
function of the solution phase φ;
),,,( FeCuCrmag, TxxxGϕ∆ is the magnetic term
considered for crystal phases. The excess term was described by Redlich-Kister-Мuggianu equations [15]
)
(
)(
)(
)(
),,,(
FeCuCr2
FeFeCuCr1
Cu
FeCuCr0
CrFeCuCr
FeCrFeCr
n
0
FeCr
CuCrCuCr
n
0
CuCr
n
0
FeCuFeCuFeCu
FeCuCrex,
ϕϕ
ϕ
ϕ
ϕ
ϕ
ϕ
−−−−
−−
−=
−=
=−
+
+
+−
+−
+−
=∆
∑
∑
∑
LxLx
Lxxxx
xxLxx
xxLxx
xxLxx
TxxxG
ii
i
ii
i
i
ii
(4)
where ϕFeCu−Li , ϕ
CuCr−Li , ϕFeCr−Li are model
parameters for the binary phases; n is the power of the
Redlich-Kister polynomials; ϕFeCuCr
0−−L , ϕ
FeCuCr1
−−L ,
ϕFeCuCr
2−−L are model parameters for the ternary
phases. The magnetic term was described according to the method proposed by [16]
(5)))((
1))((lnR
)(
FeCuCrCr
FeCuCr
FeCuCrmag
x,x,xT/Tf
x,x,xT
T,x,x,xG ,
ϕ
ϕ
ϕ
β ×+
=∆
where )( FeCuCrCr x,x,xTϕ is the Curie temperature of
the solid solution in K; )( FeCuCr x,x,xϕβ is the
average magnetic moment per atom. The intermetallic phase σ was treated as a binary phase without any homogeneity range in the ternary system. A three-sublattice model, which is described in detail in [17], was adopted for this phase. The expression for the Gibbs energy of one mole of formula unit is:
L.A. Dreval’ et al., Thermodynamic assessment of the Cu–Fe–Cr phase diagram
Chem. Met. Alloys 3 (2010) 135
a b
Fig. 2 Microstructure of as-cast samples (SEM, back-scattered electron images): (a) copper-rich part of Cu30Fe30Cr40, dendrites of (Cr,Fe) phase (Cu1.9Fe40.5Cr57.6) embedded in a (Cu) matrix (Cu97.8Fe1.2Cr1.0); (b) iron-rich part of Cu21.6Fe64.8Cr13.6, (Cr,Fe) matrix (Cu2.1Fe79.5Cr18.4) with (Cu) inclusions (Cu96.1Fe3.3Cr0.6).
σ
σ
σσ
FeCr,:Cr:Fe3Fe
3Cr
3Fe
3Fe
3Cr
3Cr
Fe:Cr:Fe3Fe
Cr:Cr:Fe3CrFeCuCrm
)lnln(18R
)(
),,,(
LyyyyyyT
TGy
GyTxxxG
++
+°
+°=
(6)
σσ:FeCr:FeFeCrFe:FeCr:Fe 1848 GGGGG bccbccfcc ∆+++= ooo (7)
σσCr:Cr:FeCrFeCr:Cr:Fe 228 GGGG bccfcc ∆++= oo (8)
Here 3
Cry is the site fraction of the component in the
third sublattice; fccGFe , bccGCro , bccGFe
o is the Gibbs
energy of the pure component; σ:FeCr:FeG∆ and
σCr:Cr:FeG∆ are two Gibbs energy of formation
parameters. Thermodynamic descriptions for the pure metals were taken from the SGTE database [9]. For the binary Cu–Fe system several assessments are available [10,18-23]. As remarked by Chen and Jin [23], the agreement between the assessments [18-22] and the experimental phase diagram of the system was not satisfactory in the high-temperature range. Moreover, a combination of these assessments with other binary systems assessed recently for extrapolation to higher order systems is impossible because the unary data and thermodynamic models employed are different from what is generally accepted at present. A better agreement with experimental data was obtained in the assessment [23]. But [23], like [18-22], has not taken into account the temperature dependence of the enthalpy of mixing of liquid Cu–Fe alloys. However, the experimental data [10] show that the enthalpy of mixing of the liquid alloys change with temperature. The thermodynamic assessment in [10] was carried out to fit these variations of the mixing enthalpies and took into account experimental data on phase equilibria obtained after 1995. For these reasons the thermodynamic evaluation of the binary Cu–Fe
system reported in [10] was accepted in the present work. Thermodynamic descriptions of the Cu–Cr system have been reported in [24-27]. The thermodynamic evaluations of the system [24-26] do not consider the whole spectrum of thermodynamic data and the results of studies of the phase equilibria. In order to better fit the experimental results and take into consideration all experimental data available at that moment a new thermodynamic assessment [27] was carried out and was accepted in the present work. Coefficients for the models of the binary Fe–Cr phases were taken from the thermodynamic assessments in [17]. Model parameters for the ternary phases were optimized using the Academic version of the Thermo-Calc AB software. We used data from [1,5,6,11-14] on the phase equilibria and [7] for the mixing enthalpy of liquid ternary alloys. The resulting set of parameters, along with parameters for the binary systems, is presented in Table 2. 4. Results of calculations and discussion
As expected, the obtained thermodynamic description reproduces in a satisfactory way the experimental data of [7] on the mixing enthalpies (Fig. 1). It was also used for the calculation of the phase equilibria in the Cu–Fe–Cr system above 1073 K. The calculated isothermal sections and isopleths, including experimental points of various works, are shown in Figs. 3 and 4. The boundaries of the phase fields are in satisfactory agreement with the experimental results. Increasing of the copper content in the alloys leads to expansion of the homogeneity range of the γ(Fe)-phase in the ternary system (Fig. 3), which is consistent with the experimental data [5,6]. The value obtained from our calculations for the temperature of

L.A. Dreval’ et al., Thermodynamic assessment of the Cu–Fe–Cr phase diagram
Chem. Met. Alloys 3 (2010) 136
Table 2 Model parameters for the Gibbs function (J/mol) of the phases of the Cu–Fe–Cr system and the boundary Cu–Fe, Cu–Cr and Fe–Cr systems.
Phase Parameter Reference
LFeCu
0−L = 73316.72 – 142.79·T + 15.82·T·lnT [10]
LFeCu
1−L = 9100.15 – 5.94·T [10]
LFeCu
2−L = 2428.96 [10]
LFeCu
3−L = –233.62 [10]
LCrCu
0−L = 83730.00 – 105.12·T + 10.00·T·lnT [18]
LCrCu
1−L = –1371.45 [18]
LCrCu
2−L = –1271,47 [18]
LFeCr
0−L = –14550.00 + 6.65·T [27]
LFeCuCr
0−−L = –115799 + 61.673·Т Present work
LFeCuCr
1−−L = –89317 + 55.011·Т Present work
L L(Fe,Cr) L(Cu)
LFeCuCr
2−−L = 116631 – 57.980·Т Present work
γ−FeCu
0L = 48885.74 – 11.51·T [10] γ
−FeCu 1L = 12687.16 – 8.01·T [10]
γ−FeCu
2L = 4054.11 [10] γ
−CrCu 0L = 67800.00 + 6.00·T [18]
γ−FeCr
0L = 10833 – 7.477·T [27] γ
−FeCr 1L = 1410 [27]
γ(Fe) γ(Cu)
γ−− FeCuCr
2L = –29976 + 24.982·Т Present work
α−FeCu
0L = 40146.22 – 4.91·T [10] αCr0, Fe-Cu
T = –41.4 [10]
α−CrCu
0L = 75275.26 – 21.00·T [18] α
−FeCr 0L = 20500 – 9.68·T [27] αCr0, Fe-Cr
T = 1650; αCr1, Fe-Cr
T = 550 [27]
α0, Fe-Cr
β = –0.85 [27]
δ(Fe) α(Fe) α(Cr) α(Fe,Cr)
α−− FeCuCr
0L = α−− FeCuCr
2L = 28629 – 41.552·T Present work σ
Cr:Cr:FeG∆ = 117300 – 95.96·T [27] σ
σCr:Cr:FeG∆ = 92300 – 95.96·T [27]
the reaction of transition-type U2, 1362 K (Figs. 4a and 5), corresponds well to the value reported in [11], 1358 K. The liquidus projection calculated in the present work is shown in Fig. 5. The broad region of liquid-phase separation L ↔ L(Cu) + L(Fe,Cr) with the critical point с1 at 1855 K is presented there. It may be noted that small additions of chromium to the Cu–Fe alloys, as well as small additions of iron to the Cu–Cr alloys, lead to a stabilization of the liquid-phase separation in comparison with the corresponding binary systems. A four-phase invariant reaction of
transition-type U1, L(Fe,Cr) + γ(Fe) ↔ L(Cu) + α(Fe,Cr), takes place at 1686 K in the ternary system as a result of the liquid-phase separation. The two critical points c2 and c3 are maxima on the lines corresponding to the monovariant reactions L(Fe,Cr) ↔ L(Cu) + α(Fe,Cr) and L(Fe,Cr) + γ(Fe) ↔ L(Cu). The critical tie-line 1e' – 1e" in the ruled surface L(Cu) + L(Fe,Cr) is also shown in Fig. 5. It can be noted that the phase region of liquid-phase separation calculated in the present work is higher in temperature and wider in composition in comparison with those calculated in [6].

L.A. Dreval’ et al., Thermodynamic assessment of the Cu–Fe–Cr phase diagram
Chem. Met. Alloys 3 (2010) 137
FeCu
Cr
0.2 0.4 0.6 0.8xFe
xC
r
0.2
0.4
0.6
0.8
x Cu
0.2
0.4
0.6
0.8
L + α(Fe,Cr)
α(Fe,Cr)
L
1373K
γ(Fe)L + γ(Fe)
L + α(Fe,Cr) + γ(Fe)
α(Fe,Cr) + γ(Fe)
[5], L + γ(Fe)
[5], L + α(Fe,Cr)
FeCu
Cr
0.2 0.4 0.6 0.8xFe
xC
r
0.2
0.4
0.6
0.8
x Cu
0.2
0.4
0.6
0.8
α(Fe,Cr)+γ(Cu)
α(Fe,Cr)
γ(Cu)
1173K
γ(Fe)
γ(Fe)+γ(Cu)
α(Fe,Cr)+γ(Fe)+γ(Cu)
α(Fe,Cr)+γ(Fe)
[6]
a b
Fig. 3 Calculated isothermal sections of the Cu–Fe–Cr system: (a) at 1373 K; (b) at 1173 K.
T E
2
Cu0.85Cr0.15
1200
1400
2000
0.2 0.4 0.6xFe
T, K
1600
1800
Fe0.85Cr0.15
0.8
L
L(Fe,Cr)+L(Cu)
L(Cu)+γ(Fe)+α(Fe,Cr)
α(Fe,Cr)+γ(Fe)+γ(Cu)
α(Fe,Cr)
U2L(Cu)+α(Fe,Cr)+γ(Cu)
L(Fe,Cr)+L(Cu)+α(Fe,Cr)
T L
T INV
[11]:
T E
, [11] 2
Cu0.04Fe0.96
1200
1400
2000
0.2 0.4 0.6xCr
T, K
1600
1800
Cu0.04Cr0.96
0.8
L
L(Cu)+α(Fe,Cr)+γ(Cu)
γ(Fe)
α(Fe,Cr)
L+α(Fe,Cr)
L(Fe,Cr)+L(Cu)+α(Fe,Cr)
L(Cu)+α(Fe,Cr)
α(Fe,Cr)+γ(Fe)+γ(Cu)
[12]
a b
Fig. 4 Calculated vertical sections of the Cu–Fe–Cr system at (a) xCr = 0.15 and (b) xCu = 0.04. The obtained thermodynamic model of the liquid phase was used to calculate the cupola of stable and metastable separation of the melt. A projection of the cupola is shown in Fig. 6a, where the solid lines correspond to the stable separation and the dashed lines represent its metastable continuation for supercooled liquid alloys. The magnitude of supercooling required for metastable separation of the liquid phase can be calculated as the difference between the temperatures of equilibrium liquidus (T liq) and metastable separation (T sep). The projection of the T liq–T sep surface is shown in Fig. 6b. Inside the composition range limited in Fig. 6b by T liq–T sep = 0 and marked as the area of stable liquid-phase separation, formation of alloys with a core-type structure is possible. Outside this area the separation
of liquid phase is metastable and certain supercooling of the melt is necessary for alloys with a droplet-like structure to form. The information in Fig. 6 can be used to select the composition, magnitude of supercooling and technique that meet the conditions required to produce alloys with specific micro- and macrostructures. Acknowledgements The authors are deeply grateful to V.B. Sobolev, L.A. Duma, O.S. Fomichov, and A.M. Storchak-Fediuk for technical assistance. This work was supported by the Ministry of Education and Science of Ukraine under the grant 0109U002665.

L.A. Dreval’ et al., Thermodynamic assessment of the Cu–Fe–Cr phase diagram
Chem. Met. Alloys 3 (2010) 138
Binary systems: p
1: 1760 K
p2: 1368 K
e2: 1350 K
Ternary system: c
1: 1855 K
c2: 1826 K
c3: 1710 K
U1: 1686 K
e1, min: 1654 K
U2: 1362 K
γ(Cu) γ(Fe)
0.2Cu 0.1
xFe
xC
r
0.9
x Cu
0.1
0.20.8
0.0e
2
p2
0.3
0.30.7
α(Fe,Cr)
U''
1
e''
1
L(Fe,Cr)+L(Cu)
U2
2073K
α(Fe,Cr)
1654K
min 1778K
p1
e2
p2
U2
γ(Cu)
c1
c2
c3
e' 1
e'' 1
U' 1U''
1
L(Fe,Cr)+L(Cu)
1973K
1873K
1773K
1826K
1710K
1710K
1673K
1573K
1473K
γ(Fe)
1673K
FeCu
Cr
0.2 0.4 0.6 0.8x
Fe
xC
r
0.2
0.4
0.6
x Cu
0.2
0.4
0.6
0.8
0.8
T LIQ
, K
Fig. 5 Calculated liquidus projection of the Cu–Fe–Cr system.
L(Fe,Cr) + L(Cu)
1700K 1800K
1600K
1500K
1400K
1750K
T SEP
, K
1855
FeCu
Cr
0.2 0.4 0.6 0.8xFe
xC
r
0.2
0.4
0.6
0.8
x Cu
0.2
0.4
0.6
0.8
25K0K
200K
300K
50K
100K
T L
− T SEP
, K
Area of
stable liquid phase
separation
FeCu
Cr
0.2 0.4 0.6 0.8xFe
xC
r
0.2
.4
0.6
0.8
x Cu
0.2
0.4
0.6
0.8
a b
Fig. 6 (а) Calculated projection of the cupola of liquid-phase separation and (b) estimated projection of supercooling for metastable liquid-phase separation in the Cu–Fe–Cr system.
References [1] C.P. Wang, X.J. Liu, Y. Takaku, I. Ohnuma, R.
Kainuma, K. Ishida, Metall. Mater. Trans. A 35 (2004) 1243-1253.
[2] C.P. Wang, X.J. Liu, I. Ohnuma, R. Kainuma, K. Ishida, J. Mater. Res. 23 (2008) 933-940.
[3] C.P. Wang, X.J. Liu, R.P. Shi, C. Shen, Y. Wang, I. Ohnuma, R. Kainuma, K. Ishida, Appl. Phys. Lett. 91 (2007) 141904 (3 p.).
[4] B.A. Kirievskii, V.V. Khristenko, Protsessy Lit’ya (1-2) (2007) 93-100.
[5] H. Ohtani, H. Suda, K. Ishida, ISIJ Int. 37 (1997) 207-216.
L.A. Dreval’ et al., Thermodynamic assessment of the Cu–Fe–Cr phase diagram
Chem. Met. Alloys 3 (2010) 139
[6] C.P. Wang, X.J. Liu, I. Ohnuma, R. Kainuma, K. Ishida, J. Phase Equilib. 23 (2002) 236-245.
[7] L.A. Dreval, A.R. Abdulov, P.G. Agraval, M.A. Turchanin, Rasplavy 5 (2010) 81-87.
[8] M.A. Turchanin, I.V. Nikolaenko, J. Alloys Compd. 235 (1996) 128-132.
[9] A.T. Dinsdale, CALPHAD 15 (1991) 317-425. [10] M.A. Turchanin, P.G. Agraval, I.V. Nikolaenko,
J. Phase Equilib. 24 (2003) 307-319. [11] K. Moriwaki, Tetsu to Hagane 25 (1939) 396-
403. [12] M. Ahmed, F. Thuemmler, G. Zapf, Arch.
Eisenhüttenwes. 41 (1970) 797-803. [13] S.M. Hao, M. Jiang, Proc. 7th Natl. Symp. Phase
Diagrams, Shanghai, 1993, p. 1173. [14] H. Fernee, J. Nairn, A. Atrens, J. Mater. Sci.
Lett. 20 (2001) 2213-2215. [15] Y.M. Muggianu, M. Gambino, J.P. Bros, J.
Chim. Phys. 72 (1975) 83-88. [16] M. Hillert, M. Jarl, CALPHAD 2 (1978) 227-238. [17] J.O. Andersson, B. Sundman, CALPHAD 11
(1987) 83-92.
[18] W. Oelsen, E. Schurmann, C. Florin, Arch. Eisenhüttenwes. 32 (1961) 719-728.
[19] O. Kubaschewski, J.F. Smith, D.M. Bailey, Z. Metallkd. 68 (1977) 495-499.
[20] M. Hasebe, T. Nishizawa, CALPHAD 4 (1980) 83-100.
[21] M. Hasebe, T. Nishizawa, CALPHAD 5 (1981) 105-108.
[22] Y.Y. Chuang, R. Schmid, Y.A. Chang, Metall. Trans. A 15 (1984) 1921-1930.
[23] Q. Chen, Z. Jin, Metall. Mater. Trans. A 26 (1995) 417-426.
[24] N. Saunders, Mater. Sci. Technol. 3 (1987) 671-673.
[25] M. Hamalainen, K. Jaaskelainen, R. Luoma, CALPHAD 14 (1990) 125-137.
[26] K. Zeng, M. Hamalainen, CALPHAD 19 (1995) 93-104.
[27] M.A. Turchanin, Powder Metall. Met. Ceram. 45 (2006) 457-467.
______________________________________________________________________________ Proceeding of the XI International Conference on Crystal Chemistry of Intermetallic Compounds, Lviv, May 30 - June 2, 2010.