thermodynamic insight for the design and optimization of extractive
TRANSCRIPT
En vue de l'obtention du
DOCTORAT DE L'UNIVERSITÉ DE TOULOUSEDélivré par :
Institut National Polytechnique de Toulouse (INP Toulouse)Discipline ou spécialité :
Génie des Procédés et de l'Environnement
Présentée et soutenue par :M. XINQIANG YOU
le lundi 7 septembre 2015
Titre :
Unité de recherche :
Ecole doctorale :
APPROCHE THERMODYNAMIQUE POUR LA CONCEPTION ETL'OPTIMISATION DE LA DISTILLATION EXTRACTIVE DE MELANGES A
TEMPERATURE DE BULLE MINIMALE (1.0-Ia)
Mécanique, Energétique, Génie civil, Procédés (MEGeP)
Laboratoire de Génie Chimique (L.G.C.)Directeur(s) de Thèse :M. VINCENT GERBAUD
Rapporteurs :M. JEAN-NOEL JAUBERT, INP DE NANCY
M. JEAN TOUTAIN, INP BORDEAUX
Membre(s) du jury :1 Mme XUAN MI MEYER, INP TOULOUSE, Président2 M. MICHEL MEYER, INP TOULOUSE, Membre2 M. OLIVIER BAUDOIN, PROSIM SA, Membre2 M. VINCENT GERBAUD, INP TOULOUSE, Membre

ii
Title in English :
Thermodynamic Insight for the Design and Optimization of Extractive Distillation
of 1.0-1a Class Separation
ABSTRACT
i
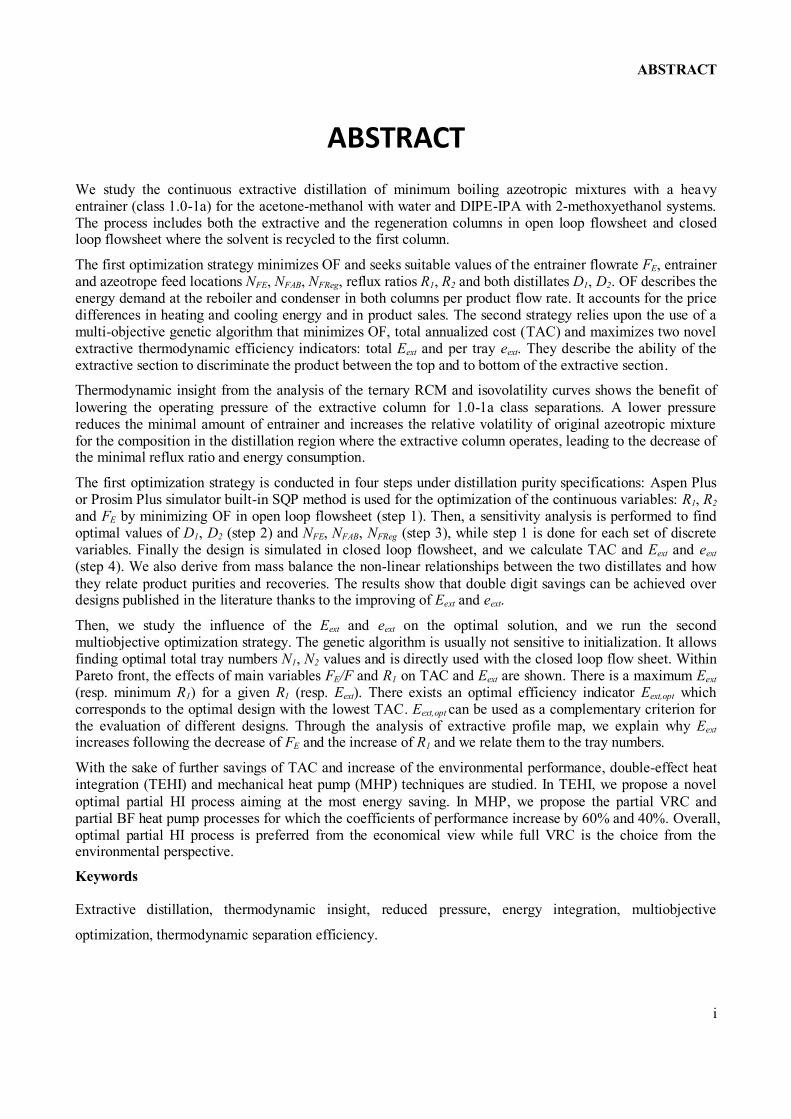
ABSTRACT
We study the continuous extractive distillation of minimum boiling azeotropic mixtures with a heavy entrainer (class 1.0-1a) for the acetone-methanol with water and DIPE-IPA with 2-methoxyethanol systems. The process includes both the extractive and the regeneration columns in open loop flowsheet and closed loop flowsheet where the solvent is recycled to the first column.
The first optimization strategy minimizes OF and seeks suitable values of the entrainer flowrate FE, entrainer and azeotrope feed locations NFE, NFAB, NFReg, reflux ratios R1, R2 and both distillates D1, D2. OF describes the energy demand at the reboiler and condenser in both columns per product flow rate. It accounts for the price differences in heating and cooling energy and in product sales. The second strategy relies upon the use of a multi-objective genetic algorithm that minimizes OF, total annualized cost (TAC) and maximizes two novel extractive thermodynamic efficiency indicators: total Eext and per tray eext. They describe the ability of the extractive section to discriminate the product between the top and to bottom of the extractive section.
Thermodynamic insight from the analysis of the ternary RCM and isovolatility curves shows the benefit of lowering the operating pressure of the extractive column for 1.0-1a class separations. A lower pressure reduces the minimal amount of entrainer and increases the relative volatility of original azeotropic mixture for the composition in the distillation region where the extractive column operates, leading to the decrease of the minimal reflux ratio and energy consumption.
The first optimization strategy is conducted in four steps under distillation purity specifications: Aspen Plus or Prosim Plus simulator built-in SQP method is used for the optimization of the continuous variables: R1, R2 and FE by minimizing OF in open loop flowsheet (step 1). Then, a sensitivity analysis is performed to find optimal values of D1, D2 (step 2) and NFE, NFAB, NFReg (step 3), while step 1 is done for each set of discrete variables. Finally the design is simulated in closed loop flowsheet, and we calculate TAC and Eext and eext (step 4). We also derive from mass balance the non-linear relationships between the two distillates and how they relate product purities and recoveries. The results show that double digit savings can be achieved over designs published in the literature thanks to the improving of Eext and eext.
Then, we study the influence of the Eext and eext on the optimal solution, and we run the second multiobjective optimization strategy. The genetic algorithm is usually not sensitive to initialization. It allows finding optimal total tray numbers N1, N2 values and is directly used with the closed loop flow sheet. Within Pareto front, the effects of main variables FE/F and R1 on TAC and Eext are shown. There is a maximum Eext (resp. minimum R1) for a given R1 (resp. Eext). There exists an optimal efficiency indicator Eext,opt which corresponds to the optimal design with the lowest TAC. Eext,opt can be used as a complementary criterion for the evaluation of different designs. Through the analysis of extractive profile map, we explain why Eext increases following the decrease of FE and the increase of R1 and we relate them to the tray numbers.
With the sake of further savings of TAC and increase of the environmental performance, double-effect heat integration (TEHI) and mechanical heat pump (MHP) techniques are studied. In TEHI, we propose a novel optimal partial HI process aiming at the most energy saving. In MHP, we propose the partial VRC and partial BF heat pump processes for which the coefficients of performance increase by 60% and 40%. Overall, optimal partial HI process is preferred from the economical view while full VRC is the choice from the environmental perspective.
Keywords
Extractive distillation, thermodynamic insight, reduced pressure, energy integration, multiobjective
optimization, thermodynamic separation efficiency.
RÉSUMÉ
ii
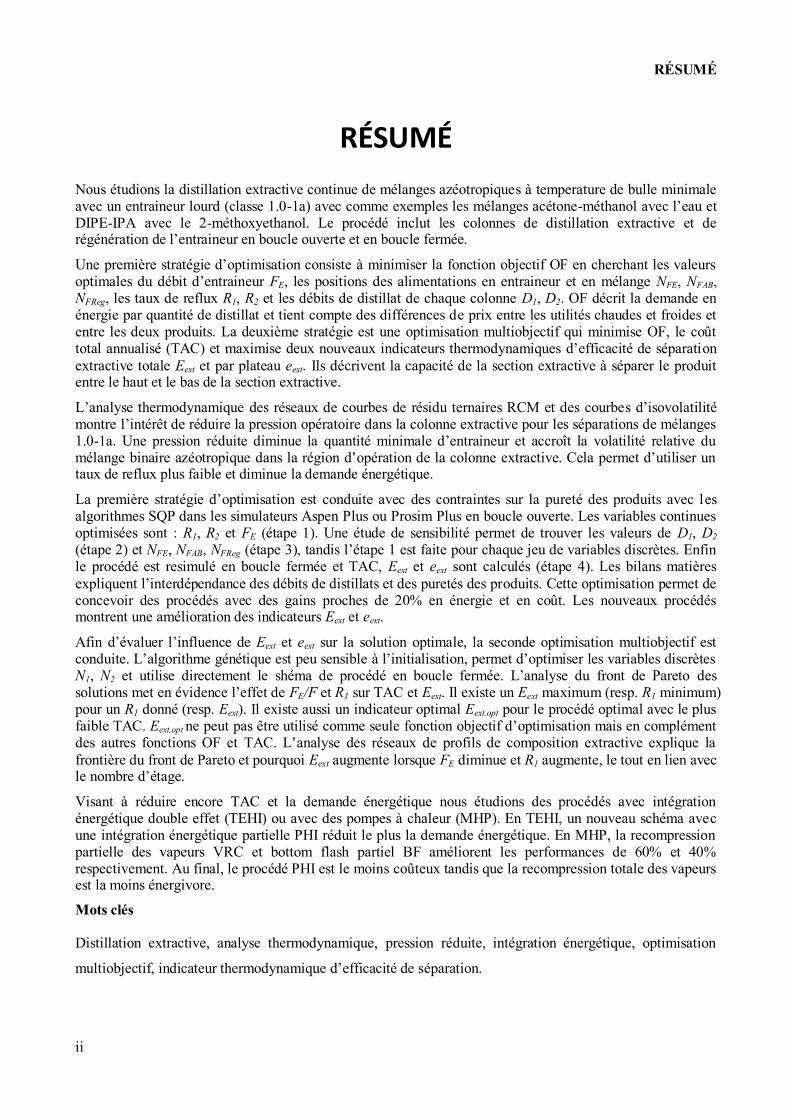
RÉSUMÉ
Nous étudions la distillation extractive continue de mélanges azéotropiques à temperature de bulle minimale avec un entraineur lourd (classe 1.0-1a) avec comme exemples les mélanges acétone-méthanol avec l’eau et DIPE-IPA avec le 2-méthoxyethanol. Le procédé inclut les colonnes de distillation extractive et de régénération de l’entraineur en boucle ouverte et en boucle fermée.
Une première stratégie d’optimisation consiste à minimiser la fonction objectif OF en cherchant les valeurs optimales du débit d’entraineur FE, les positions des alimentations en entraineur et en mélange NFE, NFAB, NFReg, les taux de reflux R1, R2 et les débits de distillat de chaque colonne D1, D2. OF décrit la demande en énergie par quantité de distillat et tient compte des différences de prix entre les utilités chaudes et froides et entre les deux produits. La deuxième stratégie est une optimisation multiobjectif qui minimise OF, le coût total annualisé (TAC) et maximise deux nouveaux indicateurs thermodynamiques d’efficacité de séparation extractive totale Eext et par plateau eext. Ils décrivent la capacité de la section extractive à séparer le produit entre le haut et le bas de la section extractive.
L’analyse thermodynamique des réseaux de courbes de résidu ternaires RCM et des courbes d’isovolatilité montre l’intérêt de réduire la pression opératoire dans la colonne extractive pour les séparations de mélanges 1.0-1a. Une pression réduite diminue la quantité minimale d’entraineur et accroît la volatilité relative du mélange binaire azéotropique dans la région d’opération de la colonne extractive. Cela permet d’utiliser un taux de reflux plus faible et diminue la demande énergétique.
La première stratégie d’optimisation est conduite avec des contraintes sur la pureté des produits avec les algorithmes SQP dans les simulateurs Aspen Plus ou Prosim Plus en boucle ouverte. Les variables continues optimisées sont : R1, R2 et FE (étape 1). Une étude de sensibilité permet de trouver les valeurs de D1, D2 (étape 2) et NFE, NFAB, NFReg (étape 3), tandis l’étape 1 est faite pour chaque jeu de variables discrètes. Enfin le procédé est resimulé en boucle fermée et TAC, Eext et eext sont calculés (étape 4). Les bilans matières expliquent l’interdépendance des débits de distillats et des puretés des produits. Cette optimisation permet de concevoir des procédés avec des gains proches de 20% en énergie et en coût. Les nouveaux procédés montrent une amélioration des indicateurs Eext et eext.
Afin d’évaluer l’influence de Eext et eext sur la solution optimale, la seconde optimisation multiobjectif est conduite. L’algorithme génétique est peu sensible à l’initialisation, permet d’optimiser les variables discrètes N1, N2 et utilise directement le shéma de procédé en boucle fermée. L’analyse du front de Pareto des solutions met en évidence l’effet de FE/F et R1 sur TAC et Eext. Il existe un Eext maximum (resp. R1 minimum) pour un R1 donné (resp. Eext). Il existe aussi un indicateur optimal Eext,opt pour le procédé optimal avec le plus faible TAC. Eext,opt ne peut pas être utilisé comme seule fonction objectif d’optimisation mais en complément des autres fonctions OF et TAC. L’analyse des réseaux de profils de composition extractive explique la frontière du front de Pareto et pourquoi Eext augmente lorsque FE diminue et R1 augmente, le tout en lien avec le nombre d’étage.
Visant à réduire encore TAC et la demande énergétique nous étudions des procédés avec intégration énergétique double effet (TEHI) ou avec des pompes à chaleur (MHP). En TEHI, un nouveau schéma avec une intégration énergétique partielle PHI réduit le plus la demande énergétique. En MHP, la recompression partielle des vapeurs VRC et bottom flash partiel BF améliorent les performances de 60% et 40% respectivement. Au final, le procédé PHI est le moins coûteux tandis que la recompression totale des vapeurs est la moins énergivore.
Mots clés
Distillation extractive, analyse thermodynamique, pression réduite, intégration énergétique, optimisation
multiobjectif, indicateur thermodynamique d’efficacité de séparation.

ACKNOWLEDGMENTS
iii
ACKNOWLEDGMENTS
Firstly, let me give my deepest gratitude to my supervisor Mr. Vincent GERBAUD, for his constructive and
illuminating guidances on my thesis. I deeply appreciate his high requirements and admire his great interest
on research. His useful method, his wonderful personality, his high efficiency, his patience and persistence
leave me the most profound impression. He is the perfect professor in my mind.
I should like to acknowledge the assistance and guidance given by Ms. Ivonne Rodriguez-Donis and Mr.
Weifeng SHEN. Their helps and professional instructions are important for my research.
I am deeply indebted to prof. Jean-Noël JAUBERT, University of Lorraine, and prof. Jean TOUTAIN of
Institut Polytechnique de Bordeaux. Both of them are reviewers of this thesis. I deeply thank them for
spending time to give constructive suggestions and opinions, and kindly eliminate many of the errors in it,
which are helpful and important for my thesis.
I really appreciate the presence of prof. Xuan MEYER, prof. Michel MEYER, and Dr. Olivier BAUDOUIN.
All of them have graciously accepted to be a member of the jury. I would like to thank them for their
constructive advices and important opinions for my thesis.
My gratitude also extends to my dear colleagues and friends: Philippe, René, Ségolène, Sofia, László,
Antonio, Stephane, Ahmed, Jesus, Marco, Manuel, Maria, Anh and many others. I have passed a happy and
wonderful life in Toulouse with all of them.
Last but importantly, my thanks would go to my family, especially to my wife for their supports during my
study.
Xinqiang YOU
Le 08/09/2015 a Toulouse
Thermodynamic Insight for the Design and Optimization of Extractive Distillation of 1.0-1a Class Separation
iv
CHAPTER CONTENTS
Title Page
Chapter 1. General Introduction .................................................................................................................................. 1
1. Introduction ................................................................................................................................................................ 2
1.1. Process feasibility ............................................................................................................................... 2
1.2. Process design and optimization .......................................................................................................... 3
Chapter 2. State of The Art and Objectives ................................................................................................................. 7
2. State of the art and objectives .................................................................................................................................. 8
2.1.1. Phase equilibrium model .......................................................................................................... 8
2.1.2. Nonideality of mixture ............................................................................................................. 9
2.2. Nonideal mixtures separation ............................................................................................................ 10
2.2.1. Pressure-swing distillation ..................................................................................................... 12
2.2.2. Azeotropic distillation ............................................................................................................ 13
2.2.3. Reactive distillation ............................................................................................................... 14
2.2.4. Generalized extractive distillation .......................................................................................... 15
2.2.4.1. Extractive distillation with solid salt or salt effect distillation 15
2.2.4.2. Extractive distillation with ionic liquid 16
2.2.4.3. Extractive distillation with low transition temperature mixtures (LTTMs) 17
2.2.4.4. Extractive distillation with hyperbranced polymers 17
2.2.4.5. Extractive distillation with pressurized carbon dioxide 17
2.3. Introduction of extractive distillation with liquid entrainer ................................................................. 18
2.3.1. Extractive distillation ............................................................................................................. 18
2.3.2. Entrainer features ................................................................................................................... 18
2.3.3. Relative volatility................................................................................................................... 19
2.3.4. Entrainer selectivity ............................................................................................................... 20
2.3.5. Residue curve maps ............................................................................................................... 21
2.3.6. Ternary VLE classification .................................................................................................... 22
CHAPTER CONTENTS
v
2.4. Extractive distillation process feasibility ............................................................................................ 24
2.4.1. Thermodynamic insight on extractive distillation feasibility ................................................... 24
2.4.1.1. Topological features of class 1.0-1a extractive distillation process 24
2.4.1.2. Product and limiting operating parameter for class 1.0-1a extractive distillation 26
2.4.1.3. Foregone feasibility research of our group 27
2.4.2. Feasibility assessed from intersection of composition profiles and differential equation .......... 28
2.4.3. Extractive process feasibility from pinch points analysis ........................................................ 30
2.5. Research objectives ........................................................................................................................... 31
Chapter 3. Optimal Retrofits of ED, Acetone-Methanol with Water ....................................................................... 33
3. Optimal retrofits of extractive distillation, acetone-methanol with water .......................................................... 34
3.1. Introduction ...................................................................................................................................... 34
3.2. Optimal method and procedure .......................................................................................................... 37
3.2.1. Extractive process feasibility .................................................................................................. 37
3.2.2. Optimal method ..................................................................................................................... 38
3.2.3. Extractive distillation process flow sheet ................................................................................ 40
3.2.4. Objective function (OF) ......................................................................................................... 41
3.2.5. Optimization procedure .......................................................................................................... 42
3.3. Results and discussion ....................................................................................................................... 42
3.3.1. First step: continuous variables FE, R1, R2 ............................................................................... 42
3.3.2. Second step: two distillates D1 and D2 .................................................................................... 43
3.3.3. Third step: three feed locations............................................................................................... 43
3.3.4. Fourth step: closed loop corroboration ................................................................................... 44
3.3.5. The final result and comparing with the design in literature .................................................... 45
3.4. Conclusions ...................................................................................................................................... 47
Chapter 4. Improved Design and Efficiency of Extractive Distillation ...................................................................... 49
4. Improved design and efficiency of extractive distillation ...................................................................................... 50
4.1. Introduction ...................................................................................................................................... 50
4.2. Back ground, methods and tools ........................................................................................................ 50

Thermodynamic Insight for the Design and Optimization of Extractive Distillation of 1.0-1a Class Separation
vi
4.2.1. Extractive process feasibility .................................................................................................. 50
4.2.2. Process optimization techniques ............................................................................................. 51
4.2.3. Objective function ................................................................................................................. 52
4.3. Analysis of pressure and residue curve map ....................................................................................... 52
4.3.1. Pressure sensitivity of the azeotropic composition .................................................................. 52
4.3.2. Analysis of residue curve map................................................................................................ 53
4.4. Optimization results .......................................................................................................................... 53
4.4.1. Continuous variables FE, R1, R2 .............................................................................................. 53
4.4.2. Distillates and three feed locations ........................................................................................ 54
4.4.3. Effect of entrainer purity on the process ................................................................................. 55
4.4.4. Summary of optimal design parameters, product purity and recovery ..................................... 56
4.5. Development of an extractive distillation process efficiency indicator................................................ 60
4.5.1. Extractive section efficiency .................................................................................................. 60
4.5.2. Comparison of efficiencies for extractive process design ........................................................ 60
4.6. Conclusions ...................................................................................................................................... 63
Chapter 5. Design and Optimization of ED for separating DIPE-IPA......................................................................... 65
5. Design and Optimization of Extractive Distillation for Separating Diisopropyl ether and Isopropyl alcohol ..... 66
5.1. Introduction ...................................................................................................................................... 66
5.2. Steady state design ............................................................................................................................ 67
5.2.1. Extractive process feasibility .................................................................................................. 67
5.2.2. Pressure sensitivity of the azeotropic mixture ......................................................................... 68
5.2.3. Analysis of residue curve map................................................................................................ 69
5.2.4. Process optimization procedure .............................................................................................. 70
5.2.5. Objective function ................................................................................................................. 70
5.3. Results and discussions ..................................................................................................................... 70
5.3.1. The relation of two distillate in extractive distillation ............................................................. 71
5.3.2. Choice of distillate flow rate for this chapter .......................................................................... 72
5.3.3. Continuous variables FE, R1 and R2 ........................................................................................ 74
5.3.4. Selecting suitable feed locations ............................................................................................. 75
CHAPTER CONTENTS
vii
5.3.5. Closed loop design and optimal design parameters ................................................................. 76
5.3.6. Analysis from efficiency indicators and profile map in ternary diagram .................................. 79
5.4. Conclusions ...................................................................................................................................... 80
Chapter 6. Influence of Thermodynamic Efficiency on Extractive Distillation ........................................................ 83
6. Influence of thermodynamic efficiency on extractive distillation acetone-methanol with water ..................... 84
6.1. Introduction ...................................................................................................................................... 84
6.2. Optimal methods ............................................................................................................................... 84
6.2.1. Non-Sorted Genetic Algorithm as Process optimization technique .......................................... 84
6.2.2. Advantages of NSGA for the design of extractive distillation process compared with SQP ..... 85
6.2.3. Objective functions ................................................................................................................ 85
6.3. Results and discussion ....................................................................................................................... 86
6.3.1. Problem setting ...................................................................................................................... 86
6.3.2. Pareto front of the optimal design solution ............................................................................. 87
6.3.3. Insight on the Pareto front shape from the ternary map with extractive profile ........................ 89
6.3.4. Further improvement of GA optimal design ........................................................................... 94
6.4. Results and discussion ....................................................................................................................... 98
Chapter 7. Reducing Process Cost and CO2 Emissions ............................................................................................ 101
7. Reducing process cost and CO2 emissions for extractive distillation by double-effect heat integration and
mechanical heat pump............................................................................................................................................... 102
7.1. Introduction .................................................................................................................................... 102
7.2. Literature studies of extractive process with double-effect heat integration and heat pump ............... 104
7.3. Evaluation method of heat pump performance and CO2 emissions ................................................... 107
7.3.1. Heat pump performance ....................................................................................................... 107
7.3.2. Evaluation of CO2 emissions for distillation column ............................................................. 108
7.3.3. Economic assessment........................................................................................................... 109
7.4. Extractive distillation with double-effect heat integration ................................................................ 109
7.4.1. Direct partial heat integration ............................................................................................... 109
7.4.2. Optimal partial heat integration ............................................................................................ 111
Thermodynamic Insight for the Design and Optimization of Extractive Distillation of 1.0-1a Class Separation
viii
7.4.3. Optimal full heat integration ................................................................................................ 112
7.5. Extractive distillation with MHP heat pump .................................................................................... 113
7.6. Evaluation of VRC heat pump assisted distillation process .............................................................. 114
7.6.1. VRC heat pump assisted extractive column .......................................................................... 114
7.6.2. VRC heat pump assisted regeneration column ...................................................................... 116
7.6.3. Full VRC heat pump process ................................................................................................ 117
7.6.4. Partial VRC heat pump process ............................................................................................ 118
7.7. Evaluation of BF heat pump assisted distillation process ................................................................. 119
7.7.1. BF heat pump assisted extractive column ............................................................................. 119
7.7.2. BF heat pump assisted regeneration column ......................................................................... 120
7.7.3. Full BF heat pump process ................................................................................................... 121
7.7.4. Partial BF heat pump process ............................................................................................... 122
7.7.5. Summary of mechanical heat pump ...................................................................................... 124
7.8. Comparison of OPHI and partial VRC............................................................................................. 124
7.9. Conclusions .................................................................................................................................... 125
Chapter 8. Conclusions and perspectives ................................................................................................................ 127
8. Conclusions and perspectives................................................................................................................................ 128
8.1. Conclusions .................................................................................................................................... 128
8.2. Perspectives .................................................................................................................................... 131
Chapter 9. Appendix ................................................................................................................................................. 133
9. Appendix ................................................................................................................................................................. 134
9.1. Cost data ......................................................................................................................................... 134
9.2. Nomenclature.................................................................................................................................. 136
9.3. References ...................................................................................................................................... 141
LIST OF TABLES
ix
LIST OF TABLES
Table Page
Table 3.1 – Entrainer candidates for acetone-methanol separation with acetone as the distillate (from
Kossack et al.,2008) ................................................................................................................................. 35
Table 3.2 – Entrainer candidates for acetone-methanol separation with methanol as the distillate (from
Kossack et al.,2008) ................................................................................................................................. 35
Table 3.3 – Model binary parameters of acetone-methanol-water system .................................................. 37
Table 3.4 – Experimental and predicted data of azeotropic point at 99.28 kPa .......................................... 37
Table 3.5 – Step 1, optimal results of FE, R1 and R2 .................................................................................. 42
Table 3.6 – Optimal results of FE, R1, R2, NFE, NFF, NFReg under fixed D1 and D2 ....................................... 44
Table 3.7 – Comparison of our optimal results with Luyben’s design ....................................................... 45
Table 3.8 – Product purities from optimal results and Luyben’s design ..................................................... 46
Table 4.1 – Acetone-methanol azeotropic temperature and composition at different pressures with
UNIQUAC model .................................................................................................................................... 52
Table 4.2 – Optimized values of FE, R1 and R2 for the extractive distillation of acetone – methanol with
water under reduced pressure ................................................................................................................... 54
Table 4.3 – Open loop optimal results of FE, R1, R2, NFE, NFAB, NFReg under fixed D1 and D2 for the
extractive distillation of acetone – methanol with water ............................................................................ 55
Table 4.4 – Optimal design parameters and cost data from closed loop simulation for the extractive
distillation of acetone – methanol with water ............................................................................................ 56
Table 4.5 – Sizing parameters for the optimal designed columns and cost data from closed loop
simulation for the extractive distillation of acetone – methanol with water................................................ 57
Table 4.6 – Product purities and recoveries for case 1, 2 and 3op designs ................................................. 58
Table 4.7 – Efficiencies of per tray and total extractive section for the extractive distillation of acetone
– methanol with water .............................................................................................................................. 60
Table 5.1 – DIPE-IPA azeotropic temperature and composition at different pressures with NRTL
model ...................................................................................................................................................... 68
Table 5.2 – Relationship of distillates, purity and recovery for binary mixture for 100kmol/h binary
mixture .................................................................................................................................................... 72
Thermodynamic Insight for the Design and Optimization of Extractive Distillation of 1.0-1a Class Separation
x
Table 5.3 – Relationship of distillates, purity and recovery for DIEP-IPA................................................. 73
Table 5.4 – Optimized values of FE, R1, and R2 for the extractive distillation of DIPE – IPA with 2-
methoxyethanol ....................................................................................................................................... 74
Table 5.5 – Open loop optimal results of FE, R1, R2, NFE, NFAB, NFReg under fixed D1 and D2 for the
extractive distillation of DIPE – IPA with 2-methoxyethanol, P1 = 0.4 atm and P2 = 1 atm ....................... 75
Table 5.6 – Optimal design parameters and cost data from closed loop simulation for the extractive
distillation of DIPE-IPA with 2-methoxyethanol ...................................................................................... 77
Table 5.7 – Product purities and recoveries for case Luo, case 1 and 2 designs ......................................... 78
Table 5.8 – Efficiencies of per tray and total extractive section for the extractive distillation of DIPE –
IPA with 2-methoxyethanol ..................................................................................................................... 80
Table 6.1 – Design parameters for G1-G6 belonging to the Pareto front, P1 = 0.6 atm, P2 = 1 atm ............. 92
Table 6.2 – Sizing parameters for the columns and cost data of the design G1-G6 belonging to Pareto
front......................................................................................................................................................... 93
Table 6.3 – Final design results for acetone-methanol-water by NSGA and SQP ...................................... 95
Table 6.4 – Sizing parameters for the columns and cost data of the design case 1, case G1 and case
SQP ......................................................................................................................................................... 96
Table 6.5 – Product purities and recoveries for case NSGA and SQP designs ........................................... 96
Table 7.1 – Temperature difference, TAC and OF2 of reboiler/condenser heat exchanger following P2 .. 110
Table 7.2 – Design parameters of three double-effect heat integration extractive distillation processes,
acetone-methanol with water.................................................................................................................. 112
Table 7.3 – Sizing parameters and cost data of three double-effect heat integration extractive
distillation processes, acetone-methanol with water ................................................................................ 112
Table 7.4 – Cost data for extractive column with heat pump at different compressor outlet pressure ....... 114
Table 7.5 – Comparison of extractive column with and without VRC heat pump .................................... 115
Table 7.6 – Cost data for extractive column with heat pump at different compressor outlet pressure ....... 116
Table 7.7 – Comparison of regeneration column with and without heat pump ......................................... 117
Table 7.8 – Cost data of the process without heat pump, full and partial VRC heat pump ....................... 118
Table 7.9 – Cost data for extractive column with BF heat pump at different throttle valve outlet
pressure ................................................................................................................................................. 120
Table 7.10 – Comparison of extractive column with and without BF heat pump ..................................... 120
LIST OF TABLES
xi
Table 7.11 – Cost data for regeneration column with BF heat pump at different throttle valve outlet
pressure ................................................................................................................................................. 121
Table 7.12 – Comparison of regeneration column with and without BF heat pump ................................. 121
Table 7.13 – Cost data of the process without heat pump, partial and full BF heat pump ......................... 123
Table 7.14 – Comparison of optimal partial HI, partial VRC processes................................................... 125

Thermodynamic Insight for the Design and Optimization of Extractive Distillation of 1.0-1a Class Separation
xii
LIST OF FIGURES
xiii
LIST OF FIGURES
Figure Page
Figure 1.1 – Onion model for energy efficiency improvement. ................................................................... 4
Figure 2.1 – Typical homogeneous mixtures with maximum boiling azeotrope water and formic acid, a
negative deviation from Raoult’s law ......................................................................................................... 9
Figure 2.2 – Typical homogeneous mixtures with minimum boiling azeotrope methanol and
chloroform, a positive deviation from Raoult’s law .................................................................................. 10
Figure 2.3 – Schematic diagram of various techniques for separation of azeotropic mixtures .................... 11
Figure 2.4 – Indirect separation (a) and direct (b) azeotropic continuous distillation under finite for a
1.0-2 class mixture (from Gerbaud and Rodriguez-Donis, 2010) .............................................................. 14
Figure 2.5 – Azeotropic ternary mixture: Serafimov’s 26 topological classes and Reshetov’s statistics
(Hilmen et al., 2002). (o) unstable node, (∆) saddle, (●) stable ................................................................ 23
Figure 2.6 – Topological features of class 1.0-1a with heavy entrainer in extractive distillation process
operation (adapted from Rodriguez-Donis et al., 2009a). .......................................................................... 25
Figure 2.7 – Thermodynamic features of 1.0–1a mixtures. Separation of a minimum boiling azeotrope
with a heavy entrainer. (adapted from Shen et al., 2012) ........................................................................... 27
Figure 2.8 – Extractive distillation of acetone-methanol with water (1.0-1a class). Feed ratio as a
function of the reflux ratio to recover 98% mol acetone. (adapted from Shen et al., 2012) ........................ 28
Figure 3.1 – T-xy and y-x experimentand predicted maps at 1 atm for acetone (A)-methanol (B)-water
(E) system ............................................................................................................................................... 36
Figure 3.2 – Extractive distillation column configuration and acetone – methanol – water 1.0-1a
residue curve map at 1 atm with univolatility curves at 1 atm ................................................................... 38
Figure 3.3 – Closed loop (a) and open loop (b) flow sheet of the extractive distillation process ................. 40
Figure 3.4 – Effects of D1 and D2 on OF with D1, D2, FE, R1 and R2 as variables ....................................... 43
Figure 3.5 – Temperature and composition profiles of extractive column for acetone – methanol with
water (adapted from Luyben 2008) .......................................................................................................... 45
Figure 3.6 – Our design: Temperature and composition profiles of extractive column for acetone –
methanol with water................................................................................................................................. 46
Thermodynamic Insight for the Design and Optimization of Extractive Distillation of 1.0-1a Class Separation
xiv
Figure 4.1 – Extractive distillation column configuration and acetone – methanol – water 1.0-1a
residue curve map at 1 atm with univolatility curves at 0.6 and 1 atm ....................................................... 51
Figure 4.2 – Temperature and composition profiles of case 3opt extractive column for the extractive
distillation of acetone – methanol with water ............................................................................................ 57
Figure 4.3 – Temperature and composition profiles of case 3opt regeneration column for the extractive
distillation of acetone – methanol with water ............................................................................................ 58
Figure 4.4 – Liquid composition profiles for case 1(1atm),case 2(1atm) and 3(0.6atm) extractive
distillation column designs for the extractive distillation of acetone – methanol with water ...................... 61
Figure 4.5 – Volatility profile of acetone vs methanol along the extractive column for the extractive
distillation of acetone – methanol with water, case 1(1atm),case 2(1atm) and 3(0.6atm) ........................... 61
Figure 5.1 – Extractive distillation column configuration and DIPE – IPA –2-methoxyethanol class
1.0-1a residue curve map at 1atm with isovolatility curves at 0.4 and 1 atm. ............................................. 68
Figure 5.2 – T-xy map of 2-methoxyethanol – DIPE ................................................................................ 70
Figure 5.3 – Effects of D1 and D2 on OF with D1, D2, FE, R1 and R2 as variables ....................................... 73
Figure 5.4 – Temperature and composition profiles of case 2 extractive column for the extractive
distillation of DIPE-IPA with 2-methoxyethanol ...................................................................................... 78
Figure 5.5 – Temperature and composition profiles of case 2 entrainer regeneration column for the
extractive distillation of DIPE-IPA with 2-methoxyethanol ...................................................................... 79
Figure 5.6 – Liquid composition profiles for case Luo (1atm), case 1(1atm) and case 2(0.4atm)
extractive distillation column designs for the extractive distillation of DIPE-IPA with 2-
methoxyethanol ....................................................................................................................................... 80
Figure 6.7 – Pareto front of extractive distillation for acetone-methanol-water system, TAC versus Eext
and R1, △ means G1 ................................................................................................................................ 87
Figure 6.8 – Pareto front of extractive distillation for acetone-methanol-water system, Eext versus R1
and FE, △ means G1................................................................................................................................ 88
Figure 6.9 – Pareto front of extractive distillation for acetone-methanol-water system, TAC versus R1
and FE, △ means G1................................................................................................................................ 89
Figure 6.10 – Relation map of Eext and TAC for some designs from Pareto front ...................................... 90
Figure 6.11 – Extractive section profile map for acetone-methanol-water, case G3 ................................... 90
Figure 6.12 – Extractive section profile map for acetone-methanol-water, case G1 ................................... 94
Figure 6.13 – Temperature and composition profiles of extractive column for the extractive distillation
of acetone – methanol with water, case SQP ............................................................................................ 97
LIST OF FIGURES
xv
Figure 6.14 – Temperature and composition profiles of entrainer regeneration column for the
extractive distillation of acetone – methanol with water, case SQP ........................................................... 98
Figure 7.1 – Mechanical heat pump flow sheet for extractive column (a) vapor compression (VC) (b)
vapor recompression (VRC) (c) bottom flash (BF). ................................................................................ 103
Figure 7.2 – Sketch for heat integration process ..................................................................................... 105
Figure 7.3 – Extractive distillation of acetone-methanol with water, case SQP in chapter 6 as base case . 106
Figure 7.4 – Effect of P2 on TAC and OF2, the performance of direct partial heat integration process..... 110
Figure 7.5 – Relative volatility of methanol over water at different pressure ........................................... 111
Figure 7.6 – Partial VRC heat pump for extractive distillation process.................................................... 114
Figure 7.7 – Total annual cost of extractive column following payback period with and without heat
pump technique ..................................................................................................................................... 116
Figure 7.8 – Total annual cost of regeneration column following payback period with and without heat
pump technique ..................................................................................................................................... 117
Figure 7.9 – Total annual cost of basic case, full and partial VRC heat pump processes following
payback period....................................................................................................................................... 119
Figure 7.10 – Partial BF heat pump for extractive distillation process ..................................................... 122
Figure 7.11 – Total annual cost of basic case, full and partial BF heat pump processes following
payback period....................................................................................................................................... 123
Figure 7.12 – Total annual cost of optimal partial HI and partial VRC process following payback
period .................................................................................................................................................... 124

Thermodynamic Insight for the Design and Optimization of Extractive Distillation of 1.0-1a Class Separation
xvi
Chap.1. General Introduction
1
Chapter 1. General Introduction
Thermodynamic Insight for the Design and Optimization of Extractive Distillation of 1.0-1a Class Separation
2
1.Introduction
Distillation is the most practical and hence the most widely used fluid mixture separation technology in
many chemical and other industry fields like perfumery, medicinal and food processing (Olujić et al., 2009).
The first clear evidence of distillation can be dated back to the first century AD. Being the leading process
for the purification of liquid mixtures, distillation consumes large amounts of energy that are estimated to be
more than 95% of the total energy used for separation processes in chemical process industries (Mahdi et al.,
2015). Azeotropic and low relative volatility mixtures often occur in separating industry which separation
cannot be realized by conventional distillation. Extractive distillation is then a suitable alternative process.
Extractive distillation has been studied for many decades with rich literatures, some main subjects studied
include: column with all possible configurations; process operation polices and strategy; process design,
synthesis, optimization; determining separation sequencing; entrainer design and selection, feasibility studies
and so on. Among those, process feasibility and process design and optimization are always the critical
issues. It is necessary to assess process feasibility before making the design specifications, and the feasibility
studies also contribute to a better understanding of complex unit operations. In the other view, process design
and optimization which are more practical for industries are not only the aims of process feasibility studies,
but also tools for the validation of process feasibility.
1.1.Process feasibility
Upon the feasibility study, the design of extractive distillation is connected to thermodynamics, in particular
the volatility order. The residue curve maps analysis allows assessing the feasibility under infinite reflux
conditions with the finding of the ultimate products under direct or indirect split conditions. However, under
finite reflux conditions, finding which products are achievable and the location of the suitable feed
composition region is more complicated because we must consider the dependency of composition profile on
reflux and entrainer-to-feed ratio. That affects the range of composition available to each section profiles due
to the occurrence of pinch points, which differ from the singular points of the residue curve map. The
identification of possible cut under key parameters reflux, reboil ratio and entrainer flowrate has been the
main challenge for an efficient separation of azeotropic mixtures.
For decades, the design of an extractive distillation process has relied upon a simple feasibility rule (Levy
and Doherty, 1986; Andersen et al., 1991; Laroche et al., 1992): for the separation of a minimum (maximum)
boiling azeotropic mixture A-B, one should add a heavy entrainer E that forms no new azeotrope. The
corresponding ternary mixture A-B-E belongs to the (1.0-1a) class (Hilmen et al., 2002), which occurrence
among all azeotropic ternary mixtures amounts to 21.6% (Kiva et al., 2003). Rodríguez-Donis et al., (2001)
combined the knowledge of the thermodynamic properties of residue curve map and uni-volatility line, and
expressed a general feasibility criterion for extractive distillation under infinite reflux. Residue curve maps

Chap.1. General Introduction
3
and uni-volatility line analysis allows assessing the feasibility under infinite reflux conditions and the finding
of the ultimate products which is related to column configuration (direct or indirect split). Besides,
isovolatility lines reflect the easiness of proposed separation system, especially for the regeneration column.
However, distillation runs under finite reflux conditions and finding which products are achievable and the
location of the suitable feed composition region is more complicated because we must consider the
dependency of composition profiles on reflux as well as on entrainer flowrate (Lelkes et al., 1998a).
Following the general feasibility criterion for extractive distillation, the use of heavy, light or intermediate
boiling entrainers for the separation of minimum or maximum boiling azeotropic mixtures or of low relative
volatility mixtures are feasible (Rodriguez-Donis et al., 2009a, 2009b, 2012a, 2012b). The total occurrence
of suitable ternary mixtures classes for homogeneous extractive distillation reaches 53% in batch operation
mode and can be extended to continuous operation as well (Shen et al., 2013; Shen and Gerbaud, 2013). The
position of the uni-volatility curve in the residue curve map defines the product to be withdrawn as was first
proposed by Laroche et al.,(1991). It also hints at the occurrence of limiting entrainer flow rate or the
separation to be effective.
1.2.Process design and optimization
Upon the process design and optimization, following the definition of Figueirêdo et al. (2011), a well-
designed extractive process means obtaining the lowest specific energy consumption and the least loss of
solvent, taking into consideration the constraints imposed on the process. In the other hand, as global energy
consumption continues to increase, global climate change has recently begun to affect human life. Many
comprehensive energy reduction programs are being pursued to reduce energy usage and promote
sustainable development for the near future (Gao et al., 2013). Studies on how to save energy cost during
distillation operation is in urgent because distillation processes represent approximately 3% of the world
energy consumption (Engelien and Skogestad, 2004) and it is ranked in a third of the total used energy in
chemical industry (Linnhoff et al., 1983).
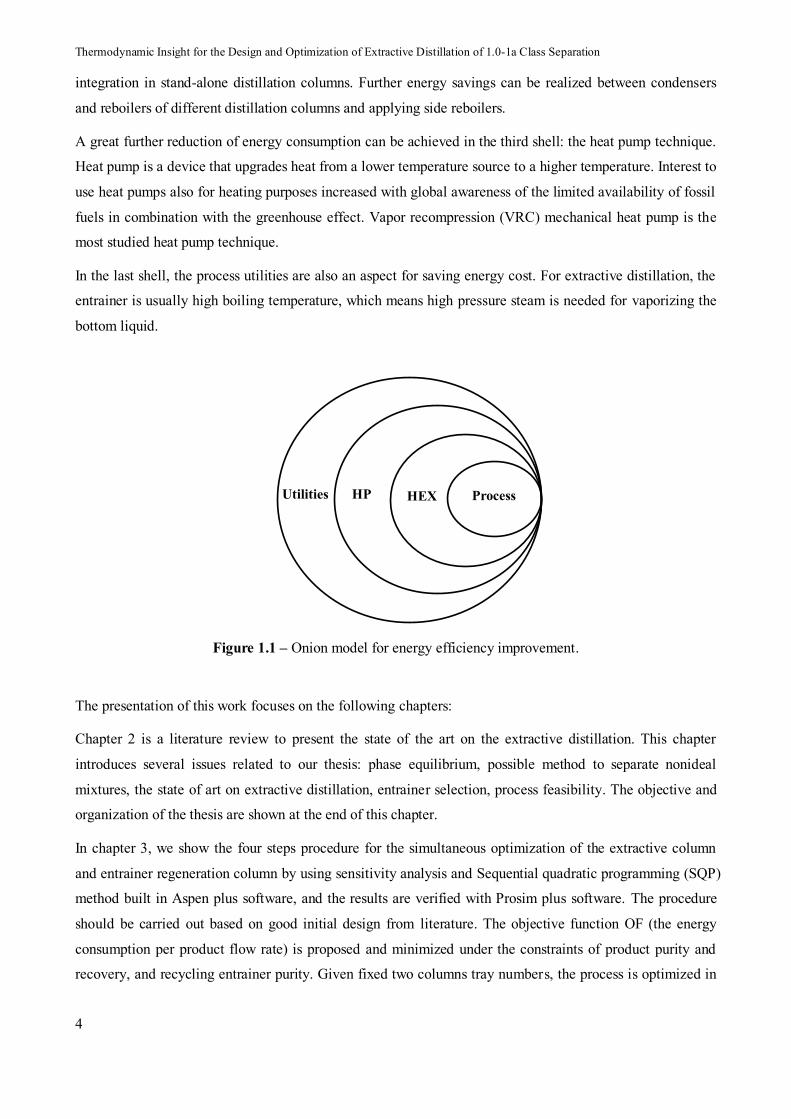
A systematic approach in saving energy consumption and improving the energy efficiency of industrial
processes is the onion-model developed in industrial heat technology (Bruinsma and Spoelstra, 2010). The
model is visualized in Figure 1.1.
In the first shell, the processes itself are optimized with respect to energy consumption and capital cost. It is
done by an economic optimization in which energy and other operating cost are balanced with annualized
investment cost for the equipments. In extractive distillation, the process means that both-columns are
optimized with variables by minimizing the energy cost and total annual cost.
In the second shell, energy consumption can be saved further by heat integration using heat exchanger
(HEX). There is a limitation for using heat integration technique because a temperature driving force is
needed for heat exchangers. Preheating the feed stream by using the bottom stream is the basic heat
Thermodynamic Insight for the Design and Optimization of Extractive Distillation of 1.0-1a Class Separation
4
integration in stand-alone distillation columns. Further energy savings can be realized between condensers
and reboilers of different distillation columns and applying side reboilers.
A great further reduction of energy consumption can be achieved in the third shell: the heat pump technique.
Heat pump is a device that upgrades heat from a lower temperature source to a higher temperature. Interest to
use heat pumps also for heating purposes increased with global awareness of the limited availability of fossil
fuels in combination with the greenhouse effect. Vapor recompression (VRC) mechanical heat pump is the
most studied heat pump technique.
In the last shell, the process utilities are also an aspect for saving energy cost. For extractive distillation, the
entrainer is usually high boiling temperature, which means high pressure steam is needed for vaporizing the
bottom liquid.
Process
HEX HP Utilities
Figure 1.1 – Onion model for energy efficiency improvement.
The presentation of this work focuses on the following chapters:
Chapter 2 is a literature review to present the state of the art on the extractive distillation. This chapter
introduces several issues related to our thesis: phase equilibrium, possible method to separate nonideal
mixtures, the state of art on extractive distillation, entrainer selection, process feasibility. The objective and
organization of the thesis are shown at the end of this chapter.
In chapter 3, we show the four steps procedure for the simultaneous optimization of the extractive column
and entrainer regeneration column by using sensitivity analysis and Sequential quadratic programming (SQP)
method built in Aspen plus software, and the results are verified with Prosim plus software. The procedure
should be carried out based on good initial design from literature. The objective function OF (the energy
consumption per product flow rate) is proposed and minimized under the constraints of product purity and
recovery, and recycling entrainer purity. Given fixed two columns tray numbers, the process is optimized in
Chap.1. General Introduction
5
open loop flowsheet and process variables are reflux ratios and distillates of the two columns, three feed
locations and the entrainer flowrate (It reflects entrainer-to-feed flowrate ratio). The effects of operating
variables in the regeneration column on the extractive column and the total process are firstly qualified
during optimization process. Then, the closed loop flowsheet is simulated with the variables got from the
open loop flowsheet in order to make sure that the effect of impurity of recycling entrainer on the process is
overcome. Total annual cost (TAC) for the process is calculated and worked as a complementary criterion
for comparing different designs. A trade-off between the two columns variables is found and optimal
parameters with lower energy consumption and TAC than literature results are found. The case study is
provided with the extractive distillation separation of acetone-methanol with entrainer water (class 1.0-1a).
Notice that the optimization procedure can treat the designs with different column tray number following
TAC, but we keep the same column tray numbers as literatures for comparison in chapter 3, 4 and 5. Then
we take them into account as variables in chapter 6 by using the genetic algorithm method.
In chapter 4, we show how thermodynamic insight can be used to improve the design of a homogeneous
extractive distillation process and we define an extractive efficiency indicator to compare the optimality of
different designs. Thermodynamic insight from the analysis of the ternary residue curve map and
isovolatility curves shows that a lower pressure reduces the minimal amount of entrainer and increases the
relative volatility of acetone – methanol in the extractive column. A 0.6 atm pressure is selected to enable the
use of cheap cooling water in the condenser. The four steps procedure shown in Chapter 3 is used by
minimizing the total energy consumption per product unit. The TAC is calculated for all processes. Double
digit savings in energy consumption and in TAC are achieved compared to literature values. We then
propose a novel efficiency indicator Eext and eext that describes the ability per tray of the extractive section to
discriminate the desired product between the top and the bottom of the extractive section. Shifting the feed
trays locations improves the efficiency of the separation, even when less entrainer is used.
In chapter 5, in order to further demonstrate the effects of thermodynamic insight and extractive efficiency
indicators on the homogeneous extractive distillation process itself, we show the optimization process of the
separation of the diisopropyl ether (DIPE) – isopropyl alcohol (IPA) minimum boiling azeotrope with heavy
entrainer 2-methoxyethanol aiming at finding the possible way to save energy cost and TAC. The four steps
procedure and the thermodynamic insight from the analysis of the ternary residue curve map and isovolatility
curves shows again that a lower pressure reduces the usage of entrainer and increases the relative volatility of
DIPE – IPA for the same entrainer content in the extractive column. A 0.4 atm pressure is selected to enable
the use of cheap cooling water in the condenser. We pay attention to explain the relationship of two
distillates in extractive distillation process and the curious behaviors that the energy cost OF decreases
following the increase of the distillate flowrate. Double digit savings in energy consumption have achieved
while TAC is reduced. The efficiency indicator of extractive section is calculated for comparison and
explanation of the energy savings.
Thermodynamic Insight for the Design and Optimization of Extractive Distillation of 1.0-1a Class Separation
6
In chapter 6, we consider thermodynamic efficiency indicator Eext and eext for optimizing the extractive
distillation in addition to energy cost OF and TAC. A two step optimization strategy for extractive
distillation is conducted to find suitable values of the entrainer feed flowrate, entrainer feed and azeotropic
mixture feed locations, total number of trays, reflux ratio, heat duty and condenser duty in both the extractive
column and the entrainer regeneration column. The first strategy relies upon the use of a multi-objective
genetic algorithm (GA) with four objective functions: OF, TAC, Eext and eext. Secondly, results taken from
the GA Pareto front are further optimized focusing on decreasing the energy cost by using the four steps
procedure shown in chapter 3 with only OF as objective function. In this way, the most suitable design with
relatively high efficiency and low cost are obtained. The final design is related to the thermodynamic insight
and help understanding the process behaviors. We find that there is a maximum Eext at given reflux ratio, and
there is minimum reflux ratio for a given Eext. There is an optimal efficiency indicator Eext,opt which
corresponding the minimum TAC. In other word, Eext,opt can be a criterion for the comparison between
different design for the same separating system.
In chapter 7, we show the double-effect heat integration and mechanical heat pump (MHP) technique for
extractive distillation in order to further save energy cost and TAC. As extractive distillation is an energy
intensive non-ideal liquid mixture separation process, reducing the total process cost and TAC is an
interesting issue for the process itself as well as the environmental pollution reduction effort. Double-effect
heat integration and mechanical heat pump technique are investigated for extractive distillation process and
compared from the economical view by TAC and environmental aspect by CO2 emissions. A novel optimal
partial heat integration process is proposed and optimized through the new objective function OF2. The
direct partial and full heat integration are regarded as the extremely conditions where (Qr1-Qc2) in OF2 taking
the maximal value or the minimal value zero. Instead of the minimum TAC founded in the optimal full heat
integration process as intuition, the optimal partial heat integration has the lowest TAC. Further, the
mechanical heat pumps (VRC and BF) are evaluated and both economical and environmental aspects are
taken into account. Based on the character of extractive distillation process that the temperature difference
between the bottom of the extractive column and the top of the regeneration column is usually small, we
proposed the new partial VRC and new partial BF process flowsheet in order to reduce the high initial capital
cost of compressors. We find that Partial VRC process gives better performance from economical view while
full BF process leads better performance in environmental aspect.
The last part chapter deals with conclusions and future studies that can be drawn. Appendixes collect the
formulations for calculating the cost data of distillation column, some definitions of common terms of
extractive distillation in this manuscript.

Chap.2. State of The Art and Objectives
7
Chapter 2. State of The Art and Objectives
Thermodynamic Insight for the Design and Optimization of Extractive Distillation of 1.0-1a Class Separation
8
2.State of the art and objectives
2.1.Phase equilibrium
As the systems in extractive distillation are non-ideal, the phase equilibrium model and thermodynamic
model used to describe the proposed system are fatal for all the works and the results should be validated by
the experimental data.
2.1.1.Phase equilibrium model
Phase equilibrium behavior is the foundation of chemical mixture components separation by distillation. The
basic relationship for every component in the vapor and liquid phases of a system at equilibrium is the
equality of fugacity in all phases. In an ideal liquid solution the liquid fugacity of each component in the
mixture follows Raoult’ law and is directly proportional to the mole fraction of the component. However,
because of the non-ideality in the liquid solution of the systems, activity coefficient which represents the
deviation of the mixture from ideality methods is used to describe the liquid phase behavior. For the vapor
phase, as the pressure is not high, ideal gas behavior is assumed and the gas fugacity equals to the partial
pressure. Thus the basic vapor-liquid equilibrium equation (McCabe et al., 2004; Poling et al., 2001) is
modified as:
Pyffxf iv
il
iiil
i *, (2.1)
i is the liquid activity coefficient. With the liquid phase reference fugacity lif*, being calculated from:
****,*, ),( iiiv
il
i PPTf (2.2)
Where vi*, is the fugacity coefficient of pure component i at the system temperature (T) and saturated vapor
pressure, as calculated from the vapor phase equation of state (for ideal vapor phase: vi*, = 1 ). *
iP is the
saturated vapor pressure of component i at the system temperature. *i is the Poynting correction for
pressure )1exp(*
*,
P
P
li
i
dPVRT
.
At low pressures, the Poynting correction is near unity and can be ignored. Thus the overall vapor–liquid
phase equilibrium (VLE) relationship for most of the mixture systems in the following chapters can be
described as the following equation:
*iiii PxPy (2.3)
Chap.2. State of The Art and Objectives
9
Equation (2.3) is the so-called Raoult-Dalton's Law. Calculation of the saturated vapor pressure for a pure
component is needed in Equation (2.3) for the VLE relationship. The extended Antoine equation can be used
to compute liquid vapor pressure as a function of the system temperature T:
iCiii
i
jii TCTCTC
CTC
CP 7654
3
21
* lnln
(2.4)
Where C1i to C7i are the model parameters, model parameters for many components are available in the
literature or from the pure component databank of the Aspen Physical Property System or from Simulis
Thermodynamic.
2.1.2.Nonideality of mixture
In most distillation systems, the predominant nonideality occurs in the liquid phase because of molecular
interactions. Equation (2.3) contains the liquid phase activity coefficient of the i component. When
chemically dissimilar components are mixed together (for example, oil molecules and water molecules),
there exists repulsion or attraction between dissimilar molecules. If the molecules repel each other, they exert
a higher partial pressure than if they were ideal. In this case the activity coefficients are greater than unity
(called a “positive deviation” from Raoult‘s law). If the molecules attract each other, they exert a lower
partial pressure than if they were ideal. Activity coefficients are less than unity (negative deviations).
Activity coefficients are usually calculated from experimental data or from the VLE models regressed on
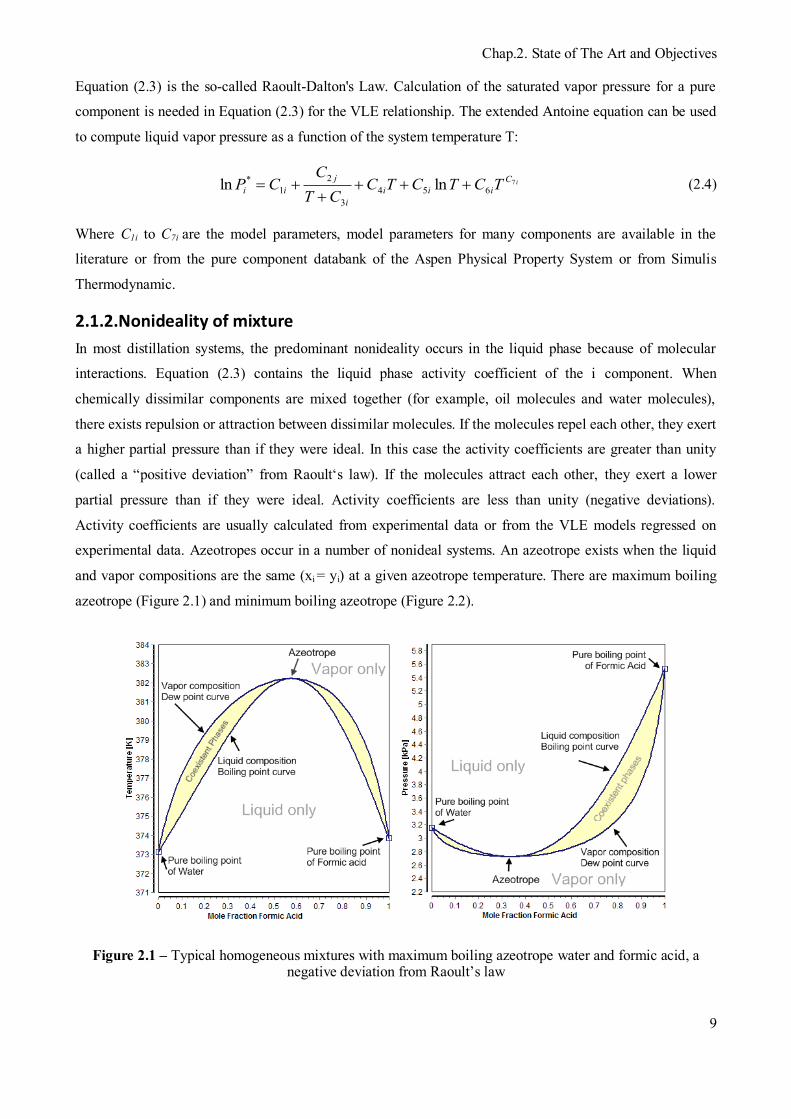
experimental data. Azeotropes occur in a number of nonideal systems. An azeotrope exists when the liquid
and vapor compositions are the same (xi = yi) at a given azeotrope temperature. There are maximum boiling
azeotrope (Figure 2.1) and minimum boiling azeotrope (Figure 2.2).
Figure 2.1 – Typical homogeneous mixtures with maximum boiling azeotrope water and formic acid, a negative deviation from Raoult’s law
Thermodynamic Insight for the Design and Optimization of Extractive Distillation of 1.0-1a Class Separation
10
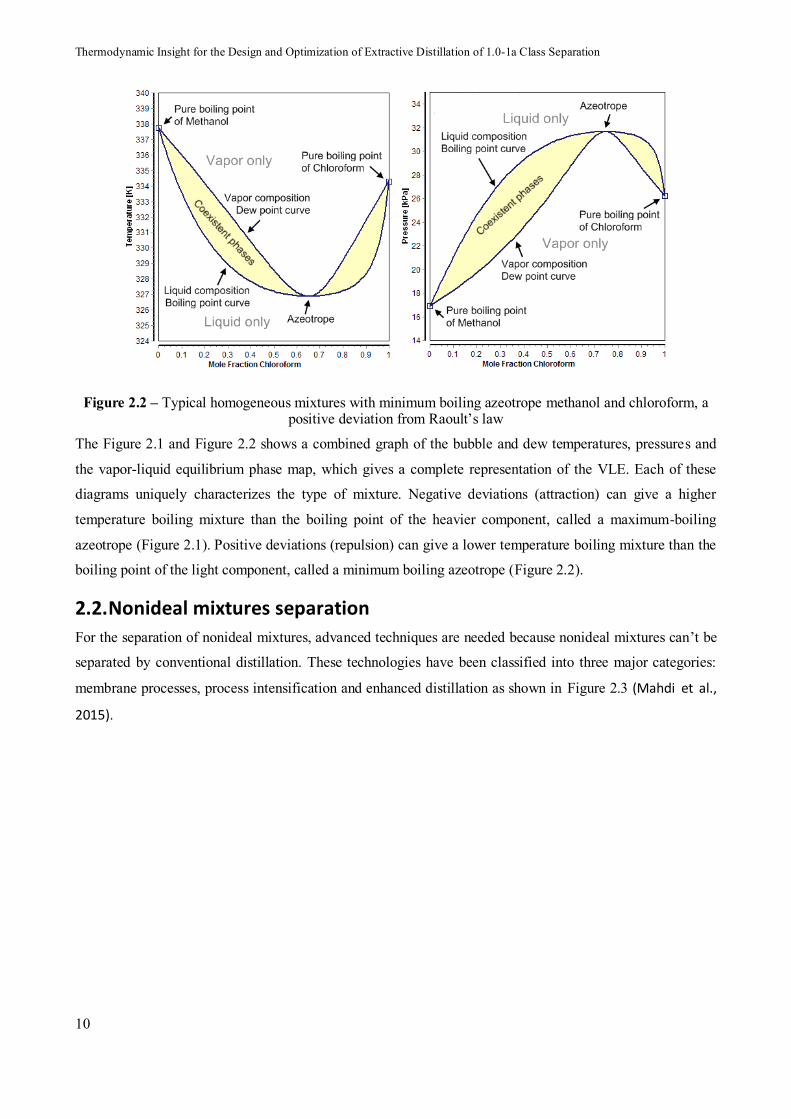
Figure 2.2 – Typical homogeneous mixtures with minimum boiling azeotrope methanol and chloroform, a positive deviation from Raoult’s law
The Figure 2.1 and Figure 2.2 shows a combined graph of the bubble and dew temperatures, pressures and
the vapor-liquid equilibrium phase map, which gives a complete representation of the VLE. Each of these
diagrams uniquely characterizes the type of mixture. Negative deviations (attraction) can give a higher
temperature boiling mixture than the boiling point of the heavier component, called a maximum-boiling
azeotrope (Figure 2.1). Positive deviations (repulsion) can give a lower temperature boiling mixture than the
boiling point of the light component, called a minimum boiling azeotrope (Figure 2.2).
2.2.Nonideal mixtures separation
For the separation of nonideal mixtures, advanced techniques are needed because nonideal mixtures can’t be
separated by conventional distillation. These technologies have been classified into three major categories:
membrane processes, process intensification and enhanced distillation as shown in Figure 2.3 (Mahdi et al.,
2015).
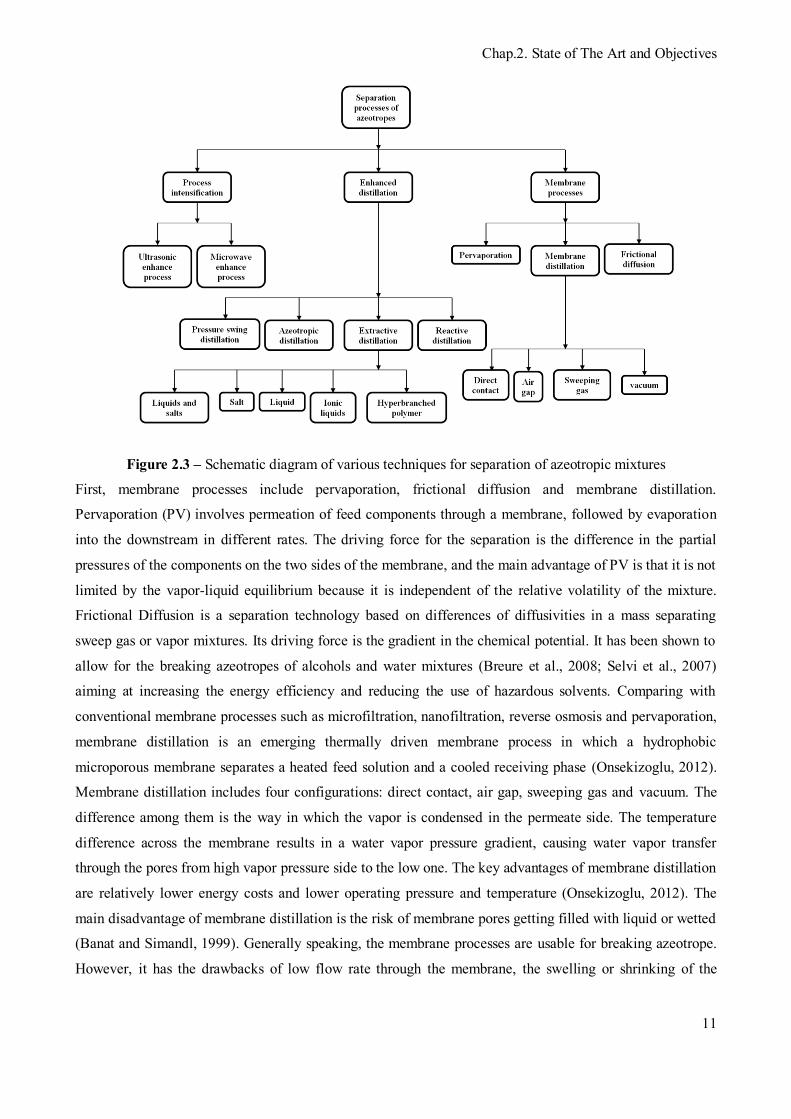
Chap.2. State of The Art and Objectives
11
Figure 2.3 – Schematic diagram of various techniques for separation of azeotropic mixtures
First, membrane processes include pervaporation, frictional diffusion and membrane distillation.
Pervaporation (PV) involves permeation of feed components through a membrane, followed by evaporation
into the downstream in different rates. The driving force for the separation is the difference in the partial
pressures of the components on the two sides of the membrane, and the main advantage of PV is that it is not
limited by the vapor-liquid equilibrium because it is independent of the relative volatility of the mixture.
Frictional Diffusion is a separation technology based on differences of diffusivities in a mass separating
sweep gas or vapor mixtures. Its driving force is the gradient in the chemical potential. It has been shown to
allow for the breaking azeotropes of alcohols and water mixtures (Breure et al., 2008; Selvi et al., 2007)
aiming at increasing the energy efficiency and reducing the use of hazardous solvents. Comparing with
conventional membrane processes such as microfiltration, nanofiltration, reverse osmosis and pervaporation,
membrane distillation is an emerging thermally driven membrane process in which a hydrophobic
microporous membrane separates a heated feed solution and a cooled receiving phase (Onsekizoglu, 2012).
Membrane distillation includes four configurations: direct contact, air gap, sweeping gas and vacuum. The
difference among them is the way in which the vapor is condensed in the permeate side. The temperature
difference across the membrane results in a water vapor pressure gradient, causing water vapor transfer
through the pores from high vapor pressure side to the low one. The key advantages of membrane distillation
are relatively lower energy costs and lower operating pressure and temperature (Onsekizoglu, 2012). The
main disadvantage of membrane distillation is the risk of membrane pores getting filled with liquid or wetted
(Banat and Simandl, 1999). Generally speaking, the membrane processes are usable for breaking azeotrope.
However, it has the drawbacks of low flow rate through the membrane, the swelling or shrinking of the
Thermodynamic Insight for the Design and Optimization of Extractive Distillation of 1.0-1a Class Separation
12
membrane materials caused by the feed mixtures and so on (Mahdi et al., 2015; Wang et al., 2005). Besides,
they are limited in terms of industrial application because it is yet to be proven in large scale production.
Second, process intensifications include microwave enhanced process and ultrasonic enhanced process. Gao
et al., (2013) studied the separation of benzene-ethanol mixture using microwave technology and
demonstrated that the effect of VLE under a microwave field was significant, indicating that a strong
dependence on the dielectric properties of the binary mixture might exist. Ripin et al., (2009) studied the
effects of ultrasonic waves on the vapor-liquid equilibrium of methyl-tert-butyl-ether and methanol mixture,
and proved that ultrasonic waves at different intensities and frequencies had potential to favorably
manipulate the relative volatility of an azeotropic mixture. The main advantage of microwave and ultrasonic
technology is that the azeotropic point can be shifted or eliminated by choosing suitable operating conditions.
However, those studies are still in laboratory stage and more research attentions are needed before they are
used in industrial separation processes.
Third, there are four enhanced distillation processes by modifying the process conditions and configurations:
(1) Pressure-swing distillation (PSD), which consists in taking advantage of the binary azeotropic
composition changing with the pressure (Knapp and Doherty, 1992; Phimister and Seider, 2000). (2)
Azeotropic distillation (AD), in which a third component E is added to the feed. A or B components become
either a residue curve stable or unstable node in the relevant distillation region, thus being removable as
product by either an indirect or a direct split respectively (Widagdo and Seider, 1996). (3) Reactive
distillation (RD), which uses chemical reaction to modify the composition of the mixture or, alternatively,
uses existing vapor-liquid differences between reaction products and reactants to enhance the performance of
a reaction. (4) Extractive distillation (ED), in which the third component is fed at another location than the
main feed, giving rise to an extractive section (Pierotti, 1944; Lelkes et al., 1998b;). Usually but not always,
the achievable product of extractive distillation is a residue curve saddle node in the relevant distillation
region. For generalized extractive distillation, the separating agent can be a liquid solvent, dissolved salt (salt
distillation), mixture of liquid solvents, mixture of dissolved salts, ionic liquids and hyperbranched polymers
(Mahdi et al., 2015). As the industrial proven processes for separating azeotropic mixture, enhanced
distillation processes are still the main technologies in large scale production.
2.2.1.Pressure-swing distillation
Pressure-swing distillation can be used for the binary pressure-sensitive azeotrope (Luyben, 2012; Modla and
Lang, 2010) or pressure-insensitive azeotrope with an entrainer (Knapp and Doherty, 1992; Li et al., 2013)
or ternary mixture with one, two or three binary azeotropes and at least one of them is pressure sensitive
(Modla et al., 2010). In binary pressure-swing distillation, two columns operated in sequence at two different
pressures if composition of the azeotrope changes significantly with pressure (Seader et al., 2010). Generally,
the composition of component A (light in the azeotropic mixture) increases as pressure decreases, possibly
until disappearance of the azeotrope allowing the use of a conventional distillation process.

Chap.2. State of The Art and Objectives
13
For pressure insensitive azeotropes, Knapp and Doherty, (1992) proposed a new pressure-swing distillation
to separate them with a suitable pressure-swing entrainer. This new technique uses varying pressure to move
distillation boundaries that lie between the desired products which otherwise would make the separation
impossible. The design and control of pressure-swing distillation for separating pressure insensitive
maximum boiling azeotrope phenol-cyclohexanone using acetophenone as a heavy entrainer is shown by Li
et al., (2013). In a ternary mixture separation, there may exist distillation boundaries involving azeotrope (s)
as seen on residue curve maps. These boundaries can be crossed by changing the pressure because they vary
with pressure along with the azeotrope composition. Between the boundaries at two different pressures, there
is a region from where different products can be obtained at the different pressures. If all products obtained
at different pressures are pure components or pressure sensitive binary azeotrope (s) this region is considered
as the operating region of pressure-swing distillation (Modla et al., 2010).
2.2.2.Azeotropic distillation
Azeotropic distillation usually refers to the specific technique of adding another component along with the
main feed. In some senses, adding an entrainer is similar to extractive distillation. Azeotropic distillation
processes have been well studied and the feasibility assessment only relies upon residue curve map analysis
whereas for extractive distillation, the volatility order region must be known as well (Gerbaud and
Rodriguez-Donis, 2014). Consider the separation of a minimum boiling azeotrope AB with a light entrainer
E forming no new azeotrope. The ternary diagram belongs to the 1.0-2 class (see Figure 2.4). Both A and B
are stable node but they are located in different batch distillation regions. Residue curves begin at the
unstable entrainer vertex (E) and end at the stable A or B. In batch, both azeotropic components can be
distillated if the boundary is curved enough (Bernot et al., 1990; Doherty and Malone, 2001). In continuous
only A or B is obtained from the column. Regarding continuous process, research has focused on advances in
the methodologies for the synthesis, design, analysis and control of separation sequences involving
homogeneous and heterogeneous azeotropic towers. Maps of residue curves and distillation lines were
examined in a review article (Widagdo and Seider 1996), as well as geometric methods for the synthesis and
design of separation sequences, trends in the steady-state and dynamic analysis of homogeneous and
heterogeneous towers, the nonlinear behavior of these towers, and strategies for their control. Emphasis is
placed on the methods of computing all of the azeotropes associated with a multicomponents mixture, on the
features that distinguish azeotropic distillations from their non azeotropic counterparts, on the possible
steady-state multiplicity, and on the existence of maximum and minimum reflux bounds. Important
considerations in the selection of entrainers are examined (Foucher et al., 1991). For the synthesis of
separation trains, when determining the feasible product compositions, the graphical methods are clarified,
especially the conditions under which distillation boundaries can be crossed and bounding strategies under
finite reflux (Gerbaud and Rodriguez-Donis, 2014). A recent update on azeotropic distillation was published
by Arlt (2014).

Thermodynamic Insight for the Design and Optimization of Extractive Distillation of 1.0-1a Class Separation
14
(a)
A A
B C B C
(b)
Figure 2.4 – Indirect separation (a) and direct (b) azeotropic continuous distillation under finite for a 1.0-2
class mixture (from Gerbaud and Rodriguez-Donis, 2010)
2.2.3.Reactive distillation
Reactive Distillation (RD) is a combination of reaction and distillation in a single vessel owing to which it
enjoys a number of specific advantages over conventional sequential approach of reaction followed by
distillation or other separation techniques (Hiwale et al., 2004). Harmsen, (2007) reported that more than 150
industrial scale reactive distillations which is operated worldwide at capacities of 100–3000 kiloton/year
because it offers the advantage of improved selectivity, increased conversion, better heat control, effective
utilization of reaction heat, scope for difficult separations and the avoidance of azeotropes. In RD, the
entrainer reacts preferentially and reversibly with one of the original mixture components, the reaction
product is distilled out from the non-reacting component and the reaction is reversed to recover the initial
component. This can result in significant reductions in both energy and equipment in systems that have
appropriate chemistry and appropriate vapor–liquid phase equilibrium. Besides, conversion can be increased
far beyond what is expected by the equilibrium due to the continuous removal of reaction products from the
reactive zone (Luyben and Yu, 2009).
Although invented in 1921, the industrial application of reactive distillation did not take place before the
1980. Being a relatively new field, research on various aspects such as modeling and simulation, process
feasibility, column hardware design, non-linear dynamics and control is in progress. The suitability of RD
for a particular reaction depends on various factors such as volatilities of reactants and products along with
the feasible reaction and distillation temperature. A commentary paper (Malone and Doherty, 2000) on RD
exposes an effective way of decomposing the design and development of reactive distillation involves four
stages: (1) feasibility and alternatives, (2) conceptual design and evaluation, (3) equipment selection and
hardware design, and (4) operability and control. The feasibility criteria for single-feed and double-feed
continuous and batch reactive distillation systems are studied by Guo and coworkers (Guo et al., 2004; Guo
and Lee, 2004) using graphical method and the phase and reaction equilibrium information. Brehelin et al.,
(2007) studied the catalytic reactive distillation process for the production of n-propyl acetate based on
experiments and simulations. Pilot plant experiments were performed using a homogeneous strong acid
catalyst in a packed column. Simulation results are in good agreement with experimental data. Filipe et al.,
Chap.2. State of The Art and Objectives
15
(2008) investigated the multiobjectives design of complex reactive distillation columns through the use of
feasible regions. A cost indicator reflecting energy usage and column size is introduced and used to build the
Pareto surface describing the optimal combinations of cost and performance. Mo et al., (2011) studied the
design and control of the RD for hydrolysis of methyl lactate based on the objective function of TAC. The
effects of tray number of rectifying section, tray number of reactive section, and feed location on the TAC
were investigated, and a dual-temperature control structure was proposed. Fernandez et al., (2013) presented
a series of experiments for the production of ethyl acetate from esterification of acetic acid and ethanol in a
reactive distillation pilot column. Predicted and measured results show good agreement and reveal a strong
dependency of the structured packing catalyst activity on the pilot geometry and its operating conditions. The
experimental validation is shown to be essential to provide realistic hydrodynamic parameters, to understand
the sensitive parameters such as heat losses and to adapt values for the catalyst holdup as a function of the
system. A recent update on reactive distillation was published by Keller (2014).
2.2.4.Generalized extractive distillation
Extractive distillation is a powerful and widely used technique for separating azeotropic and low relative
volatility mixtures in pharmaceutical and chemical industries. Given an azeotropic mixture A-B (with A
having a lower boiling temperature than B), an entrainer E is added to interact selectively with the original
components and alter their relative volatility, thus enhancing the original separation. Compared with
azeotropic distillation, some energy saving is expected in extractive distillation because the amount of
entrainer is usually less, leading to the energy saving in entrainer regeneration column (Lang, 1992; Lei et al.,
2003). The main distinction between extractive distillation and azeotropic distillation is that: the entrainer is
fed at a different location than the main mixture, bringing an additional extractive section in the column,
between the usual stripping and/or the rectifying sections (Gerbaud and Rodriguez-Donis, 2014). We will
introduce the extractive distillation following the separating agent: solid salt, combination of liquid solvent
and solid salt, ionic liquid and hyperbranched polymers. Notice that the extractive distillation processes with
a liquid entrainer are the main part of this work and will be introduced emphatically in the next part.
2.2.4.1. Extractive distillation with solid salt or salt effect distillation
In salt effect distillation, a salt is dissolved in the mixture of azeotropic or zeotropic liquids mixtrures and
alters the relative volatilities sufficiently so that the separation becomes possible. The salt is fed into the
distillation column at the top of the column at a steady rate. It dissolves in the liquid phase, and since it is
non-volatile, flows out with the heavier bottoms stream. The bottoms are partially or completely evaporated
to recover the salt for reuse. The simulate and optimization of a saline extractive distillation process for
dehydration of ethanol have been studied by using four saline agents (NaCl,KCl,KI,CaCl2) (Pinto et al.,
2000).
Compared to the liquid agent, solid salt is more effective and requires a much smaller salt ratio, thus leading
to a high production capacity and a low energy consumption (Gil et al., 2008). Besides, the product at the top

Thermodynamic Insight for the Design and Optimization of Extractive Distillation of 1.0-1a Class Separation
16
of the column is free from salt impurities since solid salt is not volatile. However, salt effect distillation has
the disadvantages of dissolution, reuse and transport of the salt, corrosion of equipment. Thus its application
in industry is limited (Lei et al., 2005).
In order to overcome the disadvantages of salt effect distillation, Lei et al., (2002) studied the use of N,N-
dimethylformamide (DMF) as a solvent to separate C4 mixture by adding a small amount of solid salt to
DMF and achieved an improvement in the relative volatilities of C4. They also described the relationship
between microscale salt coefficients and macroscale relative volatilities at infinite dilution by using the
scaled particle theory. Gil et al., (2008) analyzed an extractive distillation process for azeotropic ethanol
dehydration with ethylene glycol and calcium chloride mixture as entrainer, and obtained a substantial
reduction in the energy consumption. Dhanalakshmi et al., (2014) investigated the salt effect of four
inorganic salts on the vapor liquid equilibria of the binary methyl acetate–methanol system at 1 atm and they
observed that the bivalent cation salts had greater salting out effect than uni-valent cation. They also found
that zinc nitrate is more effective than the other nitrate salts of calcium and magnesium even at lower salt
concentrations, which leads to energy saving in reboiler. However, because of the equipment corrosion
caused by salts and the decomposition of salts at high temperatures, the suitable solid salts are available only
in a narrow range.
2.2.4.2. Extractive distillation with ionic liquid
The use of ionic liquids (ILs) as separating agents in the extractive distillation process is a recent strategy
and has received considerable attention due to their unique advantages of negligible vapor pressure at room
temperature (Earle et al., 2006). Besides, extractive distillation with the ILs has the following advantages: (1)
Absence of product impurities at the top of the column as ILs are not volatile. (2) A wide using temperature
range. (3) Facile recovery and reuse of ILs. (4) High stability when the operations of extractive distillation in
terms of thermal and chemical conditions (Mahdi et al., 2015). Dhanalakshmi et al., (2013) studied the
separation of methyl acetate-methanol and ethyl acetate-ethanol with 13 cations and 27 anions as entrainers
to identify suitable ILs using the conductor-like screening model for realistic salvation (COSMO-RS) model.
They reported that the shorter alkyl chain of the cation favors the azeotrope separation, and the anion plays
an important role and decides the solubility of ionic liquid in alcohols by which methyl acetate and ethyl
acetate are removed from the alcohol solutions. Ramírez-Corona et al., (2015) presented a design method for
distillation systems aided by ILs based on tray-by-tray calculations with the ethanol dehydration as case
study. They found that the most important design parameter is the IL concentration, and that the separation
process can be intensified with the use of a single column.
Nevertheless, extractive distillation with ILs has some disadvantages such as the long time required to
prepare ILs, the high cost of synthesis specialty components, difficult to manage due to the separation of
viscous solutions, and moisture sensitivity of ILs (Lei et al., 2005; Pereiro et al., 2012). Such disadvantages
have slowed down the application of this process in industry.
Chap.2. State of The Art and Objectives
17
2.2.4.3. Extractive distillation with low transition temperature mixtures (LTTMs)
LTTMs are commonly defined as mixtures of two or more solid compounds, which have much lower
melting point than the initial components due to hydrogen bonding. Originally, LTTMs were called deep
eutectic solvents (DESs), but this name does not cover the complete class of solvents because many mixtures
do not show an (eutectic) melting point, but a glass transition instead (Rodríguez et al., 2015). LTTMs have
some common properties that make them suitable as entrainers for extractive distillation: low vapor pressure,
wide liquid range, water compatibility, biodegradability, non-flammability and easy and cheap preparation
by mixing natural and readily starting materials (Francisco et al., 2013). Oliveira et al., (2013) studied three
different DESs for the separation of azeotropic mixture heptane plus ethanol and found that DESs surpass the
performance of existing extraction solvents ILs, leading to an increase in efficiency and a reduction in energy
consumption of the overall process. Rodríguez et al., (2015) measured the vapor–liquid equilibrium data for
the pseudo-binary mixtures of water–LTTM and ethanol–LTTM and found that the ethanol–water azeotrope
can be broken by LTTMs such as lactic acid–choline chloride 2:1, malic acid–choline chloride 1:1 (MC 1:1)
and so on. Rodriguez and Kroon, (2015) considered two different LTTMs as potential entrainers for the
azeotropic mixture of isopropanol and water and reported that the given LTTMs cannot break the azeotrope
at given concentrations. However, the azeotrope was displaced to a much higher isopropanol concentration.
LTTMs are recently discovered as potential entrainer for the extractive distillation and more basic researches
are needed before it can be applied into industries.
2.2.4.4. Extractive distillation with hyperbranced polymers
Hyperbranched polymers represent highly branched, polydisperse macromolecules with a treelike topology
and a large number of functional groups. Seiler et al. (2003) seems the pioneers who suggested the use of
hyperbranched polymers as entrainers for extractive distillation. They found that the commercially available
hyperbranched polyesters and hyperbranched polyesteramides can be capable of breaking the ethanol-water
and THF-water azeotrope. Later, the author (Seiler et al., 2004) simulated the extractive distillation with
hyperbranced polymers based on thermodynamic studies of the influence of hyperbranched polymers on the
vapor–liquid and liquid–liquid equilibrium of the azeotropic ethanol–water and THF–water systems and
showed the potential of hyperbranched polymers as selective solvent in terms of feasibility and energetic
efficiency compared with conventional process. However, all the works are limited to laboratory stage and
more efforts are needed to put forward the industrial application of hyperbranced polymer.
2.2.4.5. Extractive distillation with pressurized carbon dioxide
In 1957, Baker and Anderson (1957) found that homogeneous aqueous solutions of alcohols (ethanol) can be
split into two liquid phases by pressurized gases CO2. The vapor−liquid phase equilibrium behavior of CO2
+ liquid can be tuned into a vapor−liquid−liquid phase equilibrium behavior by pressurizing CO2, and the
transition occurs at the lower critical solution pressure. Ye et al., (2013) studied the separation of azeotropic
mixture acetonitrile−water system by tuning the phase behavior using pressurized CO2 as a tunable solvent

Thermodynamic Insight for the Design and Optimization of Extractive Distillation of 1.0-1a Class Separation
18
and showed that it has significant potential to reduce the separation costs up to 30.5% compared with the
conventional pressure-swing distillation process. However, few research attentions are focused on it and
more basic studies are needed for this process.
2.3.Introduction of extractive distillation with liquid entrainer
2.3.1.Extractive distillation
Extractive distillation has been studied for many decades with very rich literatures, some main subjects
studied include: column with all possible configurations; feasibility studies; process operation polices and
strategy; process design, synthesis, optimization; determining separation sequencing; entrainer design and
selection, and so on (Shen, 2012). Among those, process feasibility is a critical issue as before making the
separation mission and find the optimal design, the designer should know that it is possible or not. Feasibility
studies also contribute to a better understanding of complex unit operations such as the batch and continuous
extractive distillation. Optimal design is another important issue in extractive distillation process since all the
studies on the separation of azeotrope is aimed to make the separating process come true in industry.
Extractive distillation is considered as a promising distillation process compared with azeotropic distillation
when the mixtures which are azeotropic or close-boiling because of saving energy, especial under the global
background of energy use reduction and emissions reduction. Extractive distillation is suitable for the
separation of non ideal mixtures, including minimum or maximum boiling azeotropes and low relative
volatility mixtures (Luyben and Chien, 2010; Petlyuk, 2004). The main tools for the feasibility study of
extractive distillation are residue curve map and uni-volatility line.
Entrainer selection and process optimal design are always the important issues in the design of extractive
distillation. The entrainer selection issue is strongly related to the process feasibility. Feasibility rules have
been published for batch (Lang et al., 1999; Lelkes et al., 1998a; Rodriguez-Donis et al., 2009a, 2009b,
2012a, 2012b) and continuous process (Botía et al., 2010; Knapp and Doherty, 1994; Laroche et al., 1991; Li
and Bai, 2012; Luyben, 2008; Petlyuk, 2004; Shen et al., 2013; Shen and Gerbaud, 2013) for the separation
of minimum or maximum boiling azeotropes or low relative volatility mixtures with heavy, light or
intermediate entrainers, giving rise to extractive separation classes (Gerbaud and Rodriguez-Donis, 2014).
Once an extractive separation class is considered, the process optimal design is undertaken by simulation and
optimization, based on the calculation of the total annual cost, a trade-off between capital cost and operating
cost. Energy consumption and solvent losses are included in the operating costs.
2.3.2.Entrainer features
The effectiveness of an extractive distillation process relies on the choice of the extractive agent (Kossack et
al., 2008) because it affects the feasibility and efficiency of the processes since the processes synthesis and
design is evidently based on the thermodynamic properties of the mixture to be separated: residue curve map
topology and equi-volatility. In the choice of solvent, many qualitative heuristic methods have been
developed. After that, a more effective method for selecting solvents is computer-aided molecular design
Chap.2. State of The Art and Objectives
19
(CAMD) (Pretel et al., 1994). Van Dyk and Nieuwoudt, (2000) proposed a method for design solvent of
extractive distillation based on CAMD, and used UNIFAC model to estimate the relative volatilities. The
boiling and freezing points are estimated by Joback’s group contribution methods, and they reported that the
predicted solvents for extractive distillation agree well with the solvent currently used in industry. The
entrainer for extractive distillation should possess suitable features on thermodynamics and process operation
(Gerbaud and Rodriguez-Donis, 2014).
First, features of thermodynamics such as boiling point, critical properties (Marrero and Gani, 2001). The
entrainer boiling temperature sets the ternary residue curve map topology, the most appropriate column
configuration, and the product cut sequence. For decades, the unique standard for selecting entrainer is
having the highest boiling point in the proposed system and not forming new azeotropes with the original
components. However, when the azeotropic components are heat sensitive or have a high boiling
temperature, the light or intermediate entrainer or reduced pressure distillation are recommended, so the
selectivity of the entrainer should not be the unique concern. Second, features of process operation such as
entrainer-feed flow ratio, selectivity and solvency (Yang and Song, 2006). Entrainer-feed flow rate ratio is
one of the important process operation parameters for extractive distillation as it directly affects the process
feasibility (Kim et al., 2004). It can be partly predicted from the thermodynamic insight, involving the
properties of residue curve map and uni-volatility curves. Selectivity is usually assessed via the relative
volatility of A versus B (αA,B) and the ratio of activity coefficients of A and B at infinite dilution in the
entrainer. Solvency refers to the total or partial miscibility of the entrainer with components A or B, which
will lead to homogeneous or heterogeneous distillation. Besides, other features for entrainer selection e.g.
corrosion, price, toxicity, thermal stability, environmental waste and so on (Weis and Visco, 2010) should
also be taken into consideration.
2.3.3.Relative volatility
The relative volatility of the components i and j in a given binary mixture with ideal vapor phase is defined
by
0
0
jj
ii
jj
iiij p
pxyxy
(2.5)
Where x and y are the molar fractions in the liquid and vapor phase, γ is the activity coefficient and p0 the
pure component vapor pressure.
The relative volatility is well-known characteristics of the vapor–liquid equilibrium and the base of
distillation. The relative volatility is a very convenient measure of the ease or difficulty of separation in
distillation. The relative volatility characterizes the ability of component i to transfer (evaporate) into the
vapor phase compared to the ability of component j. Component i is more volatile than component j if ij>1,
and less volatile if ij<1. For ideal and nearly ideal mixtures, the relative volatilities for all pair of
Thermodynamic Insight for the Design and Optimization of Extractive Distillation of 1.0-1a Class Separation
20
components are nearly constant in the whole composition space. The situation is different for non-ideal and
in particular azeotropic mixtures where the composition dependence can be complex.
Heuristics in distillation state that a large value of relative volatility implies that components i and j can be
easily separated in a distillation column. Values of ij close to 1 imply that the separation will be very
difficult, requiring a large number of trays and high energy consumption. For binary systems, the relative
volatility of light to heavy component is simply called :
)1/()1(
/xy
xy
(2.6)
x
xy)1(1
(2.7)
Where x and y are the mole fractions of the light component in the liquid and vapor phases respectively.
Rearrangement of equation (2.6) leads to the very useful y-x relationship equation (2.7) that can be employed
when is constant in a binary system. If the temperature dependence of the vapor pressure of both
components is the same, relative volatility will be independent of temperature. This is true for many
components over a limited temperature range, particularly when the components are chemically similar.
Short-cut distillation columns are frequently designed assuming constant relative volatility because it greatly
simplifies the VLE calculations. Relative volatilities usually decrease somewhat with increasing temperature
in most systems.
Uni-volatility line diagrams can be used to sketch the VLE diagrams and represent the geometry of the
simple phase transformation trajectories. The qualitative characteristics of the relative volatility functions are
typical approaches for the thermodynamic topological analysis. Kiva et al (2003) considered the behavior of
these functions for binary mixtures. The composition dependency of the distribution coefficients is
qualitative and quantitative characteristics of the VLE for the given mixture. The patterns of these functions
determines not only the class of binary mixture (zeotropic, minimum-or maximum-boiling azeotrope, or
biazeotropic), but also the individual behavior of the given mixture.
The relative volatility features can be represented by isovolatility lines. Then the system of uni-volatility
lines where αij = 1 was proposed. It is evident that the point of a binary azeotrope Azij gives rise to a αij uni-
volatility line and that the point of a ternary azeotrope gives rise to the three uni-volatility lines (Kiva et al.
2003). For the illustration of a binary azeotrope uni-volatility line, see Figure 3.2 in chapter 3 for acetone-
methanol with water system.
2.3.4.Entrainer selectivity
In the extractive distillation, the entrainer is introduced to enhance the relative volatility of the original
mixtures in order to make the azeotropes disappear. Following equation 2.5, the ratio Pi0/P j
0 is constant for a
Chap.2. State of The Art and Objectives
21
given temperature; the solvent only affects the ratio of the activity coefficients γ i/γj. In the presence of a
solvent S, this ratio is called selectivity Sij
Sj
iijS
(2.8)
The activity coefficients depend on the liquid phase composition. Since the effect of the entrainer tends to
increase with concentration in the mixture, it is common practice to evaluate the selectivity at infinite
dilution. The definition of selectivity given before then becomes
j
iijS
(2.9)
Which also represents the maximum possible selectivity.
Another proposed measure to assess the suitability of an entrainer is the capacity (Kossack et al., 2008),
which is determined by C∞j,entrainer = 1/γi
∞, where j denotes the solute. The smaller the value of the activity
coefficient γi∞, the stronger are the interactions between component j and the entrainer, which results in a
larger capacity C∞j,entrainer.
Sij∞ can only provide a preliminary guidance for the selection of entrainer as the selectivity may change
following the increasing of the solute concentration. Jork et al (Jork et al., 2005) stated that highly selective
ionic liquid entrainer often possess a low capacity. Kossack et al (Kossack et al., 2007, 2008) found that
selectivity alone was not a good criterion for ranking entrainers, instead, Sij∞C∞
j,entrainer agrees well with the
total annualized cost of optimized process for screening entrainer. They also noted that Sij∞C∞
j,entrainer can
only serve as a rule of thumb and it is limited to the screening of entrainer alternatives since minimum
entrainer flowrates and reflux bounds are not available.
2.3.5.Residue curve maps
A residue curve map (RCM) is a collection of the liquid residue curves in a simple one-stage batch
distillation originating from different initial compositions (Doherty and Perkins, 1978). The RCM technique
is considered as a powerful tool for the flowsheet development and preliminary design of conventional multi-
component separation processes since the synthesis and design of extractive or azeotropic distillation is
based on the analysis of multicomponent residue curve maps (Doherty and Malone, 2001). It has been
extensively studied since 1900. Using the theory of differential equations, Doherty and colleagues explored
the topological properties of RCM which are summarized in two articles (Hilmen et al. 2002; Kiva et al.
2003). The simple RCM was modeled by the set of differential equations.
iii yx
dhdx
(2.10)
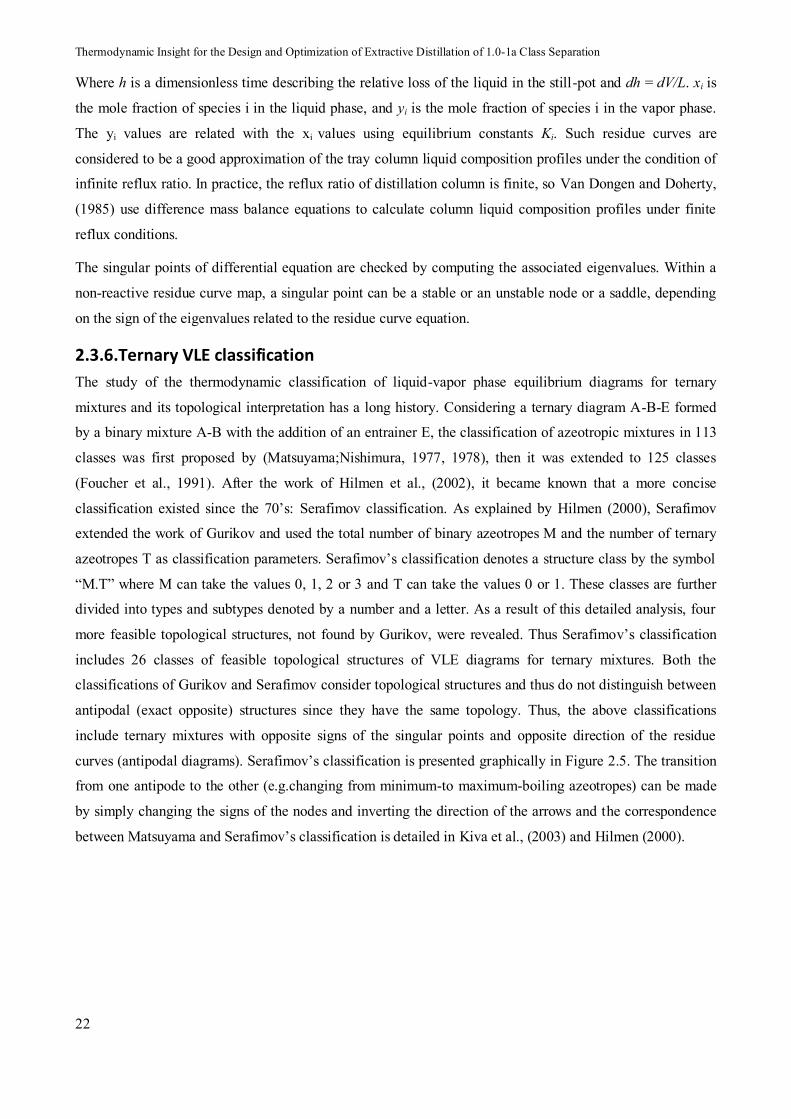
Thermodynamic Insight for the Design and Optimization of Extractive Distillation of 1.0-1a Class Separation
22
Where h is a dimensionless time describing the relative loss of the liquid in the still-pot and dh = dV/L. xi is
the mole fraction of species i in the liquid phase, and yi is the mole fraction of species i in the vapor phase.
The yi values are related with the xi values using equilibrium constants Ki. Such residue curves are
considered to be a good approximation of the tray column liquid composition profiles under the condition of
infinite reflux ratio. In practice, the reflux ratio of distillation column is finite, so Van Dongen and Doherty,
(1985) use difference mass balance equations to calculate column liquid composition profiles under finite
reflux conditions.
The singular points of differential equation are checked by computing the associated eigenvalues. Within a
non-reactive residue curve map, a singular point can be a stable or an unstable node or a saddle, depending
on the sign of the eigenvalues related to the residue curve equation.
2.3.6.Ternary VLE classification
The study of the thermodynamic classification of liquid-vapor phase equilibrium diagrams for ternary
mixtures and its topological interpretation has a long history. Considering a ternary diagram A-B-E formed
by a binary mixture A-B with the addition of an entrainer E, the classification of azeotropic mixtures in 113
classes was first proposed by (Matsuyama;Nishimura, 1977, 1978), then it was extended to 125 classes
(Foucher et al., 1991). After the work of Hilmen et al., (2002), it became known that a more concise
classification existed since the 70’s: Serafimov classification. As explained by Hilmen (2000), Serafimov
extended the work of Gurikov and used the total number of binary azeotropes M and the number of ternary
azeotropes T as classification parameters. Serafimov’s classification denotes a structure class by the symbol
“M.T” where M can take the values 0, 1, 2 or 3 and T can take the values 0 or 1. These classes are further
divided into types and subtypes denoted by a number and a letter. As a result of this detailed analysis, four
more feasible topological structures, not found by Gurikov, were revealed. Thus Serafimov’s classification
includes 26 classes of feasible topological structures of VLE diagrams for ternary mixtures. Both the
classifications of Gurikov and Serafimov consider topological structures and thus do not distinguish between
antipodal (exact opposite) structures since they have the same topology. Thus, the above classifications
include ternary mixtures with opposite signs of the singular points and opposite direction of the residue
curves (antipodal diagrams). Serafimov’s classification is presented graphically in Figure 2.5. The transition
from one antipode to the other (e.g.changing from minimum-to maximum-boiling azeotropes) can be made
by simply changing the signs of the nodes and inverting the direction of the arrows and the correspondence
between Matsuyama and Serafimov’s classification is detailed in Kiva et al., (2003) and Hilmen (2000).
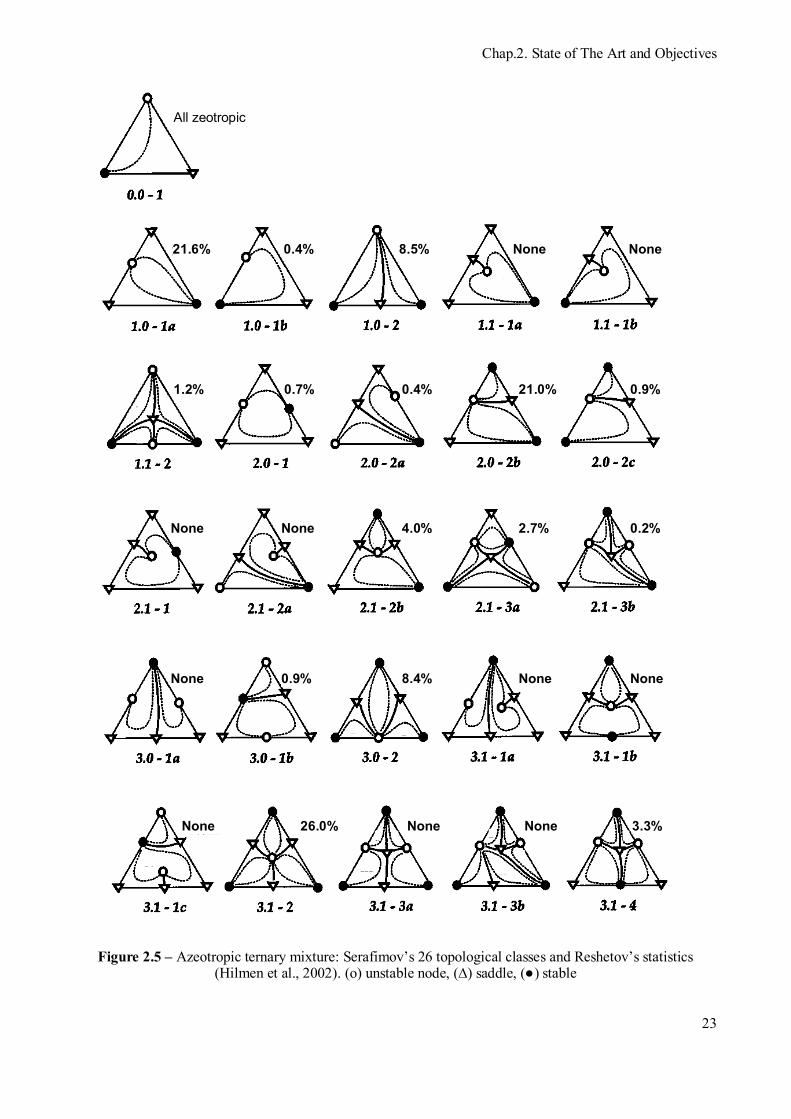
Chap.2. State of The Art and Objectives
23
All zeotropic
21.6% 0.4% 8.5% None None
None None 4.0% 2.7% 0.2%
None 0.9% 8.4% None None
None 26.0% None None 3.3%
1.2%
0.7% 0.4% 21.0% 0.9%
Figure 2.5 – Azeotropic ternary mixture: Serafimov’s 26 topological classes and Reshetov’s statistics (Hilmen et al., 2002). (o) unstable node, (∆) saddle, (●) stable

Thermodynamic Insight for the Design and Optimization of Extractive Distillation of 1.0-1a Class Separation
24
The studies on the frequency of occurrences of different types of phase diagrams for ternary azeotropic and
zeotropic mixtures were presented by (Reshetov and Kravchenko, 2007). All 26 Serafimov’s classes are
topologically and thermodynamically feasible but their occurrence is determined by the probability of certain
combinations of molecular interactions. The statistics on the physical occurrence of these 26 classes were
provided to Kiva et al. by Dr. Reshetov but the original source is not available. The hereafter called
“Reshetov’s statistics” are based on thermodynamic data for 1609 ternary systems from which 1365 are
azeotropic. The database covers data published from 1965 to 1998. The results in Figure 2.5 show that 16 out
of the 26 Serafimov’s classes were reported in the literature. Although Reshetov’s statistics do not
necessarily reflect the real occurrence in nature they can be used as an indicator of common azeotropic
classes that worthy further investigation.
2.4.Extractive distillation process feasibility
2.4.1.Thermodynamic insight on extractive distillation feasibility
Almost all the literature relied upon the feasibility rule that a heavy entrainer forming new azeotrope was
suitable to separate a minimum boiling azeotrope. The corresponding ternary diagram belongs to the 1.0-1a
Serafimov’s class (occurrence 21.6%). As (Laroche et al., 1991; Laroche et al., 1992) showed for the 1.0-1a
class, knowledge of the residue curve map and of the location of the uni-volatility curve AB = 1 can help
assess which product is removed in the distillate when using a light, intermediate or heavy entrainer. With a
heavy entrainer, A (or B) can be distillated using a direct sequence if the uni-volatility curve intersects the A-
E edge (the B-E edge). Those two intersection subcases helped to explain some counterintuitive observation
that sometimes the intermediate boiling compound B within the A-B-E mixture is removed in the distillate.
Completion and extension of thermodynamic insight to other mixture classes was published by Rodriguez-
Donis et al (2009a, 2009b, 2012a, 2012b) who combined knowledge of the thermodynamic properties of
residue curve maps and of the uni-volatility line location. They expressed a general feasibility criterion for
extractive distillation under infinite reflux,
“homogeneous extractive distillation of a A-B mixture with entrainer E feeding is feasible if there exists a
residue curve connecting E to A or B following a decreasing (a) or increasing (b) temperature direction
inside the region where A or B are the most volatile (a) or the heaviest (b) component of the mixture”.
The volatility order is set by the uni-volatility curves which knowlege is therefore critical. An illustractive
example will be discussed in Chapter 4.
2.4.1.1. Topological features of class 1.0-1a extractive distillation process
The general feasibility criterion enounced by Rodriguez-Donis and coworkers (Gerbaud and Rodriguez-
Donis, 2014; Rodríguez-Donis et al., 2009a; Shen et al., 2013) strictly holds for infinite reflux operation. For
finite reflux, things are more complicated and can only be exhaustively studied from the computation of
extractive singular points (Frits et al., 2006; Petlyuk et al., 2015). Figure 2. displays the qualitative

Chap.2. State of The Art and Objectives
25
topological features of the class 1.0-1a diagram reproduced here from the literature (Rodríguez-Donis et al.,
2009) because it will be used in the discussion section.
xP
R R B [Srcm]
Tmin azeoAB [UNrcm]
II
E (heavy) [SNrcm]
A [Srcm]
FE/F = 0
1.0-1a Residue curve map Extractive profile maps
FE/F 0+
B [SB,ext]
E [UNext]
A [SA,ext]
Tmin azeoAB [SNext]
R R B
Tmin azeoAB
E A
FE/F < (FE/F)min,R FE/F > (FE/F)min,R B
E A
Tmin azeoAB
[UNext] [SNext]
[SB,ext]
[SA,ext]
AB = 1
xP
[UNext]
[SN’ext]
[SB,ext]
Extractive profile
residue curve passing near A
(a) (b)
(c) (d)
xP
R finite R finite B
Tmin azeoAB
E A
FE/F 0+ FE/F < (FE/F)min,R>0
B
E A
Tmin azeoAB
[UNext]
[SNext]
[SB,ext]
[SA,ext] [UNext]
[SN’ext]
[SB,ext]
unfeasible region
residue curve passing near A
(e) (f)
Residue curve
Unstable extractive separatrix
Stable extractive separatrix
feasible region
+E
-D
[UN’ext]
Figure 2.6 – Topological features of class 1.0-1a with heavy entrainer in extractive distillation process operation (adapted from Rodriguez-Donis et al., 2009a).
Feasible and unfeasible regions for the composition in the extractive section of the column are deduced from
the analysis of the extractive composition profile map, similarly to residue curve map (rcm) analysis. The
feasible composition regions are the search space for the extractive section composition profile during the
optimization of extractive distillation with GA method. Those regions are bounded by extractive stable and
unstable separatrices crossing at saddle extractive singular points (Knapp and Doherty, 1994). For the class
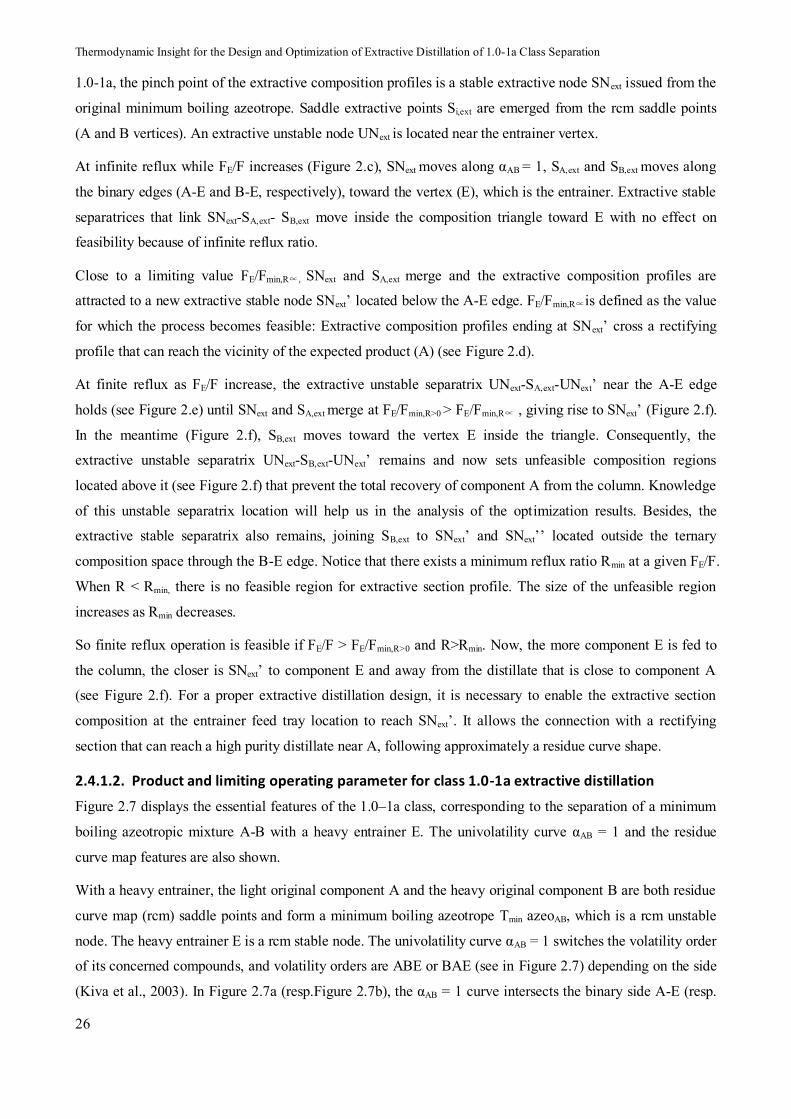
Thermodynamic Insight for the Design and Optimization of Extractive Distillation of 1.0-1a Class Separation
26
1.0-1a, the pinch point of the extractive composition profiles is a stable extractive node SNext issued from the
original minimum boiling azeotrope. Saddle extractive points Si,ext are emerged from the rcm saddle points
(A and B vertices). An extractive unstable node UNext is located near the entrainer vertex.
At infinite reflux while FE/F increases (Figure 2.c), SNext moves along αAB = 1, SA,ext and SB,ext moves along
the binary edges (A-E and B-E, respectively), toward the vertex (E), which is the entrainer. Extractive stable
separatrices that link SNext-SA,ext- SB,ext move inside the composition triangle toward E with no effect on
feasibility because of infinite reflux ratio.
Close to a limiting value FE/Fmin,R∝, SNext and SA,ext merge and the extractive composition profiles are
attracted to a new extractive stable node SNext’ located below the A-E edge. FE/Fmin,R∝is defined as the value
for which the process becomes feasible: Extractive composition profiles ending at SNext’ cross a rectifying
profile that can reach the vicinity of the expected product (A) (see Figure 2.d).
At finite reflux as FE/F increase, the extractive unstable separatrix UNext-SA,ext-UNext’ near the A-E edge
holds (see Figure 2.e) until SNext and SA,ext merge at FE/Fmin,R>0 > FE/Fmin,R∝ , giving rise to SNext’ (Figure 2.f).
In the meantime (Figure 2.f), SB,ext moves toward the vertex E inside the triangle. Consequently, the
extractive unstable separatrix UNext-SB,ext-UNext’ remains and now sets unfeasible composition regions
located above it (see Figure 2.f) that prevent the total recovery of component A from the column. Knowledge
of this unstable separatrix location will help us in the analysis of the optimization results. Besides, the
extractive stable separatrix also remains, joining SB,ext to SNext’ and SNext’’ located outside the ternary
composition space through the B-E edge. Notice that there exists a minimum reflux ratio Rmin at a given FE/F.
When R < Rmin, there is no feasible region for extractive section profile. The size of the unfeasible region
increases as Rmin decreases.
So finite reflux operation is feasible if FE/F > FE/Fmin,R>0 and R>Rmin. Now, the more component E is fed to
the column, the closer is SNext’ to component E and away from the distillate that is close to component A
(see Figure 2.f). For a proper extractive distillation design, it is necessary to enable the extractive section
composition at the entrainer feed tray location to reach SNext’. It allows the connection with a rectifying
section that can reach a high purity distillate near A, following approximately a residue curve shape.
2.4.1.2. Product and limiting operating parameter for class 1.0-1a extractive distillation
Figure 2.7 displays the essential features of the 1.0–1a class, corresponding to the separation of a minimum
boiling azeotropic mixture A-B with a heavy entrainer E. The univolatility curve αAB = 1 and the residue
curve map features are also shown.
With a heavy entrainer, the light original component A and the heavy original component B are both residue
curve map (rcm) saddle points and form a minimum boiling azeotrope Tmin azeoAB, which is a rcm unstable
node. The heavy entrainer E is a rcm stable node. The univolatility curve αAB = 1 switches the volatility order
of its concerned compounds, and volatility orders are ABE or BAE (see in Figure 2.7) depending on the side
(Kiva et al., 2003). In Figure 2.7a (resp.Figure 2.7b), the αAB = 1 curve intersects the binary side A-E (resp.

Chap.2. State of The Art and Objectives
27
B-E) at the so-called point xP. Then, A (resp. B) is the expected product in the distillate because it is the most
volatile in the region where it is connected to E by a residue curve of decreasing temperature from E to A
(resp. B). This matches the general feasibility criterion under infinite reflux ratio for extractive distillation
(Rodríguez-Donis et al., 2009). The point xP will give us information about the minimum content of entrainer
(FE/(F+FE)) (see section 4.2.1). Below this value, the terminal point of the extractive section profiles, SNext’,
lies on the univolatility curve. Above this value, SNext’ leaves the univolatility curve to lie near the [xP; E]
segment (Frits et al., 2006; Knapp and Doherty, 1994; Rodríguez-Donis et al., 2009; Shen et al., 2013). Then
the extractive profile can cross a rectifying profile, which is approximated by a residue curve under infinite
reflux ratio and which reaches the vicinity of the product, ex. A (resp. B).
[SNextr,B’] range
B [Srcm]
E [SNrcm] A [Srcm]
B [Srcm] (a)
αAB = 1
XYZ Volatility order (X possible distillate)
ABE BAE
residue curves
[SNextr,A’] range
Xp E [SNrcm] A [Srcm]
(b)
ABE BAE
αAB = 1 Tmin azeoAB
[UNrcm]
Xp
XDB
XDA
Tmin azeoAB
[UNrcm]
Distillate at R in ABE: xDA if FE/F > FE/Fmin
Distillate at R in BAE:
xDB if FE/F > FE/Fmin
Figure 2.7 – Thermodynamic features of 1.0–1a mixtures. Separation of a minimum boiling azeotrope with a heavy entrainer. (adapted from Shen et al., 2012)
2.4.1.3. Foregone feasibility research of our group
Using illustrative examples covering all subcases, but exclusively operated in batch extractive distillation,
Rodriguez-Donis and colleagues found that Serafimov’s classes covering up to 53% of azeotropic mixtures
were suited for extractive distillation : 0.0-1 (low relative volatility mixtures), 1.0-1a, 1.0-1b, 1.0-2
(azeotropic mixtures with light, intermediate or heavy entrainers forming no new azeotrope), 2.0-1, 2.0-2a,
2.0-2b and 2.0-2c (azeotropic mixtures with an entrainer forming one new azeotrope). For all suitable classes,
the general criterion under infinite reflux could explain the product to be recovered and the possible
existence of limiting values for the entrainer flow rate for batch operation: a minimum value for the class
1.0-1a, a maximum value for the class 1.0-2, etc. The behavior at finite reflux could be deduced from the
infinite behavior and properties of the residue curve maps, and some limits on the reflux were found.
However precise finding of the limiting values of reflux or of the entrainer flow rate required other
techniques.
Shen et al (2013a, 2013b) extended the general feasibility criterion from batch to continuous mode of
minimum- and maximum-boiling azeotropic mixtures with a heavy entrainer belonging to class 1.0-1a and
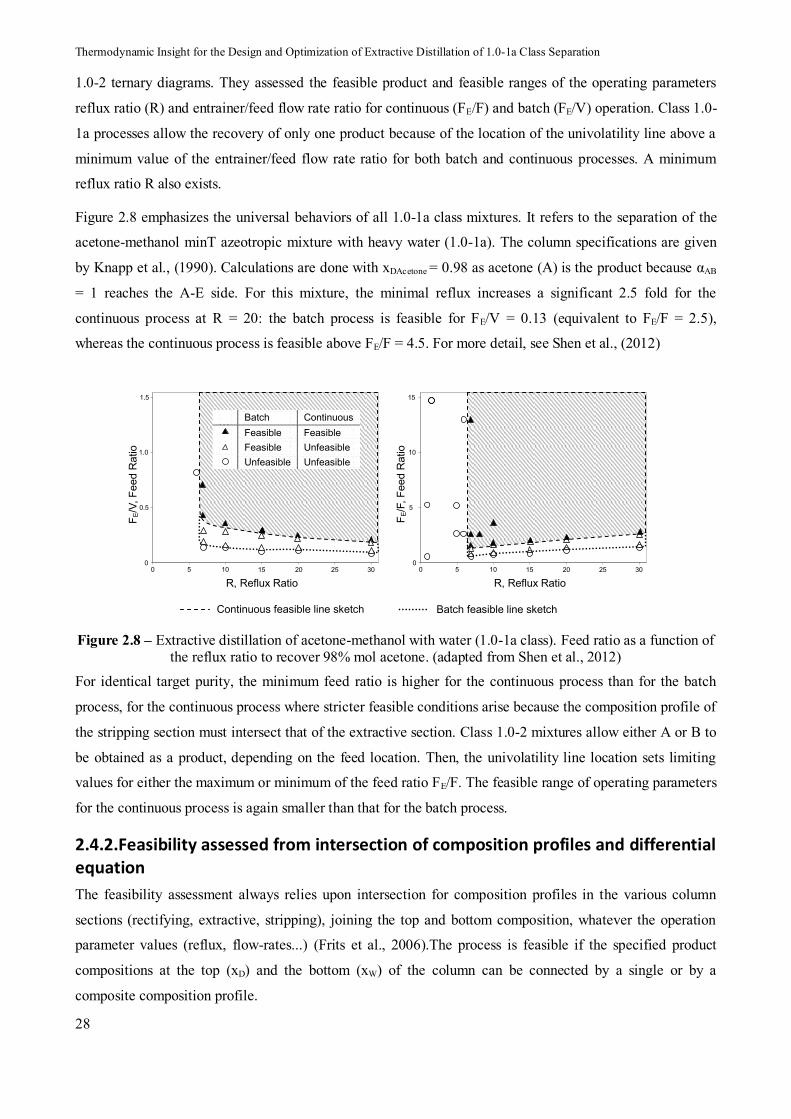
Thermodynamic Insight for the Design and Optimization of Extractive Distillation of 1.0-1a Class Separation
28
1.0-2 ternary diagrams. They assessed the feasible product and feasible ranges of the operating parameters
reflux ratio (R) and entrainer/feed flow rate ratio for continuous (FE/F) and batch (FE/V) operation. Class 1.0-
1a processes allow the recovery of only one product because of the location of the univolatility line above a
minimum value of the entrainer/feed flow rate ratio for both batch and continuous processes. A minimum
reflux ratio R also exists.
Figure 2.8 emphasizes the universal behaviors of all 1.0-1a class mixtures. It refers to the separation of the
acetone-methanol minT azeotropic mixture with heavy water (1.0-1a). The column specifications are given
by Knapp et al., (1990). Calculations are done with xDAcetone = 0.98 as acetone (A) is the product because αAB
= 1 reaches the A-E side. For this mixture, the minimal reflux increases a significant 2.5 fold for the
continuous process at R = 20: the batch process is feasible for FE/V = 0.13 (equivalent to FE/F = 2.5),
whereas the continuous process is feasible above FE/F = 4.5. For more detail, see Shen et al., (2012)
0
0.5
1.0
1.5
0 5 10 15 20 25 30
F E/V
, Fee
d R
atio
R, Reflux Ratio
0
5
10
15
0 5 10 15 20 25 30
F E/F
, Fee
d R
atio
R, Reflux Ratio Continuous feasible line sketch Batch feasible line sketch
Batch Continuous Feasible Feasible Feasible Unfeasible Unfeasible Unfeasible
Figure 2.8 – Extractive distillation of acetone-methanol with water (1.0-1a class). Feed ratio as a function of the reflux ratio to recover 98% mol acetone. (adapted from Shen et al., 2012)
For identical target purity, the minimum feed ratio is higher for the continuous process than for the batch
process, for the continuous process where stricter feasible conditions arise because the composition profile of
the stripping section must intersect that of the extractive section. Class 1.0-2 mixtures allow either A or B to
be obtained as a product, depending on the feed location. Then, the univolatility line location sets limiting
values for either the maximum or minimum of the feed ratio FE/F. The feasible range of operating parameters
for the continuous process is again smaller than that for the batch process.
2.4.2.Feasibility assessed from intersection of composition profiles and differential equation
The feasibility assessment always relies upon intersection for composition profiles in the various column
sections (rectifying, extractive, stripping), joining the top and bottom composition, whatever the operation
parameter values (reflux, flow-rates...) (Frits et al., 2006).The process is feasible if the specified product
compositions at the top (xD) and the bottom (xW) of the column can be connected by a single or by a
composite composition profile.

Chap.2. State of The Art and Objectives
29
A single composition profile belongs to one column section and a composite composition profile is
composed by two or three column section composition profiles connected at some punctual composition. The
number of section depends on the column configuration. The column section profiles are described by the
general finite differential model of (Lelkes et al., 1998a):
*)( ii yxy
LV
dhdx
(2.11)
Where V and L are the vapor and liquid flow-rates within the column, the vapor composition y* in
equilibrium with x is computed by the liquid-vapor equilibrium relation and the actual vapor composition y
is computed from the mass balance in each column section, depending on the chosen column configuration
(Rodriguez-Donis et al., 2007).
This differential equation is an initial value problem that should be solved by starting the computation from a
known liquid composition. The double sign ± shown in equation (2.11) is to be actualized according to the
direction (top down or bottom up) considering that column height h is equal to zero at the top. Therefore,
equation (2.11) must be used in computing the liquid composition profile of a rectifying, extractive and
stripping column section with an adequate definition of the initial point for x, and the direction of the
solution and the mass balance equation for y. The driving force applied in equation (2.11) is to be understood
at a given column height h. This is valid even at the very top of the column. The composition of the vapor
emerging from the column top, and the imagined vapor composition that would be in equilibrium y* with the
countercurrent liquid x0 are in the same relation. Therefore, the composition of this countercurrent liquid x0
is a good candidate to be an initial point for the higher (rectifying or extracting) column section and the
equation is solved top down. Otherwise, if the bottom composition xW is known then it can be directly
applied as the initial value, and equation (2.11) is solved bottom up in the lowest (stripping) column section
keeping a negative sign.
Thus, computation of the top (rectifying or extractive) column section composition profile should be started
from the composition of the liquid flowing on the top of the column if there are at least two column sections.
This is called ‘the top liquid composition’, and denoted by x0. The top liquid composition x0 is identical to
the composition of the reflux stream xR if there is not external feed mixed with the liquid reflux. This xR, in
turn, is identical to the distillate composition xD if there is no decanter (homogeneous extractive case). If
there is a liquid phase distribution then, the composition of the reflux stream xR is determined by the
compositions xD and the distributed liquid phases, and the reflux ratio R, together. Besides, if there is some
external liquid feed sent to the top of the column then it should be accounted as a feed mixed to the reflux
stream. The top liquid composition x0 is then determined by the mass balance of mixing the external feed
stream to the reflux stream. Finally, if there are three sections in the column then the rectifying and stripping
composition profiles begin at xR and xW, respectively, whereas for exploring the range of potentially valid
extractive composition profiles (the intermediate column section) a series of composition profiles should be
Thermodynamic Insight for the Design and Optimization of Extractive Distillation of 1.0-1a Class Separation
30
computed started from several points in the composition triangle. The more detailed relation of equation 2.11
for the rectifying, stripping and extractive section, please refer Gerbaud and Rodriguez-Donis, (2014) for
both batch and continuous mode.
2.4.3.Extractive process feasibility from pinch points analysis
In 1985, Levy and coworkers (Levy et al., 1985; Levy and Doherty, 1986) proposed an algebraic trial-and-
error tangent pinch points procedure for determining the minimum reflux ratio without the necessity of
lengthy iteration schemes involving column profile calculations. The method consisted in finding the value
of reflux which makes the feed pinch point, the saddle pinch point, and the controlling feed composition
collinear but was restricted to ternary mixtures. (Knapp and Doherty, 1990, 1994) used bifurcation theory to
analyze the separating behaviors of the acetone – methanol azeotrope with water belonging to the 1.0-1a
class and related the feasibility to the appearance of saddle-node bifurcation points and branching points.
Feasible processes required that a ternary saddle originating from a pure component exists whereas the
appearance of a ternary unstable node on the pinch branch originating at the azeotrope led to an unfeasible
separation. Once the minimal value was known, some heuristics to set the operational values of R and FE is
also shown. For the same 1.0-1a mixture as in the study of Knapp and Doherty, (1994), Frits et al., (2006)
used an interval arithmetic-based branch-and-bound optimizer to find limiting flows based on the existence
and location of singular points and separatrices in profile maps for batch extractive distillation. They found a
feasible process under infinite reflux above a minimal entrainer flow rate which corresponded to the merging
of a stable pinch point originating from the azeotrope with a saddle point originating from a pure component,
this point agrees with the study of (Knapp and Doherty, 1994) . Finite reflux analysis showed that the pinch
points moved inside the composition triangle and brought unfeasible regions.
Brüggemann and Marquardt (2004) exploited a fully-automated shortcut design procedure to determine the
limit value. The method is based on the approximation of all column profiles by so-called rectification body
method (RBM) which is constructed from nonlinear analysis of the pinches of each section (Bausa et al.,
1998). Like Knapp and Doherty (1994), they also set some operational constraint to determine the quasi-
optimal values once the minimal values of R and FE are known. All was incorporated into a general
algorithm for the determination of the optimal values of the entrainer flow rate and the reflux ratio. Kossack
et al., (2008) then used the RBM method as a second screening criterion for evaluating the extractive
distillation entrainer candidates. Fast and efficient, the method bears some critics when the profiles are
highly curves because each rectification body has straight boundaries (Lucia et al., 2008).
Most recently, Petlyuk et al., (2015) described a general method infinitely sharp splits for the search and
identification of possible splits of extractive distillations in any ternary azeotropic mixture. In an extractive
column at infinite height and finite reflux, this method can find all feasible product compositions. Limiting
parameters of the entrainer flow rate and the reflux ratio are determined fast and robustly from the local K-
values (vapor–liquid distribution coefficients) of all three components along the sides of the concentration
triangle. Besides, the method can determine the required number of trays in all the column sections for a
Chap.2. State of The Art and Objectives
31
given product specifications. Therefore, both operating and capital costs can be analyzed without
cumbersome simulations.
2.5.Research objectives
Azeotropic and close boiling components are commonly encountered in fine-chemical and specialty
industries. Extractive distillation is the widely used process for separating azeotropic and close boiling
mixture, but its high-energy consumption is a major main disadvantage, which requires dispatching (Van
Duc Long and Lee, 2013). In other hand, global climate change has recently begun to affect human life as
global energy consumption continues to increase (Gao et al., 2013). Therefore, researches on how to save
energy and capital cost during extractive distillation process would provide not only economical benefits but
also environmental benefits. Following the onion model mentioned before, extractive distillation process
itself and process integration are the two main aspects. Extractive distillation process itself includes the
column retrofitting and process optimal design. Process integration includes heat integration, heat pump and
utilities. Entrainer selection affects both process itself and process integration, and also the environmental
benefits.
First, we focus on the entrainer selection from the literatures for the separation of acetone-methanol
minimum azeotropic mixture as it is one of the most studied examples in literature. Then aiming at energy
saving and environmental benefits, we introduce a two-step optimization procedure with case study and do
the column retrofitting (keep the column tray number as literature) because column retrofitting is performed
more often than the installation of new equipment since distillation requires large capital investment (Gadalla
et al., 2003).
Second, we show how thermodynamic insight can be used to improve the design of a homogeneous
extractive distillation process based on the knowledge of process feasibility and univolatility line. The
analysis of the ternary residue curve map and isovolatility curves shows that the column operating pressure
has a strong effect on the minimal entrainer amount and the relative volatility. We define a novel extractive
efficiency indicator to compare the optimality of different designs and explain why the energy cost and TAC
is reduced since the efficiency indicator Eext describes the ability of the extractive section to discriminate the
desired product between the top and the bottom of the extractive section. In order to further demonstrate that
thermodynamic insight can work as a guideline for process optimal design, we study another case with the
same methodology.
Third, focusing on the process optimal design, a two step optimization strategy for extractive distillation is
introduced in order to completely consider the effects of the thermodynamic efficiency indicator Eext and eext
on the extractive distillation process as well as OF and TAC.
Fourth, in order to further reduce the energy cost and environmental pollution, double-effect heat integration
and heat pump technology are taken into account for extractive distillation process and compared from the

Thermodynamic Insight for the Design and Optimization of Extractive Distillation of 1.0-1a Class Separation
32
economical view by total annual cost and environmental aspect by CO2 emissions. Based on the character of
extractive distillation, we propose a novel optimal partial heat integration process, and a new partial VRC
and new partial BF process in order to reduce the high initial capital cost of compressors.
Chap.3. Optimal Retrofits of ED, Acetone-Methanol with Water
33
Chapter 3. Optimal Retrofits of ED, Acetone-
Methanol with Water
Results in this chapter have been published in
Congress ESCAPE 24: You, X., Rodriguez-Donis, I., Gerbaud, V., 2014. Extractive Distillation Process
Optimisation of the 1.0-1a Class System, Acetone - methanol with Water, in: Computer Aided Chemical
Engineering. Elsevier, pp. 1315–1320.

Thermodynamic Insight for the Design and Optimization of Extractive Distillation of 1.0-1a Class Separation
34
3.Optimal retrofits of extractive distillation, acetone-methanol with water
3.1.Introduction
Process retrofitting has proved to be a beneficial option for improving energy efficiency and reducing CO2
emissions (Mahmoud et al., 2009). Avoiding inefficient use of energy through better operating practice or
improved process design can decrease energy consumption and gas emissions. A wide range of process
improved design and process integration concepts for saving energy have been developed and successfully
applied to improve the energy efficiency of existing process sites (Gharaie et al., 2015). In this chapter, we
will introduce a four step optimization procedure for the process retrofitting of the extractive distillation
aiming at saving energy.
For decades, the separation of acetone-methanol azeotropic mixture is an hot topic in extractive distillation
(Laroche et al., 1991; Knapp and Doherty, 1994; Hilal et al., 2002; Frits et al., 2006; Kossack et al., 2008;
Luyben, 2008; Gil et al., 2009; Botía et al., 2010; Orchillés et al., 2012; You et al., 2014, 2015). The acetone-
methanol mixture is the main components in the aqueous product obtained from hydrocarbon syntheses by
the Fischer-Tropsch process. Acetone and methanol are extensively applied in chemical engineering.
Acetone is used as crude material for the production of epoxy resin, polycarbonate and so on, and as good
solvent for coating and cement, and as extractant in industries such as oil production industry. Methanol is
used as solvent in petroleum industry, and as reagent for organic products and so on. For azeotropic mixture,
the description of the vapor-liquid equilibrium is the crucial issue.
Both acetone and methanol can be distillates depending on the location of univolatility line toward the AE or
BE side (Rodriguez-Donis et al., 2009a; Shen et al., 2013). The polar entrainer associate with methanol and
produce acetone as the distillate product in the extractive column, while the nonpolar entrainer binds with
acetone and produces high purity methanol as the distillate product in the extractive column, even though
methanol is the intermediate-boiling component in the original mixture (Kossack et al., 2008). Several
entrainer candidates can be found: (Laroche et al., 1991) suggest water, ethanol, isopropanol and
chlorobenzene, while (Lei et al., 2003) add ethylene glycol as entrainer candidate. Kossack et al. (2008)
reported more entrainer by using computer-aided molecular design (CAMD) method, as shown in Table 3.1
and Table 3.2.
After comparing the results from rectifying body method (RBM) and mixed integer non-linear programming
(MINLP), Kossack et al. (2008) concluded that selectivity should not be used alone to predict entrainer
performance, and that DMSO and chlorobenzene should be the entrainer, but water is probably more
preferable since it is environmentally friendly and only induces a moderate economic penalty. Notice that
when water is used as entrainer, Kossack could only obtain the methanol purities at 98.2% mol instead of
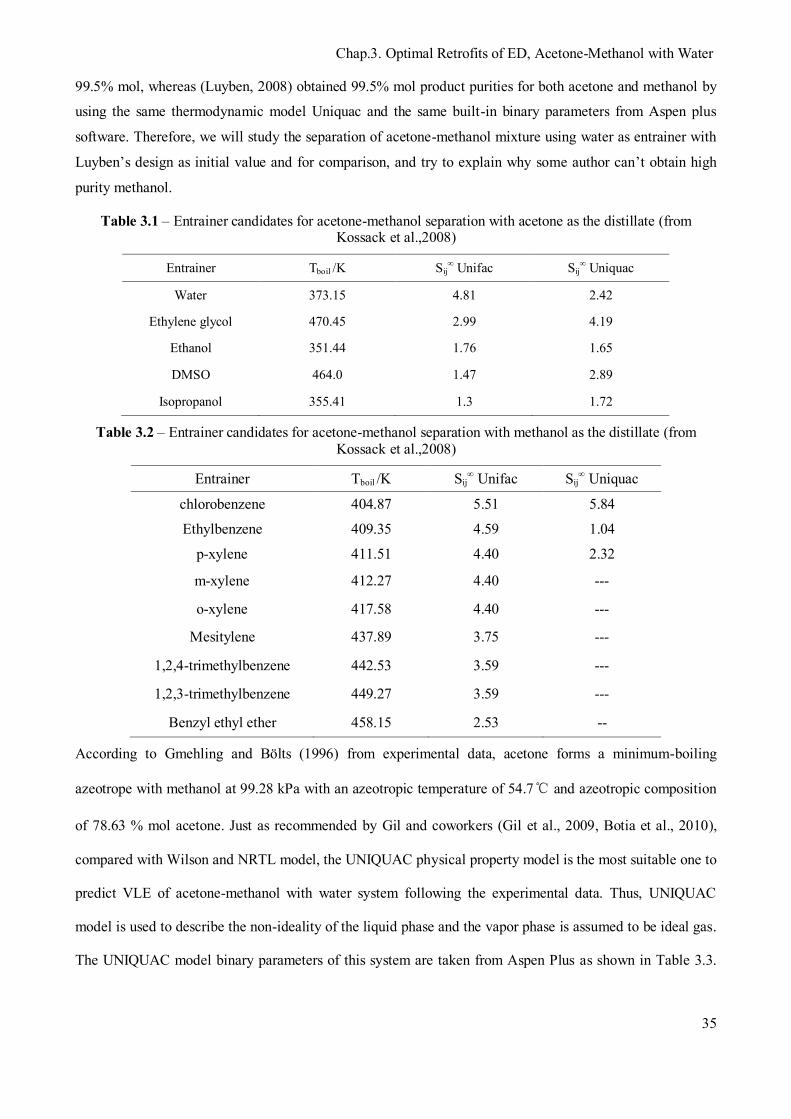
Chap.3. Optimal Retrofits of ED, Acetone-Methanol with Water
35
99.5% mol, whereas (Luyben, 2008) obtained 99.5% mol product purities for both acetone and methanol by
using the same thermodynamic model Uniquac and the same built-in binary parameters from Aspen plus
software. Therefore, we will study the separation of acetone-methanol mixture using water as entrainer with
Luyben’s design as initial value and for comparison, and try to explain why some author can’t obtain high
purity methanol.
Table 3.1 – Entrainer candidates for acetone-methanol separation with acetone as the distillate (from Kossack et al.,2008)
Entrainer Tboil /K Sij∞ Unifac Sij
∞ Uniquac
Water 373.15 4.81 2.42
Ethylene glycol 470.45 2.99 4.19
Ethanol 351.44 1.76 1.65
DMSO 464.0 1.47 2.89
Isopropanol 355.41 1.3 1.72
Table 3.2 – Entrainer candidates for acetone-methanol separation with methanol as the distillate (from Kossack et al.,2008)
Entrainer Tboil /K Sij∞ Unifac Sij
∞ Uniquac
chlorobenzene 404.87 5.51 5.84
Ethylbenzene 409.35 4.59 1.04
p-xylene 411.51 4.40 2.32
m-xylene 412.27 4.40 ---
o-xylene 417.58 4.40 ---
Mesitylene 437.89 3.75 ---
1,2,4-trimethylbenzene 442.53 3.59 ---
1,2,3-trimethylbenzene 449.27 3.59 ---
Benzyl ethyl ether 458.15 2.53 --
According to Gmehling and Bölts (1996) from experimental data, acetone forms a minimum-boiling
azeotrope with methanol at 99.28 kPa with an azeotropic temperature of 54.7℃ and azeotropic composition
of 78.63 % mol acetone. Just as recommended by Gil and coworkers (Gil et al., 2009, Botia et al., 2010),
compared with Wilson and NRTL model, the UNIQUAC physical property model is the most suitable one to
predict VLE of acetone-methanol with water system following the experimental data. Thus, UNIQUAC
model is used to describe the non-ideality of the liquid phase and the vapor phase is assumed to be ideal gas.
The UNIQUAC model binary parameters of this system are taken from Aspen Plus as shown in Table 3.3.
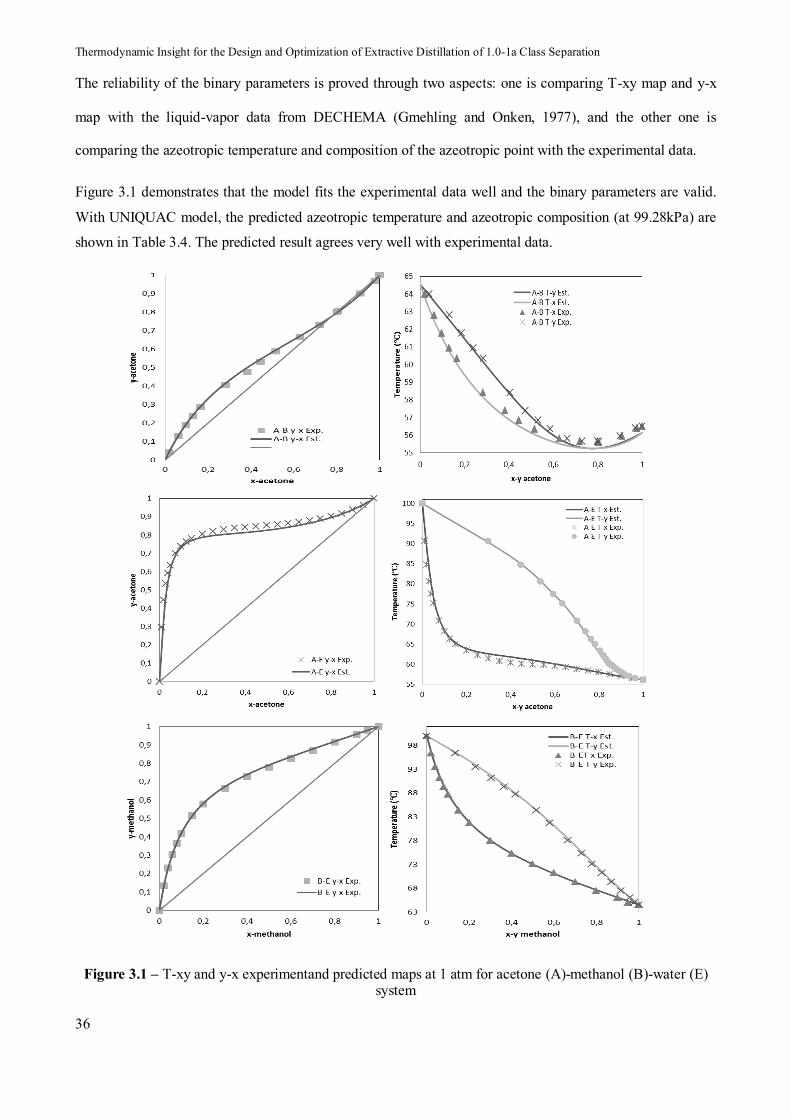
Thermodynamic Insight for the Design and Optimization of Extractive Distillation of 1.0-1a Class Separation
36
The reliability of the binary parameters is proved through two aspects: one is comparing T-xy map and y-x
map with the liquid-vapor data from DECHEMA (Gmehling and Onken, 1977), and the other one is
comparing the azeotropic temperature and composition of the azeotropic point with the experimental data.
Figure 3.1 demonstrates that the model fits the experimental data well and the binary parameters are valid.
With UNIQUAC model, the predicted azeotropic temperature and azeotropic composition (at 99.28kPa) are
shown in Table 3.4. The predicted result agrees very well with experimental data.
Figure 3.1 – T-xy and y-x experimentand predicted maps at 1 atm for acetone (A)-methanol (B)-water (E) system
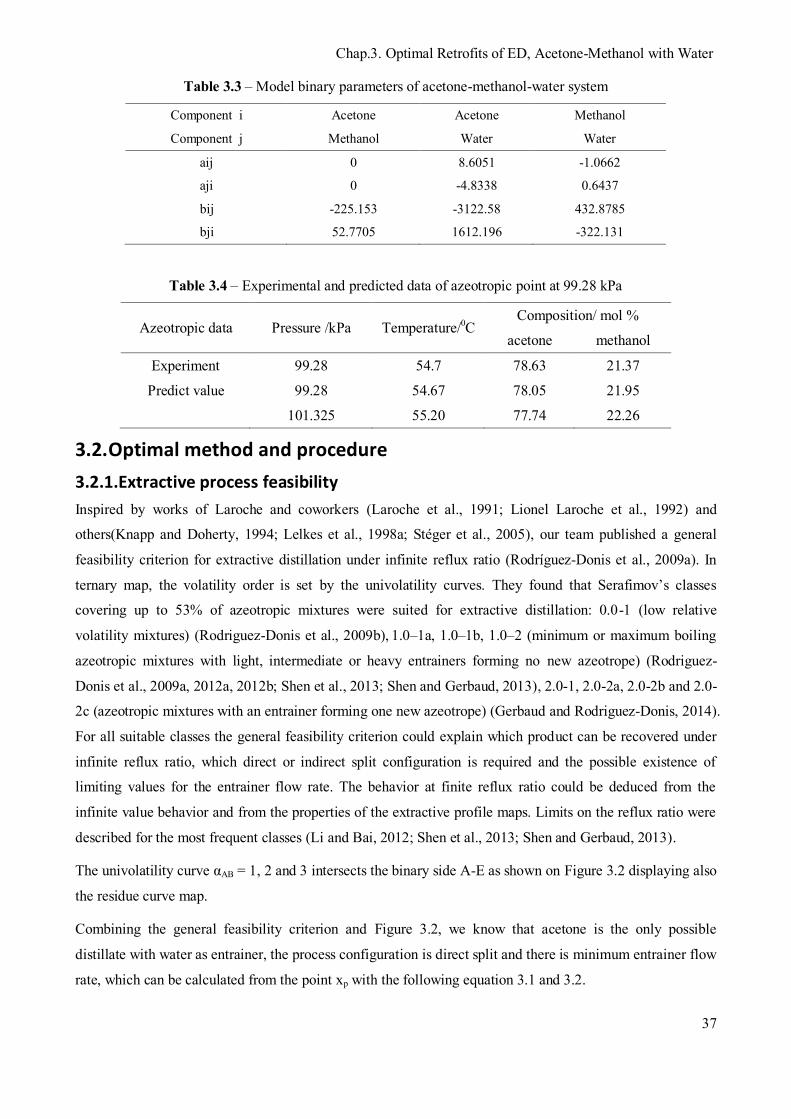
Chap.3. Optimal Retrofits of ED, Acetone-Methanol with Water
37
Table 3.3 – Model binary parameters of acetone-methanol-water system
Component i Acetone Acetone Methanol
Component j Methanol Water Water
aij 0 8.6051 -1.0662
aji 0 -4.8338 0.6437
bij -225.153 -3122.58 432.8785
bji 52.7705 1612.196 -322.131
Table 3.4 – Experimental and predicted data of azeotropic point at 99.28 kPa
Azeotropic data Pressure /kPa Temperature/0C Composition/ mol %
acetone methanol
Experiment 99.28 54.7 78.63 21.37
Predict value 99.28 54.67 78.05 21.95
101.325 55.20 77.74 22.26
3.2.Optimal method and procedure
3.2.1.Extractive process feasibility
Inspired by works of Laroche and coworkers (Laroche et al., 1991; Lionel Laroche et al., 1992) and
others(Knapp and Doherty, 1994; Lelkes et al., 1998a; Stéger et al., 2005), our team published a general
feasibility criterion for extractive distillation under infinite reflux ratio (Rodríguez-Donis et al., 2009a). In
ternary map, the volatility order is set by the univolatility curves. They found that Serafimov’s classes
covering up to 53% of azeotropic mixtures were suited for extractive distillation: 0.0-1 (low relative
volatility mixtures) (Rodriguez-Donis et al., 2009b), 1.0–1a, 1.0–1b, 1.0–2 (minimum or maximum boiling
azeotropic mixtures with light, intermediate or heavy entrainers forming no new azeotrope) (Rodriguez-
Donis et al., 2009a, 2012a, 2012b; Shen et al., 2013; Shen and Gerbaud, 2013), 2.0-1, 2.0-2a, 2.0-2b and 2.0-
2c (azeotropic mixtures with an entrainer forming one new azeotrope) (Gerbaud and Rodriguez-Donis, 2014).
For all suitable classes the general feasibility criterion could explain which product can be recovered under
infinite reflux ratio, which direct or indirect split configuration is required and the possible existence of
limiting values for the entrainer flow rate. The behavior at finite reflux ratio could be deduced from the
infinite value behavior and from the properties of the extractive profile maps. Limits on the reflux ratio were
described for the most frequent classes (Li and Bai, 2012; Shen et al., 2013; Shen and Gerbaud, 2013).
The univolatility curve αAB = 1, 2 and 3 intersects the binary side A-E as shown on Figure 3.2 displaying also
the residue curve map.
Combining the general feasibility criterion and Figure 3.2, we know that acetone is the only possible
distillate with water as entrainer, the process configuration is direct split and there is minimum entrainer flow
rate, which can be calculated from the point xp with the following equation 3.1 and 3.2.
Thermodynamic Insight for the Design and Optimization of Extractive Distillation of 1.0-1a Class Separation
38
0.5
1
0.9
0.8
0.7
0.6
0.5
0.4
0.3
0.2
0.1
0 1
0.9
0.8
0.7
0.6
0.4
0.3
0.2
0.1
0
1 0.9 0.8 0.7 0.6 0.5 0.4 0.3 0.2 0.1 0 Water (E) (100.0°C ) [SNrcm]
Acetone (A) (56.5°C ) [Srcm]
Methanol (B) (64.5°C ) [Srcm]
Tmin azeoAB [UNrcm]
(55.2°C)@1atm
Residue curves
Volatility order XYZ (X possible distillate)
BAE
αAB=1 @1atm
xP = [SNext] @1atm for FE,min
possible
distillate xD
FE, xE
FAB, xFAB
W,xW
D,xD
Extractive section
Rectification section
Stripping section
V
LT
FE feed tray composition lies at [SNext]
(A)
(B+E)
αAB=2 @1atm
αAB=3 @1atm
Univolatility curves
ABE
Figure 3.2 – Extractive distillation column configuration and acetone – methanol – water 1.0-1a residue curve map at 1 atm with univolatility curves at 1 atm
The batch minimum entrainer flow rate FE/V depending on the vapor flow rate V produced at the boiler is
defined by the equation 3.1 (Lelkes et al., 1998a):
PE
PP
R
E
xxyx
VF
*
min,
(3.1)
Where y*P is the entrainer amount in the vapor phase in equilibrium with xP and xE is the entrainer
composition. It can be transposed to a minimum entrainer flow rate for continuous operation FE/FAB with the
following equation (Gerbaud and Rodriguez-Donis, 2014; Shen et al., 2013; Shen and Gerbaud, 2013).
AB
E
AB
E
FD
VFR
FF 1 (3.2)
The [SNext] point location is critical to the process understanding because it describes approximately the
composition in the column on the entrainer feed tray location, where the extractive section and the rectifying
section connect together. By considering the locations of the [SNext] and the liquid composition at the main
feed tray, we show how the design of an extractive distillation process based on the values published by
(Luyben, 2008) can be further improved in chapter 3 and 4.
3.2.2.Optimal method
Compared with a simple conventional distillation, the difficulties of the extractive distillation process design
lie on a greater number of degrees of freedom and the recommended recycling of the entrainer with impurity.
The entrainer flowrate and entrainer feed location are all the additional degrees of freedom. The optimization
of extractive distillation is usually considered as a large size problem because of the solving of a significant
Chap.3. Optimal Retrofits of ED, Acetone-Methanol with Water
39
number of strongly nonlinear equations. Besides, good initial values are needed for solving the nonlinear
programming subproblems (Vázquez-Ojeda et al., 2013). For the optimization methods of extractive
distillation, there are sensitivity analysis (Gil et al., 2009; Luyben, 2008), sequential iterative optimization
(Wang et al., 2012), Sequential Quadratic Programming (SQP) (Figueirêdo et al., 2011; Kiss and Suszwalak,
2012), mixed-integer nonlinear programming (MINLP) (García-Herreros et al., 2011; Kossack et al., 2008),
genetic algorithm (GA) (Gutérrez-Antonio et al., 2011; Leboreiro and Acevedo, 2004) and so on. Besides,
the the common procedure for optimizing extractive distillation process is that: first, optimizing the
extractive column and then the entrainer regeneration column. In this chapter, we will show the importance
of optimizing the two columns together.
For a detailed process design, an economic trade-off must be found between the investment and operating
costs. For the extractive distillation process both the extractive column and the entrainer regeneration column
should be included and connected with the solvent recycle stream. For finding optimal parameters for the
acetone – methanol separation with water, some authors have run a sensitivity analysis over the process
variables, namely the reflux ratio, the entrainer–feed flow rate ratio, the number of trays in each of the
rectifying, extractive, stripping column sections and the distillate flow rate (Gil et al., 2009; Hilal et al., 2002;
Langston et al., 2005; Luyben, 2008). Luyben, (2008) performed a sensitivity analysis of the effect of reflux
ratio and solvent flow rate on the acetone purity. He concluded that a solvent – feed flow rate ratio of 2.06
was needed to achieve the desired 99.5 mol% acetone purity. However, the procedure is tedious and may fail
to find the best solution. Caballero et al., (2005) presented a superstructure-based optimization algorithm that
combines the capabilities of commercial process simulators and generalized disjunctive programming. With
the proposed method, the rigorous design of distillation columns in which operational conditions (reflux and
reboil ratios, recoveries etc.) and the structural parameters (number of trays, location of feed and product
streams etc.) are simultaneously optimized, but it requires good initial values and bounds to converge. Kiss
and Suszwalak, (2012) used the Aspen built-in SQP method to optimize the extractive distillation process for
the separation of ethanol-water with ethylene glycol as entrainer in both a two-column classic sequence and
an extractive dividing-wall column. Several authors formulated a MINLP problem to optimize
simultaneously both the continuous variables (reflux, entrainer flow rate) and the discrete variables (total
number of tray, feed tray location). Kossack et al., (2008) used a successive relaxed MINLP (SR-MINLP)
procedure to reduce the influence of the initial guess on the final result. García-Herreros et al., (2011) looked
at the ethanol extractive dehydration with glycerol as entrainer and solved the MINLP problem through a
two-level strategy that combines stochastic and deterministic algorithms.
In this chapter, we fixed the two column tray numbers due to two aspects: the column retrofitting in industry
and comparison our design with literatures. We use optimizing procedure as (Figueirêdo et al., 2011): basing
on an SQP scheme built in Aspen plus simulator for optimizing the continuous variables and a sensitivity
analysis over the feed locations. Unlike Figueiredo’s work and following Kossack et al., (2008), we consider
the two column sequence of extractive distillation process as in Figure 3.3. The two columns are strongly
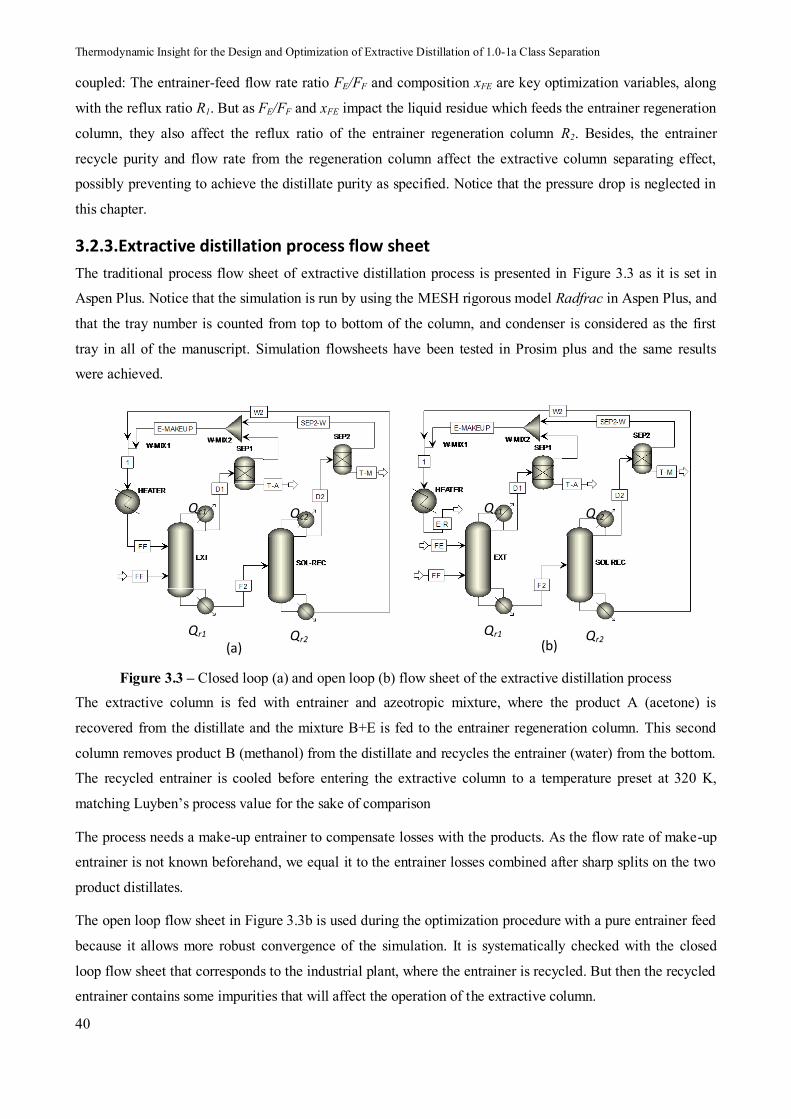
Thermodynamic Insight for the Design and Optimization of Extractive Distillation of 1.0-1a Class Separation
40
coupled: The entrainer-feed flow rate ratio FE/FF and composition xFE are key optimization variables, along
with the reflux ratio R1. But as FE/FF and xFE impact the liquid residue which feeds the entrainer regeneration
column, they also affect the reflux ratio of the entrainer regeneration column R2. Besides, the entrainer
recycle purity and flow rate from the regeneration column affect the extractive column separating effect,
possibly preventing to achieve the distillate purity as specified. Notice that the pressure drop is neglected in
this chapter.
3.2.3.Extractive distillation process flow sheet
The traditional process flow sheet of extractive distillation process is presented in Figure 3.3 as it is set in
Aspen Plus. Notice that the simulation is run by using the MESH rigorous model Radfrac in Aspen Plus, and
that the tray number is counted from top to bottom of the column, and condenser is considered as the first
tray in all of the manuscript. Simulation flowsheets have been tested in Prosim plus and the same results
were achieved.
(a) (b) Qr1 Qr2
Qc1 Qc2
Qr1 Qr2
Qc1 Qc2
Figure 3.3 – Closed loop (a) and open loop (b) flow sheet of the extractive distillation process
The extractive column is fed with entrainer and azeotropic mixture, where the product A (acetone) is
recovered from the distillate and the mixture B+E is fed to the entrainer regeneration column. This second
column removes product B (methanol) from the distillate and recycles the entrainer (water) from the bottom.
The recycled entrainer is cooled before entering the extractive column to a temperature preset at 320 K,
matching Luyben’s process value for the sake of comparison
The process needs a make-up entrainer to compensate losses with the products. As the flow rate of make-up
entrainer is not known beforehand, we equal it to the entrainer losses combined after sharp splits on the two
product distillates.
The open loop flow sheet in Figure 3.3b is used during the optimization procedure with a pure entrainer feed
because it allows more robust convergence of the simulation. It is systematically checked with the closed
loop flow sheet that corresponds to the industrial plant, where the entrainer is recycled. But then the recycled
entrainer contains some impurities that will affect the operation of the extractive column.

Chap.3. Optimal Retrofits of ED, Acetone-Methanol with Water
41
3.2.4.Objective function (OF)
For a process optimization, the importance of defining a suitable objective function is obvious. (Figueirêdo et
al., 2011) used the ratio of the reboiler heat duty of extractive distillation column and the specified
production flowrate (QR/D) as objective function. The condenser heat duty is then neglected despite its
impact on the process cost; and the regeneration column is not taken into account. Furthermore, it discards
the differences of the two products’ prices. Arifin and Chien, (2008) used the total annual cost (TAC)
including capital cost and operating cost as objective function. They showed that it exhibits a minimal value
vs the total number of trays for the extractive process sequence columns.
Inspiration of the work above, we define a novel objective function and do some improvements. Our
objective function for the optimization of variables is:
9999.0995.0
001.0995.0:
min
2,
2,
1,
1,
21
2211
Wwater
Dmethanol
Wacetone
Dacetone
crcr
xxx
xtosubjectDDk
QmQQmQOF
(3.3)
Constraints 1 and 3 concern the products purity in D1 and D2. Constraint 2 in bottom W1 aims at keeping high
the main product recovery. Constraint 4 focuses on the recycling entrainer purity. Qr1 and Qc1: extractive
column reboiler and condenser duty, Qr2 and Qc2: entrainer regeneration column reboiler and condenser duty,
D1 and D2 extractive column and entrainer regeneration column distillate flow rate, k = 5.9: product price
factor for acetone vs methanol, m = 0.036: energy price difference factor for condenser vs reboiler. Update of
k and m is done by using chemicals prices and (Douglas, 1988) costs method with Marshall and Swift
inflation index corrections. Compared with previous works where the optimization is done by minimizing
only reboiler duty (Li and Bai, 2012; Luyben, 2008), or by Qr/D with the cost of condenser been neglected
(Figueirêdo et al., 2011), our OF accounts for both columns energy demands, but also reflects the weight
coefficient of the two product prices k and reboiler vs condenser cost price m. Then our OF reflects the
operation of the entrainer regeneration column. The meaning of OF is the energy consumption used per
product unit flow rate (kJ/kmol). OF is sensitive to the variables FE/FF, R1, R2, D1, D2 and the three feed
location as well.
Finally the TAC is calculated for each optimal solution. We use the TAC formula of Li and Bai (2012) with
Douglas’ costs correlations. The payback period is considered as 3 years and Douglas’ cost formulas
(Douglas, 1988) are used with Marshall and Swift inflation 2011 index (M & S = 1518.1) (Marshall & Swift,
2011).
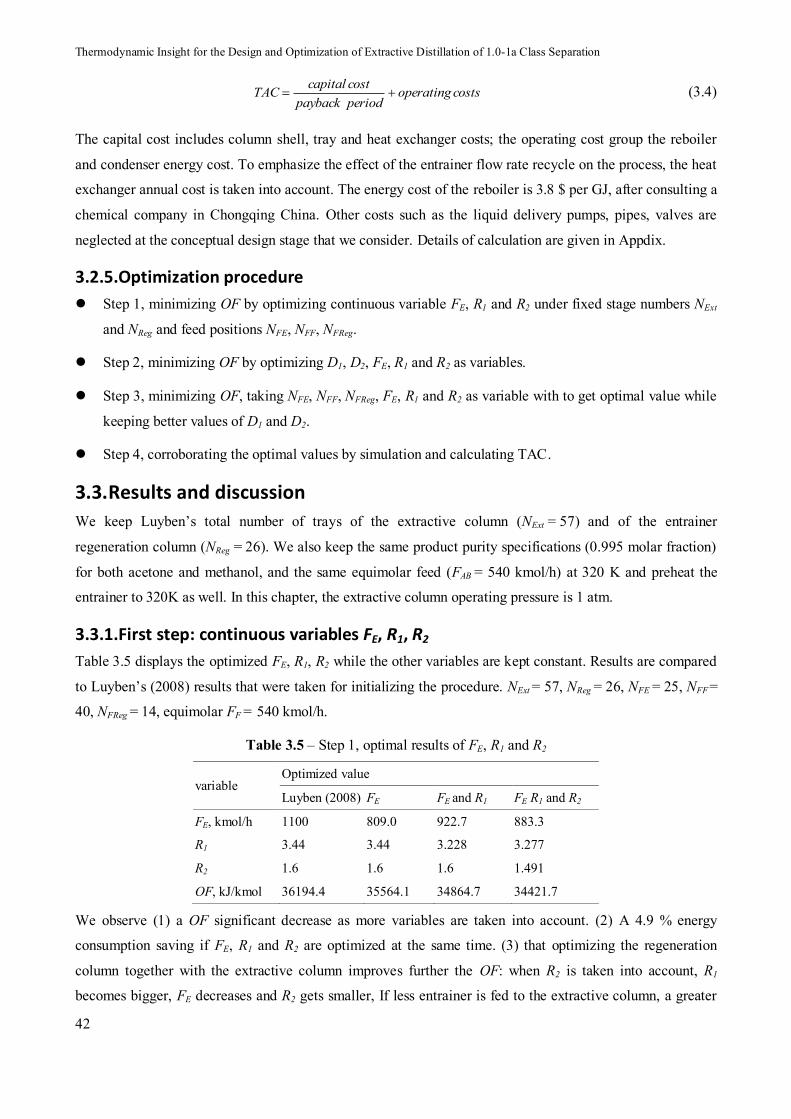
Thermodynamic Insight for the Design and Optimization of Extractive Distillation of 1.0-1a Class Separation
42
costsoperatingperiodpaybackcostcapitalTAC (3.4)
The capital cost includes column shell, tray and heat exchanger costs; the operating cost group the reboiler
and condenser energy cost. To emphasize the effect of the entrainer flow rate recycle on the process, the heat
exchanger annual cost is taken into account. The energy cost of the reboiler is 3.8 $ per GJ, after consulting a
chemical company in Chongqing China. Other costs such as the liquid delivery pumps, pipes, valves are
neglected at the conceptual design stage that we consider. Details of calculation are given in Appdix.
3.2.5.Optimization procedure
Step 1, minimizing OF by optimizing continuous variable FE, R1 and R2 under fixed stage numbers NExt
and NReg and feed positions NFE, NFF, NFReg.
Step 2, minimizing OF by optimizing D1, D2, FE, R1 and R2 as variables.
Step 3, minimizing OF, taking NFE, NFF, NFReg, FE, R1 and R2 as variable with to get optimal value while
keeping better values of D1 and D2.
Step 4, corroborating the optimal values by simulation and calculating TAC.
3.3.Results and discussion
We keep Luyben’s total number of trays of the extractive column (NExt = 57) and of the entrainer
regeneration column (NReg = 26). We also keep the same product purity specifications (0.995 molar fraction)
for both acetone and methanol, and the same equimolar feed (FAB = 540 kmol/h) at 320 K and preheat the
entrainer to 320K as well. In this chapter, the extractive column operating pressure is 1 atm.
3.3.1.First step: continuous variables FE, R1, R2
Table 3.5 displays the optimized FE, R1, R2 while the other variables are kept constant. Results are compared
to Luyben’s (2008) results that were taken for initializing the procedure. NExt = 57, NReg = 26, NFE = 25, NFF =
40, NFReg = 14, equimolar FF = 540 kmol/h.
Table 3.5 – Step 1, optimal results of FE, R1 and R2
variable Optimized value
Luyben (2008) FE FE and R1 FE R1 and R2
FE, kmol/h 1100 809.0 922.7 883.3
R1 3.44 3.44 3.228 3.277
R2 1.6 1.6 1.6 1.491
OF, kJ/kmol 36194.4 35564.1 34864.7 34421.7
We observe (1) a OF significant decrease as more variables are taken into account. (2) A 4.9 % energy
consumption saving if FE, R1 and R2 are optimized at the same time. (3) that optimizing the regeneration
column together with the extractive column improves further the OF: when R2 is taken into account, R1
becomes bigger, FE decreases and R2 gets smaller, If less entrainer is fed to the extractive column, a greater

Chap.3. Optimal Retrofits of ED, Acetone-Methanol with Water
43
R1 is needed to get the same separation effect. Meanwhile the concentration of entrainer fed to the
regeneration column decreases due to mass balance, and less energy (R2 decrease) is used to recycle the
entrainer.
3.3.2.Second step: two distillates D1 and D2
As the effect of D1 and D2 on the product purity is strongly non-linear, the simulation cannot converge
steadily, so D1 and D2 are varied with a discrete step of 0.1 kmol/h from 270 kmol/h (recovery = 99.5 %) to
271.3 kmol/h (recovery = 99.98 %) and the SQP optimization is run for FE, R1 and R2. The results are shown
in Figure 3.4.
Figure 3.4 – Effects of D1 and D2 on OF with D1, D2, FE, R1 and R2 as variables
From Figure 3.4, we observe that D2 in the regeneration column has effect on the total process energy cost,
and D1 = 270.7 kmol/h and D2 = 271.1 kmol/h published in Luyben’s results are not optimal values for our
OF. Also, OF decreases with the increase of D2 (resp. D1) when D1 (resp. D2) is fixed. As we will optimize
other variables such as NFE, NFF, NFReg, NExt and NReg in the subsequent steps, we select D1 = 271 kmol/h and
D2 = 271.1 kmol/h; those values corresponding to a product recovery high enough but not too high so as to
make the flow sheet convergence difficult. The corresponding OF value is 33911.2 kJ/kmol, with FE = 901.5
kmol/h, R1 = 3.255 and R2 = 1.406.
3.3.3.Third step: three feed locations
The variables NFE, NFF and NFReg are varied through sensitivity analysis and FE, R1, R2 are optimized while D1
and D2 are fixed. NFE, NFF, NFReg impact the OF not independently of each other. Thus, the sensitivity
analysis over the three feed positions is done with the initial value from Luyben’s design. For each group of
NFE, NFF and NFReg values (a, b, c) with (a0=25, b0=40, c0=14), the total 27 designs with ranges [a0-1, a0, a0+1]
for NFE, [b0-1, b0, b0+1] for NFF, [c0-1, c0, c0+1] for NFReg were optimized simultaneously so as to avoid local
minimum. The results were ranked by minimizing OF value in order to obtain the new group of (a1, b1, c1).
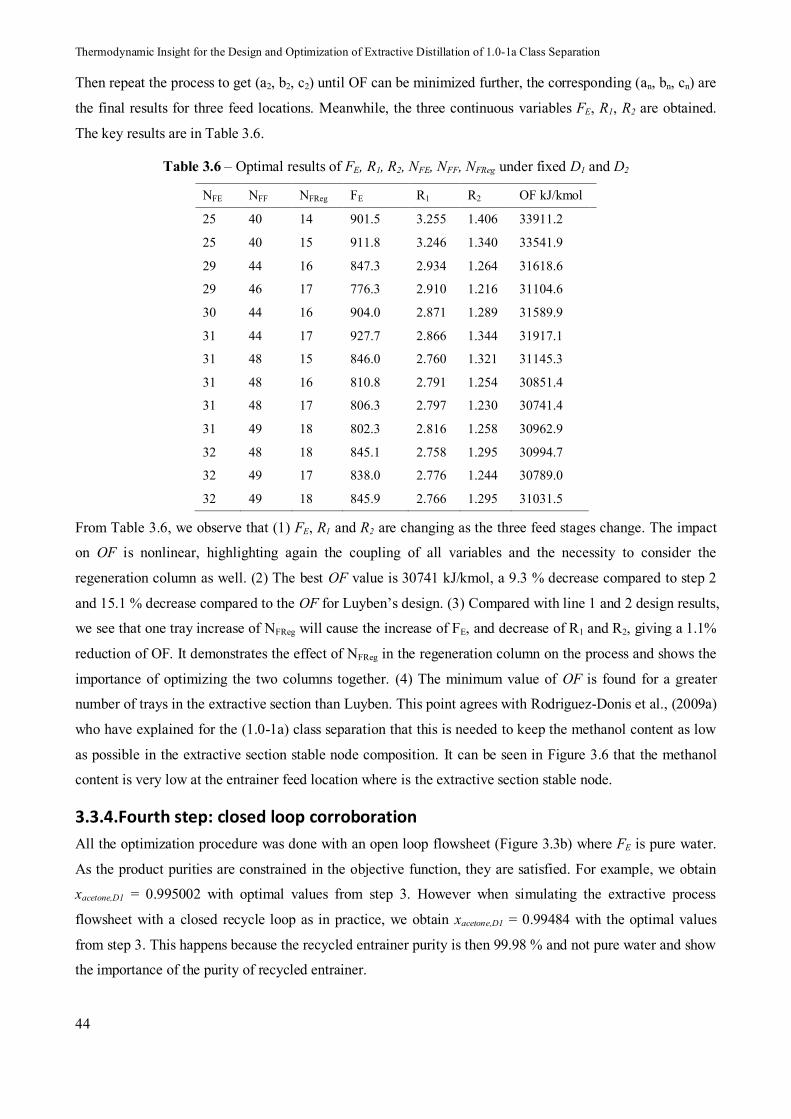
Thermodynamic Insight for the Design and Optimization of Extractive Distillation of 1.0-1a Class Separation
44
Then repeat the process to get (a2, b2, c2) until OF can be minimized further, the corresponding (an, bn, cn) are
the final results for three feed locations. Meanwhile, the three continuous variables FE, R1, R2 are obtained.
The key results are in Table 3.6.
Table 3.6 – Optimal results of FE, R1, R2, NFE, NFF, NFReg under fixed D1 and D2
NFE NFF NFReg FE R1 R2 OF kJ/kmol
25 40 14 901.5 3.255 1.406 33911.2
25 40 15 911.8 3.246 1.340 33541.9
29 44 16 847.3 2.934 1.264 31618.6
29 46 17 776.3 2.910 1.216 31104.6
30 44 16 904.0 2.871 1.289 31589.9
31 44 17 927.7 2.866 1.344 31917.1
31 48 15 846.0 2.760 1.321 31145.3
31 48 16 810.8 2.791 1.254 30851.4
31 48 17 806.3 2.797 1.230 30741.4
31 49 18 802.3 2.816 1.258 30962.9
32 48 18 845.1 2.758 1.295 30994.7
32 49 17 838.0 2.776 1.244 30789.0
32 49 18 845.9 2.766 1.295 31031.5
From Table 3.6, we observe that (1) FE, R1 and R2 are changing as the three feed stages change. The impact
on OF is nonlinear, highlighting again the coupling of all variables and the necessity to consider the
regeneration column as well. (2) The best OF value is 30741 kJ/kmol, a 9.3 % decrease compared to step 2
and 15.1 % decrease compared to the OF for Luyben’s design. (3) Compared with line 1 and 2 design results,
we see that one tray increase of NFReg will cause the increase of FE, and decrease of R1 and R2, giving a 1.1%
reduction of OF. It demonstrates the effect of NFReg in the regeneration column on the process and shows the
importance of optimizing the two columns together. (4) The minimum value of OF is found for a greater
number of trays in the extractive section than Luyben. This point agrees with Rodriguez-Donis et al., (2009a)
who have explained for the (1.0-1a) class separation that this is needed to keep the methanol content as low
as possible in the extractive section stable node composition. It can be seen in Figure 3.6 that the methanol
content is very low at the entrainer feed location where is the extractive section stable node.
3.3.4.Fourth step: closed loop corroboration
All the optimization procedure was done with an open loop flowsheet (Figure 3.3b) where FE is pure water.
As the product purities are constrained in the objective function, they are satisfied. For example, we obtain
xacetone,D1 = 0.995002 with optimal values from step 3. However when simulating the extractive process
flowsheet with a closed recycle loop as in practice, we obtain xacetone,D1 = 0.99484 with the optimal values
from step 3. This happens because the recycled entrainer purity is then 99.98 % and not pure water and show
the importance of the purity of recycled entrainer.
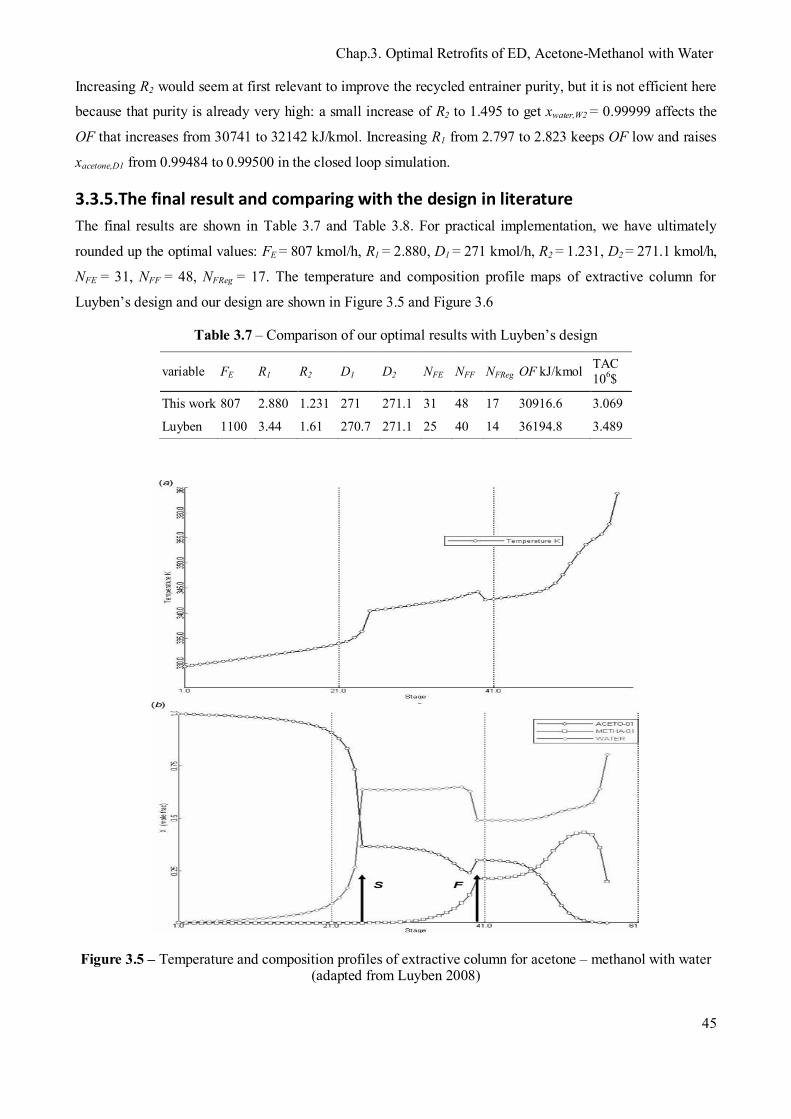
Chap.3. Optimal Retrofits of ED, Acetone-Methanol with Water
45
Increasing R2 would seem at first relevant to improve the recycled entrainer purity, but it is not efficient here
because that purity is already very high: a small increase of R2 to 1.495 to get xwater,W2 = 0.99999 affects the
OF that increases from 30741 to 32142 kJ/kmol. Increasing R1 from 2.797 to 2.823 keeps OF low and raises
xacetone,D1 from 0.99484 to 0.99500 in the closed loop simulation.
3.3.5.The final result and comparing with the design in literature
The final results are shown in Table 3.7 and Table 3.8. For practical implementation, we have ultimately
rounded up the optimal values: FE = 807 kmol/h, R1 = 2.880, D1 = 271 kmol/h, R2 = 1.231, D2 = 271.1 kmol/h,
NFE = 31, NFF = 48, NFReg = 17. The temperature and composition profile maps of extractive column for
Luyben’s design and our design are shown in Figure 3.5 and Figure 3.6
Table 3.7 – Comparison of our optimal results with Luyben’s design
variable FE R1 R2 D1 D2 NFE NFF NFReg OF kJ/kmol TAC 106$
This work 807 2.880 1.231 271 271.1 31 48 17 30916.6 3.069
Luyben 1100 3.44 1.61 270.7 271.1 25 40 14 36194.8 3.489
Figure 3.5 – Temperature and composition profiles of extractive column for acetone – methanol with water (adapted from Luyben 2008)

Thermodynamic Insight for the Design and Optimization of Extractive Distillation of 1.0-1a Class Separation
46
Figure 3.6 – Our design: Temperature and composition profiles of extractive column for acetone – methanol with water
Table 3.8 – Product purities from optimal results and Luyben’s design
mole fraction Mole Frac D1 D2 W2=water W1=F2 recovery
This work
Acetone 0.99516 0.00115 1.88E-12 0.00029 99.88%
Methanol 0.00066 0.99529 9.84E-05 0.25084 99.93%
Water 0.00418 0.00356 0.999901 0.74887
Luyben
Acetone 0.99573 0.00168 9.51E-15 0.00033 99.83%
Methanol 0.00017 0.99578 5.64E-06 0.19715 99.98
Water 0.00410 0.00254 0.999994 0.80252
From Table 3.7 and Table 3.8, we can see (1) a 14.5 % energy consumption reduction compared to Luyben’s
design based on the same stage number of columns (NExt = 57, NReg = 26). (2) A 12.0 % saving in TAC. (3) A
greater production (D1) while maintaining the product purity and using less both energy and total annual cost.

Chap.3. Optimal Retrofits of ED, Acetone-Methanol with Water
47
(4) The recovery of acetone is greater though the recovery of methanol is smaller as the weigh coefficient of
acetone is higher than methanol.
Comparing Figure 3.5 with Figure 3.6, we know that (1) The top temperature are very closed, but the
entrainer and main feed tray temperature in Luyben’s design are higher than our design, it demonstrates that
more entrainer water is used, leading to a high water content and a relatively high temperature. (2) From tray
number 40 to 45 in Figure 3.5, the temperature and composition just have a little changes, it hints the
unnecessary trays are used in stripping section. (3) In our design, two more trays are used in extractive
section which is important for extractive column. It agrees with the fact that the extractive section should
have enough trays in order to reach the stable node of the extractive section SNExt, as suggested by earlier
works (Lelkes et al., 1998a; Rodríguez-Donis et al., 2009a). (4) 6 extra trays are used in rectifying section in
our design that account for reducing R1 from 3.44 to 2.88, which leads the significant decrease of the
condenser and reboiler duties reflected by OF we proposed.
3.4.Conclusions
We have obtained optimal parameters for an extractive distillation process for separating the minimum
boiling azeotropic mixture acetone-methanol with water (class 1.0-1a) as entrainer, taking into account the
both extractive distillation and the entrainer regeneration columns and compared it with Luyben’s design at 1
atm under the constraint of 0.995 mole fraction acetone and methanol products. In a MINLP scheme we have
combined SQP optimization for the continuous variables FE, R1, R2, and sensitivity analysis for D1, D2, NFE,
NFF, NFReg. We have proposed a new objective function accounting for all the energy consumption of per
product flow rate value. Compared with Luyben’s design in literature, the total annual cost and energy
consumption are reduced by 12.0 % and 14.5 % respectively based on the same column stage numbers. It can
be predict that more energy and total annual cost will be saved if the column stage numbers are changed and
optimized follow the optimization process mentioned in this work.

Thermodynamic Insight for the Design and Optimization of Extractive Distillation of 1.0-1a Class Separation
48

Chap.4. Improved Design and Efficiency of Extractive Distillation
49
Chapter 4. Improved Design and Efficiency of
Extractive Distillation
Results in this chapter have been published in
Article: You, X., Rodriguez-Donis, I., Gerbaud, V., 2015. Improved Design and Efficiency of the Extractive
Distillation Process for Acetone–Methanol with Water. Ind. Eng. Chem. Res. 54, 491–501.
Thermodynamic Insight for the Design and Optimization of Extractive Distillation of 1.0-1a Class Separation
50
4.Improved design and efficiency of extractive distillation
4.1.Introduction
Following the definition of (Figueirêdo et al., 2011), a well-designed extractive process means obtaining the
lowest specific energy consumption and the least loss of solvent, taking into consideration the constraints
imposed on the process. In this chapter, we consider the extractive distillation of the minimum boiling
azeotrope acetone (A) – methanol (B) with a heavy entrainer E, belonging to the 1.0-1a-m1 extractive
separation class (Gerbaud and Rodriguez-Donis, 2014). The acetone-methanol azeotrope is also pressure-
sensitive and could be broken by pressure-swing distillation. However, Luyben reported that pressure-swing
distillation has a 15% higher total annual cost than extractive distillation for the ternary system acetone –
methanol with water as entrainer (Luyben, 2008).
The purpose of this chapter is first to improve the design of a continuous extractive distillation process
proposed in the literature and our design in chapter 3. This is done first by getting some thermodynamic
insight from the residue curve map and isovolatility curves that lead to an operating pressure decrease, then
secondly by optimizing the extractive process sequence, including the entrainer regeneration column, with
regards to the energy consumed per unit product output flow rate. The second purpose is to get some insight
on the column performance and to define an efficiency criterion for the extractive process that would
characterize the optimality of the design. It is related to the extractive section ability to segregate the product
between the column top rectifying section and the bottom stripping section. The pressure drop is neglected in
each column that operates at constant pressure.
4.2.Back ground, methods and tools
4.2.1.Extractive process feasibility
The separation of a minimum boiling azeotrope with a heavy entrainer gives rise to a ternary diagram A-B-E
that belongs to the 1.0–1a Serafimov’s class, one of the most common among azeotropic mixtures with a
reported occurrence of 21.6% (Hilmen et al., 2002). In our case, the separation of the minimum boiling
azeotropes acetone A (56.1°C) – Methanol B (64.5°C) (xazeo,A = 0.78 @55.2°C) with heavy entrainer water E
(100.0°C) belongs to the 1.0-1a-m1 extractive separation class. The univolatility curve αAB = 1 intersects the
binary side A-E as shown on Figure 4.1 displaying also the residue curve map. The vapor-liquid equilibrium
of the system acetone-methanol with water is described with the UNIQUAC thermodynamic model. The
reliability of the VLE model used to compute Figure 4.1 residue curve has been assessed by Botia et al
(Botía et al., 2010) using vapor-liquid equilibrium experimental data under atmospheric and vacuum pressure
and was discussed in Chapter 3. That model was also used in Luyben’s work (Luyben, 2008) and our design
in chapter 3, to which we intend to compare our improved process design. In this work, we focus on the
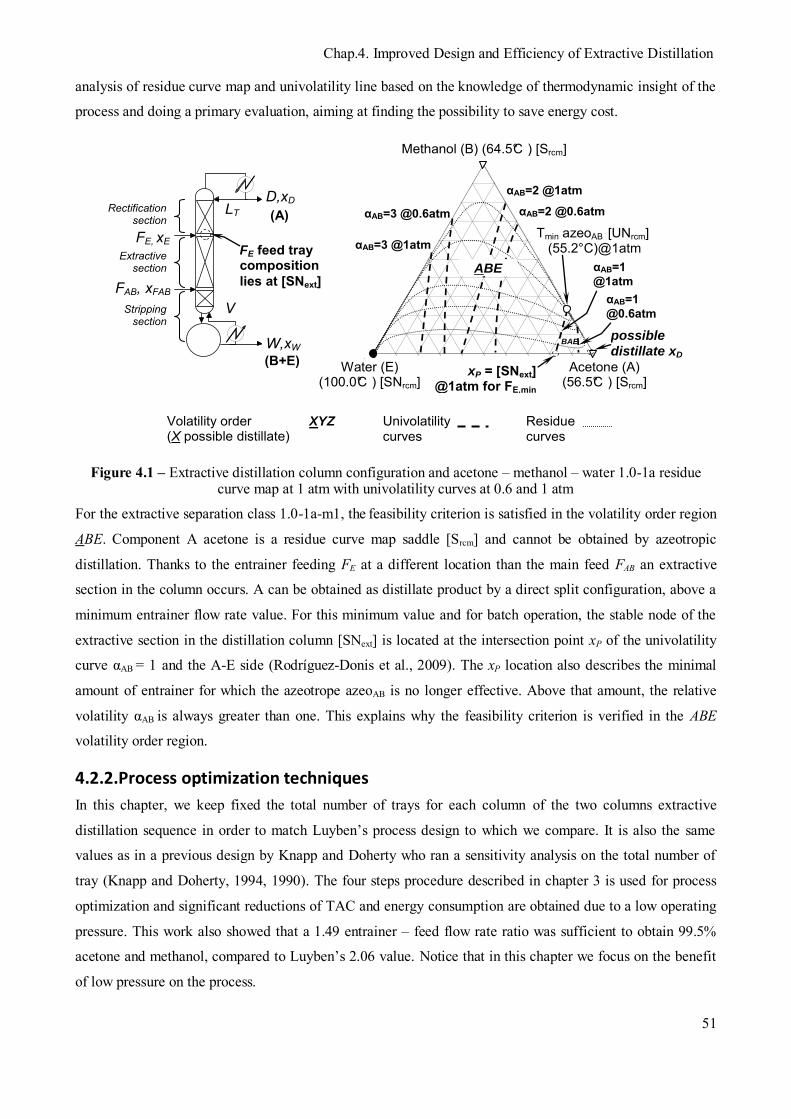
Chap.4. Improved Design and Efficiency of Extractive Distillation
51
analysis of residue curve map and univolatility line based on the knowledge of thermodynamic insight of the
process and doing a primary evaluation, aiming at finding the possibility to save energy cost.
0.5
1
0.9
0.8
0.7
0.6
0.5
0.4
0.3
0.2
0.1
0 1
0.9
0.8
0.7
0.6
0.4
0.3
0.2
0.1
0
1 0.9 0.8 0.7 0.6 0.5 0.4 0.3 0.2 0.1 0 Water (E) (100.0°C ) [SNrcm]
Acetone (A) (56.5°C ) [Srcm]
Methanol (B) (64.5°C ) [Srcm]
Tmin azeoAB [UNrcm] (55.2°C)@1atm
Residue curves
Volatility order XYZ (X possible distillate)
BAE
αAB=1 @1atm
αAB=1 @0.6atm
xP = [SNext] @1atm for FE,min
possible
distillate xD
FE, xE
FAB, xFAB
W,xW
D,xD
Extractive section
Rectification section
Stripping section
V
LT
FE feed tray composition lies at [SNext]
(A)
(B+E)
αAB=2 @1atm
αAB=2 @0.6atm
αAB=3 @1atm
αAB=3 @0.6atm
Univolatility curves
ABE
Figure 4.1 – Extractive distillation column configuration and acetone – methanol – water 1.0-1a residue curve map at 1 atm with univolatility curves at 0.6 and 1 atm
For the extractive separation class 1.0-1a-m1, the feasibility criterion is satisfied in the volatility order region
ABE. Component A acetone is a residue curve map saddle [Srcm] and cannot be obtained by azeotropic
distillation. Thanks to the entrainer feeding FE at a different location than the main feed FAB an extractive
section in the column occurs. A can be obtained as distillate product by a direct split configuration, above a
minimum entrainer flow rate value. For this minimum value and for batch operation, the stable node of the
extractive section in the distillation column [SNext] is located at the intersection point xP of the univolatility
curve αAB = 1 and the A-E side (Rodríguez-Donis et al., 2009). The xP location also describes the minimal
amount of entrainer for which the azeotrope azeoAB is no longer effective. Above that amount, the relative
volatility αAB is always greater than one. This explains why the feasibility criterion is verified in the ABE
volatility order region.
4.2.2.Process optimization techniques
In this chapter, we keep fixed the total number of trays for each column of the two columns extractive
distillation sequence in order to match Luyben’s process design to which we compare. It is also the same
values as in a previous design by Knapp and Doherty who ran a sensitivity analysis on the total number of
tray (Knapp and Doherty, 1994, 1990). The four steps procedure described in chapter 3 is used for process
optimization and significant reductions of TAC and energy consumption are obtained due to a low operating
pressure. This work also showed that a 1.49 entrainer – feed flow rate ratio was sufficient to obtain 99.5%
acetone and methanol, compared to Luyben’s 2.06 value. Notice that in this chapter we focus on the benefit
of low pressure on the process.
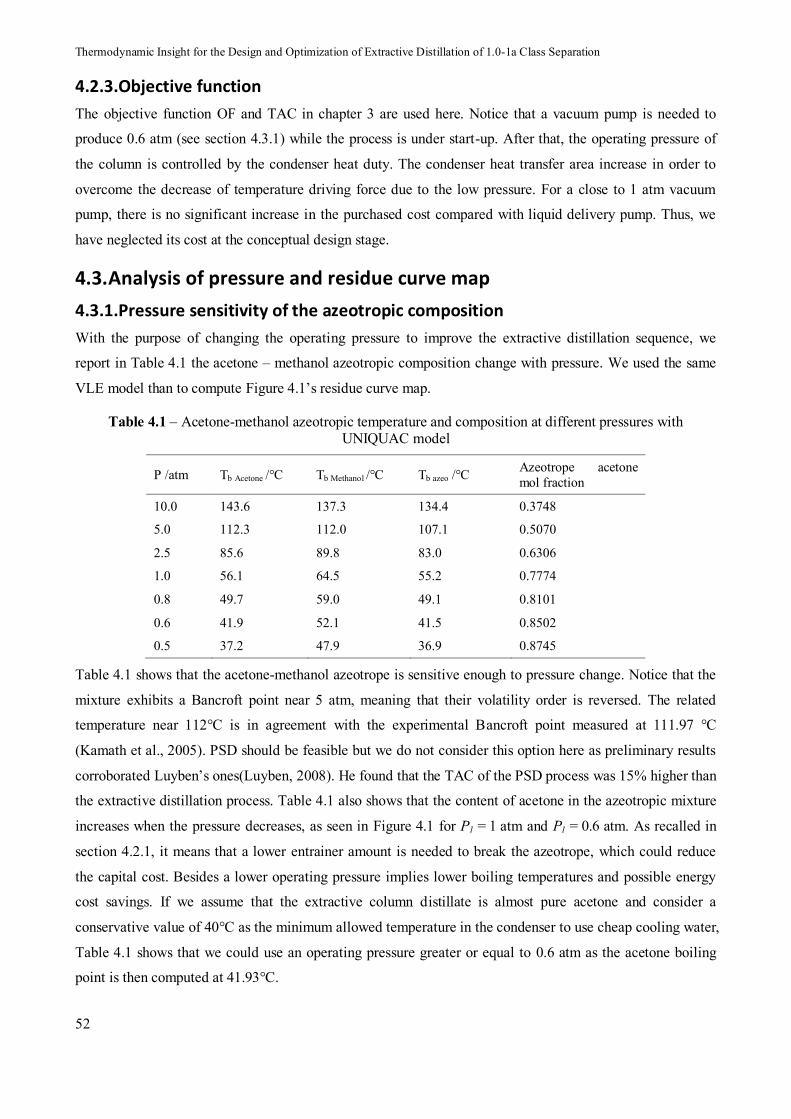
Thermodynamic Insight for the Design and Optimization of Extractive Distillation of 1.0-1a Class Separation
52
4.2.3.Objective function
The objective function OF and TAC in chapter 3 are used here. Notice that a vacuum pump is needed to
produce 0.6 atm (see section 4.3.1) while the process is under start-up. After that, the operating pressure of
the column is controlled by the condenser heat duty. The condenser heat transfer area increase in order to
overcome the decrease of temperature driving force due to the low pressure. For a close to 1 atm vacuum
pump, there is no significant increase in the purchased cost compared with liquid delivery pump. Thus, we
have neglected its cost at the conceptual design stage.
4.3.Analysis of pressure and residue curve map
4.3.1.Pressure sensitivity of the azeotropic composition
With the purpose of changing the operating pressure to improve the extractive distillation sequence, we
report in Table 4.1 the acetone – methanol azeotropic composition change with pressure. We used the same
VLE model than to compute Figure 4.1’s residue curve map.
Table 4.1 – Acetone-methanol azeotropic temperature and composition at different pressures with UNIQUAC model
P /atm Tb Acetone /°C Tb Methanol /°C Tb azeo /°C Azeotrope acetone mol fraction
10.0 143.6 137.3 134.4 0.3748
5.0 112.3 112.0 107.1 0.5070
2.5 85.6 89.8 83.0 0.6306
1.0 56.1 64.5 55.2 0.7774
0.8 49.7 59.0 49.1 0.8101
0.6 41.9 52.1 41.5 0.8502
0.5 37.2 47.9 36.9 0.8745
Table 4.1 shows that the acetone-methanol azeotrope is sensitive enough to pressure change. Notice that the
mixture exhibits a Bancroft point near 5 atm, meaning that their volatility order is reversed. The related
temperature near 112°C is in agreement with the experimental Bancroft point measured at 111.97 °C
(Kamath et al., 2005). PSD should be feasible but we do not consider this option here as preliminary results
corroborated Luyben’s ones(Luyben, 2008). He found that the TAC of the PSD process was 15% higher than
the extractive distillation process. Table 4.1 also shows that the content of acetone in the azeotropic mixture
increases when the pressure decreases, as seen in Figure 4.1 for P1 = 1 atm and P1 = 0.6 atm. As recalled in
section 4.2.1, it means that a lower entrainer amount is needed to break the azeotrope, which could reduce
the capital cost. Besides a lower operating pressure implies lower boiling temperatures and possible energy
cost savings. If we assume that the extractive column distillate is almost pure acetone and consider a
conservative value of 40°C as the minimum allowed temperature in the condenser to use cheap cooling water,
Table 4.1 shows that we could use an operating pressure greater or equal to 0.6 atm as the acetone boiling
point is then computed at 41.93°C.
Chap.4. Improved Design and Efficiency of Extractive Distillation
53
4.3.2.Analysis of residue curve map
The 1.0-1a class RCM for the acetone – methanol – water ternary system at 1 atm is shown in Figure 4.1.
Figure 4.1 also displays univolatility curves αAB = 1 and αAB = 2 and αAB = 3 at 1 atm and 0.6 atm. From αAB
= 1 intersection xP with the A-E edge, we can use equation 3.1 to compute the minimum entrainer/feed flow
rate ratio under infinite reflux ratio FE/Vmin,R∞ = 0.07 at 0.6 atm; lower than FE/Vmin,R∞ = 0.17 at 1 atm. The
univolatility curves indicate that the acetone – methanol relative volatility αAB increases more rapidly for
lower pressures when the entrainer content increases. Therefore for the same amount of entrainer, the
entrainer will increase more αAB under vacuum pressure, making the separation easier and inducing costs
saving. We will use P1 = 0.6 atm in the extractive distillation column from now.
As is well known, the binary mixture water – acetone equilibrium curve exhibit a pinch near pure acetone.
This hints that a significant number of trays are necessary in the rectifying section to reach high purity
acetone.
4.4.Optimization results
We aim at improving the extractive distillation sequence design proposed by Luyben (Luyben, 2008),
referred to as case 1 in the text, by reducing the operating pressure at P1 = 0.6 atm. We keep Luyben’s total
number of trays of the extractive column (NExt = 57) and of the entrainer regeneration column (NReg = 26).
Those values also match Knapp and Doherty’s design (Knapp and Doherty, 1990). We also keep the same
product purity specifications (0.995 molar fraction) for both acetone and methanol, and the same
thermodynamic model as Luyben that was also used to draw Figure 4.1. We also use Luyben’s equimolar
feed (FAB = 540 kmol/h) at 320 K and preheat the entrainer to 320K as well. Other design parameters are
obtained from simulation with the open loop flow sheet. They are marginally different from Luyben’s article
that showed closed loop results.
The four steps optimization procedure described in section 4.2.2 is used. Our design parameters under P1 =
1 atm in chapter 3 are used as initial point of the optimization under P1 = 0.6 atm. Notice D1 and D2 is taken
from chapter 3 since the effects of distillates on the process is the same as Figure 3.4 in chapter 3.
4.4.1. Continuous variables FE, R1, R2
Table 4.2 displays the optimized FE, R1, R2 while the other variables are kept constant. Case 1 is our closed
loop simulation results by using the design parameters of Luyben at 1 atm (Luyben, 2008). Case 2a and 2b
represent results in chapter 3 keeping P1 = 1 atm. The difference between case 2a and 2b is that the three feed
locations of case 2a are the same as case 1, and that of case 2b is taken from our previous work (You et al.,
2014). Case 2b is taken as the initial point for the SQP problem. Case 3 is new results with the extractive
column operating at 0.6 atm and regeneration column operating at 1 atm.
Case 2a and 2b already showed that for the same operating pressure the design based on Luyben’s
parameters (case 1) could be improved by reducing the entrainer flow rate, even when the feed location was
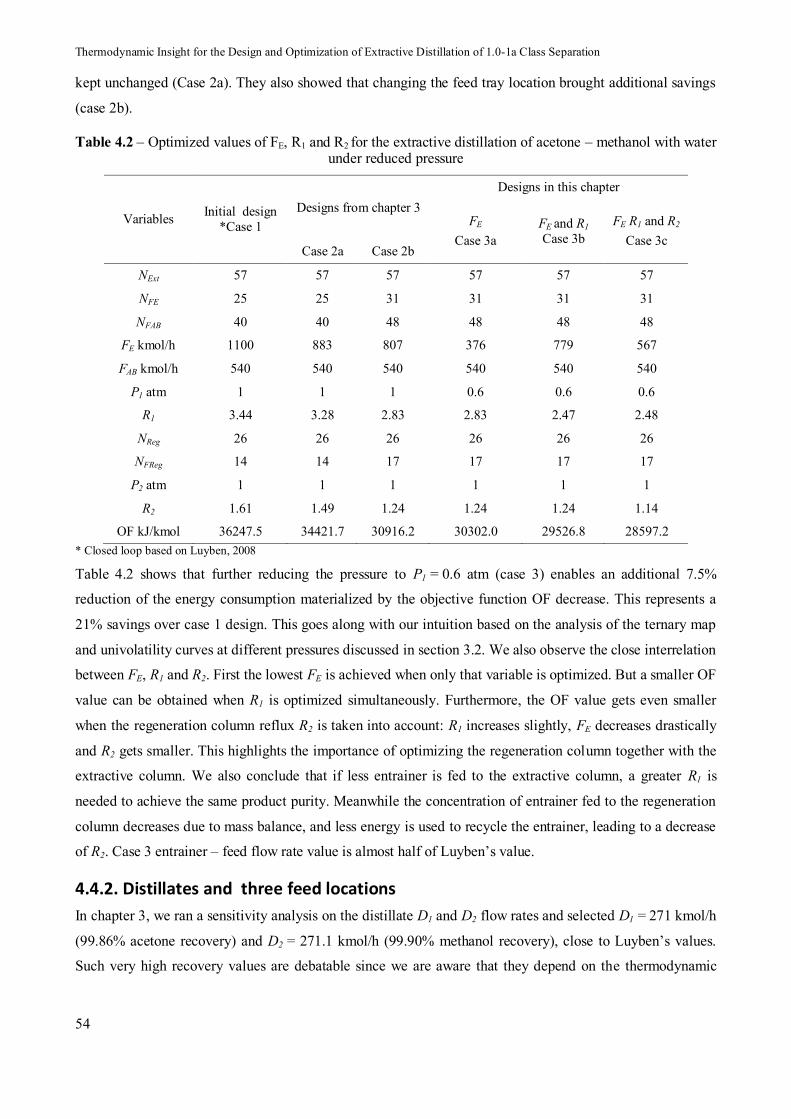
Thermodynamic Insight for the Design and Optimization of Extractive Distillation of 1.0-1a Class Separation
54
kept unchanged (Case 2a). They also showed that changing the feed tray location brought additional savings
(case 2b).
Table 4.2 – Optimized values of FE, R1 and R2 for the extractive distillation of acetone – methanol with water under reduced pressure
Variables Initial design *Case 1
Designs from chapter 3 Designs in this chapter
FE Case 3a
FE and R1 Case 3b
FE R1 and R2
Case 3c Case 2a Case 2b
NExt 57 57 57 57 57 57
NFE 25 25 31 31 31 31
NFAB 40 40 48 48 48 48
FE kmol/h 1100 883 807 376 779 567
FAB kmol/h 540 540 540 540 540 540
P1 atm 1 1 1 0.6 0.6 0.6
R1 3.44 3.28 2.83 2.83 2.47 2.48
NReg 26 26 26 26 26 26
NFReg 14 14 17 17 17 17
P2 atm 1 1 1 1 1 1
R2 1.61 1.49 1.24 1.24 1.24 1.14
OF kJ/kmol 36247.5 34421.7 30916.2 30302.0 29526.8 28597.2 * Closed loop based on Luyben, 2008
Table 4.2 shows that further reducing the pressure to P1 = 0.6 atm (case 3) enables an additional 7.5%
reduction of the energy consumption materialized by the objective function OF decrease. This represents a
21% savings over case 1 design. This goes along with our intuition based on the analysis of the ternary map
and univolatility curves at different pressures discussed in section 3.2. We also observe the close interrelation
between FE, R1 and R2. First the lowest FE is achieved when only that variable is optimized. But a smaller OF
value can be obtained when R1 is optimized simultaneously. Furthermore, the OF value gets even smaller
when the regeneration column reflux R2 is taken into account: R1 increases slightly, FE decreases drastically
and R2 gets smaller. This highlights the importance of optimizing the regeneration column together with the
extractive column. We also conclude that if less entrainer is fed to the extractive column, a greater R1 is
needed to achieve the same product purity. Meanwhile the concentration of entrainer fed to the regeneration
column decreases due to mass balance, and less energy is used to recycle the entrainer, leading to a decrease
of R2. Case 3 entrainer – feed flow rate value is almost half of Luyben’s value.
4.4.2. Distillates and three feed locations
In chapter 3, we ran a sensitivity analysis on the distillate D1 and D2 flow rates and selected D1 = 271 kmol/h
(99.86% acetone recovery) and D2 = 271.1 kmol/h (99.90% methanol recovery), close to Luyben’s values.
Such very high recovery values are debatable since we are aware that they depend on the thermodynamic
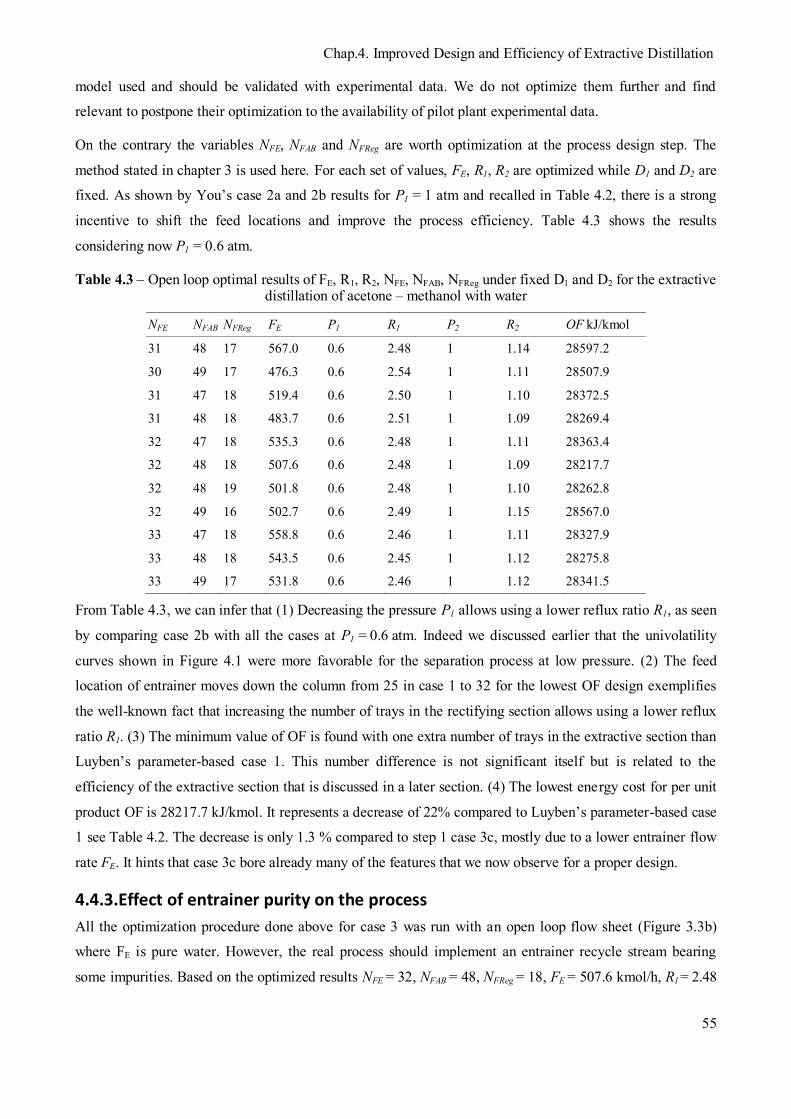
Chap.4. Improved Design and Efficiency of Extractive Distillation
55
model used and should be validated with experimental data. We do not optimize them further and find
relevant to postpone their optimization to the availability of pilot plant experimental data.
On the contrary the variables NFE, NFAB and NFReg are worth optimization at the process design step. The
method stated in chapter 3 is used here. For each set of values, FE, R1, R2 are optimized while D1 and D2 are
fixed. As shown by You’s case 2a and 2b results for P1 = 1 atm and recalled in Table 4.2, there is a strong
incentive to shift the feed locations and improve the process efficiency. Table 4.3 shows the results
considering now P1 = 0.6 atm.
Table 4.3 – Open loop optimal results of FE, R1, R2, NFE, NFAB, NFReg under fixed D1 and D2 for the extractive distillation of acetone – methanol with water
NFE NFAB NFReg FE P1 R1 P2 R2 OF kJ/kmol
31 48 17 567.0 0.6 2.48 1 1.14 28597.2
30 49 17 476.3 0.6 2.54 1 1.11 28507.9
31 47 18 519.4 0.6 2.50 1 1.10 28372.5
31 48 18 483.7 0.6 2.51 1 1.09 28269.4
32 47 18 535.3 0.6 2.48 1 1.11 28363.4
32 48 18 507.6 0.6 2.48 1 1.09 28217.7
32 48 19 501.8 0.6 2.48 1 1.10 28262.8
32 49 16 502.7 0.6 2.49 1 1.15 28567.0
33 47 18 558.8 0.6 2.46 1 1.11 28327.9
33 48 18 543.5 0.6 2.45 1 1.12 28275.8
33 49 17 531.8 0.6 2.46 1 1.12 28341.5
From Table 4.3, we can infer that (1) Decreasing the pressure P1 allows using a lower reflux ratio R1, as seen
by comparing case 2b with all the cases at P1 = 0.6 atm. Indeed we discussed earlier that the univolatility
curves shown in Figure 4.1 were more favorable for the separation process at low pressure. (2) The feed
location of entrainer moves down the column from 25 in case 1 to 32 for the lowest OF design exemplifies
the well-known fact that increasing the number of trays in the rectifying section allows using a lower reflux
ratio R1. (3) The minimum value of OF is found with one extra number of trays in the extractive section than
Luyben’s parameter-based case 1. This number difference is not significant itself but is related to the
efficiency of the extractive section that is discussed in a later section. (4) The lowest energy cost for per unit
product OF is 28217.7 kJ/kmol. It represents a decrease of 22% compared to Luyben’s parameter-based case
1 see Table 4.2. The decrease is only 1.3 % compared to step 1 case 3c, mostly due to a lower entrainer flow
rate FE. It hints that case 3c bore already many of the features that we now observe for a proper design.
4.4.3.Effect of entrainer purity on the process
All the optimization procedure done above for case 3 was run with an open loop flow sheet (Figure 3.3b)
where FE is pure water. However, the real process should implement an entrainer recycle stream bearing
some impurities. Based on the optimized results NFE = 32, NFAB = 48, NFReg = 18, FE = 507.6 kmol/h, R1 = 2.48
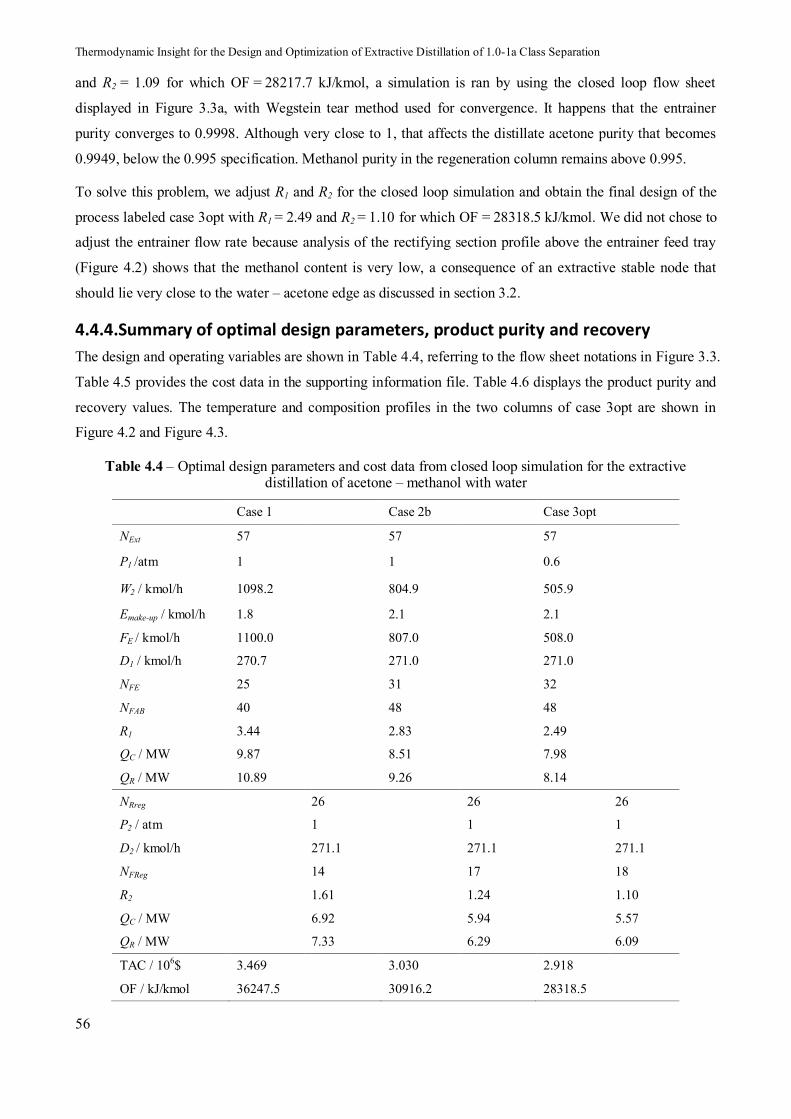
Thermodynamic Insight for the Design and Optimization of Extractive Distillation of 1.0-1a Class Separation
56
and R2 = 1.09 for which OF = 28217.7 kJ/kmol, a simulation is ran by using the closed loop flow sheet
displayed in Figure 3.3a, with Wegstein tear method used for convergence. It happens that the entrainer
purity converges to 0.9998. Although very close to 1, that affects the distillate acetone purity that becomes
0.9949, below the 0.995 specification. Methanol purity in the regeneration column remains above 0.995.
To solve this problem, we adjust R1 and R2 for the closed loop simulation and obtain the final design of the
process labeled case 3opt with R1 = 2.49 and R2 = 1.10 for which OF = 28318.5 kJ/kmol. We did not chose to
adjust the entrainer flow rate because analysis of the rectifying section profile above the entrainer feed tray
(Figure 4.2) shows that the methanol content is very low, a consequence of an extractive stable node that
should lie very close to the water – acetone edge as discussed in section 3.2.
4.4.4.Summary of optimal design parameters, product purity and recovery
The design and operating variables are shown in Table 4.4, referring to the flow sheet notations in Figure 3.3.
Table 4.5 provides the cost data in the supporting information file. Table 4.6 displays the product purity and
recovery values. The temperature and composition profiles in the two columns of case 3opt are shown in
Figure 4.2 and Figure 4.3.
Table 4.4 – Optimal design parameters and cost data from closed loop simulation for the extractive distillation of acetone – methanol with water
Case 1 Case 2b Case 3opt
NExt 57 57 57
P1 /atm 1 1 0.6
W2 / kmol/h 1098.2 804.9 505.9
Emake-up / kmol/h 1.8 2.1 2.1
FE / kmol/h 1100.0 807.0 508.0
D1 / kmol/h 270.7 271.0 271.0
NFE 25 31 32
NFAB 40 48 48
R1 3.44 2.83 2.49
QC / MW 9.87 8.51 7.98
QR / MW 10.89 9.26 8.14
NRreg 26 26 26
P2 / atm 1 1 1
D2 / kmol/h 271.1 271.1 271.1
NFReg 14 17 18
R2 1.61 1.24 1.10
QC / MW 6.92 5.94 5.57
QR / MW 7.33 6.29 6.09
TAC / 106$ 3.469 3.030 2.918
OF / kJ/kmol 36247.5 30916.2 28318.5
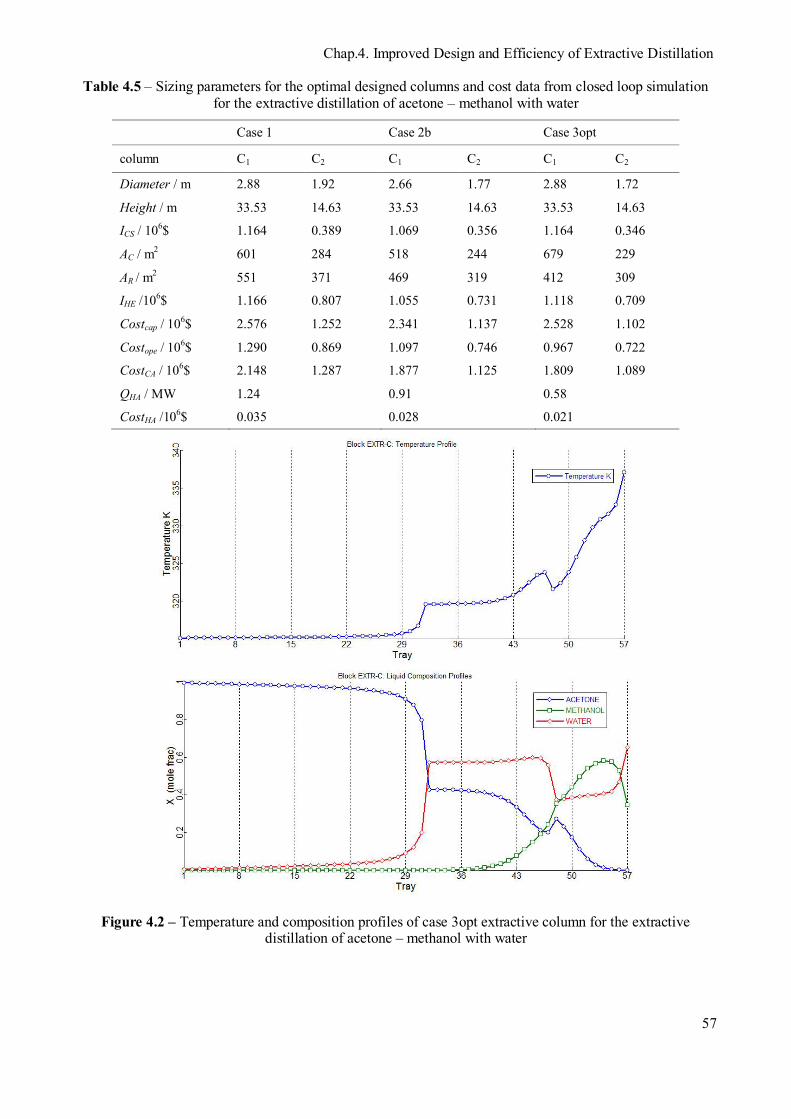
Chap.4. Improved Design and Efficiency of Extractive Distillation
57
Table 4.5 – Sizing parameters for the optimal designed columns and cost data from closed loop simulation for the extractive distillation of acetone – methanol with water
Case 1 Case 2b Case 3opt
column C1 C2 C1 C2 C1 C2
Diameter / m 2.88 1.92 2.66 1.77 2.88 1.72
Height / m 33.53 14.63 33.53 14.63 33.53 14.63
ICS / 106$ 1.164 0.389 1.069 0.356 1.164 0.346
AC / m2 601 284 518 244 679 229
AR / m2 551 371 469 319 412 309
IHE /106$ 1.166 0.807 1.055 0.731 1.118 0.709
Costcap / 106$ 2.576 1.252 2.341 1.137 2.528 1.102
Costope / 106$ 1.290 0.869 1.097 0.746 0.967 0.722
CostCA / 106$ 2.148 1.287 1.877 1.125 1.809 1.089
QHA / MW 1.24 0.91 0.58
CostHA /106$ 0.035 0.028 0.021
Figure 4.2 – Temperature and composition profiles of case 3opt extractive column for the extractive distillation of acetone – methanol with water
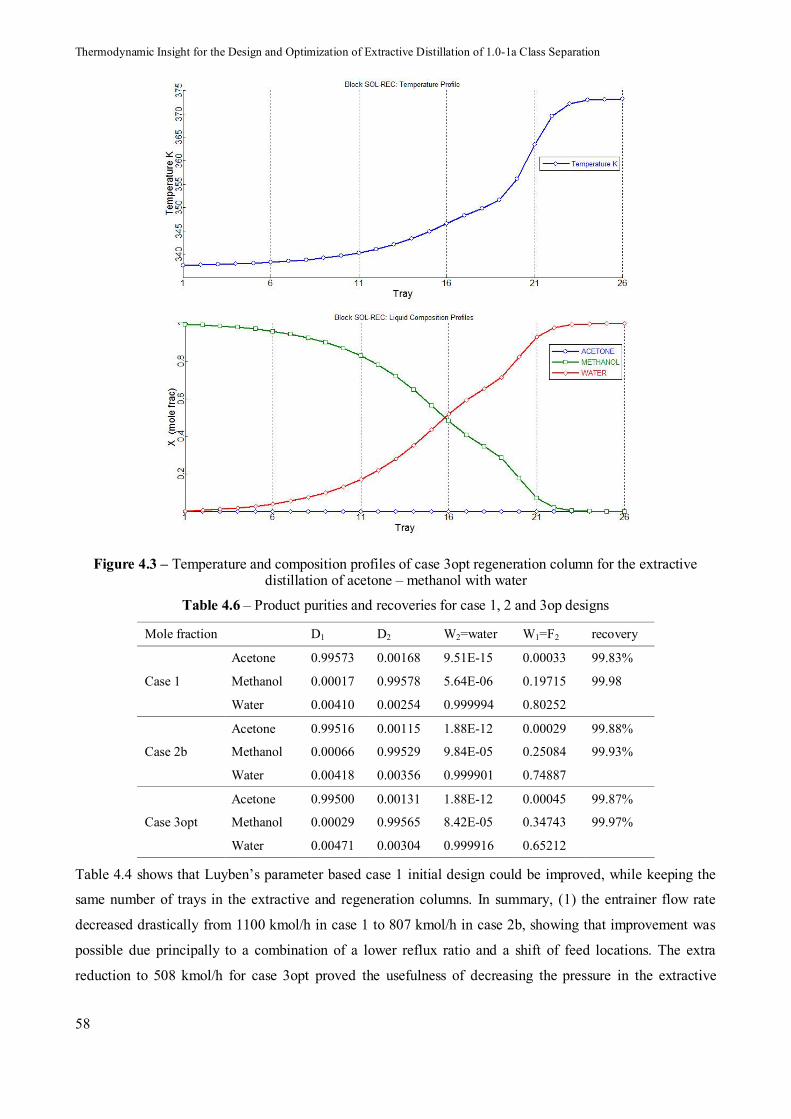
Thermodynamic Insight for the Design and Optimization of Extractive Distillation of 1.0-1a Class Separation
58
Figure 4.3 – Temperature and composition profiles of case 3opt regeneration column for the extractive distillation of acetone – methanol with water
Table 4.6 – Product purities and recoveries for case 1, 2 and 3op designs
Mole fraction D1 D2 W2=water W1=F2 recovery
Case 1
Acetone 0.99573 0.00168 9.51E-15 0.00033 99.83%
Methanol 0.00017 0.99578 5.64E-06 0.19715 99.98
Water 0.00410 0.00254 0.999994 0.80252
Case 2b
Acetone 0.99516 0.00115 1.88E-12 0.00029 99.88%
Methanol 0.00066 0.99529 9.84E-05 0.25084 99.93%
Water 0.00418 0.00356 0.999901 0.74887
Case 3opt
Acetone 0.99500 0.00131 1.88E-12 0.00045 99.87%
Methanol 0.00029 0.99565 8.42E-05 0.34743 99.97%
Water 0.00471 0.00304 0.999916 0.65212
Table 4.4 shows that Luyben’s parameter based case 1 initial design could be improved, while keeping the
same number of trays in the extractive and regeneration columns. In summary, (1) the entrainer flow rate
decreased drastically from 1100 kmol/h in case 1 to 807 kmol/h in case 2b, showing that improvement was
possible due principally to a combination of a lower reflux ratio and a shift of feed locations. The extra
reduction to 508 kmol/h for case 3opt proved the usefulness of decreasing the pressure in the extractive
Chap.4. Improved Design and Efficiency of Extractive Distillation
59
column, as deduced from the pressure dependency of the azeotrope composition and the isovolatility curves.
(2) Energy consumption underlying the OF value is reduced by 21.9% and 8.4% compared to case 1 and 2,
respectively. It is mostly attributed to the reduction in entrainer flow rate. (3) Meanwhile, TAC savings reach
16% and 3.7% due to the decrease of entrainer flow rate, column diameters and heat exchanger areas in the
second column. (4) If we just take the extractive column in case 2 and case 3opt into account, the decrease of
the pressure leads to an increase of the column diameter, and an increase of the condenser heat exchanger
area due to the decrease of condenser temperature. However, the decrease of the pressure results in the
decrease of reboiler duty by 12%, and the benefit of decreasing pressure overcomes the punishment as the
annual cost of extractive column is reduced from 1.877 to 1.809 (106$). Besides, the increase of the
temperature difference (driving force) in the reboiler due to the pressure decrease will lead to lower pressure
of steam used. This aspect is not taken into account as we assume the same temperature driving force in all
case and the same price for the used steam.
Table 4.4 also shows the importance of adjusting the feed tray locations to reduce the process energy
consumption. Luyben explained that the feed tray locations of the column were found empirically by finding
what locations give minimum energy consumption in their study. In our work, the two columns are taken
into account and the feed location is optimized by give minimum OF using the four steps procedure
described in chapter 3. This point is evidenced by comparing the total heat duty of case 1 (18.22 MW) and
case 2b (15.55 MW): a 14.6 % total heat duty is saved. Further decrease of the pressure allows an additional
saving of 8.5% in heat duty between case 2b and case 3opt (14.23 MW).
Meanwhile, we notice that more acetone product (0.3kmol/h) is obtained in case 2b and 3 despite lower
energy consumption than in case 1. This phenomenon is counterintuitive: normally, the more products at
specified purity are obtained, the more energy (reboiler duty) should be used. The reasonable interpretation is
that our optimization is conducted following OF, which reflects the energy consumption per unit product.
The optimization resulted in balancing the energy consumption more evenly between the extractive column
and regeneration column with a reboiler duty ratio of 1.486 in case 1, 1.472 in case 2b and 1.337 in case 3opt.
Regarding the TAC we have used Douglas’s method with M&S 2011 index = 1511. Case 1 value (3.469E06
$) is close to Luyben’s value (3.750E06 $) where he used different k and m factors, and energy consumption
price. Case 3opt value (2.918E06 $) which corresponds to 508 kmol/hr of entrainer is close to Knapp and
Doherty’s TAC (2.750E06 $) obtained with a 540 kmol/hr of entrainer and submitted in jan 1990 (Knapp
and Doherty, 1990). If we use the 1989 M&S index = 895.1, the TAC of case 3opt design equals 2.414E06 $.
Regarding product recovery, Table 4.6 shows that the recoveries are high and comparable for all three cases.
Also for the temperature profile, the extractive section temperature is above 320K which was the preset
temperature of the entrainer feed, not further considered for optimization because we wanted to compare to
Luyben’s design.
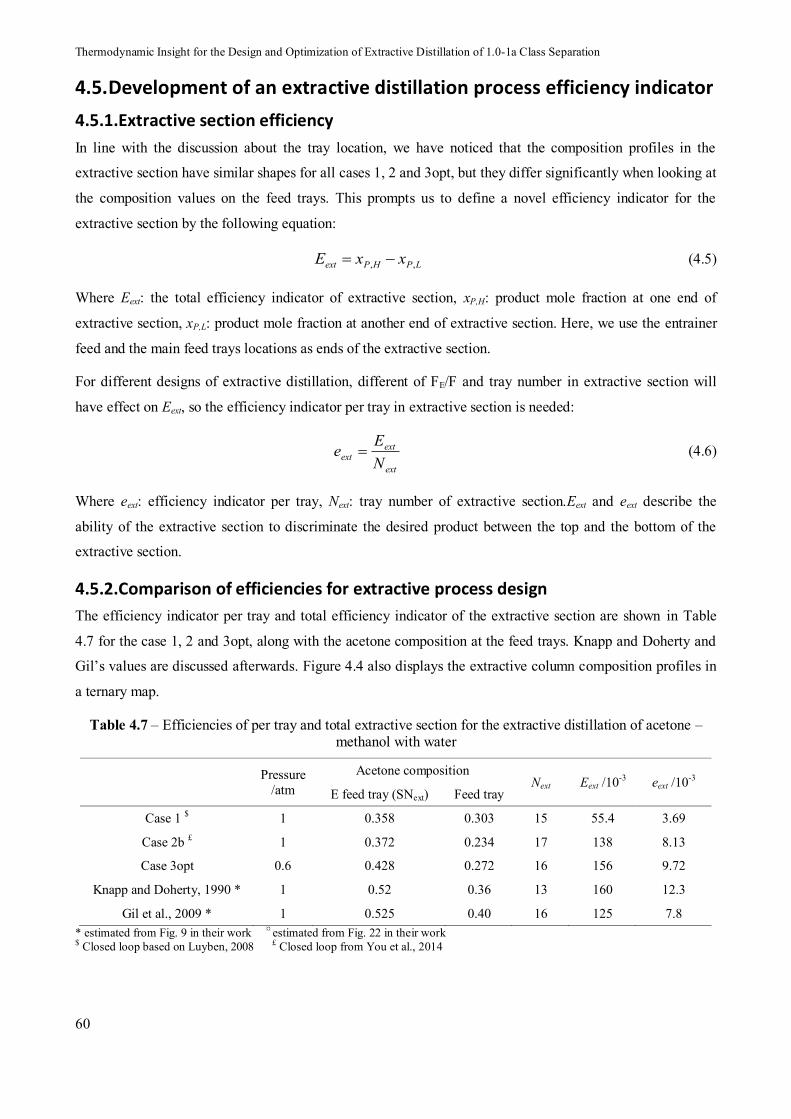
Thermodynamic Insight for the Design and Optimization of Extractive Distillation of 1.0-1a Class Separation
60
4.5.Development of an extractive distillation process efficiency indicator
4.5.1.Extractive section efficiency
In line with the discussion about the tray location, we have noticed that the composition profiles in the
extractive section have similar shapes for all cases 1, 2 and 3opt, but they differ significantly when looking at
the composition values on the feed trays. This prompts us to define a novel efficiency indicator for the
extractive section by the following equation:
LPHPext xxE ,, (4.5)
Where Eext: the total efficiency indicator of extractive section, xP,H: product mole fraction at one end of
extractive section, xP,L: product mole fraction at another end of extractive section. Here, we use the entrainer
feed and the main feed trays locations as ends of the extractive section.
For different designs of extractive distillation, different of FE/F and tray number in extractive section will
have effect on Eext, so the efficiency indicator per tray in extractive section is needed:
ext
extext N
Ee (4.6)
Where eext: efficiency indicator per tray, Next: tray number of extractive section.Eext and eext describe the
ability of the extractive section to discriminate the desired product between the top and the bottom of the
extractive section.
4.5.2.Comparison of efficiencies for extractive process design
The efficiency indicator per tray and total efficiency indicator of the extractive section are shown in Table
4.7 for the case 1, 2 and 3opt, along with the acetone composition at the feed trays. Knapp and Doherty and
Gil’s values are discussed afterwards. Figure 4.4 also displays the extractive column composition profiles in
a ternary map.
Table 4.7 – Efficiencies of per tray and total extractive section for the extractive distillation of acetone – methanol with water
Pressure /atm
Acetone composition Next Eext /10-3 eext /10-3
E feed tray (SNext) Feed tray
Case 1 $ 1 0.358 0.303 15 55.4 3.69
Case 2b £ 1 0.372 0.234 17 138 8.13
Case 3opt 0.6 0.428 0.272 16 156 9.72
Knapp and Doherty, 1990 * 1 0.52 0.36 13 160 12.3
Gil et al., 2009 * 1 0.525 0.40 16 125 7.8 * estimated from Fig. 9 in their work ¤ estimated from Fig. 22 in their work $ Closed loop based on Luyben, 2008 £ Closed loop from You et al., 2014
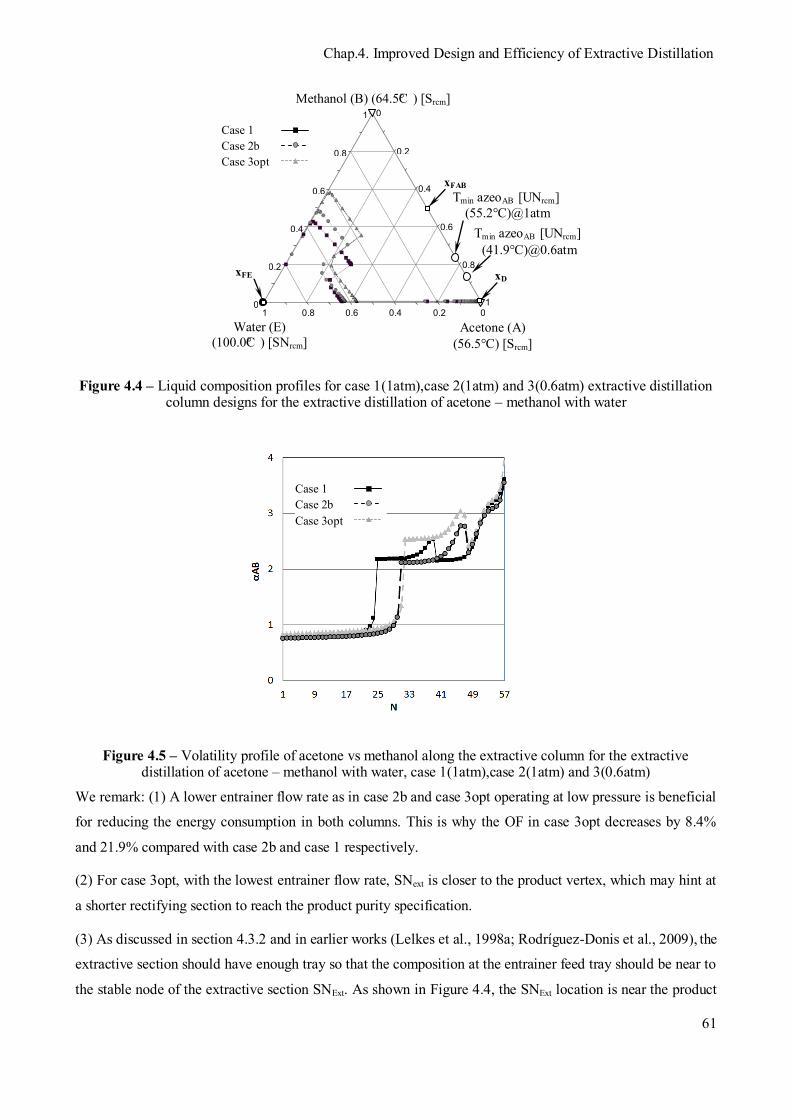
Chap.4. Improved Design and Efficiency of Extractive Distillation
61
1
0.8
0.6
0.4
0.2
0 1
0.8
0.6
0.4
0.2
0
1 0.8 0.6 0.4 0.2 0
Water (E) (100.0°C ) [SNrcm]
Acetone (A) (56.5°C) [Srcm]
Methanol (B) (64.5°C ) [Srcm]
Tmin azeoAB [UNrcm] (55.2°C)@1atm
xD
Tmin azeoAB [UNrcm]
(41.9°C)@0.6atm
Case 1 Case 2b Case 3opt
xFAB
xFE
Figure 4.4 – Liquid composition profiles for case 1(1atm),case 2(1atm) and 3(0.6atm) extractive distillation column designs for the extractive distillation of acetone – methanol with water
Case 1 Case 2b Case 3opt
Figure 4.5 – Volatility profile of acetone vs methanol along the extractive column for the extractive distillation of acetone – methanol with water, case 1(1atm),case 2(1atm) and 3(0.6atm)
We remark: (1) A lower entrainer flow rate as in case 2b and case 3opt operating at low pressure is beneficial
for reducing the energy consumption in both columns. This is why the OF in case 3opt decreases by 8.4%
and 21.9% compared with case 2b and case 1 respectively.
(2) For case 3opt, with the lowest entrainer flow rate, SNext is closer to the product vertex, which may hint at
a shorter rectifying section to reach the product purity specification.
(3) As discussed in section 4.3.2 and in earlier works (Lelkes et al., 1998a; Rodríguez-Donis et al., 2009), the
extractive section should have enough tray so that the composition at the entrainer feed tray should be near to
the stable node of the extractive section SNExt. As shown in Figure 4.4, the SNExt location is near the product
Thermodynamic Insight for the Design and Optimization of Extractive Distillation of 1.0-1a Class Separation
62
– entrainer edge depends on the reflux and on the entrainer flow rate (Gerbaud and Rodriguez-Donis, 2014;
Rodríguez-Donis et al., 2009a). This point is also in agreement with the sensitivity analysis performed by
Lang for the same separating system (Lang, 1992).
(4) Extra trays used in stripping section in case 1 are needed to keep acetone from entering bottom liquid.
For case 2b, the better efficiency of the extractive section to discriminate results in less trays needed in the
stripping section. Case 3opt operating at another pressure, cannot be rightfully discussed here.
(5) The total efficiency indicator Eext and the efficiency indicator per tray in extractive section eext increase by
2.5 and 2.2 times in case 2b compared to case 1. It demonstrates the importance of finding a suitable
extractive section position by moving the feed tray locations. For case 3opt, operating at a lower pressure
which was shown in section 3.2 to be beneficial thanks to more favorable isovolatility curves and SNext
location, Eext and eext are even better. Although one less tray than case 2b is used in the extractive section, Eext
increases further by 13% compared to case 2b, and boosts eext by 19%. Case 3opt is therefore regarded as the
most efficient design, as shown by the OF value that in case 3opt decreases by 8.4% and 21.9% compared
with case 2b and case 1 respectively.
(6) The acetone – methanol relative volatility αAB profile along the extractive distillation column (Figure 4.5)
confirms the efficiency ranking. αAB rises sharply at the entrainer feed tray and drops at the main feed tray. In
the extractive section of case 2b, the increase in αAB is larger than in case 1. This is a remarkable
achievement since the entrainer usage decreases by 26.6%, enabling to reduce the energy consumption as OF
decrease by 14.7%. Case 3opt brings additional savings translated into a better efficiency as it operates at a
higher level of relative volatility. This is because at lower pressure the volatility is higher as discussed in
section 3.2.
We compare our design with the earlier works of (Gil et al., 2009; Knapp and Doherty, 1990; Luyben, 2008).
The extractive efficiency for their design is reported in Table 4.7. Luyben’s design corresponds to our case 1.
Knapp and Doherty’s design has a larger efficiency. We interpret it as a consequence of a smaller reflux ratio.
However, when we simulated Knapp and Doherty’s flow sheet we could recover 98.79 % of the acetone and
98.74% of the methanol. This is attributed to the Van Laar thermodynamic model used by Knapp and
Doherty that overestimated the relative volatility compared to our UNIQUAC model Notice that those
authors separated also an equimolar feed in 99.5%mol pure acetone and methanol with a reflux ratio equal to
0.55 and to 1. They also optimized additional parameters, like the feed quality and temperature, which we set
fixed. Relaxing them, as in a future work in preparation could lead us to improve further our design.
Gil and coworkers’ design was done with the same UNIQUAC model. It does not exhibit an extractive
efficiency as high as we do. But they used a rather high reflux ratio equal to 5 to separate an azeotropic feed
rather than an equimolar feed. They also recovered a 99.0%mol acetone distillate in a 52 trays column with
entrainer and main feed streams entering the column at trays 22 and 48 respectively.

Chap.4. Improved Design and Efficiency of Extractive Distillation
63
4.6.Conclusions
We have looked at improving the design a homogeneous extractive distillation process for the separation of
the acetone – methanol minimum boiling azeotrope with water. The process flow sheet includes both the
extractive distillation column and the entrainer regeneration column. By using insight from the analysis of
the ternary residue curve map and isovolatility curves, we have noticed the beneficial effect of lowering the
pressure in the extractive distillation column for a 1.0-1a-m1 extractive separation class. A lower pressure
reduces the minimal amount of entrainer and increases the relative volatility of acetone – methanol for the
composition in the distillation region where the extractive column operates. A 0.6 atm pressure was selected
to enable the use of cheap cooling water in the condenser.
Then we have run an optimization aiming at minimizing the total energy consumption per product unit as
objective function OF. OF includes both products and both columns energy demands at boiler and condenser
and accounts for the price difference in heating and cooling energy and for the price difference in product
sales. Rigorous simulations in closed loop flow sheet were done in all cases. For the sake of comparison we
have kept the total number of trays identical to literature works of Luyben and of Knapp and Doherty. Other
variables have been optimized; entrainer flow rate, reflux ratios, entrainer feed location and main feed
location. The total annualized cost (TAC) was calculated for all processes.
Double digit savings in energy consumption and in TAC have been achieved compared to literature values
thanks to the optimization scheme helped with thermodynamic insight analysis. Two important issues have
emerged. First the reduction of pressure is beneficial to the separation by extractive distillation. Second, we
have proposed a novel function expressing the efficiency of the extractive section and found it correlated
with the best design. The efficiency of the extractive section describes the ability of the extractive section to
discriminate the desired product between the top and the bottom of the extractive section. We have shown
that a high Eext is correlated to a well-designed extractive distillation process. We have noticed that a suitable
shift of the feed trays locations improves the efficiency of the separation, even when less entrainer is used
and related that to thermodynamic insight gained from the ternary diagram analysis. Comparison with
literature design confirms that the total extractive efficiency and the extractive efficiency per tray functions
are a relevant criterion to assess the performance of an extractive distillation process design.
Next chapter deals with the optimization process including the efficiency indicator as a secondary objective
function to design extractive distillation processes. Additional optimization variable like the total number of
tray will be included.

Thermodynamic Insight for the Design and Optimization of Extractive Distillation of 1.0-1a Class Separation
64
Chap.5. Design and Optimization of ED for separating DIPE-IPA
65
Chapter 5. Design and Optimization of ED for
separating DIPE-IPA
Results in this chapter have been submitted to
Article: You, X., Rodriguez-Donis, I., Gerbaud, V., 2015. Optimisation of Low Pressure Extractive
Distillation for Separating Diisopropyl ether and Isopropyl alcohol. AIChE Journal.
Thermodynamic Insight for the Design and Optimization of Extractive Distillation of 1.0-1a Class Separation
66
5.Design and Optimization of Extractive Distillation for Separating Diisopropyl
ether and Isopropyl alcohol
5.1.Introduction
Diisopropyl ether (DIPE) has become an important gasoline additive over the past decade. DIPE can not only
be used as an octane-enhancing components, but also improve the combustion of gasoline and reduce
emissions (Lladosa et al., 2008). DIPE is also widely used in many other fields, such as tobacco production
and synthetic chemistry. Isopropyl alcohol (IPA) is extensively used in medicine industry as a chemical
intermediate and solvent (Wang et al., 2008). IPA can be produced by using solid acid or liquid acid as
catalytic agent, with DIPE as a coproduct (Logsdon and Loke, 2000). The separation of DIPE/IPA is the key
downstream process that determines the entire process economic benefits. However, IPA and DIPE can’t be
separated by conventional distillation process because they form a binary minimum boiling homogeneous
azeotrope. Hence, other types of distillation methods such as extractive distillation or pressure-swing
distillation are necessary for this separation.
Extractive distillation is the common method for the separation of azeotropic mixture or close boiling
mixture in large scale productions (Doherty and Malone, 2001; Luyben and Chien, 2010; Petlyuk, 2004).
Based on the analysis of residue curve map, univolatility line and univolatility order regions, the
thermodynamic feasibility of extractive distillation process can be predicted by using the general feasibility
criterion without any systematic calculations of composition profiles. Here the thermodynamic feasibility of
extractive distillation process includes knowing which component will be withdrawn in the first distillate cut,
what the adequate column configuration is, and whether it exists some limiting operating parameter value or
not (Rodríguez-Donis et al., 2009). Subsequent calculation of composition profiles can then help refine the
reflux ratio and entrainer feed flow rate range (Petlyuk et al., 2015).
Pressure-swing distillation can be used for separating pressure-sensitive azeotrope (Luyben, 2012; Modla
and Lang, 2010) or pressure-insensitive azeotrope with an entrainer (Knapp and Doherty 1992; Li et al.,
2013). According to Lladosa et al., (2007), the azeotrope of DIPE and IPA is very sensitive to pressure
following the equilibrium diagrams of them based on experimental data. Therefore, the azeotrope can be
separated by pressure-swing distillation. The author also reported that 2-methoxyethanol is an excellent
solvent to break the azeotrope based on the vapor-liquid equilibrium experimental data. In 2014, Luo et al.,
(2014) compared the pressure-swing distillation and extractive distillation with 2-methoxyethanol for the
separation of DIPE and IPA. The results show that the fully heat-integrated pressure-swing distillation
system offers a 5.75% reduction in the total annual cost and 7.97% savings in energy consumption as
compared to the extractive distillation process.

Chap.5. Design and Optimization of ED for separating DIPE-IPA
67
In order to find the possible way to save energy cost and total annual cost for extractive distillation process,
we showed in chapter 4 that a suitable decrease of pressure in extractive distillation column for the
separation of the 1.0-1a class acetone-methanol minimum boiling azeotrope with water system followed by
an optimization of the extractive column and regeneration column process allowed double digit saving in
TAC and energy cost. This was conducted with the help of thermodynamic insight and was analyzed in
terms of novel efficiency indicators of extractive section Eext and per stage in extractive section eext that
described the ability of the extractive section to discriminate the desired product between the top and the
bottom of the extractive section.
In this chapter, we perform a similar study for the extractive distillation of the DIPE-IPA minimum boiling
azeotrope with 2-methoxyethanol system and compared it with designs in literature based on the feasibility
analysis of residue curve, isovolatility line and ternary map. In addition to what was done in chapter 3 and 4,
we also dicuss the issue of selecting suitable distillate flowrate based on the non-linear relation between
distillate flowrates, product purities and recovery yields of the two columns. The two-step procedure as
stated in chapter 3 is used as optimization method and the effects of the main parameters on the process and
efficiency indicators are investigated. Based on the general feasibility criterion, the extractive distillation
process feasibility after reducing the operating pressure on the process, is discussed in order to find the
possibility to save the energy cost and TAC for the separation process itself instead of heat integration ((Luo
et al., 2014) or dividing wall column (Dejanović et al., 2010). Besides, the two efficiency indicators are
calculated to explain how the low pressure in extractive distillation gives benefit to the separation process.
5.2.Steady state design
5.2.1.Extractive process feasibility
In our case, the separation of the minimum boiling azeotropes DIPE A (68.5°C) – IPA B (82.1°C) (xazeo,A =
0.78 @66.9°C) with heavy entrainer 2-methoxyethanol E (124.5°C) belongs to the 1.0-1a-m1 extractive
separation class (Gerbaud and Rodriguez-Donis, 2014). The univolatility curve αAB = 1 intersects the binary
side A-E as shown on Figure 5.1 displaying also the residue curve map. The vapor-liquid equilibrium of the
system is described with the nonrandom two-liquid (NRTL) thermodynamic model (Renon and Prausnitz,
1968), while the vapor phase is assumed to be ideal. The binary parameters of the model are the same as
(Luo et al., 2014), who got the values by regressing from the experimental data (Lladosa et al., 2008).
In fact, for the extractive separation class 1.0-1a-m1, the feasibility criterion is satisfied in the volatility order
region ABE. Component A DIPE, is a residue curve map saddle [Srcm] and cannot be obtained by azeotropic
distillation. Thanks to the entrainer feeding FE at a different location than the main feed FAB an extractive
section in the column occurs. A can be obtained as distillate product by a direct split configuration, above a
minimum entrainer flow rate value. For this minimum value and for batch operation, the stable node of the
extractive section in the distillation column [SNext] is located at the intersection point xP of the univolatility
curve αAB = 1 and the A-E side (Rodríguez-Donis et al., 2009). The xP location also describes the minimal

Thermodynamic Insight for the Design and Optimization of Extractive Distillation of 1.0-1a Class Separation
68
amount of entrainer for which the azeotrope is no longer effective. Above that amount, the relative volatility
αAB is always greater than one.
0.5
1
0.9
0.8
0.7
0.6
0.5
0.4
0.3
0.2
0.1
0 1
0.9
0.8
0.7
0.6
0.4
0.3
0.2
0.1
0
1 0.9 0.8 0.7 0.6 0.5 0.4 0.3 0.2 0.1 0 2-methoxyethanol (E) (124.5°C ) [SNrcm]
DIPE (A) (68.5°C ) [Srcm]
IPA (B) (82.1°C ) [Srcm]
Tmin azeoAB [UNrcm]
(66.9°C)@1atm
Residue curves
Volatility order XYZ (X possible distillate)
BAE
αAB=1 @1atm
αAB=1 @0.4atm
xP = [SNext] @1atm for FE,min
possible
distillate xD
FE, xE
FAB, xFAB
W,xW
D,xD
Extractive section
Rectification section
Stripping section
V
LT
FE feed tray composition lies at [SNext]
(A)
(B+E)
αAB=2 @1atm
αAB=2 @0.4atm
αAB=4 @1atm
αAB=4 @0.4atm
Univolatility curves
ABE
Figure 5.1 – Extractive distillation column configuration and DIPE – IPA –2-methoxyethanol class 1.0-1a
residue curve map at 1atm with isovolatility curves at 0.4 and 1 atm.
5.2.2.Pressure sensitivity of the azeotropic mixture
With the purpose of changing the operating pressure to improve the extractive distillation sequence, we
report in Table 5. the DIPE – IPA azeotropic composition change with pressure. We used the same VLE
model than to compute Figure 5.1’s residue curve map.
Table 5.1 – DIPE-IPA azeotropic temperature and composition at different pressures with NRTL model
P /atm Tb DIPE /°C Tb IPA /°C Tb azeo /°C Azeotrope DIPE mol fraction
10.0 161.8 155.72 154.6 0.2957
5.0 128.1 129.5 123.7 0.5551
4.0 118.4 121.9 114.6 0.6004
2.5 99.7 107.1 96.9 0.6732
1.0 68.5 82.1 66.9 0.7745
0.8 61.7 76.6 60.4 0.7950
0.6 53.4 69.8 52.4 0.8200
0.5 48.4 65.7 47.5 0.8351
0.4 42.5 60.9 41.8 0.8531
Table 5. shows that the DIPE/IPA azeotrope is sensitive enough to pressure change. Notice that the boiling
temperature of IPA is lower than that of DIPE when pressure is high enough. That means the mixture exhibit
a Bancroft point (Elliott and Rainwater, 2000) near 5.8 atm with temperature close to 134.8°C, where their
volatility order is reversed. Considering the pressure sensitivity of the azeotrope, the PSD process is feasible
Chap.5. Design and Optimization of ED for separating DIPE-IPA
69
for the mixture and this was investigated by Luo et al., (2014). Table 5. also shows that the content of DIPE
in the azeotropic mixture increases when the pressure decreases. As seen in Figure 5.1 for P1 = 1 atm and
P1 = 0.4 atm this also prompts the univolatility curve to intersect the A-E edge nearer the DIPE vertex. As
cited in the literature survey and discussed in the next section, it means that a lower entrainer amount is
needed to break the azeotrope, which could reduce the capital cost. Besides a lower operating pressure
implies lower boiling temperatures and possible energy cost savings. In particular, if we assume that the
extractive column distillate is almost pure DIPE and consider a conservative value of 40°C as the minimum
allowed temperature in the condenser to use cheap cooling water, Table 5. shows that we could use an
operating pressure greater or equal to 0.4 atm as the DIPE boiling point is then computed at 42.5°C.
5.2.3.Analysis of residue curve map
The 1.0-1a class residue curve map (RCM) for the DIPE – IPA – 2-methoxyethanol ternary system at 1 atm
was shown in Figure 5.1. Figure 5.1 also displays isovolatility curves αAB = 1 and αAB = 2 and αAB = 4 at 1
atm and 0.4 atm, respectively. According to the general feasibility criterion (Rodríguez-Donis et al. 2009a),
the region ABE in Figure 5.1 satisfies it, so we can expect that (1) DIPE will be the distillate in extractive
column as A is the most volatile component in the region and there is residue curve linked AE following the
increase of temperature. (2) The column configuration is a direct split as the component cut is the most
volatile one.(3) There is minimum entrainer-to-feed flow rate ratio (FE/F)min as αAB = 1 reaches AE side at xP.
When FE/F is lower than (FE/F)min, the process for achieving a high purity distillate is impossible because the
stable node of extractive section SNext is located on the αAB = 1 curve. Indeed, the point xP intersection of the
univolatility curve with the triangle edge gives us the information to calculate the (FE/V)min by the method
shown in (Lelkes et al., 1998a) and then transfer (FE/V)min to (FE/F)min by using the equation 3.2 shown in
chapter 4.
In addition to the aforementioned reduction of the minimum entrainer feed ratio as the pressure is decreased
to 0.4 atm, the isovolatility curves αAB = 2 and αAB = 4 in Figure 5.1 indicate that the DIPE – IPA relative
volatility αAB increases more rapidly for lower pressures when the entrainer content increases. This will make
the separation easier and inducing costs saving at low pressure. We will use P1 = 0.4 atm in the extractive
distillation column from now.
Finally, we have drawn in Figure 5.2 the liquid – vapor equilibrium curve for the binary mixtures 2-
methoxyethanol – DIPE. It exhibits a pinch point near pure DIPE. This hints that a significant number of
trays are necessary in the rectifying section to reach high purity DIPE. This point is proved by our design
below.
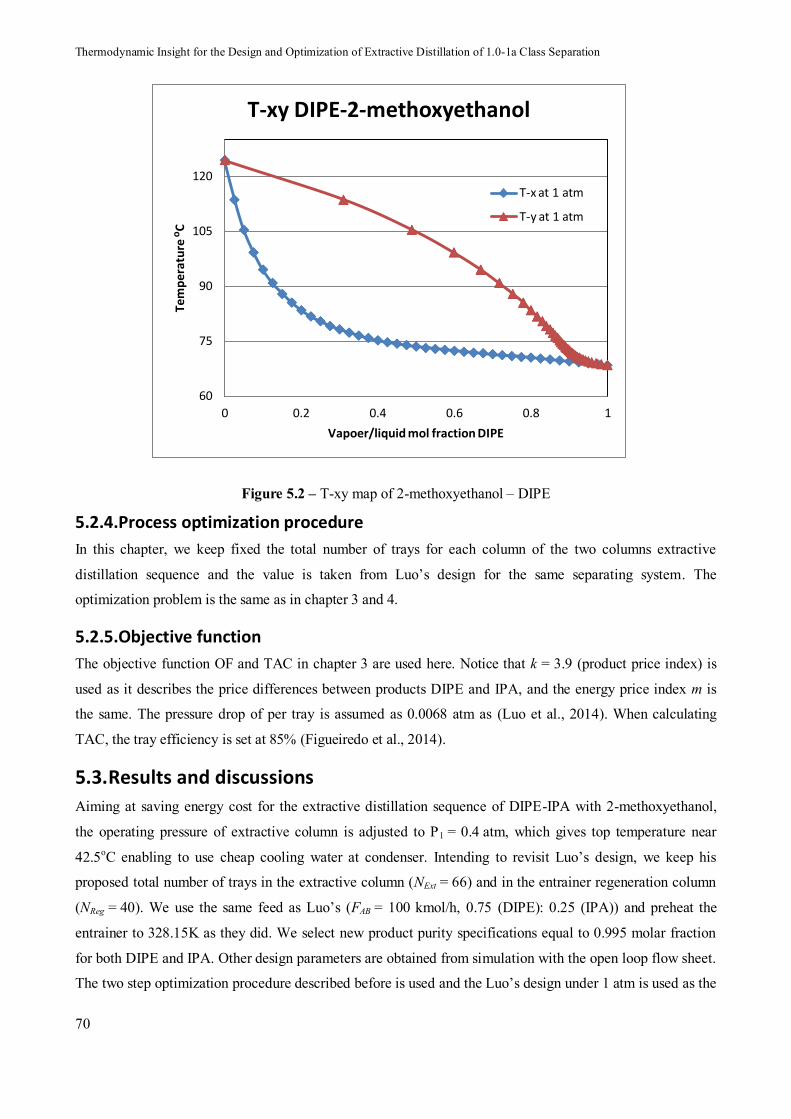
Thermodynamic Insight for the Design and Optimization of Extractive Distillation of 1.0-1a Class Separation
70
60
75
90
105
120
0 0.2 0.4 0.6 0.8 1
Tem
per
atu
re o
C
Vapoer/liquid mol fraction DIPE
T-xy DIPE-2-methoxyethanol
T-x at 1 atm
T-y at 1 atm
Figure 5.2 – T-xy map of 2-methoxyethanol – DIPE
5.2.4.Process optimization procedure
In this chapter, we keep fixed the total number of trays for each column of the two columns extractive
distillation sequence and the value is taken from Luo’s design for the same separating system. The
optimization problem is the same as in chapter 3 and 4.
5.2.5.Objective function
The objective function OF and TAC in chapter 3 are used here. Notice that k = 3.9 (product price index) is
used as it describes the price differences between products DIPE and IPA, and the energy price index m is
the same. The pressure drop of per tray is assumed as 0.0068 atm as (Luo et al., 2014). When calculating
TAC, the tray efficiency is set at 85% (Figueiredo et al., 2014).
5.3.Results and discussions
Aiming at saving energy cost for the extractive distillation sequence of DIPE-IPA with 2-methoxyethanol,
the operating pressure of extractive column is adjusted to P1 = 0.4 atm, which gives top temperature near
42.5oC enabling to use cheap cooling water at condenser. Intending to revisit Luo’s design, we keep his
proposed total number of trays in the extractive column (NExt = 66) and in the entrainer regeneration column
(NReg = 40). We use the same feed as Luo’s (FAB = 100 kmol/h, 0.75 (DIPE): 0.25 (IPA)) and preheat the
entrainer to 328.15K as they did. We select new product purity specifications equal to 0.995 molar fraction
for both DIPE and IPA. Other design parameters are obtained from simulation with the open loop flow sheet.
The two step optimization procedure described before is used and the Luo’s design under 1 atm is used as the
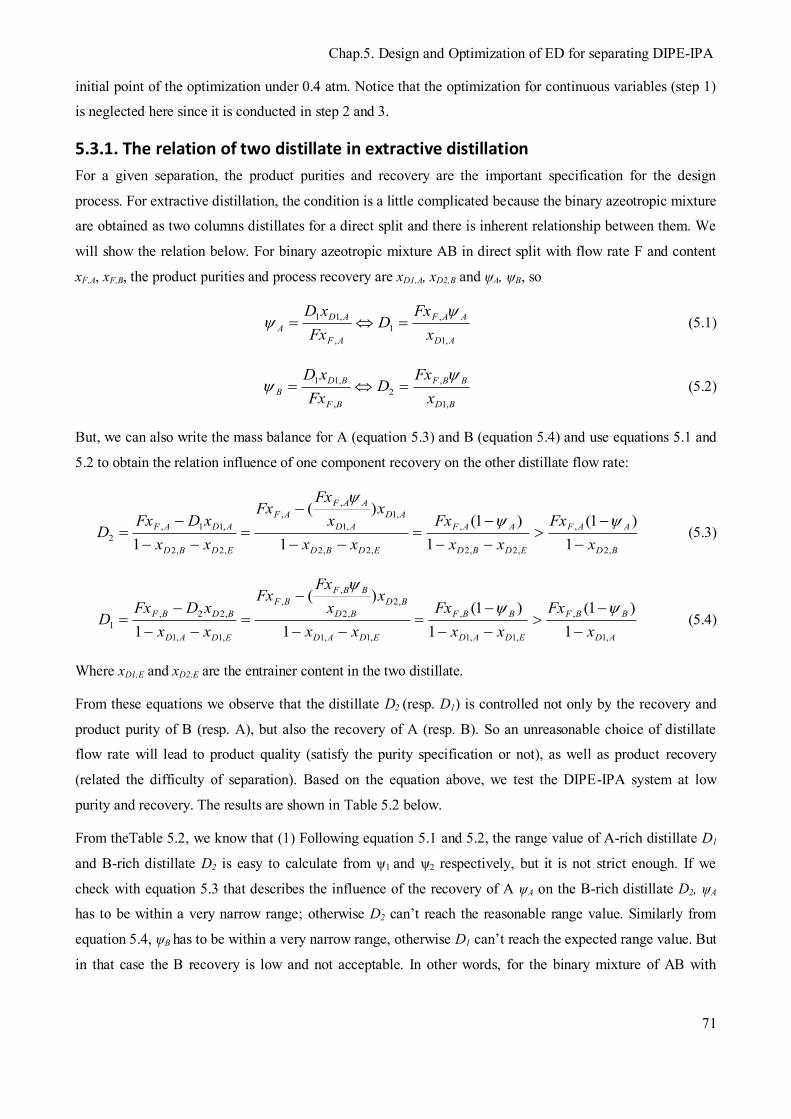
Chap.5. Design and Optimization of ED for separating DIPE-IPA
71
initial point of the optimization under 0.4 atm. Notice that the optimization for continuous variables (step 1)
is neglected here since it is conducted in step 2 and 3.
5.3.1. The relation of two distillate in extractive distillation
For a given separation, the product purities and recovery are the important specification for the design
process. For extractive distillation, the condition is a little complicated because the binary azeotropic mixture
are obtained as two columns distillates for a direct split and there is inherent relationship between them. We
will show the relation below. For binary azeotropic mixture AB in direct split with flow rate F and content
xF,A, xF,B, the product purities and process recovery are xD1,A, xD2,B and ψA, ψB, so
AD
AAF
AF
ADA x
FxD
FxxD
,1
,1
,
,11 (5.1)
BD
BBF
BF
BDB x
FxD
FxxD
,1
,2
,
,11 (5.2)
But, we can also write the mass balance for A (equation 5.3) and B (equation 5.4) and use equations 5.1 and
5.2 to obtain the relation influence of one component recovery on the other distillate flow rate:
BD
AAF
EDBD
AAF
EDBD
ADAD
AAFAF
EDBD
ADAF
xFx
xxFx
xx
xx
FxFx
xxxDFx
D,2
,
,2,2
,
,2,2
,1,1
,,
,2,2
,11,2 1
)1(1
)1(1
)(
1
(5.3)
AD
BBF
EDAD
BBF
EDAD
BDBD
BBFBF
EDAD
BDBF
xFx
xxFx
xx
xx
FxFx
xxxDFx
D,1
,
,1,1
,
,1,1
,2,2
,,
,1,1
,22,1 1
)1(1
)1(1
)(
1
(5.4)
Where xD1,E and xD2,E are the entrainer content in the two distillate.
From these equations we observe that the distillate D2 (resp. D1) is controlled not only by the recovery and
product purity of B (resp. A), but also the recovery of A (resp. B). So an unreasonable choice of distillate
flow rate will lead to product quality (satisfy the purity specification or not), as well as product recovery
(related the difficulty of separation). Based on the equation above, we test the DIPE-IPA system at low
purity and recovery. The results are shown in Table 5.2 below.
From theTable 5.2, we know that (1) Following equation 5.1 and 5.2, the range value of A-rich distillate D1
and B-rich distillate D2 is easy to calculate from ψ1 and ψ2 respectively, but it is not strict enough. If we
check with equation 5.3 that describes the influence of the recovery of A ψA on the B-rich distillate D2, ψA
has to be within a very narrow range; otherwise D2 can’t reach the reasonable range value. Similarly from
equation 5.4, ψB has to be within a very narrow range, otherwise D1 can’t reach the expected range value. But
in that case the B recovery is low and not acceptable. In other words, for the binary mixture of AB with
Thermodynamic Insight for the Design and Optimization of Extractive Distillation of 1.0-1a Class Separation
72
100kmol/h and xF,A = 0.75, if the two products specifications are set at 98%, we should choose a recovery of
A between 99.3197% < ψA < 99.333% which will ensure that the recovery of B is within 98% < ψB < 100%.
Table 5.2 – Relationship of distillates, purity and recovery for binary mixture for 100kmol/h binary mixture
Feed composition Purity specification
xF,A 0.75 xD1,A 0.98
xF,B 0.25 xD2,B 0.98
Range of distillate (equation 5.1 and 5.2)
D1 /kmol/h 75.00 (ψA=98%) 76.53 (ψA=100%)
D2 /kmol/h 25.00 (ψB=98%) 25.51(ψB=100%)
Range of distillate (equation 5.3 and 5.4)
D1 /kmol/h >76.53 (ψB=93.877%) >75.00 (ψB=94%)
D2 /kmol/h >25.51 (ψA=99.3197%) >25.00 (ψA=99.333%)
These relations also indicate that the choice of distillate impacts the necessary entrainer feed flow rate. For
example, if D1 = 75 equation 5.1 gives ψA = 0.98 for a purity of xD1,A = 0.98. Thus there will be 75 ×(1-0.98)
= 1.5 kmol/h of A entering the second regeneration column. As D2=25 kmol/h, the purity of B will be not
higher than xD2,B = (1-1.5/25) = 0.94 if neglect the loss of A in the recycled entrainer stream W2. On the
other hand, if we want to achieve xD2,B=0.98, the maximum value of A that should reach in D2 is 0.5 kmol/h
(25×(1-0.98)). Subtracted from the 1.5 kmol/hr entering column 2, 1 kmol/h A has to be recycled with the
entrainer recycle stream W2. That impurity in the recycle entrainer implies that the entrainer flow rate has to
be over 1000(1÷(1-0.999)) kmol/h in order to guarantee our specification of 0.999mol% pure entrainer
recycled to column 1. This corresponds to a very large entrainer-to-feed flow rate ratio (FE/F = 10), leading
to large energy cost. A more reasonable example is to assume D1 = 76.1 kmol/h. Then with xD1,A = 0.98
equation 5.1 gives ψA = 0.99437 and 76.1 × (1-0. 0.99437) = 0.428 kmol/h of A will enter the second column.
Being below the maximum 0.5 kmol/hr of A to enter column 2, the purities of B and recycling entrainer can
be met and the entrainer-to-feed flow rate ratio does not have to very high.
In summary, D1 and D2 strongly interact each other and with the recycled entrainer-riche stream. Also, a
suitable increase of D1 from 75 to 76.1 did not increase the separation cost but rather can result in energy
cost savings.
5.3.2.Choice of distillate flow rate for this chapter
With the new product purity specification, we use equations 5.1 to 5.4 to select suitable distillate flow rate,
as shown in Table 5.3.
Table 5.3 shows that the recovery of DIPE should be at least higher than 99.83% and that the recovery of
IPA should be above 99.5%. Our final design overcomes these values. Also, we can explain that Luo’ design
that fixed D1 = 75.44 kmol/h prevented him to reach a purity of 0.9950 for DIPE since it is above the 75.37
kmol/h limit value for that purity. He obtained 0.9930 which corresponds to a ψA = 99.88% from equation 5.1.
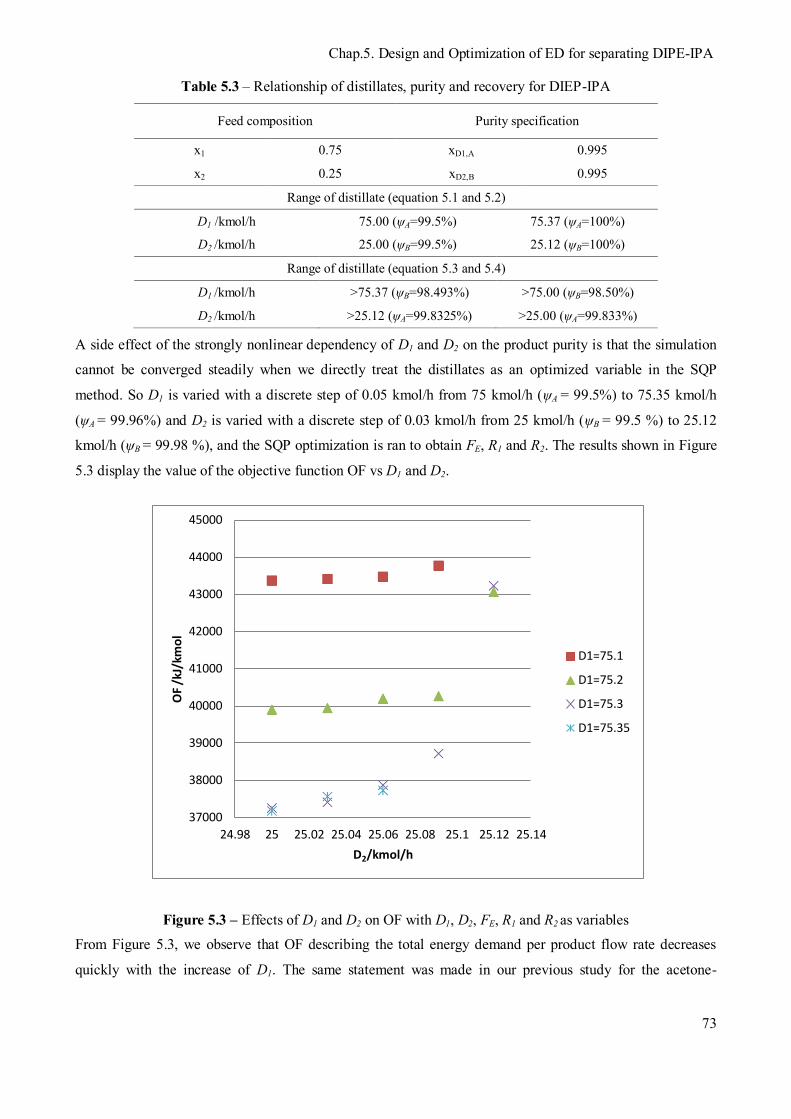
Chap.5. Design and Optimization of ED for separating DIPE-IPA
73
Table 5.3 – Relationship of distillates, purity and recovery for DIEP-IPA
Feed composition Purity specification
x1 0.75 xD1,A 0.995
x2 0.25 xD2,B 0.995
Range of distillate (equation 5.1 and 5.2)
D1 /kmol/h 75.00 (ψA=99.5%) 75.37 (ψA=100%)
D2 /kmol/h 25.00 (ψB=99.5%) 25.12 (ψB=100%)
Range of distillate (equation 5.3 and 5.4)
D1 /kmol/h >75.37 (ψB=98.493%) >75.00 (ψB=98.50%)
D2 /kmol/h >25.12 (ψA=99.8325%) >25.00 (ψA=99.833%)
A side effect of the strongly nonlinear dependency of D1 and D2 on the product purity is that the simulation
cannot be converged steadily when we directly treat the distillates as an optimized variable in the SQP
method. So D1 is varied with a discrete step of 0.05 kmol/h from 75 kmol/h (ψA = 99.5%) to 75.35 kmol/h
(ψA = 99.96%) and D2 is varied with a discrete step of 0.03 kmol/h from 25 kmol/h (ψB = 99.5 %) to 25.12
kmol/h (ψB = 99.98 %), and the SQP optimization is ran to obtain FE, R1 and R2. The results shown in Figure
5.3 display the value of the objective function OF vs D1 and D2.
37000
38000
39000
40000
41000
42000
43000
44000
45000
24.98 25 25.02 25.04 25.06 25.08 25.1 25.12 25.14
OF
/kJ/
kmo
l
D2/kmol/h
D1=75.1
D1=75.2
D1=75.3
D1=75.35
Figure 5.3 – Effects of D1 and D2 on OF with D1, D2, FE, R1 and R2 as variables
From Figure 5.3, we observe that OF describing the total energy demand per product flow rate decreases
quickly with the increase of D1. The same statement was made in our previous study for the acetone-
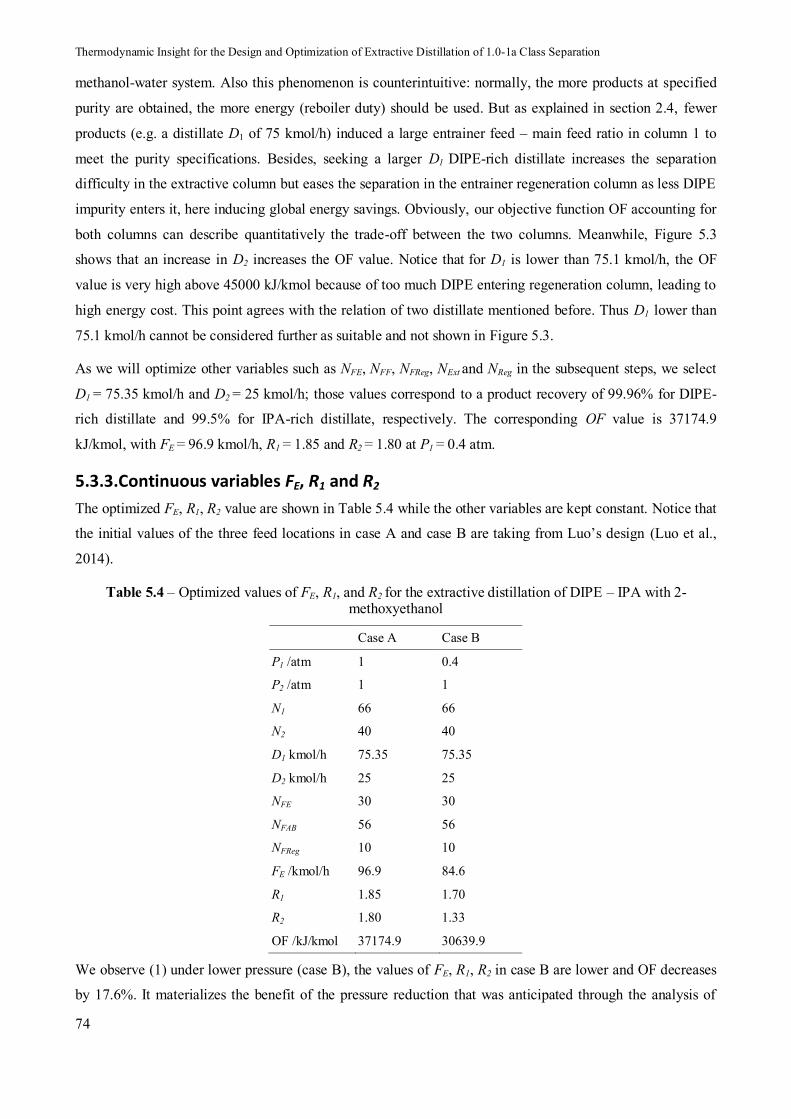
Thermodynamic Insight for the Design and Optimization of Extractive Distillation of 1.0-1a Class Separation
74
methanol-water system. Also this phenomenon is counterintuitive: normally, the more products at specified
purity are obtained, the more energy (reboiler duty) should be used. But as explained in section 2.4, fewer
products (e.g. a distillate D1 of 75 kmol/h) induced a large entrainer feed – main feed ratio in column 1 to
meet the purity specifications. Besides, seeking a larger D1 DIPE-rich distillate increases the separation
difficulty in the extractive column but eases the separation in the entrainer regeneration column as less DIPE
impurity enters it, here inducing global energy savings. Obviously, our objective function OF accounting for
both columns can describe quantitatively the trade-off between the two columns. Meanwhile, Figure 5.3
shows that an increase in D2 increases the OF value. Notice that for D1 is lower than 75.1 kmol/h, the OF
value is very high above 45000 kJ/kmol because of too much DIPE entering regeneration column, leading to
high energy cost. This point agrees with the relation of two distillate mentioned before. Thus D1 lower than
75.1 kmol/h cannot be considered further as suitable and not shown in Figure 5.3.
As we will optimize other variables such as NFE, NFF, NFReg, NExt and NReg in the subsequent steps, we select
D1 = 75.35 kmol/h and D2 = 25 kmol/h; those values correspond to a product recovery of 99.96% for DIPE-
rich distillate and 99.5% for IPA-rich distillate, respectively. The corresponding OF value is 37174.9
kJ/kmol, with FE = 96.9 kmol/h, R1 = 1.85 and R2 = 1.80 at P1 = 0.4 atm.
5.3.3.Continuous variables FE, R1 and R2
The optimized FE, R1, R2 value are shown in Table 5.4 while the other variables are kept constant. Notice that
the initial values of the three feed locations in case A and case B are taking from Luo’s design (Luo et al.,
2014).
Table 5.4 – Optimized values of FE, R1, and R2 for the extractive distillation of DIPE – IPA with 2-methoxyethanol
Case A Case B
P1 /atm 1 0.4
P2 /atm 1 1
N1 66 66
N2 40 40
D1 kmol/h 75.35 75.35
D2 kmol/h 25 25
NFE 30 30
NFAB 56 56
NFReg 10 10
FE /kmol/h 96.9 84.6
R1 1.85 1.70
R2 1.80 1.33
OF /kJ/kmol 37174.9 30639.9
We observe (1) under lower pressure (case B), the values of FE, R1, R2 in case B are lower and OF decreases
by 17.6%. It materializes the benefit of the pressure reduction that was anticipated through the analysis of

Chap.5. Design and Optimization of ED for separating DIPE-IPA
75
residue curve map and univolatility line for a 1.0-1a class mixture. (2) The reduction in R2 is more
pronounced that in R1. If less entrainer is fed to the extractive column, a greater R1 is needed to get the same
separation effect. Meanwhile the concentration of entrainer fed to the regeneration column decreases due to
mass balance, and less energy (R2 decrease) is used to recycle the entrainer. Overall, these observations agree
with those in chapter 4 for the separation of acetone-methanol-water system. These results also show the
benefit of optimizing both columns together to improve further the OF.
5.3.4.Selecting suitable feed locations
The method stated in chapter 3 is used here. For each set of values, FE, R1, R2 are optimized while D1 and D2
are fixed. Table 5.5 shows the results considering now P1 = 0.4 atm and P2 = 1 atm as in case B above
Table 5.5 – Open loop optimal results of FE, R1, R2, NFE, NFAB, NFReg under fixed D1 and D2 for the extractive distillation of DIPE – IPA with 2-methoxyethanol, P1 = 0.4 atm and P2 = 1 atm
NFE NFAB NFReg FE R1 R2 OF kJ/kmol
26 58 13 75.1 1.76 1.20 30292.8
27 59 14 75.0 1.75 1.17 30081.9
28 58 13 75.1 1.76 1.17 30144.8
28 59 15 74.1 1.77 1.16 30110.5
28 60 15 75.0 1.74 1.17 30042.9
28 60 16 74.0 1.77 1.16 30122.2
28 61 15 74.0 1.78 1.15 30213.2
29 55 9 80.0 1.73 1.37 30827.4
30 56 10 84.6 1.70 1.33 30639.9
30 57 11 84.4 1.66 1.34 30410.7
31 55 10 86.5 1.67 1.39 30740.8
31 56 11 86.6 1.65 1.38 30619.0
As a whole, the shifting of the three feed locations improves further the OF value by 1.9% but also impacts
the process efficiency that will be discussed in section 4.5. A few statements can be made from Table 5.5: (1)
OF is moderately sensitive to small changes of the three feed locations when FE, R1, and R2 are optimized. (2)
In conventional distillation an increase of the number of trays in the rectifying section allows to use a lower
reflux ratio R1, but here for an extractive column, the opposite is found as feed location of entrainer moves
up the column from 30 to 28 for the lowest OF design. The reason was stated in Lelkes et al.31: too much
trays in the rectifying section is not recommended in extractive distillation for the 1.0-1a class because the
pure product DIPE is a saddle in the RCM. (3) The minimum value of OF is found with six extra number of
trays in the extractive section than Luo’s design. As discussed earlier, a key factor to achieve the extractive
separation is to reach the extractive section stable node SNext near the DIPE-2methoxyethanol edge. This can
be achieved by more trays in the extractive section. Another consequence is that the efficiency of the
extractive section that will be discussed in section 4.5 is improved. (4) The lowest energy cost for per unit
Thermodynamic Insight for the Design and Optimization of Extractive Distillation of 1.0-1a Class Separation
76
product OF is 30042.9kJ/kmol with NFE = 28, NFAB = 60 and NFReg = 15. It represents a further 1.9% reduction
in energy cost compared the design with NFE = 30, NFAB = 56 and NFReg = 10.
5.3.5.Closed loop design and optimal design parameters
The optimal design is re-simulated in closed loop flowsheet in order to make sure the product purity is
achieved and that the effect of impurity in recycling entrainer on the process is accounted for. Case 2 under
P1 = 0.4 atm corresponds to the open loop design of case B. It is compared to case 1 that corresponds to our
best closed loop design under P1 = 1 atm. Indeed case A (P1 = 1 atm) in Table 5.4 that corresponded to a
design with Luo’s feed locations did not allowed under closed loop simulation to reach the targeted purity for
the distillates and cannot be used for comparison.
The design and operating variables and the cost data are shown in Table 5.6, referring to the flow sheet
notations in Figure 3.3 in chapter 3. Table 5.7 displays the product purity and recovery values. Figure 5.4 and
Figure 5.5 show the temperature and composition profiles of the extractive and entrainer regeneration
columns for the best case, case 2, where ME notation holds for 2-methoxyethanol.
Table 5.6 confirms that a process design operating at 1 atm like case 1 can be improved further, while
keeping the same number of trays in the extractive and regeneration columns. In summary, (1) the entrainer
flow rate decreased drastically from 100 kmol/h in case 1 to 75 kmol/h in case 2, showing that improvement
was possible due principally to a combination of a shift of feed locations and pressure reduction, as deduced
from the pressure dependency of the azeotrope composition and isovolatility curves. (2) The energy
consumption underlying the OF value in case 2 is reduced by 18.3% compared to case 1. It is mostly
attributed to a reduction in the entrainer flow rate allowed by the reduced pressure. (3) Meanwhile, TAC
savings reach 3.4% mainly due to the decrease of the entrainer flow rate and reflux ratio in the second
regeneration column. (4) If we just take into account the extractive column in case 1 and case 2, the decrease
of the pressure leads to an increase of the column diameter, and an increase of the condenser heat exchanger
area due to the decrease of condenser temperature. However, the decrease of the pressure results in the
decrease of reboiler duty by 11.6%, and the benefit of decreasing pressure overcomes the punishment as the
annual cost of extractive column is slightly reduced from 1.293 to 1.284 (106$). Regarding Luo’s design, his
sequential approach based in sensitivity analysis was to achieve the lowest TAC. But Table 5.6 shows that
his design’s TAC is higher than case 1’s TAC at the same pressure. Luo’s design OF is lower that case 1
value, but recall that as seen in Table 5.7, Luo’s design does not meet our molar purity specification on the
DIPE distillate. To meet that specification, case 1 result show that R1 must be increased and the condenser
heat duty as well. This latter increases the OF value.

Chap.5. Design and Optimization of ED for separating DIPE-IPA
77
Table 5.6 – Optimal design parameters and cost data from closed loop simulation for the extractive distillation of DIPE-IPA with 2-methoxyethanol
Case Luo* Case 1 Case 2
column C1 C2 C1 C2 C1 C2
NExt 66 66 66
P1 / atm 1 1 0.4
FAB / kmol/h 100 100 100
FE / kmol/h 100 100 75
D1 / kmol/h 75.44 75.35 75.35
NFE 30 29 28
NFAB 56 59 60
R1 1.54 1.86 1.83
QC / MW 1.553 1.746 1.838
QR / MW 2.279 2.205 1.948
NRreg 40 40 40
P2 / atm 1 1 1
D2 / kmol/h 25.03 25 25
NFReg 10 12 15
R2 1.93 1.88 1.18
QC / MW 0.823 0.811 0.614
QR / MW 0.748 0.737 0.658
column C1 C2 C1 C2 C1 C2
Diameter / m 1.44 0.78 1.37 0.69 1.66 0.65
Height / m 46.33 28.05 46.33 28.05 46.33 28.05
ICS / 106$ 0.720 0.251 0.683 0.220 0.838 0.207
AC / m2 66 23 74 22 164 18
AR / m2 116 38 112 38 99 34
IHE /106$ 0.347 0.172 0.354 0.170 0.443 0.151
Costcap / 106$ 1.184 0.449 1.145 0.412 1.426 0.378
Costope / 106$ 0.938 0.313 0.911 0.308 0.809 0.274
CostCA / 106$ 1.333 0.462 1.293 0.445 1.284 0.399
QHA / MW 0.407 0.407 0.305
CostHA /106$ 0.016 0.016 0.013
TAC / 106$ 1.810 1.754 1.696
OF / kJ/kmol 35098.7 37230.7 30398.9
* Luo’s process distillate molar purity for DIPE-rich product is below our specifications
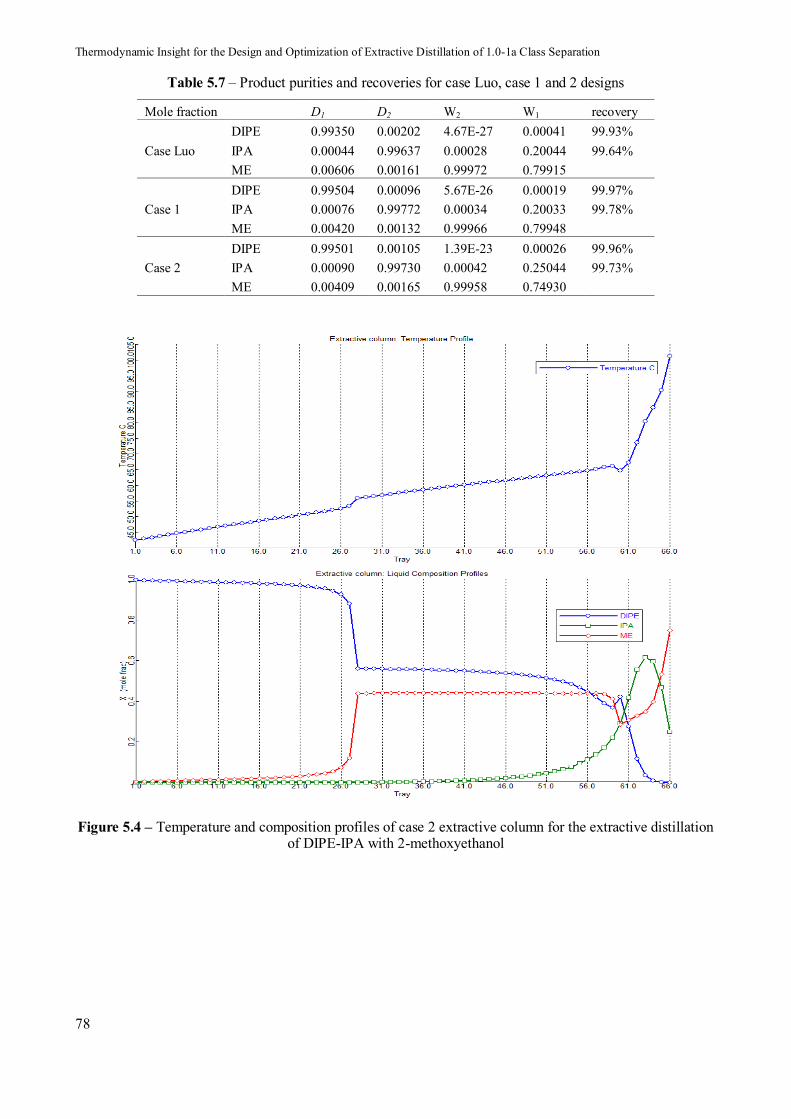
Thermodynamic Insight for the Design and Optimization of Extractive Distillation of 1.0-1a Class Separation
78
Table 5.7 – Product purities and recoveries for case Luo, case 1 and 2 designs
Mole fraction D1 D2 W2 W1 recovery
Case Luo DIPE 0.99350 0.00202 4.67E-27 0.00041 99.93% IPA 0.00044 0.99637 0.00028 0.20044 99.64% ME 0.00606 0.00161 0.99972 0.79915
Case 1 DIPE 0.99504 0.00096 5.67E-26 0.00019 99.97% IPA 0.00076 0.99772 0.00034 0.20033 99.78% ME 0.00420 0.00132 0.99966 0.79948
Case 2 DIPE 0.99501 0.00105 1.39E-23 0.00026 99.96% IPA 0.00090 0.99730 0.00042 0.25044 99.73% ME 0.00409 0.00165 0.99958 0.74930
Figure 5.4 – Temperature and composition profiles of case 2 extractive column for the extractive distillation of DIPE-IPA with 2-methoxyethanol
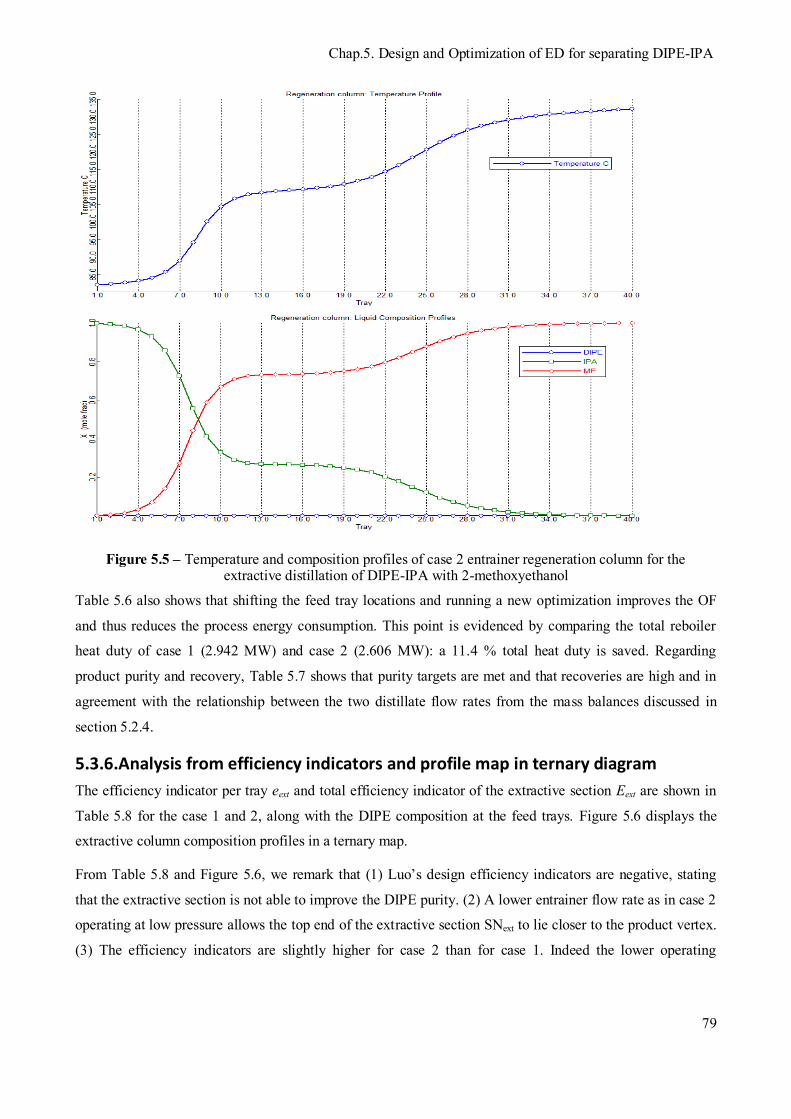
Chap.5. Design and Optimization of ED for separating DIPE-IPA
79
Figure 5.5 – Temperature and composition profiles of case 2 entrainer regeneration column for the extractive distillation of DIPE-IPA with 2-methoxyethanol
Table 5.6 also shows that shifting the feed tray locations and running a new optimization improves the OF
and thus reduces the process energy consumption. This point is evidenced by comparing the total reboiler
heat duty of case 1 (2.942 MW) and case 2 (2.606 MW): a 11.4 % total heat duty is saved. Regarding
product purity and recovery, Table 5.7 shows that purity targets are met and that recoveries are high and in
agreement with the relationship between the two distillate flow rates from the mass balances discussed in
section 5.2.4.
5.3.6.Analysis from efficiency indicators and profile map in ternary diagram
The efficiency indicator per tray eext and total efficiency indicator of the extractive section Eext are shown in
Table 5.8 for the case 1 and 2, along with the DIPE composition at the feed trays. Figure 5.6 displays the
extractive column composition profiles in a ternary map.
From Table 5.8 and Figure 5.6, we remark that (1) Luo’s design efficiency indicators are negative, stating
that the extractive section is not able to improve the DIPE purity. (2) A lower entrainer flow rate as in case 2
operating at low pressure allows the top end of the extractive section SNext to lie closer to the product vertex.
(3) The efficiency indicators are slightly higher for case 2 than for case 1. Indeed the lower operating
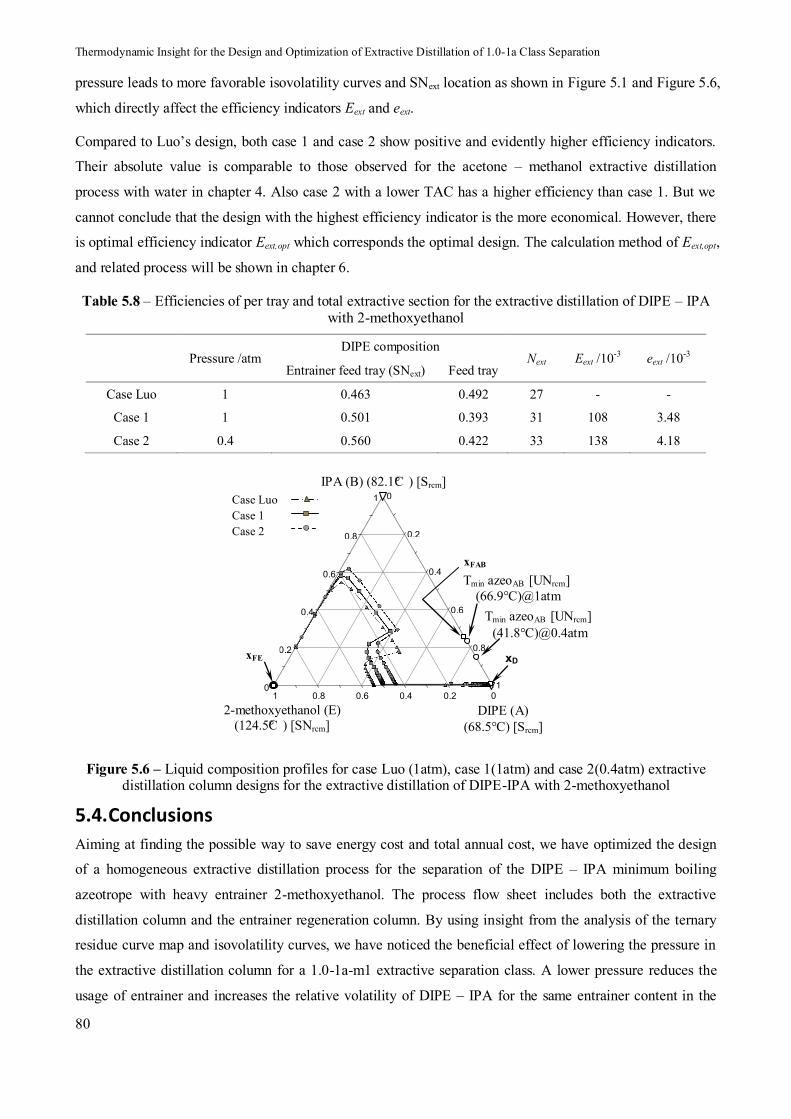
Thermodynamic Insight for the Design and Optimization of Extractive Distillation of 1.0-1a Class Separation
80
pressure leads to more favorable isovolatility curves and SNext location as shown in Figure 5.1 and Figure 5.6,
which directly affect the efficiency indicators Eext and eext.
Compared to Luo’s design, both case 1 and case 2 show positive and evidently higher efficiency indicators.
Their absolute value is comparable to those observed for the acetone – methanol extractive distillation
process with water in chapter 4. Also case 2 with a lower TAC has a higher efficiency than case 1. But we
cannot conclude that the design with the highest efficiency indicator is the more economical. However, there
is optimal efficiency indicator Eext,opt which corresponds the optimal design. The calculation method of Eext,opt,
and related process will be shown in chapter 6.
Table 5.8 – Efficiencies of per tray and total extractive section for the extractive distillation of DIPE – IPA with 2-methoxyethanol
Pressure /atm DIPE composition
Next Eext /10-3 eext /10-3 Entrainer feed tray (SNext) Feed tray
Case Luo 1 0.463 0.492 27 - -
Case 1 1 0.501 0.393 31 108 3.48
Case 2 0.4 0.560 0.422 33 138 4.18
1
0.8
0.6
0.4
0.2
0 1
0.8
0.6
0.4
0.2
0
1 0.8 0.6 0.4 0.2 0
2-methoxyethanol (E) (124.5°C ) [SNrcm]
DIPE (A) (68.5°C) [Srcm]
IPA (B) (82.1°C ) [Srcm]
Tmin azeoAB [UNrcm] (66.9°C)@1atm
xD
Tmin azeoAB [UNrcm]
(41.8°C)@0.4atm
Case Luo Case 1 Case 2
xFAB
xFE
Figure 5.6 – Liquid composition profiles for case Luo (1atm), case 1(1atm) and case 2(0.4atm) extractive distillation column designs for the extractive distillation of DIPE-IPA with 2-methoxyethanol
5.4.Conclusions
Aiming at finding the possible way to save energy cost and total annual cost, we have optimized the design
of a homogeneous extractive distillation process for the separation of the DIPE – IPA minimum boiling
azeotrope with heavy entrainer 2-methoxyethanol. The process flow sheet includes both the extractive
distillation column and the entrainer regeneration column. By using insight from the analysis of the ternary
residue curve map and isovolatility curves, we have noticed the beneficial effect of lowering the pressure in
the extractive distillation column for a 1.0-1a-m1 extractive separation class. A lower pressure reduces the
usage of entrainer and increases the relative volatility of DIPE – IPA for the same entrainer content in the
Chap.5. Design and Optimization of ED for separating DIPE-IPA
81
distillation region where the extractive column operates. A 0.4 atm pressure was selected to enable the use of
cheap cooling water in the condenser.
Then we have run an optimization aiming at minimizing the total energy consumption per product unit as
objective function OF. OF includes both products and both columns energy demands at boiler and condenser
and accounts for the price difference in heating and cooling energy and for the price difference in product
sales. Rigorous simulations in closed loop flow sheet were done in all cases. The total number of trays
identical to literature works of Luo et al. Other variables have been optimized; two distillates, entrainer flow
rate, reflux ratios, entrainer feed location and main feed location. The total annualized cost (TAC) was
calculated for all processes.
Thanks to the optimization scheme helped with thermodynamic insight analysis, double digit savings in
energy consumption has been achieved while TAC is also reduced. Three important issues have emerged.
First the reduction of the pressure is beneficial to the separation by extractive distillation. Second, the energy
cost function OF decreases when the distillate flow rate increases at constant purity. This phenomenon has
been explained by the relationship of two distillates through mass balance. Third, efficiency indicators of the
extractive section that describes the ability of the extractive section to discriminate the desired product
between the top and the bottom of the extractive section are relevant criterions to assess the performance of
an extractive distillation process design. We have shown that pressure reduction is a possible way to save
energy cost and total annual cost based on the thermodynamic insight gained from the ternary diagram
analysis. Further investigation of assessing the relation of the efficiency indicators on the process TAC and
total energy consumption will be shown in chapter 6.

Thermodynamic Insight for the Design and Optimization of Extractive Distillation of 1.0-1a Class Separation
82
Chap.6. Influence of Thermodynamic Efficiency on Extractive Distillation
83
Chapter 6. Influence of Thermodynamic
Efficiency on Extractive Distillation
Results in this chapter have been submitted to:
Aarticle: You, X., Rodriguez-Donis, I., Gerbaud, V., 2015. Influence of thermodynamic efficiency indicator
as an optimization criterion for extractive distillation acetone-methanol-water class 1.0-1a as case study. Ind.
Eng. Chem. Res.

Thermodynamic Insight for the Design and Optimization of Extractive Distillation of 1.0-1a Class Separation
84
6.Influence of thermodynamic efficiency on extractive distillation acetone-methanol with water
6.1.Introduction
As a common method applied in industry for separating azeotropic or low relative volatility liquid mixtures,
extractive distillation is becoming a more and more important separation method in petrochemical
engineering because of the saving both energy cost and capital cost (Doherty and Knapp, 1993; Luyben,
2006).
In this chapter, the configuration of continuous extractive distillation enabling a direct split suitable for the
acetone-methanol minimum boiling azeotrope mixture separation with a heavy entrainer water (class 1.0-1a)
(Gerbaud and Rodriguez-Donis, 2014) is used shown in Figure 3.3a in chapter 3
In chapter 4, we intended to assess the engineering and physical meaning of an optimal extractive distillation
design based on the knowledge of thermodynamic insights from the residue curve map and univolatility line
for extractive distillation. We ran the optimization by using the four steps procedure (You et al., 2015). The
optimization process led to significant savings in energy consumption and TAC compared to literature values
thanks to the low pressure in extractive column and optimization scheme helped with thermodynamic insight
analysis. Comparing with literature design, we defined and analyzed them based on the total extractive
efficiency and the extractive efficiency per tray that describe the ability of the extractive section to
discriminate the product between the top and bottom of that section. For comparison, we fixed the total
number of trays as they were proposed in Luyben’s design. (Luyben, 2008, 2006).
In this chapter, we investigate if the optimization of extractive distillation can be run satisfactorily with the
thermodynamic efficiency indicator Eext and eext, and no need the good initial value. A multi-objectives
genetic algorithm is used with energy cost, TAC, Eext and eext.
6.2.Optimal methods
6.2.1.Non-Sorted Genetic Algorithm as Process optimization technique
Compared with other methods mentioned in section 6.1, the genetic algorithms are attractive in solving
optimization problems with modular process simulators due to the following characteristics. First, the
knowledge of initial feasible points is not required and the initial points do not influence the final solution as
the search for optimal solution in genetic algorithm is not limited to one point but rather it relies on several
points simultaneously (Leboreiro and Acevedo, 2004). Second, in Non-Sorted Genetic Algorithm (NSGA), it
is not necessary to have explicit information of the mathematical model or its derivatives because the
algorithms are based on a direct search method.
Chap.6. Influence of Thermodynamic Efficiency on Extractive Distillation
85
NSGA has been implemented in Excel with visual basic for applications (VBA) programming by our
colleagues (Gomez et al., 2010), named genetic algorithm library MULTIGEN. It can handle multi-objective
constrained optimization problems involving mixed variables (boolean, integer, real) and some of these
problems can be related to process structural optimization. Constraints as well as Pareto domination
principles can be handled by the algorithms. Non-Sorted Genetic Algorithm II (NSGAII) is the method we
used. NSGAII is based on a ranking procedure, where the rank of each solution is defined as the rank of the
Pareto front to which it belongs. The diversity of non-dominated solutions is guaranteed by using a crowding
distance measurement, which is an estimation of the size of the largest cuboids enclosing a given solution
without including any other. This crowding sorting avoids the use of the sharing parameter used in the
previous version of the NSGA algorithm (Gomez et al., 2010).
The stable link between Excel and Aspen Plus was coded in VBA, as was done by (Vázquez-Ojeda et al.,
2013). The node of variables such as tray number of column, reflux ratio and so on, are found by Aspen plus
tools named variable explorer. The simulation is run by using the MESH model Radfrac in Aspen Plus.
For NSGA method, a set of optimal designs called Pareto front will be obtained as the results instead of only
one optimal design by other methods. As stochastic optimization methods, NSGA is generally robust
numerical tools and it presents a reasonable computational effort in the optimization of multivariable
functions (Bravo-Bravo et al., 2010). Besides, it can be applicable to unknown structure problems, requiring
only calculations of the objective function, and also can be used with all models without problem
reformulation (Teh and Rangaiah, 2003).
6.2.2. Advantages of NSGA for the design of extractive distillation process compared with SQP
Compared with SQP optimization solver, NSGA brings advantages. First, there is no need to found a good
initial value to guarantee the optimization process to be converged successfully. Second, we no longer have
to choose two important aspects in extractive distillation: the choice of distillate flow rates, and the choice of
open loop or closed loop flow sheet. (1) Earlier, we chose the two distillate flow rates by sensitivity analysis
(You et al., 2015, 2014) because their effects on the achievable product purity are strongly non-linear. (2)
The open loop flow sheet does not connect the recycled entrainer and the fresh entrainer feed. However, the
closed loop flow sheet can be directly used in NSGA, and the effect of impurity in the recycled entrainer on
the product purity is readily handled.
6.2.3.Objective functions
We minimize the total process energy consumption by using the objective function OF as in chapter before.
With the use of OF, the two columns in the extractive distillation process are evaluated simultaneously. Only
the two product purities are regarded as constraints, and not the recycling entrainer purity thanks to the use of
NSGA in closed loop flow sheet, see Figure 3.3 in chapter 3.
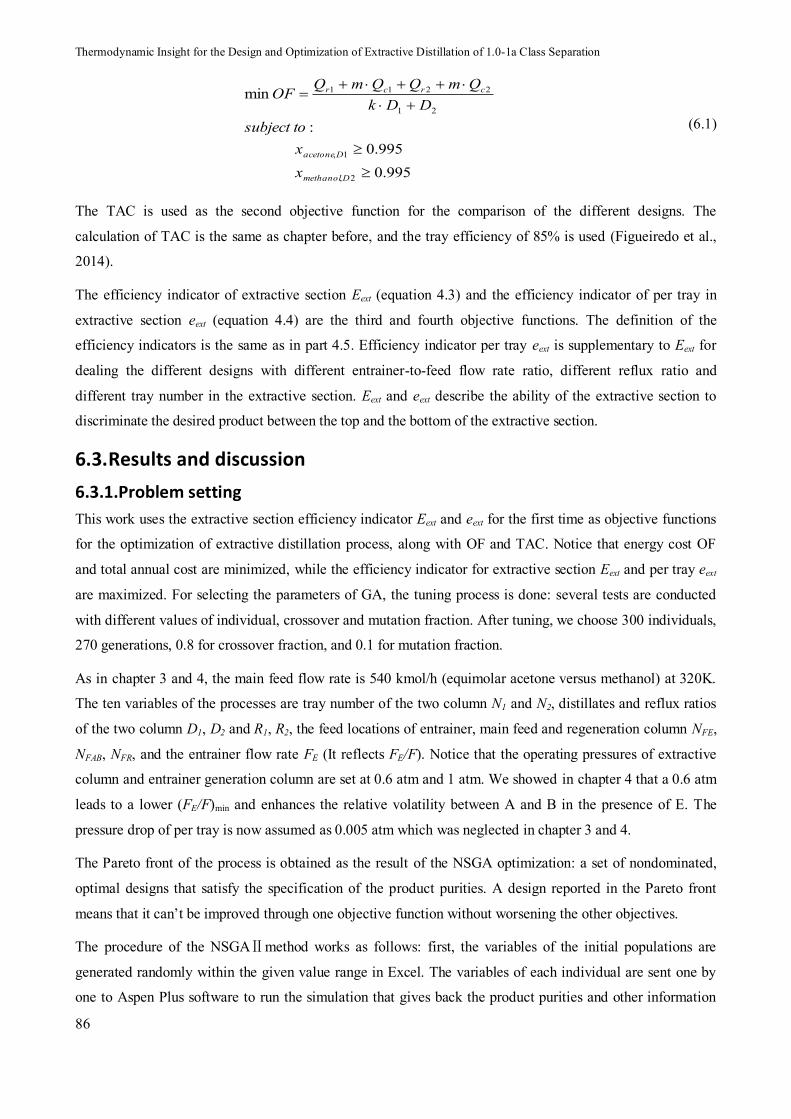
Thermodynamic Insight for the Design and Optimization of Extractive Distillation of 1.0-1a Class Separation
86
995.0995.0
:
min
2,
1,
21
2211
Dmethanol
Dacetone
crcr
xxtosubject
DDkQmQQmQ
OF
(6.1)
The TAC is used as the second objective function for the comparison of the different designs. The
calculation of TAC is the same as chapter before, and the tray efficiency of 85% is used (Figueiredo et al.,
2014).
The efficiency indicator of extractive section Eext (equation 4.3) and the efficiency indicator of per tray in
extractive section eext (equation 4.4) are the third and fourth objective functions. The definition of the
efficiency indicators is the same as in part 4.5. Efficiency indicator per tray eext is supplementary to Eext for
dealing the different designs with different entrainer-to-feed flow rate ratio, different reflux ratio and
different tray number in the extractive section. Eext and eext describe the ability of the extractive section to
discriminate the desired product between the top and the bottom of the extractive section.
6.3.Results and discussion
6.3.1.Problem setting
This work uses the extractive section efficiency indicator Eext and eext for the first time as objective functions
for the optimization of extractive distillation process, along with OF and TAC. Notice that energy cost OF
and total annual cost are minimized, while the efficiency indicator for extractive section Eext and per tray eext
are maximized. For selecting the parameters of GA, the tuning process is done: several tests are conducted
with different values of individual, crossover and mutation fraction. After tuning, we choose 300 individuals,
270 generations, 0.8 for crossover fraction, and 0.1 for mutation fraction.
As in chapter 3 and 4, the main feed flow rate is 540 kmol/h (equimolar acetone versus methanol) at 320K.
The ten variables of the processes are tray number of the two column N1 and N2, distillates and reflux ratios
of the two column D1, D2 and R1, R2, the feed locations of entrainer, main feed and regeneration column NFE,
NFAB, NFR, and the entrainer flow rate FE (It reflects FE/F). Notice that the operating pressures of extractive
column and entrainer generation column are set at 0.6 atm and 1 atm. We showed in chapter 4 that a 0.6 atm
leads to a lower (FE/F)min and enhances the relative volatility between A and B in the presence of E. The
pressure drop of per tray is now assumed as 0.005 atm which was neglected in chapter 3 and 4.
The Pareto front of the process is obtained as the result of the NSGA optimization: a set of nondominated,
optimal designs that satisfy the specification of the product purities. A design reported in the Pareto front
means that it can’t be improved through one objective function without worsening the other objectives.
The procedure of the NSGAⅡmethod works as follows: first, the variables of the initial populations are
generated randomly within the given value range in Excel. The variables of each individual are sent one by
one to Aspen Plus software to run the simulation that gives back the product purities and other information
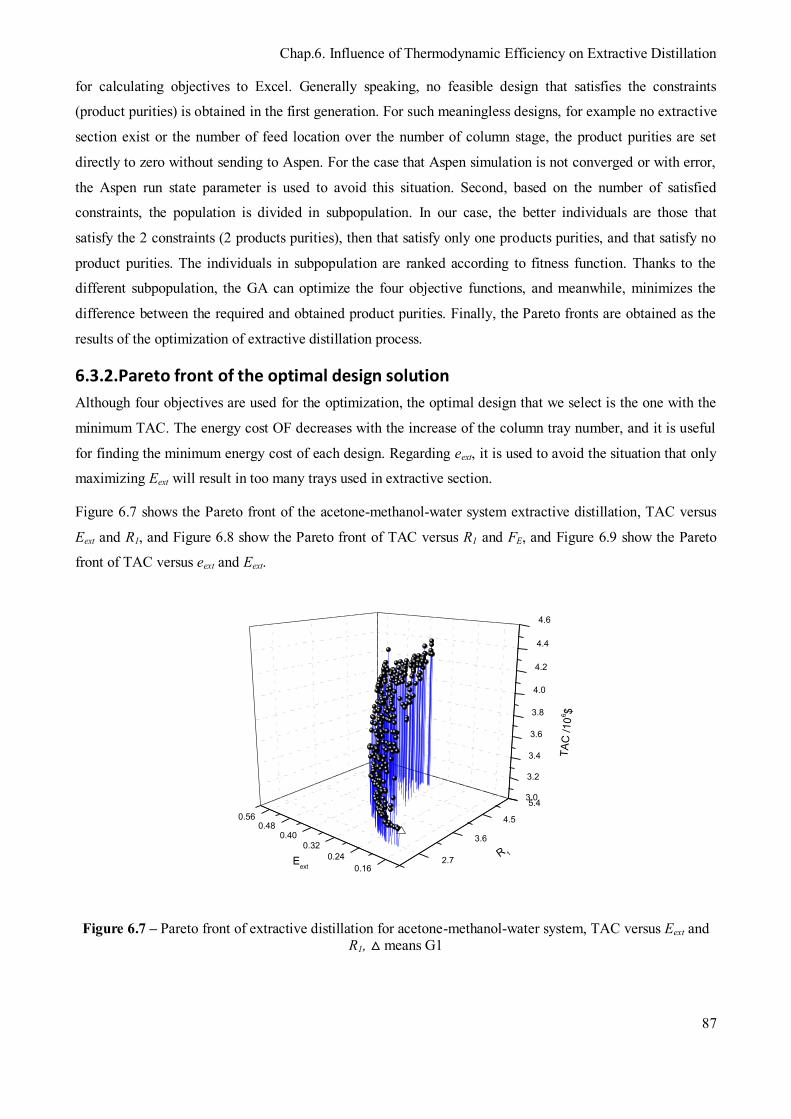
Chap.6. Influence of Thermodynamic Efficiency on Extractive Distillation
87
for calculating objectives to Excel. Generally speaking, no feasible design that satisfies the constraints
(product purities) is obtained in the first generation. For such meaningless designs, for example no extractive
section exist or the number of feed location over the number of column stage, the product purities are set
directly to zero without sending to Aspen. For the case that Aspen simulation is not converged or with error,
the Aspen run state parameter is used to avoid this situation. Second, based on the number of satisfied
constraints, the population is divided in subpopulation. In our case, the better individuals are those that
satisfy the 2 constraints (2 products purities), then that satisfy only one products purities, and that satisfy no
product purities. The individuals in subpopulation are ranked according to fitness function. Thanks to the
different subpopulation, the GA can optimize the four objective functions, and meanwhile, minimizes the
difference between the required and obtained product purities. Finally, the Pareto fronts are obtained as the
results of the optimization of extractive distillation process.
6.3.2.Pareto front of the optimal design solution
Although four objectives are used for the optimization, the optimal design that we select is the one with the
minimum TAC. The energy cost OF decreases with the increase of the column tray number, and it is useful
for finding the minimum energy cost of each design. Regarding eext, it is used to avoid the situation that only
maximizing Eext will result in too many trays used in extractive section.
Figure 6.7 shows the Pareto front of the acetone-methanol-water system extractive distillation, TAC versus
Eext and R1, and Figure 6.8 show the Pareto front of TAC versus R1 and FE, and Figure 6.9 show the Pareto
front of TAC versus eext and Eext.
2.7
3.6
4.5
5.4
0.16
0.24
0.320.40
0.480.56
3.0
3.2
3.4
3.6
3.8
4.0
4.2
4.4
4.6
TA
C /1
06 $
R 1
Eext
Figure 6.7 – Pareto front of extractive distillation for acetone-methanol-water system, TAC versus Eext and R1, △ means G1
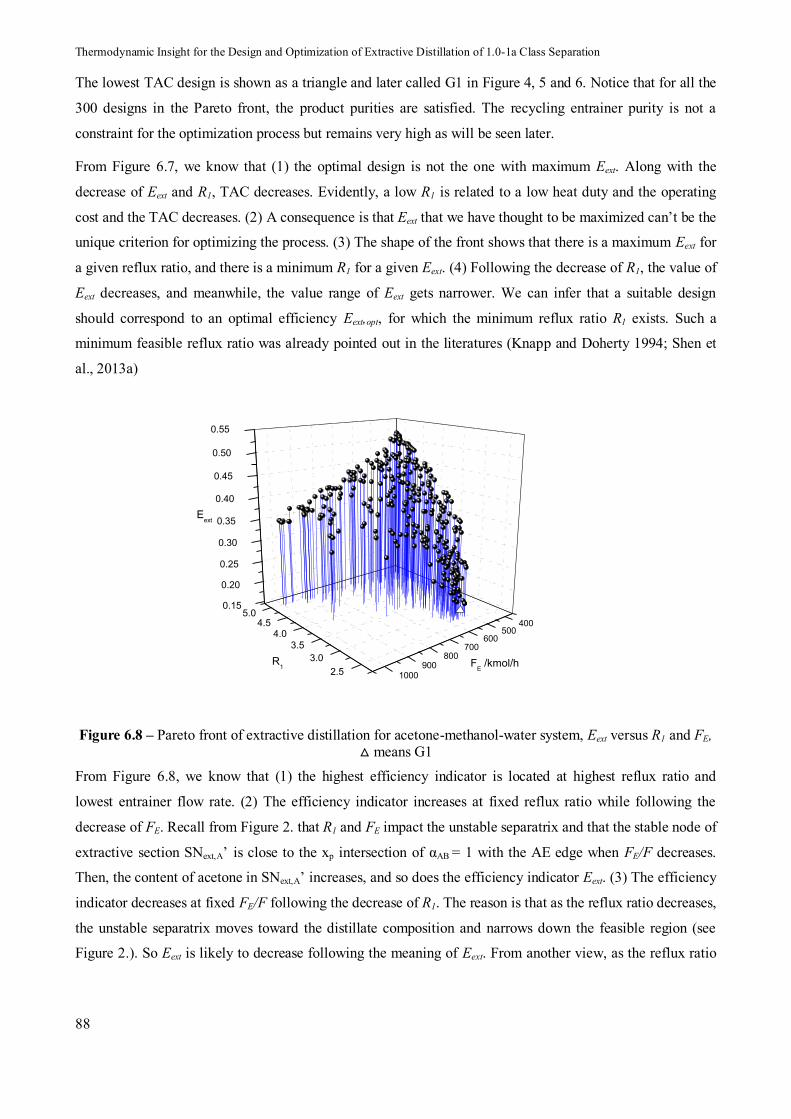
Thermodynamic Insight for the Design and Optimization of Extractive Distillation of 1.0-1a Class Separation
88
The lowest TAC design is shown as a triangle and later called G1 in Figure 4, 5 and 6. Notice that for all the
300 designs in the Pareto front, the product purities are satisfied. The recycling entrainer purity is not a
constraint for the optimization process but remains very high as will be seen later.
From Figure 6.7, we know that (1) the optimal design is not the one with maximum Eext. Along with the
decrease of Eext and R1, TAC decreases. Evidently, a low R1 is related to a low heat duty and the operating
cost and the TAC decreases. (2) A consequence is that Eext that we have thought to be maximized can’t be the
unique criterion for optimizing the process. (3) The shape of the front shows that there is a maximum Eext for
a given reflux ratio, and there is a minimum R1 for a given Eext. (4) Following the decrease of R1, the value of
Eext decreases, and meanwhile, the value range of Eext gets narrower. We can infer that a suitable design
should correspond to an optimal efficiency Eext,opt, for which the minimum reflux ratio R1 exists. Such a
minimum feasible reflux ratio was already pointed out in the literatures (Knapp and Doherty 1994; Shen et
al., 2013a)
400500
600700
800900
10002.5
3.0
3.5
4.04.5
5.00.15
0.20
0.25
0.30
0.35
0.40
0.45
0.50
0.55
R1 F
E /kmol/h
Eext
Figure 6.8 – Pareto front of extractive distillation for acetone-methanol-water system, Eext versus R1 and FE, △ means G1
From Figure 6.8, we know that (1) the highest efficiency indicator is located at highest reflux ratio and
lowest entrainer flow rate. (2) The efficiency indicator increases at fixed reflux ratio while following the
decrease of FE. Recall from Figure 2. that R1 and FE impact the unstable separatrix and that the stable node of
extractive section SNext,A’ is close to the xp intersection of αAB = 1 with the AE edge when FE/F decreases.
Then, the content of acetone in SNext,A’ increases, and so does the efficiency indicator Eext. (3) The efficiency
indicator decreases at fixed FE/F following the decrease of R1. The reason is that as the reflux ratio decreases,
the unstable separatrix moves toward the distillate composition and narrows down the feasible region (see
Figure 2.). So Eext is likely to decrease following the meaning of Eext. From another view, as the reflux ratio
Chap.6. Influence of Thermodynamic Efficiency on Extractive Distillation
89
decreases for a fixed distillate, the liquid flow rate from column top to the main feed tray decrease, leading to
the acetone content on the main feed tray to increase relatively, so Eext decreases following its definition.
2.4
3.2
4.0
4.8
4005006007008009001000
3.0
3.5
4.0
4.5
TA
C /1
06$
R1
FE /kmol/h
Figure 6.9 – Pareto front of extractive distillation for acetone-methanol-water system, TAC versus R1 and FE, △ means G1
From Figure 6.9, we know that (1) there are only a few points belonging to the Pareto front in the region of
reflux ratio R1 lower than 4 and entrainer flow FE higher than 700 kmol/h. At a relatively high entrainer flow
rate, the separating cost in regeneration column increases. Then, TAC increases compared with the design at
a more suitable entrainer flow rate, leading to fewer designs in this region to be ranked in the Pareto front. (2)
At low FE (400-500 kmol/h) and reflux ratio (2.4-2.8), no design is ranked. For these values, the
specification of product purities is difficult to achieve for finite tray number. (3) Finally for the value P1 =
0.6 atm that we chose, an economical feasible value range of the entrainer flow rate is (450 – 650 kmol/h),
namely (0.83 - 1.2) for FE/F.
6.3.3.Insight on the Pareto front shape from the ternary map with extractive profile
In order to further understand the effect of the efficiency indicator Eext on the process, we extract from Figure
6.7 the relation map of Eext and TAC and analyze some designs from Pareto front, namely G1-G6, as shown
in Figure 6.10. G1, G3, G4 and G6 are chosen on the upper border of the Pareto front. G2 has a TAC close to
that of G3 but exhibits a lower thermodynamic efficiency Eext. G5 has the same Eext than G4 but a much
higher TAC. Table 6.1 shows the design variables of G1-G6 and Table 6.2 provides the sizing parameters
and cost data.
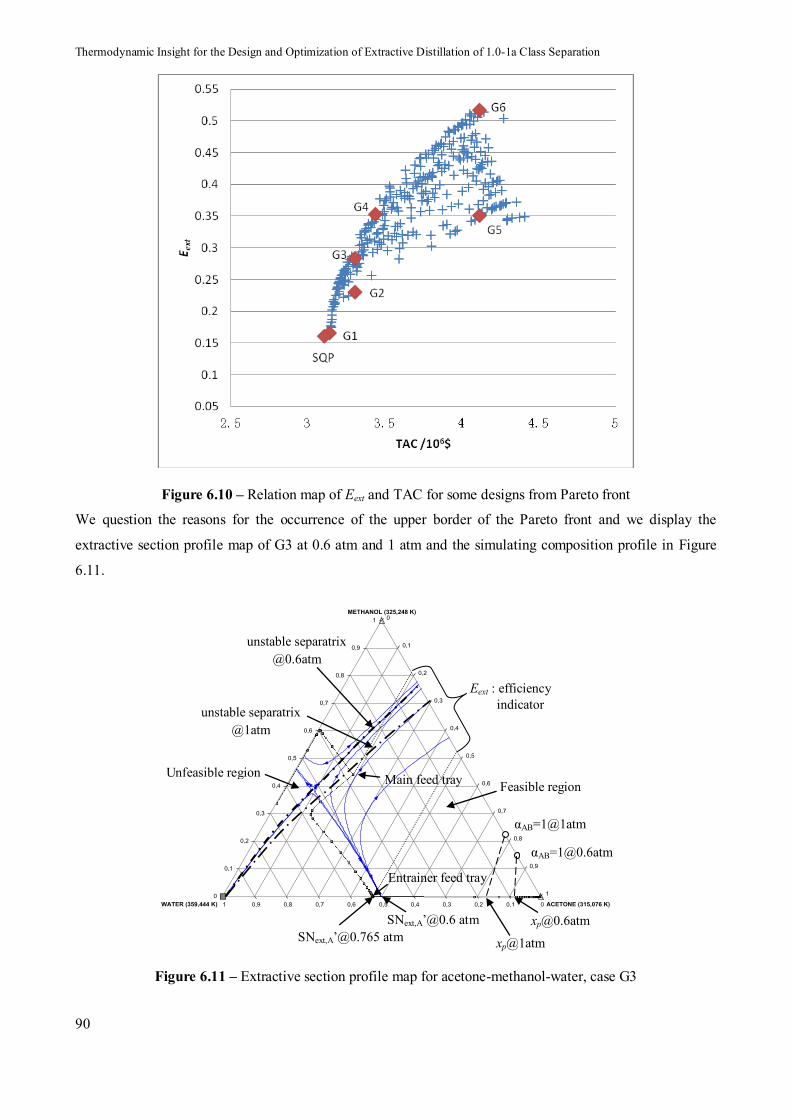
Thermodynamic Insight for the Design and Optimization of Extractive Distillation of 1.0-1a Class Separation
90
Figure 6.10 – Relation map of Eext and TAC for some designs from Pareto front
We question the reasons for the occurrence of the upper border of the Pareto front and we display the
extractive section profile map of G3 at 0.6 atm and 1 atm and the simulating composition profile in Figure
6.11.
αAB=1@1atm
unstable separatrix @1atm
unstable separatrix @0.6atm
Eext : efficiency indicator
SNext,A’@0.6 atm SNext,A’@0.765 atm
Unfeasible region Feasible region Main feed tray
Entrainer feed tray
xp@1atm
Figure 6.11 – Extractive section profile map for acetone-methanol-water, case G3
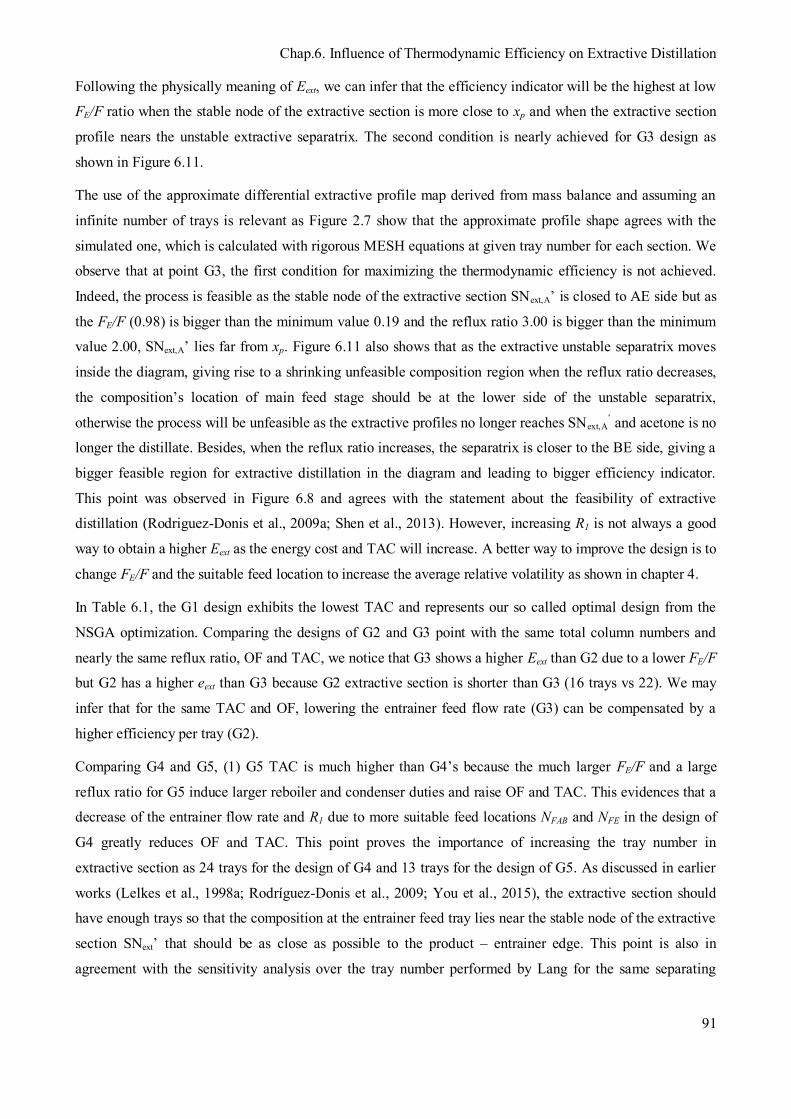
Chap.6. Influence of Thermodynamic Efficiency on Extractive Distillation
91
Following the physically meaning of Eext, we can infer that the efficiency indicator will be the highest at low
FE/F ratio when the stable node of the extractive section is more close to xp and when the extractive section
profile nears the unstable extractive separatrix. The second condition is nearly achieved for G3 design as
shown in Figure 6.11.
The use of the approximate differential extractive profile map derived from mass balance and assuming an
infinite number of trays is relevant as Figure 2.7 show that the approximate profile shape agrees with the
simulated one, which is calculated with rigorous MESH equations at given tray number for each section. We
observe that at point G3, the first condition for maximizing the thermodynamic efficiency is not achieved.
Indeed, the process is feasible as the stable node of the extractive section SNext,A’ is closed to AE side but as
the FE/F (0.98) is bigger than the minimum value 0.19 and the reflux ratio 3.00 is bigger than the minimum
value 2.00, SNext,A’ lies far from xp. Figure 6.11 also shows that as the extractive unstable separatrix moves
inside the diagram, giving rise to a shrinking unfeasible composition region when the reflux ratio decreases,
the composition’s location of main feed stage should be at the lower side of the unstable separatrix,
otherwise the process will be unfeasible as the extractive profiles no longer reaches SNext,A’ and acetone is no
longer the distillate. Besides, when the reflux ratio increases, the separatrix is closer to the BE side, giving a
bigger feasible region for extractive distillation in the diagram and leading to bigger efficiency indicator.
This point was observed in Figure 6.8 and agrees with the statement about the feasibility of extractive
distillation (Rodriguez-Donis et al., 2009a; Shen et al., 2013). However, increasing R1 is not always a good
way to obtain a higher Eext as the energy cost and TAC will increase. A better way to improve the design is to
change FE/F and the suitable feed location to increase the average relative volatility as shown in chapter 4.
In Table 6.1, the G1 design exhibits the lowest TAC and represents our so called optimal design from the
NSGA optimization. Comparing the designs of G2 and G3 point with the same total column numbers and
nearly the same reflux ratio, OF and TAC, we notice that G3 shows a higher Eext than G2 due to a lower FE/F
but G2 has a higher eext than G3 because G2 extractive section is shorter than G3 (16 trays vs 22). We may
infer that for the same TAC and OF, lowering the entrainer feed flow rate (G3) can be compensated by a
higher efficiency per tray (G2).
Comparing G4 and G5, (1) G5 TAC is much higher than G4’s because the much larger FE/F and a large
reflux ratio for G5 induce larger reboiler and condenser duties and raise OF and TAC. This evidences that a
decrease of the entrainer flow rate and R1 due to more suitable feed locations NFAB and NFE in the design of
G4 greatly reduces OF and TAC. This point proves the importance of increasing the tray number in
extractive section as 24 trays for the design of G4 and 13 trays for the design of G5. As discussed in earlier
works (Lelkes et al., 1998a; Rodríguez-Donis et al., 2009; You et al., 2015), the extractive section should
have enough trays so that the composition at the entrainer feed tray lies near the stable node of the extractive
section SNext’ that should be as close as possible to the product – entrainer edge. This point is also in
agreement with the sensitivity analysis over the tray number performed by Lang for the same separating
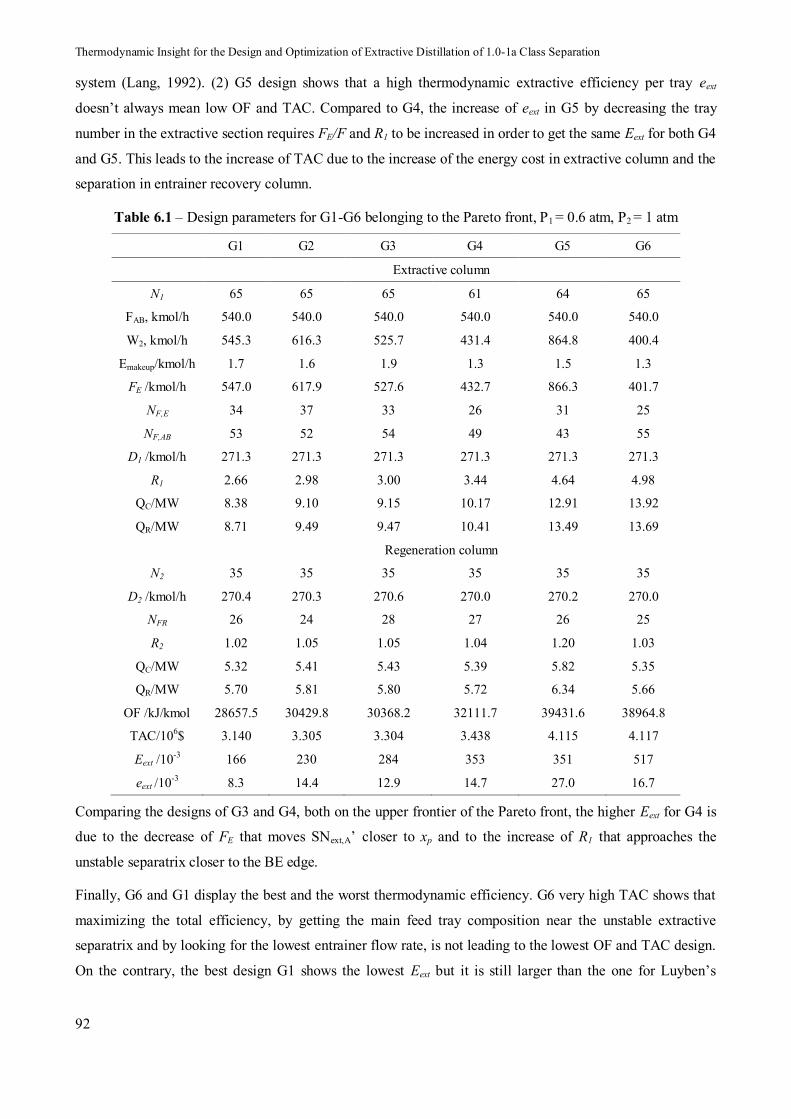
Thermodynamic Insight for the Design and Optimization of Extractive Distillation of 1.0-1a Class Separation
92
system (Lang, 1992). (2) G5 design shows that a high thermodynamic extractive efficiency per tray eext
doesn’t always mean low OF and TAC. Compared to G4, the increase of eext in G5 by decreasing the tray
number in the extractive section requires FE/F and R1 to be increased in order to get the same Eext for both G4
and G5. This leads to the increase of TAC due to the increase of the energy cost in extractive column and the
separation in entrainer recovery column.
Table 6.1 – Design parameters for G1-G6 belonging to the Pareto front, P1 = 0.6 atm, P2 = 1 atm
G1 G2 G3 G4 G5 G6
Extractive column
N1 65 65 65 61 64 65
FAB, kmol/h 540.0 540.0 540.0 540.0 540.0 540.0
W2, kmol/h 545.3 616.3 525.7 431.4 864.8 400.4
Emakeup/kmol/h 1.7 1.6 1.9 1.3 1.5 1.3
FE /kmol/h 547.0 617.9 527.6 432.7 866.3 401.7
NF,E 34 37 33 26 31 25
NF,AB 53 52 54 49 43 55
D1 /kmol/h 271.3 271.3 271.3 271.3 271.3 271.3
R1 2.66 2.98 3.00 3.44 4.64 4.98
QC/MW 8.38 9.10 9.15 10.17 12.91 13.92
QR/MW 8.71 9.49 9.47 10.41 13.49 13.69
Regeneration column
N2 35 35 35 35 35 35
D2 /kmol/h 270.4 270.3 270.6 270.0 270.2 270.0
NFR 26 24 28 27 26 25
R2 1.02 1.05 1.05 1.04 1.20 1.03
QC/MW 5.32 5.41 5.43 5.39 5.82 5.35
QR/MW 5.70 5.81 5.80 5.72 6.34 5.66
OF /kJ/kmol 28657.5 30429.8 30368.2 32111.7 39431.6 38964.8
TAC/106$ 3.140 3.305 3.304 3.438 4.115 4.117
Eext /10-3 166 230 284 353 351 517
eext /10-3 8.3 14.4 12.9 14.7 27.0 16.7
Comparing the designs of G3 and G4, both on the upper frontier of the Pareto front, the higher Eext for G4 is
due to the decrease of FE that moves SNext,A’ closer to xp and to the increase of R1 that approaches the
unstable separatrix closer to the BE edge.
Finally, G6 and G1 display the best and the worst thermodynamic efficiency. G6 very high TAC shows that
maximizing the total efficiency, by getting the main feed tray composition near the unstable extractive
separatrix and by looking for the lowest entrainer flow rate, is not leading to the lowest OF and TAC design.
On the contrary, the best design G1 shows the lowest Eext but it is still larger than the one for Luyben’s

Chap.6. Influence of Thermodynamic Efficiency on Extractive Distillation
93
design, Eext = 55×10-3, and close to that of Knapp and Doherty’s design (Knapp and Doherty, 1990), Eext =
160×10-3, as we discussed in chapter 4.
Table 6.2 – Sizing parameters for the columns and cost data of the design G1-G6 belonging to Pareto front
G1 G2 G3 G4 G5 G6
Extractive column
Diameter /m 2.825 2.954 2.962 3.135 3.564 3.679
Height /m 45.72 45.72 45.72 42.68 44.50 45.72
ICS /106$ 1.462 1.533 1.538 1.546 1.833 1.937
AC /m2 878 954 959 1066 1353 1435
AR /m2 441 480 479 527 683 704
IHE /106$ 1.257 1.328 1.330 1.421 1.668 1.720
Costcap /106$ 3.044 3.210 3.218 3.323 3.954 4.147
Costope /106$ 1.033 1.125 1.124 1.236 1.600 1.652
CostCA /106$ 2.048 2.195 2.196 2.344 2.918 3.034
Regeneration column
Diameter /m 1.614 1.626 1.630 1.625 1.689 1.618
Height /m 23.78 23.78 23.78 23.78 23.78 23.78
ICS /106$ 0.477 0.480 0.482 0.480 0.500 0.478
AC /m2 183 185 186 185 200 184
AR /m2 289 294 294 290 321 286
IHE /106$ 0.648 0.656 0.656 0.652 0.691 0.647
Costcap /106$ 1.196 1.208 1.210 1.203 1.268 1.`96
Costope /106$ 0.675 0.689 0.687 0.678 0.750 0.671
CostCA /106$ 1.074 1.091 1.091 1.079 1.173 1.069
QHA/MW 0.67 0.76 0.65 0.53 1.06 0.491
CostHA /106$ 0.018 0.019 0.017 0.015 0.024 0.014
Figure 6.12 displays the extractive section profile map and the simulation composition profile for G1. The
beginning point of the extractive section (at main feed tray) in the design of G1 (see Figure 6.12) is not as
close to the unstable separatrix as would have been expected from the design of G3 (see Figure 6.11) and Eext
is consequently lower. The reasonable explanation is that during optimization procedure of NSGA with
maximizing Eext, the effect of reflux ratio (R1) is a dominant variable to reduce OF and TAC. When Eext is
closer to its optimal value Eext,opt, the effect of R1 become weak, and meanwhile the effect of other variables
(entrainer flow rate, entrainer and main feed locations) become more obvious, leading to that a design with
much lower TAC and the beginning point away from unstable separatrix. This phenomenon proves that
finding an optimal design can’t only upon the sole maximization of Eext, but that optimization is much
needed for a given R1 and FE.
Thermodynamic Insight for the Design and Optimization of Extractive Distillation of 1.0-1a Class Separation
94
Unstable separatrix @ 0.6 atm
SNext’@ 0.6 atm SNext’@ 0.765 atm
Main feed tray
Entrainer feed tray
xp@ 0.6 atm
Figure 6.12 – Extractive section profile map for acetone-methanol-water, case G1
This answers our initial question and tempers our optimism displayed in our previous work: we cannot use
the thermodynamic efficiency indicator alone to optimize the extractive distillation process for the 1.0-1a
class and there likely exist an optimal Eext,opt near G1’s values that we now verify.
6.3.4.Further improvement of GA optimal design
The results shown in Pareto front are obtained through the optimization of the four objective functions, but in
practice the design with the lowest TAC is the most favorable one. So we select the design of G1 which has
the lowest TAC as initial design to run a further optimization by SQP method in order to appreciate the
ability of the NSGA to find an optimal solution. The results are shown in Table 6.3 namely case SQP.
Besides, in order to compare fairly with our previous design in chapter 4 (N1 = 57, N2 = 26) namely case 3opt
where a 100% tray efficiency was assumed and the pressure drop per tray was neglected, we now optimize it
as case 3opt’ under 85% tray efficiency and a 0.005 atm pressure drop per tray.
The four-step procedure stated in chapter 4 is used. The single objective function for the SQP optimization is
OF and is based on the same column tray number (N1 = 57, N2 = 26) for Case 3opt’ and (N1 = 65, N2 = 35) for
Case SQP. The other 8 variables are optimized by SQP through minimizing OF. TAC and two efficiency
indicators are calculated afterwards. The design and operating variables are shown in Table 6.3 and Table 6.4,
referring to the flow sheet notations in Figure 3.3 in chapter 3. Table 6.5displays the product purity and
recovery values.
With the same number of trays than Luyben and Knapp and Doherty’s design but with stricter product purity
constraints, Table 6.3 shows that Case 3opt in chapter 4 represented a great improvement over Luyben’s
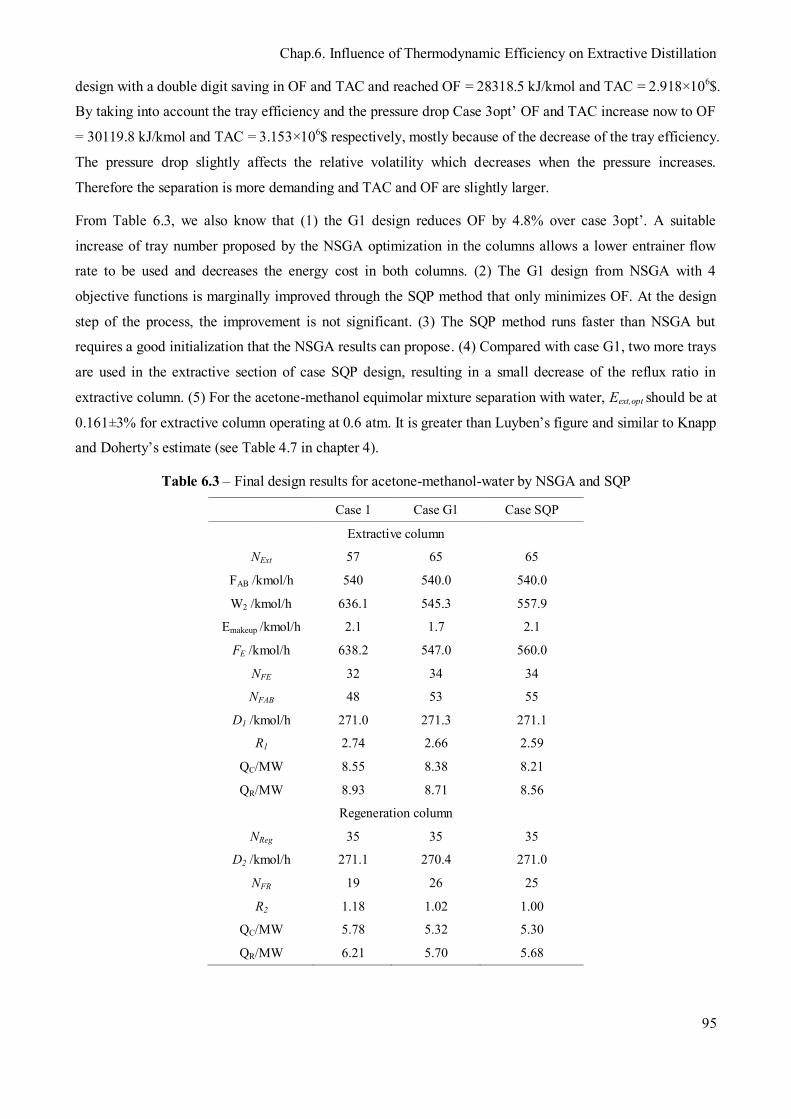
Chap.6. Influence of Thermodynamic Efficiency on Extractive Distillation
95
design with a double digit saving in OF and TAC and reached OF = 28318.5 kJ/kmol and TAC = 2.918×10⁶$.
By taking into account the tray efficiency and the pressure drop Case 3opt’ OF and TAC increase now to OF
= 30119.8 kJ/kmol and TAC = 3.153×10⁶$ respectively, mostly because of the decrease of the tray efficiency.
The pressure drop slightly affects the relative volatility which decreases when the pressure increases.
Therefore the separation is more demanding and TAC and OF are slightly larger.
From Table 6.3, we also know that (1) the G1 design reduces OF by 4.8% over case 3opt’. A suitable
increase of tray number proposed by the NSGA optimization in the columns allows a lower entrainer flow
rate to be used and decreases the energy cost in both columns. (2) The G1 design from NSGA with 4
objective functions is marginally improved through the SQP method that only minimizes OF. At the design
step of the process, the improvement is not significant. (3) The SQP method runs faster than NSGA but
requires a good initialization that the NSGA results can propose. (4) Compared with case G1, two more trays
are used in the extractive section of case SQP design, resulting in a small decrease of the reflux ratio in
extractive column. (5) For the acetone-methanol equimolar mixture separation with water, Eext,opt should be at
0.161±3% for extractive column operating at 0.6 atm. It is greater than Luyben’s figure and similar to Knapp
and Doherty’s estimate (see Table 4.7 in chapter 4).
Table 6.3 – Final design results for acetone-methanol-water by NSGA and SQP
Case 1 Case G1 Case SQP
Extractive column
NExt 57 65 65
FAB /kmol/h 540 540.0 540.0
W2 /kmol/h 636.1 545.3 557.9
Emakeup /kmol/h 2.1 1.7 2.1
FE /kmol/h 638.2 547.0 560.0
NFE 32 34 34
NFAB 48 53 55
D1 /kmol/h 271.0 271.3 271.1
R1 2.74 2.66 2.59
QC/MW 8.55 8.38 8.21
QR/MW 8.93 8.71 8.56
Regeneration column
NReg 35 35 35
D2 /kmol/h 271.1 270.4 271.0
NFR 19 26 25
R2 1.18 1.02 1.00
QC/MW 5.78 5.32 5.30
QR/MW 6.21 5.70 5.68
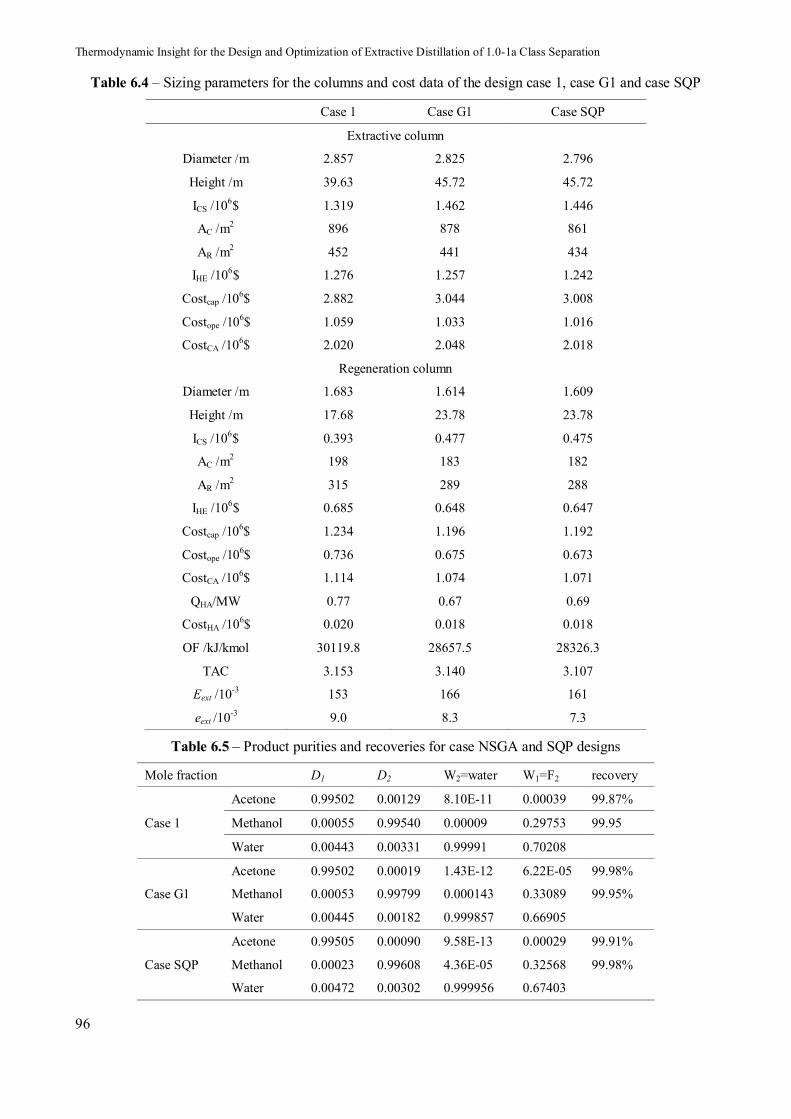
Thermodynamic Insight for the Design and Optimization of Extractive Distillation of 1.0-1a Class Separation
96
Table 6.4 – Sizing parameters for the columns and cost data of the design case 1, case G1 and case SQP
Case 1 Case G1 Case SQP
Extractive column
Diameter /m 2.857 2.825 2.796
Height /m 39.63 45.72 45.72
ICS /106$ 1.319 1.462 1.446
AC /m2 896 878 861
AR /m2 452 441 434
IHE /106$ 1.276 1.257 1.242
Costcap /106$ 2.882 3.044 3.008
Costope /106$ 1.059 1.033 1.016
CostCA /106$ 2.020 2.048 2.018
Regeneration column
Diameter /m 1.683 1.614 1.609
Height /m 17.68 23.78 23.78
ICS /106$ 0.393 0.477 0.475
AC /m2 198 183 182
AR /m2 315 289 288
IHE /106$ 0.685 0.648 0.647
Costcap /106$ 1.234 1.196 1.192
Costope /106$ 0.736 0.675 0.673
CostCA /106$ 1.114 1.074 1.071
QHA/MW 0.77 0.67 0.69
CostHA /106$ 0.020 0.018 0.018
OF /kJ/kmol 30119.8 28657.5 28326.3
TAC 3.153 3.140 3.107
Eext /10-3 153 166 161
eext /10-3 9.0 8.3 7.3
Table 6.5 – Product purities and recoveries for case NSGA and SQP designs
Mole fraction D1 D2 W2=water W1=F2 recovery
Case 1
Acetone 0.99502 0.00129 8.10E-11 0.00039 99.87%
Methanol 0.00055 0.99540 0.00009 0.29753 99.95
Water 0.00443 0.00331 0.99991 0.70208
Case G1
Acetone 0.99502 0.00019 1.43E-12 6.22E-05 99.98%
Methanol 0.00053 0.99799 0.000143 0.33089 99.95%
Water 0.00445 0.00182 0.999857 0.66905
Case SQP
Acetone 0.99505 0.00090 9.58E-13 0.00029 99.91%
Methanol 0.00023 0.99608 4.36E-05 0.32568 99.98%
Water 0.00472 0.00302 0.999956 0.67403
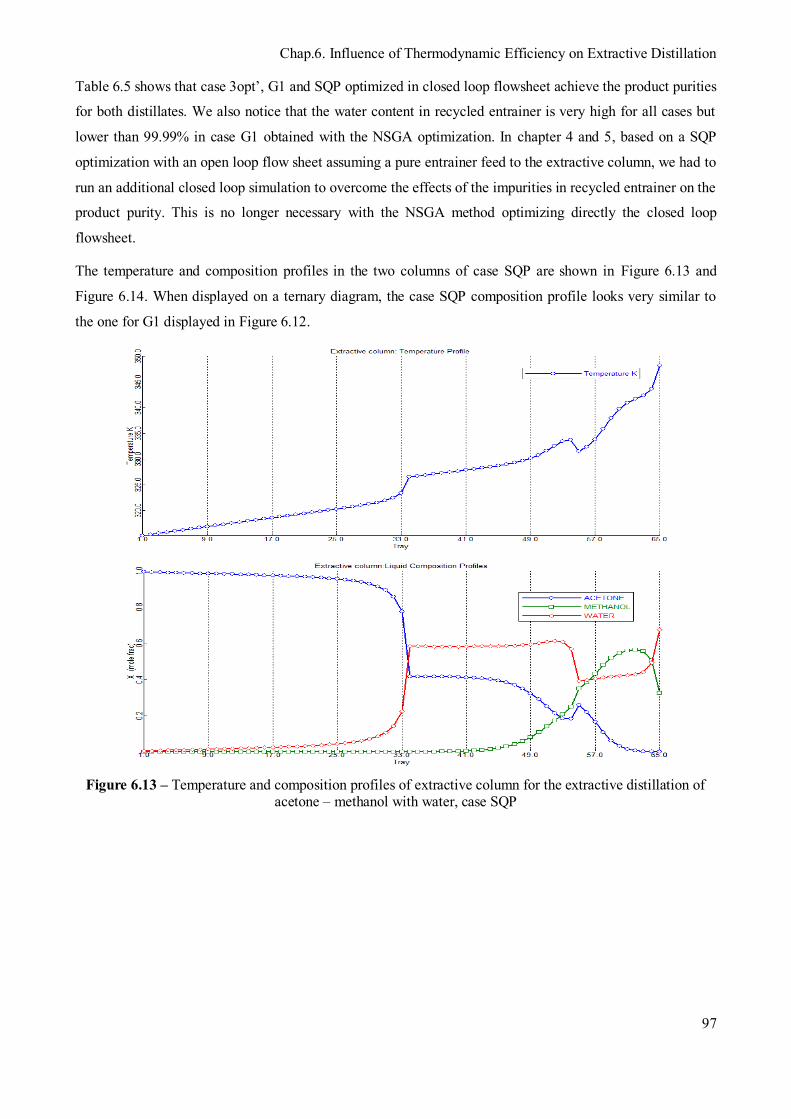
Chap.6. Influence of Thermodynamic Efficiency on Extractive Distillation
97
Table 6.5 shows that case 3opt’, G1 and SQP optimized in closed loop flowsheet achieve the product purities
for both distillates. We also notice that the water content in recycled entrainer is very high for all cases but
lower than 99.99% in case G1 obtained with the NSGA optimization. In chapter 4 and 5, based on a SQP
optimization with an open loop flow sheet assuming a pure entrainer feed to the extractive column, we had to
run an additional closed loop simulation to overcome the effects of the impurities in recycled entrainer on the
product purity. This is no longer necessary with the NSGA method optimizing directly the closed loop
flowsheet.
The temperature and composition profiles in the two columns of case SQP are shown in Figure 6.13 and
Figure 6.14. When displayed on a ternary diagram, the case SQP composition profile looks very similar to
the one for G1 displayed in Figure 6.12.
Figure 6.13 – Temperature and composition profiles of extractive column for the extractive distillation of
acetone – methanol with water, case SQP

Thermodynamic Insight for the Design and Optimization of Extractive Distillation of 1.0-1a Class Separation
98
Figure 6.14 – Temperature and composition profiles of entrainer regeneration column for the extractive
distillation of acetone – methanol with water, case SQP
From Figure 6.13, there is a temperature decrease in the temperature profile map of extractive column as the
main feed temperature was fixed at 320K during the optimization the same as in chapter 4 and 5. We can
also notice in Table 6.5 that most of the impurity in distillate (D1) is the high-boiling temperature water
because the rectifying section profile reaches xD1 on the acetone-water mixture side where there is a pinch
point at the high acetone content side. Its effect is that more than half of the trays (34 out of 65) are used in
rectifying section in extractive column for separating the acetone from water. Besides, the content of
methanol in the rectifying section is very low (see Figure 6.13) which proves that the extractive section pinch
point (SNext’) was able to come very close to the AE side.
6.4.Results and discussion
The optimization of the extractive distillation process including the extractive and entrainer regeneration
columns for the separation of acetone-methanol minimum azeotropic mixture with heavy entrainer water was
investigated. Based on our study in chapter 4, the operating pressure of extractive column was set at 0.6 atm
because it takes the benefit of low pressure for enhancing the relative volatility and the separation as well as
the use of cheap cooling water. Not needing good initial value and allowing the optimization of both
continuous (reflux ratio, entrainer and distillate flowrates) and discrete (column tray number and feed
locations) variables, a multi-objective NSGA method coded in Excel is used as optimization method and it is
linked with Aspen plus software through programming in VBA. Aiming at investigating the influences of a
Chap.6. Influence of Thermodynamic Efficiency on Extractive Distillation
99
thermodynamic efficiency indicator to find an optimal design, we run the optimization with four objective
functions: extractive efficiency indicator Eext and eext are maximized meanwhile TAC (economic view) and
OF (energy cost per unit product) are minimized while 99.5% products purities in the distillates are set as
constraints.
Through the analysis of Pareto front, the effects of the main variables entrainer-to-feed ratio and reflux ratio
on TAC and efficiency indicator are discussed. The results show that there is a maximum Eext for a given
reflux ratio, and there is a minimum R1 for a given Eext. There also exists an optimal efficiency indicator
Eext,opt which corresponds the optimal design defined as the one with the lowest TAC and Eext,opt can be used
as a criterion for the evaluating of different design for the same system. For acetone-methanol with water
system, Eext,opt equals to 0.161±3% at 0.6 atm. Indeed we have to conclude that although the thermodynamic
efficiency indicators can’t be used as an optimization criterion alone, it is worth combining it with usual
criteria such as TAC and OF as near its Eext,opt value the design is still very sensitive to the entrainer feed
flow rate and reflux ratio parameters that have a dominant impact on OF and TAC. Through the analysis of
extractive profile map, we explain the reasons that efficiency indicator increase following the decrease of
entrainer flow rate and the increase of reflux ratio.
The SQP method is used to further improve the design following the decrease of TAC with the good initial
values from NSGA method. A competitive design is shown with marginal improvement showing that NSGA
optimization with the four criteria described above is able to find a consistent and performance design for the
extractive process concerning the 1.0-1a class mixture.
Based on the view of total new design, an optimization procedure NSGA plus SQP is demonstrated for
extractive distillation. The advantage of both methods are taken into account: NSGA method can avoid the
local optimal and supply a good initial design for SQP method meanwhile the optimal design can be obtained
more quickly.

Thermodynamic Insight for the Design and Optimization of Extractive Distillation of 1.0-1a Class Separation
100
Chap.7. Reducing Process Cost and CO2 Emissions
101
Chapter 7. Reducing Process Cost and CO2
Emissions
Results in this chapter have been submitted to:
Article: You, X., Rodriguez-Donis, I., Gerbaud, V., 2015. Reducing process cost and CO2 emissions for
extractive distillation by double-effect heat integration and mechanical heat pump. Applied energy.
Thermodynamic Insight for the Design and Optimization of Extractive Distillation of 1.0-1a Class Separation
102
7.Reducing process cost and CO2 emissions for extractive distillation by double-effect heat integration and mechanical heat pump
7.1.Introduction
Distillation is one of the most widely used separation methods in the chemical and petrochemical industry. It
is commonly known in chemical industry that distillation process is ranked in a third of the total used energy
in chemical industry (Linnhoff et al., 1983). High quality energy in distillation is used to create the vapour
flow in reboiler and the vapour flow is cooled down in condenser, meanwhile, it becomes low quality energy.
Two approaches are commonly used to improve the energy efficiency of distillation process: double-effect
heat integration and heat pumps technology. The interest to use double-effect heat integration and heat pump
for heating purposes in distillation column also increase with global awareness of the limited availability of
fossil fuels in combination with the greenhouse effect (Bruinsma and Spoelstra, 2010). Carbon dioxide as the
main greenhouse gas plays a vital role in global warming since it is responsible for about two-thirds of the
enhanced greenhouse effect Gadalla et al. (2005).
Gutiérrez-Guerra et al., (2009) studied the conventional and thermally coupled extractive distillation for the
separation of zeotropic and azeotropic mixtures, and showed that thermally coupled extractive distillation
can achieve significant reductions of CO2 emissions due to the energy saving. Jana, (2010) gave a review on
the heat integrated distillation operation and pointed out that the main challenges for heat integrated
distillation are high investment cost, complex equipment design and control, and lack of experimental data at
sufficiently large scale to verify the theoretical predictions. Harwardt and Marquardt, (2012) studied the
internally heat-integrated distillation columns (HIDiC) and vapour recompression technique (VRC) for the
binary, multicomponent, and nonideal mixtures based on rigorous optimization. They pointed out that
excepting rare situation, VRC design are typically superior over HIDiC design with respect to energy and
cost savings. Fonyo and Benkö, (1998) analyzed various heat pump assisted continuous distillation
configurations including several mechanical heat pump arrangements (vapour compression (VC), vapour
recompression (VRC) and bottom flash (BF)) and absorption heat pump arrangements. Bruinsma and
Spoelstra, (2010) gave a comprehensive review of different kinds of heat pumps and they focused on two
conventional ways to integrate heat pump and distillation columns: the vapor compression column (VC) and
vapor recompression column (VRC) as shown in Figure 7.1 (a,b and c).
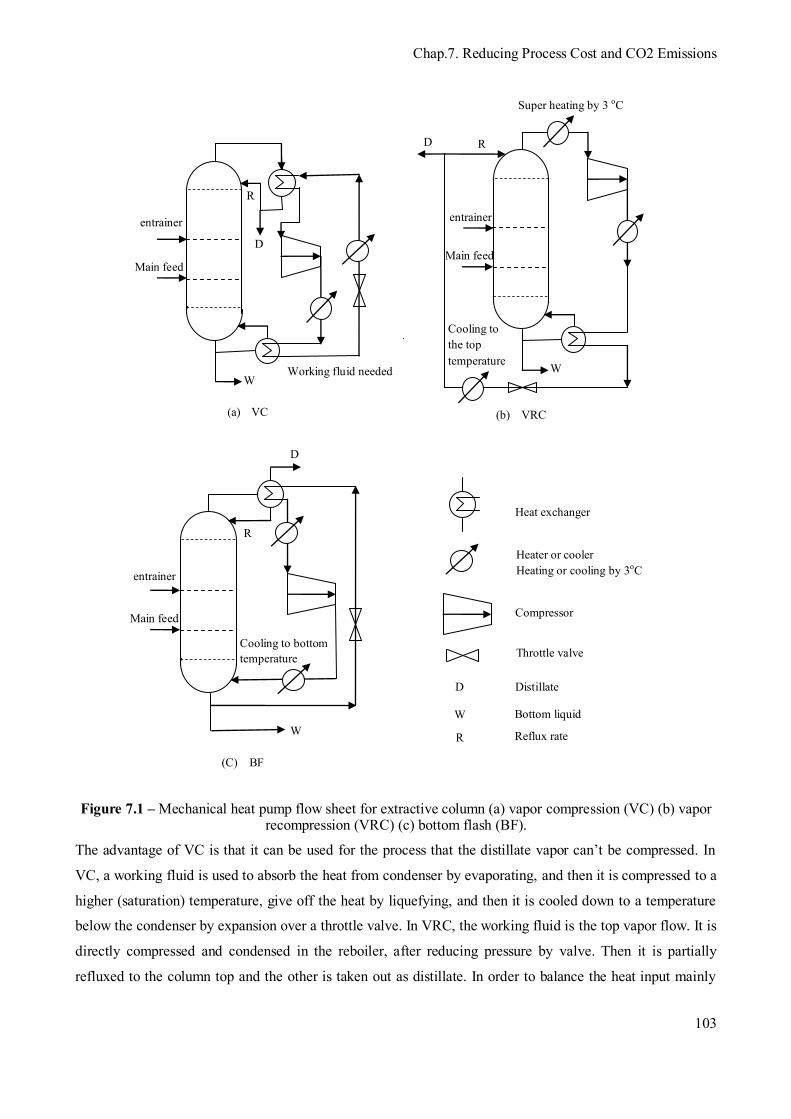
Chap.7. Reducing Process Cost and CO2 Emissions
103
(a) VC (b) VRC
entrainer
(C) BF
Heat exchanger
Heater or cooler Heating or cooling by 3oC
Compressor
Throttle valve
Main feed
Super heating by 3 oC
D Distillate
W Bottom liquid
W
Cooling to the top temperature
entrainer
Main feed
D
D
W R Reflux rate
R
W
D
Main feed
entrainer
R
R
Cooling to bottom temperature
Working fluid needed
Figure 7.1 – Mechanical heat pump flow sheet for extractive column (a) vapor compression (VC) (b) vapor recompression (VRC) (c) bottom flash (BF).
The advantage of VC is that it can be used for the process that the distillate vapor can’t be compressed. In
VC, a working fluid is used to absorb the heat from condenser by evaporating, and then it is compressed to a
higher (saturation) temperature, give off the heat by liquefying, and then it is cooled down to a temperature
below the condenser by expansion over a throttle valve. In VRC, the working fluid is the top vapor flow. It is
directly compressed and condensed in the reboiler, after reducing pressure by valve. Then it is partially
refluxed to the column top and the other is taken out as distillate. In order to balance the heat input mainly
Thermodynamic Insight for the Design and Optimization of Extractive Distillation of 1.0-1a Class Separation
104
generating by the compressor, a small condenser is needed. The advantage of VRC over VC is that smaller
condenser heat transfer area and lower temperature lift can be used because the heat is exchanged only once.
Kiss et al., (2012b) proposed a practical selection scheme of energy efficient distillation technologies with a
special focus on heat pump. Using the scheme, process designers can effectively narrow down the number of
technology alternatives that can deliver significant energy savings considering the particular process
conditions. Modla and Lang (2013) studied the VC, VRC and VRC with external heat exchanger in batch
distillation for the separation of low relative volatility mixture. They concluded that for the VRC system in
the minimal payback period point, the batch operation time was significantly longer than that of the
conventional batch distillation but the payback times was considerable reduced by applying an external heat
exchanger.
On the other hand, the bottom flash column (BF) (Figure 7.1c) is an alternative process to VC and VRC
(Fonyo and Benkö, 1998). In BF, the bottom liquid is cooled down by expansion over a throttle valve to a
temperature below the condenser, it is evaporated at the condenser to cool down the top vapor. Then it is
compressed to a higher pressure to reenter the column as bottom vapor flow. Díez et al., (2009) analyzed
several distillation assisted heat pump process including VRC and BF for close boiling mixture i-butane and
n-butane, and showed that more than 30% energy cost and 9% total cost reductions compared with
conventional distillation. Gao et al. (2013) compared VRC and BF heat pump for the separation of n-butanol
and isobutanol. VRC heat pump performances were found a little better than BF heat pump and TAC
decreased by more than 70% compared with conventional distillation.
Until now, heat pump technique is still not applied as widely as it could be, because of high investment costs
and difficulties in system design and integration (Chua et al., 2010). As pointed out by (Fonyo and Mizsey,
1994), when designing heat pump assisted distillation, all three types of MHP processes (VC,VRC and BF)
should be considered since there is no unanimous thermodynamic reason to prefer VRC despite its seemingly
lower TAC and energy demand.
7.2. Literature studies of extractive process with double-effect heat integration and heat pump
The zeotropic and azeotropic mixtures are mostly encountered in petrochemical engineering and chemical
industries. As one of the effective method for separating azeotropic mixture which can’t be separated by
conventional distillation, extractive distillation is commonly applied in industry, and is becoming a more and
more important separation method (Lei et al., 2003). In extractive distillation, entrainer is used to alter the
relative volatility of the components to be separated. Thermodynamic insight gained from analysis of residue
curve map and volatility order region allows one to assess which component will be withdrawn as product,
what the adequate column configuration is, and whether it exists some limiting operating parameter value or
not (Rodriguez-Donis et al., 2009a; Rodríguez-Donis et al., 2009b). Therefore, one pure component is
attained at the top (resp. bottom) of the extractive column while the other one with the solvent obtained at the
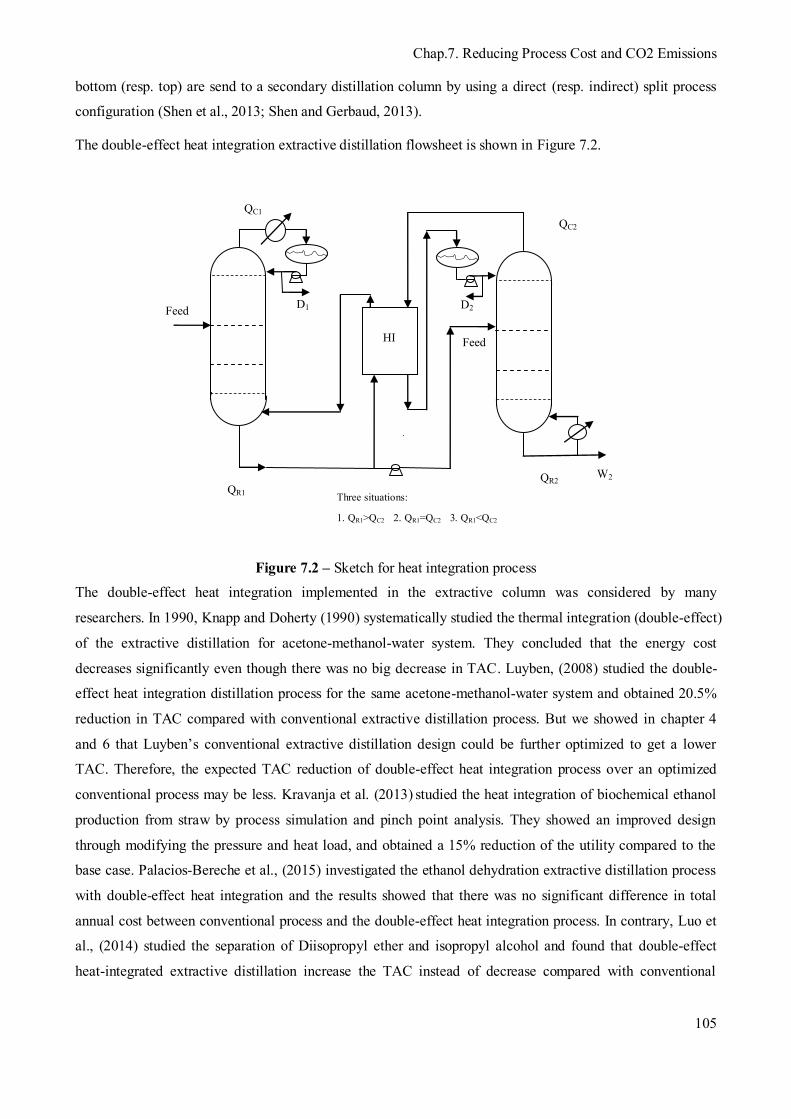
Chap.7. Reducing Process Cost and CO2 Emissions
105
bottom (resp. top) are send to a secondary distillation column by using a direct (resp. indirect) split process
configuration (Shen et al., 2013; Shen and Gerbaud, 2013).
The double-effect heat integration extractive distillation flowsheet is shown in Figure 7.2.
Feed
HI
D1 D2
W2
Feed
QC1 QC2
QR2 QR1 Three situations:
1. QR1>QC2 2. QR1=QC2 3. QR1<QC2
Figure 7.2 – Sketch for heat integration process The double-effect heat integration implemented in the extractive column was considered by many
researchers. In 1990, Knapp and Doherty (1990) systematically studied the thermal integration (double-effect)
of the extractive distillation for acetone-methanol-water system. They concluded that the energy cost
decreases significantly even though there was no big decrease in TAC. Luyben, (2008) studied the double-
effect heat integration distillation process for the same acetone-methanol-water system and obtained 20.5%
reduction in TAC compared with conventional extractive distillation process. But we showed in chapter 4
and 6 that Luyben’s conventional extractive distillation design could be further optimized to get a lower
TAC. Therefore, the expected TAC reduction of double-effect heat integration process over an optimized
conventional process may be less. Kravanja et al. (2013) studied the heat integration of biochemical ethanol
production from straw by process simulation and pinch point analysis. They showed an improved design
through modifying the pressure and heat load, and obtained a 15% reduction of the utility compared to the
base case. Palacios-Bereche et al., (2015) investigated the ethanol dehydration extractive distillation process
with double-effect heat integration and the results showed that there was no significant difference in total
annual cost between conventional process and the double-effect heat integration process. In contrary, Luo et
al., (2014) studied the separation of Diisopropyl ether and isopropyl alcohol and found that double-effect
heat-integrated extractive distillation increase the TAC instead of decrease compared with conventional
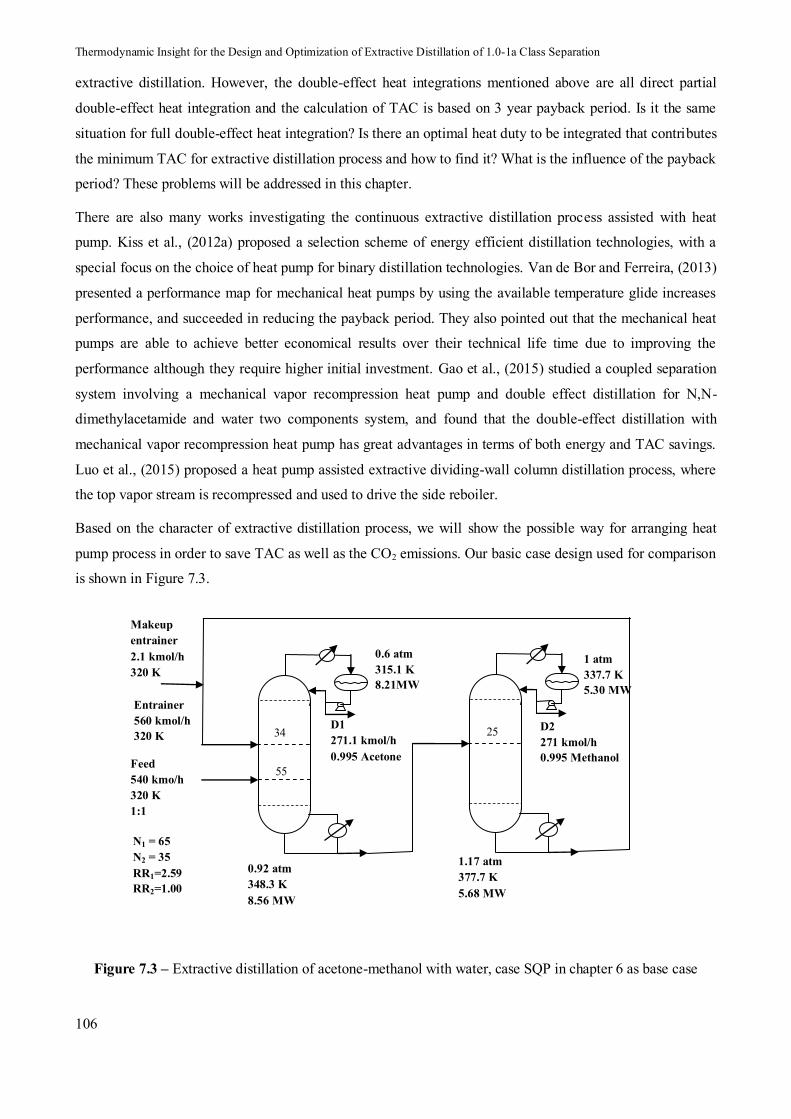
Thermodynamic Insight for the Design and Optimization of Extractive Distillation of 1.0-1a Class Separation
106
extractive distillation. However, the double-effect heat integrations mentioned above are all direct partial
double-effect heat integration and the calculation of TAC is based on 3 year payback period. Is it the same
situation for full double-effect heat integration? Is there an optimal heat duty to be integrated that contributes
the minimum TAC for extractive distillation process and how to find it? What is the influence of the payback
period? These problems will be addressed in this chapter.
There are also many works investigating the continuous extractive distillation process assisted with heat
pump. Kiss et al., (2012a) proposed a selection scheme of energy efficient distillation technologies, with a
special focus on the choice of heat pump for binary distillation technologies. Van de Bor and Ferreira, (2013)
presented a performance map for mechanical heat pumps by using the available temperature glide increases
performance, and succeeded in reducing the payback period. They also pointed out that the mechanical heat
pumps are able to achieve better economical results over their technical life time due to improving the
performance although they require higher initial investment. Gao et al., (2015) studied a coupled separation
system involving a mechanical vapor recompression heat pump and double effect distillation for N,N-
dimethylacetamide and water two components system, and found that the double-effect distillation with
mechanical vapor recompression heat pump has great advantages in terms of both energy and TAC savings.
Luo et al., (2015) proposed a heat pump assisted extractive dividing-wall column distillation process, where
the top vapor stream is recompressed and used to drive the side reboiler.
Based on the character of extractive distillation process, we will show the possible way for arranging heat
pump process in order to save TAC as well as the CO2 emissions. Our basic case design used for comparison
is shown in Figure 7.3.
D1 271.1 kmol/h 0.995 Acetone
0.6 atm 315.1 K 8.21MW
Makeup entrainer 2.1 kmol/h 320 K
D2 271 kmol/h 0.995 Methanol
1.17 atm 377.7 K 5.68 MW
0.92 atm 348.3 K 8.56 MW
1 atm 337.7 K 5.30 MW
34
55
25
N1 = 65 N2 = 35 RR1=2.59 RR2=1.00
Entrainer 560 kmol/h 320 K
Feed 540 kmo/h 320 K 1:1
Figure 7.3 – Extractive distillation of acetone-methanol with water, case SQP in chapter 6 as base case
Chap.7. Reducing Process Cost and CO2 Emissions
107
The base case is an extractive distillation process optimized in chapter 6 by focusing on the energy saving of
the process itself for the separation of the minimum azeotropic mixture acetone-methanol with heavy
entrainer water. That typical 1.0-1a class extractive separation is favored in energy cost at low operating
pressure of the extractive column and the P = 0.6 atm is chosen in order to use cooling water for the
condenser.
In this chapter, the possible double-effect heat integration process and mechanical heat pumps process are
investigated for further energy and capital cost savings as well as the assessment of the effect of process on
environment. Since the top vapor components of the two columns are compressed, the VC heat pump will
not be considered in this study due to additional heat exchanger capital cost compared with the VRC heat
pump process. The goals of this paper are (1) to compare double-effect heat integration processes and find
the suitable heat duty to be integrated between extractive and regeneration columns. (2) To study two
mechanical heat pumps process (VRC, BF) for continuous extractive distillation, and propose new
mechanical heat pump sequences for the reduction of TAC and initial capital cost. (3) To simulate and
optimize the heat integration and heat pump systems within the continuous extractive distillation including
the solvent regeneration column. (4) Aiming at energy cost and capital cost reduction, to estimate the costs
and payback times of these systems and the environmental assessment though CO2 emissions.
7.3.Evaluation method of heat pump performance and CO2 emissions
7.3.1.Heat pump performance
Bruinsma and Spoelstra, (2010) give a detail derivation of the coefficient of performance (COP) in order to
evaluate the heat pump technique in distillation process. For heating application, it is the ratio of the heat
rejected at high temperature to the work input:
WQCOP h (7.1)
The upper theoretical value of COP obtainable in a heat pump is COPc, related to the Carnot cycle:
LH
HC TT
TCOP
(7.2)
Where, the temperature lift (TH-TL) is the sum of the temperature difference over the column and the
temperature difference over the heat exchanger.
(Pleşu et al., 2014) provide an easy way to check whether or not the use of a heat pump can provide a more
sustainable distillation process decreasing its energy requirements in the early stages of design. The
simplified equation is as follow:
CR
CS TT
TWQCOP
1 (7.3)
Thermodynamic Insight for the Design and Optimization of Extractive Distillation of 1.0-1a Class Separation
108
Where Q is the reboiler duty of column, W the work provided, η the Carnot efficiency, TR and TC
temperature (K) of reboiler and condenser. They also pointed out that when the Q/W ratio exceeds 10, a heat
pump is clearly recommended, between 5 and 10 it should be evaluated more detail, and if it is lower than 5,
using a heat pump technique should not bring any benefits.
7.3.2.Evaluation of CO2 emissions for distillation column
In 1991, Smith and Delaby (1991) have related energy targets to the resulting flue gas emissions from the
utility system for a given process with fixed process conditions by considering the typical process industry
utility devices such as boilers, furnaces and turbines; the emitting gas being CO2, SO2 and NO2. Based on
their works, Gadalla et al. (2005) proposed a simple model for the calculation of CO2 emissions for heat-
integrated distillation system. The model for calculating CO2 emissions is as follow, based on the assumption
that no carbon monoxide is formed during combustion since the air is regarded as in excess.
factorfuelemiss FuelQCO ][ 2 (7.4)
Where Qfuel is the amount of fuel burnt, reflecting the heating device, and Fuelfactor is the fuel factor,
reflecting the types of the fuel. It is defined as follow:
100%C
NHVFuel factor
(7.5)
Where α (= 3.67) is the molar masses content of carbon in CO2, NHV(kJ/kg) means the net heating value of
a fuel with a carbon content of C%. Fuelfactor takes the effect of the fuel on the process in terms of C%, NHV
and α. In this study, assume heavy fuel oil is used and NHV = 39771 kJ/kg, C% = 86.5% (Gadalla et al.,
2005).
In distillation system, steam is used for heating in reboiler. The steam is produced by boiler from the
combustion of fuel. The theoretical flame temperature and the stack temperature are assumed as 1800 OC and
160 OC. so QFuel can be calculated from following equation:
stackFTB
FTBproc
proc
procfuel TT
TThQ
Q
0)419(
(7.6)
Where λproc (kJ/kg) and hproc (kJ/kg) are the latent heat and enthalpy of steam delivered to the process,
respectively, while TFTB (OC), Tstack (OC) and T0 (OC) are the flame temperature, the stack temperature and the
ambient temperature. The boiler feedwater is assumed to be at 100 OC with an enthalpy of 419 kJ/kg
(Gadalla et al., 2005). The equation 7.6 is obtained from a simple steam balance around the boiler to relate
the amount of fuel necessary in the boiler to provide a heat duty of Qproc. The CO2 emissions for the
electricity power of a compressor is take as 51.1 kg CO2 /GJ (Waheed et al., 2014), that is 184 kg CO2/hr for
1000 kW power which we use in this study.
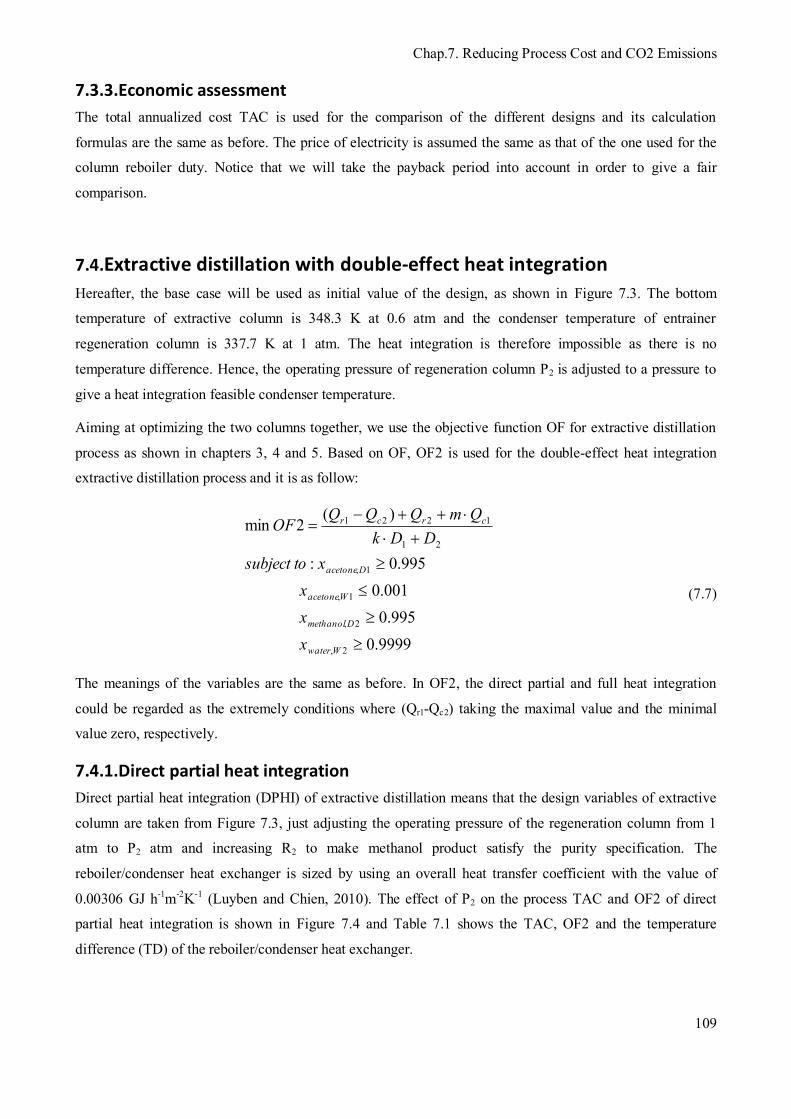
Chap.7. Reducing Process Cost and CO2 Emissions
109
7.3.3.Economic assessment
The total annualized cost TAC is used for the comparison of the different designs and its calculation
formulas are the same as before. The price of electricity is assumed the same as that of the one used for the
column reboiler duty. Notice that we will take the payback period into account in order to give a fair
comparison.
7.4.Extractive distillation with double-effect heat integration
Hereafter, the base case will be used as initial value of the design, as shown in Figure 7.3. The bottom
temperature of extractive column is 348.3 K at 0.6 atm and the condenser temperature of entrainer
regeneration column is 337.7 K at 1 atm. The heat integration is therefore impossible as there is no
temperature difference. Hence, the operating pressure of regeneration column P2 is adjusted to a pressure to
give a heat integration feasible condenser temperature.
Aiming at optimizing the two columns together, we use the objective function OF for extractive distillation
process as shown in chapters 3, 4 and 5. Based on OF, OF2 is used for the double-effect heat integration
extractive distillation process and it is as follow:
9999.0995.0
001.0995.0:
)(2min
2,
2,
1,
1,
21
1221
Wwater
Dmethanol
Wacetone
Dacetone
crcr
xxx
xtosubjectDDk
QmQQQOF
(7.7)
The meanings of the variables are the same as before. In OF2, the direct partial and full heat integration
could be regarded as the extremely conditions where (Qr1-Qc2) taking the maximal value and the minimal
value zero, respectively.
7.4.1.Direct partial heat integration
Direct partial heat integration (DPHI) of extractive distillation means that the design variables of extractive
column are taken from Figure 7.3, just adjusting the operating pressure of the regeneration column from 1
atm to P2 atm and increasing R2 to make methanol product satisfy the purity specification. The
reboiler/condenser heat exchanger is sized by using an overall heat transfer coefficient with the value of
0.00306 GJ h-1m-2K-1 (Luyben and Chien, 2010). The effect of P2 on the process TAC and OF2 of direct
partial heat integration is shown in Figure 7.4 and Table 7.1 shows the TAC, OF2 and the temperature
difference (TD) of the reboiler/condenser heat exchanger.
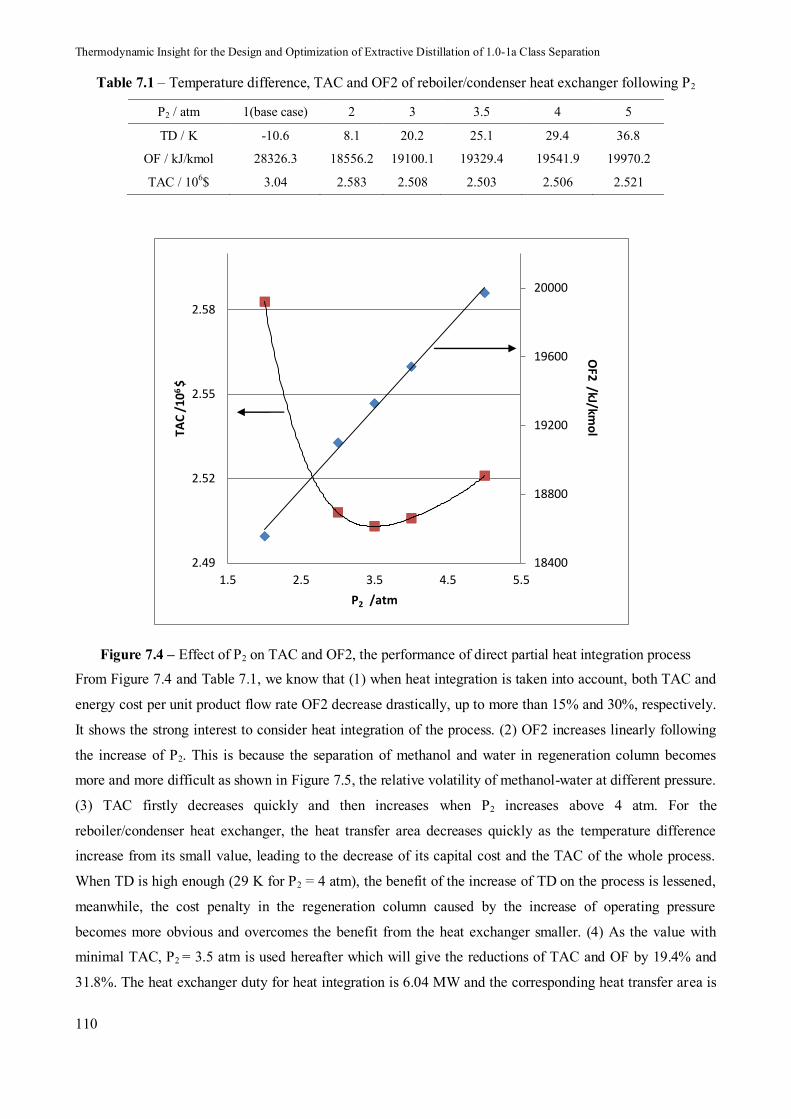
Thermodynamic Insight for the Design and Optimization of Extractive Distillation of 1.0-1a Class Separation
110
Table 7.1 – Temperature difference, TAC and OF2 of reboiler/condenser heat exchanger following P2
P2 / atm 1(base case) 2 3 3.5 4 5
TD / K -10.6 8.1 20.2 25.1 29.4 36.8
OF / kJ/kmol 28326.3 18556.2 19100.1 19329.4 19541.9 19970.2
TAC / 106$ 3.04 2.583 2.508 2.503 2.506 2.521
18400
18800
19200
19600
20000
2.49
2.52
2.55
2.58
1.5 2.5 3.5 4.5 5.5
TAC
/10
6 $
P2 /atm
TAC
OF2
OF2 /kJ/km
ol
Figure 7.4 – Effect of P2 on TAC and OF2, the performance of direct partial heat integration process From Figure 7.4 and Table 7.1, we know that (1) when heat integration is taken into account, both TAC and
energy cost per unit product flow rate OF2 decrease drastically, up to more than 15% and 30%, respectively.
It shows the strong interest to consider heat integration of the process. (2) OF2 increases linearly following
the increase of P2. This is because the separation of methanol and water in regeneration column becomes
more and more difficult as shown in Figure 7.5, the relative volatility of methanol-water at different pressure.
(3) TAC firstly decreases quickly and then increases when P2 increases above 4 atm. For the
reboiler/condenser heat exchanger, the heat transfer area decreases quickly as the temperature difference
increase from its small value, leading to the decrease of its capital cost and the TAC of the whole process.
When TD is high enough (29 K for P2 = 4 atm), the benefit of the increase of TD on the process is lessened,
meanwhile, the cost penalty in the regeneration column caused by the increase of operating pressure
becomes more obvious and overcomes the benefit from the heat exchanger smaller. (4) As the value with
minimal TAC, P2 = 3.5 atm is used hereafter which will give the reductions of TAC and OF by 19.4% and
31.8%. The heat exchanger duty for heat integration is 6.04 MW and the corresponding heat transfer area is
Chap.7. Reducing Process Cost and CO2 Emissions
111
283 m2. (5) The differential temperature driving force is 25.1 K. The results agree with the fact that the
reasonable differential temperature driving force is more than 20K (Luyben and Chien, 2010).
Based on the feasibility and univolatility analysis that led us to select P1 = 0.6 atm, the choice of a lower
pressure allows us to choose P2 = 3.5 atm instead of P2 = 5 atm as used in Luyben’s heat integrated design for
the separation systems, our design with P1 = 0.6 atm and P2 = 3.5 atm results in 16% TAC saving and 27.6%
OF (energy consumption per unit product flow rate) saving compared to Luyben’s heat integrated design
with P1 = 0.6 atm and P2 = 3.5 atm.
1.5
3.5
5.5
7.5
0 0.2 0.4 0.6 0.8 1
α met
hano
l VS
wat
er
x methanol
1 atm
3 atm
5 atm
Figure 7.5 – Relative volatility of methanol over water at different pressure
7.4.2. Optimal partial heat integration
Optimal partial heat integration (OPHI) of extractive distillation process means all the design variables are
being optimized with objective function OF after the operating pressure of regeneration column is changed to
3.5 atm from above results.
The four-step optimization procedure in chapter 3 for extractive distillation is used since we keep fixing the
two columns stage number as base case. The results after recheck in closed loop flow sheet are shown as
OPHI in Table 7.2 and Table 7.3. There is a small decrease of OF when more variables are taken into
account. The optimal values of FE, R1, D1 D2, NFE and NFF are almost similar to the DPHI case. Differences
are seen in the R2 and NFR values. Indeed, the new regeneration column design leads to a more suitable heat
exchange duty for heat integration and reduces the operating cost and the capital cost, giving rise to the drops
of TAC by 6%.
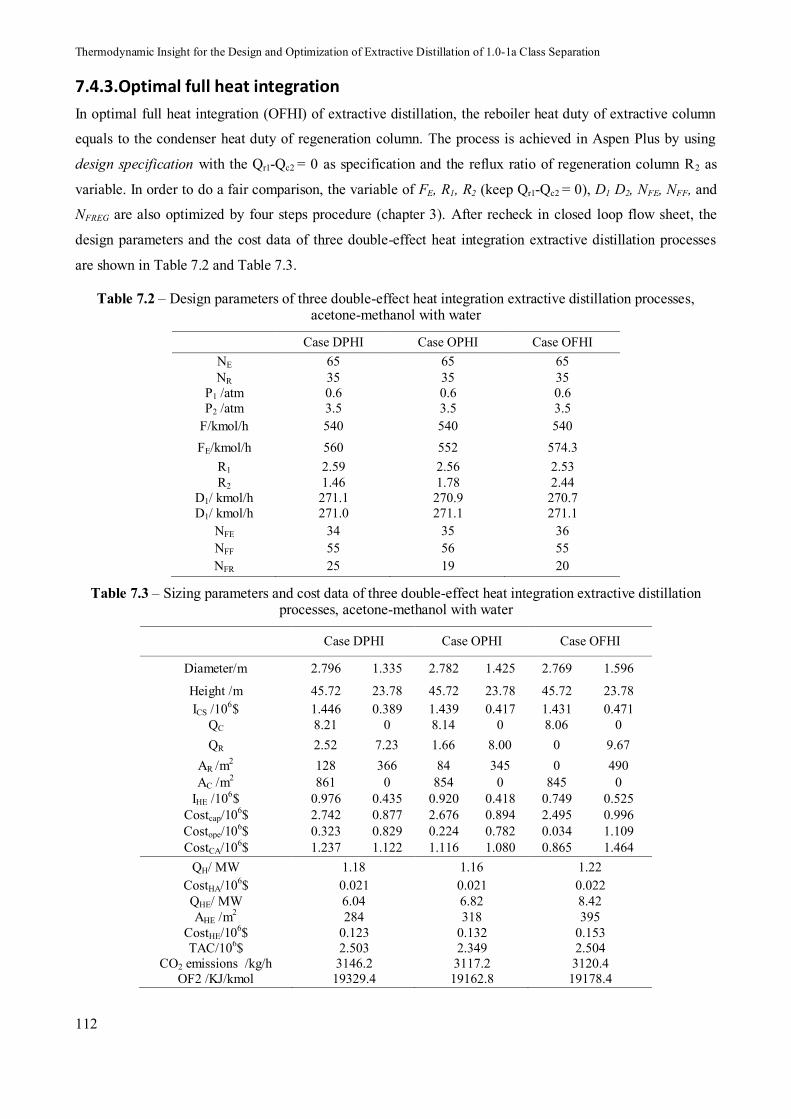
Thermodynamic Insight for the Design and Optimization of Extractive Distillation of 1.0-1a Class Separation
112
7.4.3.Optimal full heat integration
In optimal full heat integration (OFHI) of extractive distillation, the reboiler heat duty of extractive column
equals to the condenser heat duty of regeneration column. The process is achieved in Aspen Plus by using
design specification with the Qr1-Qc2 = 0 as specification and the reflux ratio of regeneration column R2 as
variable. In order to do a fair comparison, the variable of FE, R1, R2 (keep Qr1-Qc2 = 0), D1 D2, NFE, NFF, and
NFREG are also optimized by four steps procedure (chapter 3). After recheck in closed loop flow sheet, the
design parameters and the cost data of three double-effect heat integration extractive distillation processes
are shown in Table 7.2 and Table 7.3.
Table 7.2 – Design parameters of three double-effect heat integration extractive distillation processes, acetone-methanol with water
Case DPHI Case OPHI Case OFHI NE 65 65 65 NR 35 35 35
P1 /atm 0.6 0.6 0.6 P2 /atm 3.5 3.5 3.5
F/kmol/h 540 540 540 FE/kmol/h 560 552 574.3
R1 2.59 2.56 2.53 R2 1.46 1.78 2.44
D1/ kmol/h 271.1 270.9 270.7 D1/ kmol/h 271.0 271.1 271.1
NFE 34 35 36 NFF 55 56 55 NFR 25 19 20
Table 7.3 – Sizing parameters and cost data of three double-effect heat integration extractive distillation processes, acetone-methanol with water
Case DPHI Case OPHI Case OFHI
Diameter/m 2.796 1.335 2.782 1.425 2.769 1.596
Height /m 45.72 23.78 45.72 23.78 45.72 23.78 ICS /106$ 1.446 0.389 1.439 0.417 1.431 0.471
QC 8.21 0 8.14 0 8.06 0 QR 2.52 7.23 1.66 8.00 0 9.67
AR /m2 128 366 84 345 0 490 AC /m2 861 0 854 0 845 0
IHE /106$ 0.976 0.435 0.920 0.418 0.749 0.525 Costcap/106$ 2.742 0.877 2.676 0.894 2.495 0.996 Costope/106$ 0.323 0.829 0.224 0.782 0.034 1.109 CostCA/106$ 1.237 1.122 1.116 1.080 0.865 1.464
QH/ MW 1.18 1.16 1.22 CostHA/106$ 0.021 0.021 0.022 QHE/ MW 6.04 6.82 8.42 AHE /m2 284 318 395
CostHE/106$ 0.123 0.132 0.153 TAC/106$ 2.503 2.349 2.504
CO2 emissions /kg/h 3146.2 3117.2 3120.4 OF2 /KJ/kmol 19329.4 19162.8 19178.4
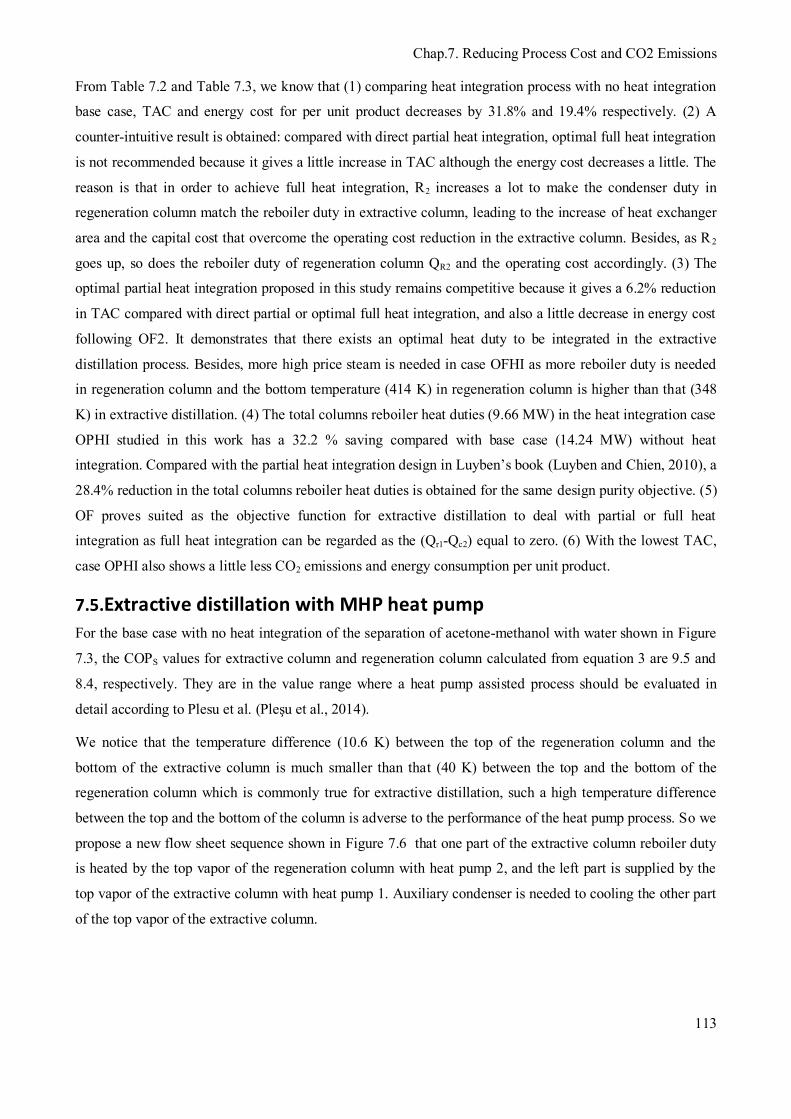
Chap.7. Reducing Process Cost and CO2 Emissions
113
From Table 7.2 and Table 7.3, we know that (1) comparing heat integration process with no heat integration
base case, TAC and energy cost for per unit product decreases by 31.8% and 19.4% respectively. (2) A
counter-intuitive result is obtained: compared with direct partial heat integration, optimal full heat integration
is not recommended because it gives a little increase in TAC although the energy cost decreases a little. The
reason is that in order to achieve full heat integration, R2 increases a lot to make the condenser duty in
regeneration column match the reboiler duty in extractive column, leading to the increase of heat exchanger
area and the capital cost that overcome the operating cost reduction in the extractive column. Besides, as R 2
goes up, so does the reboiler duty of regeneration column QR2 and the operating cost accordingly. (3) The
optimal partial heat integration proposed in this study remains competitive because it gives a 6.2% reduction
in TAC compared with direct partial or optimal full heat integration, and also a little decrease in energy cost
following OF2. It demonstrates that there exists an optimal heat duty to be integrated in the extractive
distillation process. Besides, more high price steam is needed in case OFHI as more reboiler duty is needed
in regeneration column and the bottom temperature (414 K) in regeneration column is higher than that (348
K) in extractive distillation. (4) The total columns reboiler heat duties (9.66 MW) in the heat integration case
OPHI studied in this work has a 32.2 % saving compared with base case (14.24 MW) without heat
integration. Compared with the partial heat integration design in Luyben’s book (Luyben and Chien, 2010), a
28.4% reduction in the total columns reboiler heat duties is obtained for the same design purity objective. (5)
OF proves suited as the objective function for extractive distillation to deal with partial or full heat
integration as full heat integration can be regarded as the (Qr1-Qc2) equal to zero. (6) With the lowest TAC,
case OPHI also shows a little less CO2 emissions and energy consumption per unit product.
7.5.Extractive distillation with MHP heat pump
For the base case with no heat integration of the separation of acetone-methanol with water shown in Figure
7.3, the COPS values for extractive column and regeneration column calculated from equation 3 are 9.5 and
8.4, respectively. They are in the value range where a heat pump assisted process should be evaluated in
detail according to Plesu et al. (Pleşu et al., 2014).
We notice that the temperature difference (10.6 K) between the top of the regeneration column and the
bottom of the extractive column is much smaller than that (40 K) between the top and the bottom of the
regeneration column which is commonly true for extractive distillation, such a high temperature difference
between the top and the bottom of the column is adverse to the performance of the heat pump process. So we
propose a new flow sheet sequence shown in Figure 7.6 that one part of the extractive column reboiler duty
is heated by the top vapor of the regeneration column with heat pump 2, and the left part is supplied by the
top vapor of the extractive column with heat pump 1. Auxiliary condenser is needed to cooling the other part
of the top vapor of the extractive column.
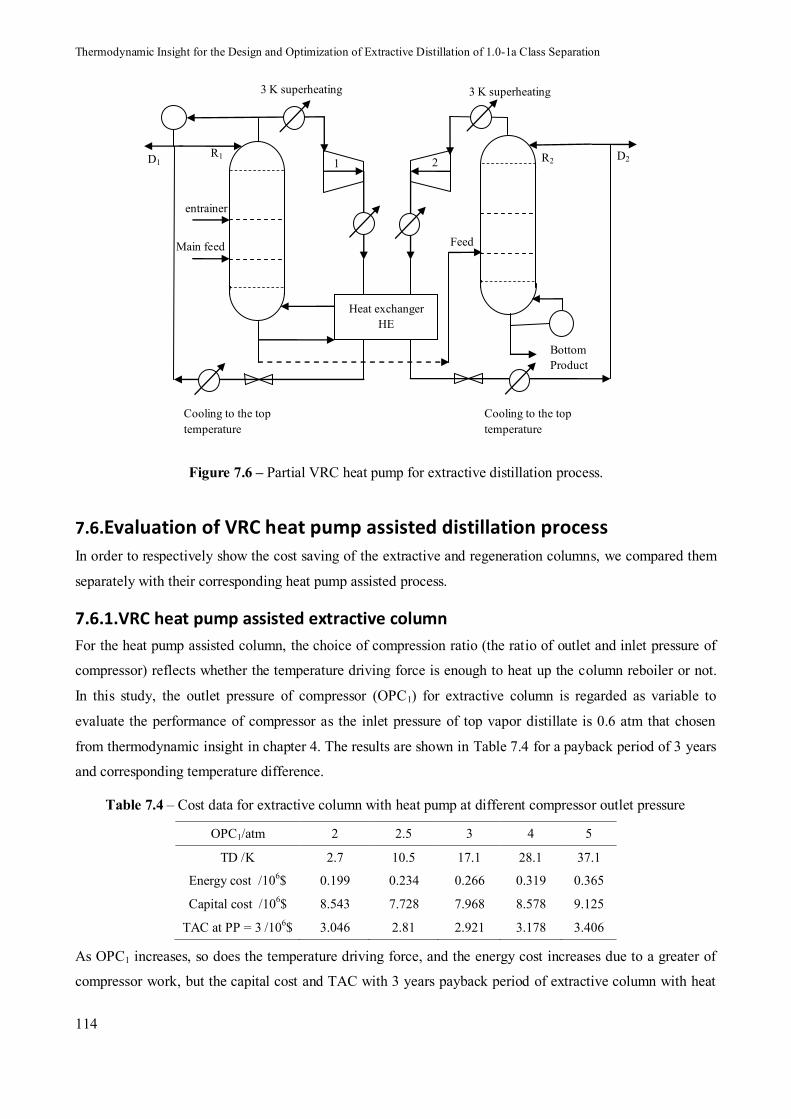
Thermodynamic Insight for the Design and Optimization of Extractive Distillation of 1.0-1a Class Separation
114
D1 R1
Cooling to the top temperature
3 K superheating
entrainer
Main feed
3 K superheating
R2
Feed
Bottom Product
Cooling to the top temperature
D2
Heat exchanger HE
1 2
Figure 7.6 – Partial VRC heat pump for extractive distillation process.
7.6.Evaluation of VRC heat pump assisted distillation process
In order to respectively show the cost saving of the extractive and regeneration columns, we compared them
separately with their corresponding heat pump assisted process.
7.6.1.VRC heat pump assisted extractive column
For the heat pump assisted column, the choice of compression ratio (the ratio of outlet and inlet pressure of
compressor) reflects whether the temperature driving force is enough to heat up the column reboiler or not.
In this study, the outlet pressure of compressor (OPC1) for extractive column is regarded as variable to
evaluate the performance of compressor as the inlet pressure of top vapor distillate is 0.6 atm that chosen
from thermodynamic insight in chapter 4. The results are shown in Table 7.4 for a payback period of 3 years
and corresponding temperature difference.
Table 7.4 – Cost data for extractive column with heat pump at different compressor outlet pressure
OPC1/atm 2 2.5 3 4 5
TD /K 2.7 10.5 17.1 28.1 37.1
Energy cost /106$ 0.199 0.234 0.266 0.319 0.365
Capital cost /106$ 8.543 7.728 7.968 8.578 9.125
TAC at PP = 3 /106$ 3.046 2.81 2.921 3.178 3.406
As OPC1 increases, so does the temperature driving force, and the energy cost increases due to a greater of
compressor work, but the capital cost and TAC with 3 years payback period of extractive column with heat

Chap.7. Reducing Process Cost and CO2 Emissions
115
pump decrease first and then increase. The high values of capital cost and TAC at OPC1 = 2 atm is because
the temperature driving force is too small, leading to a big heat exchanger area and capital cost. So OPC1 =
2.5 atm is used hereafter and the comparison of extractive column with and without heat pump are shown in
Table 7.5.
From Table 7.5 and Figure 7.7, we know that (1) there remains a condenser duty in VRC heat pump process.
The reason is that after being compressed and heat exchanged, the top vapor becomes high pressure liquid, it
is partial vaporized after throttle valve and it needs to be cooled to the top temperature before being refluxed
into the column. (2) The energy cost in extractive column is reduced by 77.0% as most of the condenser duty
is reused for heating up reboiler thanks to the heat pump. (3) The capital cost increases 2.5 times as the
compressor’s cost is much higher than that of the heat exchanger and column shell. The heat transfer area in
the process with heat pump increases by 20% more than that without heat pump. (4) Then for a 3 year
payback period, the VRC HP process is not competitive for the extractive column. However, the TAC for the
process with VRC heat pump drops below the no heat pump process if the payback period is greater than 6
years. The 10 year total cost for the process with VRC heat pump (10.07×10⁶$) is reduced by 23.5%
compared with that of the process without heat pump (13.17×10⁶$). (5) CO2 emissions (kg/h) for the process
with VRC heat pump is only 15.3% of that without heat pump.
Table 7.5 – Comparison of extractive column with and without VRC heat pump
Heat pump no Yes
QC /MW 8.21 1.63
QR /MW 8.56 0.42
QHE /MW 0 8.14
AC /m2 861 171
AR /m2 434 22
AHE /MW 0 1365
Compressor work/MW no 1.559
COP - 5.2
Capital cost of compressor /106$ 0 4.608
Energy cost per year /106$ 1.016 0.234
Capital cost /106$ 3.008 7.728
CO2 emissions /kg/h 2762.3 422.3
TAC at PP = 3 /106$ 2.018 2.810
TAC at PP = 10 /106$ 1.317 1.007

Thermodynamic Insight for the Design and Optimization of Extractive Distillation of 1.0-1a Class Separation
116
0.9
1.4
1.9
2.4
2.9
2 4 6 8 10
TAC
/10
6$
Payback period /year
NO HP
VRC HP
Figure 7.7 – Total annual cost of extractive column following payback period with and without heat pump technique
7.6.2.VRC heat pump assisted regeneration column
The outlet pressure of compressor for regeneration column (OPC2) is regarded as variable to evaluate the
performance of compressor with the top vapor distillate at atmosphere. The results are shown in Table 7.6.
Table 7.6 – Cost data for extractive column with heat pump at different compressor outlet pressure
OPC2/atm 4.5 5 5.5 6 7
TD /K 3.8 7.3 10.6 13.7 19.2
Energy cost /106$ 0.141 0.149 0.156 0.164 0.178
Capital cost /106$ 5.489 5.169 5.147 5.202 5.384
TAC at PP = 3 /106$ 1.970 1.872 1.872 1.898 1.972
As OPC2 increases, so does the temperature driving force and the energy cost due to a greater compressor
work while the capital cost and TAC with 3 years payback period of extractive column with heat pump
decreases first and then increases. The high values of capital cost and TAC at OPC2 = 4.5 atm is because the
temperature driving force is relatively small, causing a big heat exchanger area and capital cost. So OPC2 = 5
atm is used hereafter and the comparison of the regeneration column with and without heat pump are shown
in Table 7.7 and Figure 7.8.
From Table 7.7 and Figure 7.8, we know that (1) the energy cost in regeneration column with heat pump is
reduced by 77.8% while the capital cost increases 4.3 times. For a 3 year payback period, the VRC heat
pump is again not competitive. However, the CO2 emissions is reduced a lot, and the TAC for the VRC heat
pump assisted regeneration column gets competitive when the payback period is over 8 year. The 10 year
total cost for the process with heat pump (6.66×10⁶$) is reduced by 16.0% compared with that of the process
without heat pump (7.93×10⁶$).
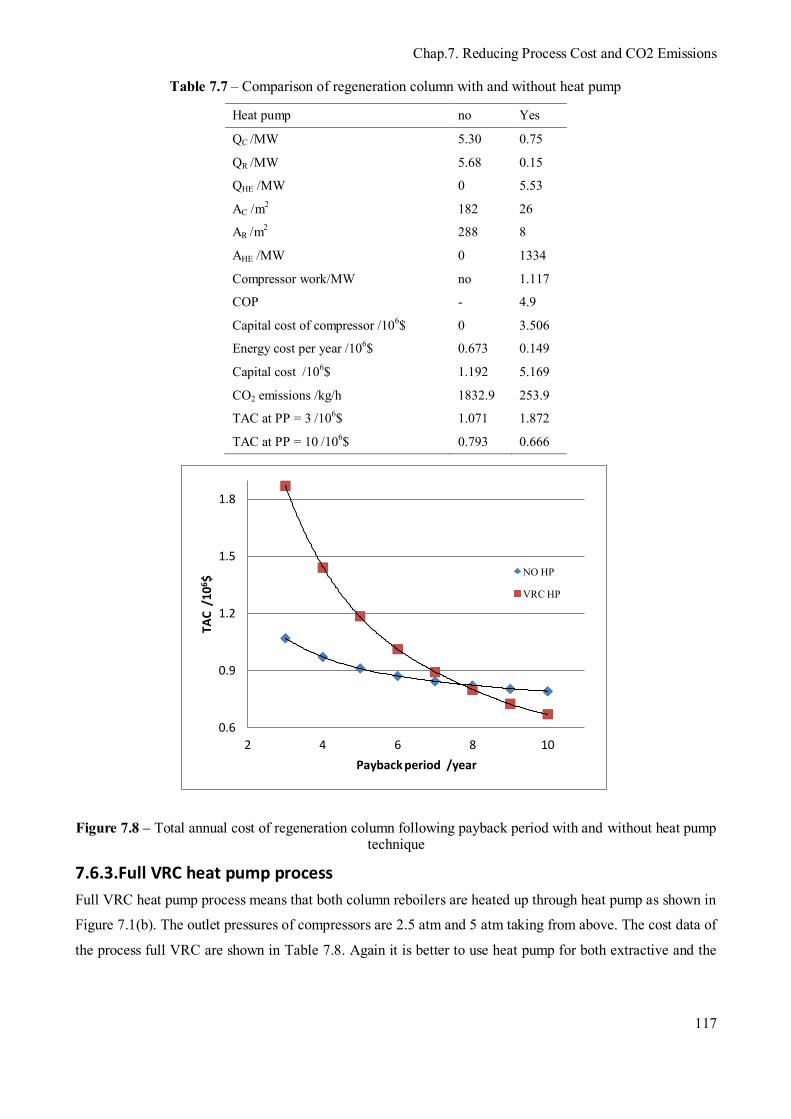
Chap.7. Reducing Process Cost and CO2 Emissions
117
Table 7.7 – Comparison of regeneration column with and without heat pump
Heat pump no Yes
QC /MW 5.30 0.75
QR /MW 5.68 0.15
QHE /MW 0 5.53
AC /m2 182 26
AR /m2 288 8
AHE /MW 0 1334
Compressor work/MW no 1.117
COP - 4.9
Capital cost of compressor /106$ 0 3.506
Energy cost per year /106$ 0.673 0.149
Capital cost /106$ 1.192 5.169
CO2 emissions /kg/h 1832.9 253.9
TAC at PP = 3 /106$ 1.071 1.872
TAC at PP = 10 /106$ 0.793 0.666
0.6
0.9
1.2
1.5
1.8
2 4 6 8 10
TAC
/10
6$
Payback period /year
NO HP
VRC HP
Figure 7.8 – Total annual cost of regeneration column following payback period with and without heat pump technique
7.6.3.Full VRC heat pump process
Full VRC heat pump process means that both column reboilers are heated up through heat pump as shown in
Figure 7.1(b). The outlet pressures of compressors are 2.5 atm and 5 atm taking from above. The cost data of
the process full VRC are shown in Table 7.8. Again it is better to use heat pump for both extractive and the
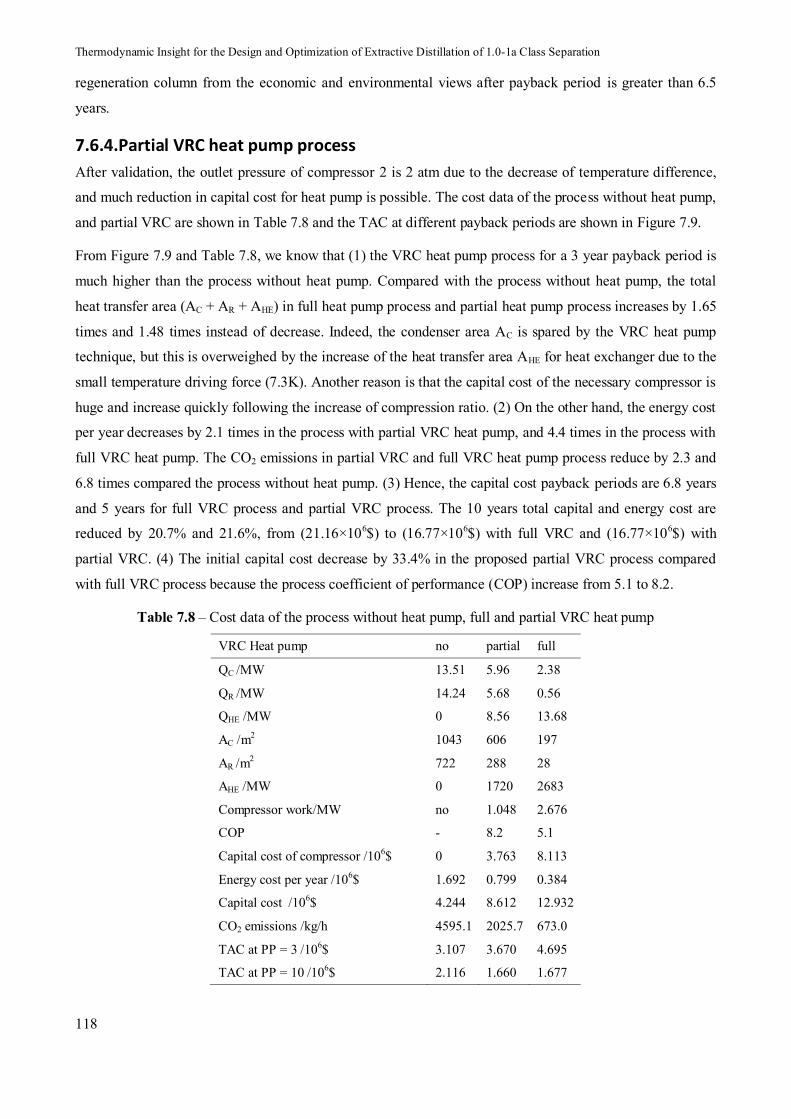
Thermodynamic Insight for the Design and Optimization of Extractive Distillation of 1.0-1a Class Separation
118
regeneration column from the economic and environmental views after payback period is greater than 6.5
years.
7.6.4.Partial VRC heat pump process
After validation, the outlet pressure of compressor 2 is 2 atm due to the decrease of temperature difference,
and much reduction in capital cost for heat pump is possible. The cost data of the process without heat pump,
and partial VRC are shown in Table 7.8 and the TAC at different payback periods are shown in Figure 7.9.
From Figure 7.9 and Table 7.8, we know that (1) the VRC heat pump process for a 3 year payback period is
much higher than the process without heat pump. Compared with the process without heat pump, the total
heat transfer area (AC + AR + AHE) in full heat pump process and partial heat pump process increases by 1.65
times and 1.48 times instead of decrease. Indeed, the condenser area AC is spared by the VRC heat pump
technique, but this is overweighed by the increase of the heat transfer area AHE for heat exchanger due to the
small temperature driving force (7.3K). Another reason is that the capital cost of the necessary compressor is
huge and increase quickly following the increase of compression ratio. (2) On the other hand, the energy cost
per year decreases by 2.1 times in the process with partial VRC heat pump, and 4.4 times in the process with
full VRC heat pump. The CO2 emissions in partial VRC and full VRC heat pump process reduce by 2.3 and
6.8 times compared the process without heat pump. (3) Hence, the capital cost payback periods are 6.8 years
and 5 years for full VRC process and partial VRC process. The 10 years total capital and energy cost are
reduced by 20.7% and 21.6%, from (21.16×10⁶$) to (16.77×10⁶$) with full VRC and (16.77×10⁶$) with
partial VRC. (4) The initial capital cost decrease by 33.4% in the proposed partial VRC process compared
with full VRC process because the process coefficient of performance (COP) increase from 5.1 to 8.2.
Table 7.8 – Cost data of the process without heat pump, full and partial VRC heat pump
VRC Heat pump no partial full
QC /MW 13.51 5.96 2.38
QR /MW 14.24 5.68 0.56
QHE /MW 0 8.56 13.68
AC /m2 1043 606 197
AR /m2 722 288 28
AHE /MW 0 1720 2683
Compressor work/MW no 1.048 2.676
COP - 8.2 5.1
Capital cost of compressor /106$ 0 3.763 8.113
Energy cost per year /106$ 1.692 0.799 0.384
Capital cost /106$ 4.244 8.612 12.932
CO2 emissions /kg/h 4595.1 2025.7 673.0
TAC at PP = 3 /106$ 3.107 3.670 4.695
TAC at PP = 10 /106$ 2.116 1.660 1.677
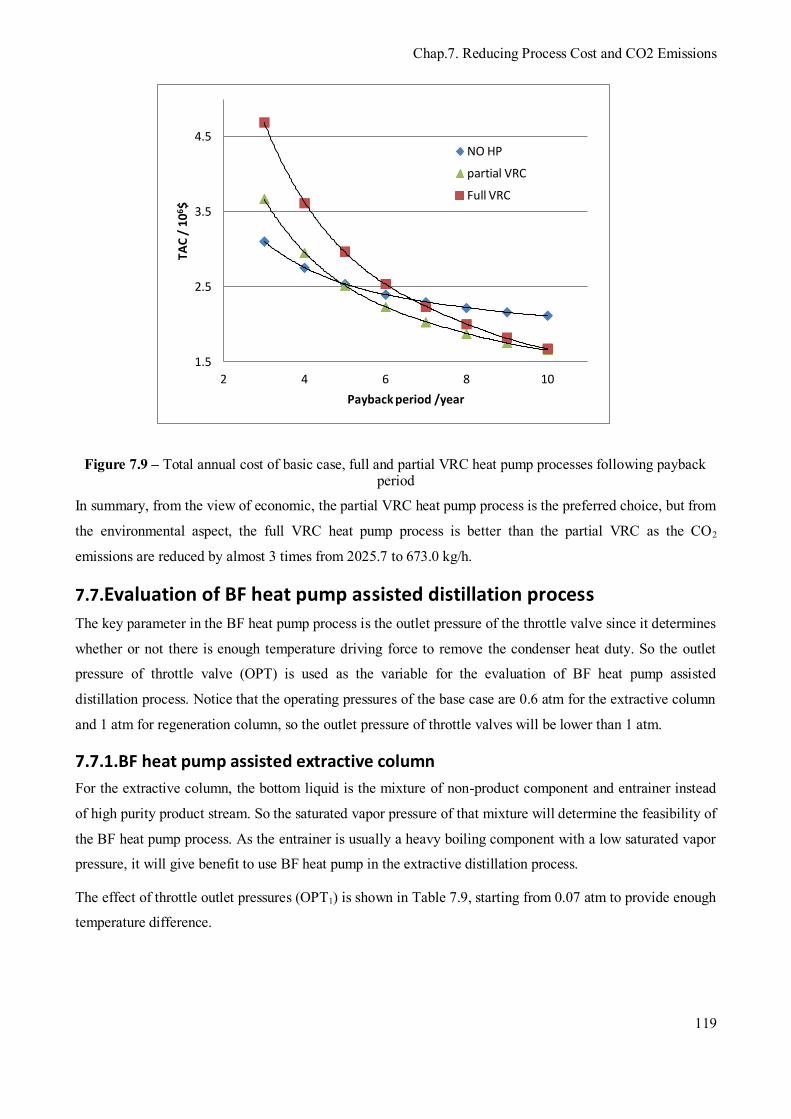
Chap.7. Reducing Process Cost and CO2 Emissions
119
1.5
2.5
3.5
4.5
2 4 6 8 10
TA
C /
10
6$
Payback period /year
NO HP
partial VRC
Full VRC
Figure 7.9 – Total annual cost of basic case, full and partial VRC heat pump processes following payback period
In summary, from the view of economic, the partial VRC heat pump process is the preferred choice, but from
the environmental aspect, the full VRC heat pump process is better than the partial VRC as the CO2
emissions are reduced by almost 3 times from 2025.7 to 673.0 kg/h.
7.7.Evaluation of BF heat pump assisted distillation process
The key parameter in the BF heat pump process is the outlet pressure of the throttle valve since it determines
whether or not there is enough temperature driving force to remove the condenser heat duty. So the outlet
pressure of throttle valve (OPT) is used as the variable for the evaluation of BF heat pump assisted
distillation process. Notice that the operating pressures of the base case are 0.6 atm for the extractive column
and 1 atm for regeneration column, so the outlet pressure of throttle valves will be lower than 1 atm.
7.7.1.BF heat pump assisted extractive column
For the extractive column, the bottom liquid is the mixture of non-product component and entrainer instead
of high purity product stream. So the saturated vapor pressure of that mixture will determine the feasibility of
the BF heat pump process. As the entrainer is usually a heavy boiling component with a low saturated vapor
pressure, it will give benefit to use BF heat pump in the extractive distillation process.
The effect of throttle outlet pressures (OPT1) is shown in Table 7.9, starting from 0.07 atm to provide enough
temperature difference.

Thermodynamic Insight for the Design and Optimization of Extractive Distillation of 1.0-1a Class Separation
120
Table 7.9 – Cost data for extractive column with BF heat pump at different throttle valve outlet pressure
OPT1 /atm 0.07 0.09 0.1 0.11
TD /K 13.6 8.8 6.5 3.8
Energy cost 0.305 0.272 0.258 0.246
Capital cost 9.550 9.116 9.038 9.238
TAC at PP = 3 /106$ 3.489 3.311 3.271 3.325
As OPT1 increases, the bubble point and dew point of the bottom liquid mixtures increase, leading to the
decrease of the temperature driving force to remove the condenser duty. Meanwhile, the energy cost
decreases as the compressor duty decreases. However, the capital cost decreases until OPT1 = 0.1 atm, after
that the capital cost increase due to the increase of heat exchanger cost overwhelms the benefit caused by the
decrease of the compressor duty. The TAC at 3 year payback period quantitatively shows the effect of OPT1
on the extractive column. So OPT1 = 0.1 atm is used hereafter and the comparison of extractive column with
and without BF heat pump are shown in Table 7.10.
Table 7.10 – Comparison of extractive column with and without BF heat pump
Heat pump no Yes
QC /MW 8.21 1.87
QR /MW 8.56 0
QHE /MW 0 8.15
AC /m2 861 43
AR /m2 434 0
AHE /MW 0 1472
Compressor work/MW no 2.183
COP - 3.7
Capital cost of compressor /106$ 0 6.072
Energy cost per year /106$ 1.016 0.258
Capital cost /106$ 3.008 9.038
CO2 emissions /kg/h 2762.3 401.6
TAC at PP = 3 /106$ 2.018 3.271
TAC at PP = 10 /106$ 1.317 1.162
Just like the process with VRC heat pump, the BF heat pump process also increases the total heat transfer
area instead of decrease. The energy cost per year decreases by 3.9 times but the capital cost increases by 3
times. In summary, the 10 year total cost is saved by 11.8% and the CO2 emissions is reduced by 6.8 times.
Over the long term, the benefits of the BF heat pump assisted extractive distillation column are obvious in
both economic cost and environmental impact.
7.7.2.BF heat pump assisted regeneration column
The effect of the outlet pressures of throttle for regeneration column (OPT2) is regarded as the main variable
of the process and the results are shown in Table 7.11.
Chap.7. Reducing Process Cost and CO2 Emissions
121
Table 7.11 – Cost data for regeneration column with BF heat pump at different throttle valve outlet pressure
OPT2 /atm 0.1 0.15 0.2 0.22
TD /K 18.5 10.3 4.2 2.1
Energy cost 0.212 0.172 0.146 0.137
Capital cost 6.201 5.579 5.494 5.934
TAC at PP = 3 /106$ 2.279 2.032 1.977 2.115
Again, as OPT2 increases, the temperature driving force for removing the condenser duty decreases, and the
energy cost decrease as the compressor duty decrease. At OPT2 = 0.22 atm, the cost for heat exchanger
increases quickly leading to the increase of capital cost. Considering the TAC at 3 year payback period,
OPT2 = 0.2 atm is chosen hereafter for regeneration column with BF heat pump and the results are shown in
Table 7.12.
Table 7.12 – Comparison of regeneration column with and without BF heat pump
Heat pump no Yes
QC /MW 5.30 1.01
QR /MW 5.68 0
QHE /MW 0 5.46
AC /m2 182 16
AR /m2 288 0
AHE /MW 0 1526
Compressor work/MW no 1.230
COP - 4.4
Capital cost of compressor /106$ 0 3.794
Energy cost per year /106$ 0.673 0.146
Capital cost /106$ 1.192 5.494
CO2 emissions /kg/h 1832.9 226.3
TAC at PP = 3 /106$ 1.071 1.977
TAC at PP = 10 /106$ 0.793 0.695
The energy cost per year for the regeneration column with BF heat pump decreases by 4.6 times, and the
capital cost increases by 4.6 times. Generally speaking, the 10 year total cost is reduced by 12.4% and the
CO2 emissions are reduced from 1832.9 kg/h to 226.3 kg/h. Again, over the long term, the benefits of BF
heat pump for the entrainer regeneration column than base case is obvious in both economic and
environment aspect.
7.7.3.Full BF heat pump process
Full BF heat pump process means that both column condensers are cooled down by the vaporization of the
bottom liquid streams after throttle valve. The flow sheet is shown in Figure 7.1(c). The outlet pressures of
the two throttle valves are 0.1 atm and 0.2 atm taking from above.

Thermodynamic Insight for the Design and Optimization of Extractive Distillation of 1.0-1a Class Separation
122
7.7.4.Partial BF heat pump process
Again, in order to reduce the capital cost of full BF heat pump process, a new partial BF heat pump flow
sheet is proposed as shown in Figure 7.10. The condenser in the regeneration column is cooled down by
vaporizing of partial bottom liquid in extractive column, and the other part is used to move heat from the
condenser of the extractive column.
After validation, the OPT2 is 0.3 atm due to the decrease of temperature difference, leading to much
reduction in capital cost for heat pump.
Main feed
D1
entrainer
R1
Auxiliary condenser
feed
R2
D2
W2
Figure 7.10 – Partial BF heat pump for extractive distillation process The cost data of the process without heat pump, full and partial BF heat pump are shown in Table 7.13 and
the TAC at different payback periods are shown in Figure 7.11.
From Figure 7.11 and Table 7.13, we know that (1) compared with the process without heat pump, the total
heat transfer area in full and partial BF heat pump process increase by 1.73 times and 1.28 times. (2) The
energy cost per year dramatically by 2.0 times in the process with partial BF heat pump, and 4.2 times in the
process with full BF heat pump. The CO2 emissions in partial BF and full BF heat pump process reduce by
2.2 and 7.3 times compared the process without heat pump. This is the main advantages of heat pump
technique. (3) Meanwhile, the total capital cost increase dramatically due to the cost of compressors. (4) The
capital cost payback periods are 8.0 years and 6.2 years for full and partial BF process. (5) The 10 years total
capital and energy cost are reduced by 7.3 % and 14.8 %, from (21.16×10⁶$) to (19.61×10⁶$) with the full
BF and to (18.03×10⁶$) with partial BF. (6) The partial BF gives a 33.3% reduction in the capital cost
compared with full BF process. Meanwhile, the process coefficient of performance increases by 40%.
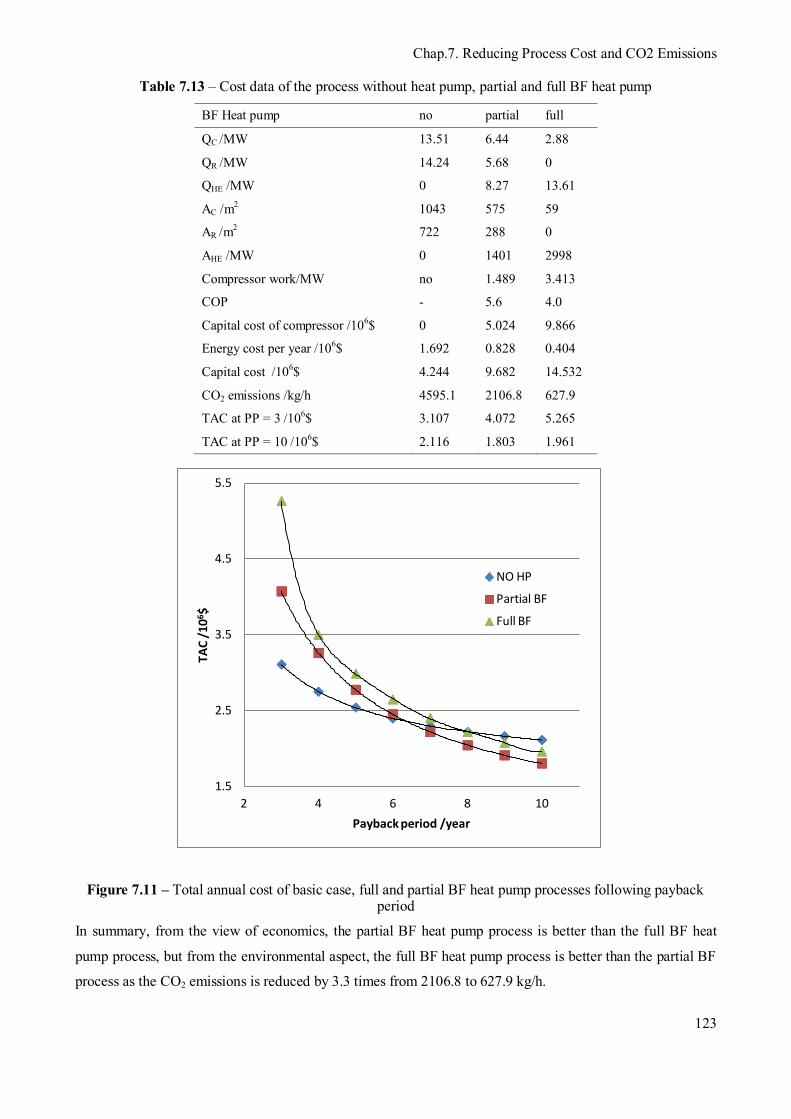
Chap.7. Reducing Process Cost and CO2 Emissions
123
Table 7.13 – Cost data of the process without heat pump, partial and full BF heat pump
BF Heat pump no partial full
QC /MW 13.51 6.44 2.88
QR /MW 14.24 5.68 0
QHE /MW 0 8.27 13.61
AC /m2 1043 575 59
AR /m2 722 288 0
AHE /MW 0 1401 2998
Compressor work/MW no 1.489 3.413
COP - 5.6 4.0
Capital cost of compressor /106$ 0 5.024 9.866
Energy cost per year /106$ 1.692 0.828 0.404
Capital cost /106$ 4.244 9.682 14.532
CO2 emissions /kg/h 4595.1 2106.8 627.9
TAC at PP = 3 /106$ 3.107 4.072 5.265
TAC at PP = 10 /106$ 2.116 1.803 1.961
1.5
2.5
3.5
4.5
5.5
2 4 6 8 10
TAC
/10
6$
Payback period /year
NO HP
Partial BF
Full BF
Figure 7.11 – Total annual cost of basic case, full and partial BF heat pump processes following payback period
In summary, from the view of economics, the partial BF heat pump process is better than the full BF heat
pump process, but from the environmental aspect, the full BF heat pump process is better than the partial BF
process as the CO2 emissions is reduced by 3.3 times from 2106.8 to 627.9 kg/h.

Thermodynamic Insight for the Design and Optimization of Extractive Distillation of 1.0-1a Class Separation
124
7.7.5.Summary of mechanical heat pump
In general, compared with the traditional process, the full heat pump assisted extractive distillation process
demonstrates a strong advantage in both economical and environmental aspects. The full VRC heat pump
shows a better performance than the full BF heat pump since the 10 year total cost is further reduced by
14.5%, but and CO2 emissions increase by 6.7%. The partial VRC heat pump process proposed in this study
has 1.7×10⁵$ reduction in 10 year total cost and 3.8% CO2 emissions reduction comparing with the proposed
partial BF heat pump process. The CO2 emissions in partial VRC heat pump process is only 44.1% of that in
traditional process though it is 3 times compared with full VRC heat pump process. The proposed partial
heat pump (partial VRC and partial BF) processes based on the character of extractive distillation can
effectively decrease the initial capital cost and increase the process coefficient of performance. In summary,
from the economical view, the partial VRC heat pump process is the best choice in mechanical heap pump
process, but from the environmental aspect, the full BF heat pump process is better than other alternatives.
7.8.Comparison of OPHI and partial VRC
As shown before, OPHI is the best choice in double-effect heat integration, whereas partial VRC gives the
lowest TAC. Thus, we show the comparison of OPHI process and partial VRC heat pump process in Figure
7.12 and Table 7.14.
1
2
3
4
2 4 6 8 10
TAC
/ 1
06$
Payback period /year
OPHI
Partial VRC
Figure 7.12 – Total annual cost of optimal partial HI and partial VRC process following payback period
Chap.7. Reducing Process Cost and CO2 Emissions
125
Table 7.14 – Comparison of optimal partial HI, partial VRC processes
Process OPHI PVRC
Initial investment/106$ 4.013 8.612
CO2 emissions /kg/h 3117.2 2025.7
TAC at PP = 3 /106$ 2.349 3.670
TAC at PP = 10 /106$ 1.414 1.660
From Table 7.14 and Figure 7.12, we remark that (1) the optimal partial heat integration process is preferable
from the economical point of view. It gives a 2.46×10⁶$ and a 7.02×10⁶$ total process cost saving over a 10
year period compared with partial VRC and base case, respectively. The optimal partial heat integration
process overwhelms the partial VRC heat pump process because the temperature differences between the
extractive and regeneration columns are higher, leading to relatively poor coefficient of performance of heat
pump process. (2) On the contrary, CO2 emissions are reduced by more than 35% in partial VRC heat pump
process comparing to optimal partial heat integration process. The potential of heat pump process in reducing
CO2 emissions contributes its interest.
7.9.Conclusions
In order to save the total cost and increase the environmental performance (CO2 emissions) of traditional
extractive distillation process for the separation of minimum azeotropic mixture acetone-methanol with
heavy entrainer water, double-effect heat integration and mechanical heat pump are extensively investigated.
Firstly, three kinds of double-effect heat integrations are studied. The direct partial heat integration and full
heat integration are the most studied two situations. We propose a novel optimal partial heat integration
process aiming at achieving the most energy saving for extractive distillation. A new objective function OF2
describe the energy cost per unit product flow rate is proposed to carry out the optimization of double-effect
heat integration by the SQP method in Aspen plus software. The direct partial and optimal full heat
integration are regarded as the extremely conditions where (Qr1-Qc2) in OF2 taking the maximal value or
the minimal value zero. The results show that double-effect heat integrations give the massive reduction in
TAC, energy cost and CO2 emissions. The optimal partial heat integration has the lowest TAC instead of the
optimal full heat integration process as intuition, and it gives a little lower CO2 emissions. This demonstrates
that before rigorous simulation and optimization, the double-effect heat integration can’t be used arbitrarily.
Secondly, in order to reduce the CO2 emissions and initial capital cost, the mechanical heat pump (VRC and
BF) is evaluated and both economical and environmental aspects are taken into account. The outlet pressure
of compressors is regarded as the main variable for VRC process while the outlet pressure of throttle valves
is used for BF process. The partial VRC and partial BF heat pump are proposed based on the character of
extractive distillation process that the temperature difference between the bottom of the extractive column
and the top of the regeneration column is usually small, and the process coefficient of performance increase
by 60.7% and 40.0% compared with the full VRC and full BF heat pump process. The results show that
Thermodynamic Insight for the Design and Optimization of Extractive Distillation of 1.0-1a Class Separation
126
partial VRC process has both lower TAC and CO2 emissions than partial BF process. The full VRC process
shows lower TAC but higher CO2 emissions than full BF process. Partial VRC process gives better
performance from economical view while full BF process leads better performance in environmental aspect.
In summary, the lowest TAC process is the proposed optimal partial heat integration and the lowest CO2
emissions process is the full BF process. Partial VRC process gives a trade-off between TAC and CO2
emissions comparing to full VRC process, and it also significantly reduces the initial investment.

Chap.8. Conclusions and perspectives
127
Chapter 8. Conclusions and perspectives
Thermodynamic Insight for the Design and Optimization of Extractive Distillation of 1.0-1a Class Separation
128
8.Conclusions and perspectives
8.1.Conclusions
A systematic approach in saving energy consumption and improving the energy efficiency of industrial
processes is the onion-model developed in industrial (Bruinsma and Spoelstra, 2010). Following the onion-
model, based on the knowledge of thermodynamic insight of extractive distillation process, we try to find the
opportunity to saving energy cost and capital cost in process itself, double-effect heat integration, heat pump
and utilities.
In the field of the extractive distillation process, process feasibility study and process optimal design are
always the hot issues. In this manuscript, we use the general feasibility criterion reported by our team as
guideline for the process optimization and give a better understanding of the complex process. The results of
the optimization which is important for industry give feedbacks to the process feasibility.
We developed a two step optimization strategy for extractive distillation to find suitable values of the
entrainer feed flowrate, entrainer feed and azeotropic mixture feed locations, total number of trays, reflux
ratio, heat duty and condenser duty in both the extractive column and the entrainer regeneration column. The
first strategy relies upon the use of a multi-objective genetic algorithm (GA) with four objective functions:
OF, TAC, Eext and eext. Secondly, results taken from the GA Pareto front are further optimized focusing on
decreasing the energy cost by using the four steps procedure: Aspen plus simulator built-in SQP method is
used for the optimization of the continuous variables: column refluxes R1, R2 and the entrainer flow rate FE
with the energy consumption OF as objective function (step 1). A sensitivity analysis is performed to find
optimal values of the two distillates D1, D2 (step 2) and the feed tray locations NFE, NFAB, NFReg (step 3) while
step 1 is done for each set of discrete variable values. Step 4 is to find the final design through minimizing
OF value, corroborate in closed loop flowsheet, and calculate TAC and thermodynamic efficiency indicators.
Chapter 3 concerns the formation and use of four steps procedure for extractive distillation, and the effects of
the process variables on each other and on the process. We have obtained optimal parameters for an
extractive distillation process for separating the minimum boiling azeotropic mixture acetone-methanol with
water (class 1.0-1a) as entrainer, taking into account the both extractive distillation and the entrainer
regeneration columns and compared it with Luyben’s design under the constraint of 0.995 mole fraction
acetone and methanol products. We have combined SQP optimization for the continuous variables FE, R1, R2,
and sensitivity analysis for D1, D2, NFE, NFF, NFReg. A new objective function accounting for all the energy
consumption of per product flow rate value is proposed. Compared with Luyben’s design in literature, the
total annual cost and energy consumption are reduced by 12.0 % and 14.5 % respectively based on the same
column stage numbers. Significant savings in both energy cost and TAC are achieved.

Chap.8. Conclusions and perspectives
129
Chapter 4 and 5 concerns finding the possible way to save energy cost in extractive distillation process based
on the knowledges of thermodynamic insight.
In chapter4, we have studied the improving design of extractive distillation process for the separation of the
acetone – methanol minimum boiling azeotrope with water. By using thermodynamic insight from the
analysis of the ternary residue curve map and isovolatility curves, we have noticed the beneficial effect of
lowering the pressure in the extractive distillation column. A lower pressure will not only reduces the
minimal amount of entrainer, but also increases the relative volatility of acetone – methanol for the
composition in the distillation region where the extractive column operates. The 0.6 atm pressure was
selected to enable the use of cheap cooling water in the condenser.
Then we have run an optimization aiming at minimizing the total energy consumption per product unit as
objective function OF. OF includes both products and both columns energy demands at boiler and condenser
and accounts for the price difference in heating and cooling energy and for the price difference in product
sales. Rigorous simulations in closed loop flow sheet were done in all cases. For the sake of comparison and
process optimal retrofitting, we have kept the total number of trays as literatures. Other variables have been
optimized: entrainer flow rate, reflux ratios, entrainer feed location and main feed location.
Double digit savings in energy consumption and in TAC have been achieved compared to literature values
thanks to the optimization scheme helped with thermodynamic insight analysis. Two important issues have
emerged. First the reduction of pressure is beneficial to the separation. Second, we have proposed a novel
function expressing the efficiency of the extractive section and found it correlated with the best design. We
have shown that a high Eext is correlated to a well-designed extractive distillation process. We have noticed
that a suitable shift of the feed trays locations improves the efficiency of the separation, even when less
entrainer is used and related that to thermodynamic insight gained from the ternary diagram analysis.
Comparison with literature design confirms that the total extractive efficiency and the extractive efficiency
per tray functions are a relevant criterion to assess the performance of an extractive distillation process
design.
In chapter 5, We have optimized the design of a homogeneous extractive distillation process for the
separation of the DIPE – IPA minimum boiling azeotrope with heavy entrainer 2-methoxyethanol aiming at
further demonstrate our methodology used in chapter 4 in finding the possible way to saving energy cost and
total annual cost., we have noticed again that lowering the pressure is beneficial to the process separation by
using the thermodynamic insight from the analysis of the ternary residue curve map and isovolatility curves.
A lower pressure reduces the usage of entrainer and increases the relative volatility of DIPE – IPA for the
same entrainer content in the distillation region where the extractive column operates. A 0.4 atm pressure
was selected to enable the use of cheap cooling water in the condenser and for further optimization. The
energy consumption OF is used again for optimizing the variables of two distillates, entrainer flow rate,

Thermodynamic Insight for the Design and Optimization of Extractive Distillation of 1.0-1a Class Separation
130
reflux ratios, entrainer feed location and main feed location, and rigorous simulations in closed loop flow
sheet were done in all cases. The TAC was calculated for all cases.
Thanks to the optimization scheme helped with thermodynamic insight analysis, significant savings in
energy consumption has been achieved while TAC is also reduced. The decrease of energy cost OF
following the increase of distillate has been explained by the relationship of two distillates through mass
balance. We have shown that pressure reduction is a possible way to save energy cost and total annual cost
based on the thermodynamic insight gained from the ternary diagram analysis. The total extractive efficiency
indicator and the extractive efficiency indicator per tray are relevant criterions to assess the performance of
an extractive distillation process design.
Chapter 6 focuses on two step optimization strategy demonstrated for acetone-methanol with water (class
1.0-1a) extractive distillation process. The advantage of both methods are taken into account: NSGA method
can avoid the local optimal and supply a good initial design for SQP method meanwhile the optimal design
can be obtained more quickly.
First, aiming at investigating the influences of the thermodynamic efficiency indicators to find an optimal
design, we run the optimization by using multi-objective NSGA method since it is not not needing good
initial value and allowing the optimization of both continuous (reflux ratio, entrainer and distillates flowrates)
and discrete (column tray number and feed locations) variables. It is coded in Excel by our teammates and
we linked it with Aspen plus software through programming in VBA. Four objective functions: extractive
efficiency indicator Eext and eext are maximized meanwhile TAC (economic view) and OF (energy cost per
unit product) are minimized while 99.5% products purities in the distillates are set as constraints. Through
the analysis of Pareto front, the effects of main variables entrainer-to-feed ratio and reflux ratio on TAC and
efficiency indicator are shown. There is a maximum Eext for a given reflux ratio, and there is a minimum R1
for a given Eext. There exist the optimal efficiency indicator Eext,opt which corresponds the optimal design
defined as the one with the lowest TAC and Eext,opt can be used as a criterion for the evaluating of different
design for the same system. For acetone-methanol with water system, Eext,opt locates at 0.161±3% at 0.6 atm.
Indeed we have to conclude that although the thermodynamic efficiency indicators can’t be used as an
optimization criterion alone, it is worth combining it with usual criteria such as TAC and OF. Through the
analysis of extractive profile map, we explain the reasons that efficiency indicator increase following the
decrease of entrainer flow rate and the increase of reflux ratio.
Second, the four steps procedure is used to further improve the design following the decrease of OF with the
good initial values from NSGA method, and a competitive design is shown. Based on the combination of
extractive profile map and the final design, we prove that NSGA optimization with maximizing Eext is doable
even that the optimal design is not the one with maximum Eext.

Chap.8. Conclusions and perspectives
131
Chapter 7 solves the problems of double-effect heat integration and heat pump technique in order to save the
total cost and increase the environmental performance (CO2 emissions) of traditional extractive distillation
process for the separation of minimum azeotropic mixture acetone-methanol with heavy entrainer water.
In double-effect heat integration, three kinds of double-effect heat integrations are studied. The direct partial
heat integration and full heat integration are the most two situations in the open references. We propose a
novel optimal partial heat integration process aiming at the most energy saving for extractive distillation. A
new objective function OF2 is proposed to carry out the optimization of double-effect heat integration with
the four steps procedure. The direct partial and optimal full heat integration are regarded as the extremely
conditions where (Qr1-Qc2) in OF2 taking the maximal value or the minimal value zero. The results show
that double-effect heat integrations give the massive reduction in TAC, energy cost and CO2 emissions
compared with traditional one. The optimal partial heat integration has the lowest TAC instead of the optimal
full heat integration process as intuition as well as a little lower CO2 emissions.
In heat pump technique, the mechanical heat pump (VRC and BF) is evaluated and both economical and
environmental aspects are taken into account in order to further saving TAC and initial capital cost. The
outlet pressure of compressors is regarded as the main variable for VRC process while the outlet pressure of
throttle valves is used for BF process. Based on the character of extractive distillation process, the partial
VRC and partial BF heat pump are proposed, and the process coefficient of performance increase by 60.7%
and 40.0% compared with the full VRC and full BF heat pump process. Partial VRC process gives better
performance from economical view while full BF process leads better performance in environmental aspect.
In summary, the lowest TAC process is the proposed optimal partial heat integration and the lowest CO2
emissions process is the full BF process. Partial VRC process gives a trade-off between TAC and CO2
emissions comparing to full VRC process, and it also significantly reduces the initial investment.
8.2.Perspectives
A future work in the area of the optimization of extractive distillation may treat some of the following topic:
1. The optimization method in this manuscript with acetone-methanol with water as entrainer can be used
for the optimization of other mixtures for example ethanol-water since it is also pressure sensitive
azeotrope.
2. With two step optimization strategy, other class of azeotropic mixture (0.0-1, 1.0-1b, 1.0-2) can be
conducted based on the knowledge of thermodynamic insight. Notice that the maximum azeotropic
mixtures with a heavy entrainer class 1.0-2 have done.
3. The two step optimization strategy can also be extended to the pressure-swing distillation or azeotropic
distillation with the knowledges of the process feasibility.

Thermodynamic Insight for the Design and Optimization of Extractive Distillation of 1.0-1a Class Separation
132
4. The dividing wall column for extractive distillation can be optimized using two step optimization
strategy. The difficulties lie at the convergence of the circle of interstream in DWC and the circle of
entrainer at the same time.

Chap.9. Appendix
133
Chapter 9. Appendix
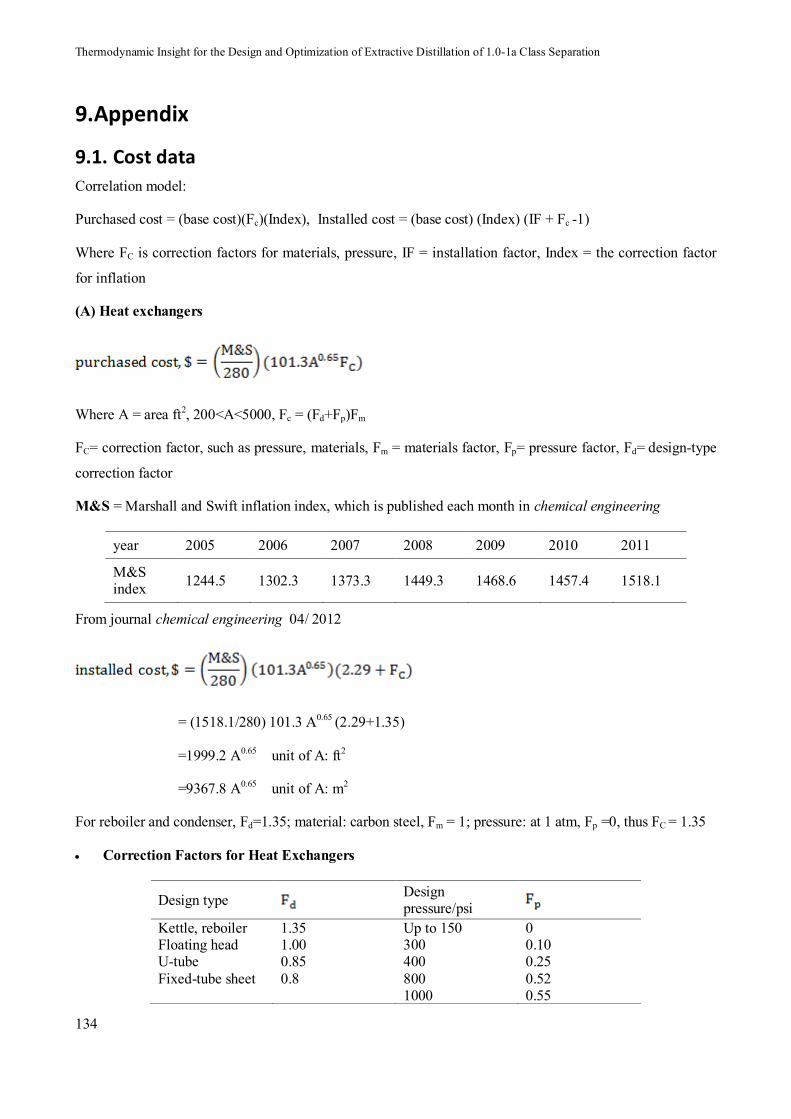
Thermodynamic Insight for the Design and Optimization of Extractive Distillation of 1.0-1a Class Separation
134
9.Appendix
9.1. Cost data
Correlation model:
Purchased cost = (base cost)(Fc)(Index), Installed cost = (base cost) (Index) (IF + Fc -1)
Where FC is correction factors for materials, pressure, IF = installation factor, Index = the correction factor
for inflation
(A) Heat exchangers
Where A = area ft2, 200<A<5000, Fc = (Fd+Fp)Fm
FC= correction factor, such as pressure, materials, Fm = materials factor, Fp= pressure factor, Fd= design-type
correction factor
M&S = Marshall and Swift inflation index, which is published each month in chemical engineering
year 2005 2006 2007 2008 2009 2010 2011
M&S index 1244.5 1302.3 1373.3 1449.3 1468.6 1457.4 1518.1
From journal chemical engineering 04/ 2012
= (1518.1/280) 101.3 A0.65 (2.29+1.35)
=1999.2 A0.65 unit of A: ft2
=9367.8 A0.65 unit of A: m2
For reboiler and condenser, Fd=1.35; material: carbon steel, Fm = 1; pressure: at 1 atm, Fp =0, thus FC = 1.35
Correction Factors for Heat Exchangers
Design type
Design pressure/psi
Kettle, reboiler 1.35 Up to 150 0 Floating head 1.00 300 0.10 U-tube 0.85 400 0.25 Fixed-tube sheet 0.8 800 0.52 1000 0.55
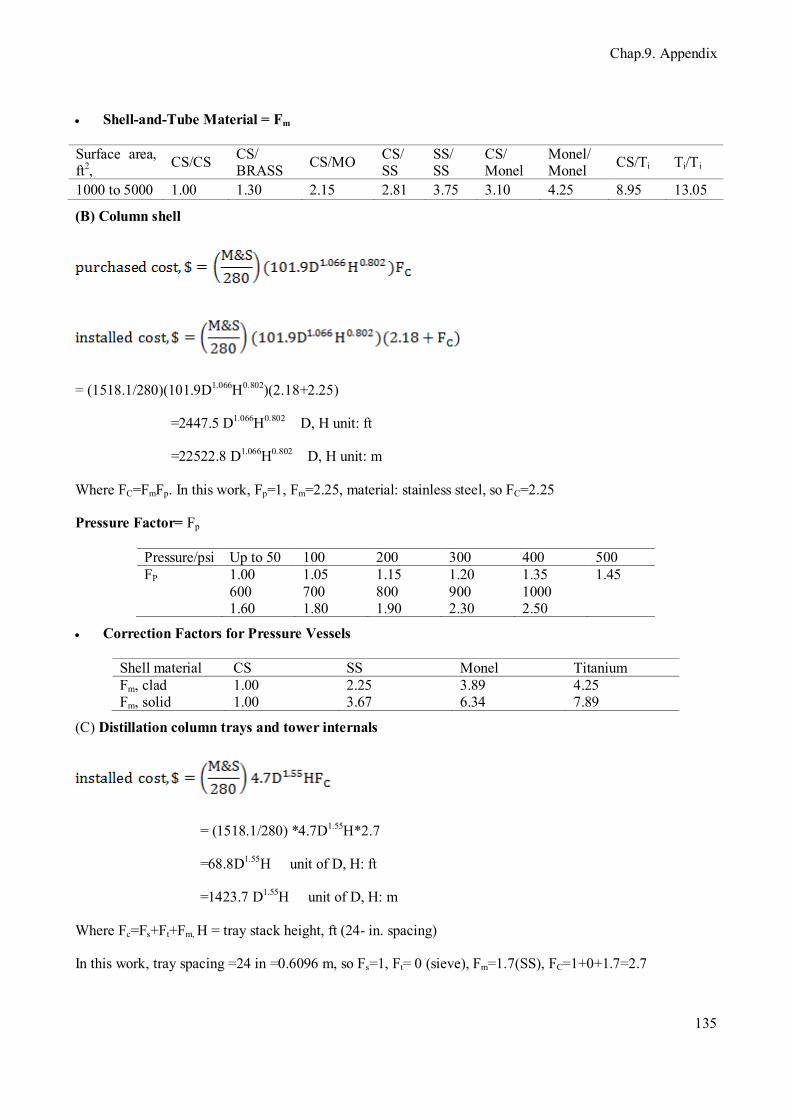
Chap.9. Appendix
135
Shell-and-Tube Material = Fm
Surface area, ft2, CS/CS CS/
BRASS CS/MO CS/ SS
SS/ SS
CS/ Monel
Monel/ Monel CS/Ti Ti/Ti
1000 to 5000 1.00 1.30 2.15 2.81 3.75 3.10 4.25 8.95 13.05
(B) Column shell
= (1518.1/280)(101.9D1.066H0.802)(2.18+2.25)
=2447.5 D1.066H0.802 D, H unit: ft
=22522.8 D1.066H0.802 D, H unit: m
Where FC=FmFp. In this work, Fp=1, Fm=2.25, material: stainless steel, so FC=2.25
Pressure Factor= Fp
Pressure/psi Up to 50 100 200 300 400 500 FP 1.00 1.05 1.15 1.20 1.35 1.45 600 700 800 900 1000 1.60 1.80 1.90 2.30 2.50
Correction Factors for Pressure Vessels
Shell material CS SS Monel Titanium Fm, clad 1.00 2.25 3.89 4.25 Fm, solid 1.00 3.67 6.34 7.89
(C) Distillation column trays and tower internals
= (1518.1/280) *4.7D1.55H*2.7
=68.8D1.55H unit of D, H: ft
=1423.7 D1.55H unit of D, H: m
Where Fc=Fs+Ft+Fm, H = tray stack height, ft (24- in. spacing)
In this work, tray spacing =24 in =0.6096 m, so Fs=1, Ft= 0 (sieve), Fm=1.7(SS), FC=1+0+1.7=2.7
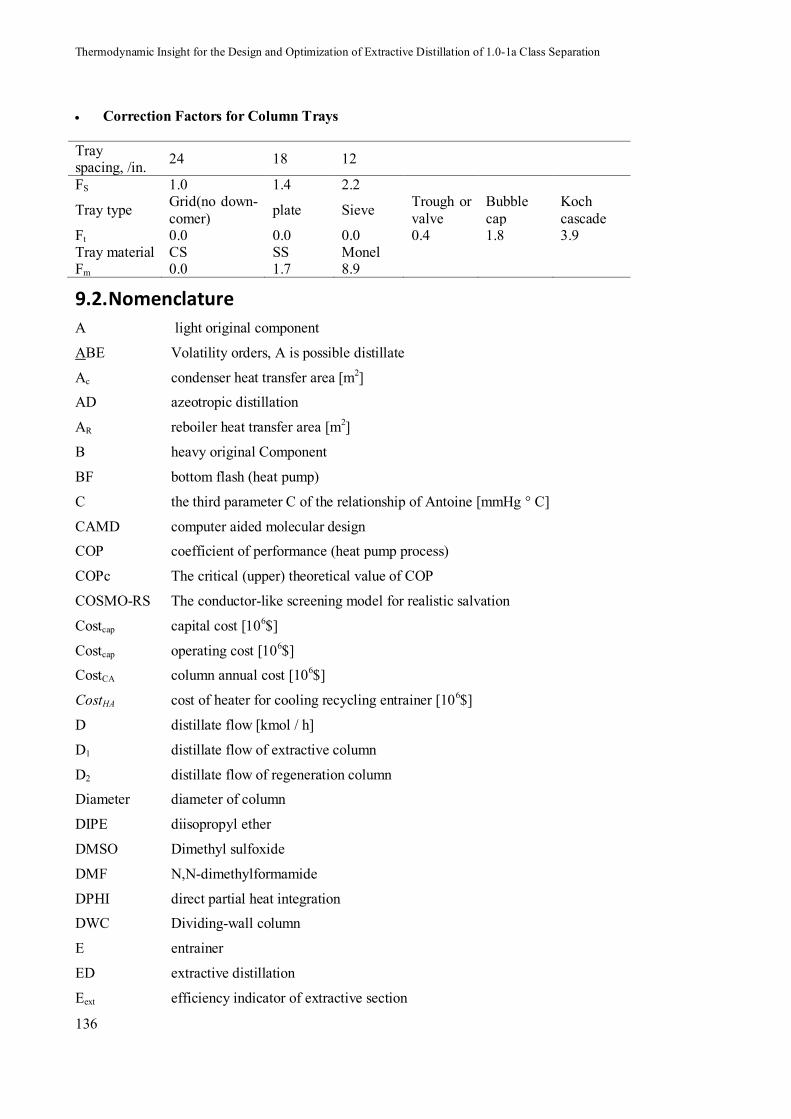
Thermodynamic Insight for the Design and Optimization of Extractive Distillation of 1.0-1a Class Separation
136
Correction Factors for Column Trays
Tray spacing, /in. 24 18 12
FS 1.0 1.4 2.2
Tray type Grid(no down-comer) plate Sieve Trough or
valve Bubble cap
Koch cascade
Ft 0.0 0.0 0.0 0.4 1.8 3.9 Tray material CS SS Monel Fm 0.0 1.7 8.9
9.2.Nomenclature
A light original component
ABE Volatility orders, A is possible distillate
Ac condenser heat transfer area [m2]
AD azeotropic distillation
AR reboiler heat transfer area [m2]
B heavy original Component
BF bottom flash (heat pump)
C the third parameter C of the relationship of Antoine [mmHg ° C]
CAMD computer aided molecular design
COP coefficient of performance (heat pump process)
COPc The critical (upper) theoretical value of COP
COSMO-RS The conductor-like screening model for realistic salvation
Costcap capital cost [106$]
Costcap operating cost [106$]
CostCA column annual cost [106$]
CostHA cost of heater for cooling recycling entrainer [106$]
D distillate flow [kmol / h]
D1 distillate flow of extractive column
D2 distillate flow of regeneration column
Diameter diameter of column
DIPE diisopropyl ether
DMSO Dimethyl sulfoxide
DMF N,N-dimethylformamide
DPHI direct partial heat integration
DWC Dividing-wall column
E entrainer
ED extractive distillation
Eext efficiency indicator of extractive section
Chap.9. Appendix
137
eext efficiency indicator of per tray in extractive section
F feed flow rate [kmol / h]
FAB original azeotropic mixtures feed flow rate [kmol / h]
FE entrainer feed flow rate [kmol / h]
FE/F feed ratio, continuous process
FE/V feed ratio, batch process
(FE/V)min minimum feed ratio, batch process
(FE/V)max maximum feed ratio, batch process
Fuelfactor the fuel factor, reflecting the types of the fuels
GA genetic algorithm
Hv vapor enthalpy
hl liquid enthalpy
hproc the enthalpy of steam delivered to the process [kJ/kg]
Height height of column
HTU height of transfer units
HIDiC highly integrated distillation columns
ILs ionic liquids
Ics column shell investment cost [106$]
IHE heat exchanger investment cost [106$]
IPA isopropyl alcohol
k product price factor for A vs B,
Ki distribution coefficient
L liquid flow rate [mol / h]
Le extractive section liquid flow rate
Ls stripping extractive section liquid flow rate
LT boiling liquid at top vessel
M energy price difference factor for condenser vs reboiler
MHP mechanical heat pump
MESH material, equilibrium, summation and enthalpy equation
MINLP mixed integer non-linear programming
N number of theoretical stages
NExt number of theoretical stages of extractive column
NFE entrainer feed stages
NFF original mixture feed stages
NFReg number of theoretical stages of regeneration column
NSGA Non-Sorted Genetic Algorithm
NTU number of transfer units

Thermodynamic Insight for the Design and Optimization of Extractive Distillation of 1.0-1a Class Separation
138
NHV the net heating value of a fuel with a carbon content (kJ/kg)
OF objective function (the energy consumption per product flow rate)
OPC1 outlet pressure of compressor for extractive column [atm]
OPC2 outlet pressure of compressor for regeneration column [atm]
OPHI optimal partial heat integration
OPFI optimal full heat integration
OPT1 outlet pressures of throttle for extractive column [atm]
OPT2 outlet pressures of throttle for regeneration column [atm]
p pressure [Hgmm] [atm]
PSD pressure-swing distillation
PV Pervaporation
Qc1 condenser heat duty of extractive column [MW]
Qc1 condenser heat duty of regeneration column [MW]
Qfuel the amount of fuel burnt [MW]
QHA heat duty of heater for cooling recycling entrainer [MW]
Qr1 reboiler heat duty of extractive column [MW]
Qr2 reboiler heat duty of regeneration column [MW]
R reflux ratio
Rmax maximum reflux ratio
Rmin minimum reflux ratio
RBM rectifying body methond
RCM residue curve map
RD reactive distillation
[SNextr] extractivefeasible region
S reboil ratio
S1 saddle originating at the “product” vertex
S2 saddle originating at the “nonproduct” vertex
SN stable node originating at the azeotrope
SN’ stable node originating outside the composition simplex
SQP Sequential quadratic programming
Str stripping section
T temperature [K]
TC top temperature of column [K]
TD temperature difference [K]
TFTB the flame temperature [OC]
TR bottom temperature of column [K]
T0 the ambient temperature [OC]
Chap.9. Appendix
139
Tstack the stack temperature [OC]
TAC total annual cost
UN unstable node originating at the entrainer vertex
UN’ unstable node originating outside the composition simplex
V vapor flows [kmol h-1]
VRC vapor recompression
W bottom product flow rate [mol / h]
xD distillate fraction
xi liquid mole fraction of component i
xF original mixture liquid mole fraction
xE entrainer liquid mole fraction
xF+xE original mixture and entrainer mass balance point
xp intersection point between univolatility curve and residue curve passing through
the distillate product
xW residue mole fraction
y* vapor phase composition in equilibrium with x
yi vapor mole fraction of component i
Greek letters
α the molar masses content of carbon in CO2
αij volatility of component i relative to component j
γi activity coefficient of component i
λproc the latent heat of steam delivered to the process [kJ/kg]
τ binary interaction parameter in NRTL model
η the Carnot efficiency
Subscripts
j component index
min minimum value
T top (decanter) vessel
m middle section or middle section map
r rectifying section or rectifying map
s stripping section or stripping map
Heavy heavy (least volatile) component
light light (most volatile) component
Explanation of Figures
● stable node of the distillation line map
Ο unstable node of the distillation line map
∆ saddle point of the distillation line map
Thermodynamic Insight for the Design and Optimization of Extractive Distillation of 1.0-1a Class Separation
140
composition profile
continuous feasible line
batch feasible line
simulated rectifying composition profile
simulated extractive composition profile
simulated stripping composition profile
extractive and stripping separatrix
residue curve map separatrix
univolatility line
Chap.9. Appendix
141
9.3.References
A
Andersen, H.W., Laroche, L., Morari, M., 1991. Dynamics of homogeneous azeotropic distillation columns. Ind. Eng. Chem. Res. 30, 1846–1855.
Arifin, S., Chien, I.-L., 2008. Design and Control of an Isopropyl Alcohol Dehydration Process via Extractive Distillation Using Dimethyl Sulfoxide as an Entrainer. Ind. Eng. Chem. Res. 47, 790–803.
Arlt, W., 2014. Chapter 7. Extractive distillation, in: Gorak, A., Olujic, Z. (Eds.), Distillation: Equipment and Processes. Elsevier, Oxford, GB, pp. 247–259.
B
Baker, L.C.W., Anderson, T.F., 1957. Some Phase Relationships in the Three-component Liquid System CO2-H2O-C2H5OH at High Pressures. J. Am. Chem. Soc. 79, 2071–2074.
Banat, F.A., Simandl, J., 1999. Membrane distillation for dilute ethanol: Separation from aqueous streams. J. Membr. Sci. 163, 333–348.
Bausa, J., Watzdorf, R. v., Marquardt, W., 1998. Shortcut methods for nonideal multicomponent distillation: I. Simple columns. AIChE J. 44, 2181–2198.
Benali, T., Tondeur, D., Jaubert, J.N., 2012. An improved crude oil atmospheric distillation process for energy integration: Part I: Energy and exergy analyses of the process when a flash is installed in the preheating train. Appl. Therm. Eng. 32, 125–131.
Bernon, C., Doherty, M.F., Malone, M.F., 1990. Patterns of composition change in multicomponent batch distillation. Chem. Eng. Sci. 45, 1207–1221.
Botía, D.C., Riveros, D.C., Ortiz, P., Gil, I.D., Sánchez, O.F., 2010. Vapor−Liquid Equilibrium in Extractive Distillation of the Acetone/Methanol System Using Water as Entrainer and Pressure Reduction. Ind. Eng. Chem. Res. 49, 6176–6183.
Bravo-Bravo, C., Segovia-Hernández, J.G., Gutiérrez-Antonio, C., Durán, A.L., Bonilla-Petriciolet, A., Briones-Ramírez, A., 2010. Extractive Dividing Wall Column: Design and Optimization. Ind. Eng. Chem. Res. 49, 3672–3688.
Brehelin, M., Forner, F., Rouzineau, D., Repke, J.-U., Meyer, X., Meyer, M., Wozny, G., 2007. Production of n-Propyl Acetate by Reactive Distillation: Experimental and Theoretical Study. Chem. Eng. Res. Des. 85, 109–117.
Breure, B., Peters, E.A.J.F., Kerkhof, P.J.A.M., 2008. Separation of azeotropic mixtures of alcohols and water with FricDiff. Sep. Purif. Technol. 62, 349–362.
Brüggemann, S., Marquardt, W., 2004. Shortcut methods for nonideal multicomponent distillation: 3. Extractive distillation columns. AIChE J. 50, 1129–1149.
Bruinsma, O.S.L., Spoelstra, S., 2010. Heat pumps in distillation, in: Presented at the Distillation & Absorption Conference. p. 15.
C
Caballero, J.A., Milán-Yañez, D., Grossmann, I.E., 2005. Rigorous Design of Distillation Columns: Integration of Disjunctive Programming and Process Simulators. Ind. Eng. Chem. Res. 44, 6760–6775.
Chua, K.J., Chou, S.K., Yang, W.M., 2010. Advances in heat pump systems: A review. Appl. Energy 87, 3611–3624.
Thermodynamic Insight for the Design and Optimization of Extractive Distillation of 1.0-1a Class Separation
142
D
Dejanović, I., Matijašević, L., Olujić, Ž., 2010. Dividing wall column—A breakthrough towards sustainable distilling. Chem. Eng. Process. Process Intensif. 49, 559–580.
Dhanalakshmi, J., Sai, P.S.T., Balakrishnan, A.R., 2014. Effect of bivalent cation inorganic salts on isobaric vapor–liquid equilibrium of methyl acetate–methanol system. Fluid Phase Equilibria 379, 112–119.
Dhanalakshmi, J., Sai, P.S.T., Balakrishnan, A.R., 2013. Study of Ionic Liquids as Entrainers for the Separation of Methyl Acetate–Methanol and Ethyl Acetate–Ethanol Systems Using the COSMO-RS Model. Ind. Eng. Chem. Res. 52, 16396–16405.
Díez, E., Langston, P., Ovejero, G., Romero, M.D., 2009. Economic feasibility of heat pumps in distillation to reduce energy use. Appl. Therm. Eng. 29, 1216–1223.
Doherty, M.F., Knapp, J.P., 1993. Distillation, Azeotropic, and Extractive, in: Kirk-Othmer Encyclopedia of Chemical Technology. John Wiley & Sons, Inc.
Doherty, M.F., Malone, M.F., 2001. Conceptual design of distillation systems. McGraw-Hill Science/Engineering/Math.
Doherty, M.F., Perkins, J.D., 1978. On the dynamics of distillation processes—I: The simple distillation of multicomponent non-reacting, homogeneous liquid mixtures. Chem. Eng. Sci. 33, 281–301.
Douglas, J.M., 1988. Conceptual design of chemical processes. McGraw-Hill New York.
E
Earle, M.J., Esperança, J.M., Gilea, M.A., Lopes, J.N.C., Rebelo, L.P., Magee, J.W., Seddon, K.R., Widegren, J.A., 2006. The distillation and volatility of ionic liquids. Nature 439, 831–834.
Elliott, J.R., Rainwater, J.C., 2000. The Bancroft point and vapor–liquid equilibria in the system benzene + isopropanol. Fluid Phase Equilibria 175, 229–236.
Engelien, H.K., Skogestad, S., 2004. Selecting appropriate control variables for a heat-integrated distillation system with prefractionator. Comput. Chem. Eng., ESCAPE 13 28, 683–691.
F
Fernandez, M.F., Barroso, B., Meyer, X.-M., Meyer, M., Le Lann, M.-V., Le Roux, G.C., Brehelin, M., 2013. Experiments and dynamic modeling of a reactive distillation column for the production of ethyl acetate by considering the heterogeneous catalyst pilot complexities. Chem. Eng. Res. Des. 91, 2309–2322.
Figueirêdo, M.F., Guedes, B.P., de Araújo, J.M.M., Vasconcelos, L.G.S., Brito, R.P., 2011a. Optimal design of extractive distillation columns—A systematic procedure using a process simulator. Chem. Eng. Res. Des. 89, 341–346.
Figueiredo, M.F. de, Brito, K.D., Ramos, W.B., Vasconcelos, L.G.S., Brito, R.P., 2014. Effect of Solvent Content on the Separation and the Energy Consumption of Extractive Distillation Columns. Chem. Eng. Commun. 0, null. doi:10.1080/00986445.2014.900053
Filipe, R.M., Turnberg, S., Hauan, S., Matos, H.A., Novais, A.Q., 2008. Multiobjective Design of Reactive Distillation with Feasible Regions. Ind. Eng. Chem. Res. 47, 7284–7293.
Fonyo, Z., Benkö, N., 1998. Comparison of Various Heat Pump Assisted Distillation Configurations. Chem. Eng. Res. Des., Techno-Economic Analysis 76, 348–360.
Fonyo, Z., Mizsey, P., 1994. Economic application of heat pumps in integrated distillation systems. Heat Recovery Syst. CHP 14, 249–263.
Foucher, E.R., Doherty, M.F., Malone, M.F., 1991. Automatic screening of entrainers for homogeneous azeotropic distillation. Ind. Eng. Chem. Res. 30, 760–772.
Chap.9. Appendix
143
Francisco, M., González, A.S.B., Dios, S.L.G. de, Weggemans, W., Kroon, M.C., 2013. Comparison of a low transition temperature mixture (LTTM) formed by lactic acid and choline chloride with choline lactate ionic liquid and the choline chloride salt: physical properties and vapour–liquid equilibria of mixtures containing water and ethanol. RSC Adv. 3, 23553–23561.
Frits, E.R., Lelkes, Z., Fonyó, Z., Rév, E., Markót, M.C., Csendes, T., 2006. Finding limiting flows of batch extractive distillation with interval arithmetic. AIChE J. 52, 3100–3108.
G
Gadalla, M.A., Olujic, Z., Jansens, P.J., Jobson, M., Smith, R., 2005. Reducing CO2 Emissions and Energy Consumption of Heat-Integrated Distillation Systems. Environ. Sci. Technol. 39, 6860–6870.
Gadalla, M., Jobson, M., Smith, R., 2003. Shortcut Models for Retrofit Design of Distillation Columns. Chem. Eng. Res. Des., Particle Technology 81, 971–986.
Gao, X., Chen, J., Tan, J., Wang, Y., Ma, Z., Yang, L., 2015. Application of Mechanical Vapor Recompression Heat Pump to Double-Effect Distillation for Separating N,N-Dimethylacetamide/Water Mixture. Ind. Eng. Chem. Res. 54, 3200–3204.
Gao, X., Li, X., Zhang, J., Sun, J., Li, H., 2013. Influence of a microwave irradiation field on vapor–liquid equilibrium. Chem. Eng. Sci. 90, 213–220.
Gao, X., Ma, Z., Yang, L., Ma, J., 2013. Simulation and Optimization of Distillation Processes for Separating the Methanol–Chlorobenzene Mixture with Separate Heat-Pump Distillation. Ind. Eng. Chem. Res. 52, 11695–11701.
García-Herreros, P., Gómez, J.M., Gil, I.D., Rodríguez, G., 2011. Optimization of the Design and Operation of an Extractive Distillation System for the Production of Fuel Grade Ethanol Using Glycerol as Entrainer. Ind. Eng. Chem. Res. 50, 3977–3985.
Gerbaud, V., Rodriguez-Donis, I., 2014. Chapter 6. Extractive distillation, in: Gorak, A., Olujic, Z. (Eds.), Distillation: Equipment and Processes. Elsevier, Oxford, GB, pp. pp. 201–246.
Gharaie, M., Panjeshahi, M.H., Kim, J.-K., Jobson, M., Smith, R., 2015. Retrofit strategy for the site-wide mitigation of CO2 emissions in the process industries. Chem. Eng. Res. Des. 94, 213–241.
Gil, I.D., Botía, D.C., Ortiz, P., Sánchez, O.F., 2009. Extractive Distillation of Acetone/Methanol Mixture Using Water as Entrainer. Ind. Eng. Chem. Res. 48, 4858–4865.
Gil, I.D., Uyazán, A.M., Aguilar, J.L., Rodríguez, G., Caicedo, L.A., 2008. Separation of ethanol and water by extractive distillation with salt and solvent as entrainer: process simulation. Braz. J. Chem. Eng. 25, 207–215.
Gmehling, J., Bölts, R., 1996. Azeotropic Data for Binary and Ternary Systems at Moderate Pressures. J. Chem. Eng. Data 41, 202–209.
Gmehling, J., Onken, U., 1977. VAPOR-LIQUID EQUILIBRIUM DATA COLLECTION. DECHEMA.
Gomez, A., Pibouleau, L., Azzaro-Pantel, C., Domenech, S., Latgé, C., Haubensack, D., 2010. Multiobjective genetic algorithm strategies for electricity production from generation IV nuclear technology. Energy Convers. Manag. 51, 859–871.
Guo, Z., Chin, J., Lee, J.W., 2004. Feasibility of Continuous Reactive Distillation with Azeotropic Mixtures. Ind. Eng. Chem. Res. 43, 3758–3769.
Guo, Z., Lee, J.W., 2004. Feasible products in batch reactive extractive distillation. AIChE J. 50, 1484–1492.
Gutérrez-Antonio, C., Briones-Ramírez, A., Jiménez-Gutiérrez, A., 2011. Optimization of Petlyuk sequences using a multi objective genetic algorithm with constraints. Comput. Chem. Eng. 35, 236–244.
Gutiérrez-Guerra, R., Segovia-Hernández, J.G., Hernández, S., 2009. Reducing energy consumption and CO2 emissions in extractive distillation. Chem. Eng. Res. Des. 87, 145–152.
Thermodynamic Insight for the Design and Optimization of Extractive Distillation of 1.0-1a Class Separation
144
H
Harmsen, G.J., 2007. Reactive distillation: The front-runner of industrial process intensification: A full review of commercial applications, research, scale-up, design and operation. Chem. Eng. Process. Process Intensif., Selected Papers from the European Process Intensification Conference (EPIC), Copenhagen, Denmark, September 19-20, 2007 46, 774–780.
Harwardt, A., Marquardt, W., 2012. Heat-integrated distillation columns: Vapor recompression or internal heat integration? AIChE J. 58, 3740–3750.
Hilal, N., Yousef, G., Langston, P., 2002. The reduction of extractive agent in extractive distillation and auto-extractive distillation. Chem. Eng. Process. Process Intensif. 41, 673–679.
Hilmen, E.K., 2000. Separation of azeotropic mixtures: tools for analysis and studies on batch distillation operation. Nor. Univ. Sci. Technol. PhD Thesis.
Hilmen, E., Kiva, V., Skogestad, S., 2002. Topology of ternary VLE diagrams: elementary cells. AIChE J. 48, 752–759.
Hiwale, R.S., Bhate, N.V., Mahajan, Y.S., Mahajani, S.M., 2004. Industrial applications of reactive distillation: recent trends. Int. J. Chem. React. Eng. 2.
J
Jana, A.K., 2010. Heat integrated distillation operation. Appl. Energy 87, 1477–1494. doi:10.1016/j.apenergy.2009.10.014
Jork, C., Kristen, C., Pieraccini, D., Stark, A., Chiappe, C., Beste, Y.A., Arlt, W., 2005. Tailor-made ionic liquids. J. Chem. Thermodyn., Ionic Liquids 37, 537–558.
K
Kamath, G., Georgiev, G., Potoff, J.J., 2005. Molecular Modeling of Phase Behavior and Microstructure of Acetone−Chloroform−Methanol Binary Mixtures. J. Phys. Chem. B 109, 19463–19473.
Keller, T., 2014. Chapter 8. Extractive distillation, in: Gorak, A., Olujic, Z. (Eds.), Distillation: Equipment and Processes. Elsevier, Oxford, GB, pp. 261–294.
Kim, K.J., Diwekar, U.M., Tomazi, K.G., 2004. Entrainer Selection and Solvent Recycling in Complex Batch Distillation. Chem. Eng. Commun. 191, 1606–1633.
Kiss, A.A., Flores Landaeta, S.J., Infante Ferreira, C.A., 2012a. Towards energy efficient distillation technologies – Making the right choice. Energy, Asia-Pacific Forum on Renewable Energy 2011 47, 531–542.
Kiss, A.A., Landaeta, S.J.F., Ferreira, C.A.I., 2012b. Mastering heat pumps selection for energy efficient distillation. Chem. Eng. 29.
Kiss, A.A., Suszwalak, D.J.-. P.C., 2012. Enhanced bioethanol dehydration by extractive and azeotropic distillation in dividing-wall columns. Sep. Purif. Technol. 86, 70–78.
Kiva, V., Hilmen, E., Skogestad, S., 2003. Azeotropic phase equilibrium diagrams: a survey. Chem. Eng. Sci. 58, 1903–1953.
Knapp, J.P., Doherty, M.F., 1994. Minimum entrainer flows for extractive distillation: A bifurcation theoretic approach. AIChE J. 40, 243–268.
Knapp, J.P., Doherty, M.F., 1992. A new pressure-swing-distillation process for separating homogeneous azeotropic mixtures. Ind. Eng. Chem. Res. 31, 346–357.
Knapp, J.P., Doherty, M.F., 1990. Thermal integration of homogeneous azeotropic distillation sequences. AIChE J. 36, 969–984.
Chap.9. Appendix
145
Kossack, S., Kraemer, K., Gani, R., Marquardt, W., 2008. A systematic synthesis framework for extractive distillation processes. Chem. Eng. Res. Des., ECCE-6 86, 781–792.
Kossack, S., Kraemer, K., Gani, R., Marquardt, W., 2007. A Systematic Synthesis Framework for Extractive Distillation Processes, in: ECCE-6 Book of Abstracts. pp. 557–558.
Kravanja, P., Modarresi, A., Friedl, A., 2013. Heat integration of biochemical ethanol production from straw – A case study. Appl. Energy, Special Issue on Advances in sustainable biofuel production and use - XIX International Symposium on Alcohol Fuels - ISAF 102, 32–43.
L
Lang, P., 1992. Computation of Multicomponent, Multistage Separation Processes, in: Pallai, I., Fonyo, Z. (Eds.), Studies in Computer-Aided Modelling, Design and Operation: Unit Operations. Elsevier, Budapest, p. pp. 256.
Lang, P., Lelkes, Z., Otterbein, M., Benadda, B., Modla, G., 1999. Feasibility studies for batch extractive distillation with a light entrainer. Comput. Chem. Eng., European Symposium on Computer Aided Process Engineering Proceedings of the European Symposium 23, Supplement, S93–S96.
Langston, P., Hilal, N., Shingfield, S., Webb, S., 2005. Simulation and optimisation of extractive distillation with water as solvent. Chem. Eng. Process. Process Intensif. 44, 345–351.
Laroche, L., Andersen, H.W., Morari, M., Bekiaris, N., 1991. Homogeneous azeotropic distillation: Comparing entrainers. Can. J. Chem. Eng. 69, 1302–1319.
Laroche, L., Bekiaris, N., Andersen, H.W., Morari, M., 1992. The curious behavior of homogeneous azeotropic distillation—implications for entrainer selection. AIChE J. 38, 1309–1328.
Laroche, L., Bekiaris, N., Andersen, H.W., Morari, M., 1992. Homogeneous azeotropic distillation: separability and flowsheet synthesis. Ind. Eng. Chem. Res. 31, 2190–2209.
Leboreiro, J., Acevedo, J., 2004. Processes synthesis and design of distillation sequences using modular simulators: a genetic algorithm framework. Comput. Chem. Eng. 28, 1223–1236.
Lei, Z., Chen, B., Ding, Z., 2005. Special Distillation Processes. Elsevier.
Lei, Z., Li, C., Chen, B., 2003. Extractive Distillation: A Review. Sep. Purif. Rev. 32, 121–213.
Lei, Z., Zhou, R., Duan, Z., 2002. Application of scaled particle theory in extractive distillation with salt. Fluid Phase Equilibria 200, 187–201.
Lelkes, Z., Lang, P., Benadda, B., Moszkowicz, P., 1998a. Feasibility of extractive distillation in a batch rectifier. AIChE J. 44, 810–822.
Lelkes, Z., Lang, P., Moszkowicz, P., Benadda, B., Otterbein, M., 1998b. Batch extractive distillation: the process and the operational policies. Chem. Eng. Sci. 53, 1331–1348.
Levy, S.G., Doherty, M.F., 1986. Design and synthesis of homogeneous azeotropic distillations. 4. Minimum reflux calculations for multiple-feed columns. Ind. Eng. Chem. Fundam. 25, 269–279.
Levy, S.G., Van Dongen, D.B., Doherty, M.F., 1985. Design and synthesis of homogeneous azeotropic distillations. 2. Minimum reflux calculations for nonideal and azeotropic columns. Ind. Eng. Chem. Fundam. 24, 463–474.
Liang, K., Li, W., Luo, H., Xia, M., Xu, C., 2014. Energy-Efficient Extractive Distillation Process by Combining Preconcentration Column and Entrainer Recovery Column. Ind. Eng. Chem. Res. 53, 7121–7131.
Li, G., Bai, P., 2012. New Operation Strategy for Separation of Ethanol–Water by Extractive Distillation. Ind. Eng. Chem. Res. 51, 2723–2729.
Linnhoff, B., Dunford, H., Smith, R., 1983. Heat integration of distillation columns into overall processes. Chem. Eng. Sci. 38, 1175–1188.
Thermodynamic Insight for the Design and Optimization of Extractive Distillation of 1.0-1a Class Separation
146
Li, W., Shi, L., Yu, B., Xia, M., Luo, J., Shi, H., Xu, C., 2013. New Pressure-Swing Distillation for Separating Pressure-Insensitive Maximum Boiling Azeotrope via Introducing a Heavy Entrainer: Design and Control. Ind. Eng. Chem. Res. 52, 7836–7853.
Lladosa, E., Montón, J.B., Burguet, Mac., Muñoz, R., 2007. Effect of pressure and the capability of 2-methoxyethanol as a solvent in the behaviour of a diisopropyl ether–isopropyl alcohol azeotropic mixture. Fluid Phase Equilibria 262, 271–279.
Lladosa, E., Montón, J.B., Burguet, M., de la Torre, J., 2008. Isobaric (vapour + liquid + liquid) equilibrium data for (di-n-propyl ether + n-propyl alcohol + water) and (diisopropyl ether + isopropyl alcohol + water) systems at 100 kPa. J. Chem. Thermodyn. 40, 867–873.
Logsdon, J.E., Loke, R.A., 2000. Isopropyl Alcohol, in: Kirk-Othmer Encyclopedia of Chemical Technology. John Wiley & Sons, Inc.
Lucia, A., Amale, A., Taylor, R., 2008. Distillation pinch points and more. Comput. Chem. Eng. 32, 1342–1364.
Luo, H., Bildea, C.S., Kiss, A.A., 2015. Novel Heat-Pump-Assisted Extractive Distillation for Bioethanol Purification. Ind. Eng. Chem. Res. 54, 2208–2213.
Luo, H., Liang, K., Li, W., Li, Y., Xia, M., Xu, C., 2014. Comparison of Pressure-Swing Distillation and Extractive Distillation Methods for Isopropyl Alcohol/Diisopropyl Ether Separation. Ind. Eng. Chem. Res. 53, 15167–15182.
Luyben, W.L., 2012. Pressure-Swing Distillation for Minimum- and Maximum-Boiling Homogeneous Azeotropes. Ind. Eng. Chem. Res. 51, 10881–10886.
Luyben, W.L., 2008. Comparison of Extractive Distillation and Pressure-Swing Distillation for Acetone−Methanol Separation. Ind. Eng. Chem. Res. 47, 2696–2707.
Luyben, W.L., 2006. Distillation Design and Control Using Aspen Simulation. John Wiley & Sons.
Luyben, W.L., Chien, I.-L., 2010. Design and Control of Distillation Systems for Separating Azeotropes. John Wiley & Sons.
Luyben, W.L., Yu, C.-C., 2009. Reactive Distillation Design and Control. John Wiley & Sons.
M
Mahdi, T., Ahmad, A., Nasef, M.M., Ripin, A., 2015. State-of-the-Art Technologies for Separation of Azeotropic Mixtures. Sep. Purif. Rev. 44, 308–330.
Mahmoud, A., Shuhaimi, M., Abdel Samed, M., 2009. A combined process integration and fuel switching strategy for emissions reduction in chemical process plants. Energy 34, 190–195.
Malone, M.F., Doherty, M.F., 2000. Reactive distillation. Ind. Eng. Chem. Res. 39, 3953–3957.
Marrero, J., Gani, R., 2001. Group-contribution based estimation of pure component properties. Fluid Phase Equilibria, Proceedings of the fourteenth symposium on thermophysical properties 183–184, 183–208.
Marshall & Swift, 2011. Average M & S index for year 2011. Chem. Eng. 119, 84.
Matsuyama H;Nishimura, H., 1977. Topological and thermodynamic classification of ternary vapor-liquid equilibria. J. Chem. Eng. Jpn. 10. doi:10.1252/jcej.10.181
McCabe, W., Smith, J., Harriott, P., 2004. Unit Operations of Chemical Engineering, 7 edition. ed. McGraw-Hill Science/Engineering/Math, Boston.
Modla, G., Lang, P., 2013. Heat pump systems with mechanical compression for batch distillation. Energy 62, 403–417.
Modla, G., Lang, P., 2010. Separation of an Acetone−Methanol Mixture by Pressure-Swing Batch Distillation in a Double-Column System with and without Thermal Integration. Ind. Eng. Chem. Res. 49, 3785–3793.

Chap.9. Appendix
147
Modla, G., Lang, P., Denes, F., 2010. Feasibility of separation of ternary mixtures by pressure swing batch distillation. Chem. Eng. Sci. 65, 870–881.
Mo, L., Shao-Tong, J., Li-Jun, P., Zhi, Z., Shui-Zhong, L., 2011. Design and control of reactive distillation for hydrolysis of methyl lactate. Chem. Eng. Res. Des. 89, 2199–2206.
O
Oliveira, F.S., Pereiro, A.B., Rebelo, L.P.N., Marrucho, I.M., 2013. Deep eutectic solvents as extraction
media for azeotropic mixtures. Green Chem. 15, 1326–1330.
Olujić, Ž., Jödecke, M., Shilkin, A., Schuch, G., Kaibel, B., 2009. Equipment improvement trends in distillation. Chem. Eng. Process. Process Intensif. 48, 1089–1104.
Onsekizoglu, P., 2012. Membrane Distillation: Principle, Advances, Limitations and Future Prospects in Food Industry. INTECH Open Access Publisher.
Orchillés, A.V., Miguel, P.J., González-Alfaro, V., Vercher, E., Martínez-Andreu, A., 2012. 1-Ethyl-3-methylimidazolium Dicyanamide as a Very Efficient Entrainer for the Extractive Distillation of the Acetone + Methanol System. J. Chem. Eng. Data 57, 394–399.
P
Palacios-Bereche, R., Ensinas, A.V., Modesto, M., Nebra, S.A., 2015. Double-effect distillation and thermal integration applied to the ethanol production process. Energy 82, 512–523.
Pereiro, A.B., Araújo, J.M.M., Esperança, J.M.S.S., Marrucho, I.M., Rebelo, L.P.N., 2012. Ionic liquids in separations of azeotropic systems – A review. J. Chem. Thermodyn., Thermodynamics of Sustainable Processes 46, 2–28.
Petlyuk, F.B., 2004. Distillation Theory and its Application to Optimal Design of Separation Units. Cambridge University Press.
Petlyuk, F., Danilov, R., Burger, J., 2015. A novel method for the search and identification of feasible splits of extractive distillations in ternary mixtures. Chem. Eng. Res. Des.
Phimister, J.R., Seider, W.D., 2000. Semicontinuous, Pressure-Swing Distillation. Ind. Eng. Chem. Res. 39, 122–130.
Pierotti, G.J., 1944. Extractive distillation process. US2455803 A.
Pinto, R.T.P., Wolf-Maciel, M.R., Lintomen, L., 2000. Saline extractive distillation process for ethanol purification. Comput. Chem. Eng. 24, 1689–1694.
Pleşu, V., Bonet Ruiz, A.E., Bonet, J., Llorens, J., 2014. Simple Equation for Suitability of Heat Pump Use in Distillation, in: Computer Aided Chemical Engineering. Elsevier, pp. 1327–1332.
Poling, B.E., Prausnitz, J.M., O’connell, J.P., 2001. The properties of gases and liquids. McGraw-Hill New York.
Pretel, E.J., López, P.A., Bottini, S.B., Brignole, E.A., 1994. Computer-aided molecular design of solvents for separation processes. AIChE J. 40, 1349–1360.
R
Ramírez-Corona, N., Ek, N., Jiménez-Gutiérrez, A., 2015. A method for the design of distillation systems aided by ionic liquids. Chem. Eng. Process. Process Intensif. 87, 1–8.
Renon, H., Prausnitz, J.M., 1968. Local compositions in thermodynamic excess functions for liquid mixtures. AIChE J. 14, 135–144.
Reshetov, S.A., Kravchenko, S.V., 2007. Statistics of liquid-vapor phase equilibrium diagrams for various ternary zeotropic mixtures. Theor. Found. Chem. Eng. 41, 451–453.

Thermodynamic Insight for the Design and Optimization of Extractive Distillation of 1.0-1a Class Separation
148
Ripin, A., Mudalip, S.K.A., Sukaimi, Z., Yunus, R.M., Manan, Z.A., 2009. Effects of Ultrasonic Waves on Vapor-Liquid Equilibrium of an Azeotropic Mixture. Sep. Sci. Technol. 44, 2707–2719.
Rodriguez-Donis, I., Gerbaud, V., Joulia, X., 2012a. Thermodynamic Insights on the Feasibility of Homogeneous Batch Extractive Distillation. 3. Azeotropic Mixtures with Light Entrainer. Ind. Eng. Chem. Res. 51, 4643–4660.
Rodriguez-Donis, I., Gerbaud, V., Joulia, X., 2012b. Thermodynamic Insights on the Feasibility of Homogeneous Batch Extractive Distillation. 4. Azeotropic Mixtures with Intermediate Boiling Entrainer. Ind. Eng. Chem. Res. 51, 6489–6501.
Rodriguez-Donis, I., Gerbaud, V., Joulia, X., 2009a. Thermodynamic Insights on the Feasibility of Homogeneous Batch Extractive Distillation, 1. Azeotropic Mixtures with a Heavy Entrainer. Ind. Eng. Chem. Res. 48, 3544–3559.
Rodríguez-Donis, I., Gerbaud, V., Joulia, X., 2009b. Thermodynamic Insights on the Feasibility of Homogeneous Batch Extractive Distillation, 2. Low-Relative-Volatility Binary Mixtures with a Heavy Entrainer. Ind. Eng. Chem. Res. 48, 3560–3572.
Rodríguez-Donis, I., Gerbaud, V., Joulia, X., 2001. Entrainer Selection Rules for the Separation of Azeotropic and Close-Boiling-Temperature Mixtures by Homogeneous Batch Distillation Process. Ind. Eng. Chem. Res. 40, 2729–2741.
Rodriguez-Donis, I., Papp, K., Rev, E., Lelkes, Z., Gerbaud, V., Joulia, X., 2007. Column configurations of continuous heterogeneous extractive distillation. AIChE J. 53, 1982–1993.
Rodríguez, N.R., González, A.S.B., Tijssen, P.M.A., Kroon, M.C., 2015. Low transition temperature mixtures (LTTMs) as novel entrainers in extractive distillation. Fluid Phase Equilibria 385, 72–78.
Rodriguez, N.R., Kroon, M.C., 2015. Isopropanol dehydration via extractive distillation using low transition temperature mixtures as entrainers. J. Chem. Thermodyn. 85, 216–221.
S
Seader, J.D., Henley, E.J., Roper, D.K., 2010. Separation Process Principles: Chemical and Biochemical Operations, 3 edition. ed. Wiley, Hoboken, NJ.
Seiler, M., Jork, C., Kavarnou, A., Arlt, W., Hirsch, R., 2004. Separation of azeotropic mixtures using hyperbranched polymers or ionic liquids. AIChE J. 50, 2439–2454.
Seiler, M., Köhler, D., Arlt, W., 2003. Hyperbranched polymers: new selective solvents for extractive distillation and solvent extraction. Sep. Purif. Technol. 30, 179–197.
Selvi, A., Breure, B., Gross, J., de Graauw, J., Jansens, P.J., 2007. Basic parameter study for the separation of a isopropanol–water mixture by using FricDiff technology. Chem. Eng. Process. Process Intensif., Selected Papers from the European Process Intensification Conference (EPIC), Copenhagen, Denmark, September 19-20, 2007 46, 810–817.
Shen, W., 2012. Extension of thermodynamic insights on batch extractive distillation to continuous operation [WWW Document]. URL http://ethesis.inp-toulouse.fr/archive/00002137/ (accessed 4.13.15).
Shen, W., Benyounes, H., Gerbaud, V., 2013. Extension of Thermodynamic Insights on Batch Extractive Distillation to Continuous Operation. 1. Azeotropic Mixtures with a Heavy Entrainer. Ind. Eng. Chem. Res. 52, 4606–4622.
Shen, W., Gerbaud, V., 2013. Extension of Thermodynamic Insights on Batch Extractive Distillation to Continuous Operation. 2. Azeotropic Mixtures with a Light Entrainer. Ind. Eng. Chem. Res. 52, 4623–4637.
Smith, R., Delaby, O., 1991. Targeting flue gas emissions. Chem. Eng. Res. Des. 69, 492–505.
Stéger, C., Varga, V., Horváth, L., Rév, E., Fonyó, Z., Meyer, M., Lelkes, Z., 2005. Feasibility of extractive distillation process variants in batch rectifier column. Chem. Eng. Process. Process Intensif. 44, 1237–1256.
Chap.9. Appendix
149
T
Teh, Y.S., Rangaiah, G.P., 2003. Tabu search for global optimization of continuous functions with application to phase equilibrium calculations. Comput. Chem. Eng. 27, 1665–1679.
V
Van de Bor, D.M., Ferreira, C.A.I., 2013. Quick selection of industrial heat pump types including the impact of thermodynamic losses. Energy 53, 312–322.
Van Dongen, D.B., Doherty, M.F., 1985. Design and synthesis of homogeneous azeotropic distillations. 1. Problem formulation for a single column. Ind. Eng. Chem. Fundam. 24, 454–463.
Van Duc Long, N., Lee, M., 2013. Optimal retrofit design of extractive distillation to energy efficient thermally coupled distillation scheme. AIChE J. 59, 1175–1182.
Van Dyk, B., Nieuwoudt, I., 2000. Design of Solvents for Extractive Distillation. Ind. Eng. Chem. Res. 39, 1423–1429.
Vázquez-Ojeda, M., Segovia-Hernández, J.G., Hernández, S., Hernández-Aguirre, A., Kiss, A.A., 2013. Design and optimization of an ethanol dehydration process using stochastic methods. Sep. Purif. Technol. 105, 90–97.
W
Waheed, M.A., Oni, A.O., Adejuyigbe, S.B., Adewumi, B.A., Fadare, D.A., 2014. Performance enhancement of vapor recompression heat pump. Appl. Energy 114, 69–79.
Wang, Q., Yu, B., Xu, C., 2012. Design and Control of Distillation System for Methylal/Methanol Separation. Part 1: Extractive Distillation Using DMF as an Entrainer. Ind. Eng. Chem. Res. 51, 1281–1292.
Wang, S.-J., Wong, D.S.H., Yu, S.-W., 2008. Effect of Entrainer Loss on Plant-Wide Design and Control of an Isopropanol Dehydration Process. Ind. Eng. Chem. Res. 47, 6672–6684.
Wang, Y.-C., Teng, M.-Y., Lee, K.-R., Lai, J.-Y., 2005. Comparison between the pervaporation and vapor permeation performances of polycarbonate membranes. Eur. Polym. J. 41, 1667–1673.
Weis, D.C., Visco, D.P., 2010. Computer-aided molecular design using the Signature molecular descriptor: Application to solvent selection. Comput. Chem. Eng., Process Modeling and Control in Drug Development and Manufacturing 34, 1018–1029.
Widagdo, S., Seider, W.D., 1996. Journal review Azeotropic distillation. AIChE J. 42, 96–130.
Y
Yang, X., Song, H., 2006. Computer Aided Molecular Design of Solvents for Separation Processes. Chem.
Eng. Technol. 29, 33–43.
Ye, K., Freund, H., Sundmacher, K., 2013. A New Process for Azeotropic Mixture Separation by Phase Behavior Tuning Using Pressurized Carbon Dioxide. Ind. Eng. Chem. Res. 52, 15154–15164.
You, X., Rodriguez-Donis, I., Gerbaud, V., 2015. Improved Design and Efficiency of the Extractive Distillation Process for Acetone–Methanol with Water. Ind. Eng. Chem. Res. 54, 491–501.
You, X., Rodriguez-Donis, I., Gerbaud, V., 2014. Extractive Distillation Process Optimisation of the 1.0-1a Class System, Acetone - methanol with Water, in: Computer Aided Chemical Engineering. Elsevier, pp. 1315–1320.

Thermodynamic Insight for the Design and Optimization of Extractive Distillation of 1.0-1a Class Separation
150
151
RÉSUMÉ
La distillation extractive continue avec ajout d’un entraineur lourd est nécessaire pour régénérer les solvants
dans des mélanges azéotropiques à température de bulle minimale. L’optimisation multiobjectif du procédé
conduit à minimiser la demande énergétique et le coût et à maximiser l’efficacité de séparation Eext qui décrit
la capacité à séparer le produit entre le haut et le bas de la section extractive.
Nous optimisons le débit d’entraineur FE, les positions des alimentations, les taux de reflux R1, R2 et les
débits de distillat de chaque colonne. L’analyse thermodynamique montre que réduire la pression dans la
colonne extractive favorise la séparation et diminue FE, R1 et l’énergie nécessaire. Le procédé optimisé est
20% moins cher et énergivore.
Les valeurs minimale et maximale de Eext et R1 sont interprétées avec la thermodynamique. L’intégration
énergétique partielle PHI réduit encore le coût mais c’est la recompression totale des vapeurs qui est la moins
énergivore.
Mots clés : Distillation extractive – analyse thermodynamique – pression réduite – intégration énergétique –
optimisation multiobjectif – indicateur thermodynamique d’efficacité de séparation.
ABSTRACT
Extractive distillation process with addition of a heavy entrainer is required to regenerate solvent mixtures
with minimum boiling azeotropes. We run a multiobjective optimization aiming at minimizing the energy
demand and total annualized cost and maximizing an extractive thermodynamic efficiency indicator Eext
describing the ability to discriminate the product between the extractive section top and bottom.
The entrainer flowrate FE, feed locations, reflux ratios R1, R2 both distillates and both column tray numbers
are optimized. Thermodynamics insight shows that a lower operating pressure increases the relative volatility
and reduces FE, R1 and the energy consumption for 1.0-1a class separations. Double digit savings in cost and
energy are achieved while there is an optimal Eext.
Minimum and maximum Eext and R1 are discussed with respect to thermodynamics. The partial heat
integration process is the cheapest but full vapor recompression achieves the lowest energy demand.
Keywords: Extractive distillation – thermodynamic insight – reduced pressure – energy integration –
multiobjective optimization – thermodynamic separation efficiency