thermodynamic properties, property relationships, andprocesses
TRANSCRIPT

THERMODYNAMICPROPERTIES,PROPERTYRELATIONSHIPS,AND PROCESSES
CHAPTER TWO
0521850436c02_p046-100.qxd 13/9/05 7:49 PM Page 46 Quark01A Quark01:BOOKS:CU/CB Jobs:CB925-Turns:Chapters:Chapter-02:

● Be able to write one or moreforms of the ideal gasequation of state and from thisderive all other (mass, molar,mass-specific, and molar-specific) forms.
● Be proficient at obtainingthermodynamic properties forliquids and gases from NISTsoftware or online databasesand from printed tables.
● Be able to explain in wordsand write out mathematicallythe meaning of thethermodynamic propertyquality.
● Be able to draw and identifythe following on T–v , P–v ,and T–s diagrams: saturatedliquid line, saturated vaporline, critical point, compressedliquid region, liquid–vaporregion, and the superheatedvapor region.
● Be able to draw an isobar on aT–v diagram, an isotherm ona P–v diagram, and bothisobars and isotherms on aT–s diagram.
● Be proficient at plotting simpleisobaric, isochoric, isothermal,and isentropic thermodynamicprocesses on T–v , P–v , andT–s coordinates.
● Be able to explain theapproximations used to
estimate properties for liquidsand solids.
● Be able to derive all of theisentropic processrelationships for an ideal gasgiven that Pv g � constant.
● Be able to explain the meaningof a polytropic process andwrite the general staterelationship expressing apolytropic process.
● Be able to explain the principleof corresponding states andthe use of generalizedcompressibility charts.
● Be able to express thecomposition of a gas mixtureusing both mole and massfractions.
● Be able to calculate thethermodynamic properties ofan ideal-gas mixture knowingthe mixture composition andthe properties of theconstituent gases.
● Understand the concept ofstandardized properties, inparticular, standardizedenthalpies, and theirapplication to ideal-gassystems involving chemicalreaction.
● Be able to apply the conceptsand skills developed in thischapter throughout this book.
After studying Chapter 2, you should:
● Be able to explain the meaningof the continuum limit and itsimportance tothermodynamics.
● Be familiar with the followingbasic thermodynamicproperties: pressure,temperature, specific volumeand density, specific internalenergy and enthalpy,constant-pressure andconstant-volume specific heats,entropy, and Gibbs free energy.
● Understand the relationshipsamong absolute, gage, andvacuum pressures.
● Know the four commontemperature scales and beproficient at conversionsamong all four.
● Know how many independentintensive properties arerequired to determine thethermodynamic state of asimple compressible substance.
● Be able to indicate whatproperties are involved in thefollowing state relationships:equation of state, calorificequation of state, and theGibbs (or T–ds) relationships.
● Explain the fundamentalassumptions used to describethe molecular behavior of anideal gas and under whatconditions these assumptionsbreak down.
LEARNING OBJECTIVES
0521850436c02_p046-100.qxd 13/9/05 7:49 PM Page 47 Quark01A Quark01:BOOKS:CU/CB Jobs:CB925-Turns:Chapters:Chapter-02:

2.1 KEY DEFINITIONS
To start our study of thermodynamic properties, you should review thedefinitions of properties, states, and processes presented in Chapter 1, asthese concepts are at the heart of the present chapter.
The focus of this chapter is not on the properties of the generic systemdiscussed in Chapter 1—a system that may consist of many clearlyidentifiable subsystems—but rather on the properties of a pure substance andmixtures of pure substances. We formally define a pure substance asfollows:
A pure substance is a substance that has a homogeneousand unchanging chemical composition.
Each element of the periodic table is a pure substance. Compounds, such asCO2 and H2O, are also pure substances. Note that pure substances may exist invarious physical phases: vapor, liquid, and solid. You are well acquainted withthese phases of H2O (i.e., steam, water, and ice). Carbon dioxide also readilyexhibits all three phases. In a compressed gas cylinder at room temperature,liquid CO2 is present with a vapor phase above it at a pressure of 56.5atmospheres. Solid CO2 or “dry ice” exists at temperatures below �78.5°C at apressure of 1 atmosphere.
In most of our discussions of properties, we further restrict our attention tothose pure substances that may be classified as simple compressiblesubstances.
page 48
THIS IS ONE OF THE LONGER chapters in this book and should be revisited many timesat various levels. To cover in detail the subject of the properties of gases and liquidswould take an entire book. Reference [1] is a classic example of such a book. We begin ourstudy of properties by defining a few basic terms and concepts. This is followed by atreatment of ideal-gas properties that originate from the equation of state, calorificequations of state, and the second law of thermodynamics. Various approaches forobtaining properties of nonideal gases, liquids, and solids follow. The properties ofsubstances that have coexisting liquid and vapor phases are emphasized. The concept ofillustrating processes graphically using thermodynamic property coordinates (i.e., T–v ,P–v , and T–s coordinates) is developed.
In addition to dealing with pure substances, we treat the thermodynamic properties ofnonreacting and reacting ideal-gas mixtures. The chapter concludes with a briefintroduction to the transport properties encountered in this book.
Chapter 2 Overview
0521850436c02_p046-100.qxd 13/9/05 7:49 PM Page 48 Quark01A Quark01:BOOKS:CU/CB Jobs:CB925-Turns:Chapters:Chapter-02:

CH. 2 Thermodynamic Properties, Property Relationships and Processes 49
A simple compressible substance is one in which the effects ofthe following are negligible: motion, fluid shear, surface
tension, gravity, and magnetic and electrical fields.1
The adjectives simple and compressible greatly simplify the description of thestate of a substance. Many systems of interest to engineering closely approxi-mate simple compressible substances. Although we consider motion, fluid shear,and gravity in our study of fluid flow (Chapters 6, 9, and 10), their effects onlocal thermodynamic properties are quite small; thus, fluid properties are verywell approximated as those of a simple compressible substance. Free surface,magnetic, and electrical effects are not considered in this book.
We conclude this section by distinguishing between extensive propertiesand intensive properties:
An extensive property depends on how much of the substanceis present or the “extent” of the system under consideration.
Examples of extensive properties are volume V and energy E. Clearly, numericalvalues for V and E depend on the size, or mass, of the system. In contrast,intensive properties do not depend on the extent of the system:
An intensive property is independent of the mass of thesubstance or system under consideration.
Two familiar thermodynamic properties, temperature T and pressure P, areintensive properties. Numerical values for T and P are independent of themass or the amount of substance in the system.
Intensive properties are generally designated using lowercase symbols,although both temperature and pressure violate the rule in this text. Anyextensive property can be converted to an intensive one simply by dividing bythe mass M. For example, the specific volume v and the specific energy e canbe defined, respectively, by
v � V�M [�] m3/kg (2.1a)
and
e � E�M [�] J/kg. (2.1b)
Intensive properties can also be based on the number of moles present ratherthan the mass. Thus, the properties defined in Eqs. 2.1 would be moreaccurately designated as mass-specific properties, whereas the correspondingmolar-specific properties would be defined by
(2.2a)
and
(2.2b)e � E>N [�] J/kmol,
v � V>N [�] m3/kmol
1 A more rigorous definition of a simple compressible substance is that, in a system comprisingsuch a substance, the only reversible work mode is that associated with compression orexpansion, work, that is, P–dV work. To appreciate this definition, however, requires anunderstanding of what is meant by reversible and by P–dV work. These concepts aredeveloped at length in Chapters 4 and 7.
The high pressure beneath the blade of an iceskate results in a thin layer of liquid between theblade and the solid ice (top). Surface tensioncomplicates specifying the thermodynamic stateof very small droplets (bottom).
0521850436c02_p046-100.qxd 13/9/05 7:49 PM Page 49 Quark01A Quark01:BOOKS:CU/CB Jobs:CB925-Turns:Chapters:Chapter-02:

50 Thermal-Fluid Sciences
where N is the number of moles under consideration. Molar-specific propertiesare designated using lowercase symbols with an overbar, as shown inEqs. 2.2. Conversions between mass-specific properties and molar-specificproperties are accomplished using the following simple relationships:
(2.3)
and
(2.4)
where z (or ) is any intensive property and M ([�] kg/kmol) is the molecularweight of the substance (see also Eq. 2.6).
2.2 FREQUENTLY USED THERMODYNAMIC PROPERTIES
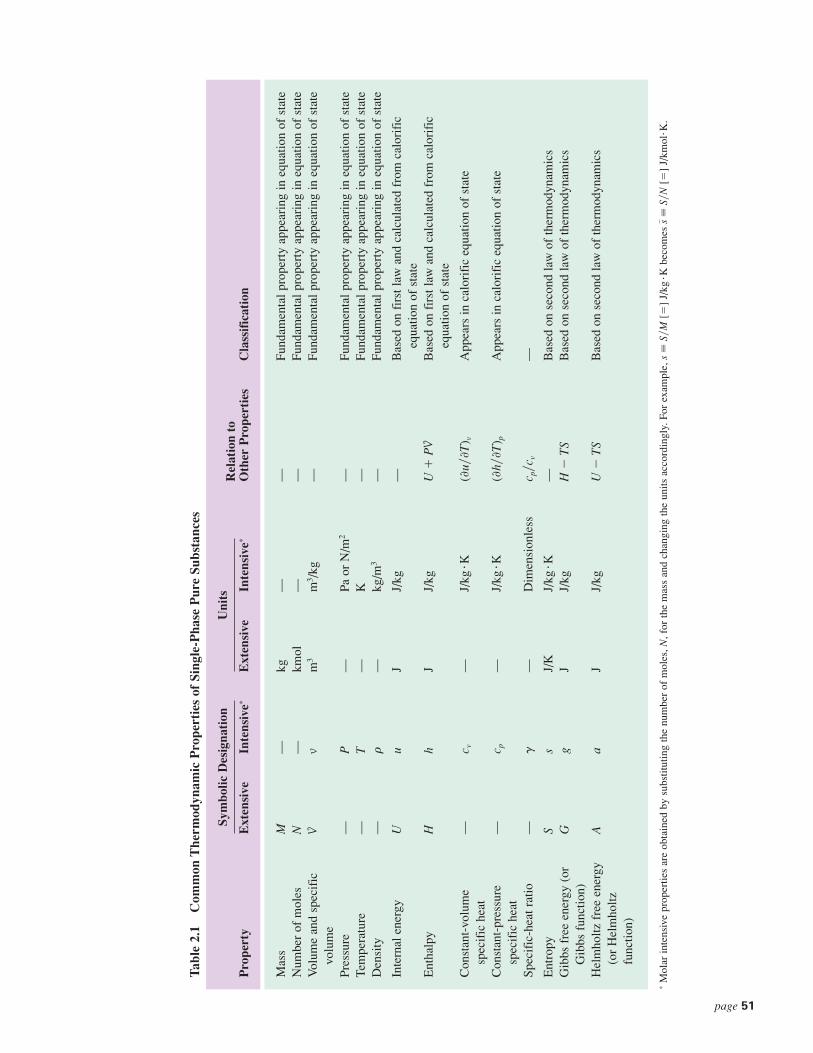
One of the principal objectives of this chapter is to see how variousthermodynamic properties relate to one another, expressed 1. by an equation ofstate, 2. by a calorific equation of state, and 3. by temperature–entropy, orGibbs, relationships. Before we do that, however, we list in Table 2.1 the mostcommon properties so that you might have an overview of the scope of ourstudy. You may be familiar with many of these properties, although others willbe new and may seem strange. As we proceed in our study, this strangenessshould disappear as you work with these new properties. We begin with adiscussion of three extensive properties: mass, number of moles, and volume.
2.2a Properties Related to the Equation of StateMassAs one of our fundamental dimensions (see Chapter 1), mass, like time,cannot be defined in terms of other dimensions. Much of our intuition of whatmass is follows from its role in Newton’s second law of motion
F � Ma. (2.5)
In this relationship, the force F required to produce a certain acceleration a ofa particular body is proportional to its mass M. The SI mass standard is aplatinum–iridium cylinder, defined to be one kilogram, which is kept at theInternational Bureau of Weights and Measure near Paris.
Number of MolesIn some applications, such as reacting systems, the number of moles Ncomprising the system is more useful than the mass. The mole is formallydefined as the amount of substance in a system that contains as manyelementary entities as there are in exactly 0.012 kg of carbon 12 (12C). Theelementary entities may be atoms, molecules, ions, electrons, etc. Theabbreviation for the SI unit for a mole is mol, and kmol refers to 103 mol.
The number of moles in a system is related to the system mass through theatomic or molecular weight2 M; that is,
M � NM, (2.6)
z
z � z>M
z � zM
2 Strictly, the atomic weight is not a weight at all but is the relative atomic mass.
0521850436c02_p046-100.qxd 13/9/05 7:49 PM Page 50 Quark01A Quark01:BOOKS:CU/CB Jobs:CB925-Turns:Chapters:Chapter-02:
Tabl
e 2.
1C
omm
on T
herm
odyn
amic
Pro
pert
ies
of S
ingl
e-P
hase
Pur
e Su
bsta
nces
Sym
bolic
Des
igna
tion
Uni
tsR
elat
ion
toP
rope
rty
Ext
ensi
veIn
tens
ive∗
Ext
ensi
veIn
tens
ive∗
Oth
er P
rope
rtie
sC
lass
ific
atio
n
Mas
sM
—kg
——
Fund
amen
tal p
rope
rty
appe
arin
g in
equ
atio
n of
sta
teN
umbe
r of
mol
esN
—km
ol—
—Fu
ndam
enta
l pro
pert
y ap
pear
ing
in e
quat
ion
of s
tate
Vol
ume
and
spec
ific
Vv
m3
m3 /
kg—
Fund
amen
tal p
rope
rty
appe
arin
g in
equ
atio
n of
sta
tevo
lum
ePr
essu
re—
P—
Pa o
r N
/m2
—Fu
ndam
enta
l pro
pert
y ap
pear
ing
in e
quat
ion
of s
tate
Tem
pera
ture
—T
—K
—Fu
ndam
enta
l pro
pert
y ap
pear
ing
in e
quat
ion
of s
tate
Den
sity
—r
—kg
/m3
—Fu
ndam
enta
l pro
pert
y ap
pear
ing
in e
quat
ion
of s
tate
Inte
rnal
ene
rgy
Uu
JJ/
kg—
Bas
ed o
n fi
rst l
aw a
nd c
alcu
late
d fr
om c
alor
ific
equa
tion
of s
tate
Ent
halp
yH
hJ
J/kg
U�
PV
Bas
ed o
n fi
rst l
aw a
nd c
alcu
late
d fr
om c
alor
ific
equa
tion
of s
tate
Con
stan
t-vo
lum
e—
c v—
J/kg
�K(�
u��T
) vA
ppea
rs in
cal
orif
ic e
quat
ion
of s
tate
spec
ific
hea
tC
onst
ant-
pres
sure
—c p
—J/
kg�K
(�h�
�T
) pA
ppea
rs in
cal
orif
ic e
quat
ion
of s
tate
spec
ific
hea
tSp
ecif
ic-h
eat r
atio
—g
—D
imen
sion
less
c p�c
v—
Ent
ropy
Ss
J/K
J/kg
�K—
Bas
ed o
n se
cond
law
of
ther
mod
ynam
ics
Gib
bs f
ree
ener
gy (
orG
gJ
J/kg
H�
TS
Bas
ed o
n se
cond
law
of
ther
mod
ynam
ics
Gib
bs f
unct
ion)
Hel
mho
ltz f
ree
ener
gyA
aJ
J/kg
U�
TS
Bas
ed o
n se
cond
law
of
ther
mod
ynam
ics
(or
Hel
mho
ltzfu
nctio
n)
∗M
olar
inte
nsiv
e pr
oper
ties
are
obta
ined
by
subs
titut
ing
the
num
ber
of m
oles
,N,f
or th
e m
ass
and
chan
ging
the
units
acc
ordi
ngly
. For
exa
mpl
e,s
�S�
M[�
] J/
kg�K
bec
omes
�
S�N
[�]
J/km
ol�K
.s
page 51
0521850436c02_p046-100.qxd 13/9/05 7:49 PM Page 51 Quark01A Quark01:BOOKS:CU/CB Jobs:CB925-Turns:Chapters:Chapter-02:

52 Thermal-Fluid Sciences
where M has units of g/mol or kg/kmol. Thus, the atomic weight of carbon12 is exactly 12. The Avagodro constant NAV is used to express the numberof particles (atoms, molecules, etc.) in a mole:
(2.7)
For example, we can use the Avagodro constant to determine the mass of asingle 12C atom:
Although not an SI unit, one-twelfth of the mass of a single 12C atom issometimes used as a mass standard and is referred to as the unified atomicmass unit, defined as
VolumeThe familiar property, volume, is formally defined as the amount of spaceoccupied in three-dimensional space. The SI unit of volume is cubic meters (m3).
DensityConsider the small volume �V (� �x�y�z) as shown in Fig. 2.1. We formallydefine the density to be the ratio of the mass of this element to the volume ofthe element, under the condition that the size of the element shrinks to thecontinuum limit, that is,
(2.8)
What is meant by the continuum limit is that the volume is very small, butyet sufficiently large so that the number of molecules within the volume isessentially constant and unaffected by any statistical fluctuations. For avolume smaller than the continuum limit, the number of molecules within the
r � lim¢VSVcontinuum
¢M
¢V [�] kg/m3.
1 mu � (1>12) M12C� 1.66053873 � 10�27 kg.
[�]kg
(atom/mol)mol�
kg
atom.
�0.012
6.02214199 � 1023(1)� 1.9926465 � 10�26
M C12 �M(1 mol 12C)
NAVNC12
NAV � e6.02214199 � 1023 particles/mol
6.02214199 � 1026 particles/kmol.
FIGURE 2.1
A finite volume element shrinks to thecontinuum limit to define macroscopicproperties. Volumes smaller than thecontinuum limit experience statisticalfluctuations in properties as moleculesenter and exit the volume.
∆x
∆ continuum limit
∆z
∆y
0521850436c02_p046-100.qxd 13/9/05 7:49 PM Page 52 Quark01A Quark01:BOOKS:CU/CB Jobs:CB925-Turns:Chapters:Chapter-02:
CH. 2 Thermodynamic Properties, Property Relationships and Processes 53
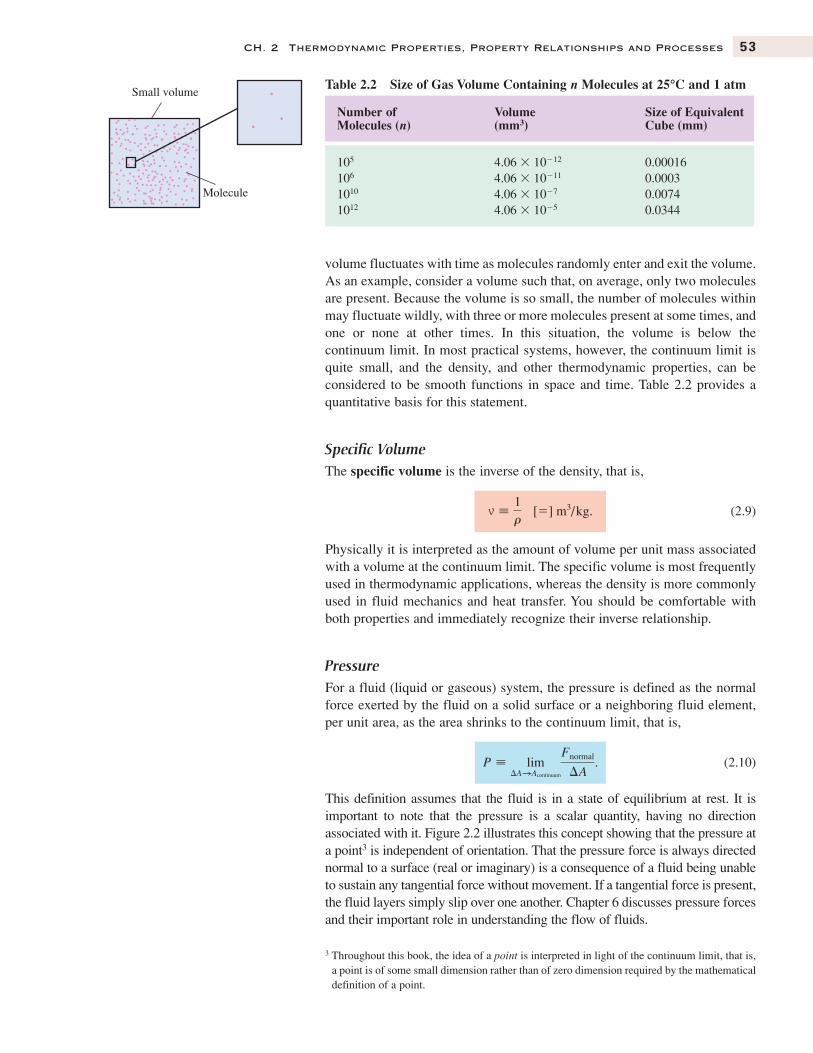
volume fluctuates with time as molecules randomly enter and exit the volume.As an example, consider a volume such that, on average, only two moleculesare present. Because the volume is so small, the number of molecules withinmay fluctuate wildly, with three or more molecules present at some times, andone or none at other times. In this situation, the volume is below thecontinuum limit. In most practical systems, however, the continuum limit isquite small, and the density, and other thermodynamic properties, can beconsidered to be smooth functions in space and time. Table 2.2 provides aquantitative basis for this statement.
Specific VolumeThe specific volume is the inverse of the density, that is,
(2.9)
Physically it is interpreted as the amount of volume per unit mass associatedwith a volume at the continuum limit. The specific volume is most frequentlyused in thermodynamic applications, whereas the density is more commonlyused in fluid mechanics and heat transfer. You should be comfortable withboth properties and immediately recognize their inverse relationship.
PressureFor a fluid (liquid or gaseous) system, the pressure is defined as the normalforce exerted by the fluid on a solid surface or a neighboring fluid element,per unit area, as the area shrinks to the continuum limit, that is,
(2.10)
This definition assumes that the fluid is in a state of equilibrium at rest. It isimportant to note that the pressure is a scalar quantity, having no directionassociated with it. Figure 2.2 illustrates this concept showing that the pressure ata point3 is independent of orientation. That the pressure force is always directednormal to a surface (real or imaginary) is a consequence of a fluid being unableto sustain any tangential force without movement. If a tangential force is present,the fluid layers simply slip over one another. Chapter 6 discusses pressure forcesand their important role in understanding the flow of fluids.
P � lim¢ASAcontinuum
Fnormal
¢A.
v �1r
[�] m3/kg.
Table 2.2 Size of Gas Volume Containing n Molecules at 25°C and 1 atm
Number of Volume Size of EquivalentMolecules (n) (mm3) Cube (mm)
105 4.06 � 10�12 0.00016106 4.06 � 10�11 0.00031010 4.06 � 10�7 0.00741012 4.06 � 10�5 0.0344
3 Throughout this book, the idea of a point is interpreted in light of the continuum limit, that is,a point is of some small dimension rather than of zero dimension required by the mathematicaldefinition of a point.
Small volume
Molecule
0521850436c02_p046-100.qxd 13/9/05 7:49 PM Page 53 Quark01A Quark01:BOOKS:CU/CB Jobs:CB925-Turns:Chapters:Chapter-02:

From a microscopic (molecular) point of view, the pressure exerted by agas on the walls of its container is a measure of the rate at which themomentum of the molecules colliding with the wall is changed.
The SI unit for pressure is a pascal, defined by
P [�] Pa � 1 N/m2. (2.11a)
Since one pascal is typically a small number in engineering applications,multiples of 103 and 106 are employed that result in the usage of kilopascal,kPa (103 Pa), and megapascal, MPa (106 Pa). Also commonly used is the bar,which is defined as
1 bar � 105 Pa. (2.11b)
Pressure is also frequently expressed in terms of a standard atmosphere:
1 standard atmosphere (atm) � 101,325 Pa. (2.11c)
As a result of some practical devices measuring pressures relative to thelocal atmospheric pressure, we distinguish between gage pressure andabsolute pressure. Gage pressure is defined as
Pgage � Pabs � Patm, abs, (2.12)
where the absolute pressure Pabs is that as defined in Eq. 2.10. In a perfectlyevacuated space, the absolute pressure is zero. Figure 2.3 graphicallyillustrates the relationship between gage and absolute pressures. The termvacuum or vacuum pressure is also employed in engineering applications(and leads to confusion if one is not careful) and is defined as
Pvacuum � Patm, abs � Pabs. (2.13)
This relationship is also illustrated in Fig. 2.3.In addition to SI units, many other units for pressure are commonly
employed. Most of these units originate from the application of a particularmeasurement method. For example, the use of manometers (as discussed inChapter 6) results in pressures expressed in inches of water or millimeters ofmercury. American (or British) customary units (pounds-force per squareinch or psi) are frequently appended with a “g” or an “a” to indicate gage orabsolute pressures, respectively (i.e., psig and psia). Conversion factors forcommon pressure units are provided at the front of this book.
54 Thermal-Fluid Sciences
FIGURE 2.2
Pressure at a point is a scalar quantityindependent of orientation. Regardlessof the orientation of �A, applicationof the defining relationship (Eq. 2.10)results in the same value of thepressure.
Fnormal
∆A
Fnormal
∆A
Fnormal
∆A
Gas volume
0521850436c02_p046-100.qxd 13/9/05 7:49 PM Page 54 Quark01A Quark01:BOOKS:CU/CB Jobs:CB925-Turns:Chapters:Chapter-02:

CH. 2 Thermodynamic Properties, Property Relationships and Processes 55
FIGURE 2.3
Absolute pressure is zero in aperfectly evacuated space; gagepressure is measured relative to thelocal atmospheric pressure.
A pressure gage is used to measure the inflation pressure of a tire. The gagereads 35 psig in State College, PA, when the barometric pressure is 28.5 inof mercury. What is the absolute pressure in the tire in kPa and psia?
Solution
Known Ptire, g, Patm, abs
Find Ptire, abs
Sketch
Analysis From the sketch and from Eq. 2.12, we know that
We need only to deal with the mixed units given to apply this relationship.Applying the conversion factor from the front of this book to express theatmospheric pressure in units of psia yields
Thus,
Ptire, abs � 35 � 14.0 � 49 psia.
Patm, abs � (28.5 in Hg) c 14.70 psia
29.92 in Hgd � 14.0 psia.
Ptire, abs � Ptire, g � Patm, abs.
P = Patm (absolute)
P = 0 (absolute)
(a) (b)
Pabs
Pgage
Pabs
Pvac
Ptire, g = 35 psig
Ptire, abs = ?
Patm, abs
Example 2.1
0521850436c02_p046-100.qxd 13/9/05 7:49 PM Page 55 Quark01A Quark01:BOOKS:CU/CB Jobs:CB925-Turns:Chapters:Chapter-02:

56 Thermal-Fluid Sciences
Converting this result to units of kPa yields
Comments Note the use of three different units to express pressure: Pa(or kPa), psi (or and in Hg. Other commonly used units are mm Hgand in You should be comfortable working with any of these. Notealso the usage psia and psig to denote absolute and gage pressures,respectively, when working with units.lbf
/in2
H2O.lbf
/in2),
Ptire, abs � 49 lbf /in2 c 1 Pa
1.4504 � 10�4 lbf /in2 d c 1 kPa
1000 Pad � 337.8 kPa.
Example 2.2 SI Engine Application
A vintage automobile has an intake manifold vacuum gage in the dashboardinstrument cluster. Cruising at 20.1 m/s (45 mph), the gage reads 14 in Hgvacuum. If the local atmospheric pressure is 99.5 kPa, what is the absoluteintake manifold pressure in kPa?
Solution
Given Pman, vac, Patm, abs
Find
Sketch
Analysis From the sketch and a rearrangement of Eq. 2.13, we find theintake manifold absolute pressure to be
Substituting numerical values and converting units yields
� 99.5 kPa � 47.4 kPa � 52.1 kPa
Pman, abs � 99.5 kPa � (14 in Hg) c 1 atm
29.92 in Hgd c 101.325 kPa
atmd
Pman, abs � Patm, abs � Pman, vac.
Pman, abs
Self Test2.1 ✓ A car tire suddenly goes flat and a pressure gage indicates zero psig. Is the absolute
pressure in the tire also zero psia? (Answer: No. A zero gage reading indicates the absolute pressure in the tireis the atmospheric pressure.)
Pman, vac = 14 in-Hg
Patm, abs
Pman, abs = ?
0521850436c02_p046-100.qxd 13/9/05 7:49 PM Page 56 Quark01A Quark01:BOOKS:CU/CB Jobs:CB925-Turns:Chapters:Chapter-02:

Comments The pressure drops across the throttle plate of an SI engine(see Chapter 11). This lower pressure, in turn, results in a decreased airdensity and a smaller quantity of air entering the cylinder than would occurwithout the throttle. The throttle thus controls the power delivered by theengine.
CH. 2 Thermodynamic Properties, Property Relationships and Processes 57
Self Test2.2 ✓ A technician performs a compression test on a vehicle engine and finds that the
maximum pressure in one cylinder is 105 psig, while the minimum pressure in anotheris 85 psig. What is the absolute pressure difference between the two cylinders?
(Answer: 20 psia)
TemperatureLike mass, length, and time, temperature is a fundamental dimension and, assuch, eludes a simple and concise definition. Nevertheless, we all have someexperiential notion of temperature when we say that some object is hotter thananother, that is, that some object has a greater temperature than another. From amacroscopic point of view, we define temperature as that property that is sharedby two systems, initially at different states, after they have been placed in thermalcontact and allowed to come to thermal equilibrium. Although this definitionmay not be very satisfying, it is the best we can do from a macroscopicviewpoint. For the special case of an ideal gas, the microscopic (molecular) pointof view may be somewhat more satisfying: Here the temperature is directlyproportional to the square of the mean molecular speed. Higher temperaturemeans faster moving molecules.
The basis for practical temperature measurement is the zeroth law ofthermodynamics.4 The zeroth law of thermodynamics is stated as follows:
Two systems that are each in thermal equilibrium with a thirdsystem are in thermal equilibrium with each other.
Alternatively, the zeroth law can be expressed explicitly in terms of temperature:
When two systems have equality of temperature witha third system, they in turn have equality of temperature
with each other.
This law forms the basis for thermometry. A thermometer measures the sameproperty, temperature, independent of the nature of the system subject to themeasurement. A temperature of 20�C measured for a block of steel means thesame thing as 20�C measured for a container of water. Putting the 20�C steelblock in the 20�C water results in no temperature change to either.
As a result of the zeroth law, a practical temperature scale can be basedon a thermometric substance. Such a substance expands as its temperatureincreases; mercury is a thermometric substance. The height of the mercurycolumn in a glass tube can be calibrated against standard fixed points ofreference. For example, the original Celsius scale (i.e., prior to 1954) defines
4 This law was established after the first and second laws of thermodynamics; however, sinceit expresses a concept logically preceding the other two, it has been designated the zerothlaw.
0521850436c02_p046-100.qxd 13/9/05 7:49 PM Page 57 Quark01A Quark01:BOOKS:CU/CB Jobs:CB925-Turns:Chapters:Chapter-02:

58 Thermal-Fluid Sciences
0�C to be the temperature at the ice point5 and 100�C to be the temperatureat the steam point.6 The modern Celsius scale assigns a temperature of0.01�C to the triple point7 of water and the size of a single degree equal tothat from the absolute, or Kelvin, temperature scale, as discussed in Chapter7. With the adoption of the International Temperature Scale of 1990 (ITS-90),the ice point is still 0�C, but the steam point is now 99.974�C. For practicalpurposes, the original and modern Celsius scales are identical.
Four temperature scales are in common use today: the Celsius scale and itsabsolute counterpart, the Kelvin scale, and the Fahrenheit scale and itsabsolute counterpart, the Rankine scale. Both absolute scales start at absolutezero, the lowest temperature possible. The conversions among these scales areshown in Table 2.3.
5 The ice point is the temperature at which an ice and water mixture is in equilibrium with watervapor–saturated air at one atmosphere.
6 The steam point is the temperature at which steam and water are in equilibrium at one atmosphere.7 The triple point is the temperature at which ice, liquid water, and steam all coexist in equilibrium.
Table 2.3 Temperature Scales
Temperature Scale Units∗ Relation to Other Scales
Celsius degree Celsius (°C) T (°C) � T (K) � 273.15
T (°C) � [T (F) � 32]
Kelvin kelvin (K) T (K) � T (°C) � 273.15
T (K) � T(R)
Fahrenheit degree Fahrenheit (F) T (F) � T (R) � 459.67
T (F) � T (°C) � 32
Rankine degree Rankine (R) T (R) � T (F) � 459.67
T (R) � T (K)
∗ Note that capital letters are used to refer to the units for each scale. The degree symbol (°),however, is used only with the Celsius unit to avoid confusion with the coulomb. Note also thatthe SI Kelvin scale unit is the kelvin; thus, we say that a temperature, for example, is 100 kelvins(100 K), not 100 degrees Kelvin.
9
5
9
5
5
9
5
9
Example 2.3
On a hot day in Boston, a high of 97 degrees Fahrenheit is reported on thenightly news. What is the temperature in units of �C, K, and R?
Solution
Known T(F)
Find T(°C), T(K), T(R)
0521850436c02_p046-100.qxd 13/9/05 7:49 PM Page 58 Quark01A Quark01:BOOKS:CU/CB Jobs:CB925-Turns:Chapters:Chapter-02:

CH. 2 Thermodynamic Properties, Property Relationships and Processes 59
Analysis We apply the temperature-scale conversions provided in Table 2.3as follows:
Comments Except for the Rankine scale, you are most likely familiarwith the conversions in Table 2.3. Note that the size of the temperature unitis identical for the Fahrenheit and Rankine scales. Similarly, the Celsiusand Kelvin units are of identical size, and each is 9/5 (or 1.8) times the sizeof the Fahrenheit or Rankine unit.
�5
9 (556.7) � 309.3 K.
T(K) �5
9 T(R)
� 97 � 459.67 � 556.7 R,
T(R) � T(F) � 459.67
�5
9 (97 � 32) � 36.1�C,
T(�C) �5
9 [T(F) � 32]
Self Test2.3 ✓ On the same hot day in Boston, the air conditioning keeps your room at 68 degrees
Fahrenheit. Find the temperature difference between the inside and the outside air in(a) R, (b) °C, and (c) K.
(Answer: (a) 29 R, (b) 16.1�C, (c) 16.1 K)
2.2b Properties Related to the First Law and Calorific Equation of StateInternal EnergyIn this section, we introduce the thermodynamic property internal energy.Further discussion of internal energy is presented in Chapter 4, which focuseson the many ways that energy is stored and transferred.
Internal energy has its origins with the microscopic nature of matter;specifically, we define internal energy as the energy associated with themotions of the microscopic particles (atoms, molecules, electrons, etc.)comprising a macroscopic system. For simple monatomic gases (e.g., heliumand argon) internal energy is associated only with the translational kineticenergy of the atoms (Fig. 2.4a). If we assume that a gas can be modeled as acollection of point-mass hard spheres that collide elastically, the translationalkinetic energy associated with n particles is
(2.14)
where is the mean-square molecular speed. Using kinetic theory (see, forexample, Ref. [2]), the translational kinetic energy can be related totemperature as
(2.15)Utrans � n
3
2 kBT,
v2
Utrans � n
1
2 Mmolecv
2,FIGURE 2.4
(a) The internal energy of amonatomic species consists only oftranslational (kinetic) energy. (b) A diatomic species internal energyresults from translation together withenergy from vibration (potential andkinetic) and rotation (kinetic).
(a) Monatomic species
(b) Diatomic species
Translation
Translation Rotation
Vibration
0521850436c02_p046-100.qxd 13/9/05 7:50 PM Page 59 Quark01A Quark01:BOOKS:CU/CB Jobs:CB925-Turns:Chapters:Chapter-02:

where kB is the Boltzmann constant,
and T is the absolute temperature in kelvins. [By comparing Eqs. 2.14 and2.15, we see the previously mentioned microscopic interpretation oftemperature, i.e.,
For molecules more complex than single atoms, internal energy is storedin vibrating molecular bonds and rotation of the molecule about two or moreaxes, in addition to the translational kinetic energy. Figure 2.4b illustrates thismodel of a diatomic species. In general, the internal energy is expressed
(2.16)
where is the vibrational kinetic and potential energy, and is therotational kinetic energy. The amount of energy that is stored in each modevaries with temperature and is described by quantum mechanics. One of thefundamental postulates of quantum theory is that energy is quantized; that is,energy storage is modeled by discrete bits rather than continuous functions.The translational kinetic energy states are very close together such that, forpractical purposes, quantum states need not be considered and the continuumresult, Eq. 2.15, is a useful model. For vibrational and rotational states,however, quantum behavior is important. We will see the effects of this laterin our discussion of specific heats.
Another form of internal energy is that associated with chemical bonds andtheir rearrangements during chemical reaction. Similarly, internal energy isassociated with nuclear bonds. We will address the topic of chemical energystorage in a later section of this chapter; nuclear energy storage, however, liesbeyond our scope.
The SI unit for internal energy is the joule (J); for the mass-specificinternal energy, it is joules per kilogram (J/kg); and for the molar-specificinternal energy, it is joules per kilomole (J/kmol).
EnthalpyEnthalpy is a useful property defined by the following combination of morecommon properties:
(2.17)
On a mass-specific basis, the enthalpy involves the specific volume or thedensity, that is,
(2.18a)
or
(2.18b)
The enthalpy has the same units as internal energy (i.e., J or J/kg). Molar-specific enthalpies are obtained by the application of Eq. 2.3.
The usefulness of enthalpy will become clear during our discussion of thefirst law of thermodynamics (the principle of energy conservation) in Chapter 5.There we will see that the combination of properties, u � Pv , arises naturally inanalyzing systems at constant pressure and in analyzing control volumes. In theformer, the P–v term results from expansion and/or compression work; for thelatter, the P–v term is associated with the work needed to push the fluid into or
h � u � P>r.
h � u � Pv
H � U � PV.
UrotUvib
U � Utrans � Uvib � Urot,
T � Mmolecv2>(3kB).]
kB � 1.3806503 � 10�23 J/K � molecule,
60 Thermal-Fluid Sciences
Enthalpy first appears inconservation of energy for
systems in Eq. 5.12.
➤
Conservation of energy for controlvolumes (Eq. 5.63) uses enthalpy to
replace the combination of flowwork (see Chapter 4) and internal
energy.
➤
For reacting systems, chemical bonds make animportant contribution to the system internalenergy.
0521850436c02_p046-100.qxd 13/9/05 7:50 PM Page 60 Quark01A Quark01:BOOKS:CU/CB Jobs:CB925-Turns:Chapters:Chapter-02:
out of the control volume, that is, flow work. Further discussion of internalenergy and enthalpy is also given later in the present chapter.
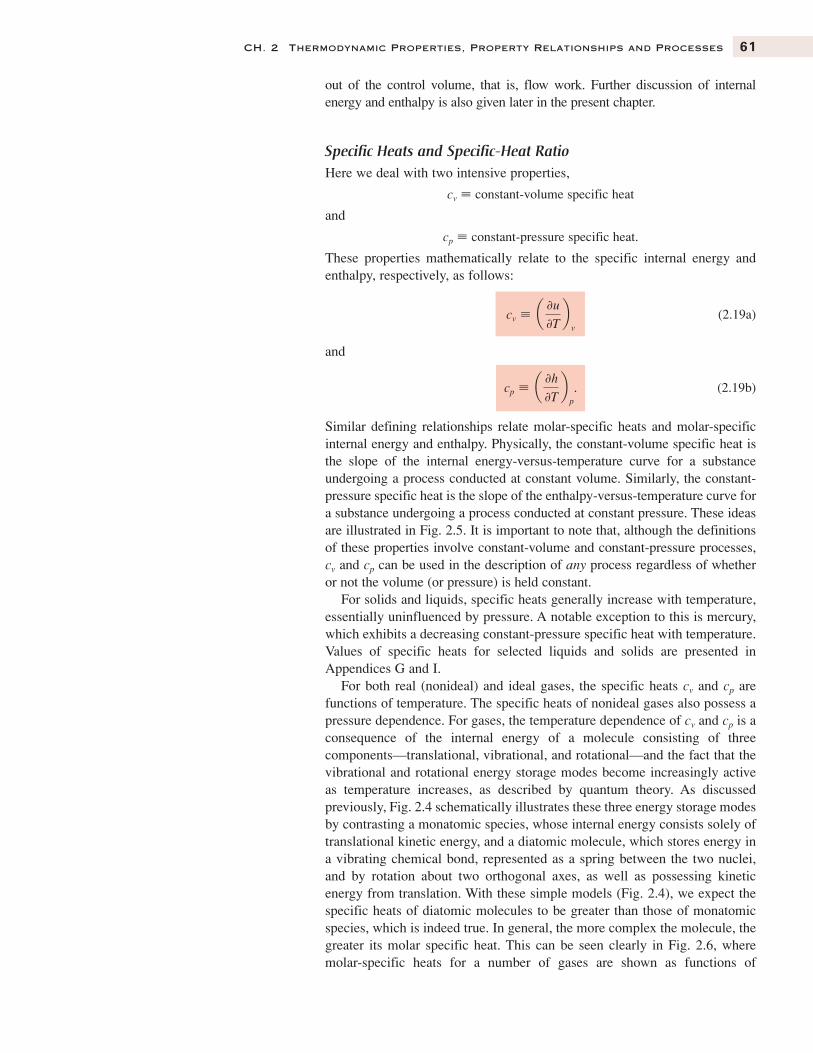
Specific Heats and Specific-Heat RatioHere we deal with two intensive properties,
cv � constant-volume specific heat
and
cp � constant-pressure specific heat.
These properties mathematically relate to the specific internal energy andenthalpy, respectively, as follows:
(2.19a)
and
(2.19b)
Similar defining relationships relate molar-specific heats and molar-specificinternal energy and enthalpy. Physically, the constant-volume specific heat isthe slope of the internal energy-versus-temperature curve for a substanceundergoing a process conducted at constant volume. Similarly, the constant-pressure specific heat is the slope of the enthalpy-versus-temperature curve fora substance undergoing a process conducted at constant pressure. These ideasare illustrated in Fig. 2.5. It is important to note that, although the definitionsof these properties involve constant-volume and constant-pressure processes,cv and cp can be used in the description of any process regardless of whetheror not the volume (or pressure) is held constant.
For solids and liquids, specific heats generally increase with temperature,essentially uninfluenced by pressure. A notable exception to this is mercury,which exhibits a decreasing constant-pressure specific heat with temperature.Values of specific heats for selected liquids and solids are presented inAppendices G and I.
For both real (nonideal) and ideal gases, the specific heats cv and cp arefunctions of temperature. The specific heats of nonideal gases also possess apressure dependence. For gases, the temperature dependence of cv and cp is aconsequence of the internal energy of a molecule consisting of threecomponents—translational, vibrational, and rotational—and the fact that thevibrational and rotational energy storage modes become increasingly activeas temperature increases, as described by quantum theory. As discussedpreviously, Fig. 2.4 schematically illustrates these three energy storage modesby contrasting a monatomic species, whose internal energy consists solely oftranslational kinetic energy, and a diatomic molecule, which stores energy ina vibrating chemical bond, represented as a spring between the two nuclei,and by rotation about two orthogonal axes, as well as possessing kineticenergy from translation. With these simple models (Fig. 2.4), we expect thespecific heats of diatomic molecules to be greater than those of monatomicspecies, which is indeed true. In general, the more complex the molecule, thegreater its molar specific heat. This can be seen clearly in Fig. 2.6, wheremolar-specific heats for a number of gases are shown as functions of
cp � a 0h
0Tb
p
.
cv � a 0u
0Tb
v
CH. 2 Thermodynamic Properties, Property Relationships and Processes 61
0521850436c02_p046-100.qxd 13/9/05 7:50 PM Page 61 Quark01A Quark01:BOOKS:CU/CB Jobs:CB925-Turns:Chapters:Chapter-02:

62 Thermal-Fluid Sciences
FIGURE 2.6
Molar constant-pressure specificheats as functions of temperature formonatomic (H, N, and O), diatomic(CO, H2, and O2), and triatomic (CO2,H2O, and NO2) species. Values arefrom Appendix B.
FIGURE 2.5
The constant-volume specific heat cv isdefined as the slope of u versus T for aconstant-volume process (top).Similarly, cp is the slope of h versus Tfor a constant-pressure process(bottom). Generally, both cv and cp arefunctions of temperature, as suggestedby these graphs.
1
T1
T
TIn
tern
al e
nerg
y, u
v = Constant
1
T1
Ent
halp
y, h
P = Constant
∂u∂T
@T1 ≡ cv(T1)( (v
∂h∂T
@T1 ≡ cp(T1)( (p
00
10
20
30
40
50
60
70
1000 2000Temperature (K)
Con
stan
t-pr
essu
re m
olar
-spe
cifi
c he
at, c
p (k
J/km
ol–K
)
3000 4000 5000
HON
CO
H2
O2
NO2
H2O
CO2
0521850436c02_p046-100.qxd 13/9/05 7:50 PM Page 62 Quark01A Quark01:BOOKS:CU/CB Jobs:CB925-Turns:Chapters:Chapter-02:

CH. 2 Thermodynamic Properties, Property Relationships and Processes 63
Example 2.4
Compare the values of the constant-pressure specific heats for hydrogen(H2) and carbon monoxide (CO) at 3000 K using the ideal-gas molar-specific values from the tables in Appendix B. How does this comparisonchange if mass-specific values are used?
Solution
Known H2 and CO at T
Find
Assumption
Ideal-gas behavior
Analysis To answer the first question requires only a simple table look-up. Molar constant-pressure specific heats found in Table B.3 for H2 andin Table B.1 for CO are as follows:
The difference between these values is 0.101 kJ/kmol �K, or approximately0.3%.
cp, CO (T � 3000 K) � 37.213 kJ/kmol � K.
cp, H2 (T � 3000 K) � 37.112 kJ/kmol � K,
cp, H2, cp, CO, cp, H2
, cp, CO
temperature. As a group, the triatomics have the greatest specific heats,followed by the diatomics, and lastly, the monatomics. Note that the triatomicmolecules are also more temperature dependent than the diatomics, aconsequence of the greater number of vibrational and rotational modes thatare available to become activated as temperature is increased. In comparison,the monatomic species have nearly constant specific heats over a wide rangeof temperatures; in fact, the specific heat of monatomic hydrogen is constant( 20.786 kJ/kmol�K) from 200 K to 5000 K.
Constant-pressure molar-specific heats are tabulated as a function oftemperature for various ideal-gas species in Tables B.1 to B.12 in AppendixB. Also provided in Appendix B are the curve-fit coefficients, taken from theChemkin thermodynamic database [3], which were used to generate thetables. These coefficients can be easily used with spreadsheet software toobtain values at any temperature within the given temperature range.
Values of cv and cp for a number of substances are also available from theNational Institute of Standards and Technology (NIST) online database [11]and the NIST12 software provided with this book. We discuss the use of theseimportant resources later in this chapter.
The ratio of specific heats, g, is another commonly used property8 and isdefined by
(2.20)g �cp
cv�
cp
cv
.
cp
cp �
8 The specific-heat ratio is frequently denoted by k or r, as well as gamma (g), our choice here.We will use k and r to represent the thermal conductivity and radial coordinate, respectively.
Six liquid hydrogen-fueled engines power thesecond stage of this Saturn rocket. Courtesy ofNASA.
0521850436c02_p046-100.qxd 13/9/05 7:50 PM Page 63 Quark01A Quark01:BOOKS:CU/CB Jobs:CB925-Turns:Chapters:Chapter-02:

64 Thermal-Fluid Sciences
Using the molecular weights of H2 and CO found in Tables B.3 and B.1,we can calculate the mass-based constant-pressure specific heats usingEq. 2.4 as follows:
and
Comments We first note that, on a molar basis, the specific heats of H2
and CO are nearly identical. This result is consistent with Fig. 2.6, wherewe see that the molar-specific heats are similar for the three diatomicspecies. On a mass basis, however, the constant-pressure specific heat ofH2 is almost 14 times greater than that of CO, which results from themolecular weight of CO being approximately 14 times that of H2.
� 1.329 kJ/kg � K.
�37.213 kJ/kmol � K
28.010 kg/kmol
cp, CO � cp, CO>MCO
� 18.409 kJ/kg � K
�37.112 kJ/kmol � K
2.016 kg/kmol
cp, H2� cp, H2
>M H2
Self Test2.4 ✓ Calculate the specific heat ratios for (a) H2, (b) CO, and (c) air using the data from
Table E.1 in Appendix E.(Answer: (a) 1.402, (b) 1.398, (c) 1.400)
2.2c Properties Related to the Second Law9
EntropyAs we will see in Chapter 7, a thermodynamic property called entropy (S)originates from the second law of thermodynamics.10 This property isparticularly useful in determining the spontaneous direction of a process andfor establishing maximum possible efficiencies, for example.
The property entropy can be interpreted from both macroscopic andmicroscopic (molecular) points of view. We defer presenting a precisemathematical definition of entropy from the macroscopic viewpoint untilChapter 7; the following verbal definition, however, provides some notionof what this property is all about:
Entropy is a measure of the unavailability of thermal energyto do work in a closed system.
9 For an introductory study of properties, this section may be skipped without any loss ofcontinuity. This section is most useful, however, in conjunction with the study of Chapter 7.
10 Rudolf Clausius (1822–1888) chose entropy, a Greek word meaning transformation,because of its root meaning and because it sounded similar to energy, a closely relatedconcept [4].
Chapter 7 revisits entropy andexpands upon the discussion here.
Equation 7.16 provides a formalmacroscopic definition of entropy.
➤
Level 2
0521850436c02_p046-100.qxd 13/9/05 7:50 PM Page 64 Quark01A Quark01:BOOKS:CU/CB Jobs:CB925-Turns:Chapters:Chapter-02:

CH. 2 Thermodynamic Properties, Property Relationships and Processes 65
Structure of liquid water.
Evaporating water molecules.
Hexagonal crystal structure of ice. The openstructure causes ice to be less dense than liquidwater.
Level 3
From this definition, we might imagine that two identical quantities ofenergy are not of equal value in producing useful work. Entropy is valuablein quantifying this usefulness of energy.
The following informal definition presents a microscopic (molecular)interpretation of entropy:
Entropy is a measure of the microscopic randomnessassociated with a closed system.
To help understand this statement, consider the physical differences betweenwater existing as a solid (ice) and as a vapor (steam). In a piece of ice, theindividual H2O molecules are locked in relatively rigid positions, with theindividual hydrogen and oxygen atoms vibrating within well-defineddomains. In contrast, in steam, the individual molecules are free to movewithin any containing vessel. Thus, we say that the state of the steam is moredisordered than that of the ice and that the steam has a greater entropy perunit mass. It is this idea, in fact, that leads to the third law of thermo-dynamics, which states that all perfect crystals have zero entropy at atemperature of absolute zero. For the case of a perfectly ordered crystal atabsolute zero, there is no motion, and there are no imperfections in thelattice; thus, there is no uncertainty about the microscopic state (becausethere is no disorder or randomness) and the entropy is zero. A more detaileddiscussion of the microscopic interpretation of entropy is presented in theappendix to this chapter.
The SI units for entropy S, mass-specific entropy s, and molar-specificentropy are J/K, J/kg�K, and J/kmol �K, respectively. Tabulated values ofentropies for ideal gases, air, and H2O are found in Appendices B, C and D,respectively. Entropies for selected substances are also available from theNIST software and online database [11].
Gibbs Free Energy or Gibbs FunctionThe Gibbs free energy or Gibbs function, G, is a composite propertyinvolving enthalpy and entropy and is defined as
G � H � TS, (2.21a)
and, per unit mass,g � h � Ts. (2.21b)
Molar-specific quantities are obtained by the application of Eq. 2.3. The Gibbsfree energy is particularly useful in defining equilibrium conditions for reactingsystems at constant pressure and temperature. We will revisit this property laterin this chapter in the discussion of ideal-gas mixtures; in Chapter 7 thisproperty is prominent in the discussion of chemical equilibrium.
Helmholtz Free Energy or Helmholtz FunctionThe Helmholtz free energy, A, is also a composite property, definedsimilarly to the Gibbs free energy, with the internal energy replacing theenthalpy, that is,
A � U � TS, (2.22a)
s,
0521850436c02_p046-100.qxd 13/9/05 7:50 PM Page 65 Quark01A Quark01:BOOKS:CU/CB Jobs:CB925-Turns:Chapters:Chapter-02:

66 Thermal-Fluid Sciences
or, per unit mass,
a � u � Ts. (2.22b)
Molar-specific quantities relate in the same manner as expressed by Eq. 2.22b.The Helmholtz free energy is useful in defining equilibrium conditions forreacting systems at constant volume and temperature. Although we make nouse of the Helmholtz free energy in this book, you should be aware of itsexistence.
2.3 CONCEPT OF STATE RELATIONSHIPS
2.3a State PrincipleAn important concept in thermodynamics is the state principle:
In dealing with a simple compressible substance, thethermodynamic state is completely defined by specifying
two independent intensive properties.
The state principle allows us to define state relationships among the variousthermodynamic properties. Before developing such state relationships, weexamine what is mean by independent properties.
The concept of independent properties is particularly important in dealingwith substances when more than one phase is present. For example,temperature and pressure are not independent properties when water (liquid)and steam (vapor) coexist. As you are well aware, water at one atmosphereboils at a specific temperature (i.e., 100°C). Increasing the pressure results inan increase in the boiling point, which is the principle upon which thepressure cooker is based. One cannot change the pressure and keep thetemperature constant: A fixed relationship exists between temperature andpressure; hence, they are not independent. We will examine this concept ofindependence in greater detail later when we study the properties ofsubstances that exist in multiple phases.
2.3b P–vv –T Equations of StateWhat is generally known as an equation of state is the mathematicalrelationship among the following three intensive thermodynamic properties:pressure P; specific volume v , and temperature T. The state principle allows usto determine any one of the three properties from knowledge of the other two. Inits most general and abstract form, we can write the P–v –T equation of state as
f1 (P, v , T) � 0. (2.23)
In the following sections, we explore the explicit functions relating P, v, andT for various substances, starting with the ideal gas, a concept with which youshould already have some familiarity.
2.3c Calorific Equations of StateA second type of state relationship connects energy-related thermodynamicproperties to pressure, temperature, and specific volume. The state principle
v
P
T
0521850436c02_p046-100.qxd 13/9/05 7:50 PM Page 66 Quark01A Quark01:BOOKS:CU/CB Jobs:CB925-Turns:Chapters:Chapter-02:

CH. 2 Thermodynamic Properties, Property Relationships and Processes 67
also applies here; thus, for a simple compressible substance, a knowledge ofany two intensive properties is sufficient to determine any of the others. Themost common calorific equations of state relate specific internal energy u tov and T, and, similarly, enthalpy h to P and T, that is,
f2 (u, T, v ) � 0, (2.24a)
or
f3 (h, T, P) � 0. (2.24b)
These ideas are developed in more detail for various substances in the sectionsthat follow.
2.3d Temperature–Entropy (Gibbs) RelationshipsThe third and final type of state relationships we consider are those that relateentropy-based properties—that is, properties relating to the second law ofthermodynamics—to pressure, specific volume, and temperature. The mostcommon relationships are of the following general form:
(2.25a)
(2.25b)
and
(2.25c)
As with the other state relationships, these, too, are defined concretely inthe following sections.
2.4 IDEAL GASES AS PURE SUBSTANCES
In this section, we define all of the useful state relationships for a class of puresubstances known as ideal gases. We begin with the definition of an ideal gas.
2.4a Ideal Gas DefinitionThe following definition of an ideal gas is tautological in that it uses a staterelationship to define what is meant by an ideal gas:
An ideal gas is a gas that obeys the relationship Pvv � RT.
In this definition P and T are the absolute pressure and absolute temperature,respectively, and R is the particular gas constant, a physical constant. Theparticular gas constant depends on the molecular weight of the gas as follows:
(2.26)
where the subscript i denotes the species of interest, and Ru is the universalgas constant, defined by
(2.27)
This definition of an ideal gas can be made more satisfying by examiningwhat is implied from a molecular, or microscopic, point of view. Kinetic
Ru � 8314.472 (15) [�] J/kmol � K.
Ri � Ru>M i [�] J/kg � K,
f6 (g, T, P) � 0.
f5 (s, T, v ) � 0,
f4 (s, T, P) � 0,
An ideal-gas thermometer consists of a sensingbulb filled with an ideal gas (right), a movableclosed reservoir (left), and a liquid column(center). The height of the liquid column isdirectly proportional to the temperature of thegas in the bulb when the reservoir position isadjusted to maintain a fixed volume for theideal gas.
0521850436c02_p046-100.qxd 13/9/05 7:50 PM Page 67 Quark01A Quark01:BOOKS:CU/CB Jobs:CB925-Turns:Chapters:Chapter-02:

68 Thermal-Fluid Sciences
theory predicts that Pv � RT, first, when the molecules comprising thesystem are infinitesimally small, hard, round spheres occupying negligiblevolume and, second, when no forces exist among these molecules exceptduring collisions. Qualitatively, these conditions imply a gas at low density.What we mean by low density will be discussed in later sections.
2.4b Ideal-Gas Equation of StateFormally, the P–v –T equation of state for an ideal gas is expressed as
(2.28a)
Alternative forms of the ideal-gas equation of state arise in various ways.First, by recognizing that the specific volume is the reciprocal of the density(v � 1�r), we get
(2.28b)
Second, expanding the definition of specific volume (v � V�M) yields
(2.28c)
Third, expressing the mass in terms of the number of moles and molecularweight of the particular gas of interest (M � N M i) yields
. (2.28d)
Finally, by employing the molar specific volume we obtain
(2.28e)
We summarize these various forms of the ideal-gas equation of state in Table 2.4and encourage you to become familiar with these relationships by performingthe various conversions on your own (see Problem 2.36).
Pv � RuT.
v � vM i,
PV � NRuT
PV � MRT.
P � rRT.
Pv � RT.
Table 2.4 Various Forms of theIdeal-Gas Equation ofState
Pv � RT Eq. 2.28aP � rRT Eq. 2.28bPV � MRT Eq. 2.28cPV � NRuT Eq. 2.28dP � RuT Eq. 2.28ev
Example 2.5
A compressed-gas cylinder contains N2 at room temperature (25°C). A gageon the pressure regulator attached to the cylinder reads 120 psig. A mercurybarometer in the room in which the cylinder is located reads 750 mm Hg.What is the density of the N2 in the tank in units of kg/m3? Also determinethe mass of the N2 contained in the 1.54-ft3 steel tank?
Solution
Known TN2, PN2,g, Patm, VN2
Find rN2, MN2
Assumption
Ideal-gas behavior
Analysis To find the density of nitrogen, we apply the ideal-gas equationof state (Eq. 2.28b, Table 2.4). Before doing so we must determine theparticular gas constant for N2 and perform several unit conversions ofgiven information.
0521850436c02_p046-100.qxd 13/9/05 7:50 PM Page 68 Quark01A Quark01:BOOKS:CU/CB Jobs:CB925-Turns:Chapters:Chapter-02:

CH. 2 Thermodynamic Properties, Property Relationships and Processes 69
From Eqs. 2.26 and 2.27, we find the particular gas constant,
where the molecular weight for N2 is calculated from the atomic weightsgiven in the front of the book (or found directly in Table B.7).
The absolute pressure in the tank is (Eq. 2.12)
where
and
Thus, the absolute pressure of the N2 is
which rounds off to
The absolute temperature of the N2 is
To obtain the density, we now apply the ideal-gas equation of state (Eq. 2.28b)
Note that we have set aside the units and unit conversions to assure theirproper treatment. Unit conversion factors are always enclosed in squarebrackets. We obtain the mass from the definition of density (Eq. 2.8)
or
MN2� rN2
VN2.
rN2�
MN2
VN2
,
[�]
Pa c 1 N/m2
Pad
J
kg � Kc 1 N � m
Jd K
� kg/m3.
� 10.5
�927,000
296.8 (298.15)
rN2�
PN2
RN2TN2
TN2� 25�C � 273.15 � 298.15 K.
PN2� 927,000 Pa.
PN2� 827,367 Pa (gage) � 99,992 Pa � 927,359 Pa,
� 99,992 Pa.
Patm,abs � (750 mm Hg) c 1 atm
760 mm Hgd c 101,325 Pa
1 atmd
� 827,367 Pa (gage)
PN2, g � 120
lbf
in2 c 39.370 in
1 md 2 c 1 N
0.224809 lbfd
PN2� PN2, g � Patm, abs,
� 296.8 J/kg � K,
RN2�
Ru
M N2
�8314.47 J/kmol � K
28.013 kg/kmol
0521850436c02_p046-100.qxd 13/9/05 7:50 PM Page 69 Quark01A Quark01:BOOKS:CU/CB Jobs:CB925-Turns:Chapters:Chapter-02:

70 Thermal-Fluid Sciences
Example 2.6
It is a cold, sunny day in Merrill, WI. The temperature is �10 F, thebarometric pressure is 100 kPa, and the humidity is nil. Estimate theoutside air density. Also estimate the molar density, N�V, of the air.
Solution
Known Tair, Pair
Find rair
Assumptions
i. Air can be treated as a pure substance.ii. Air can be treated as an ideal gas.
iii. Air is dry.
Analysis With these assumptions, we use the data in Appendix Ctogether with the ideal-gas equation of state (Eq. 2.28b) to find the airdensity. First, we convert the temperature to SI absolute units:
The density is thus
where Rair, the particular gas constant for air, was obtained from Table C.1in Appendix C. The treatment of units in this calculation is the same asdetailed in the previous example.
The molar density is the number of moles per unit volume. This quantityis calculated by dividing the mass density (rair) by the apparent molecularweight of the air, that is,
Comments The primary purpose of this example is to introduce theapproximation of treating air, a mixture of gases (see Table C.1 for the
Nair> Vair � rair>M air �
1.395 kg/m3
28.97 kg/ kmol� 0.048 kmol/m3.
rair �Pair
Rair Tair�
100,000 Pa
287.0 J/kg � K (249.8 K)� 1.395 kg/m3,
Tair (K) �5
9 (�10 � 459.67) � 249.8 K.
Self Test2.5 ✓ The valve of the tank in Example 2.5 is slowly opened and 0.1 kg of N2 escapes.
Calculate the density of the remaining N2 and find the final gage pressure in the tankassuming the temperature remains at 25°C.
(Answer: 8.2 kg/m3, 626.6 kPa)
The tank volume is
Thus,
Comments Note that, although the application of the ideal-gas law to findthe density is straightforward, unit conversions and calculations ofabsolute pressures and temperatures make the calculation nontrivial.
MN2� 10.5
kg
m3 0.0436 m3 � 0.458 kg.
VN2� 1.54 ft3 c 1 m
3.2808 ftd 3 � 0.0436 m3.
0521850436c02_p046-100.qxd 13/9/05 7:50 PM Page 70 Quark01A Quark01:BOOKS:CU/CB Jobs:CB925-Turns:Chapters:Chapter-02:

CH. 2 Thermodynamic Properties, Property Relationships and Processes 71
composition of dry air), as a simple substance that behaves as an ideal gas.Note the introduction of the apparent molecular weight, Mair � 28.97 kg/kmol, and the particular gas constant, Rair � Ru�Mair � 287.0 J/kg�K.Ideal-gas thermodynamic properties for dry air are also tabulated inAppendix C. In our study of air conditioning (Chapter 12), we investigatethe influence of moisture in air.
Self Test2.6 ✓ Calculate the mass of the air in an uninsulated, unheated 10 ft � 15 ft � 12 ft garage
on this same cold day.(Answer: 71.1 kg)
2.4c Processes in P–vv –T SpacePlotting thermodynamic processes on P–v or other thermodynamic propertycoordinates is very useful in analyzing many thermal systems. In this section,we introduce this topic by illustrating common processes on P–v and T–v
coordinates, restricting our attention to ideal gases. Later in this chapter, weadd the complexity of a phase change.
We begin by examining P–v coordinates. Rearranging the ideal-gasequation of state (Eq. 2.28a) to a form in which P is a function of v yields thehyperbolic relationship
(2.29)
By considering the temperature to be a fixed parameter, Eq. 2.29 can beused to create a family of hyperbolas for various values of T, as shown inFig. 2.7. Increasing temperature moves the isotherms further from theorigin.
The usefulness of graphs such as Fig. 2.7 is that one can immediatelyvisualize how properties must vary for a particular thermodynamic process.For example, consider the constant-pressure expansion process shown inFig. 2.7, where the initial and final states are designated as points 1 and 2,respectively. Knowing the arrangement of constant-temperature lines allowsus to see that the temperature must increase in the process 1–2. For thevalues given, the temperature increases from 300 to 600 K. The importantpoint here, however, is not this quantitative result, but the qualitativeinformation available from plotting processes on P–v coordinates. Alsoshown in Fig. 2.7 is a constant-volume process (assuming that we aredealing with a system of fixed mass). In going from state 2 to state 3 atconstant volume, we immediately see that both the temperature andpressure must fall.
In choosing a pair of thermodynamic coordinates to draw a graph, oneusually selects those that allow given constant-property processes to beshown as straight lines. For example, P–v coordinates are the natural choicefor systems involving either constant-pressure or constant- (specific) volumeprocesses. If, however, one is interested in a constant-temperature process,then T–v coordinates may be more useful. In this case, the ideal-gas equationof state can be rearranged to yield
(2.30)T � a P
Rb v.
P � (RT)
1
v.
v
P
T
vP
T
v
PT
0521850436c02_p046-100.qxd 13/9/05 7:50 PM Page 71 Quark01A Quark01:BOOKS:CU/CB Jobs:CB925-Turns:Chapters:Chapter-02:

72 Thermal-Fluid Sciences
Treating pressure as a fixed parameter, this relationship yields straight lineswith slopes of P�R. Higher pressures result in steeper slopes.
Figure 2.8 illustrates the ideal-gas T–v relationship. Consider a constant-temperature compression process going from state 1 to state 2. For this process,we immediately see from the graph that the pressure must increase. Also shownon Fig. 2.8 is a constant- (specific) volume process going from state 2 to state 3for conditions of decreasing temperature. Again, we immediately see that thepressure falls during this process.
P = 1000 kPa
800 kPa
600 kPa
500 kPa
0.40.200
500
1000
1500
2000
2500
3000
3500
4000
0.6 0.8 1Specific volume (m3/kg)
Tem
pera
ture
(K
)
Ideal gas—N2
1
2
3
FIGURE 2.8
Constant-temperature (1–2) andconstant-volume (2–3) processes areshown on T�vv coordinates for anideal gas (N2). Lines of constantpressure are straight lines, followingthe ideal-gas equation of state,T � (P�R)vv.
T = 600 K
500 K400 K
300 K
2000
1800
1600
1400
1200
1000
800
600
400
200
00 0.2 0.4 0.6 0.8 1
Specific volume (m3/kg)
Pres
sure
(kP
a)
Ideal gas—N2
1 2
3
FIGURE 2.7
Constant-pressure (1–2) andconstant-volume (2–3) processes areshown on P�vv coordinates for anideal gas (N2). Lines of constanttemperature are hyperbolic, followingthe ideal-gas equation of state, P �(RT)�vv .
0521850436c02_p046-100.qxd 13/9/05 7:50 PM Page 72 Quark01A Quark01:BOOKS:CU/CB Jobs:CB925-Turns:Chapters:Chapter-02:

CH. 2 Thermodynamic Properties, Property Relationships and Processes 73
Example 2.7
An ideal gas system undergoes a thermodynamic cycle composed of thefollowing processes:
1–2: constant-pressure expansion,
2–3: constant-temperature expansion,
3–4: constant-volume return to the state-1 temperature, and
4–1: constant-temperature compression.
Sketch these processes (a) on P–v coordinates and (b) on T–v coordinates.
Solution
The sequences of processes are shown on the sketches.
P = ConstantT = Constant
T = Constant
v = Constant
Specific volume
Pres
sure
1 2
3
4
2 3
41
v = Constant
T = Constant
P = Constant
T = Constant
Tem
pera
ture
Specific volume
Comments To develop skill in making such plots, the reader shouldredraw the requested sketches without reference to the solutions given.Note that the sequence of processes 1–2–3–4–1 constitutes a thermo-dynamic cycle.
Self Test2.7 ✓ Looking at the sketches of Example 2.7, state whether the pressure P, temperature T, and
specific volume vv increase, decrease, or remain the same for each of the four processes.(Answer: 1–2: P constant, T increases, v increases; 2–3: P decreases,T constant, v increases; 3–4: P decreases, T decreases, v constant; 4–1:P increases, T constant, v decreases)
Plotting processes on thermodynamic coordinates develops understandingand aids in problem solving. Whenever possible, we will use such diagramsin examples throughout the book. Also, many homework problems aredesigned to foster development of your ability to draw and use such plots.
0521850436c02_p046-100.qxd 13/9/05 7:50 PM Page 73 Quark01A Quark01:BOOKS:CU/CB Jobs:CB925-Turns:Chapters:Chapter-02:

74 Thermal-Fluid Sciences
2.4d Ideal-Gas Calorific Equations of StateFrom kinetic theory we predict that the internal energy of an ideal gas will bea function of temperature only. That the internal energy is independent ofpressure follows from the neglect of any intermolecular forces in the model ofan ideal gas. In real gases, molecules do exhibit repulsive and attractive forcesthat result in a pressure dependence of the internal energy. As in our discussionof the P–v –T equation of state, the ideal gas approximation, however, is quiteaccurate at sufficiently low densities, and the result that u � u (T only) is quiteuseful.
Ideal-gas specific internal energies can be obtained from experimentally ortheoretically determined values of the constant-volume specific heat. Startingwith the general definition (Eq. 2.19a),
we recognize that the partial derivative becomes an ordinary derivative whenu � u (T only); thus
(2.31a)
or
(2.31b)
which can be integrated to obtain u (T), that is,
(2.31c)
In Eq. 2.31c, we note that a reference-state temperature is required to evaluatethe integral. We also note that, in general, the constant-volume specific heat isa function of temperature [i.e., cv � cv(T)]. From Eq. 2.31b, we can easily findthe change in internal energy associated with a change from state 1 to state 2:
(2.31d)
If the temperature difference between the two states is not too large, theconstant-volume specific heat can be treated as a constant, cv,avg; thus,
(2.31e)
We will return to Eq. 2.31 after discussing the calorific equation of stateinvolving enthalpy.
To obtain the h–T–P calorific equation of state for an ideal gas, we firstshow that the enthalpy of an ideal gas, like the internal energy, is a function
u2 � u1 � cv, avg(T2 � T1).
u2 � u1 � u(T2) � u(T1) � �T2
T1
cv dT.
u(T) � �T
Tref
cv d T.
du � cv d T,
cv �du
d T,
cv � a 0u
0Tb
v
,
0521850436c02_p046-100.qxd 13/9/05 7:50 PM Page 74 Quark01A Quark01:BOOKS:CU/CB Jobs:CB925-Turns:Chapters:Chapter-02:

CH. 2 Thermodynamic Properties, Property Relationships and Processes 75
only of the temperature [i.e., h � h (T only)]. We start with the definition ofenthalpy (Eq. 2.18),
and replace the Pv term using the ideal-gas equation of state (Eq. 2.28a). Thisyields
h � u � RT. (2.32)
Since u � u (T only), we see from Eq. 2.32 that h, too, is a function only oftemperature for an ideal gas. With h � h (T only), the partial derivativebecomes an ordinary derivative and so we have
(2.33a)
From this, we can write
(2.33b)
which can be integrated to yield
(2.33c)
The enthalpy difference for a change in state mirrors that for the internalenergy, that is,
(2.33d)
and if the constant-pressure specific heat does not vary much between states 1and 2,
(2.33e)
All of these relationships (Eqs. 2.31–2.33) can be expressed on a molarbasis simply by substituting molar-specific properties for mass-specificproperties. Note then that R becomes Ru.
Before proceeding, we obtain some useful auxiliary ideal-gas relationshipsby differentiating Eq. 2.32 with respect to temperature, giving
Recognizing the definitions of the ideal-gas specific heats (Eqs. 2.31 and2.33a), we then have
(2.34a)
or(2.34b)
Since property data sources sometimes only provide values or curve fits forcp, one can use Eq. 2.34 to obtain values for cv.
cp � cv � R.
cp � cv � R,
dh
dT�
du
dT� R.
h2 � h1 � cp, avg(T2 � T1).
h2 � h1 � h(T2) � h(T1) � �T2
T1
cp dT,
h(T ) � �T
Tref
cp dT.
dh � cp dT,
cp � a 0h
0Tb
p
�dh
dT.
h � u � P v ,
0521850436c02_p046-100.qxd 13/9/05 7:50 PM Page 75 Quark01A Quark01:BOOKS:CU/CB Jobs:CB925-Turns:Chapters:Chapter-02:

Figure 2.9 provides graphical interpretations of Eqs. 2.31c and 2.33c, ourideal-gas calorific equations of state. Here we see that the area under thecv-versus-T curve represents the internal energy change for a temperaturechange from Tref to T1. A similar interpretation applies to the cp(T) curvewhere the area now represents the enthalpy change.
In the same spirit that we graphically illustrated the ideal-gas equation of stateusing P–v and T–v plots (Figs. 2.7 and 2.8, respectively), we now illustrate theideal-gas calorific equations of state using u–T and h–T plots. Figure 2.10illustrates these u–T and h–T relationships for N2. Because the specific internalenergy and specific enthalpy of ideal gases are functions of neither pressure norspecific volume, each relationship is expressed by a single curve.11 This result(Fig. 2.10) contrasts with the P–v (Fig. 2.7) and T–v (Fig. 2.8) plots generatedfrom the equation of state, where families of curves are required to express thesestate relationships. Being able to sketch processes on u–T and h–T coordinates,as well as on P–v and T–v coordinates, greatly aids problem solving.
Numerical values for (and are available from tables contained inAppendix B for a number of gaseous species, where ideal-gas behavior isassumed. Note the reference temperature of 298.15 K. Curve fits for are alsoprovided in Appendix B for these same gases. Although air is a mixture of gases,it can be treated practically as a pure substance (see Example 2.6). Properties ofair are provided in Appendix C. Note that the reference temperature used inthese air tables is 78.903 K, not 298.15 K. The following examples illustrate theuse of some of the information available in the appendices.
cp
cp)h
76 Thermal-Fluid Sciences
11 This result shows that u and T are not independent properties for ideal gases; likewise, h and Tare not independent properties. Another property is thus needed to define the state of an ideal gas.
FIGURE 2.9
The area under the cv-versus-T curveis the internal energy (top), and thearea under the cp-versus-T curve isthe enthalpy (bottom). Note that thedifference in the areas, [h(T1) �h(Tref)] � [u(T1) � u(Tref)], is R(T1 � Tref).
Area = u(T1) − u(Tref)
= ∫cv(T ) dTT
Tref
Tref
c v
cv(T)
T1T
00
Area = h(T1) − h(Tref)
= ∫ cp(T ) dTT
Tref
Tref
c p
R
cp(T)
T1T
00
0521850436c02_p046-100.qxd 13/9/05 7:50 PM Page 76 Quark01A Quark01:BOOKS:CU/CB Jobs:CB925-Turns:Chapters:Chapter-02:

CH. 2 Thermodynamic Properties, Property Relationships and Processes 77
FIGURE 2.10
For ideal gases, the specific internalenergy and specific enthalpy arefunctions of temperature only. Theconcave-upward curvature in thesenearly straight line plots results fromthe fact that the specific heats (cv andcp) for N2 increase with temperature.
00 1000 2000 3000 4000
500
1000
1500
2000
2500
3000
3500
4000
4500
5000
Temperature (K)
u(T
) or
h(T
) (k
J/kg
)
Ideal gas—N2
h(T)
u(T)
Example 2.8
Determine the specific internal energy u for N2 at 2500 K.
Solution
Known N2, T
Find u
Assumption
Ideal-gas behavior
Analysis We use Table B.7 to determine u. Before that can be done a fewpreliminaries are involved. First, we note that molar-specific enthalpies,not mass-specific internal energies, are provided in the table; however,Eq. 2.32 relates u and h for ideal gases and the conversion to a mass basisis straightforward. A second issue is how to interpret the third column inTable B.7, the column containing enthalpy data. The enthalpy values listedunder the complex column-three heading, can beinterpreted in our present context12 as simply where is assigned azero value at 298.15 K (i.e., Tref � 298.15 K in Eq. 2.33c). At 2500 K, wesee from Table B.7 that
We use this value to find the molar-specific internal energy from Eq. 3.32,which has been multiplied through by the molecular weight to yield
� 74,305 kJ/mol � 20,786 kJ/mol � 53,519 kJ/kmol.
� 74,305 kJ
kmol� 8.31447
kJ
kmol � K 2500 K
u � h � RuT
h � 74,305 kJ/kmol.
hh(T),h�(T) � h�f (Tref),
Molecular structure of nitrogen.
12 As we will see later, the column-three heading has an enlarged meaning when dealing withreacting mixtures of ideal gases. For the present, however, this meaning need not concern us.
0521850436c02_p046-100.qxd 13/9/05 7:50 PM Page 77 Quark01A Quark01:BOOKS:CU/CB Jobs:CB925-Turns:Chapters:Chapter-02:

78 Thermal-Fluid Sciences
Self Test2.8 ✓ Determine the specific enthalpy h and internal energy u for air at 1500 K and 1 atm.
(Answer: 1762.24 kJ/kg, 1331.46 kJ/kg)
Converting the molar-specific internal energy to its mass-specific form(Eq. 2.4) yields
Comments Several very simple, yet very important, concepts are illustratedby this example: 1. the conversions between mass-specific and molar-specific properties, 2. the use of the enthalpy data in Tables B.1–B.12 fornonreacting ideal gases, 3. calculation of ideal-gas internal energies fromenthalpies, and 4. practical recognition of the use of reference states forenthalpies (and internal energies).
� 1910.5 kJ/kg.
�53,519 kJ/kmol
28.013 kg/kmol
u � u>M N2
Example 2.9
Determine the changes in the mass-specific enthalpy and the mass-specificinternal energy for air for a process that starts at 300 K and ends at 1000 K.Also show that �h � �u � R�T, and compare a numerical evaluation of thiswith tabulated data.
Solution
Known air,
Find
Sketch
Assumption
Air behaves as a single-component ideal gas.
Analysis From Table C.2, we obtain the following values for h and u:
∆hh or
u
∆u
h (T )
u (T )
T1 T2T
¢h [� h(T2) � h(T1)], ¢u [� u(T2) � u(T1)], ¢h � ¢u
T1, T2
Air300 K
Air1000 K
State 1 State 2
0521850436c02_p046-100.qxd 13/9/05 7:50 PM Page 78 Quark01A Quark01:BOOKS:CU/CB Jobs:CB925-Turns:Chapters:Chapter-02:

CH. 2 Thermodynamic Properties, Property Relationships and Processes 79
T h u(K) (kJ/kg) (kJ/kg)
300 426.04 339.931000 1172.43 885.22
Using these data, we calculate
and
Applying Eq. 2.32, we can relate �h and �u, that is,
and
Subtracting these yields
or
We evaluate this equation using the particular gas constant for air (R �
Ru�Mair), giving us
This compares to the value obtained from the Table C.1 data as follows:
This result is within 0.1% of our calculation. Failure to achieve identicalvalues is probably a result of the methods used to generate the tables (i.e.,curve fitting).
Comment This example illustrates once again the treatment of air as asingle-component ideal gas and the use of Appendix C for air properties.
� 201.10 kJ/kg.
(¢h � ¢u)tables � 746.39 kJ/kg � 545.29 kJ/kg
� 200.90 kJ/kg.
¢h � ¢u �8.31447 kJ/kmol � K
28.97 kg/kmol (1000 � 300) K
¢h � ¢u � R¢T.
h2 � h1 � u2 � u1 � R(T2 � T1),
h1 � u1 � RT1.
h2 � u2 � RT2
� 545.29 kJ/kg.
¢u � 885.22 kJ/kg � 339.93 kJ/kg
� 746.39 kJ/kg
� 1,172.43 kJ/kg � 426.04 kJ/kg
� h(1000) � h(300)
¢h � h(T2) � h(T1)
Self Test2.9 ✓ Recalculate the values for the change in mass-specific enthalpy and internal energy for
the process in Example 2.9 using Eqs. 2.31e and 2.33e and an appropriate averagevalue of cv and cp. Compare your answer with that of Example 2.9.
(Answer: 751.8 kJ/kg, 550.2 kJ/kg)
At this point, the reader hassufficient knowledge of properties
to begin a study of Chapters 4 and 5. This is also a good entrypoint from Chapter 7 following
Eq. 7.26.
➤
0521850436c02_p046-100.qxd 13/9/05 7:50 PM Page 79 Quark01A Quark01:BOOKS:CU/CB Jobs:CB925-Turns:Chapters:Chapter-02:

80 Thermal-Fluid Sciences
Josiah Willard Gibbs (1839–1903).
Level 2
2.4e Ideal-Gas Temperature–Entropy (Gibbs) Relationships
To obtain the desired temperature–entropy relationships (Eqs. 2.25a and2.25b) for an ideal gas, we apply concepts associated with the first andsecond laws of thermodynamics. These concepts are developed in Chapters5 and 7, respectively, and the reader should be familiar with these chaptersbefore proceeding with this section.
We begin by considering a simple compressible system that undergoes aninternally reversible process that results in an incremental change in state.For such a process, the first law of thermodynamics is expressed (Eq. 5.5) as
The incremental heat interaction is related directly to the entropy changethrough the formal definition of entropy from Chapter 7 (i.e., Eq. 7.16),
or
For a simple compressible substance, the only reversible work mode iscompression and/or expansion, that is,
Substituting these expressions for and into the first-lawstatement yields
We rearrange this result slightly and write
(2.35a)
which can also be expressed on a per-unit-mass basis as
(2.35b)
Equation 2.35 is the first of the so-called Gibbs or T–ds equations. We obtaina second Gibbs equation by employing the definition of enthalpy (Eq. 2.17),that is,
which can be differentiated to yield
Substituting this expression for dU into Eq. 2.35a and simplifying yields
(2.36a)
or on a per-unit-mass basis
(2.36b)Tds � dh � vdP.
TdS � dH � VdP,
dU � dH � PdV � VdP.
U � H � PV,
Tds � du � Pdv.
TdS � dU � PdV,
TdS � PdV � dU.
dWrevdQrev
dWrev � PdV.
dQrev � TdS.
dS � a dQTb
rev,
dQrev
dQrev � dWrev � dU.
0521850436c02_p046-100.qxd 13/9/05 7:50 PM Page 80 Quark01A Quark01:BOOKS:CU/CB Jobs:CB925-Turns:Chapters:Chapter-02:

CH. 2 Thermodynamic Properties, Property Relationships and Processes 81
Note that Eqs. 2.35 and 2.36 apply to any simple compressible substance,not just an ideal gas; furthermore, these relationships apply to anyincremental process, not just an internally reversible one.
We now proceed toward our objective of finding the relationships f4 (s, T, P) � 0 and f5(s, T, v) � 0 for an ideal gas by using the ideal-gasequation of state and the ideal-gas calorific equations of state. Starting withEq. 2.36b, we substitute v � RT�P (Eq. 2.28a) and dh � cpdT to yield
which, upon dividing through by T, becomes
(2.37)
Similarly, Eq. 2.35b is transformed using the substitutions P � RT�v anddu � cvdT to yield
(2.38)
To evaluate the entropy change in going from state 1 to state 2 state, weintegrate Eqs. 2.37 and 2.38, that is,
and
The second term on the right-hand side of each of these expressions can beeasily evaluated since R is a constant, and so
(2.39a)
and
(2.39b)
To evaluate the integrals in Eqs. 2.39a and 2.39b requires knowledge ofcp(T) and cv(T). Curve-fit expressions for cp(T) are readily available formany species (e.g., Table B.13); cv(T) can be determined using the cp curvefits and the ideal-gas relationship, cv(T) � cp(T) � R (Eq. 2.34).
In many engineering applications, an average value of cp (or cv) over thetemperature range of interest can be used to evaluate s2 � s1 with reasonableaccuracy:
(2.40a)s2 � s1 � cp, avg ln
T2
T1� R ln
P2
P1
s2 � s1 � �2
1
cv
dT
T� R ln
v2
v1.
s2 � s1 � �2
1
cp
dT
T� R ln
P2
P1
s2 � s1 ��2
1
ds ��2
1
cv
dT
T � �
2
1
R
dv
v.
s2 � s1 � �2
1
ds � �2
1
cp
dT
T� �
2
1
R
dP
P
ds � cv
dT
T� R
dv
v.
ds � cp
dT
T� R
dP
P.
Tds � cpdT �RT
PdP,
0521850436c02_p046-100.qxd 13/9/05 7:50 PM Page 81 Quark01A Quark01:BOOKS:CU/CB Jobs:CB925-Turns:Chapters:Chapter-02:

82 Thermal-Fluid Sciences
Example 2.10
A rigid tank contains 1 kg of N2 initially at 300 K and 1 atm. Energy isadded to the gas until a final temperature of 600 K is reached. Calculatethe entropy change of the N2 associated with this heating process.
Solution
Known MN2, P1, T1, T2
Find s2 � s1
Sketch
Assumptions
i. The tank is leak free and perfectly rigid; therefore, v2 � v1.ii. The N2 behaves like an ideal gas.
Analysis Recognizing that this is a constant-volume process (see sketchand assumptions) makes the calculation of the specific entropy changestraightforward. To accomplish this, we simplify Eq. 2.40b, which appliesto an ideal gas. Starting with
we recognize that the second term on the right-hand side is zero since v2 � v1
and ln v2�v1 � ln(1) � 0; thus,
s2 � s1 � cv, avg ln
T2
T1.
s2 � s1 � cv, avg ln
T2
T1� R ln
v2
v1,
P2
T2
T1
v 1 = v 2v
P1
2
1
T
N2
and
(2.40b)
Molar-specific forms of Eqs. 2.35–2.40 are formed by substitutingmolar-specific properties for their mass-specificcounterparts (v, u, h, s, cp, and cv) and substituting Ru for R.
(v, u, h, s, cp, and cv)
s2 � s1 � cv, avg ln
T2
T1� R ln
v2
v1.
0521850436c02_p046-100.qxd 13/9/05 7:50 PM Page 82 Quark01A Quark01:BOOKS:CU/CB Jobs:CB925-Turns:Chapters:Chapter-02:

CH. 2 Thermodynamic Properties, Property Relationships and Processes 83
To evaluate cv, avg, we use data from Table B.7 together with Eq. 2.34 asfollows:
Converting to a mass basis,
and calculating the specific gas constant for N2,
we obtain from Eq. 2.34, that is,
We now calculate the entropy change from the simplified Eq. 2.40b we justderived:
Comments First, we note the importance of recognizing that thevolume is constant for the given process. Discovering that a property isconstant is frequently the key to solving problems. Second, we note that,because both the initial and final temperatures were given, finding anaverage value for the specific heat is accomplished without anyiteration.
� 0.5262 kJ/kg � K.
s2 � s1 � 0.7592 ln a 600 K
300 Kb kJ/kg �K
� 0.7592 kJ/kg � K.
� 1.0560 kJ/kg � K � 0.2968 kJ/kg � K
cv, avg � cp, avg � R
cv, avg
�8.31447 kJ/kmol � K
28.013 kg/kmol� 0.2968 kJ/kg � K,
R � Ru>M N2
�29.581 kJ/kmol � K
28.013 kg/kmol� 1.0560 kJ/kg � K,
cp, avg � cp, avg>M N2
�29.075 � 30.086
2 kJ/kmol � K � 29.581 kJ/kmol � K.
cp, avg �cp
(300) � cp (600)
2
Self Test2.10 ✓ Redo Example 2.10 using Equation 2.40a. Do you expect that your answer will be the
same as in Example 2.10? Why or why not?(Answer: 0.5262 kJ/kg �K. Yes, because entropy is a property of the systemand is defined by the states)
2.4f Ideal-Gas Isentropic Process Relationships
For an isentropic process, a process in which the initial and finalentropies are identical, Eqs. 2.40a and 2.40b can be used to develop someuseful engineering relationships. Setting s2 � s1 equal to zero in Eq.2.40a gives
0 � cp, avg ln
T2
T1� R ln
P2
P1.
0521850436c02_p046-100.qxd 13/9/05 7:50 PM Page 83 Quark01A Quark01:BOOKS:CU/CB Jobs:CB925-Turns:Chapters:Chapter-02:

84 Thermal-Fluid Sciences
Natural gas compressor station in Wyoming.
Dividing by R and rearranging yields
and removing the logarithm by exponentiation, we obtain
This equation can be simplified by introducing the specific heat ratio g andthe fact that cp � cv � R (Eq. 2.34b), and so
thus,
(2.41a)
or, more generally,
(2.41b)
Equation 2.40b can be similarly manipulated to yield
(2.42a)
or(2.42b)
Applying the ideal-gas equation of state to either Eq. 2.41 or Eq. 2.42, weobtain a third and final ideal-gas isentropic-process relationship:
(2.43a)
or
(2.43b)
This last relationship (Eq. 2.43b) is easy to remember. All of the otherisentropic relationships are easily derived from this by applying the ideal-gas equation of state.
The ideal-gas isentropic-process relationships are summarized in Table2.5 for convenient future reference. One use of these relationships is tomodel ideal compression and expansion processes in internal combustionengines, air compressors, and gas-turbine engines, for example. Example2.11 illustrates this use in this chapter; other examples are foundthroughout the book.
2.4g Processes in T–s and P–vv Space
With the addition of entropy, we now have four properties (P, v, T, and s) todefine states and describe processes. We now investigate T–s and P–v space
Pvg � constant.
P2
P1 � a v2
v1b�g
,
Tvg�1 � constant.
v2
v1� a T2
T1b
11�g
,
TgP1�g � constant.
P2
P1� a T2
T1bg
g�1,
cp, avg
R�
cp, avg
cp, avg � cv, avg�
g
g � 1;
P2
P1� a T2
T1b
cp,avg
R
,
ln
P2
P1�
cp, avg
R ln
T2
T1,
0521850436c02_p046-100.qxd 13/9/05 7:50 PM Page 84 Quark01A Quark01:BOOKS:CU/CB Jobs:CB925-Turns:Chapters:Chapter-02:

CH. 2 Thermodynamic Properties, Property Relationships and Processes 85
to see how various fixed-property processes appear on these coordinates. InT–s space, isothermal and isentropic processes are by definition horizontaland vertical lines, respectively. Less obvious are the lines of constantpressure and specific volume shown in Fig. 2.11. Here we see that, throughany given state point, lines of constant specific volume have steeper slopesthan those of constant pressure. In P–v space, constant-pressure andconstant-volume processes are, again by definition, horizontal and verticallines, whereas constant-entropy and constant-temperature processes followcurved paths as shown in Fig. 2.12. Here we see that lines of constantentropy are steeper (i.e., have greater negative slope) than those of constanttemperature. You should become familiar with these characteristics of T–sand P–v diagrams.
Table 2.5 Ideal-Gas Isentropic-Process Relationships
General Form State 1 to State 2 Equation Reference
Pv g � constant Eq. 2.43
Tv g�1 � constant Eq. 2.42
TgP1�g � constant Eq. 2.41P2
P1� a T 2
T 1bg
g�1
T2
T1� a v 2
v 1b1�g
P2
P1� a v 2
v 1b�g
Lines of constant specific volume (vB > vA)
Lines of constant pressure (P2 > P1)P 2
P 1
v A
v B
Specific entropy
Tem
pera
ture
s
T
FIGURE 2.11
On a T�s diagram, lines of constant pressure (isobars) and lines of constantspecific volume (isochors) both exhibit positive slopes. At a particular state, aconstant-volume line has a greater slope than a constant-pressure line.
0521850436c02_p046-100.qxd 13/9/05 7:50 PM Page 85 Quark01A Quark01:BOOKS:CU/CB Jobs:CB925-Turns:Chapters:Chapter-02:

86 Thermal-Fluid Sciences
FIGURE 2.12
On a P�vv diagram, lines of constanttemperature (isotherms) and lines ofconstant entropy (isentropes) havenegative slopes. At a particular state,an isentrope is steeper (has a greaternegative slope) than an isotherm.
Lines of constant temperature (T2 > T1)
Lines of constant entropy (sB > sA)
Specific volume
Pres
sure
v
P
T2
T1
sB
sA
Example 2.11
Sketch the following set of processes on T–s and P–v diagrams:
1–2: isothermal expansion,
2–3: isentropic expansion,
3–4: isothermal compression, and
4–1: isentropic compression.
Solution
We begin with the T–s diagram since the temperature is fixed for two ofthe four processes whereas the entropy is fixed for the remaining two.Recognizing that in an expansion process v2 is greater than v1 and,therefore, from Fig. 2.11 that state 2 must lie to the right of state 1, wedraw process 1–2 as a horizontal line from left to right. Because thevolume is continuing to increase in process 2–3, our isentrope is a verticalline downward from state 2 to state 3. In the compression process fromstate 3 to state 4, the volume decreases; thus, we draw the state-3 to state-4 isotherm from right to left, stopping when s4 is equal to s1. An upwardvertical line concludes the cycle and completes a rectangle on T–scoordinates.
To draw the P–v plot, we refer to Fig. 2.12, which shows lines ofconstant temperature and lines of constant entropy. Because the volumeincreases in the process 1–2, we draw an isotherm directed downward andto the right. The expansion continues from state 2 to state 3, but the processline now follows the steeper isentrope to the lower isotherm. The cycle iscompleted following this lower isotherm upward and to the left until itintercepts the upper isentrope at the initial state 1.
Comments This sequence of processes is the famous Carnot cycle, whichis discussed at length in Chapter 7.
1 2
4 3
T
P
T-s Diagram
P-v Diagram
s
v
1
2
34
0521850436c02_p046-100.qxd 13/9/05 7:50 PM Page 86 Quark01A Quark01:BOOKS:CU/CB Jobs:CB925-Turns:Chapters:Chapter-02:

CH. 2 Thermodynamic Properties, Property Relationships and Processes 87
Self Test2.11 ✓ Referring to Example 2.11, for which process(es) are the equations in Table 2.5 valid?
Why or why not?(Answer: 2–3 and 4–1 only. Equations in Table 2.5 are for isentropic processesonly.)
Example 2.12 SI Engine Application
The following processes constitute the air-standard Otto cycle. Plot theseprocesses on P–v and T–s coordinates:
1–2: constant-volume energy addition,
2–3: isentropic expansion,
3–4: constant-volume energy removal, and
4–1: isentropic compression.
Solution
Since there are two constant-volume processes and two constant-entropyprocesses, we begin by drawing two isentropes on P–v coordinates and twoisochors on T–s coordinates. These are shown in the sketches. Because we
4
3
2
1
T
ss3 = s2s1 = s4
v = Constant
v = Constant
2
1
4
3
s = Constant
s = Constant
P
vv 4 = v 3v 2 = v 1
expect the pressure to increase with energy addition at constant volume, wedraw a vertical line upward from state 1 to state 2 on the P–v diagram.Because process 2–3 is an expansion, with state 3 lying below state 2, we thusknow that process 1–2 follows the upper constant-volume line on the T–sdiagram. Having established the relative locations of states 1, 2, and 3 on eachplot, completing the cycle is straightforward.
Comments The cycle illustrated in this example using air as the workingfluid is often used as a starting point for understanding the thermodynamicsof spark-ignition (Otto cycle) engines. In the real engine, a combustionprocess causes the pressure to rise from states 1 to 2, rather than energyaddition from the surroundings. Furthermore, the real “cycle” is not closedbecause the gases exit the cylinder and are replaced by a fresh charge of air-fuel mixture each mechanical cycle. Nevertheless, this air-standard cycledoes capture the effect of compression ratio on thermal efficiency and canbe used to model other effects as well. Some of these are shown in examplesthroughout this book.
During the intake stroke of a real spark-ignitionengine, fresh fuel and air enter the cylinder andmix with the residual gases. Image courtesy ofEugene Kung and Daniel Haworth.
Also see Example 4.2 in Chapter 4. ➤
0521850436c02_p046-100.qxd 13/9/05 7:50 PM Page 87 Quark01A Quark01:BOOKS:CU/CB Jobs:CB925-Turns:Chapters:Chapter-02:

Table 2.6 Special Cases of Polytropic Processes
Process Constant Property PolytropicExponent (n)
Isobaric P 0Isothermal T 1Isentropic s or S g
Isochoric v or V
88 Thermal-Fluid Sciences
Self Test2.12 ✓ Air undergoes an isentropic compression process from 100 to 300 kPa. If the initial
temperature is 30°C, what is the final temperature? (Answer: 414.9 K)
2.4h Polytropic Processes
In the previous section, we saw that an isentropic process can be describedby the equation
By replacing g, the specific heat ratio, by an arbitrary exponent n, we definea generalized process or polytropic process as
(2.44)
For certain values of n, we recover relationships previously developed.These are shown in Table 2.6. For example, when n is unity, a constant-temperature (isothermal) process is described, that is,
Figure 2.13 graphically illustrates these special-case polytropic processes onP–v and T–s coordinates.
The polytropic process is often used to simplify and model complexprocesses. A common use is modeling compression and expansion processeswhen heat-transfer effects are present, as illustrated in the following example.
Pv1 � constant (� RT ).
Pvn � constant.
Pvg � constant.
FIGURE 2.13
P�vv and T�s diagramsillustrating polytropic processpaths for special cases of constantpressure (n � 0), constanttemperature (n � 1), constantentropy (n � g), and constantvolume (n � ��).
v
n = 1n = γ
n = γn = ± ∞
n = ± ∞
n = 0
n = 1n = 0
Tem
pera
ture
Pres
sure
Specific entropySpecific volume
P T
s
Also see Example 5.9. ➤
0521850436c02_p046-100.qxd 13/9/05 7:50 PM Page 88 Quark01A Quark01:BOOKS:CU/CB Jobs:CB925-Turns:Chapters:Chapter-02:

Example 2.13 SI Engine Application
Consider a spark-ignition engine in which the effective compression ratio(CR) is 8:1. Compare the pressure at the end of the compression processfor an isentropic compression with that for a polytropiccompression with n � 1.3. The initial pressure in the cylinder is 100 kPa,a wide-open-throttle condition.
Solution
Known P1, CR, g, n
Find P2(n � g), P2(n � 1.3)
Sketch
Assumption
The working fluid can be treated as air with g � 1.4.
Analysis We apply the polytropic process relationship, Eq. 2.44, for thetwo processes, both starting at the same initial state. From Appendix 1A,we know that the compression ratio is defined as V1�V2. Since the mass isfixed, the compression ratio also equals the ratio of specific volumes,v1�v2. For the isentropic compression,
For the polytropic compression,
Comments We see that the isentropic compression pressure is approxi-mately 20% higher than the polytropic compression pressure. The idealcompression process is adiabatic and reversible, and, hence, isentropic. In anactual engine, energy is lost from the compressed gases by heat transferthrough the cylinder walls, and frictional effects are also present. Thecombined effects result in a compression pressure lower than the ideal value.The use of a polytropic exponent is a simple way to deal with these effects.
� 1490 kPa.
� 100 kPa (8)1.3
P2(n � 1.3) � P1(v1>v2)1.3
� 1840 kPa.
� 100 kPa (8)1.4
P2(n � g) � P1(v1>v2)g
P2 (n = γ)
P2 (n = 1.3)n = 1.3
n = γ
1
v 2 v 1v
P
(n � g � 1.4)
CH. 2 Thermodynamic Properties, Property Relationships and Processes 89
V1
V2
0521850436c02_p046-100.qxd 13/9/05 8:31 PM Page 89 Quark01A Quark01:BOOKS:CU/CB Jobs:CB925-Turns:Chapters:Chapter-02:

90 Thermal-Fluid Sciences
Self Test2.13 ✓ Given an initial temperature of 400 K, calculate the final temperature for each process
in Example 2.13.(Answer: 920 K, 745 K)
2.5 NONIDEAL GAS PROPERTIES
2.5a State (P–vv –T) Relationships
In this section, we will look at three ways to determine P–v –T state relationsfor gases that do not necessarily obey the ideal-gas equation of state (Eq. 2.28):1. the use of tabular data, 2. the use of the van der Waals equation of state, and3. the application of the concept of generalized compressibility. Beforediscussing these methods, however, we define the thermodynamic criticalpoint, a concept important to all three.
The critical point is a point in P–vv –T space defined by thehighest possible temperature and the highest possible
pressure for which distinct liquid and gas phases can beobserved. (See Fig. 2.14.)
At the critical point, we designate the thermodynamic variables with thesubscript c, so that
critical temperature � Tc,critical pressure � Pc,
and
critical specific volume � vc.
Critical properties for a number of substances are given in Table E.1 inAppendix E. We elaborate on the significance of the critical point later inthis chapter in our discussion of substances existing in multiple phases. Oneimmediate use of critical point properties, however, is to establish a rule ofthumb for determining when a gas can be considered ideal: A real gasapproaches ideal-gas behavior when P V Pc. In a later section, we will seeother conditions where ideal-gas behavior is approached.
FIGURE 2.14
The bold dot indicates the criticalpoint on this P–vv –T plot for propane.At temperatures and pressures abovetheir critical values Tc and Pc,respectively, liquid and gas phasesare indistinguishable.
Pres
sure
(M
Pa)
Specific volume (m3/kg)
0.00100 0.0100 0.100
T = Tc
T = Tc
P = Pc
Critical point
Vapor (gas) phase
Liquid phase
10.0
1.00
T
T
T
Liquid and gas phases indistinguishable
0521850436c02_p046-100.qxd 13/9/05 7:50 PM Page 90 Quark01A Quark01:BOOKS:CU/CB Jobs:CB925-Turns:Chapters:Chapter-02:

CH. 2 Thermodynamic Properties, Property Relationships and Processes 91
Example 2.14
Determine if N2 is likely to approximate ideal-gas behavior at 298 K and1 atm.
Solution
The critical properties for N2 from Table E.1 are
Comparing the given properties with the critical properties, we have
and
Clearly, P V Pc; thus, the ideal-gas equation of state is likely to be a goodapproximation to the true state relation for N2 at these conditions. Moreover,T is greater than Tc, which is also in the direction of ideal-gas behavior.
Comment Since Pc is quite high (33 atm) and Tc is quite low (126.2 K),ideal-gas behavior is likely to be good approximation for N2 over a fairly widerange of conditions covering many applications. However, caution should beexercised. The methods described in the following allow us to estimatequantitatively the deviation of real-gas behavior from ideal-gas behavior.
P
Pc�
101,325 Pa
3.39 � 106 Pa� 0.030.
T
Tc�
298 K
126.2 K� 2.36
Pc � 3.39 MPa. Tc � 126.2 K,
Self Test2.14 ✓ Determine if O2 can be considered an ideal gas at 298 K and atmospheric pressure. Can
air at room temperature and atmospheric pressure be considered an ideal gas?(Answer: T�Tc � 1.93 and P�Pc � 0.020, so ideal-gas behavior is a goodapproximation for O2. Since the main constituents of air (N2 and O2) bothbehave as ideal gases, ideal-gas behavior for air is a good approximation.)
For conditions near the critical point or for applications requiring highaccuracy, alternatives to the ideal-gas equation of state are needed. Thefollowing subsections present three approaches.
Tabulated PropertiesAccurate P–v –T data in tabular or curve-fit form are available for a numberof gases of engineering importance. Because of the importance of steam inelectric power generation, a large database is available for this fluid, and tablesare published in a number of sources (e.g., Refs. [7] and [8]). Particularlyuseful and convenient sources of thermodynamic properties are available fromthe NIST [9, 10]. A large portion of the NIST database is available on the CDincluded with this book (NIST12 v. 5.2) and from the Internet [11]. Table 2.7lists the fluids for which properties are available from these sources. We usethe NIST resources throughout this book, and the reader is encouraged tobecome familiar with these valuable sources of thermodynamic data. Selectedtabular data are also provided in Appendix D for steam.
0521850436c02_p046-100.qxd 13/9/05 7:50 PM Page 91 Quark01A Quark01:BOOKS:CU/CB Jobs:CB925-Turns:Chapters:Chapter-02:

92 Thermal-Fluid Sciences
Example 2.15
Determine the deviation from ideal-gas behavior associated with thefollowing gases and conditions:
N2 at 200 K from 1 atm to Pc,
CO2 at 300 K from 1 to 40 atm, and
H2O at 600 K from 1 to 40 atm.
Solution
To quantify the deviation from ideal-gas behavior, we define the factor Z �
Pv�RT. For an ideal gas, Z is unity for any temperature or pressure. We
Table 2.7 Fluid Properties: Fluids Included in NIST12 v. 5.2 Software andNIST Online Database [11]
Fluid NIST12 V. 5.2 NIST Online
Air XWater∗ X XNitrogen X XHydrogen X XParahydrogen X XDeuterium XOxygen X XFluorine XCarbon monoxide X XCarbon dioxide X XMethane X XEthane XEthene XPropane X XPropene XButane XIsobutane XPentane XHexane XHeptane XHelium X XNeon XArgon X XKrypton XXenon XAmmonia X XNitrogen trifluoride XMethane, trichlorofluoro- (R-11) XMethane, dichlorodifluoro- (R-12) XMethane, chlorodifluoro- (R-22) X XMethane, difluoro- (R-32) XEthane, 2,2-dichloro-1,1,1-trifluoro-
(R-123) X XEthane, pentafluoro- (R-125) XEthane, 1,1,1,2-tetrafluoro- (R-134a) X XEthane, 1,1,1-trifluoro- (R-143a) XEthane, 1,1-difluoro- (R-152a) X
∗ See also Appendix D.
0521850436c02_p046-100.qxd 13/9/05 7:50 PM Page 92 Quark01A Quark01:BOOKS:CU/CB Jobs:CB925-Turns:Chapters:Chapter-02:

CH. 2 Thermodynamic Properties, Property Relationships and Processes 93
FIGURE 2.15
Deviations from ideal-gas behaviorcan be seen by the extent to which Z(� Pvv�RT) deviates from unity.At 1 atm, CO2, N2, and H2O all haveZ values near unity. At higherpressures, CO2 and H2O deviatesignificantly from ideal-gas behavior,whereas N2 still behaves essentially asan ideal gas.
00
0.8
1
1.2
10 20 30 40 50Pressure (atm)
Pv/
RT
Ideal gas
N2 (300 K)
H2O (600 K)
CO2 (300 K)
employ the NIST online database [11] to obtain values of specific volumefor the conditions specified. These data are then used to calculate Z values.For example, the specific volume of CO2 at 300 K and 20 atm is 0.025001m3/kg; thus,
A few selected results are presented in the following table, and all of theresults are plotted in Fig. 2.15.
[�]
atm a Pa
atmb am3
kgb
a J
kmol � Kb a kmol
kgb K
�
c 1 N/m2
Pad
c 1 N � m
Jd
� 1.
Z �Pv
RT�
20(101,325) 0.025001
a 8314.47
44.011b 300
� 0.8939
vv (m3/kg) Z � Pvv�RT
P(atm) N2 CO2 H2O N2 CO2 H2O
1 0.8786 0.5566 2.7273 0.9998 0.9951 0.998010 0.8773 0.5309 0.2676 0.9983 0.9491 0.979220 0.4381 0.0250 0.1308 0.9972 0.8939 0.957230 0.0292 0.0155 0.0851 0.9965 0.8330 0.934140 — 0.0107 0.0621 — 0.7642 0.9097
Comments From the table and from Fig. 2.15, we see that N2 behavesessentially as an ideal gas over the entire range of pressures from 1 atm tothe critical pressure (Pc � 33.46 atm). Z values deviate less than 0.4%from the ideal-gas value of unity. Both CO2 and water vapor, in contrast,exhibit significant departures from ideal-gas behavior, which becomelarger as the pressure increases. These large departures indicate the needfor caution in applying the ideal-gas equation of state, Pv � RT.
Self Test2.15 ✓ Using the ideal-gas equation of state, calculate the specific volume for H2O at 40 atm
and 600 K. Compare your answer with the value from the table in Example 2.15 anddetermine the calculation error.
(Answer: 0.0683 m3/kg, 10%)
0521850436c02_p046-100.qxd 13/9/05 7:50 PM Page 93 Quark01A Quark01:BOOKS:CU/CB Jobs:CB925-Turns:Chapters:Chapter-02:
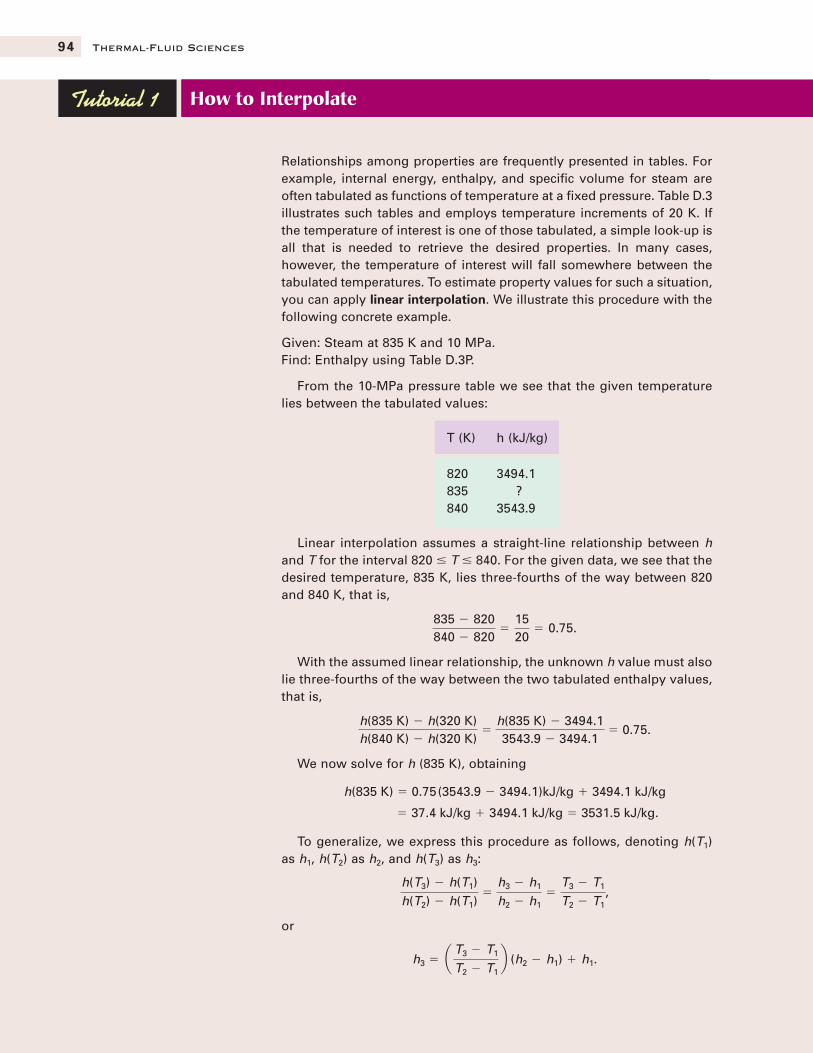
94 Thermal-Fluid Sciences
Relationships among properties are frequently presented in tables. Forexample, internal energy, enthalpy, and specific volume for steam areoften tabulated as functions of temperature at a fixed pressure. Table D.3illustrates such tables and employs temperature increments of 20 K. Ifthe temperature of interest is one of those tabulated, a simple look-up isall that is needed to retrieve the desired properties. In many cases,however, the temperature of interest will fall somewhere between thetabulated temperatures. To estimate property values for such a situation,you can apply linear interpolation. We illustrate this procedure with thefollowing concrete example.
Given: Steam at 835 K and 10 MPa.Find: Enthalpy using Table D.3P.
From the 10-MPa pressure table we see that the given temperaturelies between the tabulated values:
T (K) h (kJ/kg)
820 3494.1835 ?840 3543.9
Linear interpolation assumes a straight-line relationship between hand T for the interval 820 � T � 840. For the given data, we see that thedesired temperature, 835 K, lies three-fourths of the way between 820and 840 K, that is,
With the assumed linear relationship, the unknown h value must alsolie three-fourths of the way between the two tabulated enthalpy values,that is,
We now solve for h (835 K), obtaining
To generalize, we express this procedure as follows, denoting h(T1)as h1, h(T2) as h2, and h(T3) as h3:
or
h3 � a T3 � T1
T2 � T1b (h2 � h1) � h1.
h(T3) � h(T1)h(T2) � h(T1)
�h3 � h1
h2 � h1�
T3 � T1
T2 � T1,
� 37.4 kJ/kg � 3494.1 kJ/kg � 3531.5 kJ/kg.
h(835 K) � 0.75 (3543.9 � 3494.1)kJ/kg � 3494.1 kJ/kg
h(835 K) � h(320 K)h(840 K) � h(320 K)
�h(835 K) � 3494.13543.9 � 3494.1
� 0.75.
835 � 820840 � 820
�1520
� 0.75.
How to InterpolateTutorial 1
0521850436c02_p046-100.qxd 13/9/05 7:50 PM Page 94 Quark01A Quark01:BOOKS:CU/CB Jobs:CB925-Turns:Chapters:Chapter-02:

CH. 2 Thermodynamic Properties, Property Relationships and Processes 95
For any property pair Y (X), this can be expressed
or
Rather than remembering or referring to any equations, knowing thephysical interpretation of linear interpolation allows you to create theneeded relationships. The following sketch provides a graphic aid forthis procedure:
Although the use of computer-based property data may minimize theneed to interpolate, some data may only be available in tabular form.Moreover, the ability to interpolate is a generally useful skill and shouldbe mastered.
CA
XX1 X3 X2
Y2
Y3
Y1
Y
AB
CD
=
D
B
Y3 � a X3 � X1
X2 � X1b (Y2 � Y1) � Y1.
Y(X3) � Y(X1)Y(X2) � Y(X1)
�Y3 � Y1
Y2 � Y1�
X3 � X1
X2 � X1,
0521850436c02_p046-100.qxd 13/9/05 7:50 PM Page 95 Quark01A Quark01:BOOKS:CU/CB Jobs:CB925-Turns:Chapters:Chapter-02:

96 Thermal-Fluid Sciences
Other Equations of StateThe kinetic theory model of a gas that leads to the ideal-gas equation of stateis based on two assumptions that break down when the density of the gas issufficiently high. The first of these is that the molecules themselves occupy anegligible volume compared to the volume of gas under consideration. Clearlyas a gas is compressed, the average spacing between molecules becomes lessand the fraction of the macroscopic gas volume occupied by the microscopicmolecules increases. The van der Waals equation of state accounts for thefinite volume of the molecules by subtracting a molecular volume from themacroscopic volume; thus, the molar-specific volume in the state equationis replaced with � b, where b is a constant for a particular gas.
The second assumption that is violated at high densities is that the long-range forces between molecules are negligible. Figure 2.16 illustrates how theexistence of such forces can affect the equation of state. Since the pressure ofa gas is a manifestation of the momentum transferred to the wall by molecularcollisions, long-range attractive forces will “pull back” molecules as theyapproach the wall, thus decreasing the momentum exchange. This effect, inturn, results in a decrease in pressure. In the van der Waals equation of state,this effect of intermolecular attractive forces is accounted for by replacing thepressure P with where a is a constant, again dependent upon theparticular molecular species involved. The appearance of the reciprocal of is a consequence of the molecular collision frequency with the wall beingproportional to the density and the intermolecular attractive force alsobeing proportional to the molar gas density
With these two corrections to the ideal-gas model, we write the van derWaals equation of state as follows:
(2.45)
Values for the constants a and b for a number of gases are provided inAppendix E.
aP �a
v 2 b (v � b) � Ru T.
(1> v ).(1> v )
v2P � a>v
2,
v
v
Example 2.16
Use the van der Waals equation of state to evaluate for at 300 K and 30 atm. Compare this result with the value calculated usingthe NIST database in Example 2.15.
Solution
Known T, P
Find Z
Sketch See Fig. 2.15.
Assumptions
van der Waals gas
Analysis We use the van der Waals equation of state (Eq. 2.45) to find themolar-specific volume . This value of is then used to calculate Z. Wevv
CO2,
CO2Z (� P v>RuT)
FIGURE 2.16
Intermolecular attractive forces resultin a pressure less than would resultfrom an ideal gas in which there areno long-range intermolecular forces.
0521850436c02_p046-100.qxd 13/9/05 7:50 PM Page 96 Quark01A Quark01:BOOKS:CU/CB Jobs:CB925-Turns:Chapters:Chapter-02:

CH. 2 Thermodynamic Properties, Property Relationships and Processes 97
rearrange Eq. 2.45,
to the following cubic form:
Before solving for we calculate the coefficients using values for a and bfrom Table E.2:
The coefficients are thus
and
Substituting these coefficients into the cubic van der Waals equation of stateyields
Many methods exist to find the useful root of this polynomial. Usingspreadsheet software to implement the iterative Newton–Raphson methodwith an initial guess of results in thefollowing converged value for after four interations:
(30 atm, 300 K) � 0.7032
With this value of , we evaluate Z:
which is dimensionless. This value of Z is only 2.9% higher than the 0.8330 calculated from the
NIST database in Example 2.15.
� 0.8570,
Z �Pv
RuT�
30 (101,325) 0.7032
8314.47 (300)
v
m3>kmol.v
v
v � RuT>P (� 0.8206 m3>kmol)
v 3 � 0.863274 v 2 � 0.119845 v � 0.005117 � 0.
� 0.005117 (m3/kmol)3.
ab
P�
3.643 � 105 Pa � (m3/kmol)2 (0.0427) (m3�kmol)
30 (101,325) Pa
� 0.119845 (m3/kmol)2,
a
P�
3.643 � 105 Pa � (m3/kmol)2
30 (101,325) Pa
[�]
J
kmol � K K cN � m
1 Jd
atm cN/m2
atmd
� m3/kmol,
� 0.863274
a RuT
P� bb �
8314.47 (300)
30 (101,325)� 0.0427
b � 0.0427 m3/ kmol.
a � 3.643 � 105 Pa � (m3/ kmol)2,
v,
v 3 � a RuT
P� b b v
2 �a
P v �
ab
P� 0.
aP �a
v2 b (v � b) � Ru T,
0521850436c02_p046-100.qxd 13/9/05 7:50 PM Page 97 Quark01A Quark01:BOOKS:CU/CB Jobs:CB925-Turns:Chapters:Chapter-02:

98 Thermal-Fluid Sciences
Self Test2.16 ✓ Repeat Example 2.16 for at 40 atm and 600 K.
(Answer: )Z � 0.930H2O
Other equations of state have been developed that provide more accuracythan the van der Waals equation. Discussion of these is beyond the scope ofthis book. For more information, we refer the interested reader to Ref. [1].
Generalized CompressibilityAs we will see later, the isotherm in P–v space exhibits an inflectionpoint at the critical point. One can relate the constants a and b in the van derWaals equation of state to the properties at the critical state by recognizingthat both slope and curvature of the isotherm are zero; thus,
(2.46a)
(2.46b)
(2.46c)
That a and b depend only on the critical pressure and critical temperaturesuggests that a generalized state relationship exists when actual pressuresand temperatures are normalized by their respective critical values. Moreexplicitly, defining the reduced pressure and temperature as
(2.47a)
and
(2.47b)
respectively, we expect
(2.47c)
to be a single “universal” relationship. This idea is known as the principle ofcorresponding states, and Z is called the compressibility factor. Figure 2.17shows data and the best fit for this relationship, where Z is presented as afunction of using as a parameter. For the gases chosen, individual datapoints are quite close to the curve fits, illustrating the “universal” nature ofEq. 2.47c. Plots such as Fig. 2.17 are known as generalized compressibilitycharts. Figure 2.18 is a working generalized compressibility chart for reducedpressures up to 10 and reduced temperatures up to 15.
TRPR
Z � Z (PR, TR)
TR �T
Tc,
PR �P
Pc
Z �Pcvc
RTc�
3
8.
b �RTc
8Pc,
a �27
64 R2T
2c
Pc,
T � Tc
T � Tc
Comments For this particular example, note that the van der Waals modeldid an excellent job of predicting the specific volume for conditions far fromthe ideal-gas regime. Although the procedure used to calculate wasstraightforward, we still employed the power of a computer to solve the cubicvan der Waals equation of state.
v
0521850436c02_p046-100.qxd 13/9/05 7:50 PM Page 98 Quark01A Quark01:BOOKS:CU/CB Jobs:CB925-Turns:Chapters:Chapter-02:

CH. 2 Thermodynamic Properties, Property Relationships and Processes 99
1.1
1.0
0.9
0.8
0.7
0.6
0.5
0.4
0.3
0.2
0.10.50 1.0 1.5 2.0 2.5 3.0 3.5 4.0 4.5 5.0 5.5 6.0 6.5 7.0
Reduced pressure PR
Z =
Pv
RT
MethaneEthyleneEthanePropanen-Butane
n-HeptaneNitrogenCarbon dioxideWater
Isopentane
Legend:
Average curve based on data onhydrocarbons
TR = 1.00
TR = 1.10
TR = 1.20
TR = 1.30
TR = 1.50
TR = 2.00
FIGURE 2.17
The compressibility factor Z can be correlated using reduced properties (i.e., P�Pc and T�Tc). Note how the data forvarious substances collapse when plotted in this manner. Adapted from Ref. [12] with permission.
In reality, Eq. 2.47c is not truly universal but rather a useful approxi-mation. The best accuracy is obtained when gases are grouped according toshared characteristics. For example, a single plot constructed for polarcompounds, such as water and alcohols, provides a tighter “universal”relationship than is obtained when nonpolar compounds are also included.Generalized compressibility charts are useful for substances for which nodata are available other than critical properties.
We can also use the generalized compressibility chart to ascertainconditions where real gases deviate from ideal-gas behavior. Using Fig. 2.18as our guide, we observe the following:
● The largest departures from ideal-gas behavior occur at conditions nearthe critical point. At the critical point, the ideal-gas equation of state is notat all close to reality
● Accuracy to within 5% of ideal-gas behavior is foundfor the following conditions:● at all temperatures, provided ● when and both for
The following example illustrates the use of generalized compressibilitytheory.
PR 7.5.TR � 15,1.95 TR 2.4PR 0.1, and
(0.95 Z 1.05)(Z � 0.3).
Polar molecule (water) and nonpolar molecule(ethane).
0521850436c02_p046-100.qxd 13/9/05 7:50 PM Page 99 Quark01A Quark01:BOOKS:CU/CB Jobs:CB925-Turns:Chapters:Chapter-02:

1.0
00.
20
0.30
0.40
0.50
0.60
0.70
0.80
0.90
1.00
1.10
1.20
1.00
1.10
1.20
2.0
3.0
4.0
5.0
6.0
7.0
8.0
9.0
10.0
Red
uced
pre
ssur
e, P
R
Compressibility factor, Z = Pv/RT
TR =
3.5
0
2.00
1.80
1.50
1.40
1.30
1.20
0.30
0.35
0.40
0.45
0.45
0.70
5.00
7.00
10.0
0T
R =
15.
0
2.50
1.60
0.25
1.15
1.10
1.05
TR
= 1.
00
3.002.00 1.50 1.4
0 1.20 1.0
00.9
0 0.80
v′R =
0.2
0
FIG
UR
E 2
.18
Gen
eral
ized
com
pres
sibi
lity
char
t sho
win
g ex
tend
ed r
ange
of
redu
ced
tem
pera
ture
s (1
�T
R�
15).
The
pse
udo
redu
ced
spec
ific
vol
ume
vv� R
show
n on
the
char
t is
defi
ned
as vv
�(R
Tc�
Pc)
. Ada
pted
fro
m R
ef. [
13]
wit
h pe
rmis
sion
.
page 100
0521850436c02_p046-100.qxd 13/9/05 7:50 PM Page 100 Quark01A Quark01:BOOKS:CU/CB Jobs:CB925-Turns:Chapters:Chapter-02:
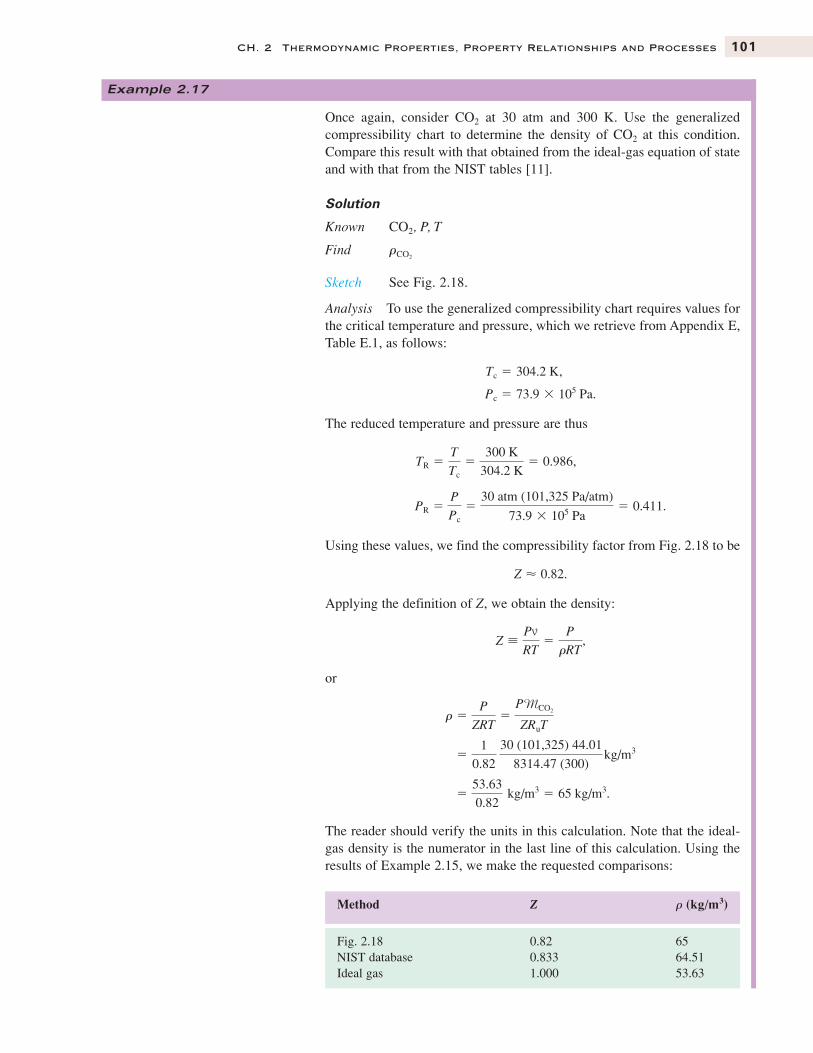
CH. 2 Thermodynamic Properties, Property Relationships and Processes 101
Example 2.17
Once again, consider at 30 atm and 300 K. Use the generalizedcompressibility chart to determine the density of at this condition.Compare this result with that obtained from the ideal-gas equation of stateand with that from the NIST tables [11].
Solution
Known , P, T
Find
Sketch See Fig. 2.18.
Analysis To use the generalized compressibility chart requires values forthe critical temperature and pressure, which we retrieve from Appendix E,Table E.1, as follows:
The reduced temperature and pressure are thus
Using these values, we find the compressibility factor from Fig. 2.18 to be
Applying the definition of Z, we obtain the density:
or
The reader should verify the units in this calculation. Note that the ideal-gas density is the numerator in the last line of this calculation. Using theresults of Example 2.15, we make the requested comparisons:
�53.63
0.82 kg/m3 � 65 kg/m3.
�1
0.82 30 (101,325) 44.01
8314.47 (300) kg/m3
r �P
ZRT�
PMCO2
ZRuT
Z �Pv
RT�
P
rRT,
Z � 0.82.
PR �P
Pc�
30 atm (101,325 Pa/atm)
73.9 � 105 Pa� 0.411.
TR �T
Tc�
300 K
304.2 K� 0.986,
Pc � 73.9 � 105 Pa.
Tc � 304.2 K,
rCO2
CO2
CO2
CO2
Method Z
Fig. 2.18 0.82 65NIST database 0.833 64.51Ideal gas 1.000 53.63
r (kg/m3)
0521850436c02_p101-149.qxd 13/9/05 7:51 PM Page 101 Quark01A Quark01:BOOKS:CU/CB Jobs:CB925-Turns:Chapters:Chapter-02:

102 Thermal-Fluid Sciences
Comments Even though reading Z from the chart is an approximateprocedure, excellent agreement is found between the density calculatedfrom the chart and that from the NIST database.
Self Test2.17 ✓ Repeat Example 2.17 for at 40 atm and 600 K.
(Answer: r � 15.41 kg>m3)Z � 0.95,H2O
2.5b Calorific RelationshipsUse the NIST database for values of h, u, and as functions of T and Pfor nonideal gases. For generalized corrections to ideal-gas properties, seeRefs. [20, 21].
2.5c Second-Law RelationshipsUse the NIST database for entropy values as functions of T and P for nonidealgases. For generalized corrections to ideal-gas properties, see Refs. [20, 21].
2.6 PURE SUBSTANCES INVOLVING LIQUIDAND VAPOR PHASES
In this section, we investigate the thermodynamic properties of simple,compressible substances that frequently exist in both liquid and vapor states.Because of its engineering importance, we focus on water. When discussingwater, we use the common designations, ice, water, and steam to refer to thesolid, liquid, and vapor states, respectively, and use the chemical designation
when we wish to be general and not designate any particular phase. Theterms vapor and gas are used interchangeably in this book.13
2.6a State (P–vv –T ) RelationshipsPhase BoundariesWe begin our discussion of multiphase properties by conducting a thoughtexperiment. Consider a kilogram of enclosed in a piston–cylinderarrangement as shown in the sketch in Fig. 2.19. The weight on the pistonfixes the pressure in the cylinder as we add energy to the system. At theinitial state, the is liquid, and remains liquid, as we add energy byheating from A to B. You might envision that a Bunsen burner is used as theenergy source, for example. The added energy results in an increase in thetemperature of the water, while the water expands slightly, causing a smallincrease in the specific volume. The temperature and the specific volumeincrease until state B is reached. At this point, further addition of energyresults in a portion of the water becoming vapor or steam, at a fixedtemperature. At 1 atm, this phase change occurs at 373.12 K At(99.97�C).14
H2O
H2O
H2O
cpcv,
13 Some textbooks distinguish a gas from a vapor using the critical pressure as a criterion. Inthis usage, gases exist above Pc, whereas vapors exist below Pc.
14 With the adoption of the International Temperature Scale of 1990 (ITS-90), the normalboiling point of water is not exactly 100�C, but rather 99.974�C.
0521850436c02_p101-149.qxd 13/9/05 7:51 PM Page 102 Quark01A Quark01:BOOKS:CU/CB Jobs:CB925-Turns:Chapters:Chapter-02:

CH. 2 Thermodynamic Properties, Property Relationships and Processes 103
0.00010
300
400
500
600
700
0.001 0.01 0.1 1 10 100 1000
A
B
C D E
F
Specific volume (m3/kg)
Tem
pera
ture
(K
)
A B C D E F
w w w
w
wwFIGURE 2.19
Heating water at constant pressurefollows the path A–B–C–D–E–F on atemperature–specific volumediagram. Note the huge increase involume in going from the liquid state(B) to the vapor state (E). Thevolumes shown in the piston–cylindersketches are not to scale.
state C, we see that most of the is still in the liquid phase. Withcontinued heating, more and more water is converted to steam. At state D,the transformation is nearly complete, and at state E, all of the liquid hasturned to vapor. Adding energy beyond this point results in an increase inboth the temperature and specific volume of the steam, creating what isknown as superheated steam. The point at F designates a superheated state.Assuming that the heating was conducted quasi-statically, the pathA–B–C–D–E–F is a collection of equilibrium states following an isobar (aline of constant pressure) in T–v space. We could repeat the experiment withlesser or greater weight on the piston (i.e., at lower or higher pressures), andmap out a phase diagram showing a line where vaporization just begins(states like B) and a line where vaporization is complete (states like E). Thebold line in Fig. 2.19 summarizes these thought experiments. Although weconsidered H2O, similar behavior is observed for many other fluids, forexample, the various fluids used as refrigerants.
Figure 2.20 presents a T–v diagram showing the designations of thevarious regions and lines associated with the liquid and vapor states of afluid. Although the numerical values shown apply to the general ideaspresented in this figure and discussed in the following apply to many liquid–vapor systems.
H2O,
H2O
0521850436c02_p101-149.qxd 13/9/05 7:51 PM Page 103 Quark01A Quark01:BOOKS:CU/CB Jobs:CB925-Turns:Chapters:Chapter-02:

104 Thermal-Fluid Sciences
Consider the region in T–v space that lies below the critical temperature butabove temperatures at which a solid phase forms. Here we have three distinctregions, corresponding to
● Compressed or subcooled liquid,● Liquid–vapor or saturation, and● Vapor or superheated vapor.
We also have two distinct lines, which join at the critical point:
● The saturated liquid line and● The saturated vapor line.
The saturated liquid line is the locus of states at which the addition ofenergy at constant pressure results in the formation of vapor (state B inFig. 2.19). The temperature and pressure associated with states on thesaturated liquid line are called the saturation temperature and saturationpressure, respectively. To the left of the saturated liquid line is thecompressed liquid region, which is also known as the subcooled liquidregion. These designations arise from the fact that at any given point in thisregion, the pressure is higher than the corresponding saturation pressure atthe same temperature (thus the designation compressed) and, similarly, anypoint is at a temperature lower than the corresponding saturationtemperature at the same pressure (thus the designation subcooled). Thesaturated liquid line terminates at the critical point with zero slope on bothT–v and P–v coordinates.
Immediately to the right of the saturated liquid line are states that consistof a mixture of liquid and vapor. Bounding this liquid–vapor or saturationregion on the right is the saturated vapor line. This line is the locus of statesthat consist of 100% vapor at the saturation pressure and temperature. Thesaturated vapor line joins the saturated liquid line at the critical point. Thisjunction, the critical point, defines a state in which liquid and vaporproperties are indistinguishable.
Figure 2.20 also shows the supercritical region. Within this region, thepressure and temperature exceed their respective critical values, and there isno distinction between a liquid and a gas.
800
700
600
500
400
300
00.00001 0.0001 0.001 0.01 0.1 1 10 100 1000
Specific volume (m3/kg)
Tem
pera
ture
(K
)
Vapor or superheated vaporSaturated vaporLiquid–vapor
Supercritical
Compressed or
subcooled liquid
Sat
urat
edliq
uid
Critical point
T = Tc
P =
Pc
FIGURE 2.20
On T-vv coordinates, the compressedliquid region lies to the left of thesaturated liquid line, the liquid–vaporregion lies between the saturated liquidand saturated vapor lines, and thevapor or superheat region lies to theright of the saturated vapor line.
0521850436c02_p101-149.qxd 13/9/05 7:51 PM Page 104 Quark01A Quark01:BOOKS:CU/CB Jobs:CB925-Turns:Chapters:Chapter-02:

CH. 2 Thermodynamic Properties, Property Relationships and Processes 105
To the right of the saturated vapor line lies the vapor or superheated vaporregion. The use of the word superheated refers to the idea that within thisregion the temperature at a particular pressure is greater than the correspondingsaturation temperature.
The liquid–vapor or saturation region is frequently referred to as the vapordome because of its shape on a T–log v plot. When dealing with water, theterm steam dome is sometimes applied. Because two phases coexist in thesaturation region, defining a thermodynamic state here is a bit more complexthan in the single-phase regions. We examine this issue in the next section.
The three-dimensional P–v –T surface (Fig. 2.21) provides the most generalview of a simple substance that exhibits multiple phases. From Fig. 2.21, wesee that the T–v, P–v, and P–T plots are simply projections of the three-dimensional surface onto these respective planes.
A New Property—QualityIn our discussion of gases, whether ideal or real, we saw that simultaneouslyspecifying the temperature and pressure defined the thermodynamic state. Aknowledge of P and T was sufficient to define all other properties. In theliquid–vapor region, however, this situation no longer holds, although we stillrequire two independent properties to define the thermodynamic state. In
Critical point
VaporV
apor Liquid
Liq
uid
SolidSolid
P
P
T
v
v
P
v
T
T
Triple-point line
FIGURE 2.21
A P–vv–T surface for a substance thatcontracts upon freezing. After Ref.[22].
0521850436c02_p101-149.qxd 13/9/05 7:51 PM Page 105 Quark01A Quark01:BOOKS:CU/CB Jobs:CB925-Turns:Chapters:Chapter-02:

106 Thermal-Fluid Sciences
Mmix = Mvap + Mliq
Mvap
Mliq
FIGURE 2.22
The property quality x defines thefraction of a liquid–vapor mixture thatis vapor.
15 The subscripts f and g are actually from the German words Flussigkeit (liquid) and Gaszustand(gaseous state), respectively.
Fig. 2.19, we see that the temperature and pressure are both fixed for all stateslying between point B and point E; thus, in the two-phase region, thetemperature and pressure are not independent properties. If one is known, theother is a given. To define the state within the liquid–vapor mixture regionthus requires another property in addition to P or T. For example, we see fromFig. 2.19 that specifying the specific volume together with the temperaturecan define all states along B–E.
To assist in defining states in the saturation region, a property calledquality is used. Formally, quality (x) is defined as the mass fraction of themixture existing in the vapor state (see Fig. 2.22); that is,
(2.48a)
Conventional notation uses the subscript g to refer to the vapor (gas) phaseand the subscript f to refer to the liquid phase.15 Using this notation, thequality is defined as
(2.48b)
The quality for states lying on the saturated liquid line is zero, whereas forstates lying on the saturated vapor line, the quality is unity, or 100% whenexpressed as a percentage. Since the actual mass in each phase is not usuallyknown, the quality is usually derived, or related to, other intensive properties.For example, we can relate the quality to the specific volume as follows:
(2.49a)
or
(2.49b)
That this is true is easily seen by expressing the intensive properties, v and x,in terms of their defining extensive properties, V and M, that is,
The relationship expressed by Eq. 2.49a can be generalized in that any mass-specific property (e.g., u, h, and s) can be used in place of the specific volume,so that
(2.49c)
or
(2.49d)x �� � �f
�g � �f,
� � (1 � x) �f � x �g,
�Vmixture
Mmixture.
�Vf
Mf � Mg�
Vg
Mf � Mg�
Vf � Vg
Mf � Mg
v �Mf
Mf � Mg
Vf
Mf�
Mg
Mf � Mg
Vg
Mg
x �v � v f
vg � v f.
v � (1 � x)vf � x vg,
x �Mg
Mg � Mf.
x �Mvapor
Mmix.
0521850436c02_p101-149.qxd 13/9/05 7:51 PM Page 106 Quark01A Quark01:BOOKS:CU/CB Jobs:CB925-Turns:Chapters:Chapter-02:

CH. 2 Thermodynamic Properties, Property Relationships and Processes 107
where represents any mass-specific property. A physical interpretation of Eq.2.49d is easy to visualize by referring to Fig. 2.19. Here we interpret the qualityat state C as the length of the line B–C divided by the length of the line B–E,where a linear rather than logarithmic scale is used for v. This same interpretationapplies to any mass-specific property plotted in a similar manner.
Commonly employed rearrangements of Eqs. 2.49a and 2.49b are
(2.50a)
and
(2.50b)
Defining v fg and bfg,
(2.50c)
and
(2.50d)
we rewrite Eqs. 2.50a and 2.50b more compactly as
(2.50e)
and
b � bf � xbfg. (2.50f)
Equations 2.50e and 2.50f are useful when using tables that provide values forand similar properties �fg.vfg
v � vf � x vfg
�fg � �g � �f,
v fg � vg � v f
� � �f � x (�g � �f).
v � vf � x (vg � v f)
�
�
Example 2.18
A rigid tank contains 3 kg of (liquid and vapor) at a quality of 0.6.The specific volume of the liquid is and the specificvolume of the vapor is Determine the mass of the vapor, themass of the liquid, and the specific volume of the mixture.
Solution
Known x,
Find
Sketch See Fig. 2.22.
Assumptions
Equilibrium prevails.
Analysis We apply the definition of quality (Eq. 2.48b) to find the massof in each phase:
and
� 3 kg � 1.8 kg � 1.2 kg.
Mf � Mmix � Mg
� 0.6(3 kg) � 1.8 kg
Mg � x (Mg � Mf) � xMmix
H2O
Mg, Mf, vmix
vf, vgMmix,
1.859 m3/kg.0.001041 m3/kg
H2O
0521850436c02_p101-149.qxd 13/9/05 7:51 PM Page 107 Quark01A Quark01:BOOKS:CU/CB Jobs:CB925-Turns:Chapters:Chapter-02:

108 Thermal-Fluid Sciences
Using the given quality and given values for the specific volumes of thesaturated liquid and saturated vapor, we calculate the mixture specificvolume (Eq. 2.49a):
Comments This example is a straightforward application of definitions.Knowledge of definitions can be quite important in the solution of complexproblems.
� 1.1158 m3/kg.
� (1 � 0.6) 0.001041 m3/kg � 0.6 (1.859 m3/kg)
vmix � (1 � x) vf � x vg
Self Test2.18 ✓ Repeat Example 2.18 with x � 0.8 and find the volume of the tank.
(Answer: Mg � 2.4 kg, Mf � 0.6 kg, vmix � 1.4874 m3/kg, V � 4.46 m3)
Property Tables and DatabasesTabulated properties are available for H2O and many other fluids of engineeringinterest (see Table 2.7). Typically, data are presented in four forms:
● Saturation properties for convenient temperature increments,● Saturation properties for convenient pressure increments,● Superheated vapor properties at various fixed pressures with convenient
temperature increments, and● Compressed (subcooled) liquid properties at various fixed pressures with
convenient temperature increments.
Tables in Appendix D provide data in these forms for H2O.Computerized and online databases are making the use of printed tables
obsolete. Using such databases also eliminates the need to interpolate, whichcan be tedious. Throughout this book, we illustrate the use of both tabulateddata (Appendix D) and the NIST databases [9, 10]. You should developproficiency with both sources of properties.
Figures 2.23–2.26 illustrate the use of the NIST online database. Figure2.23 shows one of the input menus for creating your own tables and graphs.After selecting the fluid of interest and choosing the units desired (notshown), one has the choice of accessing saturation data in temperature orpressure increments (Figs. 2.24 and 2.25, respectively) or accessing data asan isotherm or as an isobar (Fig. 26). Figure 2.24 presents saturation data fortemperatures from 300 to 310 K in increments of 10 K; Fig. 2.25 showssimilar data but for a range of saturation pressures from 0.1 to 0.2 MPa inincrements of 0.1 MPa. Figure 2.26 presents data for the 10-MPa isobar fora 800–900 K temperature range in 100-K increments. Note that the data inFig. 2.26 all lie within the superheated vapor region as indicated in the finalcolumn of the table. Tables generated from the database can also bedownloaded. Figures 2.27–2.30, for example, were generated using NISTdata with spreadsheet software.
The NIST12 v. 5.2 software packaged with this book provides expandedcapability to that available online. Tutorials 2 and 3 describe the use of thispowerful software.
0521850436c02_p101-149.qxd 13/9/05 7:51 PM Page 108 Quark01A Quark01:BOOKS:CU/CB Jobs:CB925-Turns:Chapters:Chapter-02:

Saturation Properties for Water -- Temperature Increments
Address Go
Standard Reference Data Program
Data Gateway
Online Databases
Chemistry WebBook
Liquid Phase DataVapor Phase DataAuxiliary DataReferencesAdditional Information
View data with display applet. (requires Java capable browser).
NotesOther Data Available:
Liquid Phase Data
Download data as a tab-delimited text file.Main NIST Chemistry WebBook page for this species.Recommended citation for data from this page.Fluid data for other species.
Data on Saturation Curve
Vapor Phase DataData on Saturation Curve
Temperature (K)
Pressure (MPa)
Density (kg/m3)
Volume (m3/kg)
Internal Energy (kJ/kg)
Enthalpy (kJ/kg)
Entropy (J/g*K)
Cv (J/g*K)
Cp (J/g*K)
Sound Spd. (m/s)
Joule-Thomson (K/MPa)
Viscosity (uPa*s)
Therm. Cond. (W/m*K)
Surf. Tension (N/m)
Phase
300.00
310.00
0.0035368
0.0062311
996.51
993.34
0.0010035
0.0010067
112.56
154.36
112.56
154.37
0.39309
0.53015
4.1305
4.0879
4.1809
4.1795
1501.4
1523.2
-0.22024
-0.21393
853.84
693.54
0.61028
0.62605
0.071686
0.070106
liquid
liquid
Temperature (K)
Pressure (MPa)
Density (kg/m3)
Volume (m3/kg)
Internal Energy (kJ/kg)
Enthalpy (kJ/kg)
Entropy (J/g*K)
Cv (J/g*K)
Cp (J/g*K)
Sound Spd. (m/s)
Joule-Thomson (K/MPa)
Viscosity (uPa*s)
Therm. Cond. (W/m*K)
Phase
300.00
310.00
0.0035368
0.0062311
0.025590
0.043663
39.078
22.903
2411.6
2425.2
2549.9
2567.9
8.5174
8.3156
1.4422
1.4520
1.9141
1.9270
427.89
434.63
264.35
203.74
9.9195
10.213
0.018673
0.019369
vapor
vapor
http://webbook.nist.gov/cgi/fluid.cgi?Action=Load&ID=C7732185&Type=SatP&THigh=310&TLOw=300&TInc=10&RefState=DEF&TUnit=K&PUnit=MPa&[
File Edit View Favorites Tools Help
Internet
EN
Done
Saturation Properties for Water - Microsoft Internet Explorer
D:\Yongzhe\I... Saturation Pr... AllPosters.co... Internet Spee... ?start 3:17 PM
Back Search Favorites Media W
FIGURE 2.24
Saturation properties for water from NIST online database: 300–310 K in 10-K increments. FromRef. [11].
FIGURE 2.23
Graphical user interface for the NIST online thermophysical property database. See Table 2.7 for fluidsfor which properties are provided. From Ref. [11].
This option will supply data on the saturation curve over the specified temperature range. The range should not extend extend outside the minimum and maximum values given. Calculations are limited to a maximum of 201 data points; increments resulting in a larger number of points will be adjusted upward to limit the number of points computed.
Enter temperature range and increment in selected units:
Check here if you want to use the display applet (requires Java capable browser)
(min value: 273.16 K)
(max value: 647.096 K)
TLow
THigh
TIncrement
Press for Data
© 1991, 1994, 1996, 1997, 1998, 1999, 2000, 2001, 2003 copyright by the U.S. Secretary of Commerce on behalf of the United States of America. All rights reserved.
If you have comments or questions about this site, please contact us.
Standard Reference Data Program
Data Gateway
Online Databases
Chemistry WebBook
300
310
10
File Edit View Favorites Tools Help
Saturation Properties for Water -- Temperature Increments
http://webbook.nist.gov/cgi/fluid.cgi?ID=C7732185&TUnit=K&PUnit=MPa&DUnit=Kg%2Fm3&HUnit=KJ%FKg&WUnit=m%2Fs&VisUnit=uPa*s&STUnit=Address
Internet
EN 3:26 PM
Done
Saturation Properties for Water - Microsoft Internet Explorer
Go
1.
2.
3.
D:\Yongzhe\I... Saturation Pr... AllPosters.co... Turns Stuff.d...Internet Spee... ?start
Back Search Favorites Media W
0521850436c02_p101-149.qxd 13/9/05 7:51 PM Page 109 Quark01A Quark01:BOOKS:CU/CB Jobs:CB925-Turns:Chapters:Chapter-02:

File Edit View Favorites Tools Help
Internet
EN
Done
Saturation Properties for Water - Microsoft Internet Explorer
D:\Yongzhe\I... Saturation Pr... AllPosters.co... Turns Stuff.d...Internet Spee... ?start
Saturation Properties for Water -- Pressure Increments
Address
3:23 PM
Go
Standard Reference Data Program
Data Gateway
Online Databases
Chemistry WebBook
Liquid Phase DataVapor Phase DataAuxiliary DataReferencesAdditional Information
View data with display applet. (requires Java capable browser).
NotesOther Data Available:
Liquid Phase Data
Download data as a tab-delimited text file.Main NIST Chemistry WebBook page for this species.Recommended citation for data from this page.Fluid data for other species.
Data on Saturation Curve
Vapor Phase DataData on Saturation Curve
Temperature (K)
Pressure (MPa)
Density (kg/m3)
Volume (m3/kg)
Internal Energy (kJ/kg)
Enthalpy (kJ/kg)
Entropy (Jg/*K)
Cv (Jg/*K)
Cp (Jg/*K)
Sound Spd. (m/s)
Joule-Thomson (K/MPa)
Viscosity (uPa*s)
Therm. Cond. (W/m*K)
Surf. Tension (N/m)
Phase
372.76
393.36
0.100000
0.20000
958.63
942.94
0.0010432
0.0010605
417.40
504.49
417.50
504.70
1.3028
1.5302
3.7702
3.6652
4.2152
4.2439
1543.5
1519.6
-0.17843
-0.16547
282.91
231.62
0.67897
0.68321
0.058988
0.054926
liquid
liquid
Temperature (K)
Pressure (MPa)
Density (kg/m3)
Volume (m3/kg)
Internal Energy (kJ/kg)
Enthalpy (kJ/kg)
Entropy (J/g*K)
Cv (J/g*K)
Cp (J/g*K)
Sound Spd. (m/s)
Joule-Thomson (K/MPa)
Viscosity (uPa*s)
Therm. Cond. (W/m*K)
Phase
372.76
393.36
0.10000
0.20000
0.59034
1.1291
1.6939
0.88568
2505.6
2529.1
2674.9
2706.2
7.3588
7.1269
1.5548
1.6184
2.0784
2.1782
471.99
481.83
67.083
52.775
12.256
12.963
0.025053
0.027493
vapor
vapor
http://webbook.nist.gov/cgi/fluid.cgi?Action=Load&ID=C7732185&Type=SatT&PLow=.1&PHigh=.2&PInc=.1&RefState=DEF&TUnit=K&PUnit=MPa&DUnit
Back Search Favorites Media W
FIGURE 2.25
Saturation properties for water from NIST online database: 0.1–0.2 MPa in 0.1-MPa increments.From Ref. [11].
File Edit View Favorites Tools Help
Internet
EN
Done
Isobaric Properties for Water - Microsoft Internet Explorer
D:\Yongzhe\I... Isobaric Prop... AllPosters.co... Turns Stuff.d...Internet Spee... ?start
Isobaric Properties for Water
Address
3:25 PM
Go
Standard Reference Data Program
Data Gateway
Online Databases
Chemistry WebBook
Fluid DataAuxiliary DataReferencesAdditional Information
View data with display applet. (requires Java capable browser).
NotesOther Data Available:
Fluid Data
Download data as a tab-delimited text file.Main NIST Chemistry WebBook page for this species.Recommended citation for data from this page.Fluid data for other species.
Isobaric Data for P = 10.000 MPa
Auxiliary Data
Reference States
Temperature (K)
Pressure (MPa)
Density (kg/m3)
Volume (m3/kg)
Internal Energy (kJ/kg)
Enthalpy (kJ/kg)
Entropy (J/g*K)
Cv (J/g*K)
Cp (J/g*K)
Sound Spd. (m/s)
Joule-Thomson (K/MPa)
Viscosity (uPa*s)
Therm. Cond. (W/m*K)
Phase
800.00
820.00
840.00
860.00
880.00
900.00
10.000
10.000
10.000
10.000
10.000
10.000
29.107
28.185
27.335
26.546
25.810
25.123
0.034356
0.035479
0.036584
0.037671
0.038744
0.039804
3100.2
3139.3
3178.1
3216.7
3255.1
3293.5
3443.7
3494.1
3543.9
3593.4
3642.6
3691.6
6.6867
6.7489
6.8089
6.8671
6.9237
6.9787
1.8367
1.8336
1.8332
1.8351
1.8387
1.8439
2.5313
2.5032
2.4818
2.4658
2.4540
2.4458
662.61
672.98
682.95
692.59
701.92
710.98
4.3529
4.0620
3.7968
3.5546
3.3327
3.1289
30.054
30.895
31.728
32.552
33.368
34.176
0.078476
0.080741
0.083093
0.085515
0.087993
0.090516
vapor
vapor
vapor
vapor
vapor
vapor
http://webbook.nist.gov/cgi/fluid.cgi?Action=Load&ID=C7732185&Type=IsoBar&P=10&THigh=900&TLow=800&TInc=20&RefState=DEF&TUnit=K&PUn
Internal energy U = 0 at 273.16 K for saturated liquid.
Back Search Favorites Media W
FIGURE 2.26
Properties of water for the 10-MPa isobar from NIST online database: 800–900 K in 20-Kincrements. From Ref. [11].
0521850436c02_p101-149.qxd 13/9/05 7:51 PM Page 110 Quark01A Quark01:BOOKS:CU/CB Jobs:CB925-Turns:Chapters:Chapter-02:

How to Use the NIST SoftwareTutorial 2
CH. 2 Thermodynamic Properties, Property Relationships and Processes 111
Packaged with this book is a CD containing the software packageNIST12 Version 5.2. This software, an invaluable resource for thermo-dynamic and transport properties of many pure substances and air, isvery easy to use: You can learn to use it in only a few minutes and canbe an expert in less than an hour. The purpose of this tutorial is toacquaint you with the basic capabilities of this powerful package and toencourage you to become an expert user.
What fluids are contained in the NIST database?
From the “Substance” menu a selection of seventeen pure fluids isavailable. A listing is shown in the figure. Air is also available as apseudo-pure fluid from the substance menu.
What properties are available?
All of the properties used in this book and many others are provided.“Properties” can be selected from the “Options” menu as illustrated here.
(Continued on next page)
0521850436c02_p101-149.qxd 13/9/05 7:51 PM Page 111 Quark01A Quark01:BOOKS:CU/CB Jobs:CB925-Turns:Chapters:Chapter-02:

112 Thermal-Fluid Sciences
What units can be used?
From the “Options” menu, the user can select SI, U.S. customary, andother units using pull-down selections. Mixed units can be used ifdesired and either mass- or molar-specific quantities can be selected.
Can tables be generated?
Under the “Calculate” menu, the user has the option to generate twotypes of tables: saturation tables and isoproperty tables. The creation ofan isoproperty (P fixed) table is illustrated here.
How to Use the NIST Software (continued)Tutorial 2
0521850436c02_p101-149.qxd 13/9/05 7:51 PM Page 112 Quark01A Quark01:BOOKS:CU/CB Jobs:CB925-Turns:Chapters:Chapter-02:

CH. 2 Thermodynamic Properties, Property Relationships and Processes 113
What if I want properties at a single state point?
From the “Calculate” menu the user can select “Specified State Points”or “Saturation Points.”
What plots can be generated with the software?
All of the standard thermodynamic coordinates (P–v, T–s, h–s, etc.) andothers are available from the “Plot” menu. Plots with iso-lines, asshown in the figure, are easy to create. The option “Other Diagrams”allows the user to select any pair of thermodynamic coordinates. TheT–v diagram here illustrates this option.
(Continued on next page)
0521850436c02_p101-149.qxd 13/9/05 7:51 PM Page 113 Quark01A Quark01:BOOKS:CU/CB Jobs:CB925-Turns:Chapters:Chapter-02:

How to Use the NIST Software (continued)Tutorial 2
114 Thermal-Fluid Sciences
Is the NIST software compatible with other
common software?
Tables generated using NIST12 Version 5.2 can be easily pasted intospreadsheets. Similarly, plots can be pasted into word-processingdocuments.
The reader is encouraged to use this software to solve the homeworkproblems provided in this book.
0521850436c02_p101-149.qxd 13/9/05 7:51 PM Page 114 Quark01A Quark01:BOOKS:CU/CB Jobs:CB925-Turns:Chapters:Chapter-02:
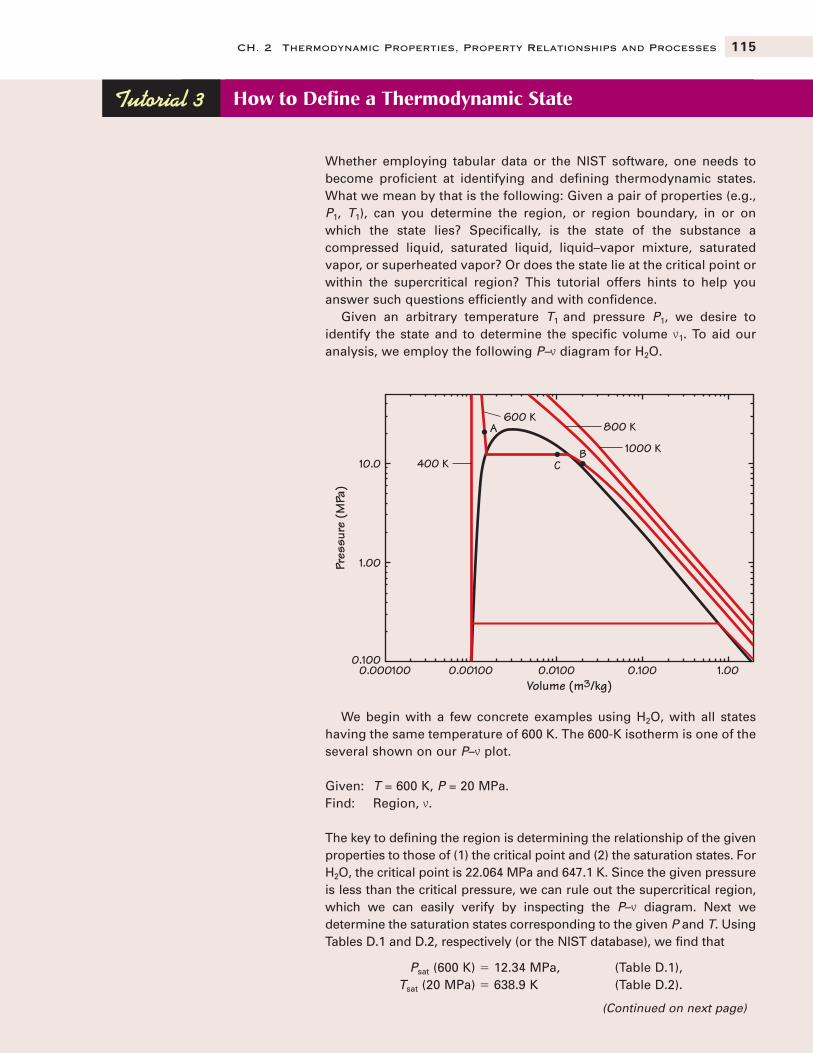
CH. 2 Thermodynamic Properties, Property Relationships and Processes 115
Whether employing tabular data or the NIST software, one needs tobecome proficient at identifying and defining thermodynamic states.What we mean by that is the following: Given a pair of properties (e.g.,P1, T1), can you determine the region, or region boundary, in or onwhich the state lies? Specifically, is the state of the substance acompressed liquid, saturated liquid, liquid–vapor mixture, saturatedvapor, or superheated vapor? Or does the state lie at the critical point orwithin the supercritical region? This tutorial offers hints to help youanswer such questions efficiently and with confidence.
Given an arbitrary temperature T1 and pressure P1, we desire toidentify the state and to determine the specific volume v1. To aid ouranalysis, we employ the following P–v diagram for H2O.
CB
A 800 K
1000 K
600 K
400 K
0.0001000.100
1.00
10.0
0.00100 0.0100 0.100 1.00Volume (m3/kg)
Pres
sure
(MPa
)
We begin with a few concrete examples using H2O, with all stateshaving the same temperature of 600 K. The 600-K isotherm is one of theseveral shown on our P–v plot.
Given: T = 600 K, P = 20 MPa.Find: Region, v.
The key to defining the region is determining the relationship of the givenproperties to those of (1) the critical point and (2) the saturation states. ForH2O, the critical point is 22.064 MPa and 647.1 K. Since the given pressureis less than the critical pressure, we can rule out the supercritical region,which we can easily verify by inspecting the P–v diagram. Next wedetermine the saturation states corresponding to the given P and T. UsingTables D.1 and D.2, respectively (or the NIST database), we find that
Psat (600 K) � 12.34 MPa, (Table D.1),Tsat (20 MPa) � 638.9 K (Table D.2).
How to Define a Thermodynamic StateTutorial 3
(Continued on next page)
0521850436c02_p101-149.qxd 13/9/05 7:51 PM Page 115 Quark01A Quark01:BOOKS:CU/CB Jobs:CB925-Turns:Chapters:Chapter-02:

How to Define a Thermodynamic State (continued)Tutorial 3
116 Thermal-Fluid Sciences
From these values, we see that the given temperature, 600 K, is lessthan the saturation value, 638.9 K [i.e., T (20 MPa) � Tsat (20 MPa)]. Thestate thus lies in the subcooled region. Alternatively, we see that thegiven pressure, 20 MPa, is greater than the saturation value, 12.34 MPa[i.e., P (600 K) � Psat (600 K)]; the state thus lies in the compressed-liquid region. The compressed-liquid and subcooled-liquid regions aresynonymous. Point A on the P–v plot denotes this state. Now knowingthe region, we turn to the compressed-liquid table, Table D.4D, to findthe specific volume. No interpolation is needed and we read the valuedirectly:
v (20 MPa, 600 K) = 0.001481 m3/kg.
A simpler, but less instructive, procedure is to use the NIST software. Byselecting “Specified State Points” from the “Calculate” menu, weobtain the density [� 675.11 kg/m3 � 1�v � 1�(0.001481 m3/kg)].
Note that finding the region in which the state lies must be a separatestep because the “Specified State Point” calculation does not identifythe state location. Being able to locate a state relative to the liquid,liquid–vapor mixture, and vapor boundaries is an essential skill.
Given: T = 600 K, P = 10 MPa.Find: Region, v.
Again, we use Tables D.1 and D.2 to find the corresponding saturationvalues:
Psat (600 K) � 12.34 MPa (Table D.1),Tsat (10 MPa) � 584.15 K (Table D.2).
0521850436c02_p101-149.qxd 13/9/05 7:51 PM Page 116 Quark01A Quark01:BOOKS:CU/CB Jobs:CB925-Turns:Chapters:Chapter-02:

CH. 2 Thermodynamic Properties, Property Relationships and Processes 117
Because T (10 MPa) > Tsat (10 MPa) (i.e., 600 K � 584.15 K), the state liesin the superheated vapor region. We come to the same conclusion byrecognizing that P (600 K) � Psat (600 K). Point B on the P–v plot denotesthis state. To find the specific volume, we employ the superheatedvapor table for 10 MPa, Table D.3P, which directly yields
v (10 MPa, 600 K) � 0.020091 m3/kg.
The given values were deliberately selected to avoid any interpolation.Finding properties in the superheat region may be complicated by theneed to interpolate both temperature and pressure. In such cases, useof the NIST software is recommended to avoid this tedious process.
Given: T � 600, v � 0.01 m3/kg.Find: Region, P.
Since the specific volume is given, we determine the relationship of thisvalue to those of the saturated liquid and saturated vapor at the sametemperature to define the region. From Table D.1, we obtain
vsat liq (600 K) � 0.0015399 m3/kg,vsat vapor (600 K) � 0.014984 m3/kg.
Because the given specific volume falls between these two values, thestate must lie in the liquid–vapor mixture region. The pressure must thenbe the saturation value, Psat (600 K) � 12.34 MPa. If the given specificvolume were less than vsat liq, we would have to conclude that the statelies in the compressed-liquid region. Similarly, if the given specificvolume were greater than vsat vapor, the state would then lie in thesuperheated-vapor region. Point C denotes this state on the P–v diagram.
Although we determined the regions in which various states lie usingT, P, and v, other properties can be employed as well. The key, regardlessof the particular properties given, is to find their relationships to thecorresponding saturation state boundaries (i.e., the “steam dome”).
0521850436c02_p101-149.qxd 13/9/05 7:51 PM Page 117 Quark01A Quark01:BOOKS:CU/CB Jobs:CB925-Turns:Chapters:Chapter-02:

118 Thermal-Fluid Sciences
Example 2.19 Steam Power Plant Application
A turbine expands steam to a pressure of 0.01 MPa and a quality of 0.92.Determine the temperature and the specific volume at this state.
Solution
Known P, x
Find T, v
Sketch
Analysis The given state lies in the liquid–vapor region on the 0.01-MPaisobar as shown in the sketch. Knowing this, we use Table D.2, SaturationProperties of Water and Steam—Pressure Increments, to obtain thefollowing data:
Using the given quality and these values for the specific volumes of thesaturated liquid and saturated vapor, we calculate the specific volume fromEq. 2.49a as follows:
Comments The keys to this problem are, first, recognizing the region inwhich the given state lies, and, second, choosing the correct table toevaluate properties. The reader should verify the values obtained fromTable D.2 for this example and also verify that the values agree with theNIST online database and NIST12 v. 5.2 software.
� 13.496 m3/kg.
� (1 � 0.92) 0.0010103 m3/kg � 0.92 (14.670 m3/kg)
v � (1 � x) vf � x vg
vg � 14.670 m3/kg.
vf � 0.0010103 m3/kg,
T � Tsat (P � Psat � 0.01 MPa) � 318.96 K,
Psat = 0.01 MPa
x = 0.92
Tsat
T
s
Self Test2.19 ✓ Calculate the values of the specific internal energy u and the specific enthalpy h for the
conditions given in Example 2.19.(Answer: u � 2257.57 kJ/kg, h � 2392.53 kJ/kg)
0521850436c02_p101-149.qxd 13/9/05 7:51 PM Page 118 Quark01A Quark01:BOOKS:CU/CB Jobs:CB925-Turns:Chapters:Chapter-02:

CH. 2 Thermodynamic Properties, Property Relationships and Processes 119
T–vv DiagramsFigure 2.27 presents a T–v diagram for H2O showing several lines ofconstant pressure. In the liquid region, lines of constant pressure hug thesaturated liquid line quite closely. This fact is illustrated more clearly inthe expanded view of the liquid region provided in Fig. 2.28 where the 10-MPa constant-pressure line is shown together with the saturated liquid line.All of the constant-pressure lines for pressures less than 10 MPa, butgreater than Psat at any given temperature, are crowded between the twolines shown in Fig. 2.28; thus, we see that specific volume is much more
0.0001
400
200
600
800
1000
1200
1400
0.001 0.01 0.1 1 10Specific volume (m3/kg)
Tem
pera
ture
(K
)
Critical point Pc = 22.064 MPa
Tc = 647.1 K P =
Pc
P =
10
MPa
P =
1 M
Pa
P =
0.1
MPa
FIGURE 2.27
Temperature–specific volumediagram for H2O showing isobarsfor 0.1, 1, and 10 MPa. Alsoshown is the critical pressureisobar.
0.00105
300
350
400
450
500
550
600
0.00115 0.00125 0.00135 0.00145
Saturated liquid line
P = 10 MPa (liquid)
P = Psat = 10 MPa
Tem
pera
ture
(K
)
Specific volume (m3/kg)
FIGURE 2.28
Isobars in T–vv space in the compressedliquid region for H2O lie close to thesaturated liquid line. The 10-MPaisobar crosses the saturated liquid linewhen Psat = 10 Ma and then proceedshorizontally across the steam dome (notshown).
0521850436c02_p101-149.qxd 13/9/05 7:51 PM Page 119 Quark01A Quark01:BOOKS:CU/CB Jobs:CB925-Turns:Chapters:Chapter-02:

120 Thermal-Fluid Sciences
sensitive to temperature than to pressure. As a consequence, values forspecific volume for compressed liquids can be approximated as those at thesaturated liquid state at the same temperature; that is,
v liq (T) � vf (T), (2.51)
where vf is the specific volume of the saturated liquid at T. This rule-of-thumbcan be used when comprehensive compressed liquid data are not available.We discuss compressed liquid properties in more detail in a later section.
Returning to Fig. 2.27 we now examine the behavior of the constant-pressure lines on the other side of the steam dome. We first note thesignificant dependence of the specific volume on pressure along the saturatedvapor line, where an order-of-magnitude increase in pressure results inapproximately an order-of-magnitude decrease in specific volume. If thesaturated vapor could be treated as an ideal gas, this relationship would followv�1 � P. In the vapor region, specific volume increases with temperaturealong a line of constant pressure, and pressure increases with temperaturealong a line of constant volume. Although somewhat obscured by the use ofthe logarithmic scale for specific volume, the vapor region of Fig. 2.28 looksmuch like the ideal-gas T–v plot shown earlier (cf. Fig. 2.8). Of course, thereal-gas behavior of steam affects the details of such a comparison.
P–vv DiagramsFigure 2.29 presents a P–v diagram for H2O showing a single isotherm (T �
373.12 K or 99.97°C). The corresponding saturation pressure is 101,325 Pa(1 atm). The saturation condition thus corresponds to the normal boiling pointof water. Note that both axes in Fig. 2.29 are logarithmic. Isotherms fortemperatures greater than 373.12 K lie above and to the right of the isothermshown. In the superheated vapor region, the isotherms lie relatively close tothe saturated vapor line in the log–log coordinates of Fig. 2.29. Figure 2.30presents an expanded view of the region 0.01 � P � 0.1 MPa showing severalisotherms in linear P–v space.
100
10
1
0.1
0.01
0.001
0.0001 0.001 0.01 0.1 1Specific volume (m3/kg)
Pres
sure
(M
Pa)
10 100 1000
Saturation line
T = 373.12 K
T = 373.12 KT = 373.12 K
FIGURE 2.29
P–vv diagram for H2O showing T =373.12 K (99.97�C) isotherm. Anexpanded view of several isotherms inthe superheated vapor region (P =0.01–0.1 MPa) is shown in Fig. 2.30.
0521850436c02_p101-149.qxd 13/9/05 7:51 PM Page 120 Quark01A Quark01:BOOKS:CU/CB Jobs:CB925-Turns:Chapters:Chapter-02:

CH. 2 Thermodynamic Properties, Property Relationships and Processes 121
00
0.02
0.04
0.06
0.08
0.1
5 10 15 20 25 30 35 40 45 50Specific volume (m3/kg)
T=
500 K
T=
1000K
Saturated vapor line T = 373.12 K (99.97°C)
Pres
sure
(M
Pa)
FIGURE 2.30
Isotherms in P–vv space for thesuperheated region of H2O exhibit ahyperbolic-like behavior (cf. ideal-gasbehavior in Fig. 2.7).
Example 2.20
A 0.5-kg mass of steam at 800 K and 1 MPa is contained in a rigid vessel.The steam is cooled to the saturated vapor state. Plot the process on bothT–v and P–v coordinates. Determine the volume of the vessel and the finaltemperature and pressure of the steam.
T = 800 KP = 1 MPa
State 1 State 2
T = TsatP = Psat
Solution
Known Steam, M, P1, T1, saturated vapor at state 2
Find P2, T2, V
Assumptions
i. Rigid tank (given)ii. Simple compressible substance
Analysis Before we can create T–v and P–v sketches, we need to deter-mine the region in which the state-1 point lies. Since the state-1 temperature(800 K) is greater than the critical temperature (Tc � 647.27 K) and thestate-1 pressure (1 MPa) is less than the critical pressure (Pc � 22.064MPa), state 1 must lie in the superheated vapor region. With this information,we now construct the following T–v and P–v plots:
0521850436c02_p101-149.qxd 13/9/05 7:51 PM Page 121 Quark01A Quark01:BOOKS:CU/CB Jobs:CB925-Turns:Chapters:Chapter-02:

122 Thermal-Fluid Sciences
We note that the cooling of the steam from state 1 to state 2 is aconstant-volume process because the tank is rigid. Because the mass isalso constant, the specific volume at state 1 equals the specific volumeat state 2, as shown on the sketches. To find P2, T2, and V requires anumerical value for v2 (� v1). Using data from Table D.3, we find thespecific volume v1:
The NIST12 v. 5.2 software yields a value identical to the tabulated value.Since state 2 lies on the saturated vapor line, we know that vg (T2, P2) �
v2 � v1. From Table D.2, we see that the state-2 specific volume is between
0.0001
400
600
800
1000
1200
1400
0.001 0.01 0.1 1 10Specific volume (m3/kg)
Tem
pera
ture
(K) Critical point P
= P c
10 M
Pa
1 M
Pa
P =
0.1 M
Pa
1
2
v 1 = v 2 = 0.3667
T = 800 K
1
2
log P
log v
1 MPa
v1 = v2 = 0.3667
T (K) vv (m3/kg)
780 0.35734800 � T1 0.36677 � v1
820 0.37618
0521850436c02_p101-149.qxd 13/9/05 7:51 PM Page 122 Quark01A Quark01:BOOKS:CU/CB Jobs:CB925-Turns:Chapters:Chapter-02:

CH. 2 Thermodynamic Properties, Property Relationships and Processes 123
those of saturated vapor at 0.5 and 0.6 MPa; thus, we interpolate to find P2
and T2 as follows:
Using the NIST database provides a more accurate result:
To calculate the volume of the rigid vessel containing the steam, weapply the definition of specific volume
or
Thus,
Comments This example illustrates some of the thought processesinvolved in determining the region in which a state point lies. We also seethe importance of recognizing that the process involved was a constant-volume process.
V � (0.5 kg) 0.36677 m3/kg � 0.1834 m3.
V � Mv.
v � V>M,
T2 � 425.8 K.
P2 � 0.511 MPa,
vv sat (m3/kg) Psat (MPa) Tsat (K)
0.37481 0.5 424.980.36677 � v2 0.514 � P2 425.9 � T2
0.31558 0.6 431.98
Self Test2.20 ✓ The system of Example 2.20 is further cooled to a final temperature of 350 K.
Determine the final pressure and the quality at this state. (Answer: P � Psat (350 K) � 41.68 kPa, x � 0.095)
2.6b Calorific and Second-Law PropertiesThe sources available for calorific properties—specific enthalpies and specificinternal energies—and the second-law property—entropy—are the same as forstate properties: Appendix D, the NIST online database [11], and NIST12. Inthe NIST data, both enthalpies and internal energies are provided; however,many sources provide only enthalpies, leaving it to the user to obtain internalenergies from the definition
u (T, P) � h (T, P) � Pv.
Also frequently tabulated is the enthalpy of vaporization, which isdefined as
hfg � hvap � hliq � hg � hf. (2.52)
Physically, this represents the amount of energy required to vaporize a unitmass of liquid at constant pressure. This quantity is also sometimes referred
hfg,
0521850436c02_p101-149.qxd 13/9/05 7:51 PM Page 123 Quark01A Quark01:BOOKS:CU/CB Jobs:CB925-Turns:Chapters:Chapter-02:

124 Thermal-Fluid Sciences
to as the latent heat of vaporization, a term coined during the reign of thecaloric theory.16
T–s DiagramsOf equal importance to T–v and P–v diagrams is the temperature–entropy, orT–s, diagram. For a reversible process, the integral of Tds provides the energyadded as heat to a system; thus, the area under a reversible process line on T–scoordinates represents the energy added or removed by heat interactions. SeeChapter 4 for a discussion of heat transfer and see Chapter 7 for a moreexpansive discussion of T–s diagrams.
Figure 2.31 presents a T–s diagram for water and shows an isobartraversing the compressed liquid region, across the steam dome, and upinto the superheat region. Without an expanded scale, the 1-MPa isobar inthe compressed liquid region is indistinguishable from the saturated liquidline; however, it does lie above and to the left of the saturated liquid line.Isobars for pressures greater than 1 MPa lie above the isobar shown, andthose for lower pressures lie below. Although not shown, isochors(constant-volume lines) in the superheat region have steeper slopes thanthe isobars (see Fig. 2.11). Note that Fig. 2.31 employs linear scales forboth temperature and entropy, rather than the semilog and log–log scalespreviously used in the analogous T–v (Fig. 2.27) and P–v (Fig. 2.29) diagrams,respectively.
16 See Chapter 4 for a brief history of the caloric theory and how it was superceded by modernconstructs of energy.
00
200
400
600
800
1000
1200
1400
2 4 6 8 10Entropy (kJ/kg·K)
P=
1M
Pa
Critical point
Tem
pera
ture
(K
)
FIGURE 2.31
Temperature–entropy (T–s) diagramfor water showing liquid–vaporsaturation lines and the 1-MPa isobar.
0521850436c02_p101-149.qxd 13/9/05 7:51 PM Page 124 Quark01A Quark01:BOOKS:CU/CB Jobs:CB925-Turns:Chapters:Chapter-02:

CH. 2 Thermodynamic Properties, Property Relationships and Processes 125
Solution
Known Saturated vapor at P1, T1 (� T2), P2
Find v1 (� vg), v2
Assumption
Simple compressible substance at equilibrium
Analysis We begin by drawing the P1 (� 3 MPa) and P2 (� 1 MPa)isobars on a T–s diagram as shown. State 1 is identified on this diagram asa saturated vapor. For the isothermal process, a horizontal line is extendedfrom the state-1 point. The location where this isotherm, T � Tsat (3 MPa),crosses the 1-MPa isobar identifies the state-2 point. State 2 is in thesuperheated vapor region. On P–v coordinates, we draw the same T � Tsat
(3 MPa) isotherm. Where it crosses the 1-MPa isobar identifies the state-2point in P–v space.
Example 2.21
Consider an isothermal expansion of steam from an initial state ofsaturated vapor at 3 MPa to a pressure of 1 MPa. Plot the process on T–sand P–v coordinates and determine the initial and final specificvolumes.
T1 = Tsat(P1)P1 = 3 MPa
T2 = T1P2 = 1 MPa
W1
W2
Tsat (3 MPa) 12
s
T
P=
3M
PaP
=1 M
Pa
0521850436c02_p101-149.qxd 13/9/05 7:51 PM Page 125 Quark01A Quark01:BOOKS:CU/CB Jobs:CB925-Turns:Chapters:Chapter-02:

126 Thermal-Fluid Sciences
From Table D.2, we obtain the following properties:
To obtain the state-2 properties, we can interpolate to find v2 in thesuperheated-vapor table for P � 1 MPa (see Table D.3). Alternatively, theNIST database can be used directly to determine v2 by generatingisothermal data (T � 507.00 K) with pressure increments containing P �
1 MPa. The result is
v2 � 0.22434 m3/kg.
Comments We note the utility of defining constant-property lines on T–sand P–v diagrams. The reader should verify the state-2 property determi-nations using Table D.3 and the NIST online database and/or software.
v 1 � 0.066664 m3/kg.
T1 � 507.00 K,
P1 � 3 MPa,
Self Test2.21 ✓ The system of Example 2.21 is allowed to expand isothermally until the final specific
volume is 0.32 m3/kg. Find the final pressure. (Answer: P � 0.70 MPa)
h–s DiagramsFigure 2.32 illustrates an enthalpy–entropy diagram for water. Unlike allof the other previously shown property diagrams, the steam dome isskewed because both enthalpy and entropy increase during theliquid–vapor phase change. Note that the critical point does not lie at thetopmost point on the saturation line in h–s space. In the analysis of manyprocesses and devices, enthalpy and entropy are key properties and henceh–s diagrams can be helpful. Prior to the advent of digital computers,detailed h–s or Mollier diagrams showing numerous properties (e.g., P,T, x, etc.) were routinely used in thermodynamic analyses. Figure 2.33illustrates such a diagram.
log P
3 MPa
1 MPa
1
2
v 1 v 2log v
T = Tsat (3 MPa)
0521850436c02_p101-149.qxd 13/9/05 7:51 PM Page 126 Quark01A Quark01:BOOKS:CU/CB Jobs:CB925-Turns:Chapters:Chapter-02:

0
500
0
1000
1500
2000
2500
3000
3500
4000
4500
5000
2 4 6 8 10Entropy (kJ/kg·K)
Ent
halp
y (k
J/kg
)
Critical point
T = 453.03 K
P =
1 M
Pa
FIGURE 2.32
Enthalpy–entropy (h–s) diagramfor water showing liquid and vaporsaturation lines and the 1-MPaisobar. Also shown is the 453.03-Kisotherm.
1.11.01650
1600
1550
1500
1450
1400
1350
1300
1250
1200
1150
1100
1050
1000
950
900
850
800
750
1650
1600
1550
1500
1450
1400
1350
1300
1250
1200
1150
1100
1050
1000
950
900
850
800
750
1.2 1.3 1.4 1.5 1.6 1.7 1.8 1.9 2.0 2.1 2.2 2.3
1.11.0 1.2 1.3 1.4 1.5 1.6 1.7 1.8 1.9 2.0 2.1 2.2 2.3Entropy (Btu/lbm·F)
Entropy (Btu/lbm·F)
Ent
halp
y (B
tu/lb
m)
Ent
halp
y (B
tu/lb
)
50
40
35
30
25
20
15
10
5
10
2.5
1.0
0.5
0.2
2030
50
10020
030050
01000
20003000
4000
5500
1200 1000
1100
1000
900
900
800
700
600
500
400
300
200
800
700
600
500
400
300
200
100
Constant temperature, F
Constant moisture % 5
Saturation line
Stan
dard
atn
mos
pher
e
Consta
nt p
ress
ure,
psi
Constant superheat, deg F100
FIGURE 2.33
Mollier (h–s) diagram for water.Courtesy of The Babcock & WilcoxCompany.
page 127
0521850436c02_p101-149.qxd 13/9/05 7:51 PM Page 127 Quark01A Quark01:BOOKS:CU/CB Jobs:CB925-Turns:Chapters:Chapter-02:

128 Thermal-Fluid Sciences
Example 2.22
Superheated steam, initially at 700 K and 10 MPa, is isentropicallyexpanded to 1 MPa. Determine the values of v , h, T, and x at the final state.Sketch the process on a T–s diagram.
W1
W2
P1 = 10 MPa T1 = 700 K
P2 = 1 MPas2 = s1
T = 700 K
P = 1 MPa2
1
s = 6.327 kJ/kg.K
0.0300
400
500
600
700
800
900
1000
1.0 2.0 3.0 4.0 5.0 6.0 7.0 8.0 9.0Entropy (kJ/kg.K)
Tem
pera
ture
(K)
P=
10M
Pa
P=
1 MPa
Solution
Known Superheated H2O at T1, P1, isentropic expansion to P2
Find v2, h2, T2, x2
Sketch
Assumption
Simple compressible substance at equilibrium
Analysis Our strategy here is to locate state 1 in T–s space, that is, finds1 given T1 and P1. State 2 is then determined by the given pressure (P2 �
1 MPa) and the fact that the process is isentropic (i.e., that s2 � s1). Therelationship between state 1 and state 2 is shown in the sketch. Since we
0521850436c02_p101-149.qxd 13/9/05 7:51 PM Page 128 Quark01A Quark01:BOOKS:CU/CB Jobs:CB925-Turns:Chapters:Chapter-02:
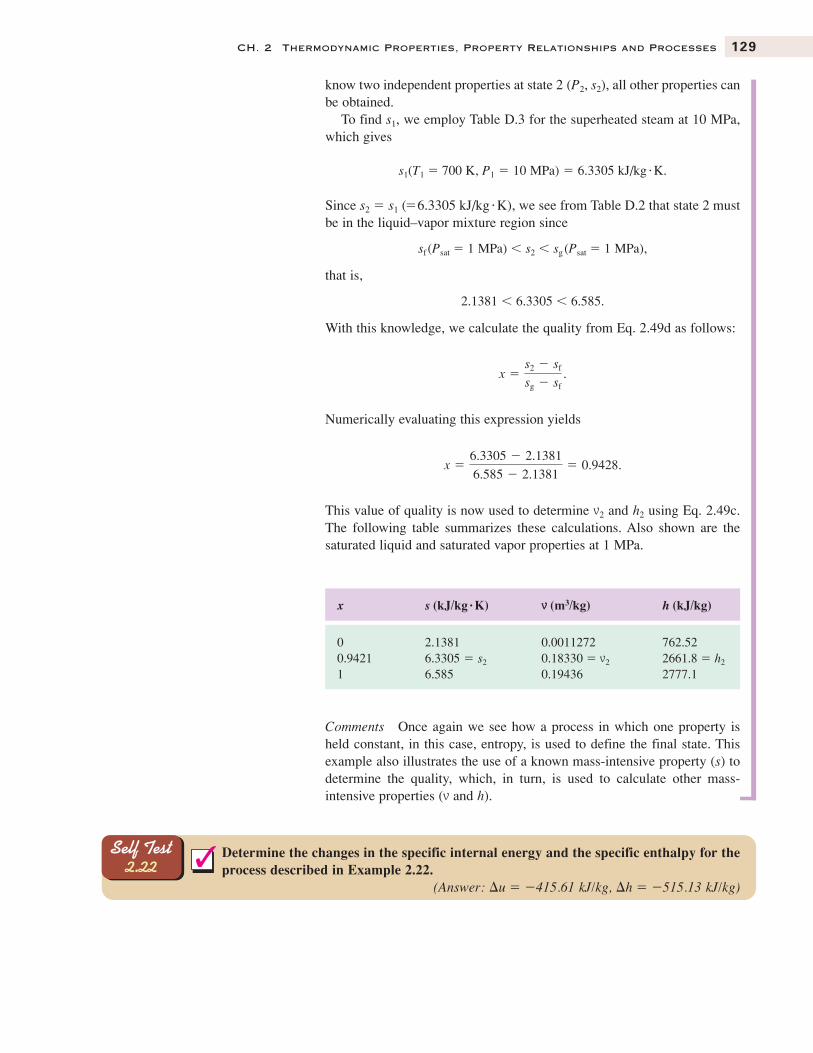
CH. 2 Thermodynamic Properties, Property Relationships and Processes 129
Comments Once again we see how a process in which one property isheld constant, in this case, entropy, is used to define the final state. Thisexample also illustrates the use of a known mass-intensive property (s) todetermine the quality, which, in turn, is used to calculate other mass-intensive properties (v and h).
x s (kJ/kg�K) vv (m3/kg) h (kJ/kg)
0 2.1381 0.0011272 762.520.9421 6.3305 � s2 0.18330 � v2 2661.8 � h2
1 6.585 0.19436 2777.1
Self Test2.22 ✓ Determine the changes in the specific internal energy and the specific enthalpy for the
process described in Example 2.22.(Answer: u � �415.61 kJ/kg, h � �515.13 kJ/kg)
know two independent properties at state 2 (P2, s2), all other properties canbe obtained.
To find s1, we employ Table D.3 for the superheated steam at 10 MPa,which gives
s1(T1 � 700 K, P1 � 10 MPa) � 6.3305 kJ/kgK.
Since s2 � s1 (�6.3305 kJ/kgK), we see from Table D.2 that state 2 mustbe in the liquid–vapor mixture region since
sf (Psat � 1 MPa) � s2 � sg (Psat � 1 MPa),
that is,
2.1381 � 6.3305 � 6.585.
With this knowledge, we calculate the quality from Eq. 2.49d as follows:
Numerically evaluating this expression yields
This value of quality is now used to determine v2 and h2 using Eq. 2.49c.The following table summarizes these calculations. Also shown are thesaturated liquid and saturated vapor properties at 1 MPa.
x �6.3305 � 2.1381
6.585 � 2.1381� 0.9428.
x �s2 � sf
sg � sf .
0521850436c02_p101-149.qxd 13/9/05 7:51 PM Page 129 Quark01A Quark01:BOOKS:CU/CB Jobs:CB925-Turns:Chapters:Chapter-02:

130 Thermal-Fluid Sciences
2.7 LIQUID PROPERTY APPROXIMATIONS
Although accurate thermodynamic property data are available for manysubstances in the compressed liquid region (see Table 2.7), we now discusssome approximations. These approximations for liquid properties are usefulto simplify some analyses, and they can be used when detailed compressedliquid data are not available.
For most liquids, the specific volume v and specific internal energy u arenearly independent of pressure; hence, they depend only on temperature, sothat,
Since saturation properties are available for many liquids, v and u can beapproximated using the corresponding saturation values where the saturationstate is evaluated at the temperature of interest, that is,
(2.53a)
and
(2.53b)
The enthalpy can also be approximated using these relationships, togetherwith the definition h � u � Pv ; thus,
(2.53c)h (T, P) � hf (Tsat � T) � (P � Psat) vf
(Tsat � T).
u (T, P) � uf (Tsat � T).
v (T, P) � v f (Tsat � T)
u (T, P) � u (T).
v (T, P) � v (T),
Example 2.23
Determine the error associated with the evaluation of v and h from Eqs.2.53a–2.53c for water at 10 MPa and 300 K.
Solution
Known H2O (liquid), P, T
Find v and h (approximations and “exact”)
Sketch
v = ?v
v f
300
P = 10 MPaT
Saturated liquid line
Assumption
Water is approximately incompressible
0521850436c02_p101-149.qxd 13/9/05 7:51 PM Page 130 Quark01A Quark01:BOOKS:CU/CB Jobs:CB925-Turns:Chapters:Chapter-02:

CH. 2 Thermodynamic Properties, Property Relationships and Processes 131
Analysis Using the NIST database, we obtain the following values for thecompressed liquid at 10 MPa and 300 K:
To obtain the approximate specific volume, we employ Eq. 2.53a togetherwith Table D.1, which gives
We also employ values from Table D.2 to evaluate Eq. 2.54c for theapproximate enthalpy:
Verification of the units is left to the reader. The errors associated with theapproximations are given in the following table:
� 122.59 � 103 J/kg or 122.59 kJ/kg.
� 103 Pa) 0.0010035 m3/kg
� 112.56 � 103 J/kg � (10 � 106 Pa � 3.5369
h (T, P) � hf (T) � [P � Psat
(T)] vf (T)
v (T, P) � vf (Tsat � T) � vf
(300 K) � 0.0010035 m3/kg.
h � 121.73 kJ/kg.
v � 0.00099905 m3/kg,
Property NIST Value Approximation Error
v (m3/kg) 0.00099905 0.0010035 �0.44%h (kJ/kg) 121.73 122.59 �0.71%
Comments We see that the approximate values are quite close to the ex-act values, with errors of less than 1%. We also note that the high pressure(10 MPa) makes a significant contribution to the enthalpy.
Self Test2.23 ✓ A beaker contains H2O at atmospheric pressure and 10°C. Find the specific volume,
specific internal energy, and specific enthalpy of the H2O.(Answer: v � 0.001 m3/kg, u � 41.391 kJ/kg, h � 41.491 kJ/kg)
2.8 SOLIDS
We have focused thus far on the thermodynamic properties of gases, liquids,and their mixtures. We now examine solids. Figure 2.34 presents a phasediagram for water showing the solid region, which is designated I; the liquidregion, designated II; and the vapor region, III. A key feature of thisdiagram is the triple point. As you may recall, the triple point is the state atwhich all three phases (solid, liquid, and vapor) of a substance coexist inequilibrium. For water, the triple point temperature is 0.01°C (273.16 K)and the triple point pressure is 0.00604 atm (0.6117 kPa). The nearlyvertical line that originates at the triple point, the solidification or fusionline, separates the solid region from the liquid region. Another line, thesublimation line, separates the solid from the vapor phase and ends at thetriple point. A third line, which starts at the triple point and continues up tothe critical point, comprises the saturation states that were defined in ourdiscussion of liquid–vapor mixtures. The normal (i.e., 1 atm) freezing point
0521850436c02_p101-149.qxd 13/9/05 7:51 PM Page 131 Quark01A Quark01:BOOKS:CU/CB Jobs:CB925-Turns:Chapters:Chapter-02:
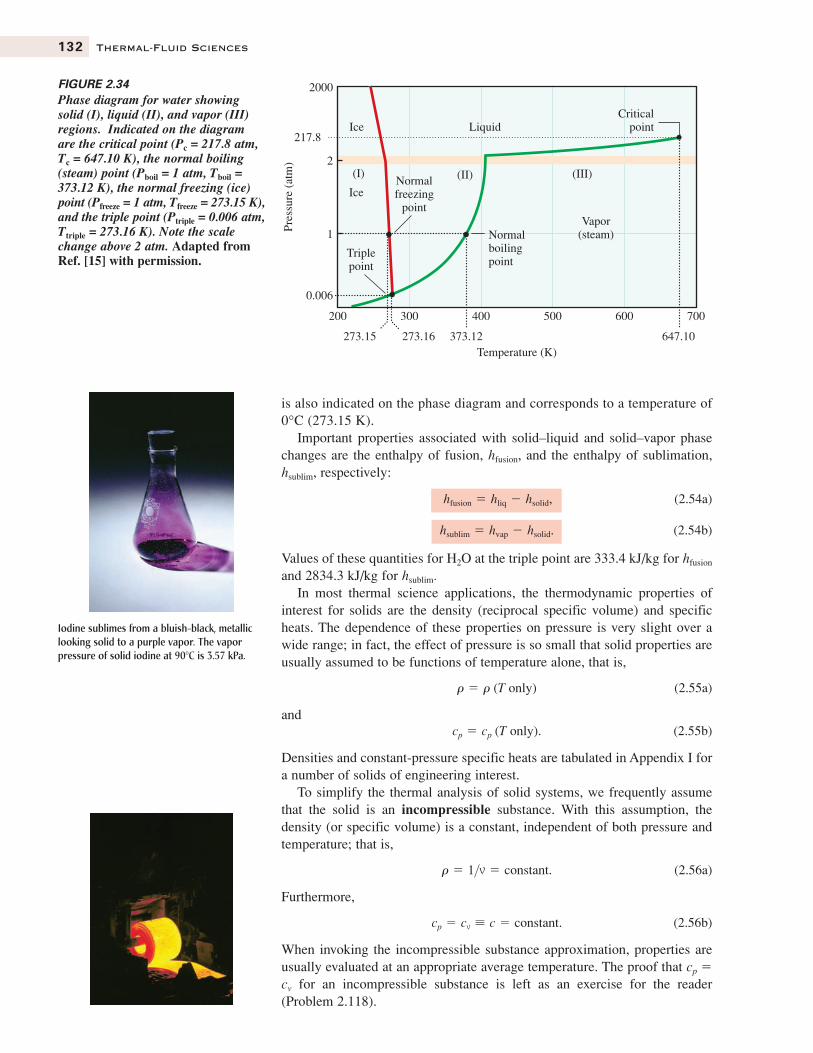
132 Thermal-Fluid Sciences
Normal boiling point
Vapor (steam)
Normal freezing
point
Triple point
Critical point
200 300
273.15 273.16 373.12 647.10
400 500 600 700
0.006
1
2
2000
Pres
sure
(at
m)
Ice
217.8
(I) (II) (III)
Temperature (K)
Ice Liquid
FIGURE 2.34
Phase diagram for water showingsolid (I), liquid (II), and vapor (III)regions. Indicated on the diagramare the critical point (Pc = 217.8 atm,Tc = 647.10 K), the normal boiling(steam) point (Pboil = 1 atm, Tboil =373.12 K), the normal freezing (ice)point (Pfreeze = 1 atm, Tfreeze = 273.15 K),and the triple point (Ptriple = 0.006 atm,Ttriple = 273.16 K). Note the scalechange above 2 atm. Adapted fromRef. [15] with permission.
Iodine sublimes from a bluish-black, metalliclooking solid to a purple vapor. The vaporpressure of solid iodine at 90�C is 3.57 kPa.
is also indicated on the phase diagram and corresponds to a temperature of0°C (273.15 K).
Important properties associated with solid–liquid and solid–vapor phasechanges are the enthalpy of fusion, hfusion, and the enthalpy of sublimation,hsublim, respectively:
(2.54a)
(2.54b)
Values of these quantities for H2O at the triple point are 333.4 kJ/kg for hfusion
and 2834.3 kJ/kg for hsublim.In most thermal science applications, the thermodynamic properties of
interest for solids are the density (reciprocal specific volume) and specificheats. The dependence of these properties on pressure is very slight over awide range; in fact, the effect of pressure is so small that solid properties areusually assumed to be functions of temperature alone, that is,
(2.55a)
and(2.55b)
Densities and constant-pressure specific heats are tabulated in Appendix I fora number of solids of engineering interest.
To simplify the thermal analysis of solid systems, we frequently assumethat the solid is an incompressible substance. With this assumption, thedensity (or specific volume) is a constant, independent of both pressure andtemperature; that is,
(2.56a)
Furthermore,
(2.56b)
When invoking the incompressible substance approximation, properties areusually evaluated at an appropriate average temperature. The proof that cp �
cv for an incompressible substance is left as an exercise for the reader(Problem 2.118).
cp � cv � c � constant.
r � 1>v � constant.
cp � cp (T only).
r � r (T only)
hsublim � hvap � hsolid.
hfusion � hliq � hsolid,
0521850436c02_p101-149.qxd 13/9/05 7:51 PM Page 132 Quark01A Quark01:BOOKS:CU/CB Jobs:CB925-Turns:Chapters:Chapter-02:

CH. 2 Thermodynamic Properties, Property Relationships and Processes 133
Example 2.24
A pure copper rod of diameter D � 25 mm and length L � 150 mm isinitially at a uniform temperature of 300 K. The rod is heated at 1 atm to auniform temperature of 450 K. Estimate the change in internal energyU([�] J) of the rod in going from the initial to the final state.
Solution
Known Pure Cu, L, D, T1, T2
Find U2 � U1 � U
Sketch
Assumptions
Incompressible solid
Analysis We develop the required calorific equation of state for copperby starting with the definition of the constant-volume specific heat (Eq. 2.19a),
With the assumption of incompressibility, this becomes an ordinaryderivative, which can be separated and integrated as follows:
For a system of mass M, the internal energy change is thus
We find the mass of the rod as follows:
We use Appendix I (Table I.1) to obtain values for c and r. Because valuesof c are given for several temperatures, we interpolate for an averagetemperature T[�(T1 � T2)�2] of 375 K:
M � rV � r
pD2
4 L.
¢U � M¢u � Mc (T2 � T1).
¢u � �u2
u1
du � �T2
T1
cv dT � c (T2 � T1).
cv � a 0u
0Tb
v
.
State 1
State 2U2
U∆U
U1
T1 T2T
T1 = 300 K
D
L
0521850436c02_p101-149.qxd 13/9/05 7:51 PM Page 133 Quark01A Quark01:BOOKS:CU/CB Jobs:CB925-Turns:Chapters:Chapter-02:

134 Thermal-Fluid Sciences
Because only a single value of the density is given in Table I.1, we use thatvalue:
Evaluating the mass and internal energy change yields
and
Comments Note the use of a cp value based on an average temperature.This approach to find an average cp is frequently used. That thetemperature is uniform at both the start and end of the process also greatlysimplifies this problem. (How would you solve the problem if atemperature distribution were given at the end of the heating process,rather than a single uniform temperature?)
[�] kg
J
kg K K � J.
¢U � 0.6577 (392)(450 � 300) � 38,700
[�]
kg
m3 (m2)m � kg,
M � 8933
p(0.025)2
4 0.150 � 0.6577
r (300 K) � 8933 kg/m3 �
r (375 K).
T (K) cp (J/kg �K)
200 356375 392400 397
Self Test2.24 ✓ Redo Example 2.24 for an iron rod of the same dimensions. Compare your answer with
that of Example 2.24 and discuss your results. (Answer: U � 41.4 kJ. Even though the density of iron is lower than thatof copper, more energy is required for the same process because iron has ahigher cp value.)
2.9 IDEAL-GAS MIXTURES
So far we have confined our discussion of properties to pure substances;however, many practical devices involve mixtures of pure substances. Airconditioning and combustion systems are common examples of such. In theformer application, water vapor becomes an important component of air,which already is a mixture of several components, whereas combustionsystems deal with reactant mixtures of fuel and oxidizer and with productmixtures of various components. In both of these examples, we can treatthe various gas streams as ideal-gas mixtures with reasonable accuracy fora wide range of conditions. For air conditioning and humidificationsystems, this results from the small amounts of water involved in the
Example 12.15 in Chapter 12 showsthat treating the water vapor in
moist atmospheric air as an idealgas is a good approximation.
➤L
evel 2
0521850436c02_p101-149.qxd 13/9/05 7:51 PM Page 134 Quark01A Quark01:BOOKS:CU/CB Jobs:CB925-Turns:Chapters:Chapter-02:

CH. 2 Thermodynamic Properties, Property Relationships and Processes 135
Condensation of water vapor from combustionproducts.
Some specific examples in Chapter12 include the operation of
evaporative coolers (Example 12.17)and household dehumidifiers
(Example 12.18).
➤
Conservation of mass for reactingsystems uses mole and mass
fractions. See Examples 3.14 and3.15 in Chapter 3.
➤
mixtures. For combustion, the high temperatures typically involved resultin mixtures of low density. Applications of the concepts developed in thissection are found in Chapters 3, 5, 11, and 12 for combustion systems andin Chapter 12 for air conditioning and humidification systems.
2.9a Specifying Mixture Composition
To characterize the composition of a mixture, we define two important anduseful quantities: the constituent mole fractions and mass fractions. Considera multicomponent mixture of gases composed of N1 moles of species 1, N2
moles of species 2, etc. The mole fraction of species i, Xi, is defined as thefraction of the total number of moles in the system that are species i:
(2.57a)
Similarly, the mass fraction of species i, Yi, is the fraction of the totalmixture mass that is associated with species i:
(2.57b)
Note that, by definition, the sum of all the constituent mole (or mass)fractions must be unity; that is,
(2.58a)
(2.58b)
where J is the total number of species in the mixture.We can readily convert mole fractions and mass fractions from one to
another using the molecular weights of the species of interest and theapparent molecular weight of the mixture:
(2.59a)
(2.59b)
The apparent mixture molecular weight, denoted Mmix, is easily calculatedfrom knowledge of either the species mole or mass fractions:
(2.60a)
or
(2.60b)
2.9b State (P–vv–T) Relationships for Mixtures
In our treatment of mixtures, we assume a double ideality: first, that the pureconstituent gases obey the ideal-gas equation of state (Eq. 2.8), and, second,
Mmix �1
aJ
i�1(Yi�Mi)
#
Mmix � aJ
i�1XiMi,
Xi � YiMmix>Mi.
Yi � XiMi>Mmix,
aJ
i�1Yi � 1,
aJ
i�1Xi � 1,
Yi KMi
M1 � M2 � � Mi � �
Mi
Mtot.
Xi KNi
N1 � N2 � �
Ni
Ntot
0521850436c02_p101-149.qxd 13/9/05 7:51 PM Page 135 Quark01A Quark01:BOOKS:CU/CB Jobs:CB925-Turns:Chapters:Chapter-02:

136 Thermal-Fluid Sciences
NA, V
TPA
NB, V
TPB
NC, V
T
NA + NB +NC, V
TP
PC
FIGURE 2.35
In an ideal-gas mixture, the sum ofthe pressures associated with eachcomponent isolated in the samevolume at the same temperature isidentical to the total pressureobserved when all species areconfined together in the same volumeat the same temperature.
that when these pure components mix, an ideal solution results. In an idealsolution, the behavior of any one component is uninfluenced by thepresence of any other component.
Let us explore the characteristics of an ideal solution considering, first,the thermodynamic property pressure. Consider a fixed volume V containingtwo or more different species. If the mixture (solution) is ideal, gas moleculesof species A are free to roam through the entire volume V, as if no otherspecies were present. The pressure that molecules A exert on the wall is lessthan the total pressure, however, since other non-A molecules also collidewith the wall. We can thus define the partial pressure of species A, PA, byapplying the ideal-gas equation of state just to the A molecules:
(2.61)
Since each species behaves independently, similar expressions can bewritten for each,
PBV � NBRuT,� �
PiV � NiRuT,
etc. Summing this set of equations for a mixture containing J species yields
(PA � PB � � Pi � � PJ)V � (NA � NB � � Ni � � NJ)RuT.(2.62)
Because the sum of the number of moles of each constituent is the totalnumber of moles in the system, Ntot, this equation becomes
(2.63)
where Pi is the partial pressure of the ith species. Because the mixture as awhole obeys the ideal-gas law,
PV � NtotRuT, (2.64)
the sum of the partial pressures must be identical to the total pressure, that is,
(2.65)
This statement is known as Dalton’s law of partial pressures and isschematically illustrated in Fig. 2.35. Here we see four containers, eachhaving the same volume V. Gas A fills one container, gas B another, and gasC the third. Each gas has the same temperature T. The absolute pressure of thegas in each container is measured to be PA, PB, and PC, respectively. We nowconduct the thought experiment in which gases A, B, and C are transferred tothe fourth container, again at temperature T. The absolute pressure of themixture in the fourth container is found to be the sum of the absolute pressuresmeasured when the gases were segregated. That the contribution of a singlespecies to the total pressure in a gas mixture is the same as that of the purespecies occupying the same total volume at the same temperature is a definingcharacteristic of an ideal-gas mixture (i.e., an ideal solution). In nonidealmixtures (solutions), the total pressure is not necessarily equal to the sum ofthe pure component pressures as in the thought experiment.
aJ
i�1Pi � P.
aJ
i�1PiV � Ntot
Ru T,
PAV � NA Ru
T.
0521850436c02_p101-149.qxd 13/9/05 7:51 PM Page 136 Quark01A Quark01:BOOKS:CU/CB Jobs:CB925-Turns:Chapters:Chapter-02:

In Chapter 12, the partial pressureof water vapor is used to define
the relative humidity of moist air.See Eq. 12.62.
➤
TP
VA+VB+VC
VA
TP
VB
TP
VC
TP
FIGURE 2.36
In an ideal-gas mixture, the sum ofthe volumes associated with eachcomponent isolated at the sametemperature and the same pressure isidentical to the total volume when allspecies are confined together at thesame temperature and the samepressure.
The partial pressure can be related to the mixture composition and totalpressure by dividing Eq. 2.61 by Eq. 2.64,
which simplifies to
(2.66a)
or
(2.66b)
Ideal-gas mixtures also exhibit the property that when component gaseshaving different volumes but identical pressures and temperatures arebrought together, the mixture volume is the sum of the pure componentvolumes (Fig. 2.36). Mathematically, we express this idea by writing theideal-gas equation of state for each pure constituent,
and summing to yield
P(VA � VB � VC) � (NA � NB � NC)RuT.
SincePVtot � NtotRuT,
we conclude that the individual volumes, or partial volumes, must equal thetotal volume when combined, that is,
Vtot � VA � VB � VC. (2.67)
This view of an ideal-gas mixture is frequently referred to as Amagat’s model.The partial volumes also can be related to the mixture composition by
defining a volume fraction,
Vi�V � Ni�Ntot. (2.68)
Comparing Eqs. 2.66a and 2.68, we see that the three measures of mixturecomposition—the ratio of the partial pressure to the total pressure, the volumefraction, and the mole fraction—are all equivalent for an ideal-gas mixture:
Pi�P � Vi�V � Ni�N (� Xi). (2.69)
For insight into the behavior of nonideal mixtures, the reader is referredto Refs. [20, 21].
2.9c Standardized Properties
From our earlier discussion of the calorific equation of state for ideal gases,we see that a reference temperature is required to evaluate the specificinternal energy and enthalpy (see Eqs. 2.31c and 2.33c). If one is concernedonly with a single pure substance, as opposed to a reacting system whereboth reactant and product species are present, then Eqs. 2.31c and 2.33c
PVC � NCRuT,
PVB � NBRuT,
PVA � NARuT,
Pi � Xi P.
Pi
P�
Ni
Ntot� Xi,
PiV
PV�
Ni Ru
T
Ntot Ru
T ,
Level 3
CH. 2 Thermodynamic Properties, Property Relationships and Processes 137
0521850436c02_p101-149.qxd 13/9/05 7:51 PM Page 137 Quark01A Quark01:BOOKS:CU/CB Jobs:CB925-Turns:Chapters:Chapter-02:

138 Thermal-Fluid Sciences
Standardizedenthalpy at
temperature T
Enthalpy offormation at
standardreference state
(Tref, Po)
Sensible enthalpy change
in going from Tref
to T
Table 2.8 Standard Reference State
Tref K 298.15 KPref K 101,325 PaFor elements in their naturally
occurring state (solid, liquid, orgas) at Tref and Pref*
hi (Tref) K 0
*For example, the standard-state enthalpies forC(s), N2(g), and O2(g) are all zero.
Shared electrons form a covalent bond inmolecular oxygen. An energy input is requiredto break this bond to form two oxygen atoms.
17 The use of this superscript is redundant for ideal-gas enthalpies, which exhibit no temperaturedependence; for entropies, however, the superscript is important.
would suffice to describe the internal energy and enthalpy changes for allthermodynamic processes, as only differences in states are of importance.Moreover, any choice of reference temperature would yield the same results.For example, the enthalpy change associated with a change of temperaturefrom T1 to T2 is calculated from Eq. 2.33c as
a straightforward calculation in which the reference temperature drops out. Inreacting systems, however, we must include energy stored in chemical bondsin our accounting. To accomplish this, the concept of standardized enthalpiesis extremely valuable. For any species, we define a standardized enthalpythat is the sum of an enthalpy that takes into account the energy associatedwith chemical bonds (or lack thereof), the enthalpy of formation, hf, and anenthalpy associated only with a temperature change, the sensible enthalpychange, hs. Thus, we write the molar standardized enthalpy for species i as
(2.70)
where
To make practical use of Eq. 2.70, it is necessary to define a standardreference state (Table 2.8). We employ a standard-state temperature, Tref �
25�C (298.15 K), and standard-state pressure, Pref � P� � 1 atm (101,325Pa), consistent with the JANAF [5], Chemkin [3], and NASA [6] thermody-namic databases. Although not needed to describe enthalpies, the standard-state pressure is required to calculate entropies at pressures other than oneatmosphere (see Eq. 2.39a). In addition to defining Tref and Pref, we adopt theconvention that enthalpies of formation are zero for the elements in theirnaturally occurring state at the reference-state temperature and pressure. Forexample, oxygen exists as diatomic molecules at 25°C and 1 atm; hence,
where the superscript � is used to denote that the value is for the standard-state pressure.17
To form oxygen atoms at the standard state requires the breaking of arather strong chemical bond. The bond dissociation energy for O2 at 298 Kis 498,390 kJ/ . Breaking this bond creates two O atoms; thus, theenthalpy of formation for atomic oxygen is half the value of the O2 bonddissociation energy:
Thus, enthalpies of formation have a clear physical interpretation as thenet change in enthalpy associated with breaking the chemical bonds of the
(h�f,O) � 249,195 kJ/kmolO.
kmolO2
(h�f, O2)298 � 0,
¢hs,i � hi (T) � h�f, i
(Tref).
hi (T) � h�f,i
(Tref) � ¢hs, i (T),
h(T2) � h(T2) � �T2
Tref
cp dT � �
T1
Tref
cp dT � �
T2
T1
cp dT,
0521850436c02_p101-149.qxd 13/9/05 7:51 PM Page 138 Quark01A Quark01:BOOKS:CU/CB Jobs:CB925-Turns:Chapters:Chapter-02:

CH. 2 Thermodynamic Properties, Property Relationships and Processes 139
standard-state elements and forming new bonds to create the compoundsof interest.
Representing the standardized enthalpy graphically provides a usefulway to understand and use this concept. In Fig. 2.37, the standardizedenthalpies for atomic oxygen (O) and diatomic oxygen (O2) are plottedversus temperature starting from absolute zero. At 298.15 K, we see that is zero (by definition of the standard-state reference condition), and thestandardized enthalpy of atomic oxygen equals its enthalpy of formation,since the sensible enthalpy at 298.15 K is zero. At the temperature indicated(4000 K), we see the additional sensible enthalpy contribution to thestandardized enthalpy. In Appendix B, enthalpies of formation at thereference state are given, and sensible enthalpies are tabulated as a functionof temperature for a number of species of importance in combustion.Enthalpies of formation for reference temperatures other than the standardstate 298.15 K are also tabulated.
Although the choice of a zero datum for the enthalpy of the elements atthe reference state is arbitrary (being merely a pragmatic choice), the thirdlaw of thermodynamics is used to set zero values for entropies; thus, thestandard-state entropy values are always larger than zero.
ho2
Standardized enthalpies are firstused in conservation of energy for
combustion systems. SeeExamples 5.7–5.9 in Chapter 5.
➤
1000−100,000
0
100,000
200,000
300,000
400,000
0 2000 3000 4000 5000 6000
Stan
dard
ized
ent
halp
y (k
J/km
ol)
Temperature (K)
h̄ O (4000 K)
h̄°f, O
∆h̄s, O (4000 K)
O2 molecules
O atoms
FIGURE 2.37
Graphical interpretation ofstandardized enthalpy, enthalpy offormation, and sensible enthalpy.
Example 2.25
Determine the standardized molar- and mass-specific enthalpies and entropiesof N2 and N at 3000 K and 2.5 atm.
Solution
Known N2, N, T, P
Find
Assumptions
Ideal-gas behavior
h, h, s, s
0521850436c02_p101-149.qxd 13/9/05 7:51 PM Page 139 Quark01A Quark01:BOOKS:CU/CB Jobs:CB925-Turns:Chapters:Chapter-02:

140 Thermal-Fluid Sciences
Analysis Tables B.7 and B.8 can be used to determine the molar-specificstandard-state enthalpies and entropies for N2 and N, respectively. Thestandard-state (1-atm) entropy can be converted to the value at 2.5 atmusing the molar-specific form of Eq. 2.39a.
The sum of the enthalpies of formation and sensible enthalpies are thestandardized enthalpies we seek (Eq. 2.70). At 3000 K, these values are
and
Since the standard-state pressure is 1 atm, application of Eq. 2.39a yields
or
Thus,
Using the values from Tables B.7 and B.8, we evaluate this equation asfollows:
and
To compute the mass-specific enthalpies and entropies, we divide the molar-specific values by the molecular weight of the respective species; for example,
The following table summarizes these calculations:
M h s(kg/kmol) (kJ/kmol) (kJ/kg) (kJ/kmolK) (kJ/kgK)
N2 28.013 92,730 3310.25 259.192 9.2526N 14.007 528,841 37,755 193.581 13.8203
Comments This example illustrates the use of the tables in Appendix B tocalculate standardized properties at temperatures and pressure not equal tothe reference-state values. Because we assume ideal-gas behavior, thepressure has no effect on the enthalpy and, furthermore, the entropy is asimple function of pressure (see Eq. 2.39a). The conversion from thereference-state pressure (1 atm) to the pressure at the desired state (2.5 atm)is thus straightforward.
sh
hN2�
h
MN2
�92,730 kJ/kmol
28.013 kg/kmol� 3310.25 kJ/kg.
sN � 201.199 � 8.31447ln 2.5 � 193.581 kJ/kmol K.
sN2� 266.810 � 8.31447 ln 2.5 � 259.192 kJ/kmol K
s (3000 K, 2.5 atm) � s �(3000 K) � Ruln 2.5.
s (T, P) � s �(T) � �Ru ln a P (atm)
1 atmb .
s (T, P) � s(T, 1 atm) � �Ru ln a P (atm)
1 atmb ,
� 472,628 kJ/kmol � 56,213 kJ/kmol � 528,841 kJ>kmol.
hN � h�f, N(298.15 K) � ¢hs, N(3000 K)
� 0 kJ/kmol � 92,730 kJ/kmol � 92,730 kJ/kmol
hN2� h�f, N2
(298.15 K) � ¢hs,N2(3000 K)
0521850436c02_p101-149.qxd 13/9/05 7:51 PM Page 140 Quark01A Quark01:BOOKS:CU/CB Jobs:CB925-Turns:Chapters:Chapter-02:

CH. 2 Thermodynamic Properties, Property Relationships and Processes 141
Self Test2.25 ✓ Determine the standardized mass-specific enthalpies and entropies of O and O2 at 2000 K
and atmospheric pressure. (Answer:
)sO � 12.571 kJ>kg KhO � 17,806.8 kJ�kg,sO2
� 8.396 kJ>kg K,hO2� 1,849.09 kJ>kg,
The analysis of a jet enginecombustor in Chapter 12
(Example 12.11) uses conceptsdeveloped here: mole and mass
fractions and standardizedproperties of ideal-gas mixtures.
➤
2.9d Calorific Relationships for Mixtures
The calorific relationships for ideal-gas mixtures are straightforward mass-fraction or mole-fraction weightings of the pure-species individual specificcalorific properties:
(2.71a)
(2.71b)
(2.71c)
(2.71d)
or
(2.71e)
(2.71f)
(2.71g)
(2.71h)
where the subscript i represents the ith species and J is the total number ofspecies in the mixture. Since the specific heats, internal energies, and enthalpiesof the constituent ideal-gas species depend only on temperature, the same is truefor the mixture calorific properties; for example, umix � umix (T only), etc.Molar-specific enthalpies for a number of species are tabulated in Appendix B.
2.9e Second-Law Relationships for Mixtures
The mixture entropy also is calculated as a weighted sum of the constituents:
(2.72a)
(2.72b) smix(T, P) � aJ
i�1Xisi
(T, Pi).
smix(T, P) � aJ
i�1Yisi
(T, Pi),
cp,mix � aJ
i�1Xicp, i,
cv,mix � aJ
i�1Xicv, i,
hmix � aJ
i�1Xihi,
umix � aJ
i�1Xiui,
cp, mix � aJ
i�1Yi
cp, i,
cv,mix � aJ
i�1Yicv,i,
hmix � aJ
i�1Yihi,
umix � aJ
i�1Yiui,
0521850436c02_p101-149.qxd 13/9/05 7:51 PM Page 141 Quark01A Quark01:BOOKS:CU/CB Jobs:CB925-Turns:Chapters:Chapter-02:

142 Thermal-Fluid Sciences
Unlike the ideal-gas calorific relationships, pressure is now required as asecond independent variable. Here the pure-species entropies (si and depend on the species partial pressures, as explicitly indicated in Eq. 2.72.Equation 2.39a can be applied to evaluate the constituent entropies in Eq. 2.72from standard-state (Pref � Po � 1 atm) values as
(2.73a)
(2.73b)
where Pi � XiP. Ideal-gas, standard-state molar-specific entropies aretabulated in Appendix B for several species.
The Gibbs function is an important second-law property that has manyuses in dealing with ideal-gas mixtures. For example, the Gibbs function isused to determine the equilibrium composition of reacting gas mixtures (seeChapter 7). Earlier in the present chapter (see Eq. 2.21) we defined theGibbs function as
G � H � TS,
or(2.74a)
(2.74b)
For an ideal-gas mixture, the mass- or molar-specific Gibbs function is aweighted sum of the pure-species mass- or molar-specific Gibbs functions:
(2.75a)
(2.75b)
where
(2.76a)
and
(2.76b)
The connection to the mixture composition is through the ideal-gasrelationship Pi � XiP (Eq. 2.66b).
2.10 SOME PROPERTIES OF REACTING MIXTURES
2.10a Enthalpy of Combustion
Knowing how to express the enthalpy for mixtures of reactants and mixturesof products allows us to define the enthalpy of reaction, or, when dealingspecifically with combustion reactions, the enthalpy of combustion. The
gi (T, Pi) � hi � T c s �i
(T) � Ru ln
Pi
P�d .
gi (T, Pi) � hi
(T) � Tsi (T, Pi) � hi
(T) � T c s�i (T) � R ln
Pi
P�d
gmix(T, P) � aJ
i�1Xigi
(T, Pi),
gmix(T, P) � aJ
i�1Yigi
(T, Pi),
g � h � T s.
g � h � Ts,
si (T, P) � si
(T, Pref) � Ru ln
Pi
Pref,
si (T, Pi) � si
(T, Pref) � Rln
Pi
Pref,
si)
0521850436c02_p101-149.qxd 13/9/05 7:51 PM Page 142 Quark01A Quark01:BOOKS:CU/CB Jobs:CB925-Turns:Chapters:Chapter-02:

CH. 2 Thermodynamic Properties, Property Relationships and Processes 143
A
298
C
B
∆HR = (−877,236) − (−74,831) = −802,405
Hprod (298) = −877,236
Hreac (298) = −74,831
H reac
H prod
T0
H (kJ)
Hot products
Cold reactants
at T1
A
Coldproducts
at T1
CB
CombustionHeat
removal
FIGURE 2.38
The enthalpy of reaction is illustratedusing values for the reaction of one mole of methane with astoichiometric quantity of air. Thewater in the products is assumed tobe in the vapor state.
definition of the enthalpy of reaction, or the enthalpy of combustion,�HR, is
HR(T) � Hprod(T) � Hreac(T), (2.77a)
where T may be any temperature, although a reference-state value of 298.15 Kis frequently used. The enthalpy of combustion is illustrated graphically inFig. 2.38. Note that the standardized enthalpy of the products lies below thatof the reactants. For example, at 25°C and 1 atm, the reactants’ enthalpy of astoichiometric mixture of CH4 and air is �74,831 kJ per kmol of fuel. At thesame conditions (25°C, 1 atm), the combustion products have a standardizedenthalpy of �877,236 kJ for the combustion of 1 kmol of fuel. Thus,
HR � �877,236 � (�74,831) � �802,405 kJ (per kmol CH4).
This value is usually expressed on a per-mass-of-fuel basis:
hR(kJ/kgfuel) � HR�Mfuel, (2.77b)
0521850436c02_p101-149.qxd 13/9/05 7:51 PM Page 143 Quark01A Quark01:BOOKS:CU/CB Jobs:CB925-Turns:Chapters:Chapter-02:

144 Thermal-Fluid Sciences
or
hR � (�802,405�16.043) � �50,016 kJ/kgfuel.
Note that the value of the enthalpy of combustion depends on thetemperature chosen for its evaluation. Because the enthalpies of both thereactants and products vary with temperature, the distance between the Hprod
and Hreac lines in Fig. 2.38 is not constant.
2.10b Heating Values
The heat of combustion, �hc (known also as the heating value), isnumerically equal to the enthalpy of reaction, but with opposite sign. Theupper or higher heating value, HHV, is the heat of combustion calculatedassuming that all of the water in the products has condensed to liquid. Inthis scenario, the reaction liberates the most amount of energy, henceleading to the designation “upper.” The lower heating value, LHV,corresponds to the case where none of the water is assumed to condense.For CH4, the upper heating value is approximately 11% larger than thelower one. Standard-state heating values for a variety of hydrocarbon fuelsare given in Appendix H.
Fuel heating values are usedto define the efficiency of
gas-turbine engines in Chapter 12.See Eq. 12.38.
➤
Methane, the largest component of natural gas,has a higher heating value of 55,528 kJ/kg.
Example 2.26
Determine the upper and lower heating values of gaseous n-decane(C10H22) for stoichiometric combustion with air at 298.15 K. For thiscondition, 15.5 kmol of O2 reacts with each kmol of C10H22 to produce10 kmol of CO2 and 11 kmol of H2O. Assume that air can be representedas a mixture of O2 and N2 in which there are 3.76 kmol of N2 for each kmolof O2. Express the results per unit mass of fuel. The molecular weight ofn-decane is 142.284.
Solution
Known T, compositions of reactant and product mixtures, MC10H22
Find hc (upper and lower)
Sketch
Productswith H2O(l )
Productswith H2O(g)
Reactants
298.15 KT
H
Fuelat
298 K
Airat
298 K
Productsat
298 K
0521850436c02_p101-149.qxd 13/9/05 7:51 PM Page 144 Quark01A Quark01:BOOKS:CU/CB Jobs:CB925-Turns:Chapters:Chapter-02:

CH. 2 Thermodynamic Properties, Property Relationships and Processes 145
Assumption
Ideal-gas behavior
Analysis For 1 kmol of C10H22, stoichiometric combustion can be expressedfrom the given information as (see also Eqs. 3.53 and 3.54):
C10H22(g) � 15.5 (O2 � 3.76 N2)
S 10 CO2 � 11 H2O (/ or g) � 15.5 (3.76) N2.
For either the upper or lower heating value,
Hc � �HR � Hreac � Hprod,
where the numerical value of Hprod depends on whether the H2O in theproducts is liquid (defining the higher heating value) or gaseous (definingthe lower heating value). The sensible enthalpy changes for all speciesinvolved are zero since we desire Hc at the reference state (298.15 K).Furthermore, the enthalpies of formation of the O2 and N2 are also zero at298.15 K. Recognizing that
we obtain
Note that the N2 contribution as a reactant cancels with the N2 contributionas a product. Table B.6 (Appendix B) gives the enthalpy of formation forgaseous water; the enthalpy of vaporization, hfg, is obtained from Table D.1or the NIST database. We thus calculate the enthalpy of formation of theliquid water as follows:
Using this value together with enthalpies of formation given in Appendices Band H, we obtain the higher heating value:
To express this on a per-mass-of-fuel basis, we need only divide by thenumber of moles of fuel in the combustion reaction and the fuel molecularweight, that is,
[�] kJ
kmol(kg/kmol)� kJ/kgfuel.
�6,829,975
(1) 142.284� 48,002
¢hc �¢Hc
MC10H22
�¢Hc
NC10H22MC10H22
[�] kmol a kJ
kmolb � kJ.
� 6,829,975
¢Hc,H2O (/) � (1)(�249,659) � [10(�393,546) � 11(�285,834)]
� �285,834 kJ/mol.
� �241,847 kJ/mol � (45,876 � 1889) kJ/mol
h�f,H2O(/) � h�f,H2O(g) � hfg
¢Hc,H2O(/) � HHV � (1)h�f,C10H22� �10h�f,CO2
� 11h�f,H2O(/)�.
Hreac � areac
Ni hi and Hprod � aprod
Ni hi,
Conservation of elements istreated in detail in Chapter 3. See
Example 3.14.
➤
0521850436c02_p101-149.qxd 13/9/05 7:51 PM Page 145 Quark01A Quark01:BOOKS:CU/CB Jobs:CB925-Turns:Chapters:Chapter-02:

146 Thermal-Fluid Sciences
For the lower heating value, we repeat these calculations using in place of The result is
Hc � 6,345,986 kJ
and
hc � 44,601 kJ/kgfuel.
Comment We note that the difference between the higher and lowerheating values is approximately 7%. What practical implications does thishave, say, for a home heating furnace?
h�f,H2O(/) � �285,834 kJ/kmol.�241,847 kJ/kmolh�f,H2O(g) �
Self Test2.26 ✓ Determine the enthalpy of reaction per unit mass of fuel for the conditions given in
Example 2.26 when the products are at a temperature of 1800 K.(Answer: hR � �14,114 kJ/kg fuel)
2.11 TRANSPORT PROPERTIES18
In addition to thermodynamic properties, we require transport properties tocharacterize many thermal-fluid systems. Of particular interest are the thermalconductivity k and the viscosity m. These two properties are not defined bythermodynamic analyses of systems in equilibrium, as are all of the properties
18 This section is appropriately used in conjunction with the study of conduction heat transfer inChapter 5 and viscous fluid flow in Chapter 6.
Common materials in order of decreasing thermal conductivity: pure gold, copper alloy, steel, stoneblock, ceramic tile, and fiberglass insulation.
Level 2
0521850436c02_p101-149.qxd 13/9/05 7:51 PM Page 146 Quark01A Quark01:BOOKS:CU/CB Jobs:CB925-Turns:Chapters:Chapter-02:

CH. 2 Thermodynamic Properties, Property Relationships and Processes 147
Nonmetallic solids
Insulation systems
Gases
Liquids
Alloys
Pure metals
HydrogenCarbon dioxide
Foams Fibers
MercuryWaterOils
Zinc Silver
Nickel Aluminum
Plastics Ice Oxides
Thermal conductivity (W/m.K)0.01 0.1 1 10 100 1000
FIGURE 2.39
Typical ranges of thermalconductivity values for gases, liquids,insulation systems, nonmetallicsolids, alloys, and pure metals.Adapted from Ref. [19] withpermission.
Chapter 4 discusses these threemodes of heat transfer:
conduction, convection, andRadiation.
➤
discussed previously, but result from the dynamic, or rate, processes ofthermal energy transfer and momentum transfer, respectively. Both thermalconductivity and viscosity can be predicted from models of the behavior ofatoms, molecules, and electrons in the solid, liquid, and gaseous states ofmatter. Other commonly used transport properties are related in simple waysto the thermal conductivity and the viscosity. For example, the thermaldiffusivity a(� k�rcp) is introduced in Chapter 5; the kinematic viscosity, alsoknown as the momentum diffusivity, n(� m�r), is introduced in Chapter 6.
2.11a Thermal Conductivity
Physically, thermal conductivity k is the proportionality factor relating therate of energy transfer per unit area by conduction, to its drivingpotential, the temperature gradient; that is,
(2.78a)
or
(2.78b)
The SI units associated with the thermal conductivity are
k [�] W/m K.
Figure 2.39 illustrates the wide range of thermal conductivity valuesassociated with various substances. From this figure, we see that gases havethe smallest magnitudes (say, 0.02–0.13 W/m K), liquids have intermediatevalues (say, 0.12–9 W/m K), and pure metals have the highest values (say,35–400 W/mK). Falling between the most conducting pure metal and theleast conducting gases are metal alloys and nonmetallic solids. Alsoindicated in Fig. 2.39 are insulation systems. These systems are neither puresubstances nor intimate mixtures of pure substances but, rather, complexnonhomogeneous systems comprised, for example, of fiberglass fibers andair-filled voids, or various layers of foils and/or fabrics. For these systems,the thermal conductivity is an effective conductivity since the energyexchange across a layer of such material results from the combined effectsof conduction, convection, and radiation.
Q#–cond � �k§T.
Q#–cond r � §T
Q#–cond,
0521850436c02_p101-149.qxd 13/9/05 7:51 PM Page 147 Quark01A Quark01:BOOKS:CU/CB Jobs:CB925-Turns:Chapters:Chapter-02:

148 Thermal-Fluid Sciences
In general, values of thermal conductivity depend on temperature, withweak, or essentially no, dependence on pressure. For gases, a simplekinetic-theory model of energy transfer can be used to explain thedependence of the thermal conductivity on temperature. In this model,molecules in regions of higher temperature have greater kinetic energiesthan nearby molecules in regions of lower temperature, where thedifferences in temperature are associated with the temperature gradient �T,or dT�dx for a 1-D system. With no net bulk motion, higher energymolecules collide with lower energy molecules, and vice versa. The neteffect is an energy transfer from high to low temperature, as expressed byEq. 2.78. Since the mechanism for energy transfer is the collision ofmolecules, we expect the energy transfer rate to be proportional to thecollision rate. The collision rate, in turn, is proportional to the number ofmolecules per unit density, N�V, and the mean molecular speed Amore complete analysis [1] shows that
where is the mean free path, the average distance traveled by amolecule between collisions. Because the mean free path is inverselyproportional to the number density N�V, the temperature and pressuredependence inherent in N�V (� T�P) cancels in our simple model forconductivity. We are left with the conductivity being proportional to themean molecular speed. The molecular speed, in turn, increases withtemperature and with a decrease in the mass and size of the moleculesinvolved. Thus, among the gases, small, light molecules, such as H2 or He,at high temperatures exhibit the greatest conductivity. Appendix Fprovides tabulations of k for a range of temperatures for various gases;values for air are given in Appendix C. The NIST software and onlinedatabase [11] can also be used to obtain values of thermal conductivity forselected gases (see Table 2.7).
The mechanism for energy transfer by conduction in liquids is similar tothat of gases, except that the range of interaction is much shorter and thestrength and frequency of the molecular collisions greater. Appendix Gpresents tabulations of k for water and a few other common liquids asfunctions of temperature. The NIST software and online database [11] alsoprovide values of k for selected liquids (see Table 2.7).
In solids, the mechanism for energy transfer by conduction is the combinedeffects of lattice waves and the flow of free electrons. In amorphous solids,lattice waves are essentially the sole mechanism, whereas, for metals, electronflow dominates the transport. For metal alloys and nonmetallic crystallinesolids, both mechanisms are important. Appendix I provides extensivetabulations of thermal conductivities for pure solids and for commonly usedengineering materials such as insulations and building materials.
2.11b Viscosity19
In analogy to energy transport by conduction, the viscosity m is theproportionality factor relating the rate at which momentum is transferred perunit area within a fluid to the application of a driving potential (i.e., a velocity
/mf
k r (N>V)vmolec/mf,
vmolec.
19 The viscosity as used here is sometimes referred to as the absolute viscosity or the coefficientof viscosity. These terms are used interchangeably.
0521850436c02_p101-149.qxd 13/9/05 7:51 PM Page 148 Quark01A Quark01:BOOKS:CU/CB Jobs:CB925-Turns:Chapters:Chapter-02:

CH. 2 Thermodynamic Properties, Property Relationships and Processes 149
gradient). Alternatively, the viscosity may be thought of as the proportionalityfactor in the stress–strain relationship associated with a fluid:
stress � strain rate, (2.79a)
orstress � m(strain rate). (2.79b)
The SI units of viscosity are N s/m2. For a more detailed definition ofviscosity, the reader is referred to Chapter 6.
Ideas or constructs similar to those discussed here for gases and liquidsapply to understanding viscosity except that, now, momentum transportreplaces energy transport, and the velocity gradient replaces the temperaturegradient. From such arguments, we again conclude that values of viscositydepend on temperature and are weakly sensitive, or insensitive, to pressure.Tabulations of viscosity are presented for air in Appendix C and for variousgases and various liquids in Appendices F and G, respectively. Again, valuesare also available from the NIST software and online database [11] forselected fluids. Note that, for a solid, viscosity has no meaning, and thestress–strain relationship is defined by Young’s modulus.
SUMMARY
This chapter introduced the reader to the myriad thermodynamic andthermophysical properties that are used throughout this book. The chapteralso showed how these properties relate to one another through equations ofstate, calorific equations of state, and second-law (or Gibbs) relationships.The concept of an ideal gas was presented, and methods were presented toobtain properties for substances that do not behave as ideal gases. Theproperties of H2O in both its liquid and vapor states were emphasized. Youshould be familiar with the use of both tables and computer-based resourcesto obtain property data for a wide variety of substances. You should also beproficient at sketching simple processes on thermodynamic coordinates. Amore detailed summary of this chapter can be obtained by reviewing thelearning objectives presented at the outset. It is recommended that you revisitthis chapter many times in the course of your study of later chapters.Appropriate junctures for return are indicated in subsequent chapters.
0521850436c02_p101-149.qxd 13/9/05 7:51 PM Page 149 Quark01A Quark01:BOOKS:CU/CB Jobs:CB925-Turns:Chapters:Chapter-02:

Chapter 2 Key Concepts & Definitions Checklist20
2.1 Key Definitions
❑ Property ➤ Q2.2
❑ State ➤ Q2.2
❑ Process ➤ Q2.2
❑ Pure substance ➤ Q2.3
❑ Simple compressible substance ➤ Q2.3
❑ Extensive and intensive properties ➤ Q2.6
❑ Mass- and molar-specific properties ➤ Q2.7
2.2 Frequently Used Thermodynamic Properties
❑ Common thermodynamic properties (list)
❑ Continuum limit ➤ Q2.5
❑ Absolute, gage, and vacuum pressures ➤ 2.3, 2.4
❑ Zeroth law of thermodynamics ➤ Q2.12
❑ Internal energy ➤ 2.17
❑ Enthalpy ➤ 2.18
❑ Constant-volume and constant-pressurespecific heats ➤ Q2.11
❑ Specific heat ratio ➤ Q2.13
❑ Entropy ➤ Q2.14
❑ Gibbs free energy or function ➤ Q2.15
2.3 Concept of State Relationships
❑ State principle ➤ Q2.8
❑ P–v –T relationships ➤ Q2.9, Q2.10
❑ Calorific relationships ➤ Q2.9, Q2.10
❑ Second-law relationships ➤ Q2.9, Q2.10, Q2.16
2.4 Ideal Gases as Pure Substances
❑ Ideal gas definition ➤ 2.23, 2.36
❑ Ideal-gas equation of state (Table 2.4) ➤ 2.27, 2.31
❑ Particular gas constant ➤ 2.36
❑ P–v and T–v diagrams ➤ 2.35
❑ u, cv, T relationships (Eqs. 2.31a–2.31e) ➤ 2.46
❑ h, cp, T relationships (Eqs. 2.33a–2.33e) ➤ 2.41,2.42
❑ u–T and h–T diagrams ➤ 2.22, 2.46
❑ T–dS relationships (Eqs. 2.35 and 2.36) ➤ Q2.21
❑ �s relationships (Eqs. 2.39 and 2.40) ➤ 2.54, 2.56
❑ Isentropic process relationships (Table 2.5) ➤ 2.57, 2.58
❑ T–s and P–v diagrams (Figs. 2.11 and 2.12) ➤ 2.59
❑ Polytropic processes ➤ 2.60
2.5 Nonideal Gas Properties
❑ Critical point ➤ Q2.24
❑ Use of tables and NIST databases ➤ 2.73, 2.74
❑ Van der Waals equation of state ➤ 2.75
❑ Generalized compressibility ➤ 2.72
2.6 Pure Substances Involving Liquid andVapor Phases
❑ Regions and phase boundaries ➤ Q2.27
❑ T–v and P–v diagrams ➤ Q2.28, 2.83
❑ Quality and liquid–vapor mixture properties ➤ Q2.25, 2.99
❑ Use of tables and NIST databases ➤ 2.79, 2.80
❑ T–s and h–s diagrams ➤ Q2.29
2.7 Liquid Property Approximations
❑ Specific volume, internal energy, and enthalpyapproximations ➤ 2.116
2.8 Solids
❑ Fusion and sublimation properties ➤ Q2.32
page 150
20 Numbers following arrows refer to Questions (prefaced with a Q) and Problems at the end of the chapter.
0521850436c02_p150-171.qxd 13/9/05 7:52 PM Page 150 Quark01A Quark01:BOOKS:CU/CB Jobs:CB925-Turns:Chapters:Chapter-02:

CH. 2 Thermodynamic Properties, Property Relationships and Processes 151
2.9 Ideal-Gas Mixtures
❑ Partial pressures and mole and volume fractions ➤ 2.126
❑ Standardized properties ➤ Q2.37, 2.132
❑ Enthalpy of formation ➤ Q2.38
❑ Sensible enthalpy change ➤ Q2.38
❑ Standard reference state (Table 2.8) ➤ Q2.39
❑ Mixture properties (Eqs. 2.71–2.76) ➤ 2.135
2.10 Some Properties of Reacting Mixtures
❑ Enthalpy of reaction ➤ 2.141, Q2.40
❑ Heat of combustion and higher and lowerheating values ➤ Q2.41, 2.143
2.11 Transport Properties ➤ 2.144
❑ Thermal conductivity
❑ Viscosity
REFERENCES
1. Reid, R. C., Prausnitz, J. M., and Poling, B. E., TheProperties of Gases and Liquids, 4th ed., McGraw-Hill,New York, 1987.
2. Halliday, D., and Resnick, R., Physics, combined 3rd ed.,Wiley, New York, 1978.
3. Kee, R. J., Rupley, F. M., and Miller, J. A., “The ChemkinThermodynamic Data Base,” Sandia National LaboratoriesReport SAND87-8215 B, March 1991.
4. Clausius, R., “The Second Law of Thermodynamics,” inThe World of Physics, Vol. 1 (J. H. Weaver, Ed.), Simon &Schuster, New York, 1987.
5. Stull, D. R., and Prophet, H., “JANAF ThermochemicalTables,” 2nd ed., NSRDS-NBS 37, National Bureau ofStandards, June 1971. (The 3rd ed. is available fromNIST.)
6. Gordon, S., and McBride, B. J., “Computer Program forCalculation of Complex Chemical Equilibrium Composi-tions, Rocket Performance, Incident and Reflected Shocks,and Chapman-Jouguet Detonations,” NASA SP-273, 1976.
7. Keenan, J. H., Keyes, F. G., Hill, P. G., and Moore, J. G.,Steam Tables: Thermodynamic Properties of WaterIncluding Vapor, Liquid & Solid Phases, Krieger,Melbourne, FL, 1992.
8. Irvine, T. F., Jr., and Hartnett, J. P. (Eds.), Steam and AirTables in SI Units, Hemisphere, Washington, DC, 1976.
9. NIST Thermodynamic and Transport Properties of PureFluids Database: Ver. 5.0, National Institute of Standardsand Technology, Gaithersburg, MD, 2000.
10. NIST/ASME Steam Properties Database: Ver. 2.2, NationalInstitute of Standards and Technology, Gaithersburg, MD,2000.
11. Linstrom, P., and Mallard, W. G. (Eds.), NIST Chemistry WebBook, Thermophysical Properties of Fluid Systems, National
Institute of Standards and Technology, Gaithersburg, MD,2000, http://webbook.nist.gov/chemistry/fluid.
12. Su, G.-J., “Modified Law of Corresponding States,”Industrial Engineering Chemistry, 38:803 (1946).
13. Obert, E. F., Concepts of Thermodynamics, McGraw-Hill, New York, 1960.
14. Haar, L., Gallagher, J. S., and Kell, G. S. S., NBS/NRCSteam Tables, Hemisphere, New York, 1984.
15. Atkins, P. W., Physical Chemistry, 6th ed., OxfordUniversity Press, Oxford, 1998.
16. Sears, F. W., Thermodynamics, Kinetic Theory, andStatistical Thermodynamics, Addision-Wesley, Reading,MA, 1975.
17. Wark, K., Thermodynamics, McGraw-Hill, New York,1966.
18. Webster’s New Twentieth Century Dictionary, Unabridged,2nd ed., Simon & Schuster, New York, 1983.
19. Incropera, F. P., and DeWitt, D. P., Fundamentals of Heatand Mass Transfer, 4th ed., Wiley, New York, 1996.
20. Moran, M. J., and Shapiro, H. N., Fundamentals ofEngineering Thermodynamics, 3rd ed., Wiley, New York,1995.
21. Van Wylen, G. J., Sonntag, R. E., and Borgnakke, C.,Fundamentals of Classical Thermodynamics, 4th ed.,Wiley, New York, 1994.
22. Myers, G. E., Engineering Thermodynamics, PrenticeHall, Englewood Cliffs, NJ, 1989.
Some end-of-chapter problems were adapted with permissionfrom the following:
23. Look, D. C., Jr., and Sauer, H. J., Jr., EngineeringThermodynamics, PWS, Boston, 1986.
0521850436c02_p150-171.qxd 13/9/05 7:52 PM Page 151 Quark01A Quark01:BOOKS:CU/CB Jobs:CB925-Turns:Chapters:Chapter-02:

Nomenclature
a Acceleration vector (m/s2)
a Specific Helmholtz free energy (J/kg orvan der Waals constant (Pa�m6/kmol2)
A Helmoltz free energy (J) or area (m2)
b Van der Waals constant (m3/kmol)
c Specific heat (J/kg�K)
cp Constant-pressure specific heat (J/kg�K)
Molar constant-pressure specific heat(J/kmol�K)
cv Constant-volume specific heat (J/kg�K)
Molar constant-volume specific heat(J/kmol�K)
e Specific energy (J/kg)
Molar-specific energy (J/kmol)
E Energy (J)
F Force (N)
g Specific Gibbs function (J/kg)
Molar-specific Gibbs function(J/kmol)
G Gibbs function (J)
h Specific enthalpy (J/kg)
Molar-specific enthalpy (J/kmol)
H Enthalpy (J)
HHV Higher heating value (J/kgfuel)
k Thermal conductivity (W/m�K)
kB Boltzmann constant, 1.3806503 �10�23 (J/K)
/mf Mean free path (m)
LHV Lower heating value (J/kgfuel)
M Mass (kg)
M Molecular weight (kg/kmol)
mu Unified atomic mass unit (kg)
n Number of particles or polytropicexponent (dimensionless)
N Number of moles (kmol)
h
g
e
cv
cp
NAV Avagodro’s number (see Eq. 2.7)
P Pressure (Pa)
Conduction heat flux (W/m2)
R Particular gas constant (J/kg�K)
Ru Universal gas constant,8,314.472 (J/kmol�K)
s Specific entropy (J/kg�K)
Molar-specific entropy (J/kmol�K)
S Entropy (J/K)
t Time (s)
T Temperature (K)
u Specific internal energy (J/kg)
Molar-specific internal energy (J/kmol)
U Internal energy (J)
v Velocity (m/s)
Mean molecular speed (m/s)
v Specific volume (m3/kg)
Molar-specific volume (m3/kmol)
V Volume (m3)
x Quality (dimensionless) or spatialcoordinate (m)
X Mole fraction (dimensionless)
y Spatial coordinate (m)
Y Mass fraction (dimensionless)
z Spatial coordinate (m)
Z Compressibility factor, Pv�RT(dimensionless)
GREEK
� Arbitrary property
� Specific-heat ratio (dimensionless)
� Difference or increment
�HR Enthalpy of reaction (or ofcombustion) (J)
v
vmolec
u
s
Q#
��cond
page 152
0521850436c02_p150-171.qxd 13/9/05 7:52 PM Page 152 Quark01A Quark01:BOOKS:CU/CB Jobs:CB925-Turns:Chapters:Chapter-02:

CH. 2 Thermodynamic Properties, Property Relationships and Processes 153
�hR Enthalpy of reaction (or of combustion)per mass of fuel (J/kgfuel)
�hc Heat of combustion or heating value(J/kgfuel)
� Viscosity (N�s/m2)
� Density (kg/m3)
SUBSCRIPTS
abs absolute
atm atmospheric
avg average
c critical
f fluid (liquid) or formation
fg difference between saturated vapor andsaturated liquid states
g gas (vapor)
gage gage
i species i
liq liquid
mix mixture
molec molecule
prod products
reac reactants
ref reference state
rot rotational
s sensible
sat saturated state
sublim sublimation
tot total
trans translational
vac vacuum
vap vapor
vib vibrational
SUPERSCRIPTS
� Denotes standard-state pressure (P� �1 atm)
0521850436c02_p150-171.qxd 13/9/05 7:52 PM Page 153 Quark01A Quark01:BOOKS:CU/CB Jobs:CB925-Turns:Chapters:Chapter-02:

154 Thermal-Fluid Sciences
QUESTIONS
2.1 Review the most important equations presented inthis chapter (i.e., those with a red background).What physical principles do they express? Whatrestrictions apply?
2.2 Discuss how the following concepts are related:properties, states, and process.
2.3 Distinguish between a pure substance and a simplecompressible substance.
2.4 Explain the continuum limit to a classmate.
2.5 Without direct reference to any textbook, write anexplanation of the continuum limit.
2.6 Explain the difference between extensive andintensive properties. List five (or more) propertiesof each type.
2.7 How do the properties u and differ? Theproperties v and ?
2.8 Write out the state principle for a simple compressiblesubstance.
2.9 Explain the distinction between an equation of stateand a calorific equation of state.
2.10 What are the three types of thermodynamic staterelationships? What properties are typically used ineach?
2.11 Distinguish between constant-volume and constant-pressure specific heats.
2.12 What is the practical significance of the zeroth lawof thermodynamics?
2.13 Define the specific-heat ratio. What Greek symbolis used to denote this ratio?
2.14 Write out a qualitative definition of thethermodynamic property entropy.
2.15 Using symbols, define the Gibbs free energy (orfunction) in terms of other thermodynamic properties.
2.16 Consider an ideal gas. Indicate which of thefollowing thermodynamic properties are pressuredependent: density, specific volume, molar-specificinternal energy, mass-specific enthalpy, mass-specific entropy, constant-volume specific heat, andconstant-pressure specific heat.
2.17 Sketch two isotherms on a P–v plot for an ideal gas.Label each where T2 � T1.
2.18 Sketch two isobars on a T–v plot for an ideal gas.Label each where P2 � P1.
2.19 What is the microscopic interpretation of internalenergy for a monatomic gas?
2.20 What is the microscopic interpretation of internalenergy for a gas comprising diatomic molecules?
vu
2.21 Write out the so-called first and second Gibbs (orT–dS) relationships.
2.22 List fluids that you know are used as working fluidsin thermal-fluid devices.
2.23 Compare your list of fluids from Question 2.22with the fluids for which property data are availablefrom the NIST online database.
2.24 What is the physical significance of the criticalpoint? Locate the critical point on a P–v diagram.
2.25 Write out a physical interpretation of thethermodynamic property quality.
2.26 Explain the meaning of quality to a classmate.
2.27 Draw from memory (or familiarity) a T–v diagram forH2O. Show an isobar that begins in the compressed-liquid region and ends in the superheated-vaporregion. Label all lines and regions and indicate thecritical point.
2.28 Draw from memory (or familiarity) a P–v diagram forH2O. Show an isotherm that begins in the compressed-liquid region and ends in the superheated-vaporregion. Label all lines and regions and indicate thecritical point.
2.29 Draw from memory (or familiarity) a T–s diagramfor H2O. Show an isobar that begins in thecompressed-liquid region and ends in thesuperheated-vapor region. Also draw an isothermthat crosses your isobar at a state well within thesuperheated-vapor region. Label each.
2.30 Explain the principle of corresponding states andhow this principle relates to the use of thegeneralized compressibility chart.
2.31 List and explain the factors that result in thebreakdown of the application of the ideal-gasapproximation to real gases.
2.32 Distinguish between the enthalpy of fusion and theenthalpy of sublimation.
2.33 Consider an ideal-gas mixture. Explain thedifferences and similarities among the followingmeasures of composition: mole fraction, volumefraction, and mass fraction.
2.34 How does the partial pressure of a constituent in anideal-gas mixture relate to the mole fraction of thatconstituent?
2.35 Compare and contrast Dalton’s and Amagat’s viewsof an ideal-gas mixture.
2.36 Explain in words how the mass-specific and molar-specific enthalpies of an ideal-gas mixture relate tothe corresponding properties of the constituentspecies.
0521850436c02_p150-171.qxd 13/9/05 7:52 PM Page 154 Quark01A Quark01:BOOKS:CU/CB Jobs:CB925-Turns:Chapters:Chapter-02:

CH. 2 Thermodynamic Properties, Property Relationships and Processes 155
2.40 What is the sign (positive or negative) associatedwith the enthalpy of reaction for exothermicreactions? For endothermic reactions? Explain.
2.41 Explain what is meant by the heating value of afuel. What distinguishes the “higher” heating valuefrom the “lower” heating value?
2.37 Explain the concept of standardized propertiesapplied to chemically reacting systems.
2.38 Distinguish between enthalpies of formation andsensible enthalpies.
2.39 List the conditions that define the standardreference state for properties of species involved inreacting systems.
PROBLEMS
2.1 The specific volume of water vapor at 150 kPa and120°C is 1.188 m3/kg. Determine the molar-specificvolume and the density of the water vapor.
2.2 Determine the number of molecules in 1 kg of water.
2.3 An air compressor fills a tank to a gage pressure of100 psi. The barometric pressure is 751 mm Hg. Whatis the absolute pressure in the tank in kPa?
Chapter 2 Problem Subject Areas
2.1–2.16 State properties: definitions, units, and conversions2.17–2.22 Calorific properties: definitions and units2.23–2.39 Ideal gases: equation of state2.40–2.56 Ideal gases: calorific and second-law state relationships2.57–2.71 Ideal gases: isentropic and polytropic processes2.72–2.78 Real gases: tabulated properties, generalized compressibility, and van der Waals
equation of state2.79–2.114 Pure substances with liquid and vapor phases2.115–2.116 Liquid property approximations2.117–2.118 Solids2.119–2.125 Ideal-gas mixtures: specifying composition2.126–2.131 Ideal-gas mixtures: P–vv–T relationships2.132–2.133 Ideal-gas mixtures: standardized properties2.134–2.140 Ideal-gas mixtures: enthalpies and entropies2.141–2.143 Ideal-gas mixtures: enthalpy of combustion and heating values2.144–2.145 Transport properties
barometric pressure is 1 standard atmosphere?Express your result in psia, mm Hg, and Pa.
2.5 Find the specific volume (in both ft3/lbm and m3/kg)of 45 lbm of a substance of density 10 kg/m3, wherethe acceleration of gravity is 30 ft/s2.
2.6 Assume that a pressure gage and a barometer read227.5 kPa and 26.27 in Hg, respectively. Calculatethe absolute pressure in psia, psfa (pounds-force persquare foot absolute), and atm.
Pgage
Tank
2.4 An instrument used to measure the concentration ofthe pollutant nitric oxide uses a vacuum pump tocreate a vacuum of 28.3 in Hg in a reaction chamber.What is the absolute pressure in the chamber if the
0521850436c02_p150-171.qxd 13/9/05 7:52 PM Page 155 Quark01A Quark01:BOOKS:CU/CB Jobs:CB925-Turns:Chapters:Chapter-02:

156 Thermal-Fluid Sciences
2.7 The pressure in a partially evacuated enclosure is26.8 in Hg vacuum when the local barometer reads29.5 in Hg. Determine the absolute pressure in inHg, psia, and atm.
2.8 A vertical cylinder containing air is fitted with apiston of 68 lbm and cross-sectional area of 35 in2.The ambient pressure outside the cylinder is 14.6 psiaand the local acceleration due to gravity is 31.1 ft/s2.What is the air pressure inside the cylinder in psia andin psig?
2.9 The accompanying sketch shows a compartmentdivided into two sections a and b. The ambientpressure Pamb is 30.0 in Hg (absolute). Gage C reads620,528 Pa and gage B reads 275,790.3 Pa.Determine the reading of gage A and convert thisreading to an absolute value.
2.10 A cylinder containing a gas is fitted with a pistonhaving a cross-sectional area of 0.029 m2.Atmospheric pressure is 0.1035 MPa and theacceleration due to gravity is 30.1 ft/s2. To producean absolute pressure in the gas of 0.1517 MPa, whatmass (kg) of piston is required?
2.11 For safety, cans of whipped cream (with propellant)should not be stored above 120 F. What is thistemperature expressed on the Rankine, Celsius, andKelvin temperature scales?
a
b
B
A
C
PambPamb
2.12 Albuterol inhalers, used for the control of asthma,are to be stored and used between 15°C and 30°C.What is the acceptable temperature range on theFahrenheit scale?
2.13 How fast, on average, do nitrogen molecules travelat room temperature (25°C)? How does this speedcompare to the average speed of a modern jetaircraft that travels 2500 miles in 5 hours?
2.14 A thermometer reads 72 F. Specify the temperaturein °C, K, and R.
2.15 Convert the following Celsius temperatures toFahrenheit: (a) �30°C, (b) �10°C, (c) 0°C,(d) 200°C, and (e) 1050°C.
2.16 At what temperature are temperatures expressed inFahrenheit and Celsius numerically equal?
2.17 At 600 K and 0.10 MPa, the mass-specific internalenergy of water vapor is 2852.4 kJ/kg and thespecific volume is 2.7635 m3/kg. Determine thedensity and mass-specific enthalpy of the watervapor. Also determine the molar-specific internalenergy and enthalpy.
2.18 At 0.3 MPa, the mass-specific internal energy andenthalpy of a substance are 3313.6 J/kg and 3719.2J/kg, respectively. Determine the density of thesubstance at these conditions.
2.19 A tank having a volume of 2 m3 contains 6.621 kgof water vapor at 1 MPa. The internal energy of thewater vapor is 19,878 J. Determine the density, themass-specific internal energy, and the mass-specificenthalpy of the water vapor.
0521850436c02_p150-171.qxd 13/9/05 7:52 PM Page 156 Quark01A Quark01:BOOKS:CU/CB Jobs:CB925-Turns:Chapters:Chapter-02:

CH. 2 Thermodynamic Properties, Property Relationships and Processes 157
2.20 The constant-volume molar-specific heat ofnitrogen (N2) at 1000 K is 24.386 kJ/kmol�K andthe specific-heat ratio g is 1.3411. Determine theconstant-pressure molar-specific heat and theconstant-pressure mass-specific heat of the N2.
2.21 For temperatures between 300 and 1000 K and at1 atm, the molar specific enthalpy of O2 isexpressed by the following polynomial:
�4.19614 � 10�8 T3 4.4382025 � 10�12 T4
�2.27287 � 10�16 T5 � 1233.9301),
where is expressed in kJ/kmol and T in kelvins.Determine the constant-pressure molar-specific
heat at 500 K and at 1000 K. Compare themagnitudes of the values at the two temperaturesand discuss. Also determine cp, the constant-pressure mass-specific heat.
2.22 Plot a graph of the molar specific enthalpy for O2
given in Problem 2.21 for the temperature range300–1000 K (i.e., plot versus T). (Spreadsheetsoftware is recommended.) Use your plot tographically determine at 500 K and at 1000 K.Use a pencil and ruler to perform this operation.How do these estimated values for compare withyour computations in Problem 2.21?
2.23 What is the mass of a cubic meter of air at 25�C and1 atm?
cp
cp
hO2
cp
h
hO2� Ru(3.697578 T 3.0675985 � 10�4 T2
B. Assume to a first approximation that the dragforce exerted on a well-hit baseball arcing to theoutfield, or beyond, is proportional to the airdensity. Discuss the implications of this for ballshit at Mile High Stadium in Denver versus ballshit in Yankee Stadium in New York (which is atsea level).
H2O vaporM = 6.621 kgP = 1 MPaU = 19,878 J
Tank= 2 m3
Air1 atm25°C1 m
1 m
1 m
2.24 A. Determine the density of air at Mile HighStadium in Denver, Colorado, on a warmsummer evening when the temperature is 78 F.The barometric pressure is 85.1 kPa.
2.25 A compressor pumps air into a tank until a pressuregage reads 120 psi. The temperature of the air is 85 F,and the tank is a 0.3-m-diameter cylinder 0.6 m long.Determine the mass of the air contained in the tankin grams.
Pgage = 120 psi
0.3 m dia.
0.6 m
CO
Steel cylinder(tank)
2.26 Determine the number of kmols of carbon monoxidecontained in a 0.027-m3 compressed-gas cylinder at200 psi and 72 F. Assume ideal-gas behavior.
0521850436c02_p150-171.qxd 13/9/05 7:52 PM Page 157 Quark01A Quark01:BOOKS:CU/CB Jobs:CB925-Turns:Chapters:Chapter-02:
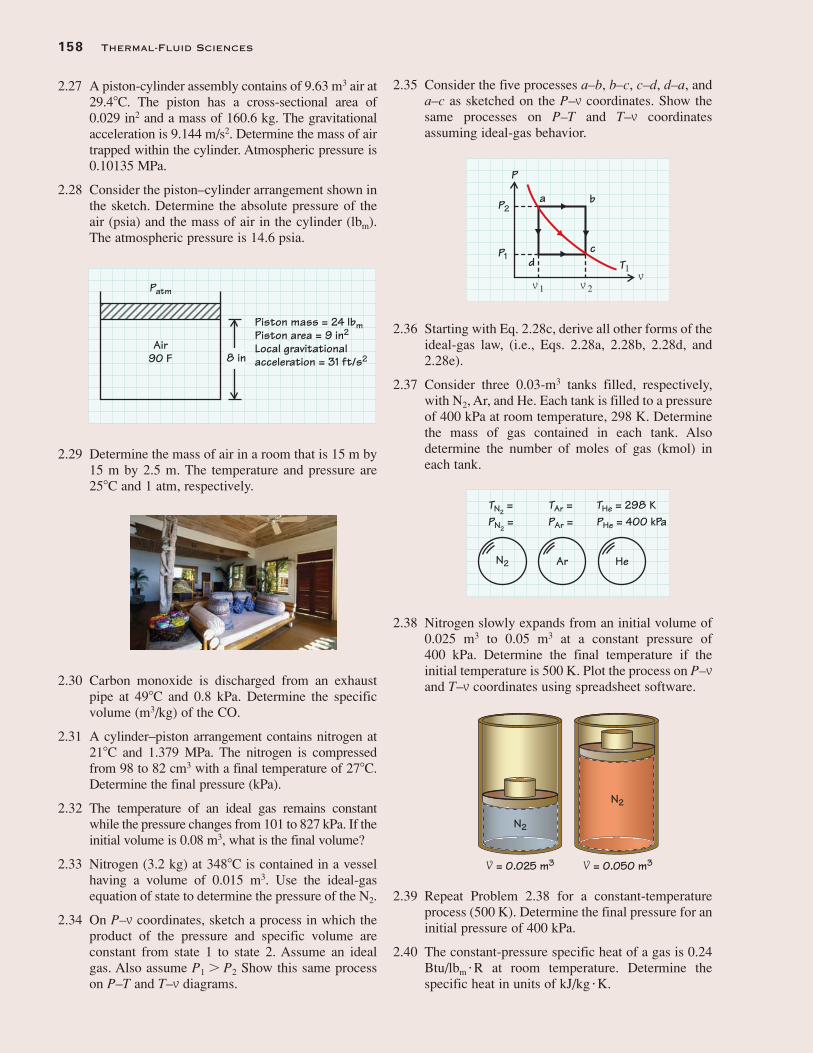
158 Thermal-Fluid Sciences
2.27 A piston-cylinder assembly contains of 9.63 m3 air at29.4�C. The piston has a cross-sectional area of0.029 in2 and a mass of 160.6 kg. The gravitationalacceleration is 9.144 m/s2. Determine the mass of airtrapped within the cylinder. Atmospheric pressure is0.10135 MPa.
2.28 Consider the piston–cylinder arrangement shown inthe sketch. Determine the absolute pressure of theair (psia) and the mass of air in the cylinder (lbm).The atmospheric pressure is 14.6 psia.
2.35 Consider the five processes a–b, b–c, c–d, d–a, anda–c as sketched on the P–v coordinates. Show thesame processes on P–T and T–v coordinatesassuming ideal-gas behavior.
Air90 F 8 in
Piston mass = 24 lbmPiston area = 9 in2
Local gravitationalacceleration = 31 ft/s2
Patm
2.29 Determine the mass of air in a room that is 15 m by15 m by 2.5 m. The temperature and pressure are25�C and 1 atm, respectively.
2.30 Carbon monoxide is discharged from an exhaustpipe at 49�C and 0.8 kPa. Determine the specificvolume (m3/kg) of the CO.
2.31 A cylinder–piston arrangement contains nitrogen at21�C and 1.379 MPa. The nitrogen is compressedfrom 98 to 82 cm3 with a final temperature of 27�C.Determine the final pressure (kPa).
2.32 The temperature of an ideal gas remains constantwhile the pressure changes from 101 to 827 kPa. If theinitial volume is 0.08 m3, what is the final volume?
2.33 Nitrogen (3.2 kg) at 348�C is contained in a vesselhaving a volume of 0.015 m3. Use the ideal-gasequation of state to determine the pressure of the N2.
2.34 On P–v coordinates, sketch a process in which theproduct of the pressure and specific volume areconstant from state 1 to state 2. Assume an idealgas. Also assume P1 � P2 Show this same processon P–T and T–v diagrams.
2.36 Starting with Eq. 2.28c, derive all other forms of theideal-gas law, (i.e., Eqs. 2.28a, 2.28b, 2.28d, and2.28e).
2.37 Consider three 0.03-m3 tanks filled, respectively,with N2, Ar, and He. Each tank is filled to a pressureof 400 kPa at room temperature, 298 K. Determinethe mass of gas contained in each tank. Alsodetermine the number of moles of gas (kmol) ineach tank.
2.38 Nitrogen slowly expands from an initial volume of0.025 m3 to 0.05 m3 at a constant pressure of400 kPa. Determine the final temperature if theinitial temperature is 500 K. Plot the process on P–vand T–v coordinates using spreadsheet software.
P
P2
P1
a b
cd T1
v 1 v 2v
N2
TN2 = PN2
= TAr = PAr =
THe = 298 KPHe = 400 kPa
Ar He
N2
N2
V = 0.025 m3 V = 0.050 m3
2.39 Repeat Problem 2.38 for a constant-temperatureprocess (500 K). Determine the final pressure for aninitial pressure of 400 kPa.
2.40 The constant-pressure specific heat of a gas is 0.24Btu/lbm �R at room temperature. Determine thespecific heat in units of kJ/kg �K.
0521850436c02_p150-171.qxd 13/9/05 7:52 PM Page 158 Quark01A Quark01:BOOKS:CU/CB Jobs:CB925-Turns:Chapters:Chapter-02:

CH. 2 Thermodynamic Properties, Property Relationships and Processes 159
2.41 Compute the mass-specific enthalpy changeassociated with N2 undergoing a change in statefrom 400 to 800 K. Assume the constant-pressurespecific heat is constant for your calculation. Usethe arithmetic average of values at 400 and 800 Kfrom Table B.7.
2.42 Compare the specific enthalpy change calculated inProblem 2.41 with the change determined directlyfrom the ideal-gas tables (Table B.7). Also comparethese values with that obtained from the NISTsoftware or online database at 1 atm.
2.43 Use Table C.2 to calculate the mass-specific enthalpychange for air undergoing a change of state from 300to 1000 K. How does this value compare with thatestimated using the constant-pressure specific heat atthe average temperature, Tavg � (300 1000)�2?
2.44 Determine the mass-specific internal energy for O2 at900 K for a reference-state temperature of 298.15 K.Also determine the constant-volume specific heat(mass basis).
2.45 Hydrogen is compressed in a cylinder from 101 kPaand 15°C to 5.5 MPa and 121°C. Determine �v, �u,�h, and �s for the process.
2.46 As air flows across the cooling coil of an airconditioner at the rate of 3856 kg/hr, its temperaturedrops from 26°C to 12°C. Determine the internalenergy change in kJ/hr. Plot the process on h–Tcoordinates.
2.47 Air cools an electronics compartment by entering at60 F and leaving at 105 F. The pressure is essentiallyconstant at 14.7 psia. Determine (a) the change ininternal energy of the air as it flows through thecompartment and (b) the change in specific volume.
D. Change in entropy (Btu/R)E. Change in internal energy (Btu)
2.49 In a closed (fixed-mass) system, an ideal gasundergoes a process from 75 psia and 5 ft3 to 25 psiaand 9.68 ft3. For this process, �H � �62 Btu andcv ,avg � 0.754 Btu/ lbm � R. Determine (a) �U,(b) cp,avg, and (c) the specific gas constant R.
2.50 In a fixed-mass system, 4 lbm of air is heated atconstant pressure from 30 psia and 40 F to 140 F.Determine the change in internal energy (Btu) forthis process assuming Btu/lbmol�Rand k � 1.4.
2.51 Use Table C.2 to calculate the mass-specificentropy change for air undergoing a change of statefrom 300 to 1000 K. The initial and final pressuresare both 1 atm.
2.52 Calculate the mass-specific enthalpy and entropychanges for air undergoing a change of state from400 K and 2 atm to 800 K and 7.2 atm.
2.53 Air is compressed in the compressor of a turbojetengine. The air enters the compressor at 270 K and58 kPa and exits the compressor at 465 K and350 kPa. Determine the mass-specific enthalpy,internal energy, and entropy changes associatedwith the compression process.
cv, avg � 4.96
2.48 Nitrogen is compressed adiabatically in a cylinderhaving an initial volume of 0.25 ft3. The initialpressure and temperature are 20 psia and 100 F,respectively. The final volume is 0.1 ft3 and the finalpressure is 100 psia. Assuming ideal-gas behavior andusing average specific heats, determine the following:
A. Final temperature (F)B. Mass of nitrogen (lbm)C. Change in enthalpy (Btu)
N2 N2
State 1 State 2
T1 = 400 KP1 = 5 atm
T2 = 300 K
Air in Air out
270 K58 kPa
465 K350 kPa
2.54 Consider 0.3 kg of N2 in a rigid container at 400 Kand 5 atm. The N2 is cooled to 300 K. Determine thespecific entropy change of the N2 associated withthis cooling process.
2.55 A fixed mass of air undergoes a state change from400 K and 1 atm to 500 K and 1.5 atm. Determine thespecific entropy change associated with this process.
0521850436c02_p150-171.qxd 13/9/05 7:52 PM Page 159 Quark01A Quark01:BOOKS:CU/CB Jobs:CB925-Turns:Chapters:Chapter-02:
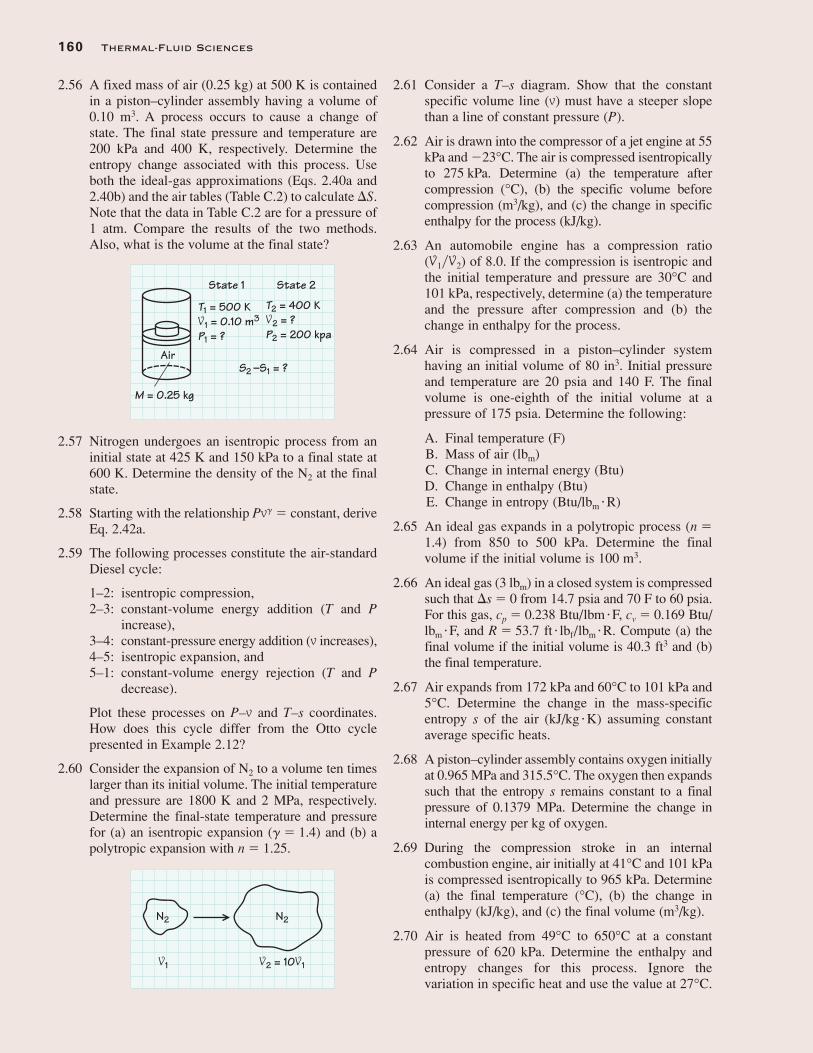
160 Thermal-Fluid Sciences
2.56 A fixed mass of air (0.25 kg) at 500 K is containedin a piston–cylinder assembly having a volume of0.10 m3. A process occurs to cause a change ofstate. The final state pressure and temperature are200 kPa and 400 K, respectively. Determine theentropy change associated with this process. Useboth the ideal-gas approximations (Eqs. 2.40a and2.40b) and the air tables (Table C.2) to calculate �S.Note that the data in Table C.2 are for a pressure of1 atm. Compare the results of the two methods.Also, what is the volume at the final state?
2.61 Consider a T–s diagram. Show that the constantspecific volume line (v) must have a steeper slopethan a line of constant pressure (P).
2.62 Air is drawn into the compressor of a jet engine at 55kPa and �23°C. The air is compressed isentropicallyto 275 kPa. Determine (a) the temperature aftercompression (°C), (b) the specific volume beforecompression (m3/kg), and (c) the change in specificenthalpy for the process (kJ/kg).
2.63 An automobile engine has a compression ratio(V1�V2) of 8.0. If the compression is isentropic andthe initial temperature and pressure are 30°C and101 kPa, respectively, determine (a) the temperatureand the pressure after compression and (b) thechange in enthalpy for the process.
2.64 Air is compressed in a piston–cylinder systemhaving an initial volume of 80 in3. Initial pressureand temperature are 20 psia and 140 F. The finalvolume is one-eighth of the initial volume at apressure of 175 psia. Determine the following:
A. Final temperature (F)B. Mass of air (lbm)C. Change in internal energy (Btu)D. Change in enthalpy (Btu)E. Change in entropy (Btu/lbm �R)
2.65 An ideal gas expands in a polytropic process (n �1.4) from 850 to 500 kPa. Determine the finalvolume if the initial volume is 100 m3.
2.66 An ideal gas (3 lbm) in a closed system is compressedsuch that �s � 0 from 14.7 psia and 70 F to 60 psia.For this gas, cp � 0.238 Btu/lbm�F, cv � 0.169 Btu/lbm�F, and R � 53.7 ft� lbf/lbm�R. Compute (a) thefinal volume if the initial volume is 40.3 ft3 and (b)the final temperature.
2.67 Air expands from 172 kPa and 60°C to 101 kPa and5°C. Determine the change in the mass-specificentropy s of the air (kJ/kg �K) assuming constantaverage specific heats.
2.68 A piston–cylinder assembly contains oxygen initiallyat 0.965 MPa and 315.5°C. The oxygen then expandssuch that the entropy s remains constant to a finalpressure of 0.1379 MPa. Determine the change ininternal energy per kg of oxygen.
2.69 During the compression stroke in an internalcombustion engine, air initially at 41°C and 101 kPais compressed isentropically to 965 kPa. Determine(a) the final temperature (°C), (b) the change inenthalpy (kJ/kg), and (c) the final volume (m3/kg).
2.70 Air is heated from 49°C to 650°C at a constantpressure of 620 kPa. Determine the enthalpy andentropy changes for this process. Ignore thevariation in specific heat and use the value at 27°C.
Air
M = 0.25 kg
State 1
T1 = 500 KV1 = 0.10 m3
P1 = ?
State 2
T2 = 400 KV2 = ?P2 = 200 kpa
S2 –S1 = ?
2.57 Nitrogen undergoes an isentropic process from aninitial state at 425 K and 150 kPa to a final state at600 K. Determine the density of the N2 at the finalstate.
2.58 Starting with the relationship Pvg � constant, deriveEq. 2.42a.
2.59 The following processes constitute the air-standardDiesel cycle:
1–2: isentropic compression,2–3: constant-volume energy addition (T and P
increase),3–4: constant-pressure energy addition (v increases),4–5: isentropic expansion, and5–1: constant-volume energy rejection (T and P
decrease).
Plot these processes on P–v and T–s coordinates.How does this cycle differ from the Otto cyclepresented in Example 2.12?
2.60 Consider the expansion of N2 to a volume ten timeslarger than its initial volume. The initial temperatureand pressure are 1800 K and 2 MPa, respectively.Determine the final-state temperature and pressurefor (a) an isentropic expansion (g� 1.4) and (b) apolytropic expansion with n � 1.25.
N2 N2
V1 V2 = 10V1
0521850436c02_p150-171.qxd 13/9/05 7:52 PM Page 160 Quark01A Quark01:BOOKS:CU/CB Jobs:CB925-Turns:Chapters:Chapter-02:

CH. 2 Thermodynamic Properties, Property Relationships and Processes 161
Also determine the percentage error associated withthe use of this constant specific heat.
2.71 Air expands through a air turbine from inletconditions of 690 kPa and 538°C to an exit pressureof 6.9 kPa in an isentropic process. Determine theinlet specific volume, the outlet specific volume,and the change in specific enthalpy.
2.72 Determine the density of methane (CH4) at 300 K and40 atm. Compare results obtained by assuming ideal-gas behavior, by using the generalized compressibilitychart, and by using the NIST software or onlinedatabase. Discuss.
2.73 Compare the value of the specific volume ofsuperheated steam at 2 MPa and 500 K found inAppendix D with that calculated assuming ideal-gas behavior. Discuss.
2.74 Consider steam. Plot the 500-K isotherm in P–vspace using the NIST online database as your datasource. Also plot on the same graph the 500-Kisotherm assuming ideal-gas behavior. Start(actually end) the isotherm at the saturated vaporline. Use a sufficiently large range of pressures sothat the real isotherm approaches the fictitiousideal-gas isotherm at large specific volumes. Usespreadsheet software for your calculations and plot.
2.79 Given the following property data for H2O designatethe region in T–v or P–v space (i.e., compressedliquid, liquid–vapor mixture, superheated vapor, etc.)and find the value(s) of the requested property orproperties. Use the tables in Appendix D or the NISTdatabase as necessary. Provide units with youranswers.
P
v
T = 500 K
2.75 Use the van der Waals equation of state todetermine the density of propane (C3H8) at 400 Kand 12.75 MPa. How does this value compare withthat obtained from the NIST online database?
2.76 Carbon dioxide (CO2) is heated in a constant-pressureprocess from 15°C and 101.3 kPa to 86°C Determine,per unit mass, the changes in (a) enthalpy, (b) internalenergy, (c) entropy, and (d) volume all in SI units.
2.77 A large tank contains nitrogen at �65°C and91 MPa. Can you assume that this nitrogen is anideal gas? What is the specific volume error in thisassumption?
2.78 Is steam at 10 MPa and 500°C an ideal gas? Discuss.
T
v
??
?
A. T � 310 K, v � 22.903 m3/kgRegion � ?P � ?
B. T � 310 K, v � 15 m3/kgRegion � ?h � ?
C. T � 310 K, P � 10 kPaRegion � ?v � ?
D. T � 310 K, P � 4 kPaRegion � ?u � ?
E. T � 647.096 K, P � 22.064 MPaRegion � ?v � ?
F. T � 800 K, P � 25 MPaRegion � ?r � ?
G. T � 800 K, P � 5 MPaRegion � ?s � ?
H. T � 743.2 K, P � 4.61 MPaRegion � ?h � ?
2.80 Determine the remaining properties for each of thefollowing states of H2O:
A. P � ? psia B. P � 200 psiaT � 200 F T � ? Fv � ? ft3/lbm v � ? ft3/lbm
h � ? Btu/lbm h � ? Btu/lbm
u � ? Btu/lbm u � 480 Btu/lbm
s � 1.87 Btu/lbm �R s � ? Btu/lbm �R
0521850436c02_p150-171.qxd 13/9/05 7:52 PM Page 161 Quark01A Quark01:BOOKS:CU/CB Jobs:CB925-Turns:Chapters:Chapter-02:

162 Thermal-Fluid Sciences
C. P � 2000 psia D. P � 1 psiaT � 100 F T � 100 Fv � ? ft3/lbm v � ? ft3/lbm
h � ? Btu/lbm h � ? Btu/lbm
s � ? Btu/lbm �R s � ? Btu/lbm �R
E. P � ? kPa F. P � 1379 kPaT � 95 °C T � ? °Cv � ? m3/kg v � ? m3/kgh � ? kJ/kg h � 1116.5 kJ/kgs � 1.28933 kJ/kg �K s � ? kJ/kg �K
G. P � 6.895 kPa H. P � 13,979 kPaT � 38 °C T � 38 °Cv � ? m3/kg v � ? m3/kgh � ? kJ/kg h � ? kJ/kgs � ? kJ/kg �K s � ? kJ/kg �K
2.81 A. At room temperature (25°C), what pressure (inboth kPa and psi) is required to liquefy propane(C3H8)?
B. Determine values of the specific volume of thesaturated vapor and saturated liquid. Alsodetermine their ratios.
C. Determine hfg for these same conditions.
v � m3/kg v � m3/kgh � kJ/kg h � kJ/kgs � kJ/kg �K s � 4.000 kJ/kg�K
G. P � kPa H. P � kPaT � 500 °C T � 200 °Cv � 0.1161 m3/kg v � m3/kgh � kJ/kg h � 1500 kJ/kgs � kJ/kg �K s � kJ/kg �K
2.84 Steam in a boiler has an enthalpy of 2558 kJ/kg andan entropy of 6.530 kJ/kg�K. What is its internalenergy in kJ/kg?
2.85 Water at 30 psig is heated from 62 to 115 F.Determine the change in enthalpy in Btu/lbm.
2.86 A hot water heater has 2.0 gal/min entering at 50 Fand 40 psig. The water leaves the heater at 160 Fand 39 psig. Determine the change in enthalpy inBtu/lbm.
2.87 Water at 6.90 MPa and 95°C enters the steam-generating unit of a power plant and leaves the unitas steam at 6.90 MPa and 850°C. Determine thefollowing properties in SI units:
Inlet Outletv � ? m3/kg v � ? m3/kgh � ? kJ/kg h � ? kJ/kgu � ? kJ/kg u � ? kJ/kgs � ? kJ/kg �K s � ? kJ/kg �K
Region: ? Region: ?
2.88 In a proposed automotive steam engine, the steamafter expansion would reach a state at which thepressure is 20 psig and the volume occupied perpound mass is 4.8 ft3. Atmospheric pressure is 15psia. Determine the following properties of thesteam at this state:T � ? Fu � ? Btu/lbm
Region: ?
2.89 A water heater operating under steady-flow con-ditions delivers 10 liters/min at 75�C and 370 kPa.The input conditions are 10�C and 379 kPa. What arethe corresponding changes in internal energy and en-thalpy per kilogram of water supplied?
2.90 Water at 3.4 MPa is pumped through pipes em-bedded in the concrete of a large dam. The water, inpicking up the heat of hydration of the curing,increases in temperature from 10�C to 40�C. Deter-mine (a) the change in enthalpy (kJ/kg) and (b) thechange in entropy of the water (kJ/kg �K).
2.91 Steam enters the condenser of a modern powerplant with a temperature of 32�C and a quality of0.98 (98% by mass vapor). The condensate (water)leaves at 7 kPa and 27�C. Determine the change in
T = 25°CP = ?
C3H8 vapor
C3H8 liquid
2.82 Plot the 1-atm isobar for H2O on T–v coordinates.Start in the compressed-liquid region, continueacross the liquid-vapor dome, and end well into thesuperheated-vapor region. Hint: Use a log scale forspecific volume.
2.83 For H2O complete the following:
A. P � 1000 psia B. P � 30 psiaT � 150 F T � 150 Fv � ft3/lbm v � ft3/lbm
h � Btu/lbm h � Btu/lbm
s � Btu/lbm �R s � Btu/lbm �R
C. P � psia D. P � 30 psiaT � 250 F T � Fv � ft3/lbm v � 1.4 ft3/lbm
h � Btu/lbm h � Btu/lbm
s � 1.21 Btu/lbm �R s � Btu/lbm �R
E. P � 200 kPa F. P � 400 kPaT � 600 °C T � °C
0521850436c02_p150-171.qxd 13/9/05 7:52 PM Page 162 Quark01A Quark01:BOOKS:CU/CB Jobs:CB925-Turns:Chapters:Chapter-02:

CH. 2 Thermodynamic Properties, Property Relationships and Processes 163
specific volume between inlet and outlet of thecondenser in m3/kg.
2.92 What is the temperature or quality of H2O in thefollowing states?
A. 20�C, 2000 kJ/kg (u)B. 2 MPa, 0.1 m3/kgC. 140�C, 0.5089 m3/kgD. 4 MPa, 25 kg/m3
E. 2 MPa, 0.111 m3/kg
2.93 Wet steam exits a turbine at 50 kPa with a quality of0.83. Determine the following properties of the wetsteam: T, v, h, u, and s. Give units.
2.97 A 0.6-m3 tank contains 0.2 kg of H2O at 350 K.Determine the pressure in the tank and theenthalpy of the H2O.
2.98 A 7.57-m3 rigid tank contains 0.546 kg of H2O at37.8�C. The H2O is then heated to 204.4�C.Determine (a) the initial and final pressures of theH2O in the tank (MPa) and (b) the change ininternal energy (kJ).
2.99 A 2.7-kg mass of H2O is in a 0.566-m3 container(liquid and vapor in equilibrium) at 700 kPa.Calculate (a) the volume and mass of liquid and(b) the volume and mass of vapor in the container.
2.100 Consider 0.25 kg of steam contained in a rigidcontainer at 600 K and 4 MPa. The steam is cooledto 300 K. Determine the entropy change of theH2O associated with this cooling process. Note:Find S2 � S1, not s2 � s1.
T
S
h = 2600 kJ/kg
375 K
2.94 Wet steam at 375 K has a specific enthalpy of2600 kJ/kg. Determine the quality of the mixtureand the specific entropy s.
2.95 Consider H2O at 1 MPa. Plot the following pro-perties as a function of quality x: T(K), h (kJ/kg),s (kJ/kg�K), and v (m3/kg). Discuss.
2.96 Steam is condensing in the shell of a heat exchangerat 305 K under steady conditions. The volume ofthe shell is 2.75 m3. Determine the mass of theliquid in the shell if the specific enthalpy of themixture is 2500 kJ/kg.
Steam in
Steam out
Pexit = 50 kPaxexit = 0.83
Steamturbine
Steam in
Condensateout
Coolingwater
Vshell = 2.75 m3
H2OM = 0.2 kgT = 350 K
Rigid tankV = 0.6 m3
Rigidtank
SteamM = 0.25 kg
State 1
T1 = 600 KP1 = 4 MPa
State 2
T2 = 300 K
0521850436c02_p150-171.qxd 13/9/05 7:52 PM Page 163 Quark01A Quark01:BOOKS:CU/CB Jobs:CB925-Turns:Chapters:Chapter-02:

164 Thermal-Fluid Sciences
2.101 Steam expands isentropically from 2 MPa and500 K to a final state in which the steam issaturated vapor. What is the temperature of thesteam at the final state?
2.107 Determine the specific entropy of evaporation ofsteam at standard atmospheric pressure (kJ/kg�K).
2.108 A liquid–vapor mixture of H2O at 2 MPa is heatedin a constant-volume process. The final state is thecritical point. Determine the initial quality of theliquid-vapor mixture.
2.109 An 85-m3 rigid vessel contains 10 kg of water(both liquid and vapor in thermal equilibrium at apressure of 0.01 MPa). Calculate the volume andmass of both the liquid and vapor.
2.110 Determine the moisture content (1 � x) of thefollowing:
H2O: 400 kPa, h � 1700 kJ/kgH2O: 1850 lbf/in2, s � 1 Btu/lbm�RR-134a: 10 F, 40 lbm/ft3
2.111 Determine the moisture content of the following:
H2O: h = 950 Btu/lbm, s = 1.705 Btu/lbm�FH2O: h � 1187.7 Btu/lbm, 0.38714 ft3/lbm
R-134a: 59 F, 0.012883 ft3/lbm
2.112 Consider 0.136 kg of H2O (liquid and vapor inequilibrium) contained in a vertical piston–cylinderarrangement at 50�C, as shown in the sketch.Initially, the volume beneath the 113.4-kg piston(area of 11.15 cm2) is 0.03 m3. With an atmos-pheric pressure of 101.325 kPa (g � 9.14 m/s2), thepiston rests on the stops. Energy is transferred tothis arrangement until there is only saturated vaporinside.
T
s
2
1
2.102 Steam expands isentropically from 2 MPa and500 K to a final state in which the quality is 0.90.Determine the final-state temperature, pressure,and specific volume.
T
s
2
1
2.103 Steam expands isentropically from 6 MPa and1000 K to 1 MPa. Determine the temperature at thefinal state. Also determine the specific enthalpychange for the process, (i.e., h2 � h1).
2.104 A piston–cylinder assembly contains steam initiallyat 0.965 MPa and 315.6�C. The steam then expandsin an isentropic process to a final pressure of0.138 MPa. Determine the change in specificinternal energy (kJ/kg and Btu/lbm).
2.105 A rigid vessel contains saturated R-22 at 15.6�C.Determine (a) the volume and mass of liquid and(b) the volume and mass of vapor at the pointnecessary to make the R-22 pass through thecritical state (or point) when heated.
2.106 Determine the specific enthalpy (Btu/lbm) ofsuperheated ammonia vapor at 1.3 MPa and 65�C.Use the NIST database.
A. Show this process on a T–V diagram.B. What is the temperature of the H2O when the
piston first rises from the stops?
2.113 H2O expands isentropically through a steam turbinefrom inlet conditions of 700 kPa and 550�C to anexit pressure of 7 kPa. Determine the specificvolume and specific enthalpy at both the inlet andoutlet conditions.
Vapor
Liquid
0521850436c02_p150-171.qxd 13/9/05 7:52 PM Page 164 Quark01A Quark01:BOOKS:CU/CB Jobs:CB925-Turns:Chapters:Chapter-02:

CH. 2 Thermodynamic Properties, Property Relationships and Processes 165
2.114 Fifty kilograms of H2O liquid and vapor in equili-brium at 300�C occupies a volume of m3. What isthe percentage of liquid, that is, the moisture con-tent, 1 � x?
2.115 Consider water at 400 K and a pressure of 5 atm.Estimate the enthalpy of the water using thesaturated liquid tables from Appendix D.Compare this result with the value obtained fromthe NIST database or the compressed liquid tablesin Appendix D. Repeat for the density.
2.116 Water exits a water pump at 13.7 MPa and 172�C.Use Eqs. 2.53a–2.53c to estimate the specificvolume, internal energy, and enthalpy of the water.Compare with the exact values obtained from theNIST database and calculate the percent errorassociated with each.
2.120 Determine the apparent molecular weight ofsynthetic air created by mixing 1 kmol of O2 with3.76 kmol of N2. Also determine the mole andmass fractions of the O2 in the mixture.
2.117 Consider a block of pure aluminum measuring 25 �300 � 200 mm. Estimate the change in internal en-ergy associated with a temperature change from 600to 400 K.
2.118 Formally show that cp � cv for an incompressiblesolid.
2.119 A mixture of ideal gases contains 1 kmol of CO2,2 kmol of H2O, 0.1 kmol of O2, and 7.896 kmol ofN2. Determine the mole fractions and the massfractions of each constituent. Also determine theapparent molecular weight of the mixture.
Mixture :1 kmol CO22 kmol H2O 0.1 kmol O27.896 kmol N2
Synthetic air
O2
N2
2.121 On a hot (95 F) summer day the relative humidityreaches an uncomfortable 85%. At this condition,the water vapor mole fraction is 0.056. Treating themoist air as an ideal-gas mixture of water vaporand dry air, determine the mass fraction of water
vapor and the apparent molecular weight of themoist air. Treat the dry air as a simple substancewith a molecular weight of 28.97 kg/kmol.
Pump
H2O
Pexit = 13.7 MPa Texit = 172°C
0521850436c02_p150-171.qxd 13/9/05 7:52 PM Page 165 Quark01A Quark01:BOOKS:CU/CB Jobs:CB925-Turns:Chapters:Chapter-02:

166 Thermal-Fluid Sciences
2.122 A 0.5-m3 rigid vessel contains 1 kg of carbonmonoxide and 1.5 kg of air at 15�C. Thecomposition of the air on a mass basis is 23.3% O2
and 76.7% N2. What are the partial pressures (kPa)of each component?
2.123 A gas mixture of O2, N2, and CO2 contains 5.5, 3,and 1.5 kmol of each species, respectively. Deter-mine volume fractions of each component. Alsodetermine the mass (kg) and molecular weight(kg/kmol) of the mixture.
2.124 For air containing 75.53% N2, 23.14% O2, 1.28%Ar, and 0.05% CO2, by mass, determine the gasconstant and its molecular weight. How do thesevalues compare if the mass-based composition is76.7% N2 and 23.3% O2?
2.125 The gravimetric (mass) analysis of a gaseousmixture yields CO2 � 32%, O2 � 56.5%, and N2
� 11.5%. The mixture is at a pressure of 3 psia.Determine (a) the volumetric composition and(b) the partial pressure of each component.
2.126 A 17.3-liter tank contains a mixture of argon,helium, and nitrogen at 298 K. The argon andhelium mole fractions are 0.12 and 0.35, respec-tively. If the partial pressure of the nitrogen is 0.8atm, determine (a) the total pressure in the tank,(b) the total number of moles (kmol) in the tank,and (c) the mass of the mixture in the tank.
a 42.8-liter tank at 1500 psig and 298 K. Theatmospheric pressure is 100 kPa. Determine (a) thepartial pressure of each constituent in the tank and(b) the total mass of the mixture. Assume ideal-gasbehavior for the mixture.
2.128 A rigid tank contains 5 kg of O2, 8 kg of N2, and10 kg of CO2 at 100 kPa and 1000 K. Assume thatthe mixture behaves as an ideal gas. Determine (a)the mass fraction of each component, (b) the molefraction of each component, (c) the partial pressureof each component, (d) the average molar mass(apparent molecular weight) and the gas constant ofthe mixture, and (e) the volume of the mixture in m3.
Mixture : XAr = 0.12XHe = 0.35XN2
= ?
TankV = 17.3 l
2.127 An instrument for the analysis of trace hydrocarbonsin air, or in the products of combustion, uses a flameionization detector. The flame in this device isfueled by a mixture of 40% (vol.) hydrogen and60% (vol.) helium. The fuel mixture is contained in
40% H260% Heat1500 psig298 K
Patm = 100 kPa
TankV = 42.8 l
Mixture :5 kg O28 kg N210 kg CO2
Rigidtank
P = 100 kPaT = 1000 K
2.129 A 3-ft3 rigid vessel contains a 50–50 mixture of N2
and CO (by volume). Determine the mass of eachcomponent for T � 65 F and P � 30 psia.
2.130 A 1-m3 tank contains nitrogen at 30�C and 500kPa. In an isothermal process, CO2 is forced intothis tank until the pressure is 1000 kPa. What isthe mass (kg) of each gas present at the end of thisprocess?
2.131 A 0.08-m3 rigid vessel contains a 50–50 (byvolume) mixture of nitrogen and carbon monoxideat 21�C and 2.75 MPa. Determine the mass of eachcomponent.
2.132 Determine the standardized enthalpies and entropiesof the following pure species at 4 atm and 2500 K:H2, H2O, and OH.
2.133 Use the curve-fit coefficients for the standardizedenthalpy from Table H.2 to verify the enthalpies offormation at 298.15 K in Table H.1 for methane,propane, and hexane.
2.134 Determine the total standardized enthalpy H (kJ) fora fuel–air reactant mixture containing 1 kmol CH4,2.5 kmol O2, and 9.4 kmol N2 at 500 K and 1 atm.Also determine the mass-specific standardizedenthalpy h (kJ/kg) for this mixture.
2.135 A mixture of products of combustion contains thefollowing constituents at 2000 K: 3 kmol of CO2,4 kmol of H2O, and 18.8 kmol of N2.
0521850436c02_p150-171.qxd 13/9/05 7:52 PM Page 166 Quark01A Quark01:BOOKS:CU/CB Jobs:CB925-Turns:Chapters:Chapter-02:

CH. 2 Thermodynamic Properties, Property Relationships and Processes 167
Determine the following quantities:
A. The mole fraction of each constituent in themixture
B. The total standardized enthalpy H of the mixtureC. The mass-specific standardized enthalpy h of
the mixture
2.141 In the stoichiometric combustion of 1 kmol of meth-ane with air (2 kmol of O2 and 7.52 kmol of N2).the following combustion products are formed:1 kmol CO2, 2 kmol H2O, and 7.52 kmol N2. TheH2O is in the vapor state. Determine the following:
A. The enthalpy of reaction (kJ)B. The apparent molecular weight of the product
mixtureC. The enthalpy of reaction per mass of mixtureD. The enthalpy of reaction per mass of fuel
2.142 Repeat Problem 2.141 for the stoichiometriccombustion of propane with air where thefollowing reaction occurs:
C3H8 5(O2 3.76N2) S 3CO2 4H2O 18.8 N2.
2.143 Determine the higher and lower heating values forthe stoichiometric combustion of methane with air(see Problem 2.141) and for the combustion ofpropane with air (see Problem 2.142).
Mixture :3 kmol CO24 kmol H2O18.8 kmol N2
T = 2000 K
2.136 Calculate the change in entropy for mixing 2 kmolof O2 with 6 kmol of N2. Both species are initiallyat 1 atm and 300 K, as is the final mixture.
2 kmolO2
6 kmolN2
O2–N2 mixture
P = 1 atmT = 300 K
2.137 A mixture of 15% CO2, 12% O2, and 73% N2, (byvolume) expands to a final volume six times greaterthan its initial volume. The corresponding temper-ature change is 1000�C to 750�C. Determine theentropy change (kJ/kg�K).
2.138 Determine the change in entropy (kJ/kg �K) of amixture of 60% N2 and 40% CO2 by volume for areversible adiabatic increase in volume by a factorof 5. The initial temperature is 540�C.
2.139 A partition separating a chamber into two compart-ments is removed. The first compartment initiallycontains oxygen at 600 kPa and 100�C; the secondcompartment initially contains nitrogen at the samepressure and temperature. The oxygen compartmentvolume is twice that of the one containing nitrogen.The chamber is isolated from the surroundings.Determine the change of entropy associated with themixing of the O2 and N2. Hint: Assume that theprocess is isothermal.
2.140 Consider two compartments of the same chamberseparated by a partition. Both compartmentscontain nitrogen at 600 kPa and 100�C; however,the volume of one compartment is twice that ofthe other. The partition is removed. Assuming thechamber is isolated from the surroundings,determine the entropy change of the N2 associatedwith this process.
LHV = ?
298 KT
H
HHV = ?
Reactants
Products with H2O vaporProducts with H2O liquid
2.144 Use the NIST software or online database todetermine the thermal conductivity k and theviscosity m of H2O for the following conditions.Express your results in SI units.
A. 1 MPa and 300 KB. 1 MPa and 400 KC. 0.1 MPa and 300 KD. 3 kPa and 300 K
2.145 Use the NIST online database to determine thethermal conductivity k and viscosity m of N2 forthe following conditions. Express your results inSI units.
A. 1 atm and 300 KB. 1 atm and 500 KC. 1 atm and 1000 KD. 2 atm and 1000 KE. 5 atm and 1000 KF. 100 atm and 1000 K
Use your results to discuss the influence oftemperature and pressure on the thermal conductivityand viscosity of N2.
0521850436c02_p150-171.qxd 13/9/05 7:52 PM Page 167 Quark01A Quark01:BOOKS:CU/CB Jobs:CB925-Turns:Chapters:Chapter-02:

Appendix 2AMolecular Interpretation of Entropy
The purpose of this appendix is to introduce the reader to a molecularinterpretation of entropy without getting bogged down in details. A rigorousdevelopment can be found in Ref. [16], for example, and a very readableelementary treatment is provided by Wark [17].
We begin by stating our final result that the entropy S is given by thefollowing expression:
S � kBlnWmp, (2A.1)
where kB is Boltzmann's constant and Wmp is the most probable thermodynamicprobability, a concept that requires some elaboration. Continuing to workbackward, we define the thermodynamic probability as the number ofmicrostates associated with a given macrostate. We are now at the heart of thisissue: What do we mean by a microstate or by a macrostate? Answering thesequestions allows us to come full circle back to Eq. 2A.1, our statistical definitionof entropy.
To understand the concepts of microstates and macrostates, we consider anisolated group of N particles comprising our thermodynamic system.Furthermore, we assume that the individual particles in our system havevarious energy levels, , as dictated by quantum mechanics. Although anyindividual particle may have any particular allowed energy, the system energymust remain fixed and is constrained by
(2A.2)
where Ni is the number of particles that have the specific energy level . Wecontinue now with a specific, but hypothetical, example in which our systemcontains only three particles, A, B, and C, and has a total system energy of sixunits, or quanta. Furthermore, we assume that the allowed energy levels areequally spaced intervals of one unit, beginning with unity. Thus, anyindividual particle can have energy of one, two, three, or four quanta. Clearly,energy levels above four are disallowed because, if one or more particlespossessed this energy, the overall system constraint of six units would beviolated. For example, if particle A possesses five units, the least possibletotal system energy is seven units, since the least energy particles B and C canpossess is one unit (5 1 1 � 7)
We now consider the number of ways the overall system can be configured,assuming particles A, B, and C are distinguishable. Using Table 2A.1 as aguide, we see that there are a total of ten ways that our three particles can bearranged while maintaining the total system energy at six units. Each one ofthese ten arrangements is identified as a microstate. We further note that some
ei
a Ni ei � U,
ei
page 168
0521850436c02_p150-171.qxd 13/9/05 7:52 PM Page 168 Quark01A Quark01:BOOKS:CU/CB Jobs:CB925-Turns:Chapters:Chapter-02:

CH. 2 Thermodynamic Properties, Property Relationships and Processes 169
of these microstates are similar; if we remove the restriction that A, B, and Care distinguishable, there are six identical microstates in which one particlepossesses three units of energy, another particle possesses two units of energy,and the third particle possesses one unit. The identification of a state purely byenumeration of the number of particles at each energy level without regard tothe identification of the individual particle is defined as a macrostate.Employing this definition, we see that there are two other macrostatesassociated with our system: macrostate 2, in which one particle has four unitsof energy and two particles possess one unit, and macrostate 3, in which eachparticle has two units of energy. The probability of our system being found ina particular macrostate is related to the number of microstates comprising themacrostate. For our example, there are six internal arrangements that can beidentified with macrostate 1, three for macrostate 2, and only one arrangementpossible for macrostate 3.
Recall that one of our goals at the outset of this discussion was tounderstand the definition of thermodynamic probability as the number ofmicrostates associated with a given macrostate. We come to closure on thisgoal by generalizing and defining the thermodynamic probability W for asystem containing a total of N particles as follows:
(2A.3)W �N!
N1! N2! . . . Ni! . . . NM
,
Table 2A.1 Macrostates and Microstates Associated with a System ofThree Particles and a Total Energy of Six Units
Macrostate 1
4 — — — — — —3 A B C B A C2 B A A C C B1 C C B A B A
6 6 6 6 6 6
Macrostate 2
4 A B C3 — — —2 — — —1 B,C A,C B,A
6 6 6
Macrostate 3
4 —3 —2 A,B,C1 —
6
W � 1
a Ni ei �
ei
W � 3
a Ni ei �
ei
W � 6
a Ni ei �
ei
0521850436c02_p150-171.qxd 13/9/05 7:52 PM Page 169 Quark01A Quark01:BOOKS:CU/CB Jobs:CB925-Turns:Chapters:Chapter-02:

170 Thermal-Fluid Sciences
where Ni represents the number of particles having energies associated withthe ith energy level. For our example, formal application of Eq. 2A.3 to thethree macrostates shown in Table 2A.1 yields (recognizing that 0! � 1)
and
If we normalize these results by the total number of microstates, aconventional concept of probability gives us:
and
Thus we see that the probability of finding the system in macrostate 1 is 0.6,whereas the probability of finding the system in macrostates 2 and 3 are 0.3and 0.1, respectively. As the number of particles increases, the probability ofthe most probable macrostate overwhelms that of all of the other possiblemacrostates.
We conclude our discussion of entropy with two observations. First, thepractical evaluation of the defining relationship for entropy (Eq. 2A.1)requires a knowledge of how particles in a macroscopic system distributeamong all of the allowed energy states (i.e., quantum levels) to determine themost probable thermodynamic probability. Various theories provide suchdistribution functions (e.g., Maxwell–Boltzmann, Bose–Einstein, and Fermi-Dirac statistics). Discussion of these is beyond the scope of this book and theinterested reader is referred to Refs. [16, 17], for example. Our secondobservation is that Boltzmann's definition of entropy (Eq. 2A.1) does indeedsay something about “disorder” as being a favored condition.21 By definition,the most probable macrostate is the one that has the greatest number ofmicrostates. We can view this most probable macrostate as a state ofmaximum “disorder”—there is no other possible state that has as manydifferent possible arrangements of particles.
P3 �W3
W1 W2 W3� 0.1.
P2 �W2
W1 W2 W3� 0.3,
P1 �W1
W1 W2 W3� 0.6,
W3 �3!
0! 3! 0! 0!� 1.
W2 �3!
2! 0! 0! 1!� 3,
W1 �3!
1! 1! 1! 0!� 6,
21 The idea of disorder is frequently invoked in nontechnical definitions of entropy. Forexample, one dictionary definition of entropy is a measure of the degree of disorder in asubstance or a system [18].
0521850436c02_p150-171.qxd 13/9/05 7:52 PM Page 170 Quark01A Quark01:BOOKS:CU/CB Jobs:CB925-Turns:Chapters:Chapter-02:

0521850436c02_p150-171.qxd 13/9/05 7:52 PM Page 171 Quark01A Quark01:BOOKS:CU/CB Jobs:CB925-Turns:Chapters:Chapter-02: