thermodynamic structure of tropical cyclones from aircraft reconnaissance kay shelton university at...
Post on 21-Dec-2015
227 views
TRANSCRIPT
Thermodynamic Structure Thermodynamic Structure of Tropical Cyclones From of Tropical Cyclones From Aircraft ReconnaissanceAircraft Reconnaissance
Kay SheltonUniversity at Albany/SUNY,
Albany, New York
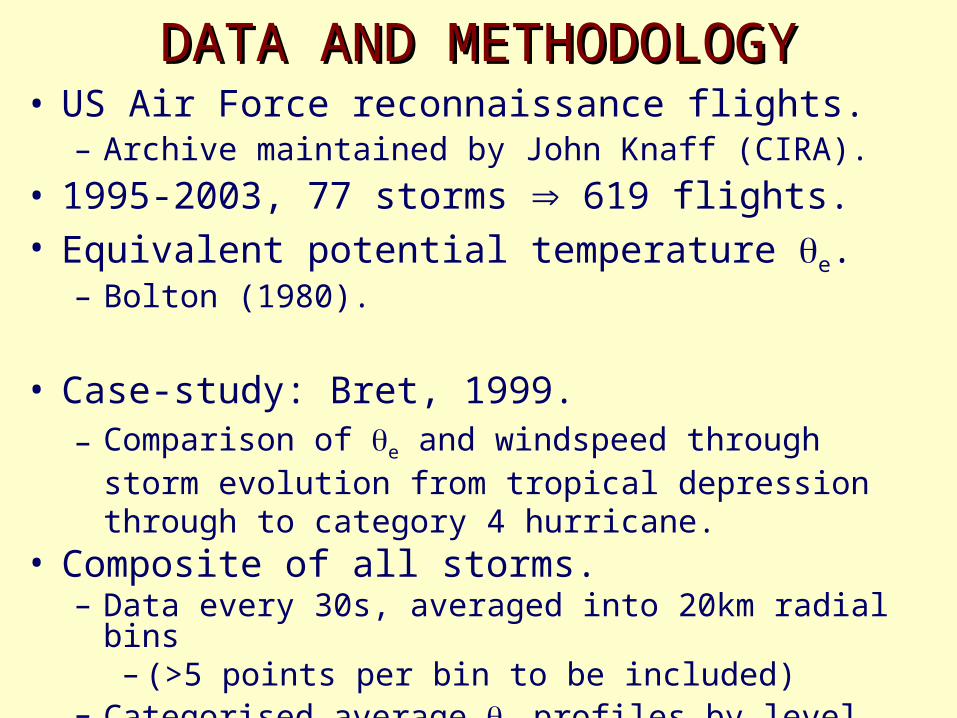
• US Air Force reconnaissance flights.– Archive maintained by John Knaff (CIRA).
• 1995-2003, 77 storms 619 flights.• Equivalent potential temperature e.
– Bolton (1980).
• Case-study: Bret, 1999.– Comparison of e and windspeed through storm
evolution from tropical depression through to category 4 hurricane.
• Composite of all storms.– Data every 30s, averaged into 20km radial bins
– (>5 points per bin to be included)– Categorised average e profiles by level and
intensity.
DATA AND METHODOLOGYDATA AND METHODOLOGY
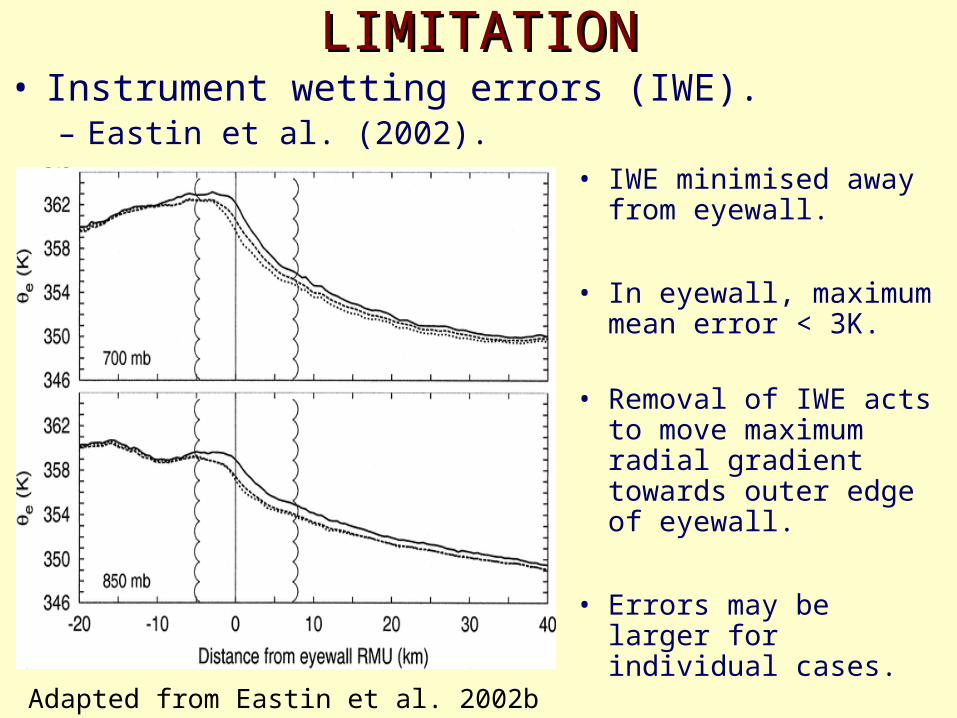
• Instrument wetting errors (IWE). – Eastin et al. (2002).
LIMITATIONLIMITATION
Adapted from Eastin et al. 2002b
• IWE minimised away from eyewall.
• In eyewall, maximum mean error < 3K.
• Removal of IWE acts to move maximum radial gradient towards outer edge of eyewall.
• Errors may be larger for individual cases.
• Hurricane Bret, 1999.
– Organised to TD at 18Z on 18th August, in Bay of Campeche.
– Bret strengthened to category 4, then decreased to category 3 prior to landfall on Padre Island, TX at 00Z on 23rd August.
– Scatter plots of e and windspeed in six flights will be shown.
CASE STUDYCASE STUDY
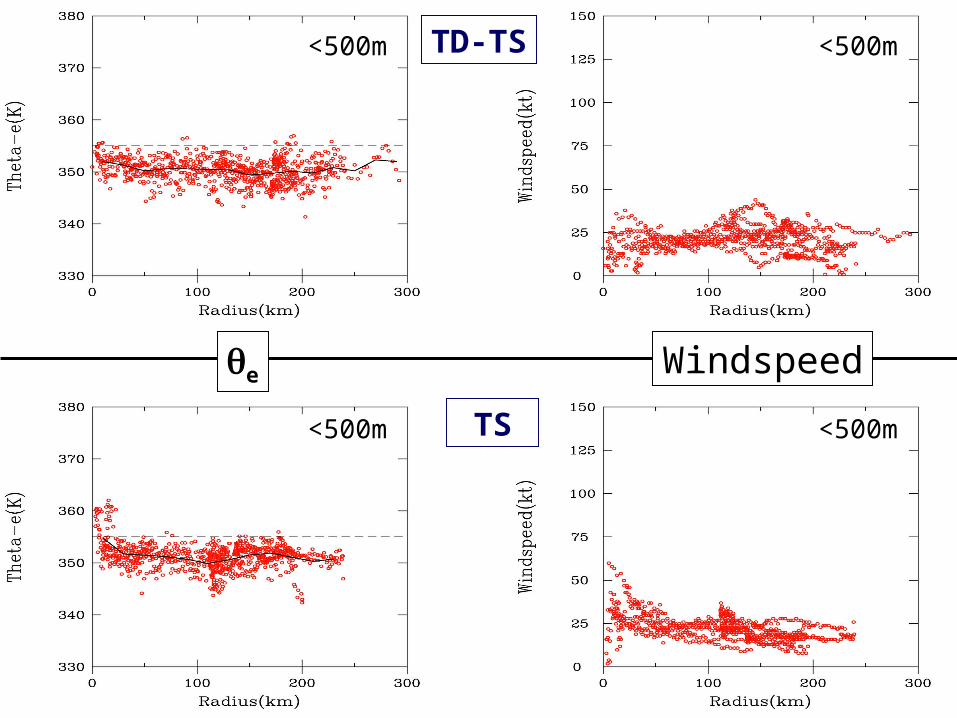
<500m TD-TS
TS <500m
<500m
<500m
e Windspeed

TS
H1-H2
~850hPa
~850hPa
~850hPa
~850hPa
37.5km
e Windspeed
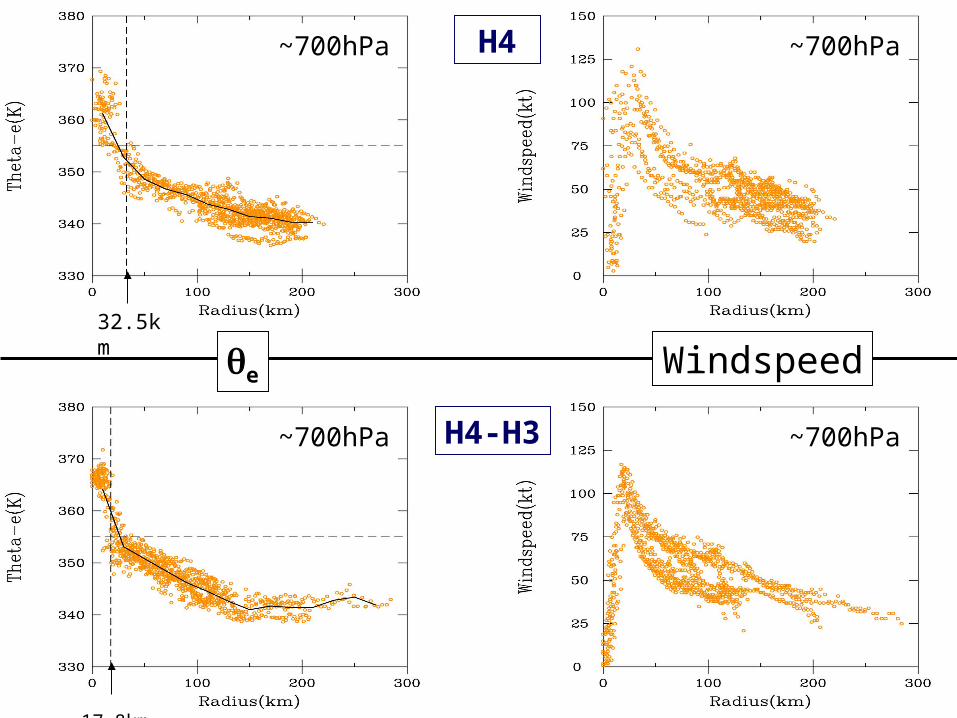
H4
H4-H3
~700hPa
~700hPa~700hPa
~700hPa
17.8km
32.5km e Windspeed
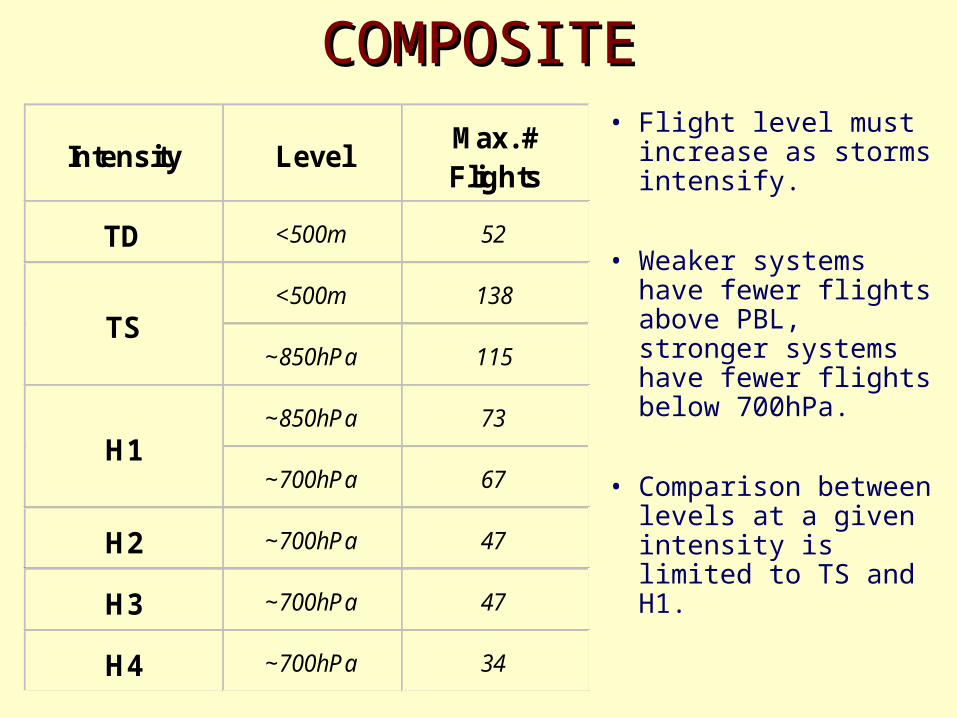
COMPOSITECOMPOSITE
Intensity LevelMax. # Flights
TD <500m 52
<500m 138
~850hPa 115
~850hPa 73
~700hPa 67
H2 ~700hPa 47
H3 ~700hPa 47
H4 ~700hPa 34
TS
H1
• Flight level must increase as storms intensify.
• Weaker systems have fewer flights above PBL, stronger systems have fewer flights below 700hPa.
• Comparison between levels at a given intensity is limited to TS and H1.
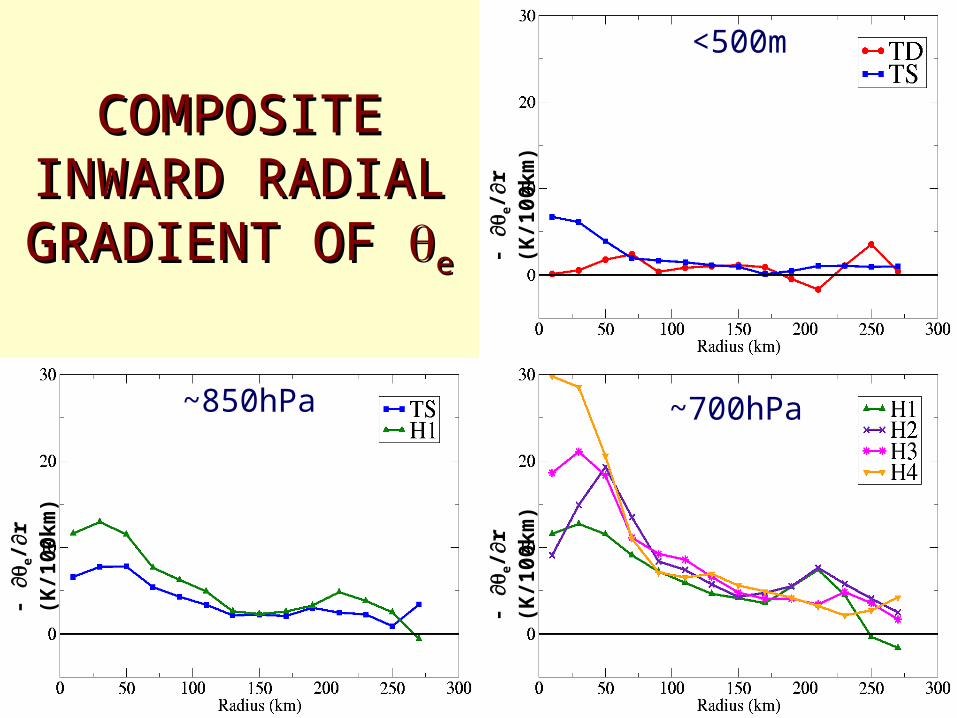
COMPOSITE COMPOSITE INWARD RADIAL INWARD RADIAL GRADIENT OF GRADIENT OF ee -
e/
r (K/100km)
-
e/
r (K/100km)
-
e/
r (K/100km)
<500m
~850hPa ~700hPa
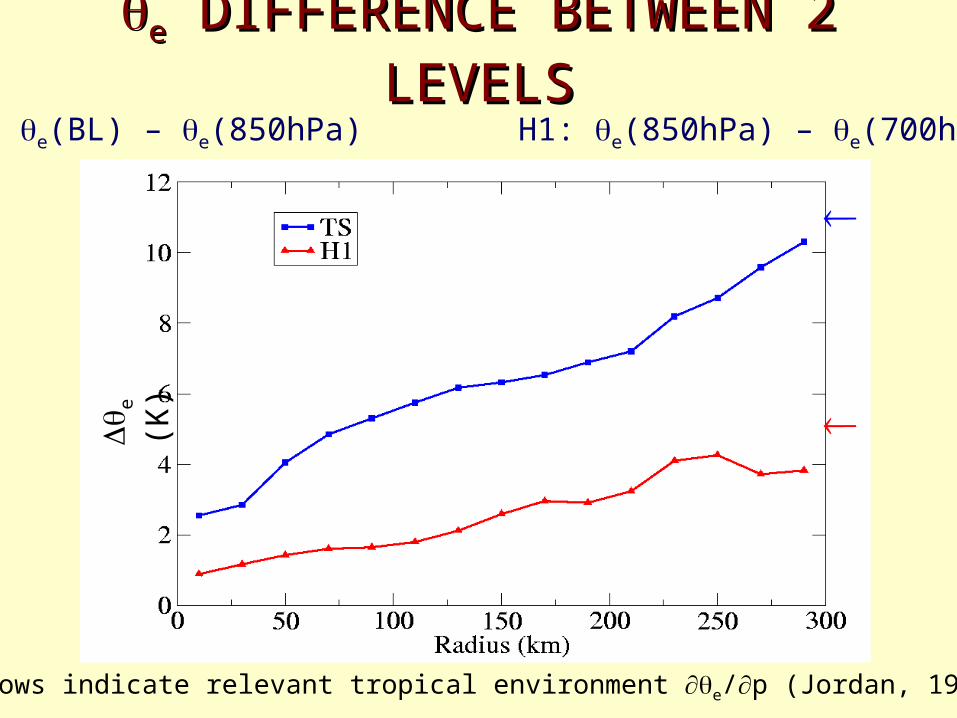
ee DIFFERENCE BETWEEN 2 DIFFERENCE BETWEEN 2 LEVELSLEVELS
TS: e(BL) – e(850hPa) H1: e(850hPa) – e(700hPa)
e (
K)
Arrows indicate relevant tropical environment e/p (Jordan, 1958)
SUMMARYSUMMARYRADIAL
• TD: |e/r| ~ 0 at all radii• TS: e increases first in the core (r<90km)• H1-H4: |e/r| increases with intensity, within
r=100km
VERTICAL• TS and H1: In lower troposphere convective
instability increases outward.– Both profiles are close to convective neutrality near
storm centre and convective instability increases outwards to their respective tropical environmental values.