thermodynamics of water in an enzyme active site: grid-based
TRANSCRIPT
Thermodynamics of Water in an Enzyme Active Site: Grid-BasedHydration Analysis of Coagulation Factor XaCrystal N. Nguyen,† Anthony Cruz,‡ Michael K. Gilson,*,† and Tom Kurtzman*,‡
†Skaggs School of Pharmacy and Pharmaceutical Sciences, University of California San Diego, 9500 Gilman Drive, La Jolla, California92093-0736, United States‡Department of Chemistry, Lehman College, The City University of New York, 250 Bedford Park Blvd. West, Bronx, New York10468, United States
*S Supporting Information
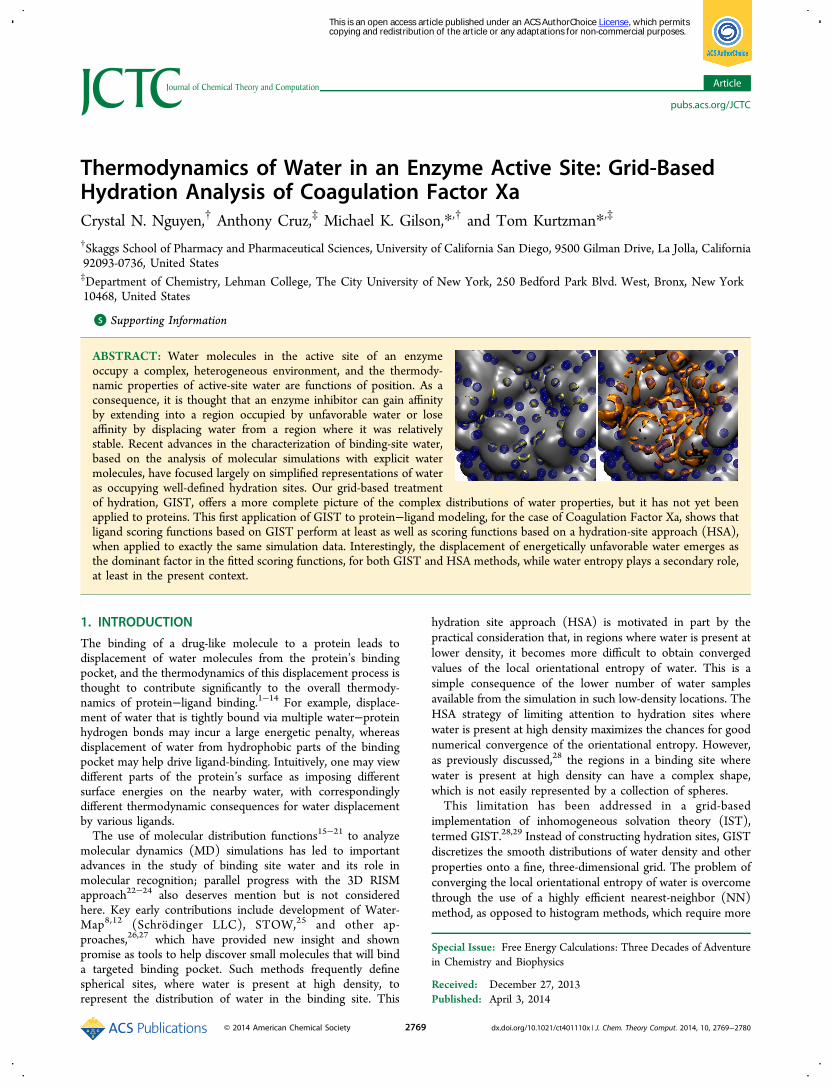
ABSTRACT: Water molecules in the active site of an enzymeoccupy a complex, heterogeneous environment, and the thermody-namic properties of active-site water are functions of position. As aconsequence, it is thought that an enzyme inhibitor can gain affinityby extending into a region occupied by unfavorable water or loseaffinity by displacing water from a region where it was relativelystable. Recent advances in the characterization of binding-site water,based on the analysis of molecular simulations with explicit watermolecules, have focused largely on simplified representations of wateras occupying well-defined hydration sites. Our grid-based treatmentof hydration, GIST, offers a more complete picture of the complex distributions of water properties, but it has not yet beenapplied to proteins. This first application of GIST to protein−ligand modeling, for the case of Coagulation Factor Xa, shows thatligand scoring functions based on GIST perform at least as well as scoring functions based on a hydration-site approach (HSA),when applied to exactly the same simulation data. Interestingly, the displacement of energetically unfavorable water emerges asthe dominant factor in the fitted scoring functions, for both GIST and HSA methods, while water entropy plays a secondary role,at least in the present context.
1. INTRODUCTION
The binding of a drug-like molecule to a protein leads todisplacement of water molecules from the protein’s bindingpocket, and the thermodynamics of this displacement process isthought to contribute significantly to the overall thermody-namics of protein−ligand binding.1−14 For example, displace-ment of water that is tightly bound via multiple water−proteinhydrogen bonds may incur a large energetic penalty, whereasdisplacement of water from hydrophobic parts of the bindingpocket may help drive ligand-binding. Intuitively, one may viewdifferent parts of the protein’s surface as imposing differentsurface energies on the nearby water, with correspondinglydifferent thermodynamic consequences for water displacementby various ligands.The use of molecular distribution functions15−21 to analyze
molecular dynamics (MD) simulations has led to importantadvances in the study of binding site water and its role inmolecular recognition; parallel progress with the 3D RISMapproach22−24 also deserves mention but is not consideredhere. Key early contributions include development of Water-Map8,12 (Schrodinger LLC), STOW,25 and other ap-proaches,26,27 which have provided new insight and shownpromise as tools to help discover small molecules that will binda targeted binding pocket. Such methods frequently definespherical sites, where water is present at high density, torepresent the distribution of water in the binding site. This
hydration site approach (HSA) is motivated in part by thepractical consideration that, in regions where water is present atlower density, it becomes more difficult to obtain convergedvalues of the local orientational entropy of water. This is asimple consequence of the lower number of water samplesavailable from the simulation in such low-density locations. TheHSA strategy of limiting attention to hydration sites wherewater is present at high density maximizes the chances for goodnumerical convergence of the orientational entropy. However,as previously discussed,28 the regions in a binding site wherewater is present at high density can have a complex shape,which is not easily represented by a collection of spheres.This limitation has been addressed in a grid-based
implementation of inhomogeneous solvation theory (IST),termed GIST.28,29 Instead of constructing hydration sites, GISTdiscretizes the smooth distributions of water density and otherproperties onto a fine, three-dimensional grid. The problem ofconverging the local orientational entropy of water is overcomethrough the use of a highly efficient nearest-neighbor (NN)method, as opposed to histogram methods, which require more
Special Issue: Free Energy Calculations: Three Decades of Adventurein Chemistry and Biophysics
Received: December 27, 2013Published: April 3, 2014
Article
pubs.acs.org/JCTC
© 2014 American Chemical Society 2769 dx.doi.org/10.1021/ct401110x | J. Chem. Theory Comput. 2014, 10, 2769−2780
This is an open access article published under an ACS AuthorChoice License, which permitscopying and redistribution of the article or any adaptations for non-commercial purposes.

sampling to reach adequate convergence.30,31 GIST can alsotake advantage of the fact that regions of lower densitycontribute proportionately less than regions of higher densityregions to the overall orientational entropy of the displacedwater. This density-weighting means that, if one is interested inthe integral of the orientational entropy over a volumecontaining both high and low density regions, one canconverge the overall integral to an acceptable tolerance, solong as the high-density regions are well converged.Alternatively, the grid approach makes it straightforward tofocus on regions where water is present at high density, as donein HSA, without simplifying their shapes.Here, we describe the first test of GIST for a ligand−protein
system. In order to establish a clear basis for comparingmethods, we study coagulation factor Xa (FXa) with a set ofsmall molecule inhibitors used in early studies of the WaterMapmethod,12 and we derive scoring functions based on both GISTand HSA methods. For this initial test of GIST’s applicability toprotein−ligand modeling, we do not seek to establish a full-fledged protein−ligand scoring function, suitable for virtualscreening or lead optimization. Instead, as previously done,12
we ask how well the GIST treatment of hydration can captureaffinity differences between closely related congeneric pairs ofligands, where differences in binding affinity that result fromcontributions other than solvation such as configurationalentropy and protein−ligand energy are minimal. Our resultssupport the applicability of GIST and, in addition, provide anunexpected outcome regarding the role of energetically versusentropically unfavorable water.
2. METHODS
We ran explicit-water MD simulations of FXa and used bothGIST and our local HSA implementation to extract informationabout the structure and thermodynamics of the water in thebinding site. We then considered the displacement of thisbinding site water by various FXa inhibitors, whose binding siteposes are known or could be inferred from the known poses ofvery similar compounds. Candidate scoring functions, based onthe computed properties of the water displaced by each ligand,were trained on subsets of the experimental affinity data andthen tested on separate sets, in order to assess the utility of thehydration data to resolve the relative binding affinities of pairsof congeneric ligands. Details of the computational methods arepresented in the following subsections.2.1. Grid Inhomogeneous Solvation Theory (GIST).
2.1.1. GIST Implementation. As previously detailed, GIST usesa three-dimensional rectangular grid of cubic voxels in theregion of interest and processes the snapshots of an MDtrajectory to compute the following thermodynamic quantitiesfor each voxel, k, centered at location rk:• ΔEk,swnorm, the mean solute−water interaction energy of a
water molecule in voxel k.• ΔEk,ww
norm, one-half the mean interaction energy of the waterin voxel k with all other waters. The factor of 1/2, which wasnot included in the definition of the corresponding water−water interaction energy in our initial presentation of GIST,28 iscustomary in liquid-state theory; it allows the total energy ofneat water to be written as the sum of the individual waterenergies.• −TΔSk,swtrans,norm, the single-body (one-water) translational
entropy of water in voxel k, relative to bulk, normalized to themean number of waters in the voxel.
• −TΔSk,sworient,norm, the single-body (one-water) orientationalentropy of water in voxel k, relative to bulk, normalized to themean number of waters in the voxel.Note that we previously used a somewhat different notation
for these quantities;29 for example, ΔEk,swnorm was ΔEswnorm(rk).Here, a 20.5 × 20.5 × 22.5 Å grid was centered on the activesite of FXa. The grid spacing of 0.5 Å provides voxels largeenough to give statistically meaningful data but small enough tostill give a high resolution description of the density distributionfunctions.28 It is worth noting that the volume of each voxel is33.5 times less than that of a hydration site (see below), as thelatter represents a sphere of radius 1 Å. The GIST Lennard-Jones and electrostatic energies were computed from storedMD frames, using the minimum image convention and nocutoff, and the reference value of the bulk water−waterinteraction energy was computed in the same convention. Themain GIST calculations presented here used 100 000 framessaved at 1 ps intervals during a 100 ns production MD run, butshorter durations were also examined, to study convergence, asdetailed below.
2.1.2. Functional Form of GIST-Based Scoring Functions.When a ligand binds a protein, it displaces water from theprotein’s binding site. If the displaced water was unfavorablerelative to bulk, then water displacement should make afavorable contribution to the ligand’s binding affinity. With thisin mind, we initially looked for a correlation between measuredligand binding affinities and regional hydration free energies(eq 25 of ref 28), where the region was defined as those voxelscovered by each ligand in a bound pose. However, finding littlecorrelation (data not shown), we conjectured that anyunderlying correlation had been obscured by noise, due tosharp variations in the hydration energies with even smallchanges in ligand position. This sharpness traces, at least inpart, to our use of a single pose for each ligand, and a restrainedprotein structure in the water simulations. We addressed thisissue by constructing scoring functions which are based on theGIST data but are less sensitive to the details of local waterproperties, due to the use of cutoffs in local water density,energy, and entropy. The use of cutoffs to construct a well-behaved scoring function from local hydration data was firstintroduced in the context of a hydration site model.12
We tested three such scoring functions based on the GISThydration data available from the grid described above. In allthree cases, voxel k can contribute to a ligand’s score only if thevoxel’s center, rk, lies within the van der Waals radius of anyatom of the ligand. For a given ligand, then, each voxel isassigned a binary displacement indicator, dk, which equals 1 ifthe center of the voxel lies within the van der Waals radius ofany ligand atom and 0 if it does not. The van der Waals radiiare drawn from the software package Crystal Maker (Crystal-Maker Software Ltd.), which in turn relies on Bondi.32 We alsoallowed the scoring function to focus on voxels where water ispresent at high density by setting up an additional binaryindicator, gk, which is set to 1 if the water density in voxel kexceeds a cutoff gco, and 0 if it does not. This cutoff is one of thetrained parameters, so it will be greater than zero only ifimposing a density cutoff actually improves the accuracy of thescoring function. Finally, we set up similar cutoffs for the totalenergy and entropy, Ek
norm and −TΔSk,swnorm, associated with eachvoxel k, and used these to define additional binary masks basedon energy and entropy thresholds. Thus, the binary mask, ek,equals 1 if Ek
norm exceeds the cutoff, Eco, and 0 otherwise; andthe binary mask, sk, equals 1 if −TΔSk,swnorm exceeds the cutoff, Sco,
Journal of Chemical Theory and Computation Article
dx.doi.org/10.1021/ct401110x | J. Chem. Theory Comput. 2014, 10, 2769−27802770
and 0 otherwise. Like the density cutoff, gco, the values of Ecoand Sco are fitted parameters and hence are free to go to zero ifimposing these cutoffs does not improve the accuracy of thescoring function. The total energy and entropy were computedas Ek
norm ≡ ΔEk,swnorm + 2ΔEk,wwnorm − 2Eww,bulk
norm and −TΔSk,swnorm ≡−TΔSk,swtrans,norm − TΔSk,sworient,norm, respectively. The quantity Ek
norm
is the mean interaction energy of the water in voxel k with theprotein and all other waters, relative to what its interactionswould be in bulk, 2Eww,bulk
norm , computed in the same conventionas the other GIST quantities.With the voxels’ binary masks in place for density, energy,
and entropy, we now define the three candidate scoringfunctions, one using both the energy and entropy data fromGIST, the second using only the energy data, and the thirdusing only the entropy data:
∑ ∑
∑
∑
Δ = + +
Δ = +
Δ = +
G E d g e S d g s C
G E d g e C
G S d g s C
kk k k
kk k k
kk k k
kk k k
ES aff aff
E aff
S aff(1)
Here, Eaff and Saff are additional fitted parameters, whichspecify the affinity increments provided by voxels surpassingthe energy and entropy cutoffs, respectively, and also meetingthe criteria dk = gk = 1. Note that in this study, each of thesescoring functions was trained separately and has its own fittedvalues of gco and C, as well as Eco and Eaff and/or Sco and Saff.2.1.3. Training and Testing of the GIST-Based Scoring
Function.We adjusted the scoring functions described above tofit the measured relative binding free energies, ΔΔGexpt, of 28different congeneric pairs of FXa inhibitors (see below).Separate training and test sets were used, in order to avoidoverfitting of the parameters. Thus, we used a random numbergenerator to split the 28 pairs into two arbitrarily selected setsof 14 apiece. Ten such random splits were carried out, creating10 distinct training and test sets. Parameters were optimized foreach training set and then tested on the corresponding test set.We report means and standard deviations over these 10 splitsfor the resulting fitted parameters and accuracy metrics. Wefurther assess the significance of these results by comparingthem with results obtained after a shuffling operation, whichused the gsl_permutation function in the GNU ScientificLibrary, to randomly exchange the entropy and enthalpy valuesamong pairs of voxels.For each training set, the parameters were adjusted as
follows, using ΔGES as an example. We scanned values of Ecoand Sco from 0 to 4 kcal/mol and values of gco from 0 to 4 (inunits of neat water density), each in increments of 0.1. Thisscan yields 41 × 41 × 41 = 68 921 combinations of the threecutoff values. For each combination, the sums in eq 1 werecomputed for all ligands. Linear regression was then used toobtain values of Eaff and Saff that provide the highest correlationcoefficient (R2) of the relative scores for the congeneric pairs,ΔΔGES, to the corresponding experimental values, ΔΔGexpt, forthe training set. The optimized values of the five fittedparameters were then used to compute ΔΔGES for thecongeneric pairs in the training set, and the reliability of thescoring function was evaluated based on the resulting value ofR2 for the test set. Analogous procedures were used for theother two scoring functions, ΔGE and ΔGS. These require
scanning only 41 × 41 = 1681 cutoff combinations and yieldonly one of the two affinity parameters, Eaff or Saff, rather thanboth as for ΔGES.
2.2. Hydration Site Analysis (HSA). 2.2.1. Assignment ofThermodynamic Properties to Hydration Sites. Hydrationsites in the FXa binding site were defined and analyzedthermodynamically based on the same MD simulation used forthe GIST calculations, using the first 10 ns (10 000 frames), inaccord with the common practice of using approximately 2−10ns simulations for HSA calculations.12,27,33−35 We used every10th frame of this segment to identify the hydration sites. Wefirst collected all instances, in these 1000 frames, of watermolecules within 5 Å of any heavy atom of any bound ligand(see below). For each water molecule in this set, we countedthe number of neighboring waters from the same set, using thecriterion of an oxygen−oxygen distance within 1 Å. With thisdefinition, a water molecule can count as its own neighbor, iftwo instances of it in different frames meet the distancecriterion. The location of the first hydration site was then set tothe coordinates of the water oxygen with the most neighbors.This water molecule and all of its neighbors were then removedfrom consideration as potential hydration sites, and the locationof the next hydration site was set to the coordinates of theremaining water oxygen with the most neighbors, based on theinitial counts. This removal process was iterated until thenumber of neighbors of all remaining waters was less than twicethat expected for a 1000 frame simulation of bulk water (i.e., <280 from 1000 frames). Each hydration site then was associatedwith all water instances, from the full 10 000 MD frames(above), whose oxygens lay within 1 Å of the site.Each hydration site i was associated with a mean energy Ei
and a one-body entropy Si. The energy of a water molecule in agiven hydration site was calculated as half the differencebetween the total energy of the water−protein system with thewater present and without it. A script invoking the programAMBER,36 with settings matched to those of the MDsimulation, was used to compute these energies. The meanenergy of the hydration site then is the average of theseenergies for all water molecules that populate the site, minusthe average energy of a water molecule in neat water frommatched calculations. The water entropy Si associated withhydration site i is the sum of its one-body translational andorientational entropies, Si,sw
trans ≡ −kρ ∫Vhs
g(r) ln g(r) dr and Si,sworient
≡ ((−kNi)/Ω) ∫Vhs
g(ω) ln g(ω) dω, where r is position in the
protein frame of reference, k is Boltzmann’s constant, ρ is bulkwater density, g(r) is the local water density referenced to bulk,Ni is the number of water molecules associated with hydrationsite i, Ω ≡ 8π2, Vhs indicates an integral restricted to thespherical hydration site, and ω defines orientational coordinatesin the protein frame of reference. The translational entropy wascomputed by the histogram method, where sphericalcoordinates r, θ, ϕ centered on the hydration site were dividedinto uniformly spaced bins in r, cos θ, ϕ to generate 512 three-dimensional bins of equal volume, with r ∈ [0, 1] Å, θ ∈ [0, π],and ϕ ∈ [0, 2π]. The orientational entropy associated with ahydration site was computed via the same nearest neighbormethod used by GIST for individual voxels.28
2.2.2. HSA-Based Scoring Function. We used the hydrationsites described above as the basis for three cutoff-based scoringfunctions, whose functional forms build on prior work.12 Like
Journal of Chemical Theory and Computation Article
dx.doi.org/10.1021/ct401110x | J. Chem. Theory Comput. 2014, 10, 2769−27802771
the three GIST scoring functions (above), the free HSA-basedscoring functions are based on, respectively, both energy andentropy, energy alone, and entropy alone:
∑ ∑
∑
∑
Δ = + +
Δ = +
Δ = +
G E d e S d s C
G E d e C
G S d s C
ii i
ii i
ii i
ii i
ES aff aff
E aff
S aff(2)
Here, the sums range over hydration sites i; ei and si equal 1 ifEi and −TSi are greater than cutoff values Eco and Sco,respectively, and 0 otherwise; di is a displacement function,defined below, which accounts for the overlap of the ligand, in agiven pose, with hydration site i; Eaff and Saff are fittedconstants; and C is a constant offset. Note that the HSA scoringparameters in eq 2 are set independently of the GIST scoringparameters in eq 1, despite the use of some equivalent symbols.We tried two forms of the displacement function. One is
identical to that used in the previous paper,12 while the second,as discussed below, applies a physically motivated cap to thisquantity:
∑= Θ −−
=
⎛⎝⎜
⎞⎠⎟d R R
R R
R
d d
( )
min[1, ]
ij
ijij
i i
nocapatoms
coco
co
cap nocap(3)
Here, Θ(x), the Heaviside step function, equals 0 if x ≤ 0and 1 otherwise; Rco is a distance cutoff; Rij is the distancebetween hydration site i and atom j of the ligand being scored;and the sum runs over all atoms belonging to the ligand beingscored, i. For di
nocap, which is modeled on the prior hydrationsite scoring function,12 each ligand atom within Rco of thehydration site makes a contribution that scales between 0 and 1as it approaches the center of the site, so the displacementfunction accounts for the degree to which a ligand displaces thewater in the site. However, this approach is nonphysical in thesense that, if Rij < Rco for multiple ligand atoms j and a singlesite i, then the displacement of solvent from the site may bemultiply counted. That is, for the energy/entropy scoringfunction, a site might contribute more than Eaff + Saff; for theenergy-only scoring function, it might contribute more thanEaff; and for the entropy-only scoring function, it mightcontribute more than Saff. Indeed, in the present study, wefound values of di
nocap up to 3.2, implying that a single site mightcontribute over three times. We therefore also considered thealternative displacement function, di
cap, which is capped at avalue of 1, so that no hydration site may contribute more thanone-fold to a ligand’s score, in accordance with the fact that thesite cannot be displaced more than once.2.2.3. Training and Testing of the HSA-Based Scoring
Function. The parameters of the HSA-based scoring functionswere adjusted in the same manner as those of the GIST-basedscoring functions, except that Rco took the place of gco. Thus,values of Rco were scanned from 2 to 3 Å, in steps of 0.1 Å and,as for GIST, values of Eco and Sco were scanned from 0 to 4kcal/mol in increments of 0.1 kcal/mol. (Note that nohydration sites had energies greater than 3.7 kcal/mol.) Thesums in eq 2 were evaluated for each ligand and with eachcombination of Rco, Eco, and Sco. For each set of cutoffs scanned,values of Eaff and Saff were obtained by linear regression against
the differences in measured binding free energies for a trainingset of congeneric ligand pairs, for each scoring function in eq 2.The parameters that yielded the highest correlation coefficientswere chosen and were tested for their ability to reproduce thedifference in binding affinities for the congeneric pairs in thetest set. This procedure was applied to the same 10 training andtest sets used for the GIST scoring function. As done for GIST,we assessed the significance of the HSA results by comparingthem with results obtained after a shuffling operation, whichrandomly exchanges the entropy and enthalpy values acrosspairs of hydration sites.
2.3. Molecular Systems and Modeling. 2.3.1. MolecularDynamics Simulations of Binding Site Water. Both GIST andthe HSA methods take as input a Boltzmann sample of waterconfigurations for a given configuration of the protein. Here, weused molecular dynamics (MD) simulations to generate thissample from the canonical ensemble (NVT), as follows. Weused the structure of FXa from Protein Data Bank37,38 entry1FJS,39 as previously done,12 and our assignment ofprotonation states was also consistent with this prior study.We removed the ligand from the binding site and used Tleapand other Amber Tools36 to assign protein parameters from theAMBER99sb force field40 and solvate the protein with 8557TIP3P water molecules.41 The simulations used a periodic boxwith dimensions 66.5 Å × 72.2 Å × 60.9 Å, which afforded atleast 10 Å between any protein atom and the edge of theperiodic box. Four disulfide bonds were set up to join cysteinepairs 7/12, 27/43, 156/170, and 181/209, and two ionsobserved in the crystal structure (Ca2+ and Cl−) were restrainedto their original positions. The resulting simulation system had29 338 atoms, comprising the protein, the two ions, and thewater molecules.Energy minimization, followed by MD simulation, was
carried out with the Amber 12 software using pmemd.cuda42
on a single GPU. First, the energy of the system was minimizedin two rounds; both used 1500 steps of the steepest descentsalgorithm followed by the conjugate gradient method for amaximum of 2000 steps. In the first round, all protein atomswere harmonically restrained to their initial positions with aforce constant of 100 kcal/mol/Å2. In the second round, thesystem was further relaxed keeping only non-hydrogen proteinatoms restrained, with the same force constant. The energyminimized system was then heated with a series of 20 psconstant-volume and -temperature MD simulations with thefirst simulation at 50 K and the temperature incremented by 50K every 20 ps until 300 K was reached. The system was thenequilibrated for 10 ns at 300 K at a constant pressure of 1 atm.At the final volume, the system was then equilibrated for anadditional 5 ns at constant volume. The final MD productionrun of 100 ns was at constant number of particles, volume, andtemperature (NVT), and system configurations were storedevery 1 ps, for a total of 100 000 stored configurations. Duringall MD simulations, all protein atoms were harmonicallyrestrained to their positions following the energy minimizationstep, with a force constant of 100 kcal/mol/Å. The SHAKEalgorithm43 was used to constrain the lengths of all bondsinvolving hydrogen atoms. Temperature was regulated byLangevin dynamics with a collision frequency of 2.0 ps−1. A 9 Åcutoff was applied to all nonbonded interactions. Particle meshEwald was implemented to account for long-range electrostaticinteractions, and the Leapfrog algorithm was used to propagatethe trajectory. For the constant pressure simulations, isotropicposition scaling was implemented with a pressure relaxation
Journal of Chemical Theory and Computation Article
dx.doi.org/10.1021/ct401110x | J. Chem. Theory Comput. 2014, 10, 2769−27802772
time of 0.5 ps. The main GIST and HSA solvation maps wereproduced from these configurations. However, in order to studythe convergence properties of GIST, we performed twoadditional 20 ns NVT production runs storing configurationsevery 0.05 ps; one was begun identically with the 100 ns run,and the other was begun with the last MD configuration of the100 ns run.2.3.2. Ligand Data Set and Preparation. We trained and
tested the scoring functions with a set of 28 congeneric ligandpairs (see Supporting Information), where the members of eachpair differ only by small, localized chemical changes in rigidmoieties, leading to differential displacement of solvent. Aspreviously discussed,12 this approach minimizes the contribu-tions of free energy terms other than hydration and thus allowsa focus on the quantity of central interest in this study. The 28pairs used here are a subset of 31 drawn from severalexperimental series44−55 for use in a previous computationalstudy:12 we eliminated three pairs (Matter:25/Matter:28;Matter:28/2BMG:I1H; Mueller:3/Mueller:2), because wewere not confident of the conformation of at least one memberof the pair, and hence of the location of the displaced solvent.In particular, Mueller:3 differs from Mueller:2 by a phenylgroup whose orientation is not clear, because it is attached by arotatable bond; and for the other two pairs, an aromatic ringchanges to a nonaromatic ring, whose conformation isuncertain. It is worth noting that, for this set of ligands, thereis essentially no correlation between binding free energy andmolecular weight (R2 = 0.12).Ligand poses were drawn from available cocrystal structures
or generated from a cocrystal structure of a closely relatedligand by a small chemical adjustment. In all cases, the cocrystalstructure was aligned with the simulated protein (above) togenerate an initial pose in the binding site for which thehydration structure was computed. Final poses for modelingsolvent displacement were generated by protonating theligands, then minimizing the initial poses in the simulatedprotein structure while allowing the ligand and proteinhydrogen atoms to relax. The atomic partial charges for eachligand were obtained from the restrained electrostatic potential(RESP) method,56 using quantum-mechanically derivedelectrostatic potentials with the 6-31G* basis set. Other ligandforce field parameters were obtained using GAFF.57 Note thatthese parameters were used only to generate the ligand posesstudied with the GIST and HSA scoring functions.
3. RESULTS
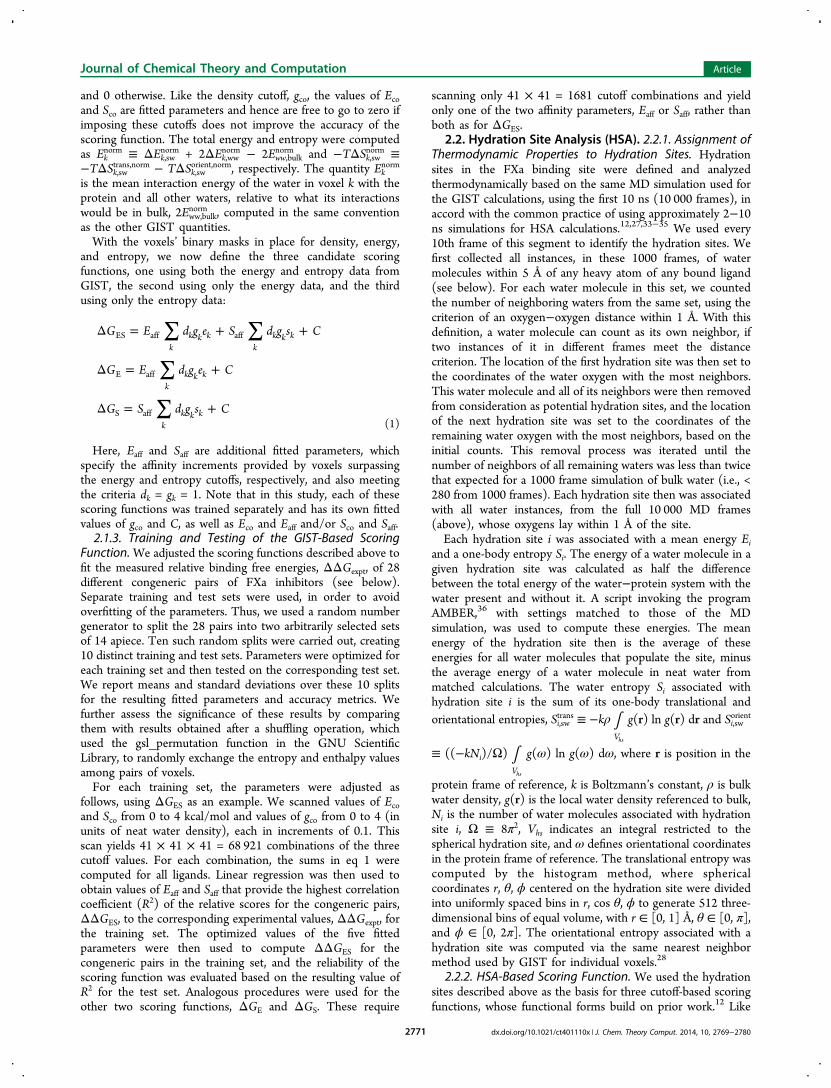
3.1. Comparison of Grid and Site Representations ofWater Density. The HSA hydration sites are informativeabout water density but do not capture the level of detailavailable from GIST’s grid-based method. The two approachesare compared in Figure 1, which displays the HSA sites (bluespheres) computed for the binding pocket of Factor Xa, alongwith GIST’s gridded representation of water density, contouredat three different levels. Contours of water density at 6 timesthat of bulk (g = 6) appear as discrete, mostly convex droplets(yellow contours, left panel), although a few of these high-density regions are elongated, rather than round. Every high-density droplet is matched by a spherical HSA site, but thereare many HSA sites in the binding pocket that do not encloseone of these high-density droplets. Contours at 4 times bulkdensity (g = 4) appear as more and larger droplets and matchthe HSA sites rather well (gold contours, middle panel).Contours at twice bulk density (g = 2) form long, curvedstrands, which follow the contours of the protein surface(orange contours, right panel), and are not well represented bythe HSA sites. These begin to delineate the first hydration shellof the protein. Finally, contours at still lower density (e.g., g =1.5) include parts of the second hydration shell (not shown).Overall, the HSA representation captures the droplet-likedistribution of the highest water densities but does notdistinguish between high and medium density regions anddoes not capture the complex distributions of water density thatbecome apparent at densities roughly twice that of bulk. Thisobservation has practical relevance, because the scoringfunctions developed here include regions where water densityis of this order, as detailed in the next subsection.It is also worth remarking that a hydration site should not be
directly equated with a single bound water, as the sites’occupancies are typically well below one. Thus, for the HSAsites within 5 Å of the bound ligands, we find a meanoccupancy of 0.58 waters molecules, with a standard deviationof 0.22. These values are similar to those reported previouslyfor Factor Xa in an early implementation of WaterMap:12 theoccupancies reported in Table 1 of the prior report correspondto a mean of 0.51 water molecules per hydration site, with astandard deviation of 0.22.
3.2. GIST scoring functions. A GIST-based scoringfunction based on both the local energy and one-body entropyof displaced water yields good correlations with the measured
Figure 1. Comparison of the GIST and HSA representations of water density in the Factor Xa binding pocket. HSA sites (blue spheres) are the samein all three panels. From left to right, the GIST contour levels are at g = 6, 4, and 2. The GIST water densities are based on the occupancy of gridvoxels by water oxygens, and the boundaries of the grid box may be discerned in the right-hand panel. A smoothed protein surface is shown in orderto highlight the water data.
Journal of Chemical Theory and Computation Article
dx.doi.org/10.1021/ct401110x | J. Chem. Theory Comput. 2014, 10, 2769−27802773
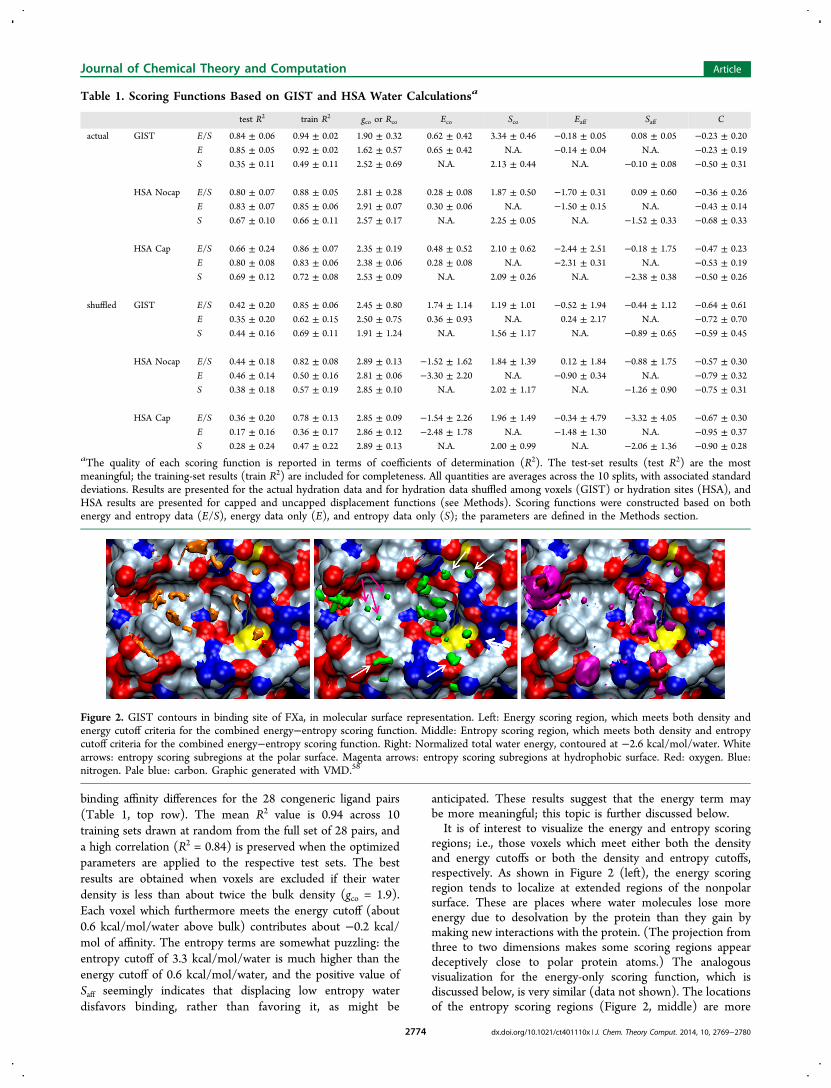
binding affinity differences for the 28 congeneric ligand pairs(Table 1, top row). The mean R2 value is 0.94 across 10training sets drawn at random from the full set of 28 pairs, anda high correlation (R2 = 0.84) is preserved when the optimizedparameters are applied to the respective test sets. The bestresults are obtained when voxels are excluded if their waterdensity is less than about twice the bulk density (gco = 1.9).Each voxel which furthermore meets the energy cutoff (about0.6 kcal/mol/water above bulk) contributes about −0.2 kcal/mol of affinity. The entropy terms are somewhat puzzling: theentropy cutoff of 3.3 kcal/mol/water is much higher than theenergy cutoff of 0.6 kcal/mol/water, and the positive value ofSaff seemingly indicates that displacing low entropy waterdisfavors binding, rather than favoring it, as might be
anticipated. These results suggest that the energy term maybe more meaningful; this topic is further discussed below.It is of interest to visualize the energy and entropy scoring
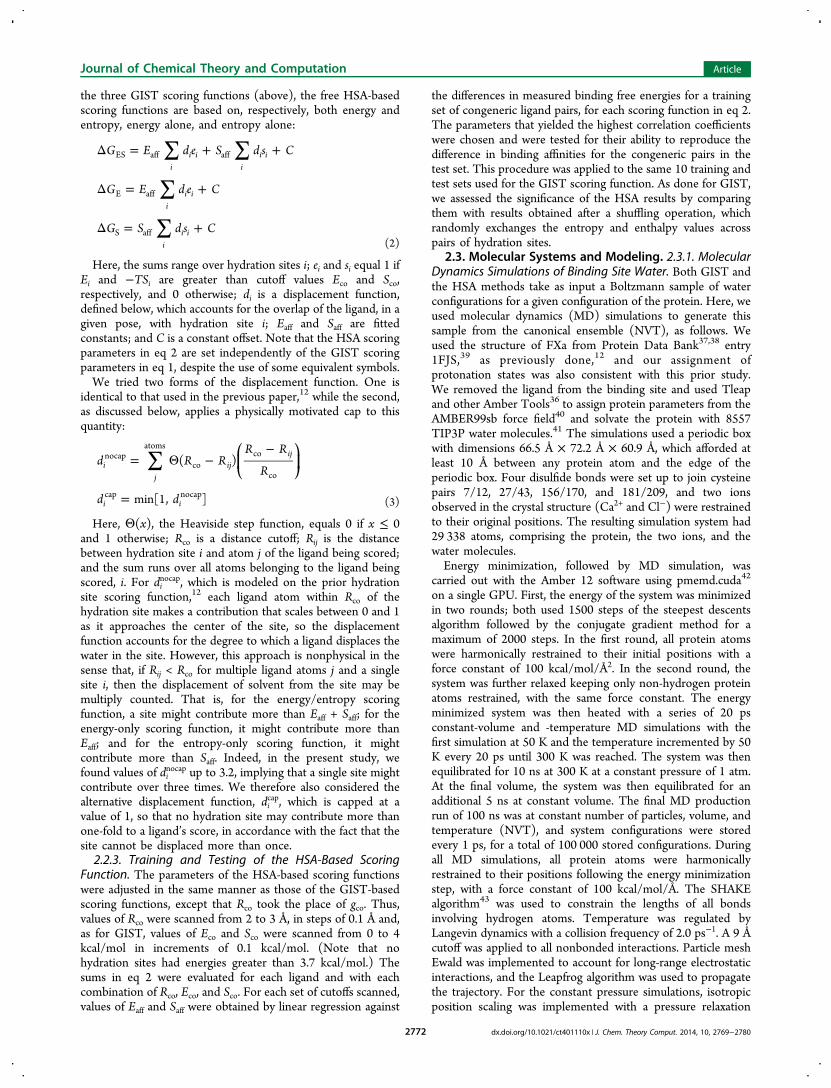
regions; i.e., those voxels which meet either both the densityand energy cutoffs or both the density and entropy cutoffs,respectively. As shown in Figure 2 (left), the energy scoringregion tends to localize at extended regions of the nonpolarsurface. These are places where water molecules lose moreenergy due to desolvation by the protein than they gain bymaking new interactions with the protein. (The projection fromthree to two dimensions makes some scoring regions appeardeceptively close to polar protein atoms.) The analogousvisualization for the energy-only scoring function, which isdiscussed below, is very similar (data not shown). The locationsof the entropy scoring regions (Figure 2, middle) are more
Table 1. Scoring Functions Based on GIST and HSA Water Calculationsa
test R2 train R2 gco or Rco Eco Sco Eaff Saff C
actual GIST E/S 0.84 ± 0.06 0.94 ± 0.02 1.90 ± 0.32 0.62 ± 0.42 3.34 ± 0.46 −0.18 ± 0.05 0.08 ± 0.05 −0.23 ± 0.20
E 0.85 ± 0.05 0.92 ± 0.02 1.62 ± 0.57 0.65 ± 0.42 N.A. −0.14 ± 0.04 N.A. −0.23 ± 0.19
S 0.35 ± 0.11 0.49 ± 0.11 2.52 ± 0.69 N.A. 2.13 ± 0.44 N.A. −0.10 ± 0.08 −0.50 ± 0.31
HSA Nocap E/S 0.80 ± 0.07 0.88 ± 0.05 2.81 ± 0.28 0.28 ± 0.08 1.87 ± 0.50 −1.70 ± 0.31 0.09 ± 0.60 −0.36 ± 0.26
E 0.83 ± 0.07 0.85 ± 0.06 2.91 ± 0.07 0.30 ± 0.06 N.A. −1.50 ± 0.15 N.A. −0.43 ± 0.14
S 0.67 ± 0.10 0.66 ± 0.11 2.57 ± 0.17 N.A. 2.25 ± 0.05 N.A. −1.52 ± 0.33 −0.68 ± 0.33
HSA Cap E/S 0.66 ± 0.24 0.86 ± 0.07 2.35 ± 0.19 0.48 ± 0.52 2.10 ± 0.62 −2.44 ± 2.51 −0.18 ± 1.75 −0.47 ± 0.23
E 0.80 ± 0.08 0.83 ± 0.06 2.38 ± 0.06 0.28 ± 0.08 N.A. −2.31 ± 0.31 N.A. −0.53 ± 0.19
S 0.69 ± 0.12 0.72 ± 0.08 2.53 ± 0.09 N.A. 2.09 ± 0.26 N.A. −2.38 ± 0.38 −0.50 ± 0.26
shuffled GIST E/S 0.42 ± 0.20 0.85 ± 0.06 2.45 ± 0.80 1.74 ± 1.14 1.19 ± 1.01 −0.52 ± 1.94 −0.44 ± 1.12 −0.64 ± 0.61
E 0.35 ± 0.20 0.62 ± 0.15 2.50 ± 0.75 0.36 ± 0.93 N.A. 0.24 ± 2.17 N.A. −0.72 ± 0.70
S 0.44 ± 0.16 0.69 ± 0.11 1.91 ± 1.24 N.A. 1.56 ± 1.17 N.A. −0.89 ± 0.65 −0.59 ± 0.45
HSA Nocap E/S 0.44 ± 0.18 0.82 ± 0.08 2.89 ± 0.13 −1.52 ± 1.62 1.84 ± 1.39 0.12 ± 1.84 −0.88 ± 1.75 −0.57 ± 0.30
E 0.46 ± 0.14 0.50 ± 0.16 2.81 ± 0.06 −3.30 ± 2.20 N.A. −0.90 ± 0.34 N.A. −0.79 ± 0.32
S 0.38 ± 0.18 0.57 ± 0.19 2.85 ± 0.10 N.A. 2.02 ± 1.17 N.A. −1.26 ± 0.90 −0.75 ± 0.31
HSA Cap E/S 0.36 ± 0.20 0.78 ± 0.13 2.85 ± 0.09 −1.54 ± 2.26 1.96 ± 1.49 −0.34 ± 4.79 −3.32 ± 4.05 −0.67 ± 0.30
E 0.17 ± 0.16 0.36 ± 0.17 2.86 ± 0.12 −2.48 ± 1.78 N.A. −1.48 ± 1.30 N.A. −0.95 ± 0.37
S 0.28 ± 0.24 0.47 ± 0.22 2.89 ± 0.13 N.A. 2.00 ± 0.99 N.A. −2.06 ± 1.36 −0.90 ± 0.28aThe quality of each scoring function is reported in terms of coefficients of determination (R2). The test-set results (test R2) are the mostmeaningful; the training-set results (train R2) are included for completeness. All quantities are averages across the 10 splits, with associated standarddeviations. Results are presented for the actual hydration data and for hydration data shuffled among voxels (GIST) or hydration sites (HSA), andHSA results are presented for capped and uncapped displacement functions (see Methods). Scoring functions were constructed based on bothenergy and entropy data (E/S), energy data only (E), and entropy data only (S); the parameters are defined in the Methods section.
Figure 2. GIST contours in binding site of FXa, in molecular surface representation. Left: Energy scoring region, which meets both density andenergy cutoff criteria for the combined energy−entropy scoring function. Middle: Entropy scoring region, which meets both density and entropycutoff criteria for the combined energy−entropy scoring function. Right: Normalized total water energy, contoured at −2.6 kcal/mol/water. Whitearrows: entropy scoring subregions at the polar surface. Magenta arrows: entropy scoring subregions at hydrophobic surface. Red: oxygen. Blue:nitrogen. Pale blue: carbon. Graphic generated with VMD.58
Journal of Chemical Theory and Computation Article
dx.doi.org/10.1021/ct401110x | J. Chem. Theory Comput. 2014, 10, 2769−27802774

complicated. Some (white arrows) lie at the surface of polaratoms; others (pink arrows) lie at hydrophobic locations. Thefrequent localization of entropy scoring regions at polarsurfaces, and the unexpectedly positive value of Saff, likelyreflects the fact that polar surfaces can tightly bind waters,leading to unfavorable entropies but favorable energies (Figure2, right) typical of traditional entropy−enthalpy compensation.Displacement of water from such regions may be netunfavorable, and this might help account for the positivevalue of Saff. On the other hand, the displacement ofentropically disfavored water from subregions where energy isnot particularly favorable should favor ligand binding. Thus, theenergetically mixed nature of the entropic scoring regionsfurther suggests that it may not give a clear signal in the overallscoring function.In order to study the significance of the energy and entropy
terms in more detail, we also considered a scoring functionbased only on density and energy, and another based only ondensity and entropy. As shown in Table 1 (second and thirdrows), the energy-only scoring function performs just as well(R2 = 0.85 for the test sets) as the original one based on bothenergy and entropy. In addition, the fitted parameters aresimilar in magnitude and sign to those of the original energyterm. In contrast, the entropy-only scoring function yielded apoor correlation with experimental data (R2 = 0.35 for the testsets), and the sign of Saff is reversed relative to that in theoriginal scoring function. Thus, the hydration energy alonecarries all of the predictive power of the GIST-based scoringfunction, at least for FXa with this ansatz. This result isconsistent with the analysis of the combined energy/entropyscoring function, above.As a further check of the statistical significance of the present
results, we shuffled the GIST data among voxels and thenrefitted all three GIST-based scoring functions using the
shuffled data. The results are presented in the lower half ofTable 1. This procedure was repeated with three independentrandomizations. Although correlations as high as R2 = 0.82 areobtained for the training sets, the test-set results are all poor (R2
≈ 0.4 ± 0.2). This result supports the significance of the highcorrelations obtained with the true (unshuffled) data andindicates that the low correlations observed for the entropy-only scoring function should be viewed as statisticallyinsignificant.Finally, we examined the amount of MD simulation data
required to generate the high correlations observed above. First,we reanalyzed the original set of MD frames, which had beensaved at 1 ps intervals. For increasing numbers of frames fromthis set, we reran the 10 training and test calculations andcomputed the mean and standard deviation of the resulting 10values of R2. As shown in Figure 3 (left), the value of R2 and itsstandard deviation (error bars) appear to plateau at about 60 nsfor the combined energy−entropy scoring function (top left).Interestingly, the plateau starts much earlier, at about 30 ns, forthe energy-alone scoring function (lower left). It appears thatthe more slowly convergent entropy term delays convergenceof the energy−entropy scoring function, so that leaving out theentropy term in the energy-only scoring function speedsconvergence. This result is, again, consistent with theirrelevance of the entropy term in the GIST scoring functions.We then asked whether shorter MD simulations might givebetter convergence if frames were saved at shorter timeintervals. First, we reprocessed the first 20 ns of the samesimulation, now processing frames saved at 0.05 ps. As shownin Figure 3 (top middle), the combined energy/entropy scoringfunction now converges somewhat more quickly, especially asmeasured by the reduction in the standard deviation of R2
across the 10 train/test calculations. The improvement is moremarked for the energy-only scoring function, as well-converged
Figure 3. Convergence of R2 values for GIST scoring functions, as a function of simulation duration. Top row: combined energy/entropy scoringfunction. Bottom row: energy-only scoring function. Left: 100 ns simulation, frames saved at 1 ps intervals. Middle: The first 20 ns of the same 100ns simulation, frames saved every 0.05 ps. Right: 20 ns simulation initiated from the last frame of the 100 ns simulation, frames saved every 0.05 ps.
Journal of Chemical Theory and Computation Article
dx.doi.org/10.1021/ct401110x | J. Chem. Theory Comput. 2014, 10, 2769−27802775
results are now available after only 10 ns of simulation time,although the standard deviation of R2 remains slightly higherthan that from the 100 ns simulation. We then extended the100 ns simulation by 20 ns, saving frames at 0.05 ps intervals,and examined convergence over this short simulation. Theresults are further improved, with good convergence and tighterror bars achieved within about 5 ns for the energy-onlyscoring function, and 10 ns for the combined energy/entropyone. The improvement in these results, relative to those fromthe early 20 ns segment, suggests that the water structurecontinued to equilibrate somewhat during the 100 ns run, so itwould have been appropriate to use a somewhat longerequilibration period in the MD protocol. In summary, at leastfor FXa, a simulation of 10 ns or less suffices to gain all thebenefit of these GIST scoring functions.3.3. HSA-Based Scoring Functions. As discussed in the
Methods section, a prior HSA scoring function was constructedin such a way that the thermodynamic contribution of eachhydration could be counted multiple times, if more than oneligand atom lay within a cutoff distance.12 This function gavegood results but is arguably nonphysical, because once thewater in a hydration site has been displaced, it cannot bedisplaced again. Here, we present results for a set of similarlyconstructed HSA-based scoring functions in which, as before, ahydration site can be counted multiple times; as well as asecond set, in which the contribution of each hydration site iscapped, so that it can only contribute once. For both theuncapped and capped models, we examine scoring functionsbased on energy and entropy, energy only, and entropy only, asalso done for GIST.With the original uncapped approach, where a hydration site
can contribute multiple times, the combined energy/entropyscoring function provides high correlation coefficients for boththe training (R2 = 0.88) and test (R2 = 0.80) sets (Table 1,fourth row, marked E/S). These values of R2 are slightly lowerthan those for GIST, but the difference is not statistically
significant. Interestingly, the fitted value of Eaff (−1.70 kcal/mol) is much greater than that of Saff, which in fact is assigned apositive sign (0.09 kcal/mol). In addition, the trainingprocedure puts much sharper constraints on the energy termsthan the entropy terms, as indicated by the fact that thestandard deviations of Eo and Eaff (0.08 and 0.31 kcal/mol,respectively) are lower than those for So and Saff (0.50 and 0.60kcal/mol). Thus, the training results suggest that the entropyterm is of lower importance than the energy term, much asobserved in the case of GIST. Accordingly, a scoring functionbased entirely on energy (Table 1, row 5, marked E) performsas well as the one with both energy and entropy, andfurthermore yields values of Rco, Eco, and Eaff very similar tothose of the combined energy−entropy scoring function. Onthe other hand, an entropy-only scoring function (Table 1, row6, marked S) also performs fairly well, with a value of R2 = 0.66for the test sets, and the fitted value of Saff, −1.52 kcal/mol, isessentially the same as the fitted value of Eaff for the energy-onlyscoring function, −1.50 kcal/mol. Thus, the entropy-onlyscoring function appears to largely replicate the energy-onlyscoring function, with some drop in the correlation withexperimental data. These results are similar to those for GIST,as in both cases, the energy-only scoring function performed aswell as the energy/entropy one, while the entropy-only one isworse. However, the decline in performance on going toentropy-only is much greater for GIST than for HSA.In the second variant of the HSA-based scoring functions, no
hydration site can contribute more than one-fold to thedifference between two ligands’ affinities. Imposing thisphysically reasonable cap on the contribution of each sitereduced the experimental correlation of the scoring functionwith experimental data to 0.66 for the test sets with thecombined energy−entropy scoring function but had essentiallyno effect on the correlations for the energy-only and entropy-only test-set results. Thus, the results remain consistent with aconclusion that the energy term alone is enough to gain all the
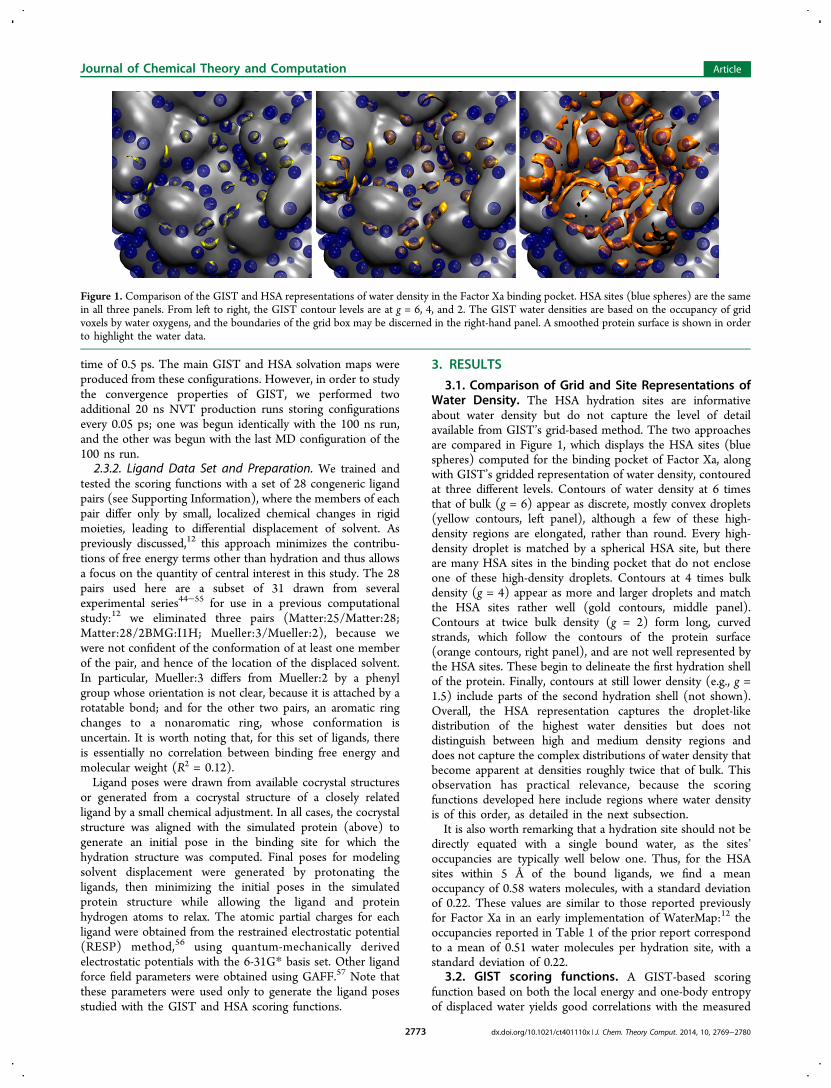
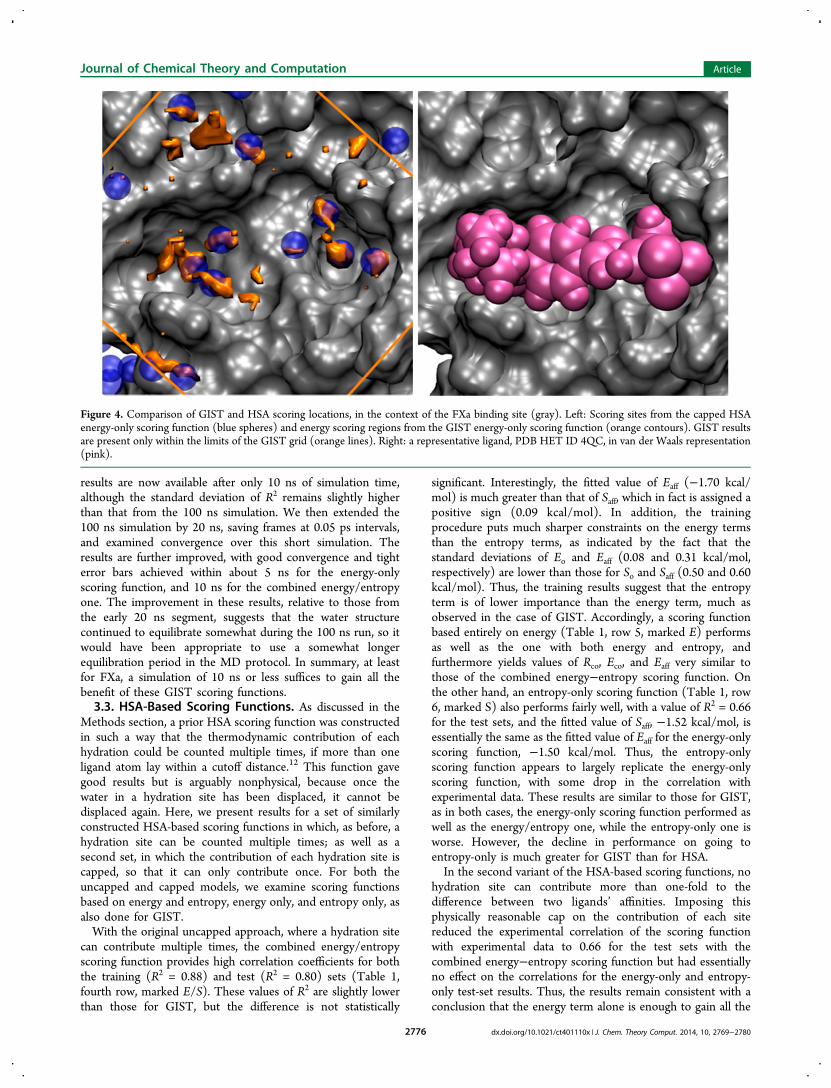
Figure 4. Comparison of GIST and HSA scoring locations, in the context of the FXa binding site (gray). Left: Scoring sites from the capped HSAenergy-only scoring function (blue spheres) and energy scoring regions from the GIST energy-only scoring function (orange contours). GIST resultsare present only within the limits of the GIST grid (orange lines). Right: a representative ligand, PDB HET ID 4QC, in van der Waals representation(pink).
Journal of Chemical Theory and Computation Article
dx.doi.org/10.1021/ct401110x | J. Chem. Theory Comput. 2014, 10, 2769−27802776

benefit of the scoring functions. The only other major change,relative to the uncapped version of the scoring function, is thatthe fitted values of Eaff and Saff changed from about −1.5 kcal/mol to about −2.3 kcal/mol, except that Saff for the combinedenergy/entropy scoring function remained small. Theseincreases presumably have the effect of compensating for thereduced values of the displacement function, i.e., for the factthat di
cap ≤ dinocap in eqs 2 and 3.
In order to further test the statistical significance of the HSAscoring results, we shuffled the energies and entropies amonghydration sites and then refitted all six HSA-based scoringfunctions with the shuffled data. As summarized in the last sixrows of Table 1, the uncapped scoring functions now yield poorcorrelations with experimental data (R2 ≈ 0.4), just as observedfor GIST, and the correlations for the capped scoring functionsfall even lower. These results support the significance of thecorrelations obtained with the actual (unshuffled) data. Thefact that the shuffled results are worse for the capped HSAscoring functions suggests, but does not prove, that applyingthe physically reasonable cap might reduce spurious correla-tions.It is of interest to examine the locations of HSA scoring sites
relative to the GIST scoring regions. We focus here on theenergy-only scoring functions, since it is not clear that includingentropy adds useful information, at least for FXa within thepresent functional form. As shown in Figure 4 (left), the HSAsites do not capture the complex shapes of the GIST scoringregions, and substantial parts of the GIST scoring region areentirely missed by the HSA scoring sites. These regions couldpresumably be used to direct rational lead drug design. Thespatial relationship of the scoring sites to the ligands studiedhere may be appreciated from Figure 4 (right), which shows thevan der Waals surface of a representative ligand.
4. DISCUSSION
A key result of this first application of GIST to protein−ligandmodeling is that the detailed representation of water structureand thermodynamics it affords works at least as well in a simplescoring function as the prior12 and present site-based HSAimplementations. In addition, the GIST results converge wellwithin 5−10 ns of MD simulation time, depending uponwhether one uses the energy-only model or the energy/entropymodel. These simulation times are commensurate with thosenormally used for the HSA approach; see the Methods. Thus,the two approaches provide similar overall performance in thepresent application. Additional considerations include the factthat site-based approaches may require less data storage andthat they paint a simple picture of water structure in a proteinbinding site. On the other hand, the GIST grid files producedare still small (<1 MB), and we anticipate that the moredetailed rendering of hydration structure and thermodynamicsafforded by the grid approach will be useful for insight andprediction. Note, in particular, that there are HSA sites whichare only partly occupied by the more refined GIST scoringregions, as well as GIST scoring regions that are not identifiedby the HSA model, as evident from Figure 4. More generally,the fact that GIST is a more direct representation of thecommon underlying inhomogeneous solvation theory facilitatesthe interpretation of its results and provides clear pathways tofuture enhancements, such as the incorporation of higher-ordercorrelations, as touched on below. A fast implementation ofGIST, based upon focused grand canonical Monte Carlo
sampling,59 may be of particular interest in the near term forhigh-throughput applications.Another novel and striking result of the present study is that
both the GIST and HSA models provide clear signals thatligands can gain affinity by displacing energetically unfavorablebinding site water, whereas the displacement of entropicallyunfavorable water seems to play a negligible role. Theenergetically unfavorable water highlighted by this studylocalizes at hydrophobic patches of the protein surface, perhapsespecially in concave regions where water molecules areexpected to lose hydrogen bonds.60 The concept that energymay outweigh entropy in cases of strong hydrophobic bindinghas been raised before,61,62 in both experimental8,63−66 andcomputational67,68 contexts. Nonetheless, water entropy istypically thought to play a central role in hydrophobicbinding.69−72 Here, interestingly, neither the GIST or HSAmodels made a compelling case that the displacement ofentropically unfavorable water consistently enhances affinity.We conjecture that the lack of a clear correlation of waterentropy with affinity may reflect the fact that low water entropyoften results from energetically favorable water−proteininteractions, so that water may actually be quite stable inmany locations where its entropy is low. This view is consistentwith the experimental observation that the entropy of hydrationof small ions is strongly negative,73 although the free energy isalso strongly negative. It may be possible in the future to devisea more sophisticated scoring function that would account forthe enthalpy−entropy compensation between stabilizing energyand destabilizing entropy and focus on regions where thiscompensation breaks down, such as in the binding cavity of thesynthetic host molecule cucurbit[7]uril.28 It is also worthmentioning that different protein binding sites affect waterdifferently, so a different result might be obtained for a differentprotein. Finally, it may be that capturing the entropic aspect ofthe hydrophobic effect requires accounting for water−watercorrelations, which are absent from the one-body entropyconsidered here. If so, the entropy term may become moreimportant once pairwise correlations have been incorporatedinto GIST’s entropy calculations.Our observation that the displacement of high energy water
plays a greater role in ligand scoring than displacement of lowentropy water appears to contrast with a prior HSA-based studyof the same system, where the fitted scoring function placedapproximately equal weight on water energy and entropy.12
However, the range of fitted values for Saff in our HSA modelsnearly spans the value of 0.66 kcal/mol for the correspondingparameter in the prior study, Srwd. In addition, the prior studydid not examine the uncertainty in its fitted energy and entropyparameters or evaluate a scoring function based purely on waterenergy. Therefore, the results of these two studies should notbe regarded as inconsistent.In summary, the grid-based GIST method of extracting
information about hydration thermodynamics from MDsimulations with explicit water has provided encouraging resultsin its first application to protein−ligand binding. It thus appearsto hold significant promise as a broadly applicable method ofunderstanding the role of binding site water in protein−ligandbinding, and as a tool to improve the accuracy of methods fordiscovering high affinity targeted ligands. It is anticipated thatthe detailed representation of water distributions andthermodynamics which GIST affords will make it particularlyinformative. We are currently working to develop suchapplications and to release an open-source implementation of
Journal of Chemical Theory and Computation Article
dx.doi.org/10.1021/ct401110x | J. Chem. Theory Comput. 2014, 10, 2769−27802777
GIST within the AmberTools36 software package for others tostudy and use.
■ ASSOCIATED CONTENT*S Supporting InformationCongeneric ligand pairs. This material is available free of chargevia the Internet at http://pubs.acs.org
■ AUTHOR INFORMATIONCorresponding Authors*E-mail: [email protected].*E-mail: [email protected].
NotesThe authors declare no competing financial interest.
■ ACKNOWLEDGMENTSThis publication was made possible in part by grantsGM061300, GM100946, and GM095417 from the NationalInstitutes of Health. Its contents are solely the responsibility ofthe authors and do not necessarily represent the official viewsof the NIH. We thank Dr. Hari Muddana for his assistance ingenerating RESP charges for the ligands.
■ REFERENCES(1) Ladbury, J. Just Add Water! The Effect of Water on theSpecificity of Protein-Ligand Binding Sites and Its PotentialApplication to Drug Design. Chem. Biol. 1996, 3, 973−980.(2) Li, Z.; Lazaridis, T. Thermodynamic Contributions of theOrdered Water Molecule in HIV-1 Protease. J. Am. Chem. Soc. 2003,125, 6636−6637.(3) García-Sosa, A. T.; Firth-Clark, S.; Mancera, R. L. IncludingTightly-Bound Water Molecules in de Novo Drug Design.Exemplification through the in Silico Generation of Poly(ADP-Ribose)polymerase Ligands. J. Chem. Inf. Model. 2005, 45, 624−633.(4) Li, Z.; Lazaridis, T. Thermodynamics of Buried Water Clusters ata Protein-Ligand Binding Interface. J. Phys. Chem. B 2006, 110, 1464−1475.(5) Mancera, R. Molecular Modeling of Hydration in Drug Design.Curr. Opin. Drug Discovery Dev. 2007, 10, 275−280.(6) Wong, S.; Lightstone, F. Accounting for Water Molecules in DrugDesign. Expert Opin. Drug Discovery 2011, 6, 65−74.(7) Poornima, C. S.; Dean, P. M. Hydration in Drug Design. 1.Multiple Hydrogen-Bonding Features of Water Molecules inMediating Protein-Ligand Interactions. J. Comput.-Aided Mol. Des.1995, 9, 500−512.(8) Young, T.; Abel, R.; Kim, B.; Berne, B. J.; Friesner, R. A. Motifsfor Molecular Recognition Exploiting Hydrophobic Enclosure inProtein-Ligand Binding. Proc. Natl. Acad. Sci. U. S. A. 2007, 104, 808−813.(9) Bissantz, C.; Kuhn, B.; Stahl, M. A Medicinal Chemist’s Guide toMolecular Interactions. J. Med. Chem. 2010, 53, 5061−5084.(10) Baron, R.; Setny, P.; Andrew McCammon, J. Water in Cavity−Ligand Recognition. J. Am. Chem. Soc. 2010, 132, 12091−12097.(11) Riniker, S.; Barandun, L. J.; Diederich, F.; Kramer, O.; Steffen,A.; van Gunsteren, W. F. Free Enthalpies of Replacing WaterMolecules in Protein Binding Pockets. J. Comput.-Aided Mol. Des.2012, 26, 1293−1309.(12) Abel, R.; Young, T.; Farid, R.; Berne, B. J.; Friesner, R. A. Roleof the Active-Site Solvent in the Thermodynamics of Factor Xa LigandBinding. J. Am. Chem. Soc. 2008, 130, 2817−2831.(13) Abel, R.; Wang, L.; Friesner, R. A.; Berne, B. J. A Displaced-Solvent Functional Analysis of Model Hydrophobic Enclosures. J.Chem. Theory Comput. 2010, 6, 2924−2934.(14) Hummer, G. Molecular Binding: Under Water’s Influence. Nat.Chem. 2010, 2, 906−907.
(15) Green, H. S. The Molecular Theory of Fluids; North-HollandPublishing Company: Amsterdam, 1952.(16) Nettleton, R. E.; Green, M. S. Expression in Terms of MolecularDistribution Functions for the Entropy Density in an Infinite System.J. Chem. Phys. 1958, 29, 1365.(17) Wallace, D. C. On the Role of Density Fluctuations in theEntropy of a Fluid. J. Chem. Phys. 1987, 87, 2282.(18) Baranyai, A.; Evans, D. J. Direct Entropy Calculation fromComputer Simulation of Liquids. Phys. Rev. A 1989, 40, 3817.(19) Morita, T.; Hiroike, K. A New Approach to the Theory ofClassical Fluids. III. Prog. Theor. Phys. 1961, 25, 537−578.(20) Lazaridis, T. Inhomogeneous Fluid Approach to SolvationThermodynamics. 1. Theory. J. Phys. Chem. B 1998, 102, 3531−3541.(21) Lazaridis, T. Inhomogeneous Fluid Approach to SolvationThermodynamics. 2. Applications to Simple Fluids. J. Phys. Chem. B1998, 102, 3542−3550.(22) Kovalenko, A.; Hirata, F. Three-Dimensional Density Profiles ofWater in Contact with a Solute of Arbitrary Shape: A RISM Approach.Chem. Phys. Lett. 1998, 290, 237−244.(23) Imai, T.; Kovalenko, A.; Hirata, F. Solvation Thermodynamicsof Protein Studied by the 3D-RISM Theory. Chem. Phys. Lett. 2004,395, 1−6.(24) Genheden, S.; Luchko, T.; Gusarov, S.; Kovalenko, A.; Ryde, U.An MM/3D-RISM Approach for Ligand Binding Affinities. J. Phys.Chem. B 2010, 114, 8505−8516.(25) Li, Z.; Lazaridis, T. Computing the ThermodynamicContributions of Interfacial Water. Methods Mol. Biol. 2012, 819,393−404.(26) Czapiewski, D.; Zielkiewicz, J. Structural Properties ofHydration Shell Around Various Conformations of Simple Poly-peptides. J. Phys. Chem. B 2010, 114, 4536−4550.(27) Haider, K.; Huggins, D. J. Combining Solvent ThermodynamicProfiles with Functionality Maps of the Hsp90 Binding Site to Predictthe Displacement of Water Molecules. J. Chem. Inf. Model. 2013, 53,2571−2586.(28) Nguyen, C. N.; Kurtzman Young, T.; Gilson, M. K. GridInhomogeneous Solvation Theory: Hydration Structure and Thermo-dynamics of the Miniature Receptor cucurbit[7]uril. J. Chem. Phys.2012, 137, 044101.(29) Nguyen, C.; Gilson, M. K.; Young, T. Structure andThermodynamics of Molecular Hydration via Grid InhomogeneousSolvation Theory. 2011. arXiv: 1108.4876.(30) Singh, H.; Misra, S.; Hnizdo, V.; Fedorowicz, A.; Demchuk, E.Nearest Neighbor Estimates of Entropy. Am. J. Math. Manage. Sci.2003, 23, 301−321.(31) Hnizdo, V.; Darian, E.; Fedorowicz, A.; Demchuk, E.; Li, S.;Singh, H. Nearest-Neighbor Nonparametric Method for Estimatingthe Configurational Entropy of Complex Molecules. J. Comput. Chem.2007, 28, 655−668.(32) Bondi, A. Van Der Waals Volumes and Radii. J. Phys. Chem.1964, 68, 441−451.(33) Pearlstein, R. A.; Hu, Q.-Y.; Zhou, J.; Yowe, D.; Levell, J.; Dale,B.; Kaushik, V. K.; Daniels, D.; Hanrahan, S.; Sherman, W.; Abel, R.New Hypotheses about the Structure−function of ProproteinConvertase Subtilisin/kexin Type 9: Analysis of the Epidermal GrowthFactor-like Repeat A Docking Site Using WaterMap. Proteins: Struct.,Funct., Bioinf. 2010, 78, 2571−2586.(34) Abel, R.; Salam, N. K.; Shelley, J.; Farid, R.; Friesner, R. A.;Sherman, W. Contribution of Explicit Solvent Effects to the BindingAffinity of Small-Molecule Inhibitors in Blood Coagulation FactorSerine Proteases. ChemMedChem 2011, 6, 1049−1066.(35) Beuming, T.; Che, Y.; Abel, R.; Kim, B.; Shanmugasundaram,V.; Sherman, W. Thermodynamic Analysis of Water Molecules at theSurface of Proteins and Applications to Binding Site Prediction andCharacterization. Proteins: Struct., Funct., Bioinf. 2012, 80, 871−883.(36) Case, D. A.; Darden, T. A.; Cheatham, T. E., III; Simmerling, C.L.; Wang, J.; Duke, R. E.; Luo, R.; Walker, R. C.; Zhang, W.; Merz, K.M.; Roberts, B. P.; Hayik, S.; Roitberg, A. E.; Seabra, G.; Swails, J. M.;Kolossvary, I.; Wong, K. F.; Paesani, F.; Vanicek, J.; Wolf, R. M.; Liu,
Journal of Chemical Theory and Computation Article
dx.doi.org/10.1021/ct401110x | J. Chem. Theory Comput. 2014, 10, 2769−27802778

J.; Wu, X.; Brozell, S. R.; Steinbrecher, T.; Gohlke, H.; Cai, Q.; Ye, X.;Wang, J.; Hsieh, M.-J.; Cui, G.; Roe, D. R.; Mathews, D. H.; Seetin, M.G.; Salomon-Ferrer, R.; Sagui, C.; Babin, V.; Luchko, T.; Gusarov, S.;Kovalenko, A.; Kollman, P. A. AMBER 12; University of California:San Francisco, 2012.(37) Bernstein, F. C.; Koetzle, T. F.; Williams, T. F.; G. J. B. Meyer,J.; Brice, M. D.; Rodgers, J. R.; Kennard, O.; Shimanouchi, T.; Tasumi,M. The Protein Data Bank: A Computer-Based Archival File forMacromolecular Structures. J. Mol. Biol. 1977, 112, 535−542.(38) Berman, H. M.; Westbrook, J.; Feng, Z.; Gilliland, G.; Bhat, T.N.; Weissig, H.; Shindyalov, I. N.; Bourne, P. E. The Protein DataBank. Nucleic Acids Res. 2000, 28, 235−242.(39) Adler, M.; Davey, D. D.; Phillips, G. B.; Kim, S. H.; Jancarik, J.;Rumennik, G.; Light, D. R.; Whitlow, M. Preparation, Character-ization, and the Crystal Structure of the Inhibitor ZK-807834 (CI-1031) Complexed with Factor Xa. Biochemistry 2000, 39, 12534−12542.(40) Hornak, V.; Abel, R.; Okur, A.; Strockbine, B.; Roitberg, A.;Simmerling, C. Comparison of Multiple Amber Force Fields andDevelopment of Improved Protein Backbone Parameters. Proteins:Struct., Funct., Bioinf. 2006, 65, 712−725.(41) Jorgensen, W. L.; Chandrasekhar, J.; Madura, J. D.; Impey, R.W.; Klein, M. L. Comparison of Simple Potential Functions forSimulating Liquid Water. J. Chem. Phys. 1983, 79, 926.(42) Salomon-Ferrer, R.; Gotz, A. W.; Poole, D.; Le Grand, S.;Walker, R. C. Routine Microsecond Molecular Dynamics Simulationswith AMBER on GPUs. 2. Explicit Solvent Particle Mesh Ewald. J.Chem. Theory Comput. 2013, 9, 3878−3888.(43) Ryckaert, J.-P.; Ciccotti, G.; Berendsen, H. J. C. NumericalIntegration of the Cartesian Equations of Motion of a System withConstraints: Molecular Dynamics of N-Alkanes. J. Comput. Phys. 1977,23, 327−341.(44) Maignan, S.; Guilloteau, J. P.; Pouzieux, S.; Choi-Sledeski, Y. M.;Becker, M. R.; Klein, S. I.; Ewing, W. R.; Pauls, H. W.; Spada, A. P.;Mikol, V. Crystal Structures of Human Factor Xa Complexed withPotent Inhibitors. J. Med. Chem. 2000, 43, 3226−3232.(45) Nar, H.; Bauer, M.; Schmid, A.; Stassen, J. M.; Wienen, W.;Priepke, H. W.; Kauffmann, I. K.; Ries, U. J.; Hauel, N. H. StructuralBasis for Inhibition Promiscuity of Dual Specific Thrombin and FactorXa Blood Coagulation Inhibitors. Structure 2001, 9, 29−37.(46) Adler, M.; Kochanny, M. J.; Ye, B.; Rumennik, G.; Light, D. R.;Biancalana, S.; Whitlow, M. Crystal Structures of Two PotentNonamidine Inhibitors Bound to Factor Xa. Biochemistry 2002, 41,15514−15523.(47) Guertin, K. R.; Gardner, C. J.; Klein, S. I.; Zulli, A. L.; Czekaj,M.; Gong, Y.; Spada, A. P.; Cheney, D. L.; Maignan, S.; Guilloteau, J.-P.; Brown, K. D.; Colussi, D. J.; Chu, V.; Heran, C. L.; Morgan, S. R.;Bentley, R. G.; Dunwiddie, C. T.; Leadley, R. J.; Pauls, H. W.Optimization of the Beta-Aminoester Class of Factor Xa Inhibitors.Part 2: Identification of FXV673 as a Potent and Selective Inhibitorwith Excellent In Vivo Anticoagulant Activity. Bioorg. Med. Chem. Lett.2002, 12, 1671−1674.(48) Maignan, S.; Guilloteau, J.-P.; Choi-Sledeski, Y. M.; Becker, M.R.; Ewing, W. R.; Pauls, H. W.; Spada, A. P.; Mikol, V. MolecularStructures of Human Factor Xa Complexed with KetopiperazineInhibitors: Preference for a Neutral Group in the S1 Pocket. J. Med.Chem. 2003, 46, 685−690.(49) Matter, H.; Will, D. W.; Nazare, M.; Schreuder, H.; Laux, V.;Wehner, V. Structural Requirements for Factor Xa Inhibition by 3-Oxybenzamides with Neutral P1 Substituents: Combining X-RayCrystallography, 3D-QSAR, and Tailored Scoring Functions. J. Med.Chem. 2005, 48, 3290−3312.(50) Haginoya, N.; Kobayashi, S.; Komoriya, S.; Yoshino, T.; Suzuki,M.; Shimada, T.; Watanabe, K.; Hirokawa, Y.; Furugori, T.; Nagahara,T. Synthesis and Conformational Analysis of a Non-Amidine FactorXa Inhibitor That Incorporates 5-Methyl-4,5,6,7-tetrahydrothiazolo-[5,4-C]pyridine as S4 Binding Element. J. Med. Chem. 2004, 47,5167−5182.
(51) Young, R. J.; Campbell, M.; Borthwick, A. D.; Brown, D.; Burns-Kurtis, C. L.; Chan, C.; Convery, M. A.; Crowe, M. C.; Dayal, S.;Diallo, H.; Kelly, H. A.; King, N. P.; Kleanthous, S.; Mason, A. M.;Mordaunt, J. E.; Patel, C.; Pateman, A. J.; Senger, S.; Shah, G. P.;Smith, P. W.; Watson, N. S.; Weston, H. E.; Zhou, P. Structure- andProperty-Based Design of Factor Xa Inhibitors: Pyrrolidin-2-Ones withAcyclic Alanyl Amides as P4Motifs. Bioorg. Med. Chem. Lett. 2006, 16,5953−5957.(52) Quan, M. L.; Lam, P. Y. S.; Han, Q.; Pinto, D. J. P.; He, M. Y.;Li, R.; Ellis, C. D.; Clark, C. G.; Teleha, C. A.; Sun, J.-H.; Alexander, R.S.; Bai, S.; Luettgen, J. M.; Knabb, R. M.; Wong, P. C.; Wexler, R. R.Discovery of 1-(3′-Aminobenzisoxazol-5′-Yl)-3-Trifluoromethyl-N-[2-Fluoro-4- [(2′-Dimethylaminomethyl)imidazol-1-Yl]phenyl]-1H-Pyra-zole-5-Carboxyamide Hydrochloride (razaxaban), a Highly Potent,Selective, and Orally Bioavailable Factor Xa Inhibitor. J. Med. Chem.2005, 48, 1729−1744.(53) Nazare, M.; Will, D. W.; Matter, H.; Schreuder, H.; Ritter, K.;Urmann, M.; Essrich, M.; Bauer, A.; Wagner, M.; Czech, J.; Lorenz,M.; Laux, V.; Wehner, V. Probing the Subpockets of Factor Xa RevealsTwo Binding Modes for Inhibitors Based on a 2-CarboxyindoleScaffold: A Study Combining Structure-Activity Relationship and X-Ray Crystallography. J. Med. Chem. 2005, 48, 4511−4525.(54) Pinto, D. J. P.; Orwat, M. J.; Quan, M. L.; Han, Q.; Galemmo, R.A., Jr.; Amparo, E.; Wells, B.; Ellis, C.; He, M. Y.; Alexander, R. S.;Rossi, K. A.; Smallwood, A.; Wong, P. C.; Luettgen, J. M.; Rendina, A.R.; Knabb, R. M.; Mersinger, L.; Kettner, C.; Bai, S.; He, K.; Wexler, R.R.; Lam, P. Y. S. 1-[3-Aminobenzisoxazol-5′-Yl]-3-Trifluoromethyl-6-[2′-(3-(R)-Hydroxy-N-Pyrrolidinyl)methyl-[1,1′]-Biphen-4-Yl]-1,4,5,6-Tetrahydropyrazolo-[3,4-C]-Pyridin-7-One (BMS-740808) aHighly Potent, Selective, Efficacious, and Orally Bioavailable Inhibitorof Blood Coagulation Factor Xa. Bioorg. Med. Chem. Lett. 2006, 16,4141−4147.(55) Matter, H.; Defossa, E.; Heinelt, U.; Blohm, P.-M.; Schneider,D.; Muller, A.; Herok, S.; Schreuder, H.; Liesum, A.; Brachvogel, V.;Lonze, P.; Walser, A.; Al-Obeidi, F.; Wildgoose, P. Design andQuantitative Structure-Activity Relationship of 3-Amidinobenzyl-1H-Indole-2-Carboxamides as Potent, Nonchiral, and Selective Inhibitorsof Blood Coagulation Factor Xa. J. Med. Chem. 2002, 45, 2749−2769.(56) Bayly, C. I.; Cieplak, P.; Cornell, W. D.; Kollman, P. A. A Well-Behaved Electrostatic Potential Based Method Using Charge-Restraints for Deriving Charges: The RESP Model. J. Phys. Chem.1993, 97, 10269−10280.(57) Wang, J.; Wolf, R.; Caldwell, J.; Kollman, P.; Case, D.Development and Testing of a General Amber Force Field. J. Comput.Chem. 2004, 25, 1157−1174.(58) Humphrey, W.; Dalke, A.; Schulten, K. VMD -Visual MolecularDynamics. J. Mol. Graphics 1996, 14, 33−38.(59) Raman, E. P.; MacKerrell, A. D., Jr. Rapid Estimation ofHydration Thermodynamics of Macromolecular Regions. J. Chem.Phys. 2013, 139, 055105.(60) Sharp, K.; Nicholls, A.; Fine, R.; Honig, B. Reconciling theMagnitude of the Microscopic and Macroscopic Hydrophobic Effects.Science 1991, 252, 106−109.(61) Lazaridis, T. Hydrophobic Effect. In eLS; John Wiley & Sons,Ltd: Chichester, U. K., 2001.(62) Lazaridis, T. Hydrophobic Effect. eLS; John Wiley & Sons, Ltd.:Chichester, U. K., 2013; pp 1−9.(63) Bingham, R. J.; Findlay, J. B. C.; Hsieh, S.-Y.; Kalverda, A. P.;Kjellberg, A.; Perazzolo, C.; Phillips, S. E. V.; Seshadri, K.; Trinh, C.H.; Turnbull, W. B.; Bodenhausen, G.; Homans, S. W. Thermody-namics of Binding of 2-Methoxy-3-Isopropylpyrazine and 2-Methoxy-3-Isobutylpyrazine to the Major Urinary Protein. J. Am. Chem. Soc.2004, 126, 1675−1681.(64) Englert, L.; Biela, A.; Zayed, M.; Heine, A.; Hangauer, D.; Klebe,G. Displacement of Disordered Water Molecules from HydrophobicPocket Creates Enthalpic Signature: Binding of Phosphonamidate tothe S1′-Pocket of Thermolysin. Biochim. Biophys. Acta, Gen. Subj. 2010,1800, 1192−1202.
Journal of Chemical Theory and Computation Article
dx.doi.org/10.1021/ct401110x | J. Chem. Theory Comput. 2014, 10, 2769−27802779
(65) Biela, A.; Nasief, N. N.; Betz, M.; Heine, A.; Hangauer, D.;Klebe, G. Dissecting the Hydrophobic Effect on the Molecular Level:The Role of Water, Enthalpy, and Entropy in Ligand Binding toThermolysin. Angew. Chem., Int. Ed. 2013, 52, 1822−1828.(66) Young, T.; Hua, L.; Huang, X.; Abel, R.; Friesner, R.; Berne, B. J.Dewetting Transitions in Protein Cavities. Proteins: Struct., Funct.,Bioinf. 2010, 78, 1856−1869.(67) Lemieux, R. U. How Water Provides the Impetus for MolecularRecognition in Aqueous Solution. Acc. Chem. Res. 1996, 29, 373−380.(68) Setny, P.; Baron, R.; McCammon, J. A. How Can HydrophobicAssociation Be Enthalpy Driven? J. Chem. Theory Comput. 2010, 6,2866−2871.(69) Frank, H. S.; Evans, M. W. Free Volume and Entropy inCondensed Systems III. Entropy in Binary Liquid Mixtures; PartialMolal Entropy in Dilute Solutions; Structure and Thermodynamics inAqueous Electrolytes. J. Chem. Phys. 1945, 13, 507.(70) Kauzmann, W. Some Factors in the Interpretation of ProteinDenaturation. Adv. Prot. Chem. 1959, 14, 1−63.(71) Eisenberg, D.; Kauzmann, W. The Structure and Properties ofWater; 1st ed.; Oxford University Press: New York, 1969.(72) Ashbaugh, H. S.; Paulaitis, M. E. Entropy of HydrophobicHydration: Extension to Hydrophobic Chains. J. Phys. Chem. 1996,100, 1900−1913.(73) Marcus, Y.; Loewenschuss, A. Chapter 4. Standard Entropies ofHydration of Ions. Annu. Rep. Prog. Chem., Sect. C: Phys. Chem. 1984,81, 81−135.
Journal of Chemical Theory and Computation Article
dx.doi.org/10.1021/ct401110x | J. Chem. Theory Comput. 2014, 10, 2769−27802780