thermohaline and wind-driven circulation - cgd · thermohaline and wind-driven circulation ......
TRANSCRIPT

Thermohaline and wind-driven circulation
Annalisa Bracco Georgia Institute of Technology
School of Earth and Atmospheric Sciences
NCAR ASP Colloquium: Carbon climate connections in the Earth System

Tracer conservation and ocean transport The tracer conservation equation describes the time rate of change of a tracer at a given point and the processes that change its concentration
The processes include 1. transport and mixing → physical (decrease
vertical contrast) 2. sources and sinks → biological and chemical
transformations (increase nutrient concentrations in deep waters)

The tracer conservation eq. for a volume at a fixed location is
where SMS(C) (mmol m-3 s-1) represents internal
sources minus sinks
( )advection diffusion
C C C SMS Ct t t
∂ ∂ ∂= + +
∂ ∂ ∂

Advection
The large-scale, depth integrated ocean circulation:
n The Meridional Overturning Circulation (MOC) or
Thermohaline circulation n The wind-drive gyre circulation

The MOC (or thermohaline circulation) n The meridional overturning circulation is associated to
the abyssal circulation in the ocean. In reality is not independent on the wind circulation, but a representation of it can be obtained considering buoyancy effects alone
n It is also called thermohaline circulation because is driven principally –not exclusively- by temperature and salinity
n A satisfactory theory explaining the MOC is not available. Simple models lack important components and are not as complete and ‘clear’ as the one describing the wind-driven circulation

(From Siedler, 2001, figure 1.2.7, as taken from Schmitz, 1996).

The MOC

Antarctic Bottom Water (AABW)
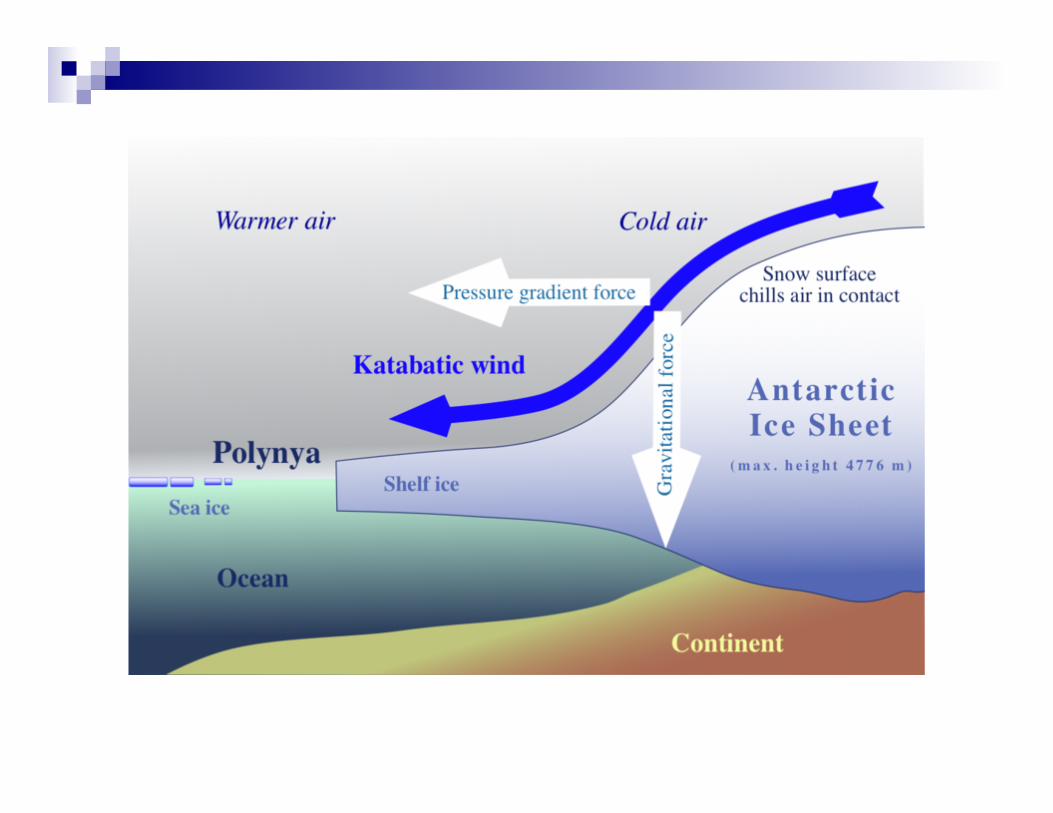
n When sea ice freezes, it leaves salt behind n Adds salt to coldest water on earth around Antarctica n Becomes the densest water in the ocean and sinks
Antarctic Polynya

Formation of Antarctic Bottom Waters

Weddell Polynya
06/1974
06/1975
06/1976
Ross Sea Polynya
Ross Sea image from MODIS (from Kwot et al., 2007)
2005

Spread of the AABW

from Sarmiento & Gruber, 2006
at 3500m with respect to preindustrial atmosphere

n Most of the stratification is concentrated in the first upper kilometer
n The relatively unstratified abyss water originates at high latitudes (the outcropping happens only in the North Atlantic subpolar gyre and in the Antarctic Circumpolar Current (ACC))

MOC plays a key role in n transporting nutrients n modulating biological productivity
n Broad nutrient distributions reflects temperature but with greater basin-to-basin and vertical contrasts (iron is an exception)

Associated with the MOC there is a distinctive stratification. n Most of stratification is concentrated in the first upper kilometer n The relatively unstratified abyss water originates at high latitudes
(with outcropping only in the North Atlantic subpolar gyre and in the Antarctic Circumpolar Current - ACC)
from Sarmiento & Gruber, 2006

Potential temperature
from Sarmiento & Gruber, 2006

North-south sections of (a) temperature, (b) salinity, and (c) oxygen along the 30oW transect in the Atlantic ocean. Note the salinity tongues indicating the interleaving of water masses from sources in the Antarctic and the North Atlantic.

Map of salinity at 25W in the NA showing salinity maximum of MOW (30-40N at 1000m), salinity minimum of LSW (40-60N at 1500-2000m). Also - salinity minimum of AAIW (south of 20N at 500-1000m) and overall salinity maximum of NADW (south of 20N and 1500-3000m)

from Williams and Follows, 2003

from Sarmiento
et al., 2004
The Southern Ocean (SO) plays a key role in the nutrient supply to the thermocline
The Subantarctic Mode Water (SAWM) represents the main conduit of nutrients from the SO
Global maps of nutrient properties mapped on the potential density surface σθ = 26.80. Si* = [Si(OH)4] - [NO3
-] ~ -10 : -15 µmolkg-1 at SAWM formation sites

Schematic showing SO control on thermocline nutrient concentrations from Sarmiento et al., 2004 Top: water pathways. Bottom: surface processes at play CDW=circumpolar Deep Water APF=Antarctic Polar Front PFZ=Polar Front Zone AAIW= Antarctic Intermediate Water SAMW=Subantarctic Mode Water SAF=Subantarctic Front SAZ=Subantarctic Zone STF=Subtropical Front
" The overturning circulation determines the broad patterns in the global distribution of nutrients (N, P, Si) (but not of iron! for which Atlantic > Indian > Pacific > Southern Ocean)
" However, on seasonal to interannual time scales biological productivity is more sensitive to the basin-scale gyre circulation

The wind-driven circulation
from Vallis, 2006

from Sarmiento & Gruber, 2006
n The large-scale surface circulation consists of subpolar
(cyclonic) and subtropical (anticyclonic)gyres
n Exception at the equator surface currents are predominantly westwards and the vertical integrated flow is eastward
n The gyres are strongest in the west intensification of western boundary currents
n Western boundary currents from subpolar and subtropical gyres lead to the Gulf Stream, Kuroshio and Brazilian currents

The zero-order features of the ocean gyre circulation has been described by a steady, forced-dissipative, homogeneous model proposed by Stommel (1948)
from Vallis, 2006

The Stommel model The planetary geostrophic eq. for a Boussinesq fluid in the
limit of small Rossby number are:
DbDt
= b
∇⋅v = 0
f ×u = −∇φ + 1
ρo
∂τ∂z
∂φ∂z
= b
thermodynamic eq continuity horizontal momentum (geostrophic balance + wind stress) vertical momentum (geostrophic balance)

cyclonic circulation anticyclonic circulation
Upwelling and downwelling associated to the Ekman transport
from Sarmiento & Gruber, 2006

and to equatorial divergence and subtropical convergence
from Sarmiento & Gruber, 2006

averaged vertical velocities
from Sarmiento & Gruber, 2006

Focusing on the averaged concentration of nitrate
observed

from Williams and Follows, 1998
impact on biogeochemistry: production associated with the vertical velocities in the gyres

impact on biogeochemistry: production associated with the horizontal velocities

Tracer conservation equation
= Advection + diffusion + reaction The advection due to the large scale circulation
(wind-driven + MOC) explains the average distribution of chemicals in the absence of biological reactions
tC∂
∂

modeled distribution of nitrate in the absence of biology
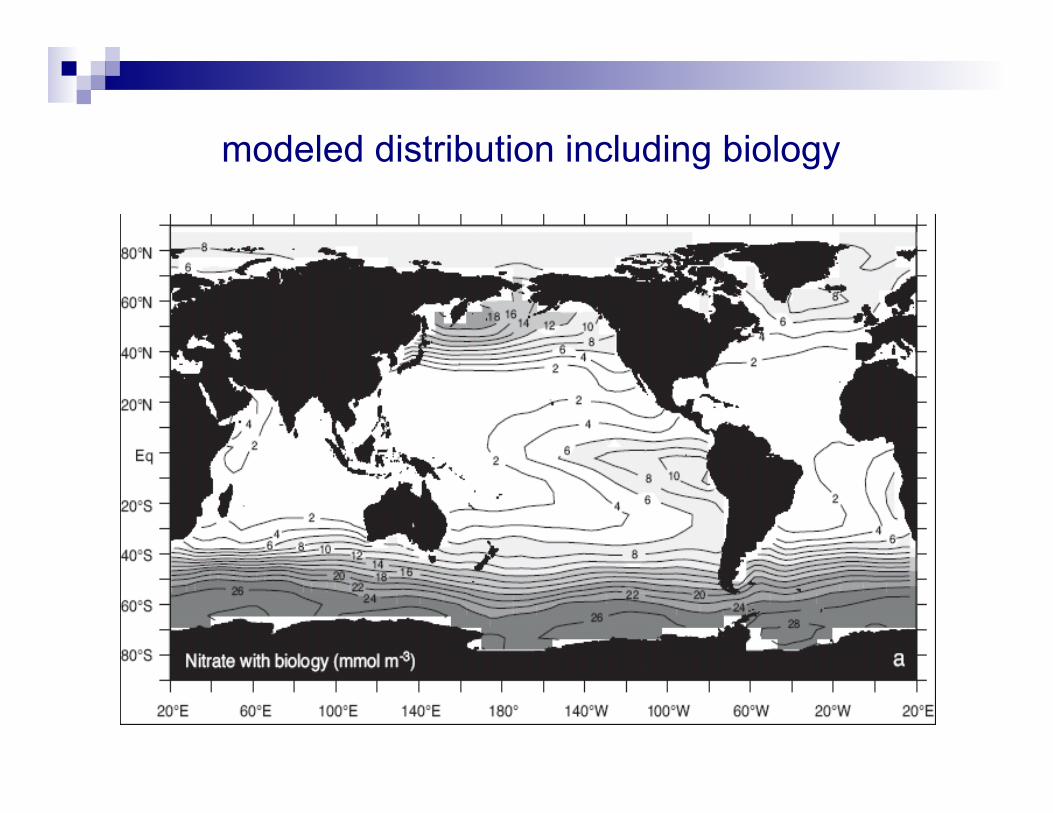
modeled distribution including biology

What else?
n Time-dependence: so far steady state circulation. By including time dependence we add a rich set of processes (waves, eddies, convection) and various modes of climate variability from intraseasonal to inderdecadal (ENSO, NAO, PDO, NPGO etc….)
n (Diffusion – molecular, turbulent diffusion...)