thermomechanical analysis of material behaviour - … 2015... · of material behaviour - strong...
TRANSCRIPT
Thermomechanical analysis of material behaviour - strong coupling effects to quantify stresses
Janice Dulieu-Barton Richard Fruehmann, Duncan Crump, Rachael Waugh, Gary Battams

2
Summary
• Background to IRT/TSA
• Application to actual structure
• Damage studies
• Field work – strain based NDE
3
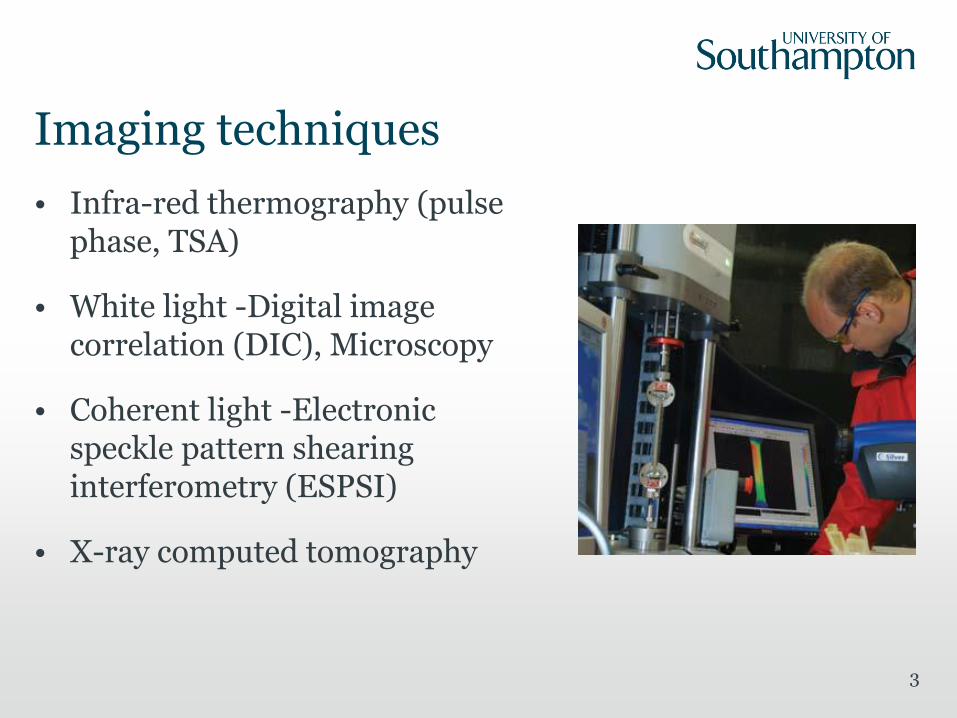
Imaging techniques
• Infra-red thermography (pulse phase, TSA)
• White light -Digital image correlation (DIC), Microscopy
• Coherent light -Electronic speckle pattern shearing interferometry (ESPSI)
• X-ray computed tomography

Thermography overview
4
• Infrared Thermography (IRT)
• Pulsed and Pulsed Phase Thermography (PPT)
• Thermoelastic Stress Analysis (TSA)
Stress vs Time
-1
1
0 1
time
Str
ess
Temperature vs Time
-1
0
1
0 1
Time
Tem
per
atu
re
5
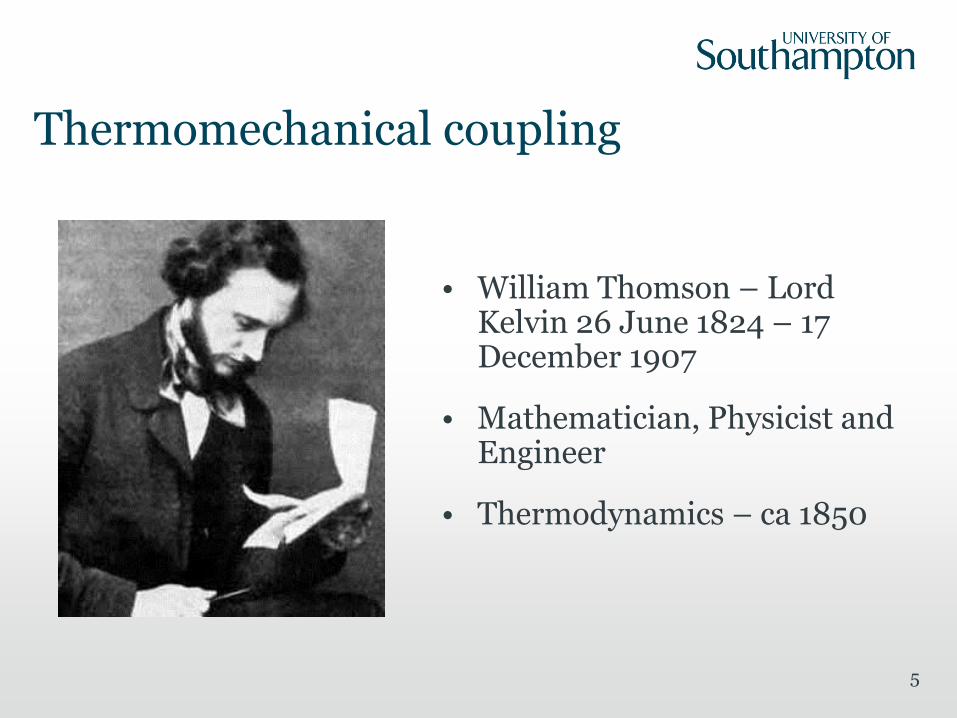
Thermomechanical coupling
• William Thomson – Lord Kelvin 26 June 1824 – 17 December 1907
• Mathematician, Physicist and Engineer
• Thermodynamics – ca 1850
6
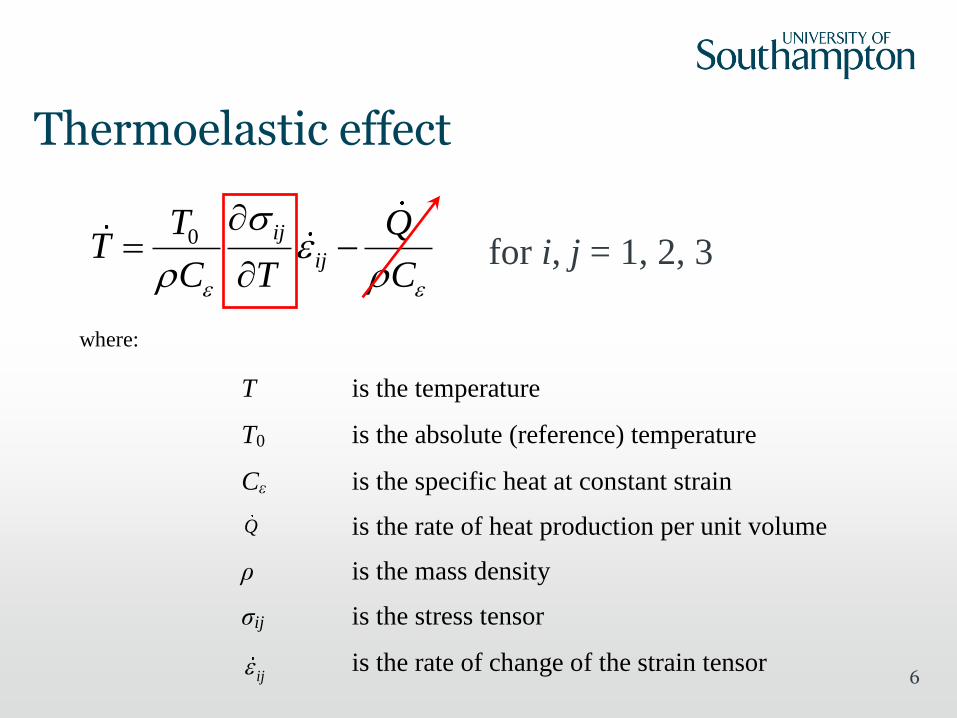
Thermoelastic effect
0 ij
ij
T QT
C T C
for i, j = 1, 2, 3
where:
T is the temperature
T0 is the absolute (reference) temperature
Cε is the specific heat at constant strain
Q is the rate of heat production per unit volume
ρ is the mass density
σij is the stress tensor
ij is the rate of change of the strain tensor

7
Thermoelastic stress analysis
21
pC
TT
2211
pC
TT

8
Stress-strain temperature equations
2 ( )ij ij kk ijT 1 for
0 forij
i j
i j
)23( 2(1 )
E
(1 )(1 2 )
E
2ij
ij kk ijTT T T T
ij
ijT
Neglecting temperature derivatives of the material elastic properties

9
Thermoelastic equation
0kk
TT
C
0
2
1 2
3kk
TT
C E
kk is the rate of change of the sum of the first stress
invariant (σ11+ σ22+ σ33)
2
03
(1 2 )p
E TC C
0kk
p
TT
C
)(C
TT
p
210
pCK

10

11 1990
2000

Detector specification
• Model:
– Cedip Silver 480 M
(now the FLIR SC5000)
• Array:
– 320 x 256 elements
– 30 μm pitch
– ½” chip (12.3 mm diagonal)
– Indium Antimonide (InSb)
– 3-5 μm wavelength band
• Standard operational range:
– 278 to 583 K
– maximum frame rate: 383 Hz (at full frame)
– sensitivity 4.12 mK / DL (at 298 to 299 K)
(electronic noise ~17 mK)
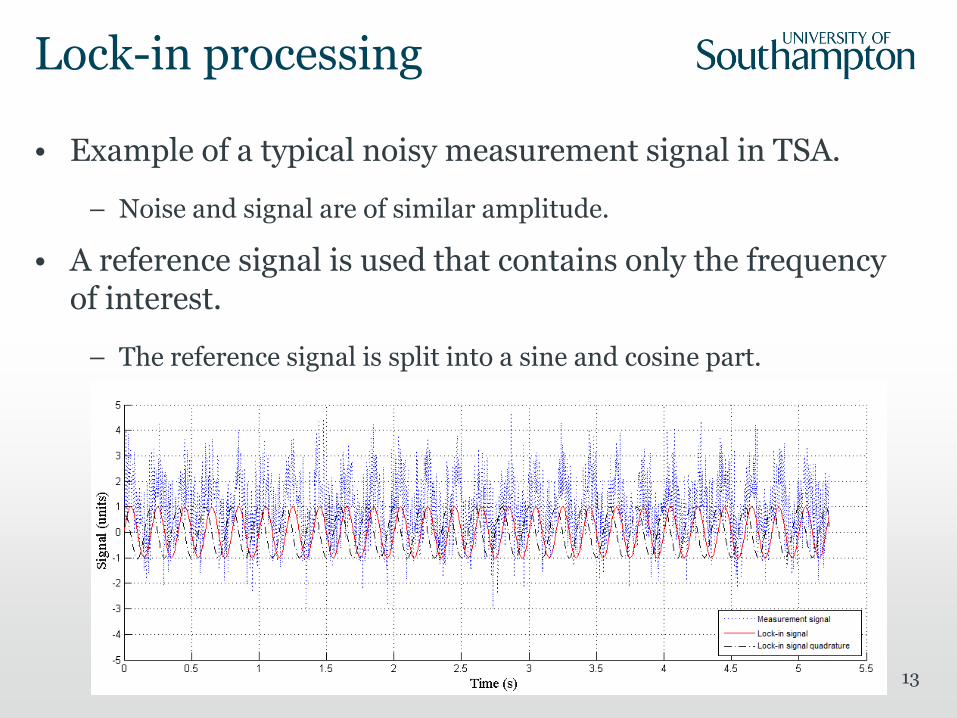
• Example of a typical noisy measurement signal in TSA.
– Noise and signal are of similar amplitude.
• A reference signal is used that contains only the frequency of interest.
– The reference signal is split into a sine and cosine part.
Lock-in processing
13
14
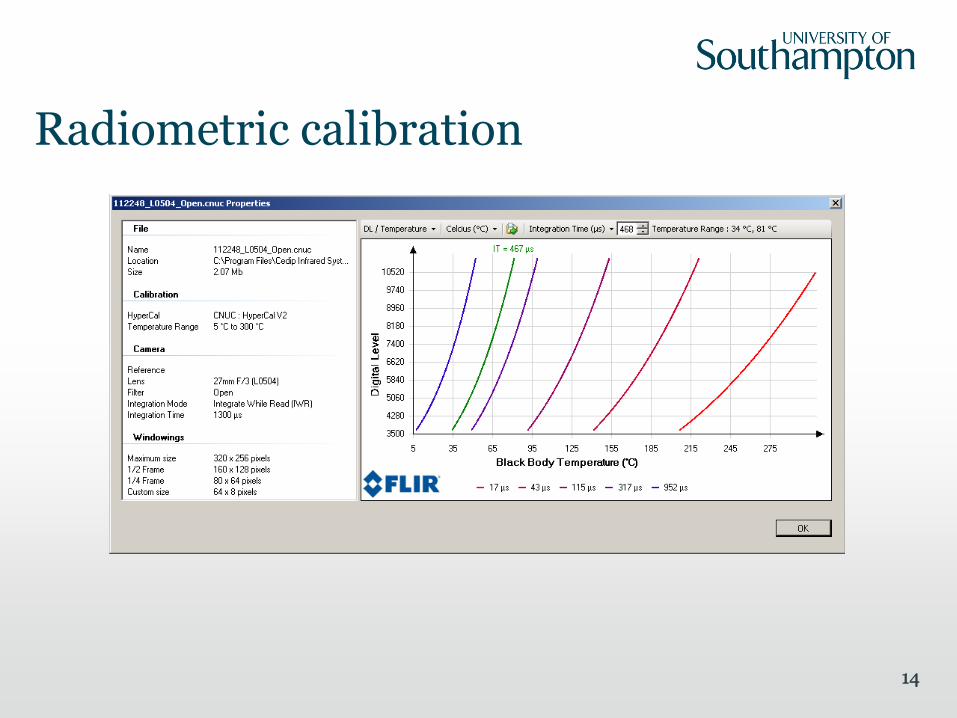
Radiometric calibration
14

15
Derivation of the thermoelastic constant
•Calibration against known stress
)(KTT 21

Why TSA?
• Hetrogeneous materials
• Monitor damage evolution
• Stress metric
• Small parasitic effects - not kinematic
• High resolution
• High speed
16
17
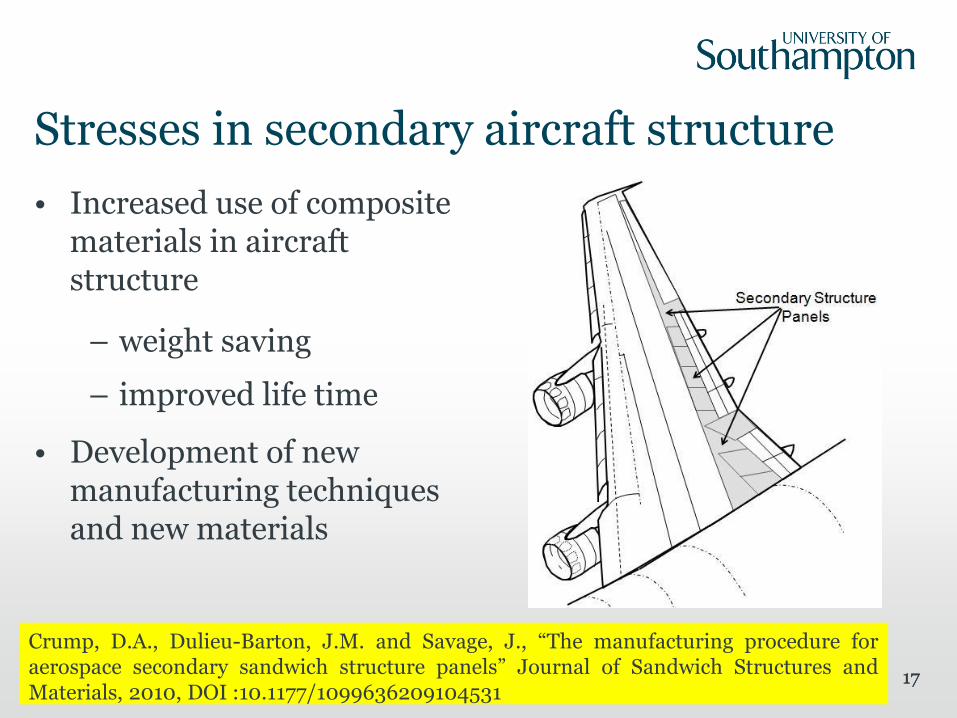
Stresses in secondary aircraft structure
• Increased use of composite materials in aircraft structure
– weight saving
– improved life time
• Development of new manufacturing techniques and new materials
17
Crump, D.A., Dulieu-Barton, J.M. and Savage, J., “The manufacturing procedure for aerospace secondary sandwich structure panels” Journal of Sandwich Structures and Materials, 2010, DOI :10.1177/1099636209104531
18
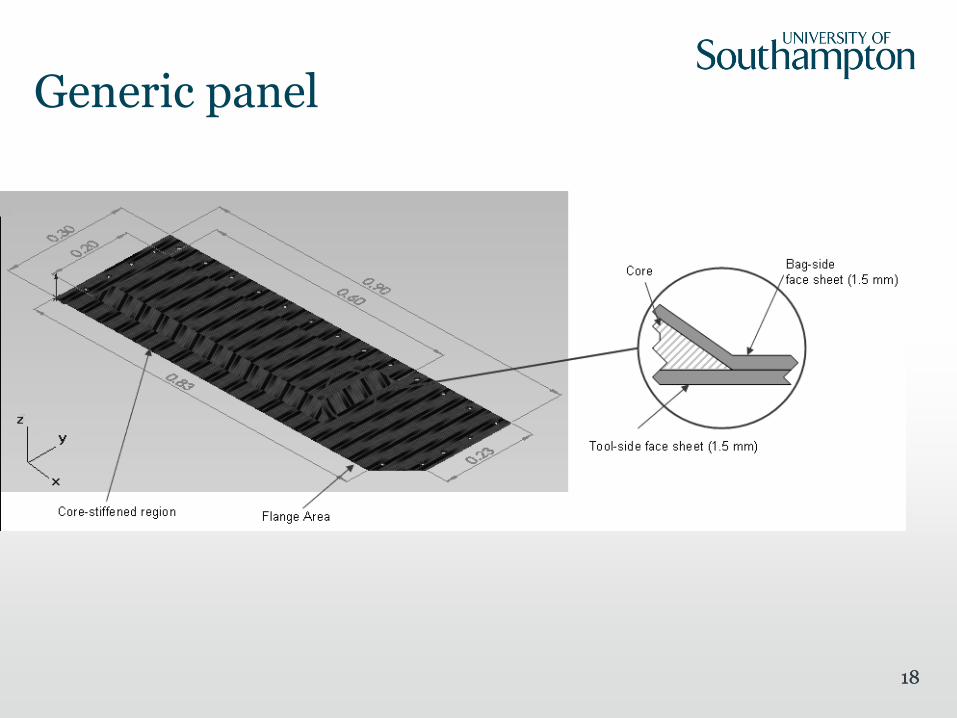
Generic panel
18
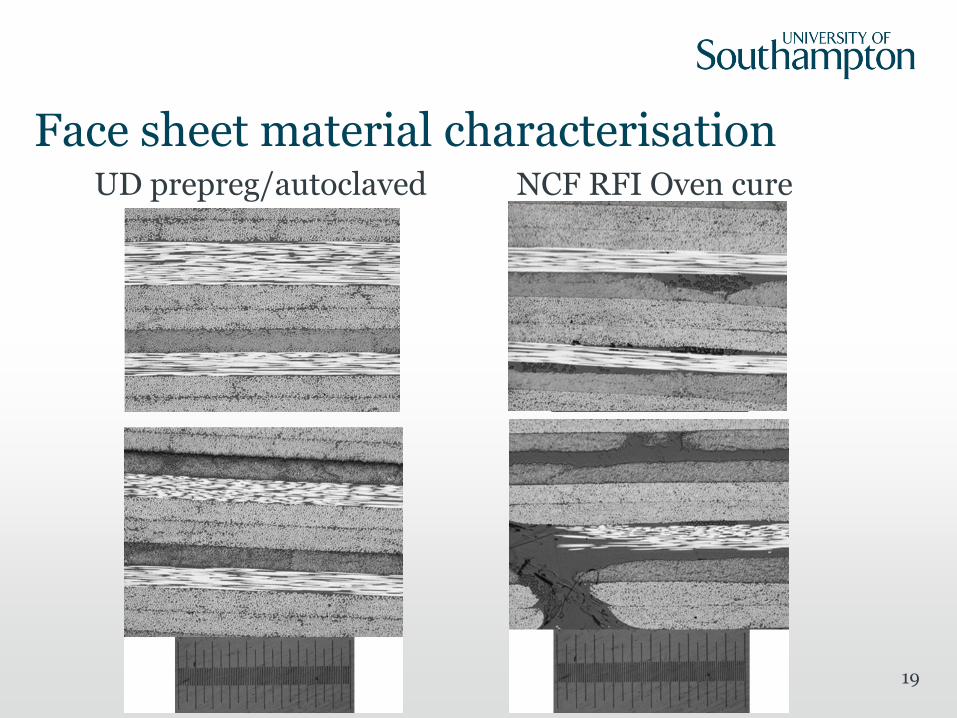
19
Face sheet material characterisation UD prepreg/autoclaved NCF RFI Oven cure
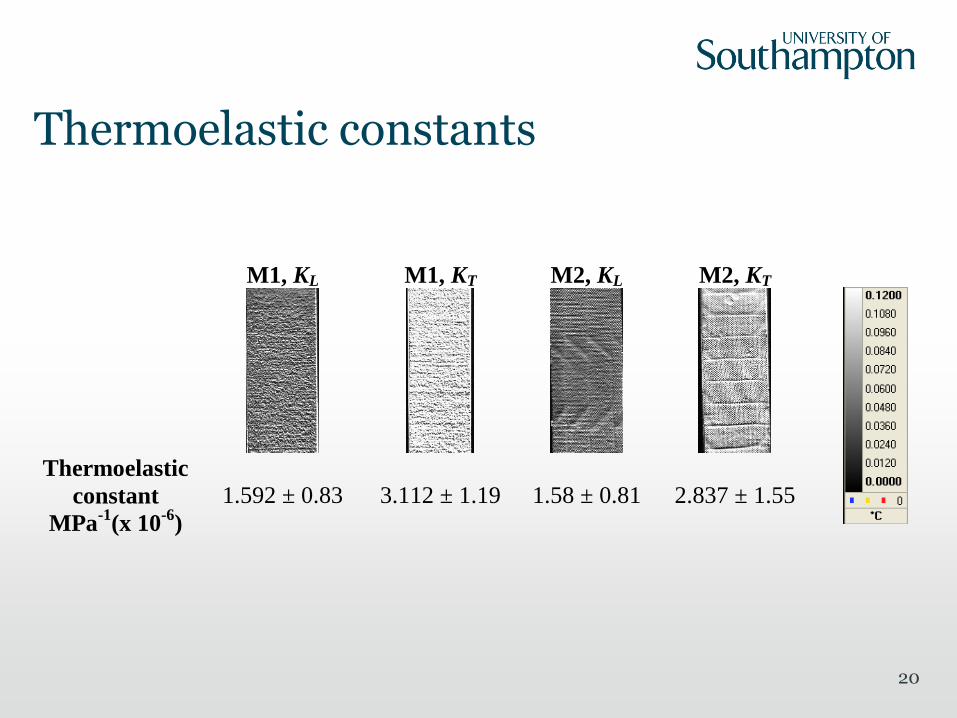
20
Thermoelastic constants
M1, KL M1, KT M2, KL M2, KT
Thermoelastic
constant
MPa-1
(x 10-6
)
1.592 ± 0.83
3.112 ± 1.19
1.58 ± 0.81
2.837 ± 1.55
21
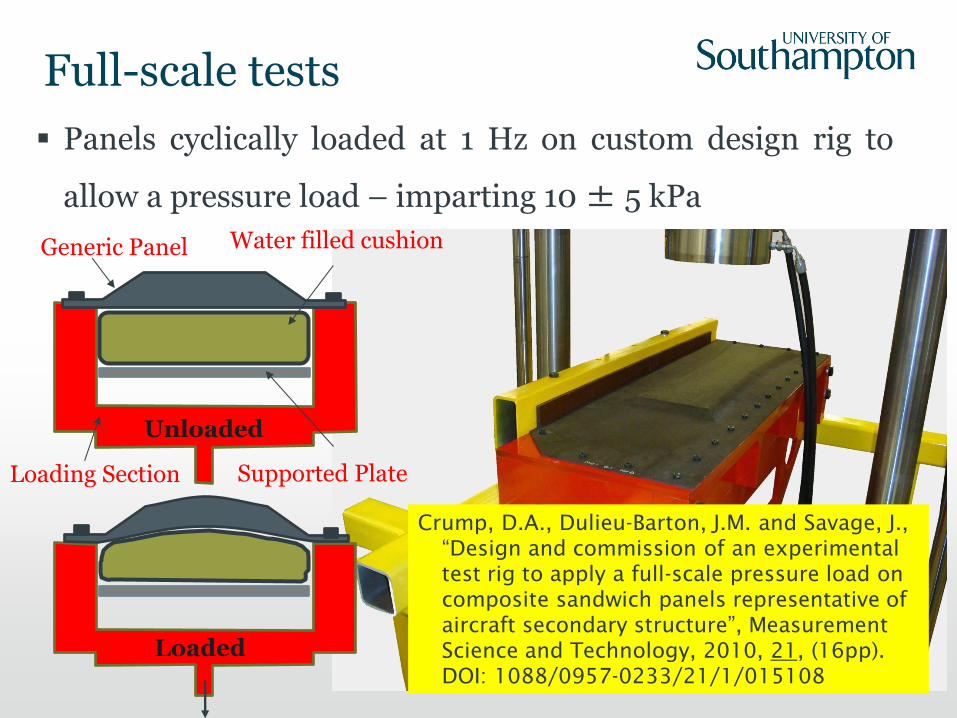
Full-scale tests
Panels cyclically loaded at 1 Hz on custom design rig to
allow a pressure load – imparting 10 ± 5 kPa
Generic Panel
Supported Plate Loading Section
Unloaded
Water filled cushion
Loaded
Crump, D.A., Dulieu-Barton, J.M. and Savage, J.,
“Design and commission of an experimental
test rig to apply a full-scale pressure load on
composite sandwich panels representative of
aircraft secondary structure”, Measurement
Science and Technology, 2010, 21, (16pp).
DOI: 1088/0957-0233/21/1/015108

22
Results
• Standard autoclaved prepreg offered a panel with a maximum deflection of 6.3 mm whilst RFI, NCF panel deformed by 4.6 mm.
• The measured stress response indicated a reduction in stress peak when using RFI and NCF.
Autoclaved RFI, NCF
Crump, D.A. and Dulieu-Barton, J.M., “Performance assessment of aerospace sandwich secondary structure panels using thermoelastic stress analysis”, Plastics, Rubber and Composites, 2010, 39, pp 137-147. DOI: 10.1179/174328910X12647080902691

23
Woven material
• Damage in textile composites can occur at very low stress levels, < 20 % of σf.
• Damage can be identified using TSA despite the heterogeneous thermoelastic material response.
• Phase data provides a means for damage identification without a priori knowledge of the thermoelastic field.
23
Complete set of high resolution TSA data from the
WRE581T specimen loaded at 10 % of the failure stress
Frühmann, R.K., Dulieu-Barton, J.M. and Quinn, S., “Assessment of fatigue damage evolution in woven composite materials using infra-red techniques” Composites Science and Technology, 2010. DOI: /10.1016/j.compscitech.2010.02.009

Is a test machine required?
Frühmann, R.K., Dulieu-Barton, J.M. and Quinn, S., “Thermoelastic stress and damage analysis using transient loading” Experimental Mechanics, 2010. DOI: 10.1007/s11340-009-9295-9
24
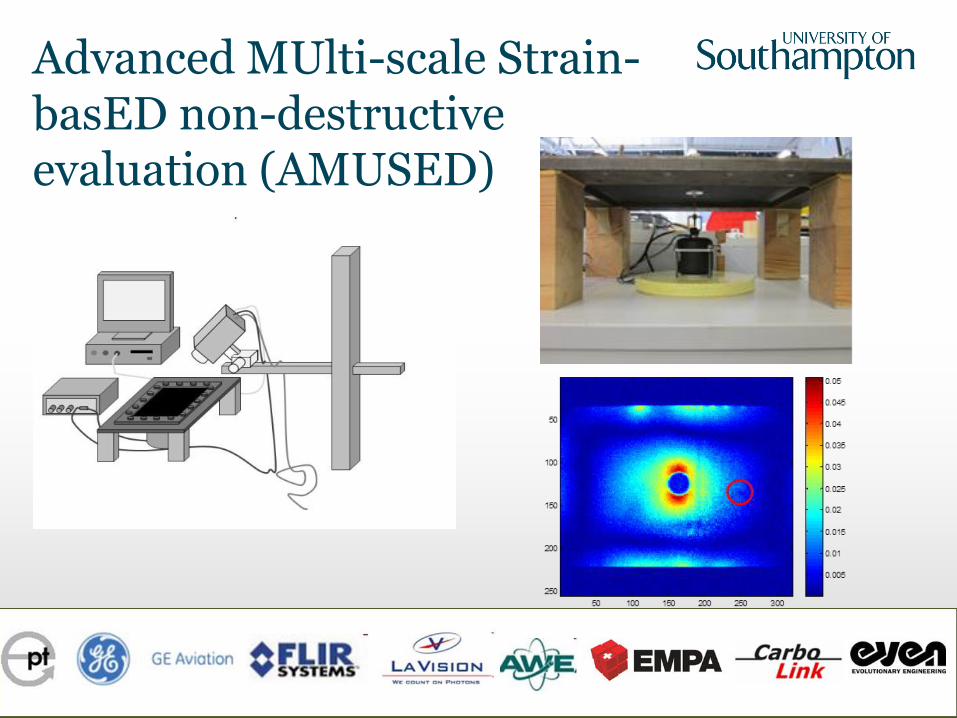
Advanced MUlti-scale Strain-basED non-destructive evaluation (AMUSED)
25
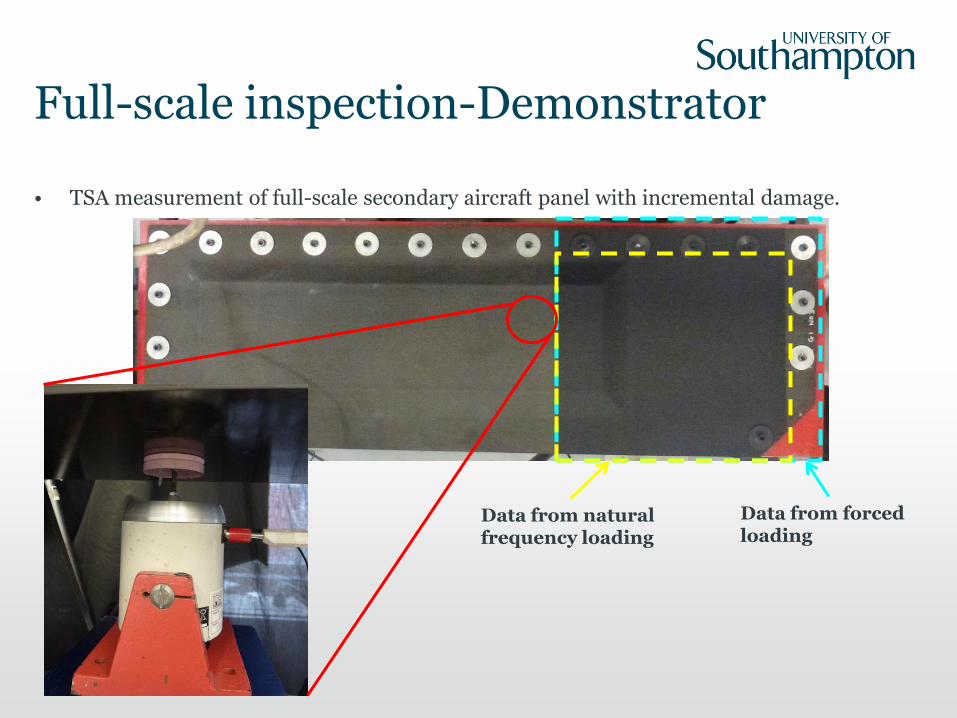
Full-scale inspection-Demonstrator
• TSA measurement of full-scale secondary aircraft panel with incremental damage.
Data from forced loading
Data from natural frequency loading
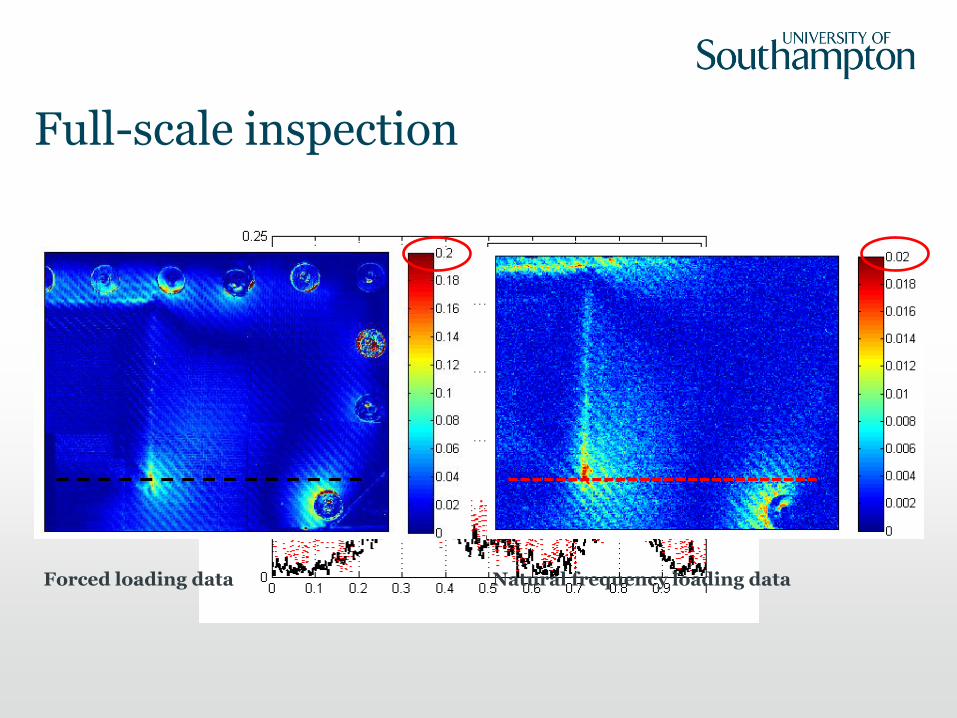
Full-scale inspection
Forced loading data Natural frequency loading data
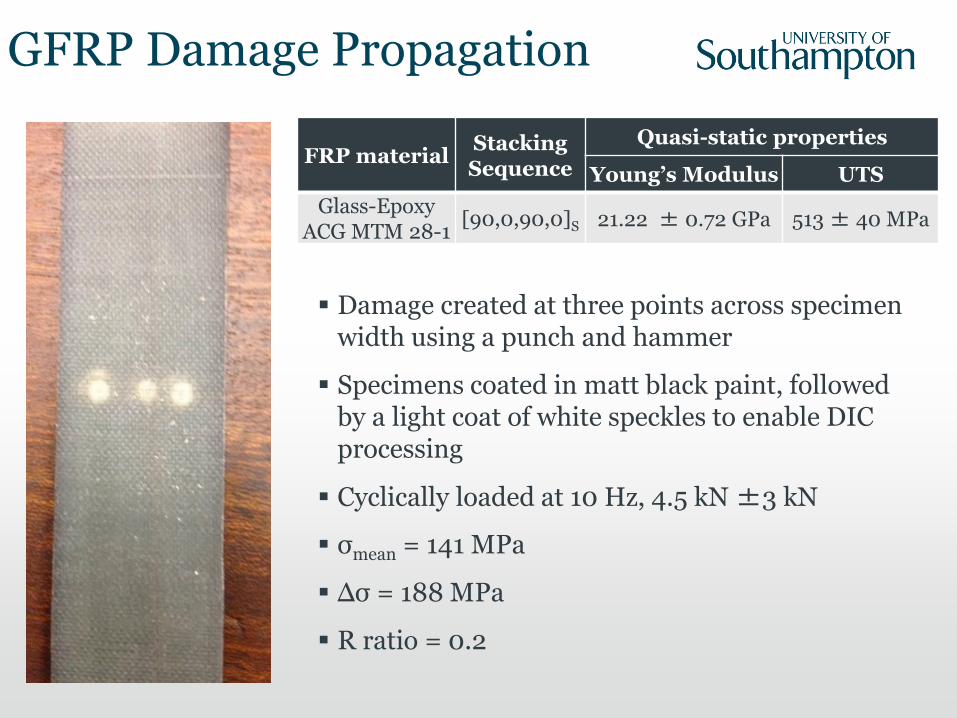
GFRP Damage Propagation
FRP material Stacking Sequence
Quasi-static properties
Young’s Modulus UTS
Glass-Epoxy ACG MTM 28-1
[90,0,90,0]S 21.22 ± 0.72 GPa 513 ± 40 MPa
Damage created at three points across specimen width using a punch and hammer
Specimens coated in matt black paint, followed by a light coat of white speckles to enable DIC processing
Cyclically loaded at 10 Hz, 4.5 kN ±3 kN
σmean = 141 MPa
Δσ = 188 MPa
R ratio = 0.2
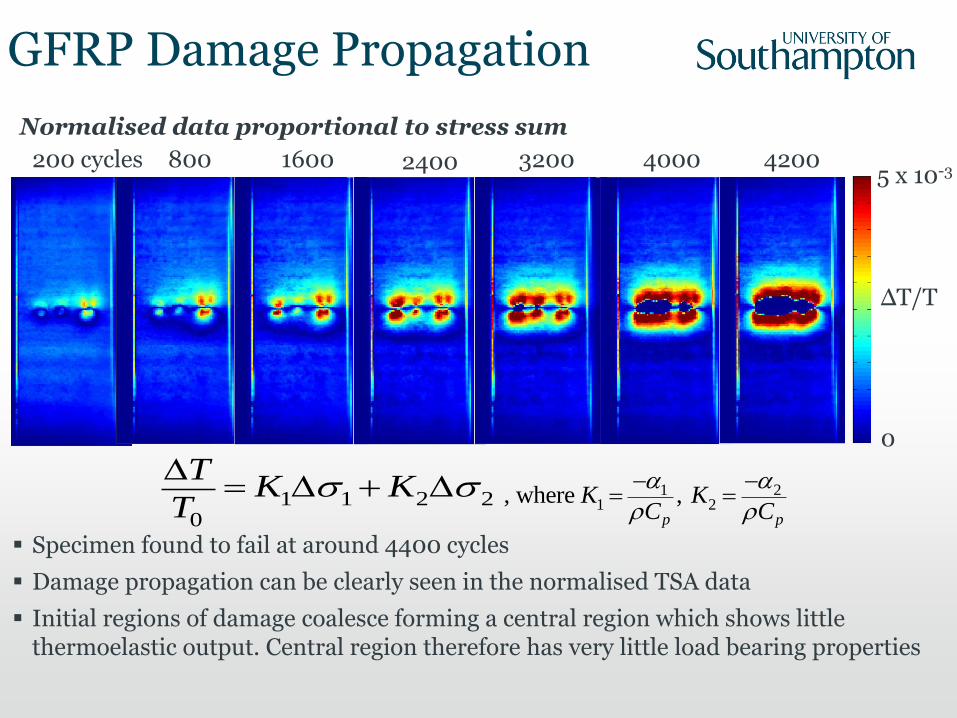
Specimen found to fail at around 4400 cycles
Damage propagation can be clearly seen in the normalised TSA data
Initial regions of damage coalesce forming a central region which shows little thermoelastic output. Central region therefore has very little load bearing properties
GFRP Damage Propagation
1 1 2 20
TK K
T
1 2
1 2, where , p p
K KC C
Normalised data proportional to stress sum
200 cycles 800 1600 2400 3200 4000 4200
ΔT/T
5 x 10⁻³
0

GFRP Damage Propagation
Cell size = 31 x 31 pixels, stepsize of 15
0.32 mm/strain data point
Longitudinal strain εyy
Image correlations performed between an unloaded reference image and images captured at the point of maximum load
εyy (%)
0
5
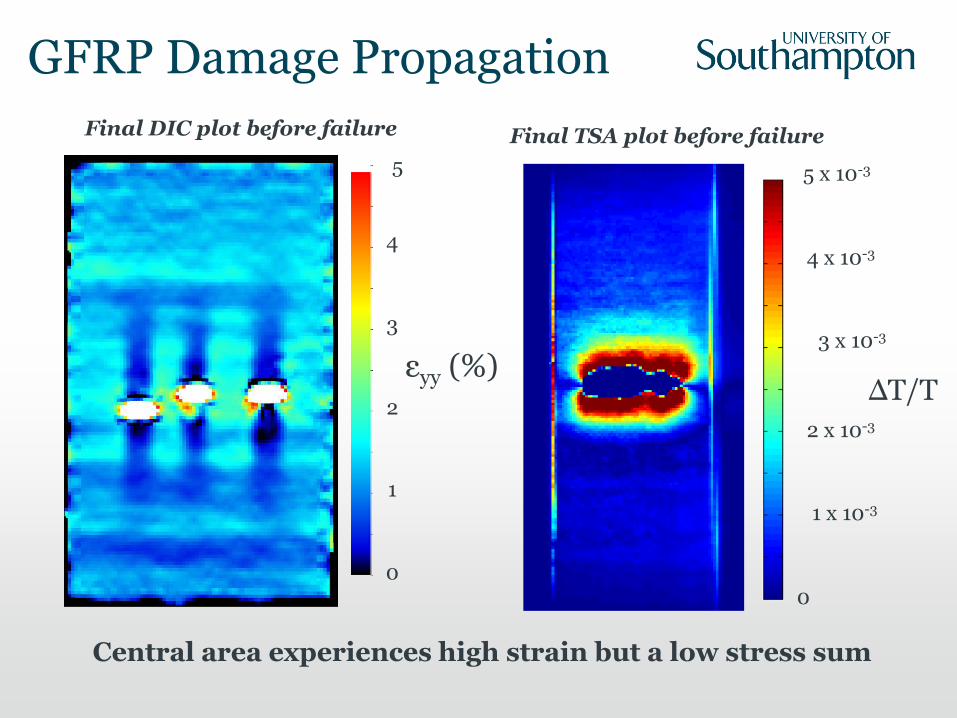
Central area experiences high strain but a low stress sum
Final DIC plot before failure Final TSA plot before failure
εyy (%)
5
0
2
1
3
4
ΔT/T
5 x 10⁻³
0
1 x 10⁻³
2 x 10⁻³
3 x 10⁻³
4 x 10⁻³
GFRP Damage Propagation

Challenges :
1.Triggering the saving of image sets automatically at various points in fatigue cycle without interrupting cyclic load.
2.High resolution white light cameras preferred for enhanced DIC accuracy. Accurate camera triggering and intense light therefore required.
Time
∆σ
Methodology development: Combining TSA and DIC
IR Camera (Cedip Silver 480M)
90°
2 x white light cameras (Manta G504-B/C, 5Mpixel)
Calibrated 3D DIC setup to be used to account for out of plane movement and camera perspective
IR images taken
σm
Load
White light images taken

Lock-in Application to DIC
33
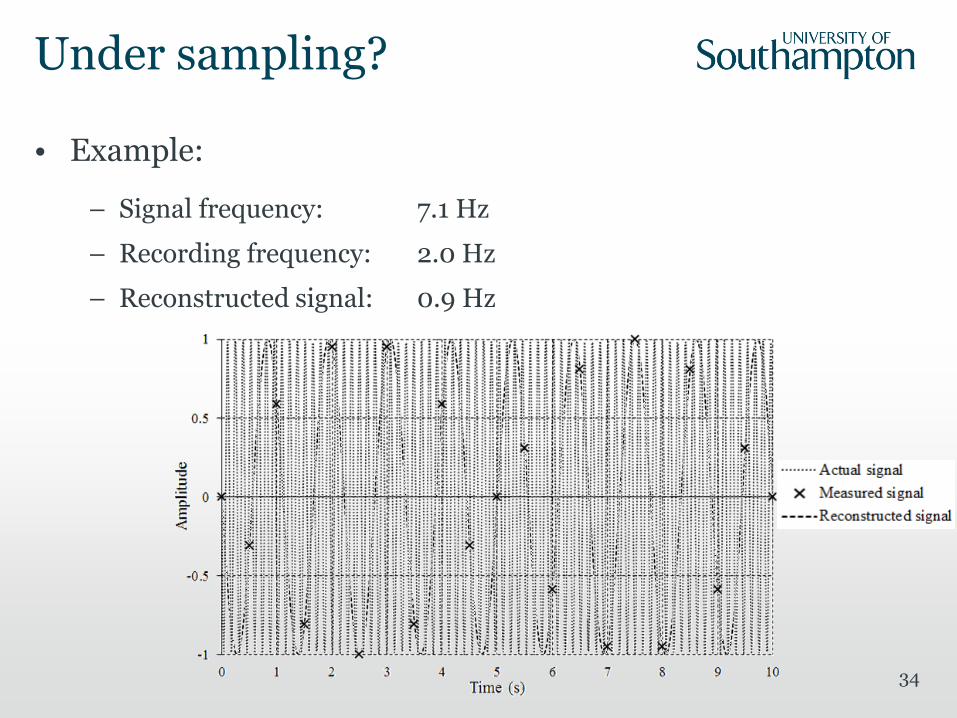
Under sampling?
• Example:
– Signal frequency: 7.1 Hz
– Recording frequency: 2.0 Hz
– Reconstructed signal: 0.9 Hz
34

Brazilian disc
35
• Visual comparison between static and dynamic results.
Static 0.75 Hz
7.1 Hz 21.1 Hz
Fruehmann, R.K., Dulieu-Barton, J.M., Quinn, S., and Tyler, J.P., “Digital image correlation applied to cyclically loaded components,” Optics and Lasers in Engineering. Submitted.

Lock-in DIC and TSA
TSA
Cedip 480M infrared photon detector
20 mK threshold, reduced to ~4 mK
using lock in
Altair and Altair LI software
DIC
3D DIC
2 x LaVision E-lite 5 MP
NILA LED lighting
DaVis software
Loading LDS V201 permanent magnet shaker from Brüel & Kjær Rigid stinger used to impart load attached via beeswax.

Aluminium plate – mode 2
TSA
DIC
ΔT/T
z-displacement
Phase
38
Conclusions
• Introduced TSA and described the basic physics
• Shown how full-field experimental mechanics techniques can be used to validate FEA
• Presented convincing case studies that demonstrate the applicability and ease of using TSA in damage studies
• Shown potential as a strain based NDE technique
• Shown how TSA can be combined with DIC during the same test

Learn more about thermography/TSA
• BSSM Experimental Mechanics Workshop, University of Southampton, 23rd -27th 2015.
• See flyer in pack
• Covers also DIC, GM, ESPI, high speed imaging.
• Hands on
• Data processing
39