these little piigs went to market: austerity and divergent recovery in ...€¦ · ·...
TRANSCRIPT

UCD GEARY INSTITUTE FOR PUBLIC POLICY
DISCUSSION PAPER SERIES
These Little PIIGS Went to Market: Austerity
and Divergent Recovery in the Eurozone
Samuel Brazys
School of Politics and International Relations and Geary Institute for Public Policy
University College Dublin
Aidan Regan
School of Politics and International Relations
University College Dublin
Geary WP2015/17
May 19, 2016
UCD Geary Institute Discussion Papers often represent preliminary work and are circulated to encourage discussion.
Citation of such a paper should account for its provisional character. A revised version may be available directly from
the author.
Any opinions expressed here are those of the author(s) and not those of UCD Geary Institute. Research published in
this series may include views on policy, but the institute itself takes no institutional policy positions.

1
These Little PIIGS Went to Market: Austerity
and Divergent Recovery in the Eurozone
Samuel Brazys and Aidan Regan1
Abstract: The 2008 financial crisis hit few places harder than the European periphery.
Faced with high levels of public debt, Portugal, Italy, Ireland, Greece and Spain (the PIIGS)
were each compelled to implement harsh austerity reforms. Yet despite this common
policy response, the recoveries, particularly in Ireland, have shown significant divergence.
We challenge the prevailing narrative that Ireland’s export-led recovery from the crisis is
due to austerity induced cost competitiveness. Instead, we argue that Ireland’s state-led
enterprise policy situated the country to be a recipient of foreign direct investment driven
by the low borrowing costs, brought on by the United States’ Quantitative Easing (QE)
programs. Using quantitative and qualitative investigation we find evidence that this state-
led enterprise policy mechanism, rather than austerity-induced cost competitiveness, kick
started Ireland’s export growth engine. As Ireland is a critical case for the “success” story
of austerity in Europe, our findings represent a significant challenge to the politics of
adjustment in the Eurozone.
Keywords: Austerity, Crisis, Debt, Ireland, PIIGS, Enterprise Policy
1 Aidan Regan is the Corresponding Author ([email protected]), Lecturer of European Political Economy
and Director of the Dublin European Institute at University College Dublin. Samuel Brazys is Lecturer of
International Relations and Geary Institute Fellow at University College Dublin.
2
“Greece has a role model and that role model is Ireland2”
Jean Claude-Trichet, as President of the European Central Bank (2010)
The fury of the 2008 housing and financial crisis struck few places harder than in the
countries of the Eurozone periphery. Massive shocks to growth, employment and public
finance plunged Portugal, Greece and Ireland into international bailouts and brought Spain
and Italy to the brink of that shared fate. Financial markets, seizing on the long tradition of
considering the poorer performing Southern European economies as “Club Med”, quickly
brought Ireland into the group, with the now infamous political re-branding using the
inflammatory moniker “PIIGS”. This heuristic became synonymous with the crisis in the
European periphery and has since been shown to have driven convergent financial market
treatment of the constituent members during the crisis (Brazys and Hardiman 2015).
Despite qualitatively distinct political economies, domestic problems, and national growth
regimes, all countries were treated similarly with the implication that their bond yields
soared above the Euro area core (Kinsella 2012, Johnston & Regan 2015; Iversen et al
2016; Hall 2014).
The PIIGS’ common entry into crisis led to a common policy response of “austerity”. These
austere adjustments included macroeconomic stabilization, fiscal consolidation and
supply-side structural reforms, coordinated by the so-called “Troika” of international
institutions: the European Commission (EC), the European Central Bank (ECB), and the
International Monetary Fund (IMF) (Blyth 2013). Austerity measures resulted in notable
social consequences – ranging from economic and electoral (Whiteley, Clarke, Sanders and
Stewart 2015), to health related (McKee, Karanikolos, Belcher and Stuckler 2012), and
have generated high-profile public critiques (for example see Krugman 2012). The wisdom
of the policy approach remains an open question and has generated an intense political and
technical debate between economists within the Troika institutions, with the IMF
2 Quoted from European parliament speech, March 24th 2010.
https://www.ecb.europa.eu/press/key/date/2010/html/sp100325.en.html

3
(Blanchard and Leigh 2013) and the ECB contradicting each other’s research
(Warmedinger, Checherita-Westphal and De Cos 2015). The austerity agenda received a
crushing blow when a team of economists at the University of Massachusetts (Herndon,
Ash, & Pollin, 2014) found a simple but meaningful data error in the economic research
(Reinhart & Rogoff, 2010) that had been regularly cited by the European Commission to
legitimate policy adjustments in the PIIGS countries.
As suggested by the quote at the start of this paper, a significant portion of the remaining
support for the contention that austerity “works” revolves around the perceived success of
the policies in Ireland. Both the European Commission3 and the Irish government4 have
argued that Ireland’s political commitment to austerity have been central to its recovery.
This makes Ireland a “crucial case” for supporting the narrative that austerity measures
can be a useful policy prescription (Gerring, 2004). Indeed, after implementing an internal
adjustment equivalent to 26 per cent of gross domestic product (GDP), Ireland has become
one of the fastest growing economies in Europe, exceeding the other ‘PIGS’ and the
aggregate EU growth rate since 2011, leading the OECD to describe Ireland as the
“comeback kid” of the Euro periphery5. The supposed success of the adjustment usually
runs as follows: austerity has reduced labor costs, which in turn has enabled export firms
to improve their competitiveness and expand external demand, which, in turn, has
attracted new firms to invest in a more cost competitive environment (Schäuble 2011, Buti
et al 2012, Chen et al 2012, Sinn 2014; see Storm and Naastepad 2014 for a critique). The
3 http://www.breakingnews.ie/ireland/barroso-to-praise-people-of-ireland-for-courage-sacrifice-during-
bailout-624243.html Accessed 15-06-15.
http://www.wsj.com/articles/SB10001424052702304911104576445583071882782 Accessed 15-06-15.
http://www.irishtimes.com/business/economy/austerity-policies-work-claim-ecb-economists-1.2244944
Accessed 15-06-15. 4 http://www.independent.ie/business/world/the-axeman-cometh-with-praise-for-irelands-austerity-
heroics-30926337.html Accessed 15-06-15.
http://www.bloombergview.com/articles/2015-07-31/two-points-for-austerity-spain-and-ireland Accessed
04-10-15.
http://www.irishcentral.com/news/bill-gates-backs-ireland-to-bounce-back-from-austerity-programme-
188816361-237561391.html Accessed 15-06-15.
http://www.irishexaminer.com/austerity-focus/economic-impact/is-austerity-working-yes-238955.html
Accessed 15-06-15. 5 http://www.ft.com/intl/cms/s/0/328ce524-cb48-11e5-a8ef-ea66e967dd44.html Accessed 10-03-16

4
argument is that this expansion in external demand, made possible by cutting relative unit
labor costs, has improved the real exchange rate and kick started an export led recovery.
Ireland is thus held up as the poster child of internal devaluation, and an example for
others to “take their medicine” if they want to grow their exports, improve their current
account and return to international competitiveness (Robbins and Lapsley 2014).
Our core claim is that the Ireland’s export growth engine has little to do with austerity-
induced cost competitiveness. Rather it is the outcome of a state-led enterprise policy
aimed at “picking winners” from Silicon Valley. This enterprise policy of attracting global
multinationals is coordinated by political entrepreneurs and public sector agents in the
Industrial Development Authority (IDA), and long preceded the economic crisis. Of the
crisis-afflicted countries in the Eurozone, only Ireland trades in high-tech exports, as
evidenced by the rapid growth of internationally traded service exports since 2008 (see
figures 1 and 2). Underpinning this growth regime is the Internet-tech sector, built around
global giants such as Google and Facebook, and what is colloquially referred to in Ireland as
“Silicon Docks”. Ireland is now the largest exporter of computer and information services in
the world (OECD 2015). The question, therefore, is how did the Irish develop the
conditions for the emergence of this global Internet-tech export sector during Eurozone
crisis while the other PIIGS could not? The conditions that enabled the development of
this growth engine, we suggest, can be traced to the public sector not the market. In this
regard, it is a story about the role of the state, but not quite as it is currently being told.
Further, as we evidence in the case study, these tech firms were almost entirely immune to
the domestic adjustment of wage cuts. Indeed, CSO (2014) data suggests that the tech
sector was increasing wages during and the period of the Troika adjustment. All of this
seriously calls into question that it was an internal devaluation that kick started Irish
export growth.
In the following section we develop our theoretical argument for the role of a state-led
enterprise policy in attaining the type of economic growth and recovery we have seen in
Ireland. We then evidence this theoretical argument in two ways. First, we pursue a

5
within-case study analysis of Ireland’s “Silicon Docks” to demonstrate that Ireland’s export-
success is due to its specific role as a US tech hub, and that the emergence of this sector is a
direct result of the actions of a state agent: the Industrial Development Authority (IDA).
Second, we look at an observable implication of this enterprise policy by conducting a
quantitative analysis of foreign investment decisions in the PIIGS countries in the run up to,
and during, the financial crisis. As enterprise policy is both a latent and structural variable,
it is difficult to assay directly. If our core claim regarding enterprise policy (and the role of
the IDA) is true than we would expect to observe an increase in investment in response to
an exogenous credit shock such as the US “Quantitative Easing” (QE) program.6 Conversely,
we would expect to see little relationship between the US QE program and post-crisis FDI
in Portugal, Italy, Greece and Spain who lacked the institutional underpinnings of a
developmental state-led enterprise policy. We conclude with a discussion on the
implications of our analysis for the politics of austerity in Europe.
6 QE has been suggested to promote investment in number of ways, including through the promotion of
venture capital (VC) endeavors (Ito 2009).

6
Lowess-smoothed measures of FDI projects per capita with 95% confidence interval in shaded grey. Sources: fDi Markets Database, OECD, Eurostat,
Authors’ calculations.

7
RETHINKING COMPARATIVE POLITICAL ECONOMY: STATES OR MARKETS?
In line with recent developments in the comparative political economy literature (Iversen
et al 2016; Hassel 2015; Hall 2014; Baccaro and Pontusson 2016; Regan 2015) we suggest
comparative differences in growth regimes (consumption-led and export-led) as the
fundamental explanation for the differentiated effect of austerity on the PIIGS, and their
recovery from the Eurozone crisis. Where Ireland made a decades-long commitment to
investment-oriented enterprise policy, as a means for attracting multilateral investment
and pursuing export-led growth, the remaining PIIGS adopted significantly different
growth paths, primarily built around domestic consumption. Unlike export-led growth
regimes, domestic demand-led models are supported by political coalitions in the domestic
non-traded sector. Within the EMU, domestic demand-driven models cluster in Southern
Europe’s low-productivity, mixed market economies. As noted by Brazys and Hardiman
(2015) these “Club Med” countries shared a strong and direct presence of the state in the
economy, with significant public bureaucracies (Sotiropoulos 2004). These structural
institutional features led the respective economies to expand rapidly as government
borrowing costs came down following the creation of the Euro, expanding domestic
consumption. This suggests that their national growth regimes (and the underlying
domestic political coalitions supporting this) are qualitatively distinct from the export
sectors shaping the post-recessionary period of strong economic growth in Ireland.
Yet, simply reducing Ireland’s success vis-à-vis the other PIIGS to an “export-led” vs.
“consumption based” growth model is rather simplistic. The primary flaw in the new
‘growth models’ perspective is that it presents a too static picture of the state and
underestimates the heterogeneity in both export-led and consumption-oriented
economies. With respect to the former, the traditional political-economy model of export-
led growth regimes is one based on international cost-competitiveness where efficiency-
seeking FDI relocates to low wage locales (Rojec & Damijan, 2008). Indeed, in the
European context, there was strong evidence of this driving investment decisions into
Eastern Europe in the late 1990s (Bevan & Estrin, 2004). The role of the state in this type
8
of regime is, to a large extent, to provide strong property rights and fiscal rules but
otherwise “get out of the way” (Blyth, 2013: 47). Divestment from industry, small (and
comparatively poorly paid) public sectors, strong public finances (achieved via decreased
public expenditure or increased tax) and, crucially, deregulated labor markets that keep
unit labor costs low, are the stratagems of this ‘ordoliberal’ approach. Indeed, these are
precisely the structural “supply side” reforms that the Troika’s austerity programs imposed
in the PIIGS economies with the explicit aim of promoting export-led growth (Blyth, 2013).
More recent work, however, suggests that new forms of high-tech export growth require a
much more activist role for the state (Breznitz & Ornston 2013; Ornston 2012; Mazzucato
2013; O’Riain 2004; O’Riain 2014). Mazzucato (2013), in particular, convincingly argues
that entrepreneurial states can and do “pick winners” by actively fostering entrepreneurial
growth and development. While her analysis has traction for large and well-resourced
economies, such as the USA, which can afford many “failures” in waiting for a “winner”, we
find it less applicable to those small and peripheral economies, lacking large internal
markets. In this regard, we argue that the state can play an active role in small economies,
less through entrepreneurial or developmental policy, but through what we coin as
enterprise policy. Key to understanding enterprise policy is the recognition that the nature
of export-led growth models are not static, but instead are dynamic processes based on
technological innovation and flexible change. Export-led growth comes either from
competing based on cost at established levels of an industry’s value-chain (see Gereffi’s
(1999) classic analysis of the apparel industry as an example) or from creating and
attracting the production that is at the leading technological edge of an industry. While
creating this production is the role of an entrepreneurial policy, attracting this activity is
the role of an enterprise policy. Importantly, enterprise policy need not capture a whole
industry but instead can attract parts of a firm’s supply chain that specialize in the specific
high-value activities of an industry.
Thus, an enterprise policy is an approach by the state to create the institutional conditions
necessary to attract leading-edge production. However, as the leading edge of production

9
is dynamic, as are global industry leaders, enterprise policy is characterized by dynamism
and flexibility as the institutional conditions attractive to leading-edge production are also
fluid. Crucially, these efforts are coordinated by a public sector agent who first identify and
attract industry leaders, the latter whose presence then serves to attract additional firms at
the technological and productive frontier via the clustering effect (Porter 2000, Iammarino
and McCann 2006). In this way, the enterprise policy becomes a virtuous circle where
success begets success. Crucially, it is centered on a public sector agent with the autonomy
to act independently of the electoral cycle. The public-sector agent helps these firms
overcome both the search and transaction costs associated with finding the ideal
institutional environment and also serves as a feedback mechanism from the firm to the
state in order to update the dynamic institutional setting.
THE ENTERPRISE STATE AND INTERNATIONALLY TRADED SERVICES
Anne Wren’s edited volume (2013), and recent work by Baccaro and Pontusson (2016),
describes how internationally traded services, particularly in the ICT sector, are at the
leading edge of high-value global production. While the traditional, cost-based, export-led
growth regime that colored Europe’s austerity policy may be suitable for (relatively) labor
intensive, manufactured goods, it is far less relevant for export sectors of high-value
services due to the nature of production and consumption of those products. Whereas
manufactured goods may require comparatively low levels of skilled labor and/or
vocationally specific trained labor, high-valued services necessitate a general-skilled and
adaptable work force, where a premium is placed on flexibility, interpersonal and human
relational capabilities. Firms engaged in internationally traded high-value services do not
compete with each other for this labor on the basis of cost. On the contrary, they compete
through offering their employees’ lucrative sales and stock options, social insurance
schemes and other favorable working conditions that have traditionally been associated

10
with unionized companies.7 Beyond a pool of a university generalist and flexible labor
force, service sectors, and in particular the tech sector, benefit from a clustering effect of
skilled labor, whether this is computational or multi-lingual (with the latter aimed at the
money making part of a firm; sales and advertising). The spillovers in the tech industry are
high, so the presence of a major firm in the sector will increase the likelihood of attracting
other firms, particularly if the early firms are industry leaders (De Propris and Driffield,
2006). When new firms locate in an area that has established firms they can effectively
recruit their workers directly from this labor market (Combes and Duranton, 2006). Thus,
the cost competitiveness and structural adjustment argument underpinning the Troika’s
austerity policies may apply to traditional manufacturing, but not to globally traded
services. In the latter, labor costs account for less than 10% of the total cost structure of
MNC exporting firms with the implication that price-based wage competitiveness is not a
determinant of their growth (Storm and Naastepad, 2015).
Beyond a flexible and skilled labor force, tax structures are also disproportionately
important for high-value service exporting firms when contrasted with labor-intensive
manufacturing. As noted in Doh et al. (2009: 930), the nature of service exports is
ambiguous as the production, and indeed the delivery, of these exports need not “occur in
the same geographic space” (Doh, Bunyaratavej, & Hahn, 2009). They are interlinked via
complex global supply chains. As described by Lipsey (2010: 99) this ambiguity has
allowed firms to vastly overstate their value-added in low-tax jurisdictions and that this
“problem … is probably worse for trade in services than trade in goods” (Lipsey, 2010).
Thus, the tax term in the profit functions becomes relatively more important for firms that
trade in high-value services both absolutely and in comparison to other determinants,
including unit labor production costs. But tax is not the only determinant driving
investment in high-value services export-led growth regimes. We contend that the
motivation comes from business cluster effects, which underlines that a state-led enterprise
7 See Newenham (2015) http://www.irishtimes.com/business/making-ireland-more-attractive-for-talented-
overseas-workers-1.1957949

11
policy aimed at coordinating and attracting export-led growth in international services is
not simply a synonym for a tax haven. But it does suggest that unit capital costs (aimed at
improving corporate profit margins) matters more than unit labor costs.
In an era of high-value added tradable services, the enterprise state can play a major role in
both setting tax policy and building a pool of skilled and flexible labor. However, both of
these policy features take time to implement in a structured and credible way. While any
state can set a low corporate tax rate, building a credible commitment to that tax rate takes
years, if not decades, where the state demonstrates its fortitude through government
changes and/or times of fiscal excess and strain (Timmons, 2010). Likewise, a skilled labor
force can take a generation to develop. However, while low taxes and a responsive labor
market may be necessary in enticing industry-leaders in high-value traded service, these
conditions are not sufficient as multiple states may, and do, offer very similar structures.
To put it another way, it’s not as simple as the government turning down the corporate tax
dial and liberalizing the labor market and then watching FDI grow in response. A
competitive tax rate and a flexible workforce may be necessary to attract FDI from global
service providers but it’s not sufficient in itself.
Our core claim is that the presence of an activist state agent tasked with coordinating
enterprise policy is also necessary to attract the industry-leading, and subsequent, firm(s)
in a high-growth sector. Beyond acting as a transmittal mechanism for credible
institutional commitments, the public sector agent can also serve as a shepherd through
the regulatory and financial transaction costs that face any firm when establishing a part of
its global supply chain in a new location; activities such as sourcing office space, recruiting
staff, and linking into domestic supply-chains. Thus, the role of the enterprise state in the
high-value services era goes far beyond reducing costs and improving profit margins (via
tax rates or labor costs). Quite the contrary, a state-led enterprise policy is built around
active coordination of the market by a public sector agent. This autonomous public sector
state agent overcomes those collective action problems facing FDI-firms in their new host
market. In the coordinated manufacturing economies of northern Europe, this coordination

12
occurs through sophisticated employer and trade union associations. In the world of
internationally traded services, it requires a much more direct role for the public sector.
Hence our core claim is that the conditions for developing a high-tech export growth engine
begin with the state not the market. It is this central coordinating role for the public sector
in facilitating the expansion of the competitive sector that studies of comparative
capitalism miss.
IRELAND: AN ENTERPRISE STATE BUILDS THE SILICON DOCKS
To evidence that it was enterprise policy, rather than austerity, that drove Ireland’s
divergent recovery in the post-crisis era we now turn to a within-case study of Ireland’s
“Silicon Docks”. The case study traces the origins of Ireland’s high-tech sectors in
information and computer services to the role of the public sector agent, the IDA, and their
relationship with Google and other global multi-national corporations. The strategy of the
IDA is straightforward: get an emergent global industry leader to locate their European
headquarters in Ireland, and then bank on the cluster effect that their presence will create,
thereby building a high-tech export sector that is at the leading edge of technological
change and global market expansion.
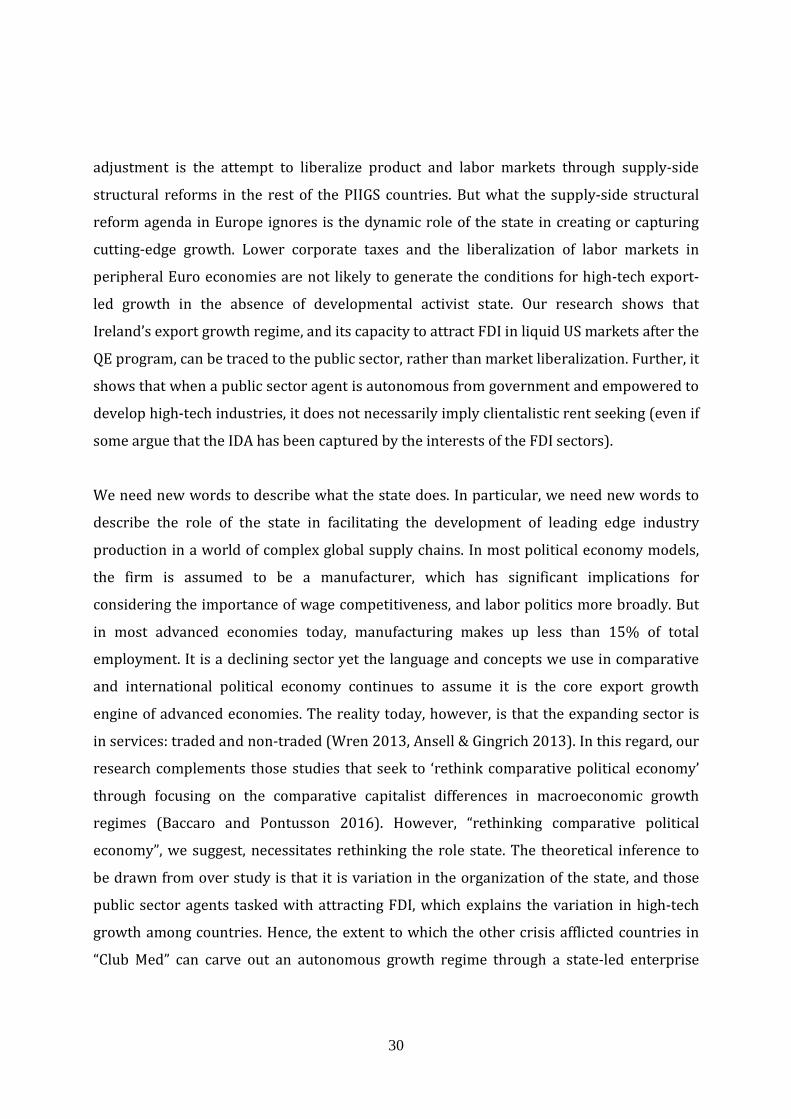
The descriptive statistics surrounding Ireland’s recovery leaves little doubt as to what
sectors drove growth in a period of contracting domestic demand. Exports accounted for
113 per cent of Irish GDP in 2015, and almost 90 per cent of this comes from the foreign
owned global US multinationals8. Figure 2 shows the extent of the Irish recovery in exports
vis-à-vis the other crisis afflicted countries of the Eurozone, a recovery that was driven by
internationally traded business services: internet-tech, biotech, e-commerce and marketing.
In 2014 international services accounted for 55 per cent of Irish exports and ICT computer
services count for over 50% of this growth, whilst total Irish trade in services is over 100
8 See Irish Business and Employers Confederation
http://ibec.ie/Sectors/ICT/ICT.nsf/vPages/Papers_and_Sector_Data~sector-profile?OpenDocument
Accessed 20-08-2015

13
per cent of GDP.9 Of note is that exports were on already on the rise in Ireland before the
2008-2009 crises. This services export recovery was primarily shaped by the presence and
expansion of US MNCs in the Internet tech and computer services sector: Google, Apple,
Microsoft and Facebook. Total service exports account for approximately €90 billion of
Irish exports and these global tech firms now account for around €40 billion of this.10 In
2015 Ireland, with a population of just over 4.5 million people, was the largest exporter of
computer and information services in the world (OECD 2015).
In contrast, the other PIIGS countries, whose trade portfolios are more dominated by
traditional manufactured goods, saw significant downturns in exports in 2009 as global
demand fell. This divergence can be traced to the ‘imbalance of capitalisms’ within the
Eurozone: consumption-oriented and export-oriented growth regimes. The divergence
between these growth regimes can be simply observed by examining the share of exports
as a percentage share of national income among the PIIGS countries. Exports have only
ever accounted for between 20-28 percent of GDP in Portugal and Greece, and between 25-
32 percent in Spain and Italy, whereas they exceed 100 percent in Ireland. More
importantly for the argument being developed here, the production structure and trade
portfolio of the US firms that underpin Irelands export growth engine are geared toward
high-productivity and high-wage activities. It is our argument that this export-growth
regime is the direct outcome of decades long activist state-led enterprise policy.
9 The overall main driver of Irish export growth, however, is the pharmaceutical sector (see Barry & Bergin
2012), 10 http://www.finfacts.ie/irishfinancenews/article_1027837.shtml Accessed 06-06-15

14
Lowess-smoothed measures of Total Exports and Total Trade in Services with 95% confidence interval in shaded grey. Source: World Bank, World
Development Indicators, Authors’ calculations.

15
Process Tracing: Irish Enterprise Policy over the Decades
In the Irish case the role of enterprise policy in developing high-tech industries, or
innovation clusters, is a decades-long story that has occurred in three distinct waves (see
Worrall 2015a, 2015b). Each wave begins with the IDA luring a large global US firm to set
up their leading-edge operations in Ireland via corporate tax incentives and a liberal labor
market regulatory environment. This focus on corporate taxation is well documented in the
critical political economy literature but what is less analyzed is how the presence of a
global firm in each wave subsequently generates a clustering labor market effect for
additional FDI from firms trading in the same sector. It is investment from these global
industry-leaders that the IDA chases.11
ICT Manufacturing – the First Wave
The first wave started in 1989 when the IDA secured inward investment from INTEL to
establish their European micro-processing plant in Ireland (White 2000a). At the time,
micro-processing manufacturing was a high-value, high-skilled product at the leading edge
of the ICT industry. The IDA helped overcome the transaction costs associated with
establishing production by sourcing the location for INTEL’s proposed plant and actively
recruiting 300 skilled engineers from California, and elsewhere, to return to Ireland to
work for the company (White 2000a, confirmed in interview with IDA board executive).
INTEL’s presence as an industry leader quickly attracted other leading-edge firms in the
same sector. IBM, Apple, Dell and other manufacturers either established or expanded their
operations during this emergent period. Employment in the sector doubled during the
1990s with Apple and INTEL each employing over 4,000 people by 2014 (Newenham 2015;
MacSharry et al 2000).
11 Annual reports on FDI from IDA supported firms can be found here: http://www.idaireland.com/about-
ida/annual-reports/ and the IDA’s take on its own history here: http://www.idaireland.com/about-
ida/history/

16
Software Development – The Second Wave
However, as computer manufacturing became commoditized during the mid-1990s many
ICT firms began to move their hardware manufacturing operations outside Ireland to low-
wage, low-cost economies, particularly in Eastern Europe. Rather than attempt to convince
these firms to keep these now comparatively low-value activities in Ireland, the IDA shifted
strategies to target software companies (see White 2000b and 2000c). This led to the
second wave of inward investment from ICT companies in the software sector (Worrall
2015). By the early 2000s Ireland was the second largest exporter of software in the world,
which was now at the forefront of high-value production in ICT (Barry and Egeraat 2008).
This second wave of investment primarily came from existing IDA client firms, particularly
Microsoft and Apple. A core strategy of the IDA is to maintain a close relationship with the
senior executives of their client firms after they establish their operations. The purpose of
this is to monitor change and to be prepared to assist and facilitate the transformation of
their business model. A large part of their role is to get corporate information and then feed
this back to the state institutional structure when the needs of the firm change, particularly
if job retention becomes an issue. For example, IBM employed 4,000 workers in
manufacturing in Ireland in the early 2000’s. In 2015, they continued to employ 4,000
people, but none of who worked in manufacturing12.
During this second wave of investment the IDA also began to target Silicon Valley, luring
emergent Californian based software companies such as Oracle, AOL and one of the world’s
first Internet browsers, Netscape (Newenham 2015). While most of these firms were
ultimately unsuccessful, and many shut down their business, they contributed to the
cluster of experienced workers and, in particular, a new generation of Irish managers with
US corporate experience in the tech sector. In addition, some of the investment during this
period led to the construction of data analytic centers, which went unused for a decade. But
12 See http://www.amcham.ie/news/latest-investments/ibm-ireland-a-60-year-journey.aspx accessed 10-
03-2016. Figures confirmed from interview with IDA.

17
this would subsequently prove to be a crucial incentive to attract Internet technology firms,
who require high-levels of data sensitivity (interviewee 2/3). At the end of this second
wave of ICT investment, State agents had secured the long-term investment of three global
leaders: INTEL, Apple, and Microsoft, all of whom became central to Irish export growth,
and none of whom would have invested in Ireland in the absence of an activist state
enterprise policy (Monaghan et al 2014).
The Google effect – the Third Wave
The dot-com crash in the early 2000s negatively affected IT investment into Ireland (and is
one of the factors that encouraged government to expand domestic consumption via tax
cuts to maintain employment growth during the early years of EMU). But the tech sector
took off again from 2004 with the arrival of new “born on the internet” companies from
Silicon Valley13 (Burke 2015). It is this third wave of Internet technology related FDI,
associated with an influx of investment from information and computer services
companies, which is central to explaining Ireland’s economic recovery from 2009 onwards.
The critical juncture can be traced to industry-leader Google’s decision to establish their
European HQ in Dublin in 2004, which was followed by Facebook in 2008.14 This “Google
Effect” was equivalent to the earlier “INTEL effect” in that it effectively launched a new
technology sector in Ireland (interviewee 2). Google employed less than 50 employees
when they established their operations in 2003.15 From 2004-2014 they expanded and
currently employ around 4,000 employees directly, and almost 5,000 employees indirectly,
13 For detailed press releases on internet firms investing in Ireland, see IDA press releases for the digital
sector here: http://www.idaireland.com/business-in-ireland/industry-sectors/internet/ accessed 10-03-16 14 See http://www.irishtimes.com/business/technology/a-seismic-shift-for-dublin-how-google-was-
persuaded-to-set-up-shop-in-ireland-1.2074137 accessed 10-03-16 15 See IDA case study on Google Ireland: http://www.idaireland.com/how-we-help/case-studies/google/
accessed 10-03-16

18
with the latter on short-term contracts.16 Facebook followed in 2008. They initially worked
out of a Dublin-based IDA office with 70 employees, but by 2015 they employed 2,000
workers. By 2016, Ireland hosted nine out of ten of the top global US technology firms,
employing 24,000 people and generating €16bn in annual exports17. The IDA strategy was
to focus on attracting the high-value services components of these firms’ operations. In the
high-tech Internet firms that now operate in Ireland, most of the focus was put on
establishing marketing and sales.18
The arrival of Google was a direct outcome of a five-year campaign by the IDA to secure
their investment, ahead of Switzerland (interviewees 5-9). Based on the IDA’s previous
experience of luring INTEL, the IDA’s strategy was aimed at ensuring Google established a
data analytic center, which would sink their costs and embed their presence in the
economy. The IDA strategy was based on the assumption that if Google established their
European HQ in Dublin it would facilitate a new wave of additional investment from a
whole host of companies in receipt of venture tech capital funding, seeking to cluster
around the Internet giant. The political objective, therefore, was to focus all resources on
Google in expectation that their presence would attract investment from all those firms in
Silicon Valley seeking to grow their European markets.
This has proven to be correct. During the period of Europe’s austerity agenda (2009-2014)
the following global Internet companies have set up operations in Ireland: Zynga, Twitter,
DropBox, LinkedIn, Hubspot, Trip Advisor, AirBnB, Square Space, Sales-force and Engine
Yard, to name but a few. We have identified an additional 80 companies that have invested
in Ireland during this same time period, listed in Appendix V19. Within the space of ten
16 See Silicon Republic webpage for more information:
https://www.siliconrepublic.com/careers/2015/05/13/record-number-of-jobs-available-ireland accessed
10-03-16 17 See http://www.idaireland.com/business-in-ireland/industry-sectors/software/ accessed 10-03-16 18 It is often wrongly assumed that these jobs are ‘low skilled’ because they don’t require technical skills. But they are the core money-making part of the firm and therefore a premium is put an interpersonal and general communication skills. 19 For an exhaustive list see: http://makeitinireland.com/tech-map/

19
years, and despite comparatively high labor costs, public sector agents tasked with
developing Ireland’s export engine crafted the conditions to turn Dublin into a European
tech hub. If the State had not secured the investment of Google and Facebook, this cluster
effect is not likely to have occurred.
While all of the Internet technology firms want a competitive tax rate, an equally important
attraction is the human capital externalities that emerge from thick labor markets and
business innovation clusters. The global presence of Google, Amazon and Facebook has
created a large internal labor market in the tech sector. These firms require multi-lingual
proficiency and although this locks-out many Irish graduates from the perspective of these
firms, this does not matter as long as they have access to the labor supply of the twenty-
eight member states of the European Union. Research gathered from the interviews for this
project suggests that corporates put a significant premium on the multi-cultural dynamic
that comes from a multi-linguistic workforce. Cultivating this labor pool over decades is a
key component of the state enterprise policy. Highlighting the beneficial effects of the most
flexible labor market in the Eurozone, aimed at 28 EU member-states, rather than selling
the cost effect of cheap labor, is a crucial part of the IDA’s strategy to attract Silicon Valley
firms (interview with IDA executive).
The computer and information services sector was almost entirely immune to the internal
adjustment and compression in domestic demand associated with the Troika austerity
program. Unit labor costs in Ireland have been reduced, and the real exchange rate
improved, but this is primarily because of a contraction in the labor intensive and non-
traded domestic sectors of the economy, primarily construction (McDonnell & O’Farrell
2015). According to a senior corporate executive interviewed for this project, “the only time
we experienced austerity was when we walked through the streets after leaving the office”.
Crucially, CSO (2014) job churn data shows that the information and computer services
sector, in addition to the financial services sector, were the only parts of the economy that
experienced increased wages during the period of the Troika adjustment, while public
sector wages were cut, on average, by 14%. Simply put, cutting wages via austerity had

20
nothing to do with attracting the firms that led Ireland’s recovery. On the contrary, the
average salary for an IDA assisted firm is 47k per annum.
To recap, our core claim is that the expansion of investment into the US-Irish tech sector
from 2009 onwards was a direct outcome of a state-led enterprise policy to attract the
frontier of high-value production. Our core argument is that this investment has fueled the
Irish recovery, not austerity-induced competitiveness. Timing, in this regard, is crucial (in
the vein of Paul Pierson’s 2004 analysis of path dependency). The fact that two Internet
global giants, Google and Facebook, were already based in Dublin prior to the crash, and
had a hugely expansive workforce, meant that the IDA was well placed to steer additional
ICT investment into Ireland during the period of economic adjustment. To give a qualitative
sense of what the IDA were doing during this specific period (whereby Ireland’s reputation
had been shot due to the financial market moniker PIIGS), the IDA dedicated almost three
quarters of their annual budget to marketing, and launched a massive business advertising
campaign in the USA. This strategy was specifically targeted at technology investors and
included slogans such as “Facebook found a place for people who think a certain way: it is
called Ireland”, and “Google searched the planet for a place to do business: they choose
Ireland” (cited in Newenham 2015, p57). Whilst it is tempting to dismiss these ‘soft
strategies’ as irrelevant they clearly show that the IDA was using the presence of global
tech firms to lure other Silicon Valley based firms, in receipt of venture capital funding, to
expand their European operations and invest in Ireland.20
The enterprise state is tasked with developing a high-tech export-sector, and specifically
attempts to build a cluster of firms trading in similar global markets. This state-led FDI
growth model is fundamentally absent in the other PIIGS economies, with the exception,
perhaps, of Catalonia. Their failure to mirror Ireland’s recovery comes not from failing to
implement austerity policies, but instead from the fact that their growth model was not
20 If there was an improvement in cost competitiveness during this period it was related to cheaper
commercial property, a trend that has since gone into reverse in Dublin.

21
conducive to the high-tech export-led strategy of the Irish state. This is not, however, a
normative celebration of Ireland’s developmental export model. One of the biggest
tradeoffs in prioritizing FDI is a lack of priority accorded to the indigenous enterprise
sectors. The latter has certainly benefited from the cluster effect of these global firms,
evidenced by the fact that ICT and information and computer services recorded the largest
net growth in employment of Irish-based exporters in 2013 and 2014 (an increase of 2,092
jobs).21 But US-exporters continue to count for 90% of all exports from Ireland.
Furthermore, the ability of global tech firms to use Ireland as an avenue to re-direct their
taxes to Bermuda, and thereby engage in active tax avoidance, clearly poses deep
distributional problems that are beyond the scope of this paper. But it is worth noting that
this “tax competition” strategy is not likely to be sustainable in the context of increasing
European integration, as evidenced by recent interventions by the European Commission
on Apple and Google’s Irish tax affairs.
We contend that the within-case process tracing analysis above provides convincing
evidence that a decades-long enterprise policy in Ireland, rather than austerity measures,
account for Ireland’s success in attracting the high-tech export firms that have driven the
Irish recovery. However, since the facets of Irish enterprise policy are largely structural,
and therefore mostly time-invariant, it is difficult to conduct a direct comparative
assessment if this alternative growth model is responsible for attracting investment to
Ireland vis-à-vis its PIIGS neighbors. Instead, in the next section, we look at an observable
empirical implication of enterprise policy – namely that a state with an enterprise policy
should be comparatively better positioned to attract inward investment when the global
financial system is hit with a positive credit shock.
21 See https://www.enterprise-ireland.com/en/Publications/Reports-Published-Strategies/2014-Annual-
Report-and-Accounts-English.pdf

22
DIVERGENT RECOVERY IN THE PIIGS: FOLLOW THE MONEY
The case study analysis above demonstrates how the Irish economy was differentially
situated from its peers on the European periphery, and deeply problematizes the
assumption that export-growth in high-value services was a causal outcome of austerity
induced cost competitiveness. This recognition forms the basis of our expectation for why
Ireland has experienced such a dramatic divergence in its recovery from the 2008 financial
crisis vis-à-vis its contemporaries. Due to its decades-long, state-directed enterprise policy,
Ireland was well primed to receive inflows of FDI, which facilitated its export-led recovery
in information and computer services. The other PIIGS countries, which did not have an
activist state seeking to build high-tech export growth, but instead relied on an economic
model driven, to a large extent, by publically financed domestic consumption, have been
unable to recover due to the continued constraints their governments face in securing
external finance within the austere constraints of EMU.
In order to test for an observable implication of enterprise policy, we consider the
relationship between FDI project announcements and an “exogenous” credit shock, the US
Quantitative Easing (QE) program, through a comparative analysis of the PIIGS. Our
contention is that different growth regimes, shaped by varying levels of state-led
developmental and enterprise policies among the PIIGS, not austerity-induced wage
competitiveness, make the constituent states more or less attractive as FDI destinations.
This is particularly the case in Ireland, where the IDA is specifically tasked with winning
FDI and their performance measured against the number of FDI projects and jobs they can
announce. The impact of QE on increased FDI flows and other macroeconomic outcomes
has been well documented in a number of recent papers (Cho and Ree, 2014; Lim et al.,
2014; Park et al., 2014; Schwartz, 2015). The relationship occurs through the three
traditional “transmission channels” of liquidity, portfolio balancing, and confidence, which
essentially related to the price of finance (Lim et al., 2014: 2). By expanding the money
supply, QE reduced financing costs for firms looking to invest (at home or abroad) in any
market that promised sufficient return. If Irish enterprise policy was working as we

23
contend, then the return in investment in Ireland came not from austerity-induced wage
competitiveness, but from the enterprise policy coordinated by the public sector agent the
IDA. In this instance, Ireland will have seen a larger increase in the number of FDI projects
in response to QE vis-à-vis the other PIIGS. These logics lead us to three testable
hypotheses.
Hypothesis 1: The US QE program increased FDI projects to Ireland due to the presence of
enterprise policy.
Hypothesis 2: Austerity-induced wage competitiveness did not result in increased FDI projects
to Ireland.
Hypothesis 3: The US QE program led to more FDI projects in Ireland compared to Portugal,
Italy, Greece or Spain due to the presence of enterprise policy not wage competitiveness
Our investigation focuses on the US Federal Reserve’s Treasuries Holdings, QE_∆, which
were expanded markedly under the QE programs, as the main independent variable.22 This
approach allows for a direct measure of the magnitude of the QE impact, by providing an
amount of monthly QE, rather than a simple temporal indicator as in (Park, Arief, & Shin,
2014), and also allows for observations on a monthly frequency. This is a significant
advantage as we are explicitly trying to determine the (differential) timing of the PIIGS into
and out of crisis. Differences that are observable in monthly data may be obscured when
aggregating to longer time periods.
22 And in particular the 2nd and 3rd QE programs. The first QE program saw the US Federal Reserve focus on
buying mortgage-backed securities, in particular subprime collateralized debt obligations (CDOs) from
distressed financial institutions. We think that the causal logic for the 1st QE program translating into
increased FDI is significantly weaker than that of the 2nd and 3rd, and indeed the studies cited above show a
more substantial impact from these latter programs. Accordingly, we focus our empirical investigation on the
2nd and 3rd QE rounds.

24
We focus our dependent variable on the number of FDI projects rather than the amount of
FDI as a component of Gross Financial Inflows (GFI). There are two advantages to this
approach. Utilizing proprietary data from the Financial Times fDi markets database, we
employ an actual count of monthly FDI projects into the five PIIGS countries.23 As a verified
count, this metric is less susceptible to measurement error and temporal smoothing vis-à-
vis the statistical estimates that are employed to generate FDI inflow data.24 Beyond
reducing our concerns with measurement error, this indicator also provides data with a
monthly frequency, allowing for more fine-grained temporal identification of the QE effect,
and it’s relationship to enterprise policy.
Our dependent variable data consists of a panel of the monthly FDI Projects
announcements in each of the PIIGS countries from January 2003 to December 2014. As
this measure is a left-censored count variable we employ negative binomial regression.25
Wooldridge tests suggest the presence of autocorrelation in our data so we also run
generalized linear models where we specify generalized linear model with a negative
binominal distribution for the dependent variable.26 These results are available in
Appendix II and are substantively similar to those presented in Table 1 below.
In the first instance (Model I), we run a baseline, non-panel model, which simply considers
data from the Irish case in order to consider hypothesis one: the relationship between QE
and Irish FDI announcements. We then add (Model II) a measure of the rate of change of
23 This data counts both “Greenfield” and expansion FDI projects. 24 The Financial Ties fDi data does not include actual investment amounts for all documented projects.
However, for those projects that did have investment amounts the average per-project amount for each
individual PIIGS country was well within one standard deviation of the average per-project amount for all the
PIIGS countries. This leads us to believe that the verified number of projects is also a reasonable proxy for the
amount of FDI. 25 Post-estimations tests from a Poisson regression suggest the data is over-dispersed and as such we use
negative binomial (xtnbreg in Stata 13). Dickey-Fuller tests reject the null hypothesis of non-stationarity for
our main variables of interest, the number of FDI projects and the first-difference in Treasury holdings, at the
0.01 level. 26 Where a Wooldridge test on all variables in Model IV returns a test statistic F(1,4) = 8.027, Prob > F =
0.0472. Generalized Linear Models in Appendix II use the Stata 13 command glm, family(nb) vce(robust).

25
wages, Wages_∆, in Ireland in order to evaluate hypothesis two.27 If our contention is
correct that it is pull effect of a state-led enterprise policy, rather than austerity-induced
wage competitiveness (internal devaluation), that attracts FDI, then we would expect to see
no statistically significant relationship between this measure and the number of FDI
projects. Finally, to test hypothesis three, how QE impacted FDI vis-à-vis Ireland and the
remaining PIIGS, we use a technique similar to that employed in Berthélemy and Tichit
(2004). We first run an aggregate random-effects panel model investigating the overall
effect of QE on FDI announcements in the PIIGS countries (Model III).28 We then look for
parameter differences for Ireland by estimating the full model again with the addition of all
of the explanatory variables multiplied by an Ireland dummy variable (Model IV). This
technique also allows us to assess the impact of the explanatory variables on Irish FDI
projects compared to the other PIIGS countries.
We incorporate a number of control variables from Lim, et al. (2014).29 We expect larger
economies, GDP, to have more FDI projects. Likewise, higher GDP Growth rates and higher
Risk premiums on corporate bonds increase the attractiveness of FDI Projects and should
increase FDI Projects numbers.30 Based on findings from Brazys & Hardiman (2015) that
increased media usage of the PIIGS term caused financial markets to treat those countries
more similarly, we include their count variable of PIIGS usage, expecting a negative
correlation with FDI Projects. Finally, we also include the monthly average of the USD/EUR
exchange rate, expecting a higher number of FDI Projects announcements when the Dollar
is strong. Data sources and summary statistics are available in Appendix I.
27 Where our measure is the monthly first-difference in the average of the NACE “m” (professional, scientific
and technical activities) and “j” (information and communication) wage codes. 28 We use a random-effects model as a Hausman test fails to reject the null, although our results below are
robust to country-level fixed effects, results which are not presented but available upon request from the
authors. 29 We lag all control variables by one period (month or quarter) to account for the delay in firms processing
economic information and making FDI decisions. We do not lag the difference in Fed Treasury holdings as the
timing of these bond buying programs were well publicized thus presumably known to firm decision makers.
We lag these differences as a robustness check (results available from authors upon request) and find no
difference in our substantive findings. 30 Where we use a standard measure for risk premiums, the spread between Baa corporate bonds and the 10-
year constant maturity US Treasury.

26
Table 1: FDI Projects and QE (Negative Binomial Regression) Variable Model I (Ireland) Model II
(Ireland with
wages)
Model III (PIIGS) Model IV (PIIGS /
Ireland
Comparison)
QE_∆ 0.0022**
(2.85)
0.0022**
(2.83)
-0.0000
(0.02)
-0.0007
(1.30)
PIIGS 0.0005
(1.10)
0.0006
(1.27)
-0.0002
(0.94)
-0.0005
(1.59)
GDP -0.0224*
(1.96)
-0.0224*
(1.96)
0.0019**
(2.87)
0.0030**
(4.53)
GDP Growth 0.0101
(1.23)
0.0121
(1.44)
-0.0021
(0.66)
0.0082**
(2.79)
RISK 0.0412
(1.03)
0.0366
(0.93)
0.0491*
(2.45)
0.0520*
(2.34)
USD/EUR 1.4032**
(3.40)
1.3967**
(3.38)
1.0371**
(5.41)
0.8250**
(4.07)
Wages_∆
-0.0015
(0.95)
QE_∆*Ireland 0.0031**
(3.18)
PIIGS*Ireland 0.0010†
(1.90)
GDP*Ireland -0.0145
(1.28)
GDP Growth*Ireland 0.0109
(1.24)
RISK*Ireland 0.0049
(0.10)
USD/EUR*Ireland 1.0088**
(2.53)
Constant 1.5757**
(2.80)
1.6117**
(2.87)
0.3027
(1.14)
0.2502
(0.93)
N 138 138 676 676
χ2 29.66 30.91 65.33 111.18
Prob > χ2 0.0000 0.0000 0.0000 0.0000
Absolute value of z score in parentheses. ** Signi[icant at 1% level, * Signi[icant at 5% level, † Signi[icant at
10% level.
The findings in Table 1 provide substantial support for our hypotheses. Examining the
Irish data alone, to evaluate hypothesis one, we see a positive and statistically significant
relationship between changes in QE and the number of FDI projects in Ireland. Negative
binomial regression reports the change in the expected log count of the dependent variable
for a one-unit change in the independent variable. Accordingly, an increase of one-billion
dollars in the monthly change of Treasuries held by the Federal Reserve is associated with
an increase of 0.0022 in the log count of Irish FDI projects. The Federal Reserve increased
its Treasury holdings by over 2 trillion dollars over the duration of QE, suggesting an

27
additional 81 FDI projects in Ireland over the same time period, ceteris paribus. This result
is magnified considerably in the panel comparison model (IV) where the coefficient for
changes in QE on FDI projects for Ireland is positively and significantly different from the
remaining PIIGS, suggesting that over the life of the program, QE contributed to 300 more
FDI projects in Ireland vis-à-vis the other PIIGS, ceteris paribus. We take these findings as
significant evidence supporting hypothesis three, - that as a result of the business cluster,
shaped by the presence of enterprise policy in Ireland, and the lack of in the other PIIGS,
the US QE program had a profound and differential impact on the number of FDI projects in
Ireland compared to the remaining PIIGS countries. Likewise, the results in Model II
support our contention in hypothesis two that it was the state-led enterprise policy (vis-à-
vis QE) and not the austerity-induced changes in Wages that led to increased FDI projects
in Ireland, as the coefficient on that variable is insignificant.31
The results on the control variables increase our overall confidence in the model. The
USD/EUR exchange rate is statistically significant in the expected direction in all models.
While GDP, the GDP growth rate, and the Risk measure are insignificant in the Ireland-only
model, GDP and the Risk measure are both significant in the expected direction in the
aggregate model. We think the non-findings on these controls in the Irish model are
entirely consistent with our empirical puzzle and theoretical explanation – Ireland was
categorized as one of the PIIGS countries in crisis (as evidenced by high bond yields and a
shrinking economy) and yet attracted a large number of FDI projects that led to its
recovery. Clearly the “conventional wisdom” on FDI determinants did not hold in Ireland
but, rather, something else (the innovation cluster of Ireland’s state-led enterprise policy)
attracted FDI to Ireland. On the one hand, this is related to low corporate taxes but, on the
other, as demonstrated in the case study above, it is the consequence of a cluster effect
associated with an expanding innovative sector, led by the enterprise state.
31 This non-finding is robust to a number of different formulations of the change in wage variable as shown in
Appendix III. We also found no significant bivariate relationship between wages and the number of FDI
projects or between wages and QE.

28
The sole anomalous results from the controls is the evidence that use of the PIIGS term had
a positive impact of FDI projects into Ireland compared to, if anything, the expected
negative impact, on the remaining PIIGS countries. Our initial reaction to this finding is
that it points to the different cognitions in the logics driving short term “portfolio”
investment, where fortunes can be won and lost in seconds (Easley, Lopez de Prado and
O'Hara 2011) compared to the widely-understood long-term planning and decision making
behind FDI (Popper, Perez-Quiros and Chuhan 1996). Whereas the former (financial
markets) might be more vulnerable to heuristics and mental short cuts in decision-making,
the latter (FDI investors) are likely to be based on a more considered analysis that is less
easily swayed by herd behavior.
In sum, our statistical findings show a strong relationship between the US QE program and
increased levels of FDI projects in Ireland vis-à-vis its PIIGS counterparts. Further, we find
no evidence that lower wages induced by austerity led to more FDI projects. The logic
behind this result is that, like elsewhere in the world, QE reduced financing costs and
increased the relative return on non-paper assets, prompting investors to seek out return
elsewhere. Our argument is that Ireland was the beneficiary of this search not because it
ardently followed austerity policies to increase its market competitiveness but because the
state built the institutions via an enterprise policy to attract this investment – a policy that
was not diminished, and perhaps enhanced, by the 2008 financial crisis. The other PIIGS
failed as beacons for FDI not because they lacked austerity-driven competitiveness (they
did not) but because they had not invested sufficiently in a developmental enterprise policy
aimed at building high-tech export growth.
DISCUSSION
Austerity in Europe is premised on the manufacturing model of cost competitiveness
whereby a reduction in relative unit labor costs is assumed to correlate with an expansion
of net exports. In the EMU, where countries cannot improve competitiveness via their
external exchange rate, this internal devaluation has become a core part of the prescribed

29
adjustment facing crisis-afflicted countries. Ireland’s economic recovery continues to be
regularly cited as a successful example of this, despite mounting evidence that reducing
unit labor costs has had no positive impact on export growth in the other four PIIGS
countries (Storm and Naastepad, 2015). Our analysis further shows that this policy
prescription is fundamentally misplaced. Ireland’s recovery had little, if anything, to do
with austerity induced cost-competitiveness. Rather it has everything to do with a state-
led enterprise policy aimed at “picking winners” from Silicon Valley and the cluster effect of
high-tech export growth in internationally traded services. In this regard, Ireland is a
crucial case. But not for the reasons the European narrative suggests. It is a crucial case for
examining the role of the state in building export-growth regimes in peripheral market
economies, not for the success of austerity-induced cost competitiveness.
Ireland’s high-wage, high-productivity, internationally traded ICT services are relatively
price insensitive, particularly to labor costs, and compete in international markets that do
not look like the traditional manufacturing model underpinning the design of the Troika
macroeconomic adjustment. It is important, therefore, to call the Irish recovery what it is: a
state-led enterprise policy, coordinated by an autonomous public sector agent, specifically
tasked (and adequately resourced) to attract investment from global firms in an
internationally liberalized market. This deeply embedded and path dependent ‘enterprise
state’ is not easily replicable, and demand-led political economies in southern Europe are
just as unlikely to converge with the Irish export-growth model in information and
computer services, as with the German manufacturing model. Any country can cut its
corporate tax rate and liberalize the labor market. But it takes decades to build a successful
enterprise policy, and the conditions for high-tech business clusters.
On the one hand, our study supports the core hypothesis of the classic varieties of
capitalism theory, namely that liberal market economies are better placed to develop
comparative advantage in high-risk innovative tech sectors, given the highly flexible nature
of their labor markets, and a focus on general university education, as opposed to skill-
specific vocational training. It is therefore unsurprising that a core component of the Troika
30
adjustment is the attempt to liberalize product and labor markets through supply-side
structural reforms in the rest of the PIIGS countries. But what the supply-side structural
reform agenda in Europe ignores is the dynamic role of the state in creating or capturing
cutting-edge growth. Lower corporate taxes and the liberalization of labor markets in
peripheral Euro economies are not likely to generate the conditions for high-tech export-
led growth in the absence of developmental activist state. Our research shows that
Ireland’s export growth regime, and its capacity to attract FDI in liquid US markets after the
QE program, can be traced to the public sector, rather than market liberalization. Further, it
shows that when a public sector agent is autonomous from government and empowered to
develop high-tech industries, it does not necessarily imply clientalistic rent seeking (even if
some argue that the IDA has been captured by the interests of the FDI sectors).
We need new words to describe what the state does. In particular, we need new words to
describe the role of the state in facilitating the development of leading edge industry
production in a world of complex global supply chains. In most political economy models,
the firm is assumed to be a manufacturer, which has significant implications for
considering the importance of wage competitiveness, and labor politics more broadly. But
in most advanced economies today, manufacturing makes up less than 15% of total
employment. It is a declining sector yet the language and concepts we use in comparative
and international political economy continues to assume it is the core export growth
engine of advanced economies. The reality today, however, is that the expanding sector is
in services: traded and non-traded (Wren 2013, Ansell & Gingrich 2013). In this regard, our
research complements those studies that seek to ‘rethink comparative political economy’
through focusing on the comparative capitalist differences in macroeconomic growth
regimes (Baccaro and Pontusson 2016). However, “rethinking comparative political
economy”, we suggest, necessitates rethinking the role state. The theoretical inference to
be drawn from over study is that it is variation in the organization of the state, and those
public sector agents tasked with attracting FDI, which explains the variation in high-tech
growth among countries. Hence, the extent to which the other crisis afflicted countries in
“Club Med” can carve out an autonomous growth regime through a state-led enterprise

31
policy aimed at export-led growth, without falling prey to regulatory capture, seems to us
to be a crucial and underexplored part of the debate in international and comparative
political economy today.
To conclude, austerity-induced cost competitiveness had little, if any, direct effect on
Ireland’s export-led recovery from the Eurozone crisis, and this is perhaps the most
important policy implication of our research. This is not a normative endorsement of the
Irish model. Rather it is a theoretical and empirical study that suggests the conditions for
export-led growth in peripheral economies are the outcome an embedded relationship
between the public sector and large foreign owned global tech firms. This deeply embedded
role for the state in the international market underpins the capacity for small countries to
make the transition to export-led growth in internationally traded services, rather than
austerity, declining labor costs or macroeconomic stabilization. It is, fundamentally,
about strategic political decision-making, and economic coordination rather than market
competition. If the European Commission is serious about generating the conditions for
economic and employment growth in the Euro area it needs to rethink the German
ordoliberal consensus on austerity. It needs a state-led enterprise policy.

32
References
Ansell, B., and Gingrich, J. 2013. “A tale of two trilemmas: varieties of higher education and
the service economy.” The Political Economy of the Service Transition, 195.
Baccaro, L., and Pontusson, J. 2016. “Rethinking Comparative Political Economy: Growth
Models and Distributive Dynamics.” Politics and Society. Forthcoming
Barry, F., and Bergin, A. 2012. “Inward Investment and Irish Exports over the Recession
and Beyond. The World Economy, 3510, 1291-1304.
Barry, F., and Van Egeraat, C. 2008. The decline of the computer hardware sector: how
Ireland adjusted.” Quarterly Economic Commentary, 38-57.
Berthélemy, J.-C. and A. Tichit 2004. "Bilateral donors' aid allocation decisions—a three-
dimensional panel analysis." International Review of Economics and Finance 133: 253-274.
Bevan, A. A., & Estrin, S. (2004). The determinants of foreign direct investment into
European transition economies. Journal of comparative economics, 32(4), 775-787.
Blanchard, O. J., and Leigh, D. 2013. “Growth Forecast Errors and Fiscal Multipliers.” The
American Economic Review, 1033, 117.
Blyth, M. 2013. Austerity: the history of a dangerous idea, Oxford: Oxford University Press.
Brazys, S. and N. Hardiman 2015. "From ‘Tiger’ to ‘PIIGS’: Ireland and the use of heuristics
in comparative political economy." European Journal of Political Research 541: 23-42.
Breznitz, D., & Ornston, D. (2013). The Revolutionary Power of Peripheral Agencies
Explaining Radical Policy Innovation in Finland and Israel. Comparative Political Studies,
0010414012472466.
Burke, E 2015. The rest start arriving. In Silicon Docks: The Rise of Dublin as a Global Tech
Hub, chapter 5, pp 97-110.
Buti, Marco 2014. "A consistent trinity for the Eurozone." VoxEU. org 8.
Buti, M., and Carnot, N. 2012. “The EMU Debt Crisis: Early Lessons and Reforms*.” JCMS:
Journal of Common Market Studies, 506, 899-911.
Central Statistics Office (2014), Job Churn Database:
http://www.cso.ie/px/pxeirestat/database/eirestat/Job%20Churn/Job%20Churn_statban
k.asp?sp=Job%20Churn

33
Cho, D. and C. Rhee 2014. "Effects of Quantitative Easing on Asia: Capital Flows and
Financial Markets." The Singapore Economic Review 5903.
Connolly 2015. Spillover effects, Silicon Docks: The Rise of Dublin as a Global Tech Hub,
chapter, chapter 9, pp136-148.
Combes, P. P., & Duranton, G. (2006). Labour pooling, labour poaching, and spatial
clustering. Regional Science and Urban Economics, 36(1), 1-28.
De Propris, L., & Driffield, N. (2006). The importance of clusters for spillovers from foreign
direct investment and technology sourcing. Cambridge Journal of Economics, 30(2), 277-
291.
Doh, J. P., Bunyaratavej, K., & Hahn, E. D. (2009). Separable but not equal: The location
determinants of discrete services offshoring activities. Journal of International Business
Studies, 40(6), 926-943.
Easley D., Lopez de Prado, M., and O'Hara, M. 2011. “The microstructure of the ‘Flash
Crash’:
Flow toxicity, liquidity crashes and the probability of informed trading.” The Journal of
Portfolio Management, 372, 118-128.
Flinders, M., and Skelcher, C. 2012. “Shrinking the quango state: five challenges in
reforming quangos.” Public Money and Management, 325, 327-334.
Gerring, J. (2004). What is a case study and what is it good for?. American Political Science
Review, 98(2), 341-354.
Hall, P. A. and Soskice, D. 2001. "An introduction to varieties of capitalism." in Varieties of
capitalism: The institutional foundations of comparative advantage
Hall, P. A. (2014). Varieties of capitalism and the Euro crisis. West European Politics, 37(6),
1223-1243.
Hassel, A. (2015). National Growth Strategies and Welfare State Reform. Paper presented at
22nd International Conference of Europeanists. Paris.
Herndon, T., Ash, M., & Pollin, R. (2014). Does high public debt consistently stifle economic
growth? A critique of Reinhart and Rogoff. Cambridge journal of economics, 38(2), 257-279.
Iammarino, S., & McCann, P. (2006). The structure and evolution of industrial clusters:
Transactions, technology and knowledge spillovers. Research policy, 35(7), 1018-1036.

34
Ito, T. 2009. Fire, flood, and lifeboats: policy responses to the global crisis of 2007-09. Federal
Reserve Bank of San Francisco Proceedings.
Iversen, T., Soskice, D., & Hope, D. (2016). The Eurozone and Political Economic
Institutions. Annual Review of Political Science, forthcoming.
Johnston, A., and Regan, A. 2015. “European Monetary Integration and the Incompatibility
of National Varieties of Capitalism.” JCMS: Journal of Common Market Studies. Advanced
access DOI: 10.1111/jcms.12289
Kinsella, S. (2012). Is Ireland really the role model for austerity? Cambridge Journal of
Economics, 36(1), 223-235.
Krugman, P. 2012. “Europe’s austerity madness.” New York Times, 28, A35.
Lipsey, R. E. (2010). Measuring the location of production in a world of intangible
productive assets, FDI, and intrafirm trade. Review of Income and Wealth, 56(s1), S99-S110.
Lim, J. J., Mohapatra, S., and Stocker, M. 2014. “Tinker, taper, QE, bye? the effect of
quantitative easing on financial flows to developing countries.” World Bank Policy Research
Working Paper, 6820. Washington, DC.
Mac Sharry, R., White, P. A., and O'Malley, J. J. 2000. The making of the Celtic tiger: the inside
story of Ireland's boom economy. Mercier Press.
Mazzucato, M. (2013). The entrepreneurial state: Debunking public vs. private sector
myths (Vol. 1). Anthem Press.
McDonnell, T. and Farrell, R 2015. “Internal devaluation and labor market trends during
Ireland’s economic crisis.” NERI working paper
http://www.nerinstitute.net/research/internal-devaluation-and-labor-market-trends-
during-irelands-economic-crisis/
McKee, M., Karanikolos, M., Belcher, P., and Stuckler, D. 2012. “Austerity: a failed
experiment on the people of Europe.” Clinical Medicine, 124, 346-350.
Monaghan, S., Gunnigle, P. & Lavelle, J. (2014) “Courting the Multinational: Subnational
institutional capacity and foreign market insidership”, Journal of International Business
Studies, 45 (2), 131–150.
Newenham, P, Roberts, J., Worrall, J. J., and Burke, E. 2015. Silicon Docks: The Rise of Dublin
as a Global Tech Hub. Liberties Press.

35
Newenham, P. 2015. “Recruiting companies for the docks: the role of IDA Ireland and
Enterprise Ireland.” In ‘Silicon Docks: The Rise of Dublin as a Global Tech Hub’, chapter 3, pp
51-66
OECD. (2015), OECD Digital Economy Outlook 2015, OECD Publishing, Paris.
DOI: http://dx.doi.org/10.1787/9789264232440-en
O Riain, S. 2004. Developmental Network States: The Politics of the Global Informational
Economy. Cambridge University Press.
— 2014. “Enterprise Policy and Ireland’s Economic Recovery.” Presented at NERI Institute.
PDF available: http://www.nerinstitute.net/download/pdf/oriain_enterprise_policy.pdf
Ornston, D. 2012. "Creative Corporatism. The Politics of High-Technology Competition in
Nordic Europe." Comparative Political Studies: 0010414012463881.
Park, D., Arief, R., & Shin, K. (2014). Capital Flows During Quantitative Easing and
Aftermath: Experiences of Asian Countries. Asian Development Bank Economics Working
Paper Series(409).
Pierson, P. 2004. Politics in time: History, institutions and social analysis. Princeton, NJ.
Princeton University Press.
Popper, H., Perez-Quiros, G., and Chuhan, P. 1996. “International capital flows: do short-
term
investment and direct investment differ?” World Bank policy research working paper, 1669.
Porter, M. E. (2000). Location, competition, and economic development: Local clusters in a
global economy. Economic development quarterly, 14(1), 15-34.
Regan, A. (2015). The Imbalance of Capitalisms in the Eurozone: Can the North and South
of Europe Converge? Comparative European Politics.
Reinhart, C. M., & Rogoff, K. S. (2010). Growth in a Time of Debt (Digest Summary).
American Economic Review, 100(2), 573-578.
Robbins, G. and I. Lapsley 2014. "The success story of the Eurozone crisis? Ireland's
austerity measures." Public Money and Management 342: 91-98.
Rojec, M., & Damijan, J. P. (2008). Relocation via foreign direct investment from old to new
EU member states: Scale and structural dimension of the process. Structural Change and
Economic Dynamics, 19(1), 53-65.

36
Schäuble, W. (2011). Why austerity is only cure for the Eurozone. Financial Times, 5(09),
2011.
Sinn, H. W. 2014. "Austerity, growth and inflation: remarks on the Eurozone's unresolved
competitiveness problem." The World Economy 371: 1-13.
Sotiropoulos, D. A. 2004. "Southern European public bureaucracies in comparative
perspective." West European Politics 273: 405-422.
Stewart, J. 2013. Is Ireland a Tax Haven No. 430, p. 18. IIIS Discussion Paper.
Storm, S. and C. Naastepad 2015. "Europe’s Hunger Games: income distribution, cost
competitiveness and crisis." Cambridge Journal of Economics: 39: 959-986.
Timmons, J. F. (2010). Taxation and Credible Commitment: Left, Right, and Partisan
Turnover. Comparative Politics, 42(2), 207-227.
Warmedinger, T., Checherita-Westphal, C. D., and De Cos, P. H. 2015. Fiscal multipliers and
beyond. ECB Occasional Paper, 162.
White, P. 2000a. The evolution of the IDA. In ‘The Making of the Celtic Tiger’, chapter 9
pp183-198.
— 2000b. The IDA philosophy through the decades. In ‘The Making of the Celtic Tiger’,
chapter 10 pp198-228.
— 2000c. How the IDA operates. In ‘The Making of the Celtic Tiger’, chapter 11 pp 229-272.
— 2000d. The IDA: keys to success. In ‘The Making of the Celtic Tiger’, chapter 13 pp 272-
309.
Whiteley, P., Clarke, H. D., Sanders, D., and Stewart, M. C. 2015. “The Economic and Electoral
Consequences of Austerity Policies in Britain.” Parliamentary Affairs, 681, 4-24.
Worall, J.J. 2015a. Game changer: Google moves to the Docks. In Silicon Docks: The Rise of
Dublin as a Global Tech Hub, chapter 4, pp 66-82
— 2015b. Silicon Republic: the broader context, Silicon Docks: The Rise of Dublin as a Global
Tech Hub chapter 10, pp 148-166
Wren, A. (2013). The political economy of the service transition. Oxford University Press.

37
Appendix I: Data sources and summary statistics
Table I.1 Data Sources and Summary Statistics Variable Source Mean
(SD)
Min Max N=
FDI
Projects Financial Times fDi Intelligence
Database
http://www.fdiintelligence.com/
(Number of projects per month)
13.49
(11.98)
1 68 705
QE http://research.stlouisfed.org/fred2
(Monthly holdings in billions of
current USD)
1092.31
(597.90)
474.68 2500.00 720
PIIGS Brazys and Hardiman 2015 (Number
per month)
34.60
(68.93)
0 447 720
GDP http://data.worldbank.org/data-
catalog/world-development-
indicators (Quarterly, billions of
current USD)
156.52
(143.53)
34.64 430.82 720
GDP
Growth http://data.worldbank.org/data-
catalog/world-development-
indicators (Authors’ calculations,
quarterly)
0.72
(5.94)
-14.31 12.24 705
RISK http://research.stlouisfed.org/fred2
(Spread between Moody’s Seasoned
Baa Corporate Bond and 10-year
Treasury Constant Maturity)
2.65
(0.87)
1.56
6.01 720
USD/EUR http://stats.oecd.org/ (Monthly
average, USD per Euro)
1.31
(0.10)
1.06 1.58 720
Wages_∆
http://www.cso.ie (Change in monthly
average of wages NACE codes M and J
in current Euros).
2.40
(20.69)
-53.66 53.12 141

38
Appendix II: FDI Projects and QE (Generalized Linear Models with Robust Standard
Errors)
Variable Model I (Ireland) Model II
(Ireland with
wages)
Model III (PIIGS) Model IV (PIIGS /
Ireland
Comparison)
QE_∆ 0.0022**
(2.90)
0.0022**
(2.82)
0.0005
(0.63)
-0.0006
(0.62)
PIIGS 0.0005
(0.76)
0.0006
(0.87)
-0.0001
(0.24)
-0.0006
(1.17)
GDP -0.0224†
(1.66)
-0.0237†
(1.67)
0.0032**
(13.77)
0.0052**
(18.63)
GDP Growth 0.0129
(1.33)
0.0150
(1.52)
-0.0004
(0.06)
0.0089†
(1.70)
RISK 0.0402
(1.41)
0.0371
(1.29)
0.0470
(1.43)
0.0562
(1.51)
USD/EUR 1.3525**
(3.50)
1.3524**
(3.48)
0.9256**
(3.00)
0.4896
(1.61)
Wages_∆
-0.0017
(1.18)
QE_∆*Ireland 0.0028*
(2.30)
PIIGS*Ireland 0.0012
(1.41)
GDP*Ireland -0.0189
(1.47)
GDP Growth*Ireland 0.0143
(1.47)
RISK*Ireland -0.0047
(0.10)
USD/EUR*Ireland 1.3196**
(3.16)
Constant 1.5757**
(2.80)
1.7333**
(3.11)
0.6626
(1.68)
0.6435
(1.67)
N 138 138 676 676
Log
Pseudolikelihood
-508.52 -508.44 -2407.01 -2363.70
Absolute value of z score in parentheses. ** Signi[icant at 1% level, * Signi[icant at 5% level, † Signi[icant at 10% level.

39
Appendix III: FDI Projects and QE. Alternative Wage Specifications (Negative Binomial
Regression)
Variable Model I (NACE “m”
wages)
Model II (NACE “j”
wages)
Model IV (NACE “mj”
wages, lagged)
QE_∆ 0.0022**
(2.83)
0.0022**
(2.85)
0.0022**
(2.86)
PIIGS 0.0005
(1.06)
0.0006
(1.30)
0.0005
(1.10)
GDP -0.0225*
(1.96)
-0.0223*
(1.95)
-0.0226*
(1.97)
GDP_%∆ 0.0109
(1.32)
0.0117
(1.39)
0.0103
(1.26)
RISK 0.0404
(1.03)
0.0361
(0.91)
0.0417
(1.07)
USD/EUR 1.4180**
(3.38)
1.3730**
(3.30)
1.4261**
(3.40)
Wages_∆
-0.0008
(0.67)
-0.0010
(0.77)
Lagged
Wages_∆
0.0005
(0.33)
Constant 1.5731**
(2.80)
1.6286**
(2.88)
1.5496**
(2.72)
N 138 138 138
χ2 30.28 30.56 29.71
Prob > χ2 0.0001 0.0001 0.0001
Absolute value of z score in parentheses. ** Signi[icant at 1% level, * Signi[icant at 5% level, † Signi[icant at 10% level.

40
Appendix IV: List of Interviewees
1. Director of Planning, IDA
2. Retired chief executive IDA
3. Retired chief executive IDA
4. Retired chief executive IDA
5. Board member IDA
6. Board member IDA
7. Secretary board IDA
8. Vice President IDA, California
9. Vice President, IDA, California
10. Minister, Department of Jobs, Enterprise & Innovation
11. Principal Officer, Department of Jobs, Enterprise & Innovation
12. General secretary, Department of Expenditure & Reform
13. European Commission Representative, Ireland
14. IBEC official
15. IBEC researcher
16. ICTU researcher
17. All corporate executives asked to remain anonymous
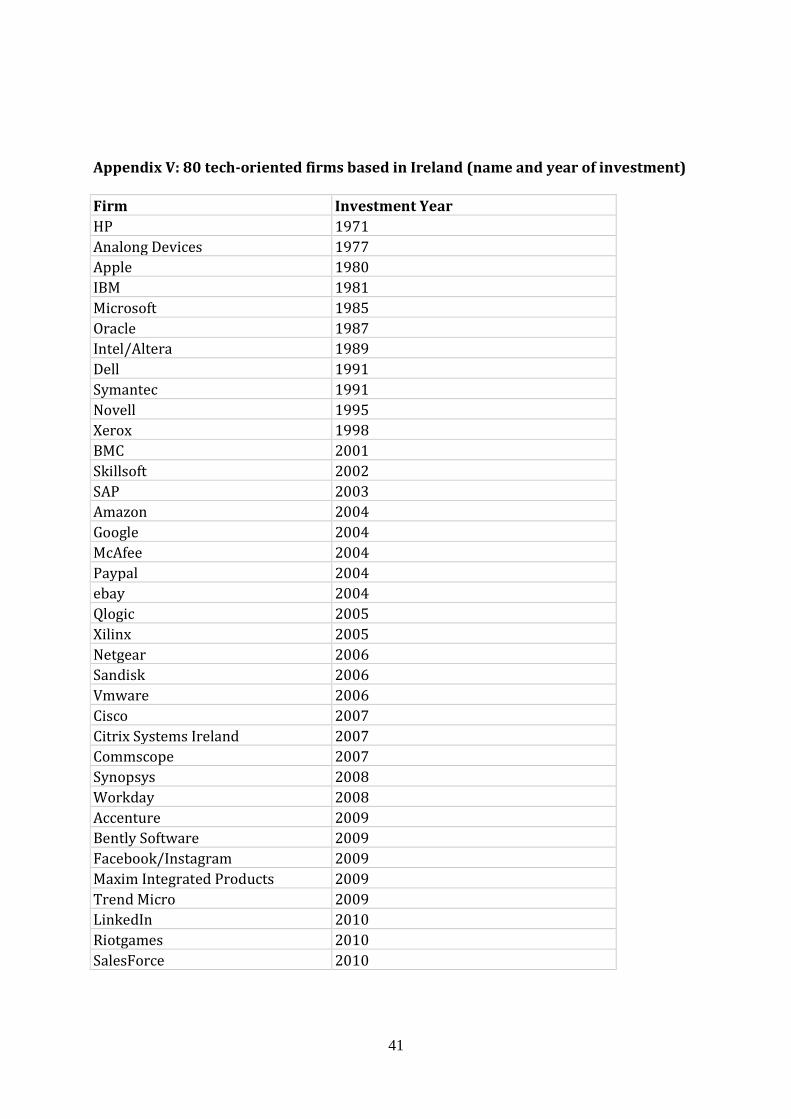
41
Appendix V: 80 tech-oriented firms based in Ireland (name and year of investment)
Firm Investment Year
HP 1971
Analong Devices 1977
Apple 1980
IBM 1981
Microsoft 1985
Oracle 1987
Intel/Altera 1989
Dell 1991
Symantec 1991
Novell 1995
Xerox 1998
BMC 2001
Skillsoft 2002
SAP 2003
Amazon 2004
Google 2004
McAfee 2004
Paypal 2004
ebay 2004
Qlogic 2005
Xilinx 2005
Netgear 2006
Sandisk 2006
Vmware 2006
Cisco 2007
Citrix Systems Ireland 2007
Commscope 2007
Synopsys 2008
Workday 2008
Accenture 2009
Bently Software 2009
Facebook/Instagram 2009
Maxim Integrated Products 2009
Trend Micro 2009
LinkedIn 2010
Riotgames 2010
SalesForce 2010

42
Seagate 2010
Webroot 2010
EA 2010
EngineYard 2011
Guidewire 2011
Teradata 2011
Twitter 2011
Zynga 2011
Pinger 2011
Marketo 2011
Gilt 2011
Quest 2011
Capita Managed IT Solutions 2012
Dropbox 2012
Indeed.com 2012
Innovative Interfaces 2012
LogMeIn 2012
Nimble Apps 2012
Yapstone 2012
Ancestry.com 2012
Total Defense 2012
Adroll 2013
Airbnb 2013
Cadence 2013
Datahug 2013
Etsy 2013
Hubspot 2013
LexisNexis 2013
Qualtrics 2013
Soundwave 2013
squarespace 2013
10gen 2013
MongoDB 2013
Qualcomm 2013
Adara 2013
Mandiant 2013
FireEye 2013
TripAdvisor 2013
Overstock.com 2013
Marin Software 2013

43
Zendesk 2013
Calypso Technology 2014
Groupon 2014
Itron Inc 2014
New Relic 2014
SmartBear 2014
Storyful 2014
SurveyMonkey 2014
SWG, Inc 2014
Tintri 2014
VCE 2014
Yelp 2014
Artisan Infrastructure 2015
Coupa 2015
Data Clarity 2015
Docusign 2015
Ellucian 2015
Malwarebytes 2015
NuoDB 2015
Slack 2015
Stryker 2015
Uber 2015
Wrike 2015
Yahoo! 2015