thesis exploration of anammox-based …
TRANSCRIPT
THESIS
EXPLORATION OF ANAMMOX-BASED DEAMMONIFICATION AND PHOSPHORUS
RECOVERY SYSTEMS USING BIOMOLECULAR TOOLS
Submitted by
DeeAnn-Rose G. Turpin
Department of Civil and Environmental Engineering
In partial fulfillment of the requirements
For the Degree of Master of Science
Colorado State University
Fort Collins, Colorado
Spring 2018
Master’s Committee:
Advisor: Kenneth H. Carlson Susan K. De Long Kimberly B. Catton Matthew J. Kipper

Copyright by DeeAnn-Rose G. Turpin 2018
All Rights Reserved

ii
ABSTRACT
EXPLORATION OF ANAMMOX-BASED DEAMMONIFICATION AND PHOSPHORUS
RECOVERY SYSTEMS USING BIOMOLECULAR TOOLS
Biomolecular tools have been used for numerous applications in a wide range of industries
including healthcare, pharmaceuticals, and material science. However, the use of biomolecular
tools has more recently been used to advance wastewater treatment (WWT) processes, specifically
the use of DNA extraction techniques and quantitative polymerase chain reaction (qPCR). DNA
extraction and qPCR techniques can be useful indicators of reactor performance due to their ability
to quantify the relative abundance of target genes, and thus determine the microbial ecology of a
system. Coupling biomolecular tools with two advanced technologies for nutrient removal such as
phosphorus (P) recovery, in the form of struvite precipitation, and nitrogen (N) removal, through
deammonification using anaerobic ammonia oxidizing bacteria, Anammox (AMX), can further
advance WWT processes. Since the struvite formation process only removes a small molar fraction
of the NH4+-N from the wastewater, and AMX bacteria consume NH4
+-N, integration of P recovery
and Anammox-based deammonification technologies is attractive for nutrient removal in
wastewater treatment plants (WWTPs). However, due to the relatively recent use of biomolecular
tools in WWT, biomass extraction methods, from fixed biofilm media, and DNA extraction
processes would benefit from further advancements to minimize biases, with the goal of improving
data accuracy. Furthermore, no research has been found where a mass balance has been developed
for total alkalinity contributing species in wastewaters and understanding the effects of P recovery
on the species contributing to total alkalinity as well as their downstream effects on an Anammox-
iii
based deammonification. Therefore, to investigate the use of biomolecular tools in WWT systems,
with advanced nutrient removal processes, and determine the effects of P recovery on an
Anammox-based downstream deammonification process, two independent research studies were
conducted.
In the first research study, a lab-scale P recovery process, in the form of struvite
crystallization, was coupled with a bench-scale moving bed biofilm reactor (MBBR), inoculated
with fixed biofilm AMX bacteria. The research objectives for the first study were to: 1) advance
published Anammox fixed biofilm sample preparation and DNA extraction methods, 2) determine
if correlations could be made from steady-state microbial ecology data and MBBR performance
data, 3) evaluate the impacts of a P recovery process on the fate of inorganic carbon (especially
carbonates), phosphate, sulfides, and volatile fatty acids, 4) assess the effects of a P recovery
process on the downstream deammonification process, and 5) analyze the effects of dissolved
oxygen, surface area loading rates, and alkalinity/ammonia ratio on MBBR performance.
The following advancements were made to existing methods for biomass extraction from
fixed biofilm media and DNA extraction protocols, which aided in minimizing biases: 1) enhanced
biomass extraction from fixed biofilm media and mechanical cell lysis using liquid nitrogen and
striking of the media carrier with a pestle, 2) increased mechanical and chemical cell lysis through
use of a DNA isolation kit optimized for biofilms, and 3) increased inhibitor removal.
Biomolecular tools were used to determine steady-state microbial ecology, targeting AMX
bacteria, ammonia oxidizing bacteria (AOB), and nitrite oxidizing bacteria (NOB). The maximum
AMX, AOB, and NOB concentrations achieved from fixed biofilm media during MBBR steady-
state were 9.43x10⁸ ± 1.62x10⁸ copies/mL, 3.43x10⁷ ± 1.03x10⁷ copies/mL, and 4.96x10⁵ ±
1.51x10⁵ copies/mL, respectively. Calculation of the average AMX, AOB, and NOB relative
iv
abundances during steady-state were 4.1x10⁸ copies/mL, 1.3x10⁷ copies/mL, and 1.7x10⁶
copies/mL, respectively. Comparative analysis of the averaged AMX, AOB, and NOB relative
abundances observed during steady-state to approximated, averaged relative abundances in a
published study indicate that the AMX concentrations were greater, while the AOB and NOB
concenters were less, 7.7x10⁷ copies/mL, 2.3x10⁸ copies/mL, and 7.7x10⁷ copies/mL, 8.2x10⁶
copies/mL, respectively (Park et al., 2010). The findings from this study are also consistent with
published studies, which indicate a greater relative abundance of AMX to AOB (Persson et al.,
2017; Laureni et al., 2015).
Additionally, the effects of P recovery on the downstream deammonification process were
analyzed during the first research study. The average ratio of bicarbonate alkalinity consumed
within the reactor based on ammonia removal rate was estimated to be 3.33:1. The digested sludge
and centrate at Denver Metro Wastewater Reclamation District (MWRD) were already limited by
the ratio of available bicarbonate alkalinity to ammonia concentration, 2.83:1 and 2.91:1,
respectively. A lab-scale simulation of the P recovery process on centrate resulted in a further
decrease of said ratio by 15% (2.48:1). This bicarbonate alkalinity limitation was clearly observed
through its direct correlation with reactor performance. Comparative analysis was conducted using
a constant surface area loading rate (2.7 g NH3/m2-day) on centrate with and without P recovery.
When using centrate with P recovery, the MBBR performed the poorest at 59.9% efficiency, due
to a decrease in bicarbonate alkalinity, and subsequently a loss of inorganic carbon (IC). Since the
deammonification process is driven by AMX bacteria, which are dependent on AOB for their
ability to oxidize NH4+ to NO2
-, and IC is the main carbon source of both AMX bacteria and AOB,
these findings showed that IC is a more accurate indicator of reactor performance, compared to
total alkalinity. The reactor displayed an immediate improvement when fed with centrate without

v
P recovery by performing at 67.8% efficiency. Extrapolation of measured data indicates that if the
observed consumption ratio of 3.33:1 was achieved, the projected reactor efficiency would be
75.5% TIN removal at a loading rate of 2.7 g NH3/m2-day.
The second independent research study conducted was a case study. During the case study,
biomolecular tools were applied on a full-scale suspended Anammox granules reactor to aid in
explaining operational upsets. The main objectives of this study were to: 1) develop a sampling
method that minimized biases of the microbial ecology results, and 2) determine the microbial
ecology of the Anammox system to help troubleshoot operational issues observed in the on-site
processes. Microbial ecology results from the full-scale suspended Anammox granule reactor
indicated that the reactor either had no AMX bacteria or concentrations were below the detection
limit. The operators of the full-scale Anammox reactor had communicated that operational issues
with the pumps had occurred, and they hypothesized that the pump issues led to decreased
concentrations of AMX bacteria in the reactor. Therefore, these findings helped explain the
observations made by on-site operators of the full-scale Anammox reactor.
In summary, findings confirmed the hypothesis that P recovery impacted a downstream
Anammox-based deammonification process. Originally it was hypothesized that total alkalinity
would be an accurate predictor of reactor performance; however, the results determined that IC is
a more accurate indicator for reactor performance. Advancements to published biomass extraction
methods from fixed biofilm media and DNA extraction methods aided in reducing biases.
Application of biomolecular tools to samples from a full-scale WWTP demonstrated the
effectiveness of these technologies in helping explain operation upsets. Overall, findings from both
independent research studies could help guide optimization of WWT systems, which integrate
biomolecular tools, P recovery processes, and Anammox-based deammonification, since these

vi
technologies are gaining popularity for their abilities to determine optimal reactor performance,
enhance resource recovery, and reduce energy consumption in WWTPs

vii
ACKNOWLEDGEMENTS
All of what I have accomplished and who I am would not be possible without the
unconditional love and support and many sacrifices from my mom. Watching how you face life’s
adversities is motivating and a testament to your incredible resilience. I cannot thank you enough
for all of the life lessons that you have taught me, especially emphasizing the importance of making
education a priority.
I sincerely appreciate the very generous support from the National Science Foundation’s
Graduate Research Fellowship Program (NSF GRFP). With my NSF GRFP I could afford the
freedom to choose which university I pursued my master’s degree at and the research topic(s) I
wanted to study. To the committee members who reviewed my 2016 NSF GRFP fellowship
application, I am incredibly humbled that you saw my potential to contribute to advancing a
wastewater treatment and selected me to be an NSF GRFP fellow.
As a result of the continued and unconditional support from my academic and professional
engineering mentors I have been able to achieve many career successes. First, I would like to
express my appreciation to Dr. Hohenbary. You truly embody the definition of an educator,
because regardless of where I am in my career, you always make time to facilitate discussions that
are stimulating as well as encouraging to help me continue growing and pursuing my passions.
What I am most impressed by is your happiness to always help even if it means exchanging 20
revisions of one essay, up until 10 minutes before a deadline, because you care and will do
whatever it takes to provide full support. Next, I would like to thank Emily Tuzson. Emily, you
are the first female-engineer I ever worked with, and an empowering industry expert. Your strong,
firm, and professional demeanor exemplifies your standards, which makes you an excellent role
model. You also our time a priority and despite your numerous commitments, you always manage

viii
to submit a recommendation before anyone else (very impressive)! Another mentor I am grateful
for is Dr. Pahwa. You have continued providing generous support even though our work together
through Engineers Without Borders has finished. Your prestigious achievements in academia are
a constant inspiration of what someone can achieve through hard work and dedication.
I would like to thank my advisor, Dr. Ken Carlson, for the opportunity to pursue advanced
wastewater treatment research and for your guidance during my research. I also appreciate the
opportunity to contribute to a publication on the findings presented in this study. I would like to
thank Dr. Susan De Long for your guidance during my research. Scheduling weekly meetings and
your diligence as I completed my thesis are appreciated. Thank you to Dr. Kimberly Catton for
creating a stimulating environment to help me learn and retain knowledge of statistics, that I used
during my master’s thesis. I would also like to thank you and Dr. Matthew Kipper for your
guidance serving as a committee member.
I would also like to thank my research team lab mates for their contributions to the aqueous
chemistry chapter of this study. I would like to thank Martha Nunez and Asma Hanif for their work
in collecting the following data: reactor performance, alkalinity, dissolved oxygen, surface area
loading rate, and phosphorus recovery.
In concluding acknowledgements, I would like to thank Dr. Kartik Chandran and his PhD
student, Zheqin Li, at Columbia University, for providing qPCR standards and their time to discuss
methodology development. Finally, I would like to express my appreciation to the managers,
engineers, and on-site operators at the full-scale wastewater treatment plant for the opportunity to
conduct research on a suspended Anammox granule wastewater treatment system and to help
troubleshoot their system.

ix
DEDICATION
All the effort invested into my education and career would not be possible without the
unconditional support, love, and life lessons from my mom. You are a constant motivation in the
pursuit of knowledge and happiness and I am incredibly grateful that you are my mom.

x
TABLE OF CONTENTS
ABSTRACT .................................................................................................................................... ii
ACKNOWLEDGEMENTS .......................................................................................................... vii
DEDICATION ............................................................................................................................... ix
LIST OF TABLES ........................................................................................................................ xii
LIST OF FIGURES ..................................................................................................................... xiii
CHAPTER 1: INTRODUCTION ................................................................................................... 1
1.1 Research objectives ............................................................................................................... 5
1.2 Thesis overview..................................................................................................................... 6
CHAPTER 2: BACKGROUND AND LITERATURE REVIEW ................................................. 8
2.1 Biomolecular tools ................................................................................................................ 8
2.1.1 DNA extraction techniques ............................................................................................ 8
2.1.2 Quantitative Polymerase Chain Reaction (qPCR) .......................................................... 9
2.2 Anaerobic ammonia oxidizing (Anammox) bacteria .......................................................... 10
2.2.1 Anammox metabolic inhibition .................................................................................... 12
2.3 Anammox-based deammonification processes ................................................................... 13
2.3.1 Advantages of Anammox-based deammonification processes .................................... 14
2.3.2 Limitations of Anammox-based deammonification processes ..................................... 16
2.4 Phosphorus recovery/struvite formation ............................................................................. 17
CHAPTER 3: BIOREACTOR MICROBIAL ECOLOGY .......................................................... 19
3. 1 Methodologies for quantifying Anammox, Ammonia Monooxygenase, and Nitrobacter in
fixed biofilm and suspended anammox granules from wastewater treatment systems............. 19
3.1.1 Introduction .................................................................................................................. 19
3.1.2 Experimental / analytical methods (fixed biofilm) ....................................................... 22
3.1.2.1 Reactor operation ................................................................................................... 22
3.1.2.2 Sample collection and sample preparation ............................................................ 23
3.1.3 Experimental / analytical methods (suspended granules) ............................................. 25
3.1.3.1 Reactor operation ................................................................................................... 25
3.1.3.2 Sampling collection points and sample preparation .............................................. 25
3.1.4 DNA extractions ........................................................................................................... 26
3.1.5 Quantitative PCR (qPCR) standards and qPCR assays ................................................ 27

xi
3.1.6 Equations (fixed biofilm and suspended granules) ....................................................... 29
3.1.7 Results (fixed biofilm methodology advancements) .................................................... 30
3.1.8 Results (fixed biofilm) .................................................................................................. 34
3.1.9 Statistical results (fixed biofilm) .................................................................................. 42
3.1.10 Discussion (fixed biofilm) .......................................................................................... 44
3.1.11 Results (suspended granules) ...................................................................................... 47
3.1.12 Discussion (suspended granules) ................................................................................ 51
CHAPTER 4: AQUEOUS CHEMISTRY .................................................................................... 52
4. 1 Evaluating the impacts of a phosphorus recovery process on inorganic carbon and its
corresponding effects on downstream deammonification ......................................................... 52
4.1.1 Introduction .................................................................................................................. 52
4.1.2 Materials and methods .................................................................................................. 54
4.1.2.1 Sample collection and storage ............................................................................... 55
4.1.2.2 Lab simulation of P recovery ................................................................................. 55
4.1.3 Bench-scale tests of Kruger’s Anita™ Mox MBBR system ........................................ 58
4.1.4 Analytical analysis ........................................................................................................ 59
4.1.5 Results .......................................................................................................................... 60
4.1.6 Discussion ..................................................................................................................... 69
CHAPTER 5: SUMMARY AND CONCLUSION ...................................................................... 74
REFERENCES ............................................................................................................................. 77
APPENDIX ................................................................................................................................... 85
LIST OF ABBREVIATIONS ....................................................................................................... 95

xii
LIST OF TABLES
Table 1- qPCR assay primers* .......................................................................................................... 28
Table 2- qPCR Thermocycling Conditions ........................................................................................ 28 Table 3- DNA concentration and OD260/OD280 results from three different DNA isolation kits using
fixed biofilm media ......................................................................................................................... 31 Table 4- Comparison of relative abundance (copies/mL) and reactor performance (% inorganic N
removed) between study and literature .............................................................................................. 42 Table 5- Pearson's correlation coefficient results between the microbial ecology and selected reactor
performance .................................................................................................................................... 44
Table 6- QA/QC results for the AMX assay for February reactor data ................................................. 51
Table 7- Tukey simultaneous test adjusted p-values for difference of means ........................................ 65 Table 8- Results from a one-way ANOVA (Tukey Pairwise Comparison method) analyzing the effects of
varying surface area loading rates on centrate with P recovery ............................................................ 67 Table 9- Two sample t-test results analyzing the effect of a constant surface area loading rate (2.7 g
NH3/m2-day) on centrate with and without P recovery ........................................................................ 68

xiii
LIST OF FIGURES
Figure 1- Process flow diagram of conventional activated sludge wastewater treatment process (Water
and Sustainability, 2002) .................................................................................................................... 2 Figure 2- Global hypoxic and eutrophic coastal areas due to nutrient pollution (World Resources Institute,
2008) ................................................................................................................................................ 3
Figure 3- PCR process (modified from White, 2016)............................................................................ 9
Figure 4- Bioenergetics of the anammox reactions (modified from Madigan et al., 2011) ..................... 11
Figure 5- Schematic of Candidatus Kuenenia stuttgartiiensis cell (modified from Kuenen, 2008) .......... 11 Figure 6- Process flow diagram of mainstream and side-stream deammonification using seeded Anammox
for on-site pilot tests conducted at Blue Plains Advanced Wastewater Treatment Plant (O’Shaughnessy, 2015) .............................................................................................................................................. 14
Figure 7- Accumulated struvite formation in WWT pipes (Suszyński, 2016) ....................................... 17 Figure 8- Process flow diagram of the digestion process, including recycle streams from dewatered
sludge, in a conventional wastewater treatment plant (Bott, 2011) ....................................................... 20
Figure 9- Bench Scale MBBR schematic with Anammox seeded media .............................................. 23
Figure 10- AnoxKaldnes™ media after biomass extraction using liquid nitrogen ................................. 24 Figure 11- Schematic and operational DEMON® Hydrocyclone for biomass separation (Bott, 2011;
Johnson, 2013) ................................................................................................................................ 25
Figure 12- AnoxKaldnes™ plastic media carrier after biomass extraction using scraping and vortexing 33 Figure 13- Quantification of Anammox gene copies per mass for each qPCR assay. The horizontal axis
represents the reactor operation day-replicates. The error bars represent the range of qPCR technical
duplicates. The limits of detection for the AMX, AOB, and NOB assays were 104, 102, and 103,
respectively. .................................................................................................................................... 35 Figure 14- Quantification of AOB gene copies per mass for each qPCR assay. The horizontal axis
represents the reactor operation day-replicates. The error bars represent the range of qPCR technical
duplicates. The limits of detection for the AMX, AOB, and NOB assays were 104, 102, and 103,
respectively. .................................................................................................................................... 35 Figure 15- Quantification of NOB gene copies per mass for each qPCR assay. The horizontal axis
represents the reactor operation day-replicates. The error bars represent the range of qPCR technical
duplicates. The limits of detection for the AMX, AOB, and NOB assays were 104, 102, and 103,
respectively. .................................................................................................................................... 36 Figure 16- Quantification of Anammox gene copies per reactor volume for each qPCR assay. The
horizontal axis represents the reactor operation day-replicates. The error bars represent the range of qPCR
technical duplicates. The limits of detection for the AMX, AOB, and NOB assays were 104, 102, and 103,
respectively. .................................................................................................................................... 37 Figure 17- Quantification of AOB gene copies per reactor volume for each qPCR assay. The horizontal
axis represents the reactor operation day-replicates. The error bars represent the range of qPCR technical
duplicates. The limits of detection for the AMX, AOB, and NOB assays were 104, 102, and 103,
respectively. .................................................................................................................................... 37 Figure 18- Quantification of NOB gene copies per reactor volume for each qPCR assay. The horizontal
axis represents the reactor operation day-replicates. The error bars represent the range of qPCR technical
xiv
duplicates. The limits of detection for the AMX, AOB, and NOB assays were 104, 102, and 103,
respectively. .................................................................................................................................... 38
Figure 19- AMX, AOB, and NOB concentrations vs Feed NH4+ concentrations ................................... 40
Figure 20- AMX, AOB, and NOB concentrations vs % nitrogen removal concentrations...................... 41 Figure 21- Quantified Anammox gene copies per reactor volume (copies/mL) observed in the reactor,
overflow, and underflow process streams. Samples 1, 2, and 3 in the reactor for the February sample set
were below the limit of detection. The limits of detection for the AMX, AOB, and NOB assays were 104,
102, and 103, respectively. ................................................................................................................ 48 Figure 22- Quantified AOB gene copies per reactor volume (copies/mL) observed in the reactor,
overflow, and underflow process streams. The limits of detection for the AMX, AOB, and NOB assays
were 104, 102, and 103, respectively. .................................................................................................. 49 Figure 23- Quantified Nitrobacter gene copies per reactor volume (copies/mL) observed in the reactor,
overflow, and underflow process streams. The limits of detection for the AMX, AOB, and NOB assays
were 104, 102, and 103, respectively. .................................................................................................. 50
Figure 24- 50-gallon storage tank containing centrate collected from MWRD ...................................... 55 Figure 25- 20-gallon baffled Nalgene tank and standing mixer used for optimized phosphorus recovery
process............................................................................................................................................ 56
Figure 26- Process flow diagram of bench-scale phosphorus recovery lab simulation ........................... 58
Figure 27- Bench Scale MBBR Schematic ........................................................................................ 59 Figure 28- Percentage of alkalinity contributing species in the digested sludge and centrate without and
with P recovery ............................................................................................................................... 61 Figure 29- Total alkalinity and alkalinity contributing species measured in eq/L as CaCO3 in the digested
sludge and centrate without and with P recovery ................................................................................ 62
Figure 30- Effects of dissolved oxygen on % inorganic N eliminated .................................................. 63
Figure 31- Linear regression model for the surface area loading rates and % inorganic N elimination .... 64 Figure 32- Quantification of the % inorganic N eliminated at different ranges of surface area loading rates
....................................................................................................................................................... 65 Figure 33- One-way ANOVA Tukey Pairwise Comparison results on the effects of surface area loading
rate ranges on % inorganic N elimination (The Tukey grouping results (A, B, and C) are also presented)
....................................................................................................................................................... 66 Figure 34- Comparison of the % inorganic N eliminated with and without P recovery at a constant surface
area loading rate of 2.7 g NH3/m2-day ............................................................................................... 68
Figure 35- Projected % of inorganic N removed with increased alkalinity/ammonia ratios .................... 69 Figure 36- DNA extraction test 1 results from using the DNeasy DNA Isolation kit with vortex and
scraping .......................................................................................................................................... 85 Figure 37- DNA extraction test 2 results from using the DNeasy DNA Isolation kit with vortex and
scraping .......................................................................................................................................... 86 Figure 38- DNA extraction test 3 results from using the DNeasy DNA Isolation kit with liquid nitrogen
and smashing with a mortar and pestle .............................................................................................. 87 Figure 39- DNA extraction test 4 results from using the DNeasy DNA Isolation kit with liquid nitrogen
and smashing with a mortar and pestle .............................................................................................. 88 Figure 40- DNA extraction test 5 results from using the DNeasy DNA Isolation kit with liquid nitrogen
and smashing with a mortar and pestle .............................................................................................. 89 Figure 41- DNA extraction test 6 results from using the PowerLyzer PowerSoil DNA Isolation kit with
liquid nitrogen and smashing with a mortar and pestle ....................................................................... 90

xv
Figure 42- DNA extraction test 7 results from using the PowerLyzer PowerSoil DNA Isolation kit with
liquid nitrogen and smashing with a mortar and pestle ....................................................................... 91 Figure 43- DNA extraction test 8 results from using the PowerLyzer PowerSoil DNA Isolation kit with
liquid nitrogen and smashing with a mortar and pestle ....................................................................... 92 Figure 44- DNA extraction test 9 results from using the PowerBiofilm DNA Isolation kit with liquid
nitrogen and smashing with a mortar and pestle ................................................................................. 93 Figure 45- DNA extraction test 10 results from using the PowerBiofilm DNA Isolation kit with liquid
nitrogen and smashing with a mortar and pestle ................................................................................. 94

1
CHAPTER 1: INTRODUCTION
Projections estimate that the global human population is growing at a rate of 0.94% per
year (United Nations, 2015). As the number of people increase worldwide, existing challenges
continue to become more severe, including limited power resources, excess nutrient (nitrogen and
phosphorus) pollution, and the desperate need to optimize wastewater treatment (WWT) processes
to treat increased volumes of wastewater safely and efficiently.
According to the United States Environmental Protection Agency (US EPA), wastewater
treatment plants (WWTPs) in the U.S. process over 128,700 m3 of wastewater every day. To move
and treat the large volumes of wastewater generated and water required daily requires nearly 4%
of the U.S.’s electricity usage (Electric Power Research Institute, 2002). A report by the Electric
Power Research Institute estimates that daily WTTPs in the U.S. using activated sludge and
advanced WWT without and with nitrification consume approximately 0.349 kWh/m3, 0.407
kWh/m3, and 0.505 kWh/m3, respectively (Electric Power Research Institute, 2002). Figure 1
below illustrates a process flow diagram of a conventional activated sludge WWT process that
uses traditional biological nitrogen removal (BNR) processes.

2
Figure 1- Process flow diagram of conventional activated sludge wastewater treatment process (Water and Sustainability, 2002)
While effluent from conventional activated sludge WWTPs have been treated for harmful
pathogens, high concentrations of nutrients, specifically nitrogen and phosphorus, remain. When
nitrogen and phosphorus concentrations exceed the nutrient loading rates needed to maintain
healthy aquatic ecosystems in the receiving water body, nutrient pollution occurs. Among the most
significant occurrences of nutrient pollution, from excess nitrogen, is eutrophication. During
eutrophication, large algal blooms form, decreasing water quality, and negatively affecting humans
and animals. As the algae decay, dissolved oxygen (DO) is consumed, creating hypoxic zones.
Figure 2 below illustrates the global eutrophic and hypoxic areas.

3
Figure 2- Global hypoxic and eutrophic coastal areas due to nutrient pollution (World Resources Institute, 2008)
Any plant or animal life existing in these hypoxic and eutrophic zones then die due to the lack of
available DO. Eutrophication creates a ripple effect, negatively impacting aquatic life and humans
because of decreased biodiversity which also results in a depletion of marine food sources. People
living in coastal and freshwater recreational areas experience economic losses due to a decrease in
resources. In the U.S. alone, approximately $2.2 billion are lost annually due to eutrophication of
freshwater sources, which impact recreational waters, waterfront real estate, spending on recovery
of threatened and endangered species, and drinking water (Dodds et al., 2009). While in the
European Union, economic losses due to eutrophication account for approximately €75k – €485k
annually and monetary losses are valued at £29k – £118k annually in the United Kingdom
(Sanseverino et al., 2016). Additionally, excess nitrogen compounds in the air can produce
pollutants such as ammonia and ozone, which can impair a living organism’s ability to breathe,
limit visibility, and alter plant growth (Environmental Protection Agency, 2017).
4
The Clean Water Act section 402 and Code of Federal Regulations 122.1(b) establishes the
framework for the National Pollutant Discharge Elimination System (NPDES), by requiring
permits for any pollutants discharged from a point source to U.S. water bodies. These efforts, set
by the US EPA, are meant to develop and enforce more stringent state and federal regulations to
help alleviate and prevent the impact of nutrient pollution on existing and potentially impaired
water bodies. Therefore, as nutrient discharge limits become increasingly stringent, and resources
such as energy, land, and money become limited, efforts towards developing innovative
approaches and designs as well as optimizing existing WWT systems to meet corresponding
challenges is crucial.
One advancement within WWTPs is the addition of phosphorus (P) removal and recovery
processes. Studies on P removal and recovery from wastewater in the form of struvite, a white
crystalline compound (MgNH4PO4.6H2O), have successfully been shown to remove and recover
more than 90% P from centrate (Adnan et al., 2004; Fattah et al., 2008a; Fattah et al., 2008b).
Struvite from P recovery is a beneficial product in the agriculture industry as a fertilizer, because
of its composition and struvite production from wastewater can help alleviate dependence on
global P reserves, which are becoming depleted (Suszyński, 2016). One limitation with the struvite
recovery process is that a significant amount of NH4+-N remains in the treated effluent, since
struvite chemistry requires equimolar N to P molar ratios, while the N:P molar ratio in centrate is
around 20:1. However, this limitation can be beneficial for systems that couple P recovery
processes with deammonification using anaerobic ammonia oxidizing bacteria, Anammox
(AMX), since AMX consume NH4+-N and NO2
--N to treat wastewater (van der Star et al., 2007).
Anammox-based deammonification systems are advanced technologies within the WWT
industry for optimally removing nitrogen. Unlike conventional nitrification-denitrification

5
processes, Anammox-based deammonification processes require less resources, including DO,
energy, external carbon sources, and equipment, and if maintained then can be a very lucrative
alternative to conventional WWT processes. While the Anammox-based deammonification
process was discovered in the early 1990s, only 100 full-scale systems existed in 2014 (Lackner
et al., 2014; Marie et al., 2014). The first full-scale granular anammox system was implemented
in 2007, after 3.5 years of start-up work (Ni et al., 2013).
The most challenging limitation of an Anammox-based deammonification system is
maintaining a balanced microbial ecology between AMX, ammonia oxidizing bacteria (AOB), and
nitrite oxidizing bacteria (NOB). Literature suggests methods for determining the microbial
ecology by quantifying target genes for AMX, AOB, and NOB populations of fixed biofilm and
suspended granules (Park et al., 2015; Marie et al., 2014; Li et al., 2011). However, additional
research was conducted to optimize sample prep and DNA extraction processes to minimize biases
with the goal of improving data accuracy. The results from the advancements made to existing
biomolecular tool techniques were compared with reactor performance to observe their effects and
the effects of P recovery, in the form of struvite crystallization, on downstream deammonification
processes.
1.1 Research objectives
This work involved conducting two independent research studies: 1) analyses of fixed
biofilm microbial ecology and performance data of an Anammox-based deammonification moving
bed biofilm reactor (MBBR) using centrate with and without phosphorus (P) recovery and 2)
analyses of the microbial ecology in a full-scale, operational reactor inoculated with suspended
Anammox granules. The research objectives for the first study were to:
6
• Advance published Anammox fixed biofilm sample preparation and DNA
extraction methods
• Determine if correlations could be made from steady-state microbial ecology data
and MBBR performance data
• Evaluate the impacts of a P recovery process on the fate of inorganic carbon
(especially carbonates), phosphate, sulfides, and volatile fatty acids
• Assess the effects of a P recovery process on the downstream deammonification
process
• Analyze the effects of dissolved oxygen, surface area loading rates, and
alkalinity/ammonia ratio on MBBR performance
The research objectives for the second study were to:
• Develop a sampling method that minimized biases of the microbial ecology results
• Determine the microbial ecology of the reactor and overflow and underflow process
streams to help troubleshoot operational issues observed in the on-site processes
1.2 Thesis overview
Chapter 2 describes the background for this study by presenting a literature review on
biomolecular tools (DNA extractions and qPCR), Anammox bacteria, Anammox-based
deammonification reactors, and the phosphorus recovery/struvite formation process. Chapter 3 is
segmented into two parts: quantification of target genes to determine the AMX, AOB, and NOB
concentrations in fixed biofilm seeded media in a MBBR and quantification of target genes to
determine the AMX, AOB, and NOB concentrations of suspended granules in a full-scale,
operational reactor. Detailed in chapter 3 are advancements made to published fixed biofilm DNA

7
extraction protocols, analyses conducted between the microbial ecology data and the reactor
performance data of a MBBR, and analyses conducted on the microbial ecology data obtained
from a full-scale, operational reactor containing suspended granules. Chapter 4 presents aqueous
chemistry concepts, experiments, and analyses conducted on centrate with and without phosphorus
recovery to determine performance of MBBR. Chapter 5 provides a summary and conclusion
along with recommendations for advancing the use of biomolecular tools to optimize the
Anammox-based deammonification processes in wastewater treatment.

8
CHAPTER 2: BACKGROUND AND LITERATURE REVIEW
2.1 Biomolecular tools
Biomolecular tools have been used for numerous applications in a wide range of industries
including healthcare, pharmaceuticals, and material science. However, biomolecular tools have
more recently been used to help advance wastewater treatment (WWT) processes, specifically the
use of DNA extraction techniques and qPCR. DNA extraction techniques allow for DNA to be
extracted from a sample, which is then used in downstream qPCR analysis. qPCR techniques use
forward and reverse primers to target specific genes from the extracted DNA, which can be
quantified to determine the relative abundance of species of interest to determine the microbial
ecology of the WWT system.
2.1.1 DNA extraction techniques
There are three types of general techniques used for DNA extraction: solid phase, inorganic
and organic DNA extraction. The DNA extraction technique used in this study was solid phase
DNA extraction, wherein a solid support, such as microbeads, were used to immobilize DNA. The
general steps used for DNA extraction in this study were:
1. Cell lysis: the cell membrane and/or cell walls are broken open
a. Mechanical lysis: bead beating
b. Chemical lysis: addition of a dry chemical reagent in the bead tube to help break
down the extracellular polymer substances present in biofilms
c. Heat lysis: sample was incubated at 65°C for 5 minutes
2. Cellular debris (non-DNA organic and inorganic) removal
3. Precipitate nucleic acids with ethanol
9
4. Remove residual contaminating nucleic acids
a. Remove DNA by DNase treatment
The exact DNA extraction procedure used in this study was followed based on the PowerBiofilm
DNA Isolation Kit protocol (MoBio Laboratories, Carlsbad, CA).
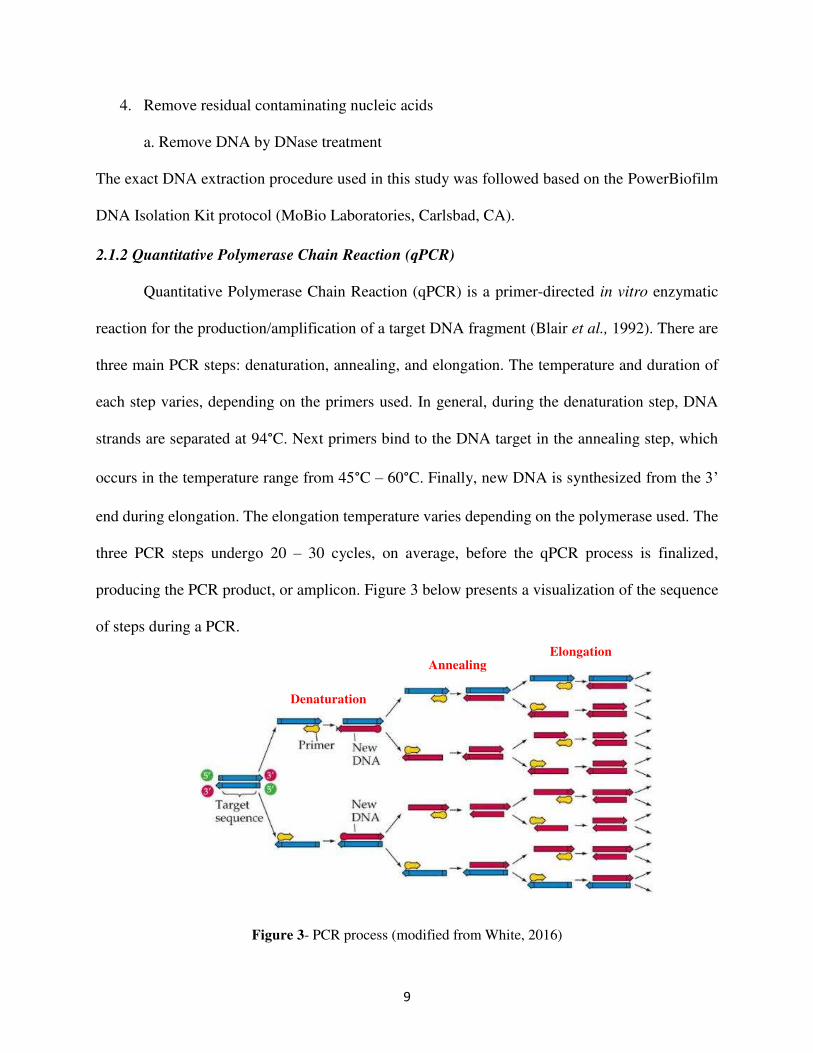
2.1.2 Quantitative Polymerase Chain Reaction (qPCR)
Quantitative Polymerase Chain Reaction (qPCR) is a primer-directed in vitro enzymatic
reaction for the production/amplification of a target DNA fragment (Blair et al., 1992). There are
three main PCR steps: denaturation, annealing, and elongation. The temperature and duration of
each step varies, depending on the primers used. In general, during the denaturation step, DNA
strands are separated at 94°C. Next primers bind to the DNA target in the annealing step, which
occurs in the temperature range from 45°C – 60°C. Finally, new DNA is synthesized from the 3’
end during elongation. The elongation temperature varies depending on the polymerase used. The
three PCR steps undergo 20 – 30 cycles, on average, before the qPCR process is finalized,
producing the PCR product, or amplicon. Figure 3 below presents a visualization of the sequence
of steps during a PCR.
Figure 3- PCR process (modified from White, 2016)
Denaturation
Annealing Elongation

10
2.2 Anaerobic ammonia oxidizing (Anammox) bacteria
Anaerobic ammonium oxidizing, Anammox (AMX), bacteria are obligate anaerobic
autotrophs that utilize carbon dioxide as their sole carbon source and use nitrite as an electron
donor to produce cell material, as shown in Eq – 1 below (Madigan et al., 2011):
Eq – 1: CO2 + 2NO2- + H2O CH2O + 2NO3
-
AMX bacteria were first discovered in wastewater sludge in the early 1990s (Kuenen,
2008). The applications of AMX bacteria in WWT processes became apparent when it was
discovered that ammonia (NH3) or ammonium (NH4+) can be oxidized by AMX bacteria with
nitrite (NO2-) as the electron acceptor to produce nitrogen gas (N2 (g)), as indicated in Eq – 2 below
(Strous et al., 1998):
Eq – 2: 1NH4+ + 1.32NO2
- + 0.066HCO3- + 0.13H+ 1.02N2 + 0.26NO3
- +
0.066CH2O0.5N0.15 + 2.03H2O
While Eq – 2 above provides the chemical stoichiometry behind the Anammox reaction, the
bioenergetics more specifically explain the Anammox reaction.
First, NO2--N is reduced to nitric oxide (NO) by nitrite reductase (NiR). Then NO reacts
with ammonium (NH4+) to form hydrazine (N2H4) by activity of the enzyme hydrazine hydrolase
(HH). N2H4 is then oxidized to N2 via a two-electron oxidation by the enzyme hydrazine
dehydrogenase (HZO). Some of the electrons generated at this step enter the anammoxosome
electron transport chain which produces a proton motive force and ATP by ATPase, while others
feed back into the system to drive the electron-consuming earlier steps (Madigan et al., 2011). The
bioenergetics of the Anammox reaction are illustrated in Figure 4 below.

11
Figure 4- Bioenergetics of the anammox reactions (modified from Madigan et al., 2011)
These Anammox reactions occur within a membrane bound structure called the
anammoxosome. As illustrated in Figure 5 below, the anammoxosome accounts for approximately
half of the cell’s volume and is designed to protect the cell from the toxic intermediates produced
during the anammox reaction, specifically N2H4, a very strong reductant (Madigan et al., 2011).
Figure 5- Schematic of Candidatus Kuenenia stuttgartiiensis cell (modified from Kuenen, 2008)
12
2.2.1 Anammox metabolic inhibition
Since optimal AMX bacterial growth occurs in anaerobic conditions, DO concentrations
significantly impact the Anammox process, and excess DO can reversibly inhibit AMX growth
(Szatkowska et al., 2014). However, AOB require aerobic conditions to oxidize NH3-N to NO2--
N, and optimal DO concentrations results in efficient NO2--N production, which is required for the
Anammox process (Cema et al., 2011). In fact, the NO2--N production rate is the rate-limiting step
for the Anammox process and the overall reaction in a single stage system (Szatkowska et al.,
2007b). While AMX use NO2--N as a substrate for cellular material production, literature reports
that NO2--N concentrations can reduce, or at greater concentrations, reversibly inhibit cellular
metabolism (Szatkowska et al., 2014).
Studies also indicate that specific concentrations of hydrazine, methanol, and free ammonia
and pH and temperature inhibit Anammox metabolism. Research indicates that the addition of
N2H4, to a biofilm reactor significantly decreased Anammox activity after 80 days (Schalk et al.,
1997). However, it was reported that inactive AMX in a culture medium may become active again
with the addition of catalytic amounts of N2H4 or hydroxylamine (Strous et al., 1999). Experiments
performed with AMX enrichment cultures from wastewater suggest that methanol inhibits the
Anammox process, and at concentrations ≥0.5 mM complete and irreversible loss of AMX activity
was observed (Güven et al., 2005). Tang et al. (2009) suggests that free ammonia concentrations
and pH levels contributed to the destabilization of an Anammox bioreactor seeded with anaerobic
granular sludge during the first 125 days of reactor startup. Studies indicate that Anammox-based
deammonification processes may be limited by lower temperatures, since the optimal temperature
for AMX is 37°C (Isaka et al., 2008; Vázquez-Padín et al., 2011).

13
2.3 Anammox-based deammonification processes
With the discovery of AMX bacteria, researchers quickly saw the opportunity to study
Anammox reactions to optimize WWTPs from the existing conventional nitrification-
denitrification processes. Although the Anammox process has been utilized for treatment of highly
concentrated ammonium streams, in both bench-scale and full-scale systems, such as landfill
leachate, swine manure, effluent from digested fish canning, and tannery wastewater, studies have
shown that the most successful application of the Anammox process is in the side-stream treatment
of centrate and filtrate (reject water) from dewatered anaerobically digested biosolids (Szatkowska
et al., 2014). By 2014, 100 Anammox-based deammonification processes had been implemented
in full-scale WWTPs (Lackner et al., 2014; Marie et al., 2014).
As with any WWTP, Anammox-based deammonification systems have various
configurations depending on the wastewater feed quality and the end use or discharge permit limits
of the treated effluent. Figure 6 below illustrates the process flows for an on-site pilot test
conducted at Blue Plains Advanced WWTP. The pilot configuration employs side-stream
deammonification of dewatered sludge from the solids handling processes and recycles the AMX
and AOB back to the mainstream deammonification processes. The overall process was evaluated
to determine if a seeded media mainstream deammonification process was possible for
implementation in the existing B-stage process (separate sludge nitrification/denitrification
process), while meeting stringent nutrient limits of 3 mg/L total nitrogen and 0.18 mg/L total
phosphorus (O’Shaughnessy, 2015).

14
Figure 6- Process flow diagram of mainstream and side-stream deammonification using seeded Anammox for on-site pilot tests conducted at Blue Plains Advanced Wastewater Treatment Plant
(O’Shaughnessy, 2015)
2.3.1 Advantages of Anammox-based deammonification processes
A study using a bench-scale Anammox MBBR reported achieving a maximum total
nitrogen (TN) removal rate of 1.1 g-N/L-day and studies using a bench-scale Anammox upflow
anaerobic sludge blanket (UASB) reactor reported achieving a maximum TN removal rate of 10.7
g-N/L-day (Yokota et al., 2018) and 18.3 g-N/L-day (Casagrande et al., 2013). Experiments
conducted on the maximum nitrification and denitrification rates achieved in a two-sludge system,
with a nitrifying activated sludge and a denitrifying activated sludge, were 0.37 g N-NH4+ / g
VSS-day (at 25°C) and 0.11 g N-NOx− / g VSS-d (using methanol) (Carrera et al., 2013).
Additionally, BNRs can only achieve average TN concentrations of 8-10 mg/L and average total
phosphorus concentrations of 1-3 mg/L in the treated effluent (Freed, 2007). One study reported
that a WWTP incorporating an Anammox-based deammonification system could reduce the
marine eutrophication potential up to 16% (Hauck et al., 2016). Therefore, Anammox-based
deammonifcation processes are more efficient at reducing N loading into water bodies, which
15
decreases nutrient pollution and consequently mitigates eutrophication, helping WWTPs meet
stringent discharge limits. The importance of not only meeting discharge limits but also managing
the N cycle is recognized through implementation of an Anammox-based deammonification
system.
In 2008, the National Academy of Engineering (NAE) published their NAE Grand
Challenges for Engineering report, which included 14 global challenges and goals necessary for
sustaining life on earth. Among the 14 goals is managing the N cycle by restoring its balance
through better fertilization technologies, increased N removal from WWT effluent, and recycling
wastes high in N, such as food, manure, and other organic wastes (NAE, 2008). Like the NAE,
state and federal government regulatory agencies in the U.S. and regulatory agencies in the
European Union (EU) recognize the significant impacts an unbalanced N cycle has on all living
organisms, which is why nutrient discharge permits are becoming increasingly stringent. In
Colorado, the current discharge permit for total inorganic nitrogen (TIN) is 7 mg/L (Colorado
department of public health and environment water quality control commission, 2012). The
European Water Framework Directive (2000/60/EC) implemented the Urban Waste Water
Directive (92/271/EEC), which states that European WWTPs can discharge 10-15 mg-N/L to
sensitive areas, depending on the size of the community, and that 70–80% of the initial amount of
N present in the influent is removed (Hauck et al., 2016). Another benefit of Anammox-based
deammonification processes is that unlike conventional WWTPs, that rely on traditional BNR
processes, Anammox-based deammonification processes require less DO.
Since AMX are obligatory anaerobic bacteria, they do not require dissolved oxygen (DO).
Rather, DO requirements are for other microorganisms in the deammonification process such as
AOBs and NOBs. Estimates indicate that Anammox-based deammonification processes consume

16
62.5% less oxygen (Park et al., 2015). Therefore, as a result of lower DO requirements, WWTPs
implementing Anammox-based deammonification processes have reduced power consumption
and require less aeration pumps and equipment, which in turn reduces capital and operation &
maintenance (O&M) costs.
Additionally, Anammox-based deammonification processes require no external carbon
source and have lower biomass yields compared to conventional BNRs (Park et al., 2015).
Whereas in conventional nitrification/denitrification processes 1.91 mg of methanol is required
per mg of oxidized N removed (Water Environment Federation, 2017) and this can be a major
contributor to operating costs.
2.3.2 Limitations of Anammox-based deammonification processes
A limitation to Anammox-based deammonification processes is the growth rate of AMX
bacteria. AMX bacteria have a very slow growth rate (μ = 0.0027 h-1) (Strous et al., 1998; van der
Star et al., 2007), which results in delayed reactor performance observations. The inability to
quickly observe the effects of altered process and operating conditions could easily result in
process upsets to which the causes are not easily known.
Another disadvantage of Anammox-based deammonification processes is the need to
maintain a balanced microbial ecology. Studies have shown that a balanced microbial ecology
between AMX, AOB, and NOBs is vital for successful operation of an Anammox-based
deammonification system (Li et al., 2011; Marie et al., 2014; Park et al., 2015; Regmi et al., 2015;
van der Star et al., 2007). Since full-scale WWTPs lack the resources to conduct analyses using
biomolecular tools such as DNA and RNA extraction, qPCR, and sequencing, operators cannot
analyze reactor samples on-site. Instead, the WWTPs need to ship samples to laboratories capable
of analyzing them, which can be costly.
17
2.4 Phosphorus recovery/struvite formation
In addition to nutrient pollution from excess nitrogen loading into water bodies, excess
phosphorus (P) also contributes to nutrient pollution. While P is an essential element for all living
organisms, especially plants, discharging too much P can be detrimental to ecosystems. When
agricultural or urban lands receive more P as fertilizer than the plants can consume, excess P runs
off during to irrigation or precipitation events, thus exacerbating eutrophication of water bodies.
Point sources, such as WWTPs also contribute to nutrient pollution problems.
Studies indicate that if all the P in sewage sludge from industrial and municipal wastewater
sources in Europe were recovered then Europe’s fertilizer imports could be reduced by 22%,
through struvite formation (Lederer et al., n.d.). (Lederer et al., n.d.) also suggests that retrofitting
WWTPs with P recovery systems for struvite formation could decrease Europe’s dependence on
imported fertilizers from 22% to 26%. P removal from WWTPs also directly benefits the facilities
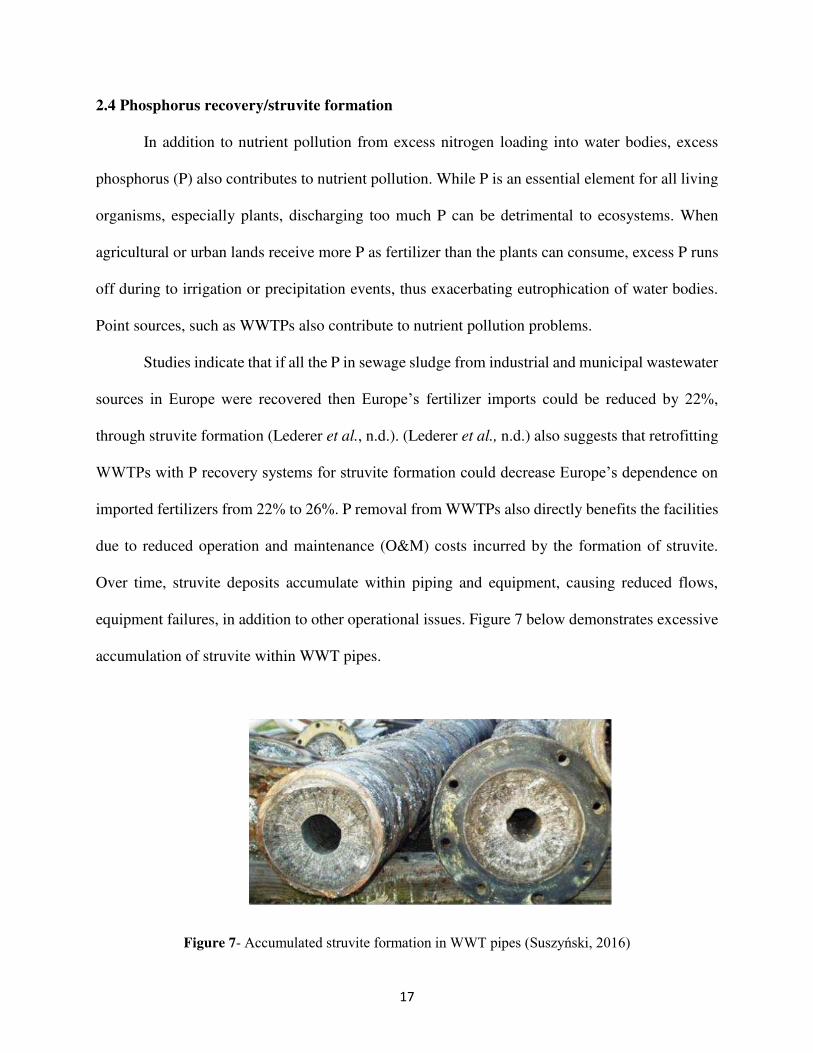
due to reduced operation and maintenance (O&M) costs incurred by the formation of struvite.
Over time, struvite deposits accumulate within piping and equipment, causing reduced flows,
equipment failures, in addition to other operational issues. Figure 7 below demonstrates excessive
accumulation of struvite within WWT pipes.
Figure 7- Accumulated struvite formation in WWT pipes (Suszyński, 2016)

18
Additionally, P is being consumed at a rate of about 148 million tonnes per year. Estimates
indicate that high-quality P reserves will be depleted within 50-100 years, where the U.S. has less
than 30 years left of supplies (Cordell, 2008b). Furthermore, due to an uneven spatial distribution
of P, where five countries provide approximately 90% of the global P consumed, international P
trade markets are significantly impacted (Lederer et al., n.d.). Therefore, as nutrient pollution
issues become exacerbated due to increased nutrient loading into water bodies and increasing
demands for fertilizers deplete global phosphorus reserves, P recovery for struvite formation in
WWT processes becomes a more lucrative solution to address the growing challenges (Suszyński,
2016).
Studies on P removal and recovery from wastewater in the form of struvite, a white
crystalline compound (MgNH4PO4.6H2O), have successfully been shown to remove and recover
more than 90% P from centrate (Adnan et al., 2004; Fattah et al., 2008a; Fattah et al., 2008b).
Struvite from P recovery is a beneficial product in the agriculture industry as a fertilizer because
of its composition. Struvite used as fertilizer also provides an alternative source of P to depleting
mined mineral rock sources. However, the struvite recovery process leaves a significant amount
of NH4+-N in the treated effluent, since struvite chemistry requires equimolar N to P molar ratios,
while the molar ratio of N:P is around 20:1 in centrate. Therefore, since struvite formation results
in the treated effluent containing excess NH4+-N, combining P recovery with an Anammox-based
deammonification treatment system could optimize WWT processes by increasing P and N
removal, thus reducing nutrient pollution, and allowing WWTPs to meet stringent nutrient loading
permits.

19
CHAPTER 3: BIOREACTOR MICROBIAL ECOLOGY
3. 1 Methodologies for quantifying Anammox, Ammonia Monooxygenase, and Nitrobacter
in fixed biofilm and suspended anammox granules from wastewater treatment systems
3.1.1 Introduction
Conventional wastewater treatment (WWT) processes achieve nitrogen removal by
biological nitrification-denitrification (Grady et al., 2011). However, as nitrogen discharge limits
become more stringent, WWT infrastructure in the U.S. reaches its design life, and energy
conservation becomes a priority, alternatives to conventional WWT processes are becoming more
crucial. One such alternative is the use of anaerobic ammonia oxidizing bacteria, Anammox
(AMX), which were discovered in the late 1990s (Strous et al., 1999). Anammox-based
deammonification processes are efficient and cost-effective alternatives to conventional processes
in treating ammonia rich wastewater streams at mesophilic temperatures (Abma et al., 2010;
Sliekers et al., 2002; van der Star et al., 2007; Wett, 2007), such as recycle streams from dewatered
sludge from anaerobic digesters. Figure 8 below illustrates recycle streams from the solids
handling processes in an overall WWT process, which would be ideal for treatment via an
Anammox-based deammonification system. The potential for retrofitting existing WWTPs, with
recycle side-streams from solids handling, is demonstrated in Figure 8 because a WWTP could
install an Anammox-based deammonification process to treat the recycle side-streams, to help the
plant meet more stringent nitrogen discharge limits.

20
Figure 8- Process flow diagram of the digestion process, including recycle streams from dewatered sludge, in a conventional wastewater treatment plant (Bott, 2011)
Anammox-based deammonification utilizes nitritation where ammonia oxidizing bacteria
(AOB) partially convert NH4+ to NO2
- while AMX use NO2- and convert the remaining NH4
+ to
N2 gas. The remaining NO2- is oxidized to NO3
- during nitratation by nitrite oxidizing bacteria
(NOB) (Fukumoto et al., 2011).
There are several advantages to using Anammox deammonification, thus making it
attractive for wastewater treatment plants (WWTPs). Anammox can be used to remove residual
NH4+ to meet discharge permits as well as residual NO2
- to avoid high chlorine demand during
disinfection (Regmi et al., 2016), thus potentially reducing the amount of disinfection byproducts
formed. Since the Anammox process converts NH4+ directly to N2(g) the process is cost-effective
compared to conventional WWT processes since the equipment required is reduced, and therefore,
less operation and maintenance (O&M) costs are incurred. Additionally, Anammox
deammonification processes require no external carbon source, consume 62.5% less oxygen, and
21
have lower biomass yields compared to conventional WWT processes (Park et al., 2015;
Innerebner et al., 2007; Kampschreur et al., 2008; Thöle et al., 2005; van der Star et al., 2007).
As of 2014, there were approximately 100 full scale WWTP worldwide with Anammox-
based reactors (Lackner et al., 2014; Marie et al., 2014) and that number has continued to increase.
To facilitate increased implementation and troubleshooting capabilities for Anammox technology
in industrial sized applications this study focuses on methodology development to effectively
determine the microbial ecology of fixed biofilm media using a pilot scale Anammox Moving Bed
Biofilm Reactor (MBBR). Advancements to published methodologies were made in this study and
were evaluated based on their ability to optimize DNA extraction concentrations, based on the idea
that maximizing yield would also produce the most representative DNA samples (by minimizing
biases) for use in gene quantification with qPCR assays as well as reduced sampling variability.
While there are several benefits to utilizing Anammox deammonification, several
challenges exist with the process. One challenge of the Anammox deammonification process is
maintaining a balanced microbial ecology that promotes AMX and AOB growth while limiting
NOB growth, to reduce NO3- concentrations. Achieving a balanced microbial ecology is also
necessary to reduce competition for NO2- between AMX and NOB. Since mainstream wastewater
flows are often dilute (total nitrogen concentrations < 100 mg/L) and have low temperatures (<
30°C) suppressing NOB growth becomes a challenge and therefore, deammonification of these
streams becomes more difficult (Regmi et al., 2016). Since the optimal temperature for AMX is
37°C and AMX have relatively lower specific growth rates compared to AOB and NOB,
deammonification may be limited by lower temperatures (Isaka et al., 2008; Vázquez-Padín et al.,
2011). The theoretical AMX stoichiometry ratios proposed by Strous et al., 1998 for NO2- -N
removed: NH4+ -N removed and NO3
- -N produced: NH4+ -N removed are 1.32 and 0.26,

22
respectively. While more current literature (Lotti et al., 2014) suggests a stoichiometry ratio of 1.2
for NO2- -N removed: NH4
+ -N removed and 0.21 for NO3- -N produced: NH4
+ -N removed.
Another challenge with operating an Anammox reactor is determining optimal operating
conditions. Anammox are anaerobic bacteria and have a very slow growth rate (μ = 0.0027 h-1)
(Strous et al., 1998; van der Star et al., 2007) which results in delayed observations when altering
process and operating conditions.
Due to limited resources, replicates from only one MBBR were obtained. The results
presented in this study were used to support the goal of this part of the project which was to advance
published sampling protocols for fixed biofilm and suspended granules and improve published
DNA extraction methodologies to support wastewater treatment operators who work directly with
full-scale, fixed biofilm Anammox deammonification MBBRs as well as suspended Anammox
granule reactors. Coupling biomolecular tools with conventional analytical chemistry methods,
can guide operators to optimize MBBR performance.
3.1.2 Experimental / analytical methods (fixed biofilm)
3.1.2.1 Reactor operation
A 7L bench scale MBBR with Anammox seeded media (AnoxKaldnes™, Kruger Inc.) was
designed and constructed specifically for this study and kept in a temperature-controlled room at
30°C. Centrate from Denver Metro Wastewater Reclamation District was continuously fed to the
MBBR, after phosphorus (P) recovery, and mixed at a continuous rate. The reactor mixer was
operated at a fixed rate and the centrate feed rate was variable to account for the variable
ammonium loading rate in the centrate. Initially, the dissolved oxygen (DO) was incrementally
increased and the centrate was fed at a variable flow rate until steady state was achieved. The
reactor was aerated with laboratory air, and at steady state, the bulk DO in the reactor was

23
maintained in the range of 0.40 – 0.55 mg O2/L. Random grab samples of the centrate and
Anammox seeded media were taken to analyze reactor performance. Figure 9 below illustrates the
bench scale reactor used for this study.
Figure 9- Bench Scale MBBR schematic with Anammox seeded media
3.1.2.2 Sample collection and sample preparation
For sample collection, AnoxKaldnes™ media were randomly obtained, during steady state,
from the MBBR twice a week using ethanol rinsed tweezers and stored in a 50 mL tube at -80°C
(Park et al., 2015), until use for DNA extraction. Samples were prepared for DNA extraction by
submerging the media in liquid nitrogen in a mortar. The media was then placed on a 12.7 cm x
12.7 cm piece of aluminum foil and the edges folded to create a sealed package. A pestle was used
to repeatedly strike the media until the media was broken into several pieces. The aluminum foil
was carefully opened, and biomass was scraped off the aluminum foil using an ethanol rinsed
spatula. The biomass was placed into a 2 mL microcentrifuge tube, and the plastic carrier was

24
placed in a 50 mL tube with approximately 2,500 μL of phosphate buffered saline (PBS). Figure
10X below shows an AnoxKaldnes™ media after biomass extraction.
Figure 10- AnoxKaldnes™ media after biomass extraction using liquid nitrogen
The 50 mL tube was vortexed for 30 seconds or until the biomass was visibly loosened
from the plastic carrier. The 50 mL tube was centrifuged at 11,180 x g for 8 minutes. Then the
plastic carrier was visually inspected to see if any biomass remained. If biomass remained on the
plastic media the tube was turned upside down and vortexed, to allow the PBS to loosen any
remaining biomass. The 50 mL tube was then centrifuged again at 11,180 x g for 8 minutes. If no
biomass remained on the plastic media, the plastic media was carefully removed with ethanol
rinsed tweezers and the supernatant removed. The 50 mL tube was centrifuged again at the same
settings and the supernatant was removed. The pelleted biomass was scraped with an ethanol rinsed
spatula and placed in a microcentrifuge tube containing the scraped biomass from the aluminum
foil. The biomass was homogenized for 10 seconds using a micromotor and pellet pestle (Fisher
Scientific, Waltham, MA). Triplicate DNA extractions per sample were performed. Then a single
qPCR assay was run on each DNA extraction.

25
3.1.3 Experimental / analytical methods (suspended granules)
3.1.3.1 Reactor operation
Experiments were conducted on samples taken from a full-scale reactor containing
suspended Anammox granules at an operation WWTP. Feed from the overflow process stream
was fed into a hydrocyclone (DEMON®-Biomass Separation) where biomass would separate into
the underflow process stream, as shown in Figure 11 below.
Figure 11- Schematic and operational DEMON® Hydrocyclone for biomass separation (Bott, 2011; Johnson, 2013)
3.1.3.2 Sampling collection points and sample preparation
For the first set of samples, obtained in January 2017, one-50 mL sample was obtained
from each process stream (reactor, overflow, and underflow), for a total of three samples. Duplicate
DNA extractions were performed per sample. Then technical qPCR replicates were performed on
each DNA extraction, for a total of six potential data points for each sample. Depending on whether
the data point passed quality assessment/quality control (QA/QC) determined the number of data
points for each sample. Results from the January sampling, as shown in Figures 21-23 below,
indicated high sampling variability; therefore, the sampling regime was modified.

26
For the second set of samples, obtained in February 2017, nine total samples were obtained,
which comprised of three samples from each process stream (reactor, overflow, and underflow),
in 50 mL tubes. A single DNA extraction was performed per sample. Technical duplicates were
performed on each DNA extraction, for a total of nine potential data points for each sample. The
actual number of data points per sample was dependent on a QA/QC screening.
All the samples obtained in January and February were transported on ice in a cooler from
the full-scale WWTP to the Colorado State University (CSU) laboratories. Samples that were not
processed for DNA extraction immediately were centrifuged at 11,180 x g for 8 minutes. The
supernatant was removed, and pelleted biomass was stored at -80°C.
Samples that were processed the same day as sampling were centrifuged at 11,180 x g for
8 minutes, and the biomass was scraped from the 50 mL tube using an ethanol rinsed spatula and
placed into a 2 mL microcentrifuge tube. The biomass was homogenized for 10 seconds using a
micromotor and pellet pestle (Fisher Scientific, Waltham, MA). Biomass homogenization
necessary to obtain a representative sub-sample, where 1/3 of the biomass was used during DNA
extraction.
3.1.4 DNA extractions
To compare DNA extraction yields to published literature, the following kits were used:
DNeasy blood and tissue kit (Qiagen, Germantown, MD), PowerLyzer PowerSoil DNA Isolation
kit, and the PowerBiofilm DNA Isolation kit (MoBio Laboratories, Carlsbad, CA). Based on the
comparative results of the three kits (results presented in section 3.1.7), the PowerBiofilm DNA
Isolation kit was used to perform DNA extractions for this study. For fixed biofilm samples, the
weight of biomass used per DNA extraction was based on the total biomass removed from each
plastic carrier. For suspended granule samples, biomass from a 50 mL sample was used. The
27
samples obtained generally had enough biomass such that 0.1 – 0.2 mg was used per extraction,
which is within the mass range stated in the PowerBiofilm DNA Isolation Kit protocol.
The protocol was carefully followed, and the only modification made to the protocol was
during the inhibitor removal step. Since the samples were a dark color, the kit protocol
recommended using 200 uL of the inhibitor removal solution instead of 100 uL of solution. The
darker colored samples indicated that they contained a higher concentration of inhibitors, and;
therefore, increasing the volume of the inhibitor removal solution used would optimize DNA
yields. The DNA extraction results were quantified using a spectrophotometer (ThermoFisher
Scientifitic, Waltham, MA; model NanoDrop 2000/2000c).
3.1.5 Quantitative PCR (qPCR) standards and qPCR assays
Standards for AMX, AOB, NOB, and eubacteria were provided courtesy of Dr. Kartik
Chandran’s laboratory (Columbia University), at a concentration of 109 copies/μL. Standards were
prepared in 3mL of DNA-free water. Serial dilutions were performed to obtain a range of
concentrations from 10 copies/μL to 106 copies/μL for each standard. The standards were stored
at -20°C and thawed on ice when used for qPCR analysis.
Published primers were used for the Anammox, Ammonia Monooxygenase, and
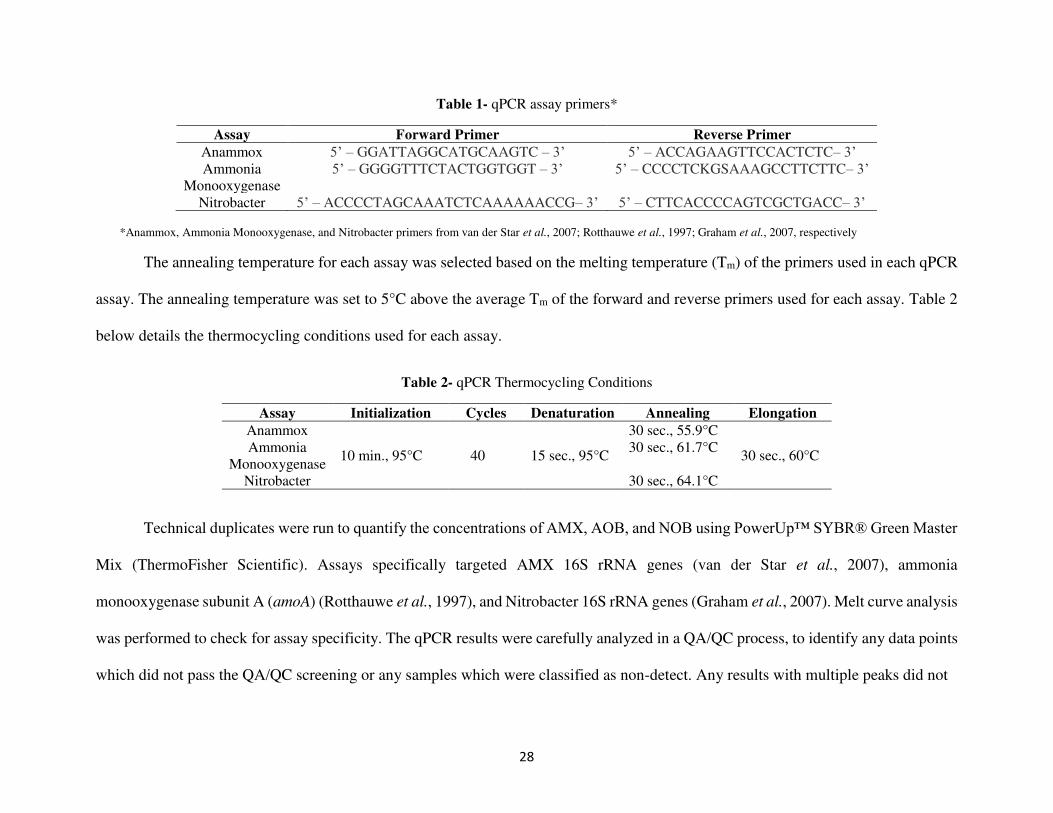
Nitrobacter assays (van der Star et al., 2007; Rotthauwe et al., 1997; Graham et al., 2007). Table
1 below lists the primers used for each qPCR assay, read from the 5’ to the 3’ end.
28
Table 1- qPCR assay primers*
Assay Forward Primer Reverse Primer
Anammox 5’ – GGATTAGGCATGCAAGTC – 3’ 5’ – ACCAGAAGTTCCACTCTC– 3’ Ammonia
Monooxygenase
5’ – GGGGTTTCTACTGGTGGT – 3’ 5’ – CCCCTCKGSAAAGCCTTCTTC– 3’
Nitrobacter 5’ – ACCCCTAGCAAATCTCAAAAAACCG– 3’ 5’ – CTTCACCCCAGTCGCTGACC– 3’ *Anammox, Ammonia Monooxygenase, and Nitrobacter primers from van der Star et al., 2007; Rotthauwe et al., 1997; Graham et al., 2007, respectively
The annealing temperature for each assay was selected based on the melting temperature (Tm) of the primers used in each qPCR
assay. The annealing temperature was set to 5°C above the average Tm of the forward and reverse primers used for each assay. Table 2
below details the thermocycling conditions used for each assay.
Table 2- qPCR Thermocycling Conditions
Assay Initialization Cycles Denaturation Annealing Elongation
Anammox
10 min., 95°C 40 15 sec., 95°C
30 sec., 55.9°C
30 sec., 60°C Ammonia
Monooxygenase
30 sec., 61.7°C
Nitrobacter 30 sec., 64.1°C
Technical duplicates were run to quantify the concentrations of AMX, AOB, and NOB using PowerUp™ SYBR® Green Master
Mix (ThermoFisher Scientific). Assays specifically targeted AMX 16S rRNA genes (van der Star et al., 2007), ammonia
monooxygenase subunit A (amoA) (Rotthauwe et al., 1997), and Nitrobacter 16S rRNA genes (Graham et al., 2007). Melt curve analysis
was performed to check for assay specificity. The qPCR results were carefully analyzed in a QA/QC process, to identify any data points
which did not pass the QA/QC screening or any samples which were classified as non-detect. Any results with multiple peaks did not

29
pass QA/QC, and results where values were too low because of no amplification or noisy signals
or a high CT were classified as non-detectable. Results that did not pass QA/QC and non-detectable
results were re-run in triplicate qPCR for result validation. The limits of detection for the AMX,
AOB, and NOB assays were 104, 102, and 103, respectively.
3.1.6 Equations (fixed biofilm and suspended granules)
To calculate the gene quantification for fixed biofilm media, on a gene copy per reactor
volume (copies/mL) basis, the following equation was used:
Eq – 3: � = � ∗ � ∗ � ∗ ∗ ∗
Where,
Q = gene quantification
F = fraction of seeded media used = 1/3
C = average DNA concentration per media sample (ng/μL)
Ve = elution volume = 100μL
N = number of packing per reactor volume = 200/5.1L
M = quantity of target gene (copies/ng)
U = unit conversion = 1L/1000mL
Eq – 3 notes:
• 5 ng of DNA template was used
• Variables F, Ve, and N were defined constants based on the fixed biofilm MBBR
To calculate the gene quantification for suspended granule samples, on a gene copy per
reactor volume (copies/mL) basis, the following equation was used:
Eq – 4: � = � ∗ � ∗

30
Where
Q = gene quantification
C = average DNA concentration per sample (ng/μL)
Ve = elution volume = 6.67μL/mL
M = quantity of target gene (copies/ng)
Eq – 4 notes:
• Weight of the DNA used = 5 ng
• Variable Ve was a defined constant based on the suspended film reactor used in
this study
3.1.7 Results (fixed biofilm methodology advancements)
Table 3 below presents the results of three different DNA extraction kits which were tested
on the fixed biofilm samples. The DNeasy blood and tissue kit was tested according to published
protocols in literature (Park et al., 2015). The results indicate that the PowerBiofilm DNA Isolation
kit had the highest DNA concentrations and purest results (OD260/OD280 ~1.6-2.0) (Khare et al.,
2014). Therefore, it was determined from the results presented in Table 3 and specific features of
the PowerBiofilm DNA Isolation kit (i.e. enhanced chemical and mechanical cell lysis specific to
biofilms) that to help mitigate biases this kit was used in this study.

31
Table 3- DNA concentration and OD260/OD280 results from three different DNA isolation kits using fixed biofilm media
Tested DNA
extraction kit
Biomass
extraction
technique
Test
extraction
number
DNA
concentration
results
(ng/μL) OD260/OD280
Spectrophotometry
results
Quantitative
spectrophotometry
results
DNeasy
blood and
tissue DNA
Isolation kit
Scraping and vortex in PBS
1 33.5 1.71 Appendix, Figure 36 No peak at 260 nm
Liquid nitrogen and smashing
with mortar and pestle
2 781.4 1.39 Appendix, Figure 37 No peak at 260 nm
3 1,663.9 1.37 Appendix, Figure 38 No peak at 260 nm
4 1,086.1 1.32 Appendix, Figure 39 No peak at 260 nm
5 1,036.7 1.3 Appendix, Figure 40 No peak at 260 nm
PowerLyzer
PowerSoil
DNA
Isolation kit
Liquid nitrogen and smashing
with mortar and pestle
6 10.1 2.11 Appendix, Figure 41 Peak at 260 nm
7 28.6 2.04 Appendix, Figure 42 Peak at 260 nm
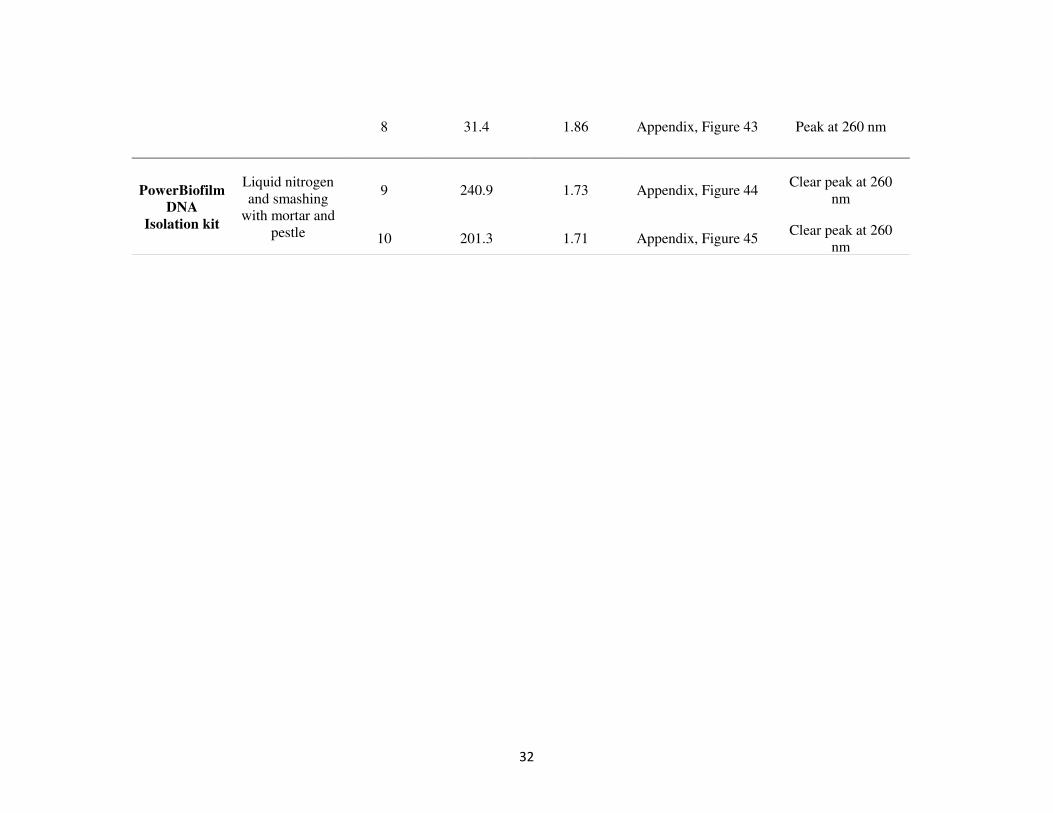
32
8 31.4 1.86 Appendix, Figure 43 Peak at 260 nm
PowerBiofilm
DNA
Isolation kit
Liquid nitrogen and smashing
with mortar and pestle
9 240.9 1.73 Appendix, Figure 44 Clear peak at 260
nm
10 201.3 1.71 Appendix, Figure 45 Clear peak at 260
nm

33
To also mitigate biases, modifications were made to existing published protocols to
increase cell lysis. Literature suggested carefully and thoroughly scraping fixed biofilm media
carriers with a sterile pipet tip (Park et al., 2015). However, after carefully following the published
protocol some red biofilm was still attached to the plastic carrier media, as shown in Figure 12
below. Additionally, the scraping technique was found to be time consuming, as compared to the
liquid nitrogen and smashing with mortar and pestle modification used in this study.
Figure 12- AnoxKaldnes™ plastic media carrier after biomass extraction using scraping and vortexing
Therefore, enhanced cell lysis, of the fixed biofilm media, was performed through mechanical lysis
techniques. The fixed biofilm media samples were submerged in liquid nitrogen and then struck
with a pestle to increase cell lysis, which was expected to minimize biases in the final gene
quantification results. Additionally, the mechanical lysis techniques used in this study increased
the efficiency of the biomass extraction process and allowed for more biomass to be separated
from the plastic media carrier, which allowed for more representative samples, in comparison to
the published methods.
Another modification to published protocols was performing increased inhibitor removal
during the DNA extraction process. All the fixed biofilm and suspended granule samples contained
a dark color, which suggested that the might samples contain a higher concentration of inhibitors.

34
Therefore, the volume of the inhibitor removal solution was doubled to 200 μL, optimize inhibitor
removal efficiencies, as per PowerBiofilm DNA Isolation Kit protocol.
3.1.8 Results (fixed biofilm)
The data presented in Figures 13-15 are organized such that the qPCR results for each
sampling day have the same color, but replicate samples from the same day are presented
separately so that variability between samples can be readily observed
Figures 13-15 below illustrate the AMX, AOB, and NOB gene copies per mass (copies/ng),
respectively. The sample obtained on reactor operation day 156 had the greatest amount of AMX,
5.46x10⁶ ± 9.36x10⁵ copies/ng, whereas the sample obtained on reactor operation day 163 had the
least amount of AMX, 2.36x10⁶ ± 1.67x10⁶ copies/ng, as shown in Figure 13 below. The sample
obtained on reactor operation day 181 had the greatest amount of AOB, 4.71x10⁵ ± 5.38x10⁴
copies/ng, whereas the sample obtained on reactor operation day 163 had the least amount of AOB,
7.81x10³ ± 1.15x10⁴ copies/ng, as shown in Figure 14 below. The sample obtained on reactor
operation day 191 had the greatest amount of NOB, 2.28x10⁴ ± 3.89 x10³ copies/ng, whereas the
sample obtained on reactor operation day 188 had the least amount of NOB, 7.25x10³ ± 1.05x10³
copies/ng, as shown in Figure 15 below.
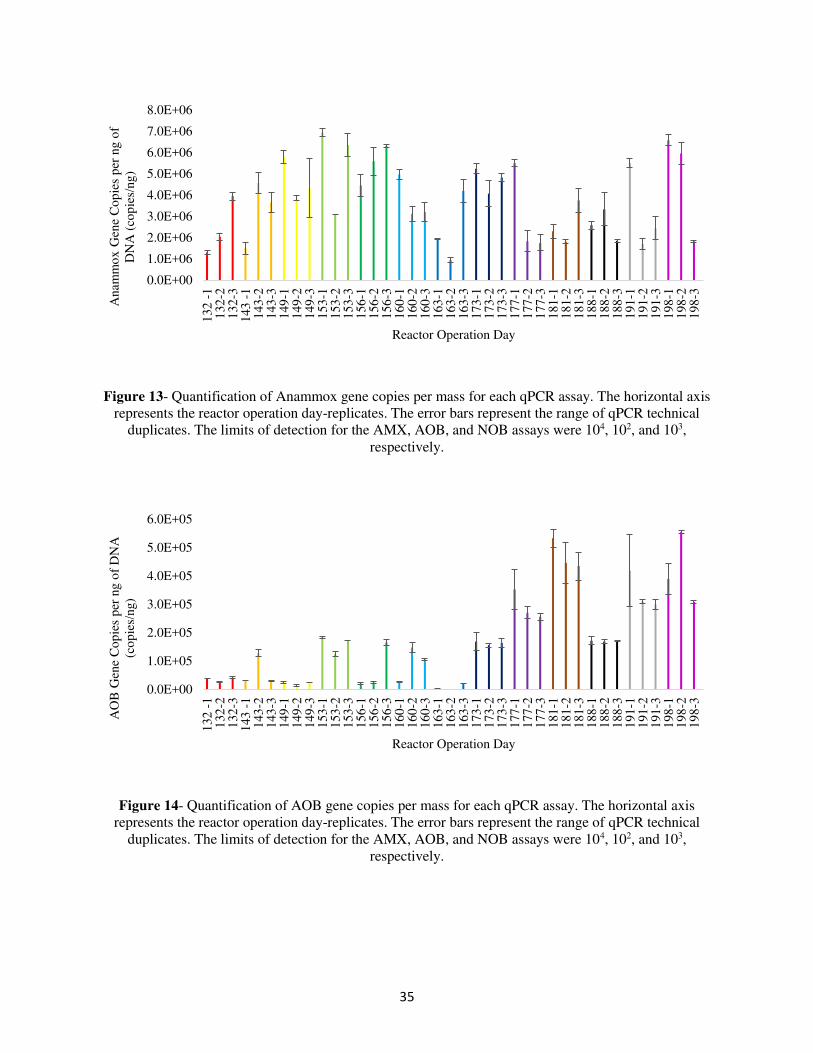
35
Figure 13- Quantification of Anammox gene copies per mass for each qPCR assay. The horizontal axis represents the reactor operation day-replicates. The error bars represent the range of qPCR technical
duplicates. The limits of detection for the AMX, AOB, and NOB assays were 104, 102, and 103, respectively.
Figure 14- Quantification of AOB gene copies per mass for each qPCR assay. The horizontal axis represents the reactor operation day-replicates. The error bars represent the range of qPCR technical
duplicates. The limits of detection for the AMX, AOB, and NOB assays were 104, 102, and 103, respectively.
0.0E+00
1.0E+06
2.0E+06
3.0E+06
4.0E+06
5.0E+06
6.0E+06
7.0E+06
8.0E+06
132
-1
132
-21
32
-31
43
-1
143
-21
43
-31
49
-11
49
-21
49
-31
53
-11
53
-21
53
-31
56
-11
56
-21
56
-31
60
-11
60
-21
60
-31
63
-11
63
-21
63
-31
73
-11
73
-21
73
-31
77
-11
77
-21
77
-31
81
-11
81
-21
81
-31
88
-11
88
-21
88
-31
91
-11
91
-21
91
-31
98
-11
98
-21
98
-3
Anam
mo
x G
ene
Co
pie
s p
er n
g o
f D
NA
(co
pie
s/ng)
Reactor Operation Day
0.0E+00
1.0E+05
2.0E+05
3.0E+05
4.0E+05
5.0E+05
6.0E+05
132
-1
132
-21
32
-31
43
-1
143
-21
43
-31
49
-11
49
-21
49
-31
53
-11
53
-21
53
-31
56
-11
56
-21
56
-31
60
-11
60
-21
60
-31
63
-11
63
-21
63
-31
73
-11
73
-21
73
-31
77
-11
77
-21
77
-31
81
-11
81
-21
81
-31
88
-11
88
-21
88
-31
91
-11
91
-21
91
-31
98
-11
98
-21
98
-3
AO
B G
ene
Co
pie
s p
er n
g o
f D
NA
(c
op
ies/
ng)
Reactor Operation Day
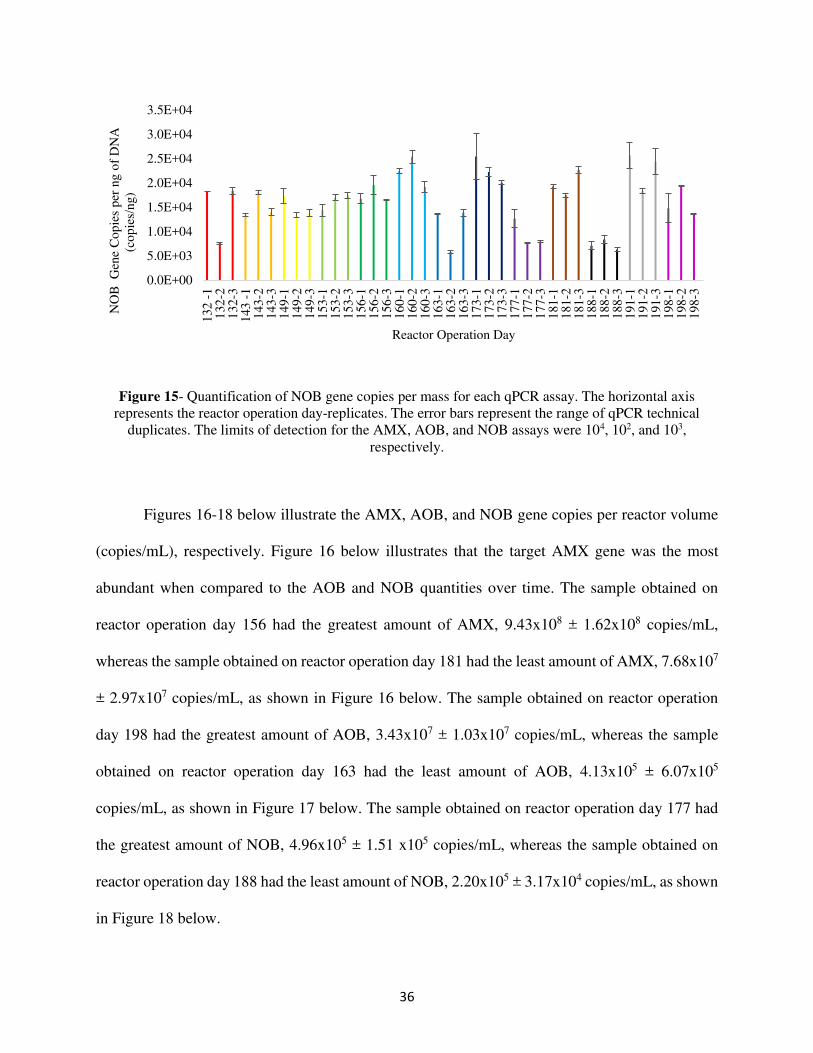
36
Figure 15- Quantification of NOB gene copies per mass for each qPCR assay. The horizontal axis represents the reactor operation day-replicates. The error bars represent the range of qPCR technical
duplicates. The limits of detection for the AMX, AOB, and NOB assays were 104, 102, and 103, respectively.
Figures 16-18 below illustrate the AMX, AOB, and NOB gene copies per reactor volume
(copies/mL), respectively. Figure 16 below illustrates that the target AMX gene was the most
abundant when compared to the AOB and NOB quantities over time. The sample obtained on
reactor operation day 156 had the greatest amount of AMX, 9.43x10⁸ ± 1.62x10⁸ copies/mL,
whereas the sample obtained on reactor operation day 181 had the least amount of AMX, 7.68x10⁷
± 2.97x10⁷ copies/mL, as shown in Figure 16 below. The sample obtained on reactor operation
day 198 had the greatest amount of AOB, 3.43x10⁷ ± 1.03x10⁷ copies/mL, whereas the sample
obtained on reactor operation day 163 had the least amount of AOB, 4.13x10⁵ ± 6.07x10⁵
copies/mL, as shown in Figure 17 below. The sample obtained on reactor operation day 177 had
the greatest amount of NOB, 4.96x10⁵ ± 1.51 x10⁵ copies/mL, whereas the sample obtained on
reactor operation day 188 had the least amount of NOB, 2.20x10⁵ ± 3.17x10⁴ copies/mL, as shown
in Figure 18 below.
0.0E+00
5.0E+03
1.0E+04
1.5E+04
2.0E+04
2.5E+04
3.0E+04
3.5E+04
132
-1
132
-21
32
-31
43
-1
143
-21
43
-31
49
-11
49
-21
49
-31
53
-11
53
-21
53
-31
56
-11
56
-21
56
-31
60
-11
60
-21
60
-31
63
-11
63
-21
63
-31
73
-11
73
-21
73
-31
77
-11
77
-21
77
-31
81
-11
81
-21
81
-31
88
-11
88
-21
88
-31
91
-11
91
-21
91
-31
98
-11
98
-21
98
-3
NO
B G
ene
Co
pie
s p
er n
g o
f D
NA
(c
op
ies/
ng)
Reactor Operation Day
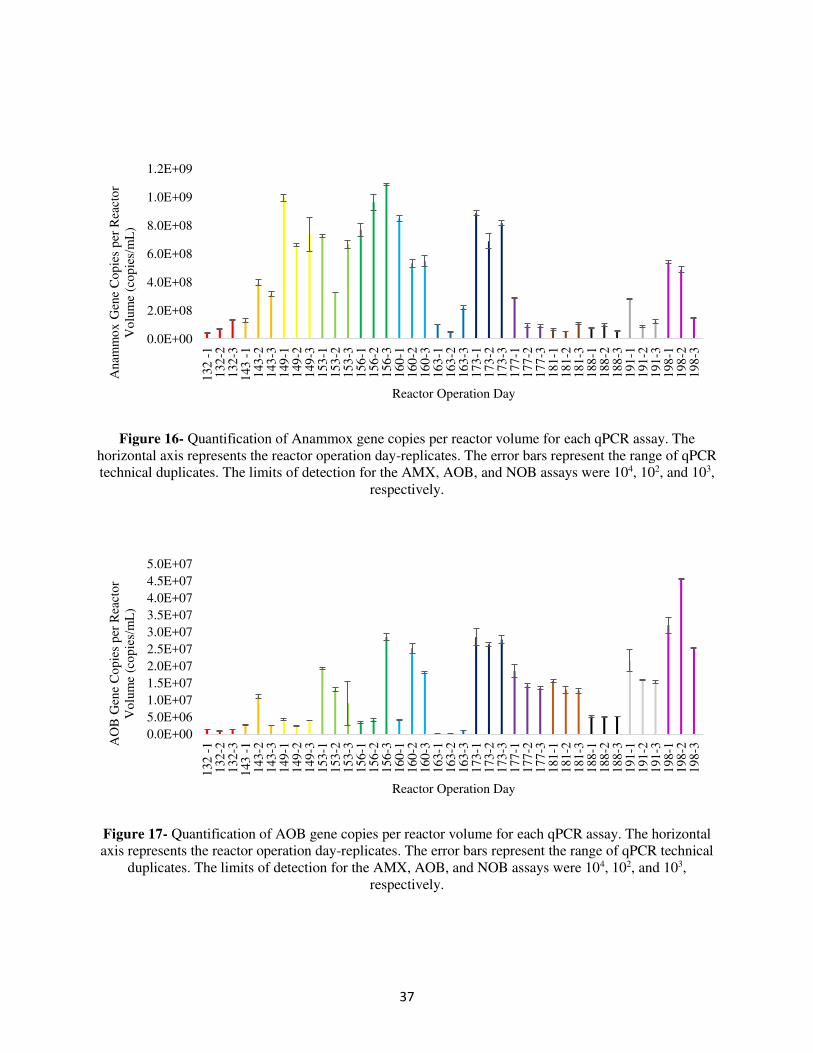
37
Figure 16- Quantification of Anammox gene copies per reactor volume for each qPCR assay. The horizontal axis represents the reactor operation day-replicates. The error bars represent the range of qPCR technical duplicates. The limits of detection for the AMX, AOB, and NOB assays were 104, 102, and 103,
respectively.
Figure 17- Quantification of AOB gene copies per reactor volume for each qPCR assay. The horizontal axis represents the reactor operation day-replicates. The error bars represent the range of qPCR technical
duplicates. The limits of detection for the AMX, AOB, and NOB assays were 104, 102, and 103, respectively.
0.0E+00
2.0E+08
4.0E+08
6.0E+08
8.0E+08
1.0E+09
1.2E+09
132
-1
132
-21
32
-31
43
-1
143
-21
43
-31
49
-11
49
-21
49
-31
53
-11
53
-21
53
-31
56
-11
56
-21
56
-31
60
-11
60
-21
60
-31
63
-11
63
-21
63
-31
73
-11
73
-21
73
-31
77
-11
77
-21
77
-31
81
-11
81
-21
81
-31
88
-11
88
-21
88
-31
91
-11
91
-21
91
-31
98
-11
98
-21
98
-3
Anam
mo
x G
ene
Co
pie
s p
er R
eact
or
Vo
lum
e (c
op
ies/
mL
)
Reactor Operation Day
0.0E+00
5.0E+06
1.0E+07
1.5E+07
2.0E+07
2.5E+07
3.0E+07
3.5E+07
4.0E+07
4.5E+07
5.0E+07
132
-1
132
-21
32
-31
43
-1
143
-21
43
-31
49
-11
49
-21
49
-31
53
-11
53
-21
53
-31
56
-11
56
-21
56
-31
60
-11
60
-21
60
-31
63
-11
63
-21
63
-31
73
-11
73
-21
73
-31
77
-11
77
-21
77
-31
81
-11
81
-21
81
-31
88
-11
88
-21
88
-31
91
-11
91
-21
91
-31
98
-11
98
-21
98
-3
AO
B G
ene
Co
pie
s p
er R
eact
or
Vo
lum
e (c
op
ies/
mL
)
Reactor Operation Day
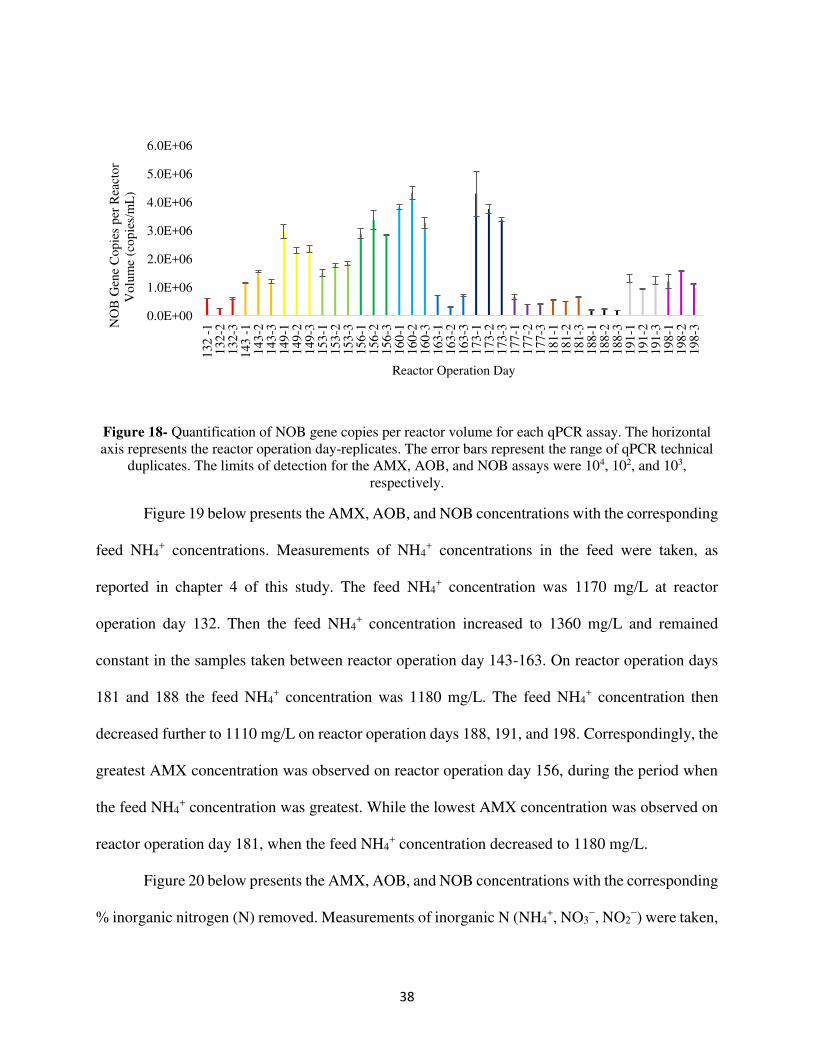
38
Figure 18- Quantification of NOB gene copies per reactor volume for each qPCR assay. The horizontal axis represents the reactor operation day-replicates. The error bars represent the range of qPCR technical
duplicates. The limits of detection for the AMX, AOB, and NOB assays were 104, 102, and 103, respectively.
Figure 19 below presents the AMX, AOB, and NOB concentrations with the corresponding
feed NH4+ concentrations. Measurements of NH4
+ concentrations in the feed were taken, as
reported in chapter 4 of this study. The feed NH4+ concentration was 1170 mg/L at reactor
operation day 132. Then the feed NH4+ concentration increased to 1360 mg/L and remained
constant in the samples taken between reactor operation day 143-163. On reactor operation days
181 and 188 the feed NH4+ concentration was 1180 mg/L. The feed NH4
+ concentration then
decreased further to 1110 mg/L on reactor operation days 188, 191, and 198. Correspondingly, the
greatest AMX concentration was observed on reactor operation day 156, during the period when
the feed NH4+ concentration was greatest. While the lowest AMX concentration was observed on
reactor operation day 181, when the feed NH4+ concentration decreased to 1180 mg/L.
Figure 20 below presents the AMX, AOB, and NOB concentrations with the corresponding
% inorganic nitrogen (N) removed. Measurements of inorganic N (NH4+, NO3
−, NO2−) were taken,
0.0E+00
1.0E+06
2.0E+06
3.0E+06
4.0E+06
5.0E+06
6.0E+06
132
-1
132
-21
32
-31
43
-1
143
-21
43
-31
49
-11
49
-21
49
-31
53
-11
53
-21
53
-31
56
-11
56
-21
56
-31
60
-11
60
-21
60
-31
63
-11
63
-21
63
-31
73
-11
73
-21
73
-31
77
-11
77
-21
77
-31
81
-11
81
-21
81
-31
88
-11
88
-21
88
-31
91
-11
91
-21
91
-31
98
-11
98
-21
98
-3
NO
B G
ene
Co
pie
s p
er R
eact
or
Vo
lum
e (c
op
ies/
mL
)
Reactor Operation Day
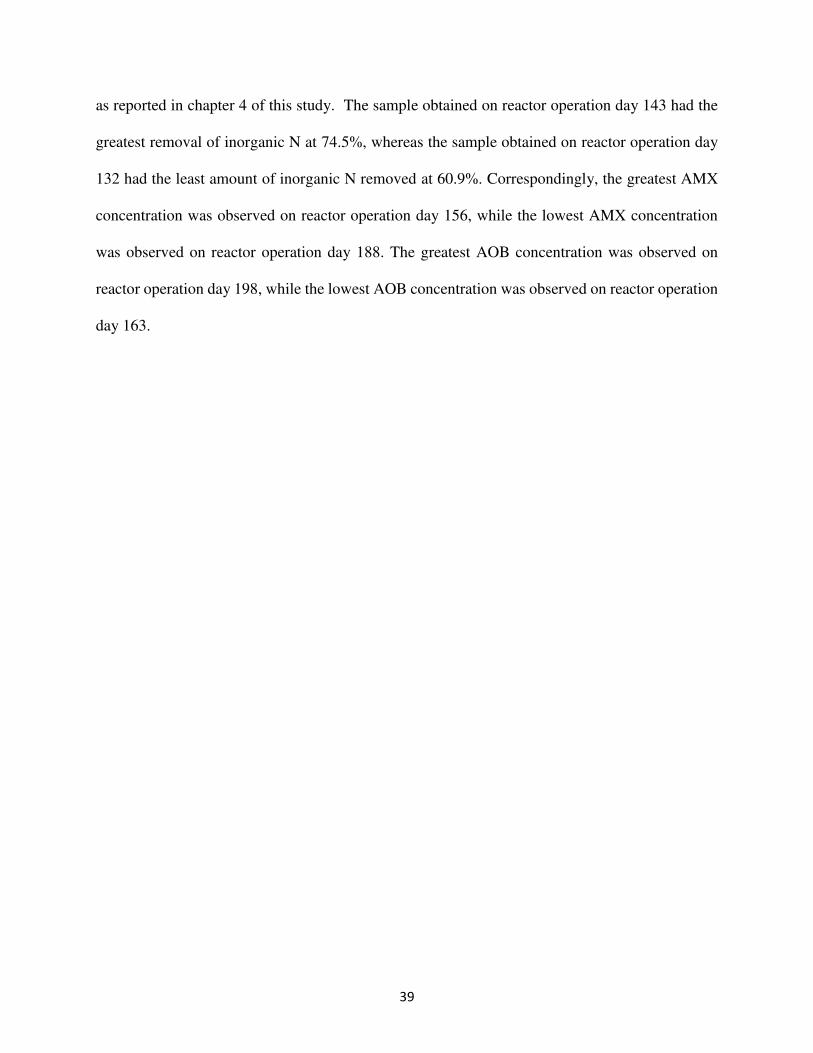
39
as reported in chapter 4 of this study. The sample obtained on reactor operation day 143 had the
greatest removal of inorganic N at 74.5%, whereas the sample obtained on reactor operation day
132 had the least amount of inorganic N removed at 60.9%. Correspondingly, the greatest AMX
concentration was observed on reactor operation day 156, while the lowest AMX concentration
was observed on reactor operation day 188. The greatest AOB concentration was observed on
reactor operation day 198, while the lowest AOB concentration was observed on reactor operation
day 163.

40
Figure 19- AMX, AOB, and NOB concentrations vs Feed NH4+ concentrations
0
200
400
600
800
1000
1200
1400
1600
1.E+00
1.E+01
1.E+02
1.E+03
1.E+04
1.E+05
1.E+06
1.E+07
1.E+08
1.E+09
132 143 149 153 156 160 163 173 181 188 191 198
Fee
d N
H4
+(m
g/L
)
AM
X,
AO
B,
and
NO
B c
once
ntr
atio
ns
(co
pie
s/m
L)
Reactor operation sample days
AMX (copies/mL)
AOB (copies/mL)
NOB (copies/mL)
Feed NH4+ (mg/L)

41
Figure 20- AMX, AOB, and NOB concentrations vs % nitrogen removal concentrations
0
10
20
30
40
50
60
70
80
1.E+00
1.E+01
1.E+02
1.E+03
1.E+04
1.E+05
1.E+06
1.E+07
1.E+08
1.E+09
132 143 149 153 156 160 163 173 181 188 191 198
% I
no
rgan
ic N
R
emo
ved
AM
X,
AO
B,
and
NO
B c
once
ntr
atio
ns
(co
pie
s/m
L)
Reactor operation sample days
AMX (copies/mL)
AOB (copies/mL)
NOB (copies/mL)
% Inorganic NRemoved

42
Table 4 below presents a comparison of the average relative abundance (copies/mL) of
AMX, AOB, and NOB and the reactor performance, as measured by the % of inorganic N
removed) between findings from this study and a published study. A greater average relative
abundance of AMX was observed in this study compared to that in literature, 4.1E+08 copies/mL
and 7.7E+07 copies/mL, respectively. However, the average AOB and NOB relative abundances
were lower compared to literature values. The average reactor performance between this study and
literature was 68 ± 5% and 64 ± 17%, respectively.
Table 4- Comparison of relative abundance (copies/mL) and reactor performance (% inorganic N removed) between study and literature
Study Literature1
AMX 4.1E+08 7.7E+07 Average relative abundance
(copies/mL) AOB 1.3E+07 2.3E+08 NOB 1.7E+06 8.2E+06
Average reactor performance (% inorganic N removed) 68 ± 4 64 ± 17
Table 4 notes: 1. Approximated, average relative abundance (copies/mL) for AMX, AOB, and NOB and reactor performance (% inorganic N removed) results from (Park et al., 2010)
3.1.9 Statistical results (fixed biofilm)
An Anderson-Darling (AD) normality test was performed to determine if the AMX, AOB,
and NOB data sets were normally distributed. The AD normality test results indicated that the
AMX, AOB, and NOB data sets were normally distributed; p = 0.103, p = 0.295, and p = 0.123,
respectively.
Table 5 below provides the values of Pearson’s correlation coefficients, r, for tests run to
determine if a correlation exists between selected microbial ecology data and selected reactor
performance data. Correlation analyses conducted between AMX concentrations (copies/mL) and
effluent NH4+-N concentrations and AOB concentrations (copies/mL) and effluent NO2
--N
43
indicated a negative r value, -0.318 (p = 0.313) and -0.265 (p = 0.405), respectively. However, the
Pearson’s correlation coefficients for tests run between AMX concentrations (copies/mL) %
inorganic n removed and effluent NO2--N concentrations were positive, 0.141 (p = 0.662) and
0.259 (p = 0.417), respectively. The r value from correlation analyses between NOB concentrations
and effluent NO3--N was also positive, 0.131 (p = 0.684). All the comparative results between the
microbial ecology on a per mass and per volume basis yielded a p-value greater than 0.05, which
indicates that was no statistical significance between each of sets of two variables being analyzed.
The same tests were run, but on a copies/ng basis. Correlation analyses conducted between
AMX concentrations (copies/ng) and effluent NH4+-N concentrations and AOB concentrations
(copies/mL) and effluent NO2--N indicated a negative r value, -0.326 (p = 0.303) and -0.261 (p =
0.412), respectively. However, the Pearson’s correlation coefficients for tests run between AMX
concentrations (copies/mL) % inorganic N removed and effluent NO2--N concentrations were
positive, 0.138 (p = 0.669) and 0.263 (p = 0.409), respectively. The r value from correlation
analyses between NOB concentrations and effluent NO3--N was also positive, 0.203 (p = 0.526).
Since the r value is a measurement of the strength of a linear association between variables,
the results indicate that there were no strong correlations between selected microbial ecology on a
per mass and per volume basis and selected reactor performance data. All the comparative results
between the microbial ecology on a per mass and per volume basis and selected reactor
performance data yielded a p-value greater than 0.05, which indicated that was no statistical
significance between each of sets of the variables being analyzed.

44
Table 5- Pearson's correlation coefficient results between the microbial ecology and selected reactor performance
Variable 1 Variable 2
Pearson's
correlation
coefficient, r
p-value
AMX concentration (copies/mL) % Inorganic N removed 0.141 0.662
AMX concentration (copies/mL) Effluent NH4+-N -0.318 0.313
AMX concentration (copies/mL) Effluent NO2--N 0.259 0.417
AMX concentration (copies/mL) AOB concentration (copies/mL) 0.310 0.326
AOB concentration (copies/mL) Effluent NO2--N -0.265 0.405
NOB concentration (copies/mL) Effluent NO3--N 0.131 0.684
AMX concentration (copies/ng) % Inorganic N removed 0.138 0.669
AMX concentration (copies/ng) Effluent NH4+-N -0.326 0.301
AMX concentration (copies/ng) Effluent NO2--N 0.263 0.409
AMX concentration (copies/ng) AOB concentration (copies/ng) -0.025 0.939
AOB concentration (copies/ng) Effluent NO2--N -0.261 0.412
NOB concentration (copies/ng) Effluent NO3--N 0.203 0.526
3.1.10 Discussion (fixed biofilm)
At first, results from Table 3 indicate that the DNeasy blood and tissue DNA Isolation kit
outperformed the PowerBiofilm and PowerLyzer PowerSoil kits, by resulting in the greatest DNA
concentration yields; however, the results do not satisfy the purity requirements, OD260/OD280
~1.6-2.0. Furthermore, review of the spectrophotometry results (Figs. 36-40) reveal curves that do
not have a distinct peak at 260 nm, the wavelength DNA and other nucleic acids absorb at
(ThermoScientific, 2009). Reasons for the increased DNA concentrations could be explained by
potential contamination of the samples and/or anomalies, and the low purity results could have
been due to impurities, such as inhibitors, in the samples.
One reason increased DNA concentration results were observed from experiments using
the PowerBiofilm kit, as compared to the PowerLyzer PowerSoil kit, was because the
PowerBiofilm kit has a dry chemical reagent in the in the microbeads in the bead beating tube, to
help break down the extracellular polymer substances present in biofilms. Therefore, chemical and

45
mechanical cell lysis techniques, specific to biofilms, allowed for a more representative sample to
be obtained, biases to be minimized, and improved increased DNA concentrations. Since
replicated experiments using the PowerBiofilm kit resulted in the highest DNA concentrations and
purest results this kit and the kit was specifically designed for DNA extraction from biofilms this
kit was selected for this study.
A comparison between the average relative abundances for AMX, AOB, and NOB
presented in Table 4 indicate that the AMX average relative abundance from this study was an
order of magnitude greater than published literature. However, the average relative abundances for
AOB and NOB from this study were slightly lower than published literature. Since the test DNA
extraction results presented in Table 3 resulted in greater and more pure DNA yields with the DNA
PowerBiofilm isolation kit used in this study compared to the DNeasy kit used in the published
study, it is probable that the improvements made to existing DNA extraction protocols resulted in
increased relative abundance of AMX. While the relative abundances of AOB and NOB in this
study were lower than the published study this could be explained by the MBBR in this study not
having as many AOB and NOB either present in the reactor or in the samples used for DNA
extractions.
The relative abundances of AMX, AOB, and NOB presented on a copies/ng and copies/mL
basis indicate different reactor operation days having the greatest and the lowest concentrations.
For example, on a per mass basis, reactor operation day 163 had the lowest concentration of AMX
whereas on a per volume basis, reactor operation day 181 had the lowest concentration of AMX.
The purpose of performing calculations on both a mass and volume basis was to demonstrate the
variance in each set of results.
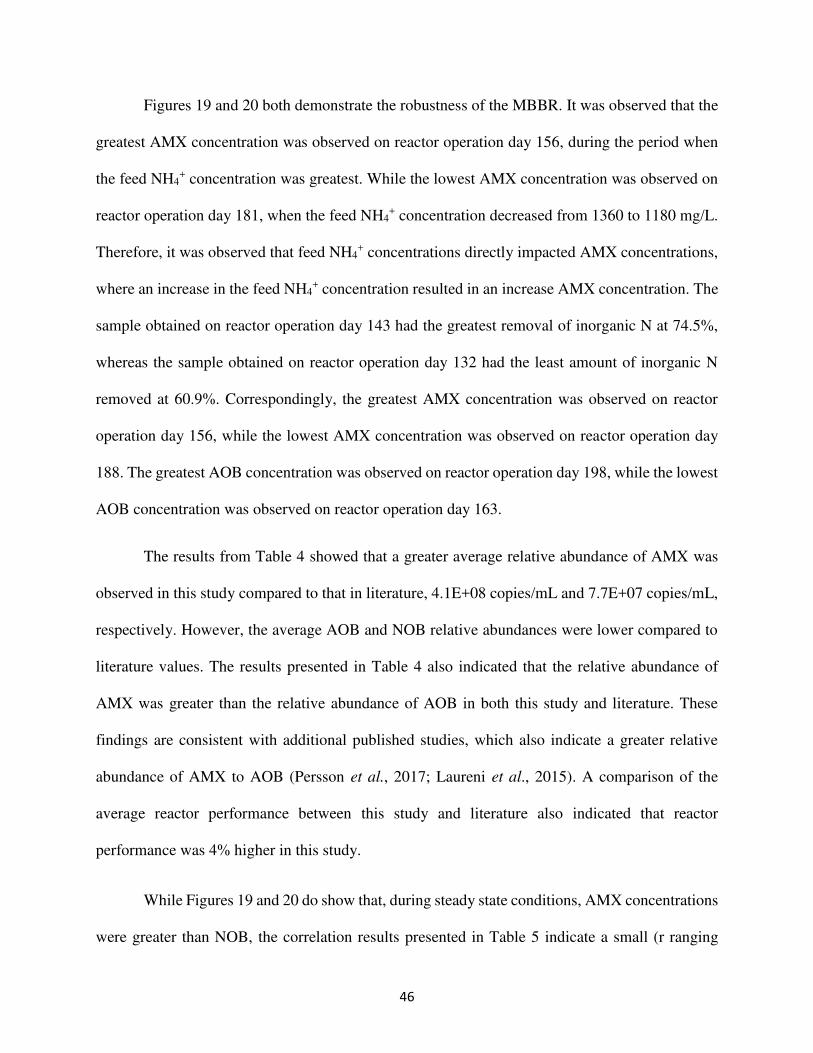
46
Figures 19 and 20 both demonstrate the robustness of the MBBR. It was observed that the
greatest AMX concentration was observed on reactor operation day 156, during the period when
the feed NH4+ concentration was greatest. While the lowest AMX concentration was observed on
reactor operation day 181, when the feed NH4+ concentration decreased from 1360 to 1180 mg/L.
Therefore, it was observed that feed NH4+ concentrations directly impacted AMX concentrations,
where an increase in the feed NH4+ concentration resulted in an increase AMX concentration. The
sample obtained on reactor operation day 143 had the greatest removal of inorganic N at 74.5%,
whereas the sample obtained on reactor operation day 132 had the least amount of inorganic N
removed at 60.9%. Correspondingly, the greatest AMX concentration was observed on reactor
operation day 156, while the lowest AMX concentration was observed on reactor operation day
188. The greatest AOB concentration was observed on reactor operation day 198, while the lowest
AOB concentration was observed on reactor operation day 163.
The results from Table 4 showed that a greater average relative abundance of AMX was
observed in this study compared to that in literature, 4.1E+08 copies/mL and 7.7E+07 copies/mL,
respectively. However, the average AOB and NOB relative abundances were lower compared to
literature values. The results presented in Table 4 also indicated that the relative abundance of
AMX was greater than the relative abundance of AOB in both this study and literature. These
findings are consistent with additional published studies, which also indicate a greater relative
abundance of AMX to AOB (Persson et al., 2017; Laureni et al., 2015). A comparison of the
average reactor performance between this study and literature also indicated that reactor
performance was 4% higher in this study.
While Figures 19 and 20 do show that, during steady state conditions, AMX concentrations
were greater than NOB, the correlation results presented in Table 5 indicate a small (r ranging
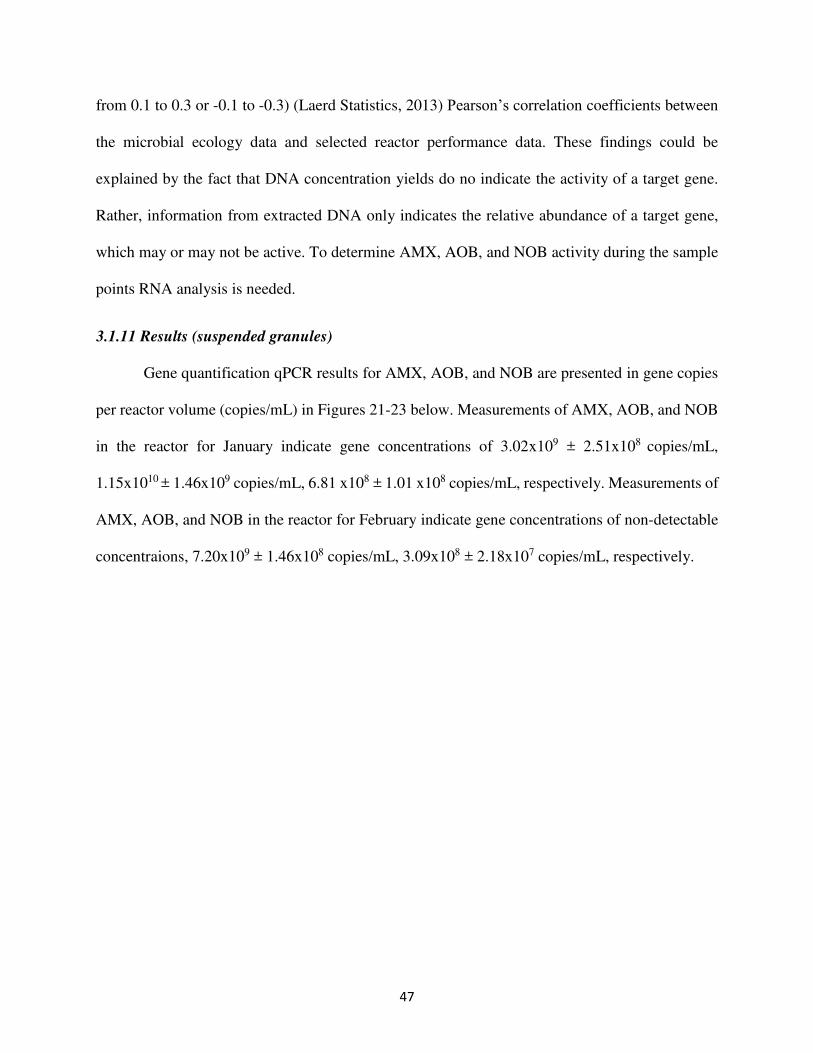
47
from 0.1 to 0.3 or -0.1 to -0.3) (Laerd Statistics, 2013) Pearson’s correlation coefficients between
the microbial ecology data and selected reactor performance data. These findings could be
explained by the fact that DNA concentration yields do no indicate the activity of a target gene.
Rather, information from extracted DNA only indicates the relative abundance of a target gene,
which may or may not be active. To determine AMX, AOB, and NOB activity during the sample
points RNA analysis is needed.
3.1.11 Results (suspended granules)
Gene quantification qPCR results for AMX, AOB, and NOB are presented in gene copies
per reactor volume (copies/mL) in Figures 21-23 below. Measurements of AMX, AOB, and NOB
in the reactor for January indicate gene concentrations of 3.02x10⁹ ± 2.51x10⁸ copies/mL,
1.15x10¹⁰ ± 1.46x10⁹ copies/mL, 6.81 x10⁸ ± 1.01 x10⁸ copies/mL, respectively. Measurements of
AMX, AOB, and NOB in the reactor for February indicate gene concentrations of non-detectable
concentraions, 7.20x10⁹ ± 1.46x10⁸ copies/mL, 3.09x10⁸ ± 2.18x10⁷ copies/mL, respectively.
48
Figure 21- Quantified Anammox gene copies per reactor volume (copies/mL) observed in the reactor, overflow, and underflow process streams. Samples 1, 2, and 3 in the reactor for the February sample set were below the limit of detection. The limits of detection for the AMX, AOB, and
NOB assays were 104, 102, and 103, respectively.
49
Figure 22- Quantified AOB gene copies per reactor volume (copies/mL) observed in the reactor, overflow, and underflow process streams. The limits of detection for the AMX, AOB, and NOB assays were 104, 102, and 103, respectively.

50
Figure 23- Quantified Nitrobacter gene copies per reactor volume (copies/mL) observed in the reactor, overflow, and underflow process streams. The limits of detection for the AMX, AOB, and NOB assays were 104, 102, and 103, respectively.

51
3.1.12 Discussion (suspended granules)
One reason for why there appeared to be no Anammox present in the reactor in February
could be explained by the on-site operational issues. The QA/QC screening, as shown in Table 6
below lists all the February reactor qPCR results which either did not pass QA/QC or were
classified as non-detect. Since most of the results were non-detect, which indicates that the
quantities were either low or non-existent in the reactor at the time, and the remaining results did
not pass QA/QC, no AMX was reported to be present in the February reactor data.
Table 6- QA/QC results for the AMX assay for February reactor data
DNA extraction 1
qPCR reaction 1 ND qPCR reaction 2 ND qPCR reaction 3 NO QA/QC
DNA extraction 2
qPCR reaction 1 NO QA/QC qPCR reaction 2 ND qPCR reaction 3 ND
Table Notes:
ND: indicates non-detect values NO QA/QC: indicates the data did not pass QA/QC
The February reactor microbial ecology results presented in Figures 21-23 also might help
explain the reactor performance issues observed on-site. Operators at the full-scale WWTP
communicated that operational issues with the pumps had occurred which they suspected could be
affecting the amount of AMX in the reactor. The operators also reported an upset between 30
January – 2 February. Since AMX have a relatively slow growth rate (μ = 0.0027 h-1) (Strous et
al., 1998; van der Star et al., 2007) as compared to AOB and NOB, it is likely that the effects of
the process upsets, due to the operational issues experienced with the pumps, were not observed
until late February, when the samples were taken. Therefore, it is possible that the results from the
full-scale WWTP correlated to the observed reactor performance.
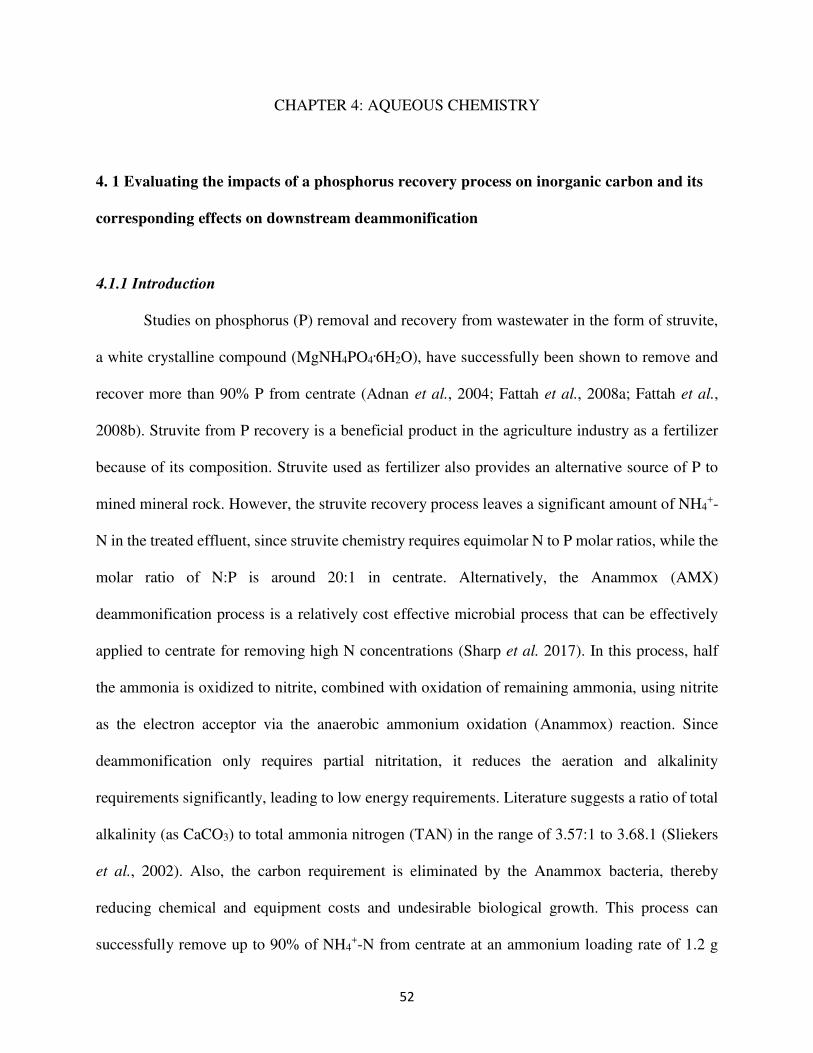
52
CHAPTER 4: AQUEOUS CHEMISTRY
4. 1 Evaluating the impacts of a phosphorus recovery process on inorganic carbon and its
corresponding effects on downstream deammonification
4.1.1 Introduction
Studies on phosphorus (P) removal and recovery from wastewater in the form of struvite,
a white crystalline compound (MgNH4PO4.6H2O), have successfully been shown to remove and
recover more than 90% P from centrate (Adnan et al., 2004; Fattah et al., 2008a; Fattah et al.,
2008b). Struvite from P recovery is a beneficial product in the agriculture industry as a fertilizer
because of its composition. Struvite used as fertilizer also provides an alternative source of P to
mined mineral rock. However, the struvite recovery process leaves a significant amount of NH4+-
N in the treated effluent, since struvite chemistry requires equimolar N to P molar ratios, while the
molar ratio of N:P is around 20:1 in centrate. Alternatively, the Anammox (AMX)
deammonification process is a relatively cost effective microbial process that can be effectively
applied to centrate for removing high N concentrations (Sharp et al. 2017). In this process, half
the ammonia is oxidized to nitrite, combined with oxidation of remaining ammonia, using nitrite
as the electron acceptor via the anaerobic ammonium oxidation (Anammox) reaction. Since
deammonification only requires partial nitritation, it reduces the aeration and alkalinity
requirements significantly, leading to low energy requirements. Literature suggests a ratio of total
alkalinity (as CaCO3) to total ammonia nitrogen (TAN) in the range of 3.57:1 to 3.68.1 (Sliekers
et al., 2002). Also, the carbon requirement is eliminated by the Anammox bacteria, thereby
reducing chemical and equipment costs and undesirable biological growth. This process can
successfully remove up to 90% of NH4+-N from centrate at an ammonium loading rate of 1.2 g

53
NH4+-N m-3d-1 but leaves a significant amount of soluble P in the final effluent (Fux et al., 2002;
Fux et al., 2006). The coupling of these two technologies is attractive for nutrient removal in
WWTPs that rely on anaerobic digestion and enhanced biological phosphorus removal (EBPR).
Alkalinity in the form of inorganic carbon (IC) is an important factor when considering the
efficiency of an Anammox deammonification process. In the Anammox deammonification
process, IC is consumed and AMX, AOBs, and NOBs compete for IC as a main carbon source.
Stimulated growth of nitrifying bacteria has been observed by the addition of IC in the form of
bicarbonate (Byong-Hee et al., 2000). A study later expanded on this by observing the Anammox
process and its limitations with suboptimal concentrations of sodium bicarbonate (Liao et al.,
2008). It was found from this study that optimizing bicarbonate concentration in a sequencing
batch reactor (SBR) could increase the rate of AMX up to 66.4 mg N/(L∙d) (Liao et al., 2008).
Additionally, it was found in a study by Kimura et al. (2011) that AMX had difficulty in
using IC when the influent IC concentrations were very low. In fact, AMX was found to be much
more affected by IC limitations than both AOB and NOB, resulting in a reduction of biomass
concentrations and nitrogen consumption rates (Yiwei et al., 2014). Yiwei et al., 2014 also found
that IC limitations led to the establishment of NOB in the biofilm after recovery, resulting in long-
term stability problems. This highlights the importance of maintaining IC concentrations during
operation.
Given the pH range of the centrate used in this study, the species contributing to total
alkalinity as measured using standard titration techniques were hypothesized to be:
Eq – 5: Alk (eq/L) = HCO3- + 2CO3
-2 + HPO4-2 + HS- + 0.68VFAs + OH-
Notes to Eq – 5:
0 0
54
• Volatile fatty acid (VFA) concentration is multiplied by 0.68 since the pKa values for
relevant VFAs (4.78-4.88) is sufficiently close to the titration endpoint (pH=4.5) such
that base species remain at significant concentrations.
• Due to the reactor operating pH, the CO3-2 and OH- species concentrations are
considered negligible and therefore are considered as zero.
• Even though H3PO4 is a tri-protic acid with three potential base species, within the pH
range of the centrate, only HPO4-2 would contribute to alkalinity.
• Of two base species associated with H2S only HS- was considered important for
alkalinity since concentrations of S-2 are negligible.
As part of this study, the species in Eq – 5 were quantitatively determined and compared
to the alkalinity measured with acid titration. To assess this objective an alkalinity “balance” was
conducted on centrate and digested sludge.
It is hypothesized that the concentration of bicarbonate limits deammonification efficiency
with respect to ammonia removal. To test this hypothesis, Anammox deammonification was
conducted at an equivalent N loading rate but different inorganic carbon concentrations. Since the
P removal process reduced the inorganic carbon concentration, tests were conducted with and
without struvite precipitation to determine if there are any impacts to the downstream
deammonification process.
4.1.2 Materials and methods
To study the impacts of P recovery on the downstream deammonification process, the
following tasks were performed:
55
4.1.2.1 Sample collection and storage
Digested sludge samples and centrate, collected in a 50-gallon storage tank, were collected
from Denver’s Metro Wastewater Reclamation District (MWRD), and transported to the Colorado
State University (CSU) laboratories in sealed containers, as shown in Figure 24 below. The
containers were stored in temperature-controlled rooms at 4°C.
Figure 24- 50-gallon storage tank containing centrate collected from MWRD
4.1.2.2 Lab simulation of P recovery
A lab-scale P recovery process was designed to simulate the altered centrate needed. The
P recovery process was conducted in batches using a 20 L Nalgene tank, as illustrated in Figure
25 below.

56
Figure 25- 20-gallon baffled Nalgene tank and standing mixer used for optimized phosphorus recovery process
The hydrogen ion concentration (measured by pH) is one of the most important factors that
influence the struvite crystallization process, because it affects saturation and solubility. A high
pH increases the rate of struvite crystallization and a lower pH increases solubility. A pH range of
7.5 – 9 has been found to be suitable for optimum struvite precipitation (Booker et al., 1999;
Stratful et al., 2001). However, conditions with pH > 9 show inhibition to struvite formation, as
NH4+ is converted to the dissolved gas NH3. Since the pH of the centrate was in the range of 8 –
8.2 additional NaOH was not added.
In most wastewaters, the limiting factor for struvite formation is the magnesium
concentration in the system. Therefore, magnesium needed to be added externally to the system to
initiate struvite formation and P recovery. Based on influent NH3 concentrations, a known volume
of MgCl2 was added to increase struvite precipitation. Although theory suggests a molar ratio of
Mg:P to be 1:1, in practice an excess amount of magnesium is required in the system to achieve
higher phosphorus recovery, with a suggested molar ratio of 3:1 (Fattah et al., 2008b; Adnan et
al., 2003a; Jaffer et al., 2002; Münch and Barr, 2001).
57
Turbulence or mixing also increases struvite formation. In struvite crystallizers, turbulence is
required during operation to allow particles to collide with each other, resulting in struvite
formation. Centrate with P recovery was continuously mixed and once the reaction was complete
the precipitate was allowed to settle to the bottom of the tank, separating from the effluent. The
effluent was then fed to the MBBR for deammonification.
The lab-scale P recovery protocol was optimized with the following key improvements:
• Temperature was kept at 20 C
• 600 rpm was used for flash mixing, followed by 300 rpm for slow mixing
• MgCl2 was added slowly during flash mixing
• Baffles were added to increase turbulence in the system
Digested sludge and centrate (liquid effluent from dewatered digested sludge) samples were
collected from Denver's MWRD. The centrate was fed into the P recovery reactor and then to the
MBBR for deammonification. Struvite precipitated and was collected from the P recovery reactor.
Figure 26 below provides a Process Flow Diagram (PFD) of the bench-scale lab simulation of the
P recovery and Anammox deammonification processes.

58
Figure 26- Process flow diagram of bench-scale phosphorus recovery lab simulation
4.1.3 Bench-scale tests of Kruger’s Anita™ Mox MBBR system
A 7L MBBR was designed and constructed specifically for this study, as illustrated in
Figure 27 below. Centrate with P recovery was fed and mixed at a continuous rate and 5.1L of
centrate was maintained in the reactor. Anammox seeded media (AnoxKaldnes™ carriers, Kruger
Inc., Cary NC) were used. The system was placed in a temperature-controlled room at 30C.

59
Figure 27- Bench Scale MBBR Schematic
4.1.4 Analytical analysis
The pH, temperature, and DO of the MBBR were continuously monitored in-situ using a
universal controller (Hach Company, Loveland, CO; model SC200). Aeration was modulated
using a relay controller programmed to the pH sensor with a set point. The MBBR was
continuously mixed at a constant rate using a mechanical stirrer (Heidolph, Schwabach, Germany;
model RZR-2021). Industry standard methods were followed to analyze grab samples (EPA).
Industry standard test kits were used to test daily grab samples from the reactor effluent for NH4+-
N (Hach TNT 832 kit), NO3− -N (Hach TNT 836 kit), NO2− -N (Hach TNT 840 kit), COD (Hach
TNT 822 kit), VFAs (Hach TNT 872 kit), HPO42- (Hach TNT 846 kit) (Hach Company, Loveland,
CO). Sulfides were analyzed by EPA Method 8131 (Hach Company). All the daily effluent grab
samples were measured using a spectrophotometer (Hach Company, Loveland, CO; model DR

60
3900). IC was quantified using a TOC analyzer (Shimadzu, Kyoto, Japan; models TOC-VCSH
and ASI-V). Total alkalinity was tested using titrimetric analysis (American Society for Testing
and Materials).
4.1.5 Results
Figure 28 below illustrates the results from tests measuring alkalinity contributing species
in the centrate and digested sludge. Measurements of the digested sludge and centrate without and
with P recovery indicate that the bicarbonate mole fractions were the greatest contributor to the
total alkalinity of the system contributing 87.3%, 87.8%, and 97.6%, respectively. The mole
fraction of VFAs contributed the least in the digested sludge and centrate without and with P
recovery at 2.2%, 1.4%, and 1.6%, respectively. The sulfide mole fraction in the digested sludge
was measured at 4.1% and was found to not be measurable in the centrate without and with P
recovery. Phosphate mole fractions decreased significantly from 10.8% in the centrate without P
recovery to 0.8% in the centrate with P recovery.
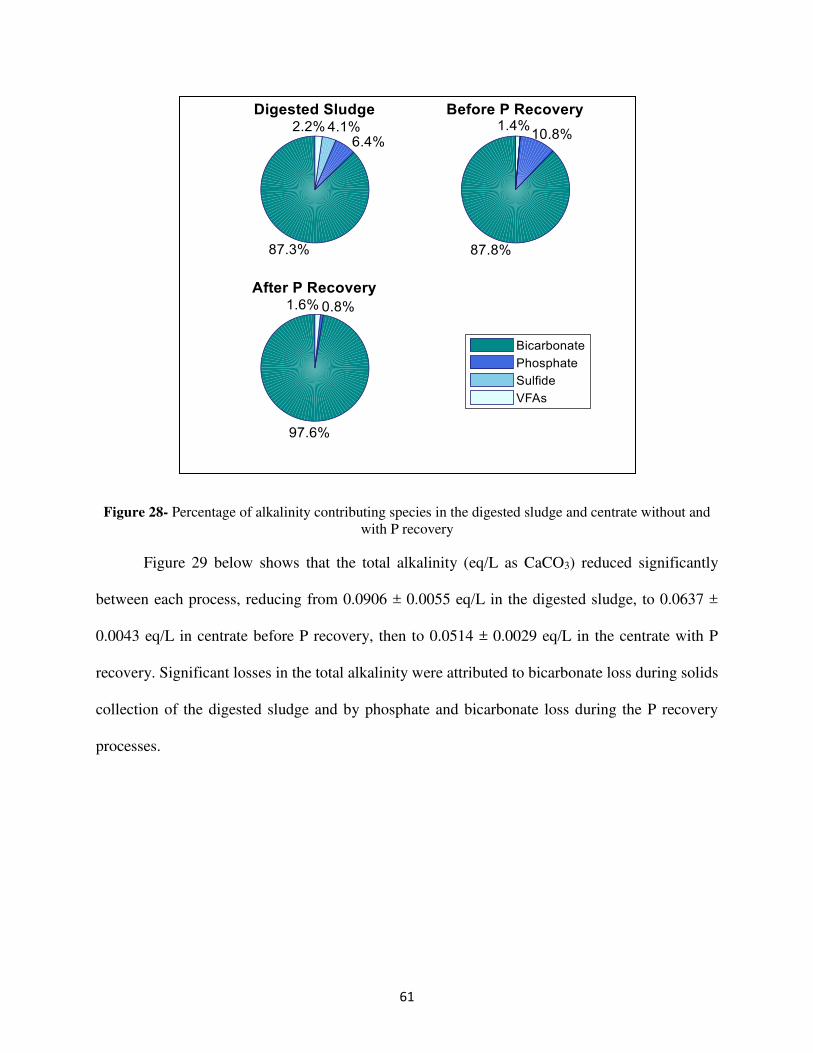
61
Figure 28- Percentage of alkalinity contributing species in the digested sludge and centrate without and with P recovery
Figure 29 below shows that the total alkalinity (eq/L as CaCO3) reduced significantly
between each process, reducing from 0.0906 ± 0.0055 eq/L in the digested sludge, to 0.0637 ±
0.0043 eq/L in centrate before P recovery, then to 0.0514 ± 0.0029 eq/L in the centrate with P
recovery. Significant losses in the total alkalinity were attributed to bicarbonate loss during solids
collection of the digested sludge and by phosphate and bicarbonate loss during the P recovery
processes.
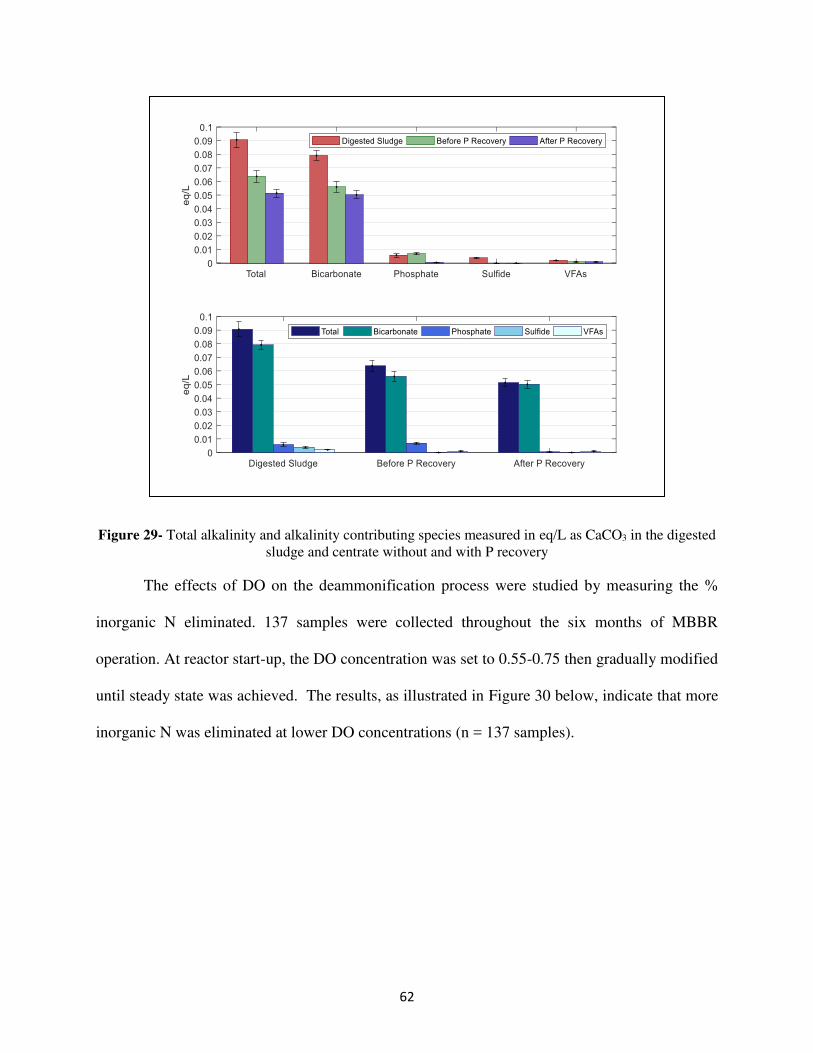
62
Figure 29- Total alkalinity and alkalinity contributing species measured in eq/L as CaCO3 in the digested sludge and centrate without and with P recovery
The effects of DO on the deammonification process were studied by measuring the %
inorganic N eliminated. 137 samples were collected throughout the six months of MBBR
operation. At reactor start-up, the DO concentration was set to 0.55-0.75 then gradually modified
until steady state was achieved. The results, as illustrated in Figure 30 below, indicate that more
inorganic N was eliminated at lower DO concentrations (n = 137 samples).

63
Figure 30- Effects of dissolved oxygen on % inorganic N eliminated
The MBBR was operated for six months and the N loading rate was gradually increased
during this period. After each successive loading rate increase, the reactor was allowed to come to
a quasi-steady state as evidenced by pH stability and at 7 days of N concentrations within 5% of
the rolling mean. The % inorganic N elimination is plotted versus surface loading rate (g NH3/m2-
day) in Figure 31 for these quasi-steady state data points. A linear regression, including the 95%
confidence intervals, is shown in Figure 31, and was constructed using data from 48 samples. A
negatively sloped linear relationship was observed as the surface area loading rate increased.
66.3
59.1
69.4
62.8
57.2 57.562.1
58.8
52.3
63.3
36.6
60.0
53.3
58.2 60.055.9
38.7 39.1
45.5
0
10
20
30
40
50
60
70
80
% I
no
rg
an
ic N
Eli
min
ati
on
Dissolved Oxygen Concentration (mg/L)

64
Figure 31- Linear regression model for the surface area loading rates and % inorganic N elimination
Figure 32 below presents a bar graph of the data presented in Figure 31 above. The graph
quantifies the % inorganic N eliminated at five varying surface area loading rates, measured in g
NH3/m2-day, and consists of 48 samples collected during steady state throughout the six months
of MBBR operation. The surface area loading rates were modified to observe their effects on the
deammonification process. The observed trend is that the % inorganic N removed decreased as the
surface area loading rate increased.

65
Figure 32- Quantification of the % inorganic N eliminated at different ranges of surface area loading rates
Table 7 and Figure 33 below present the results of a one-way ANOVA using the Tukey Pairwise
Comparison method conducted on the data presented in Figures 31 and 32. A p-value greater than
0.05 indicates that the surface area loading rate ranges are statistically equivalent at a 95%
confidence level. Surface area loading rate ranges that are statistically significantly the same are
grouped using the same letter (i.e. A, B, or C), in Figure 33.
Table 7- Tukey simultaneous test adjusted p-values for difference of means
Difference of Ranges Difference of Means Adjusted P-Values
1.26 - 1.35 - 0.35 - 1.26 -2.42 0.936
1.35 - 2.35 - 0.35 - 1.26 -6.43 0.123
2.35 - 2.6 - 0.35 - 1.26 -12.11 0.000
2.6 - 3.06 - 0.35 - 1.26 -14.42 0.000
73.8 71.467.4
61.457.3
0
10
20
30
40
50
60
70
80
90
0.35 - 1.26 1.26 - 1.35 1.35 - 2.35 2.35 - 2.6 2.6 - 3.06
% I
no
rg
an
ic N
Eli
min
ati
on
Surface Area Loading Rate (g NH3/m2-day)

66
1.35 - 2.35 - 1.26 - 1.35 -4.01 0.636
2.35 - 2.6 - 1.26 - 1.35 -9.69 0.009
2.6 - 3.06 - 1.26 - 1.35 -12.00 0.000
2.35 - 2.6 - 1.35 - 2.35 -5.68 0.091
2.6 - 3.06 - 1.35 - 2.35 -7.99 0.001
2.6 - 3.06 - 2.35 - 2.6 -2.31 0.627
Figure 33- One-way ANOVA Tukey Pairwise Comparison results on the effects of surface area loading rate ranges on % inorganic N elimination (The Tukey grouping results (A, B, and C) are also presented)
Table 8 below presents results from statistical analyses performed on the data presented in
Figures 30 and 31 above. Table 7 presents the grouping results using the Tukey Pairwise
Comparison method at a 95% confidence interval from a one-way ANOVA performed on centrate
with P recovery at varying surface area loading rates.
A
A
A, B
B, C
C

67
Table 8- Results from a one-way ANOVA (Tukey Pairwise Comparison method) analyzing the effects of varying surface area loading rates on centrate with P recovery
Surface Area Loading Rate (g
NH3/m2-day)
% Inorganic N
Eliminated
Standard
Deviation
Tukey Pairwise Comparison
Groupings
0.35 - 1.26 73.8 5.99 A
1.26 - 1.35 71.4 3.87 A
1.35 - 2.35 67.4 4.30 A, B
2.35 - 2.6 61.7 2.91 B, C
2.6 - 3.06 59.4 4.04 C
Comparative analysis was conducted on centrate with P recovery at a constant surface loading rate
of 2.7 g NH3/m2-day, as shown in Figure 34 below. The results indicate that at least a 67.8%
inorganic N elimination could be achieved for centrate without P recovery.

68
Figure 34- Comparison of the % inorganic N eliminated with and without P recovery at a constant surface area loading rate of 2.7 g NH3/m2-day
Table 9 presents the results from a two-sample t-test conducted on data from centrate with and
without P recovery subjected to a constant surface area loading rate of 2.7 g NH3/m2-day. The
results indicate that, at a 95% confidence interval, there is a statistically significant difference in
centrate with P recovery compared to centrate without P recovery (p 0.001).
Table 9- Two sample t-test results analyzing the effect of a constant surface area loading rate (2.7 g NH3/m2-day) on centrate with and without P recovery
Surface Area Loading Rate
(g NH3/m2-day)
% Inorganic N
Eliminated
Standard
Deviation
p-value
(Ha: μ1 - μi-1 ≠ 0)
Centrate with P Recovery 59.9 3.91
Centrate without P Recovery 67.8 3.01 0.001
59.9
67.8
0
10
20
30
40
50
60
70
80
Centrate with P recovery Centrate without P recovery
% I
norg
an
ic N
Eli
min
ati
on
Surface Area Loading Rate (g NH3/m2-day)

69
Figure 35 below plots the projected reactor performance based on measured % inorganic N
eliminated data with P recovery, using an alkalinity/ammonia ratio of 2.48. The projected reactor
performance indicates that as the alkalinity/ammonia ratio increased, the reactor performance
based on the % inorganic N removed, also increased. The reactor performance was measured to
be 59.9% based on measured data for centrate with P recovery, using an alkalinity/ammonia ratio
of 2.48. The reactor performance for centrate without P recovery and at an averaged
alkalinity/ammonia ratio of 2.91 was measured to be 67.8%. If the alkalinity was available at the
ratio it is consumed, 3.33, then the data indicates that the reactor performance would be 75.5%.
Figure 35- Projected % of inorganic N removed with increased alkalinity/ammonia ratios
4.1.6 Discussion
The primary focus of this study was to gain an understanding of how upstream P recovery
processes affect the Anammox-based deammonification process. Measurements of the digested
sludge and centrate without and with P recovery indicate that bicarbonate mole fractions were the
greatest contributor to the total alkalinity of the system contributing 87.3%, 87.8%, and 97.6%,
59.9
67.8
75.5
50
55
60
65
70
75
80
2.48 2.91 3.33
% I
no
rg
an
ic N
Eli
min
ati
on
Alkalinity/Ammonia Ratio

70
respectively, as indicated in Figure 28. Comparison of bicarbonate in the digested sludge and
centrate without P recovery indicated that dewatering the digested sludge significantly contributed
bicarbonate alkalinity to the overall total alkalinity in the centrate. With P recovery, the percent of
the total bicarbonate alkalinity present in the centrate further increased; therefore, dewatering the
digested sludge enhanced the P recovery process.
While the mole fraction of bicarbonate alkalinity increased in the overall total alkalinity of
the centrate, the bicarbonate concentrations decreased in the digested sludge and centrate without
and with P recovery from 0.0791 ± 0.0036 eq/L, 0.0560 ± 0.0040 eq/L, and to 0.0502 ± 0.0029
eq/L, respectively, as illustrated in Figure 29. Since the overall total alkalinity is comprised mostly
of bicarbonate alkalinity, the total alkalinity (CaCO3 eq/L) also reduced significantly between each
process, reducing from 0.0906 ± 0.0055 eq/L in the digested sludge, to 0.0637 ± 0.0043 eq/L in
centrate without P recovery, then to 0.0514 ± 0.0029 eq/L in the centrate with P recovery. The loss
of total and bicarbonate alkalinity was observed due to an increase in H+ ion concentration
(decrease in the pH), because of increased struvite formation. The deammonification process was
driven by Anammox bacteria which are chemoautotrophic bacteria, that rely on NO-2 as their
electron donor and CO2 as their main carbon source (Madigan et al., 2011). Literature also reports
that IC concentrations affect Anammox activity (Liao et al., 2008; Tang et al, 2009. A study
concluded that 1.2 mg-C/L is the optimal IC concentration for Anammox-based deammonification
process; however, when IC concentrations are very low Anammox bacteria have difficulty using
IC as a carbon source (Kimura et al., 2011). Additionally, IC is the main carbon source for AOB
growth, and studies have shown that AOB activity is limited at IC concentrations lower than 36
mg-C/L (Kimura et al., 2011). Therefore, a sufficient amount of IC is required for the
deammonification process. Thus, an important finding from this study was that IC should be used

71
as an indicator for determining reactor performance (% of inorganic N removed), rather than total
alkalinity. Initially it was hypothesized that relying solely on alkalinity would be an accurate
representation of the factors affecting deammonification. However, alkalinity is comprised of other
species than just bicarbonate, and because AMX bacteria and AOB rely on IC, this study concluded
that IC should be used to measure reactor performance.
As the P recovery process was optimized to increase struvite formation, which is beneficial
for WWTPs by preventing equipment fouling and therefore operation and maintenance costs and
the potential economic benefits of struvite as agricultural fertilizer, the amount of available
ammonia needed for AMX in the deammonification process reduced. Literature suggests (Sliekers
et al., 2002) a ratio of total alkalinity (as CaCO3) to total ammonium nitrogen (TAN) in the range
of 3.57:1 to 3.68:1. What this study observed was that 60% of the inorganic N could be eliminated
when the alkalinity/ammonia ratio was 2.48 and when the ratio was further increased to 2.91 70.1%
inorganic N removal was achieved. Using the measured data, the reactor performance was
projected to be 75.5% efficient if the alkalinity was available at the ratio it was consumed, which
was 3.33, shown in Figure 35. The alkalinity/ammonia ratio findings from this study are outside
of what literature suggests; however, the results support industry manufacturer process guarantees
for TAN removal (Veolia, 2015). The industry manufacturer of the Anita™ Mox process provides
a process guarantee of 75-85% TAN removal, without the addition of any external carbon sources
(Veolia, 2015). These findings further support the hypothesis that bicarbonate alkalinity is an
important design criterion for the deammonification process performance.
DO control is crucial when maintaining an Anammox based deammonification process.
Anammox bacteria are obligate anaerobic bacteria (Madigan et al., 2011) and during MBBR
operation it was found that DO concentrations significantly affected Anammox growth.

72
Additionally, since Anammox are anaerobic bacteria and have a very slow growth rate (μ = 0.0027
h-1) (Strous et al., 1998; van der Star et al., 2007) the observed effects of altering the DO
concentration was delayed. DO concentrations also affect the AOBs and NOBs present in the
MBBR. Unlike Anammox, AOBs, and NOBs are strict aerobes. Therefore, successful
deammonification depends on a balanced microbial ecology between Anammox, AOBs, and
NOBs, where Anammox and AOB growth is fostered due to the commensalism relationship
exhibited between each other. At reactor start-up, the DO concentration was set to 0.55-0.75 mg
O2/L. During the six-month reactor operation, the DO concentration was gradually increased then
decreased in set concentrations until steady state was achieved. The overall DO concentration
during the life of the reactor ranged from 0.4-1.8 mg O2/L. This study found that 66.3% of
inorganic N could be eliminated at a DO concentration within the range of 0.4-0.55 mg O2/L, as
demonstrated in Figure 30. Cema et al., 2011 conducted a lab simulation identical to this study by
using centrate from dewatered sludge. Cema et al., 2011 found that optimal reactor performance
was achieved for oxygen concentrations around 3 mg O2/L with the average nitrogen removal rates
of 1.8 ± 0.31 g N/m2-day. The results from both studies illustrate the variance in optimal DO
concentrations between reactors with similar lab simulations. The reason for varying oxygen
concentrations could result from specific ammonium surface loads in the biofilm (Hao et al.,
2002a).
The effects of varying surface area loading rates (n = 26) were assessed on centrate with P
recovery, at steady state. The reactor performance, measured in % inorganic N eliminated, was
correlated to ammonia addition. The trend observed in Figure 31 was that increasing the surface
area loading rate decreased the reactor performance. Once the ammonia flux exceeded 2.6 the
reactor achieved 50.5% inorganic N elimination, this was also the lowest operating rate without

73
any upsets in reactor operation. There was a statistically significant difference between groups as
determined by a one-way ANOVA (F(4, 21) = 12.20, p = 0.000) (Fig. 33 , Tables 7 and 8) in
Minitab 17 (Minitab, State College, PA). A Tukey Pairwise Comparison test revealed that, at a
95% confidence interval, reactor performance was statistically significantly lower when subjected
to surface area loading rate ranges of 2.35 – 2.6 (61.71 ± 2.91%, p = 0.001) and 2.6 – 3.06 (57.32
± 4.38%, p = 0.000) compared to the surface area loading rate range of 0.35 – 1.26 (73.82 ± 5.99%).
While reactor performance decreased from 73.82 ± 5.99% to 71.41 ± 3.87% and to 67.40 ± 4.30%
when subjected to the surface area loading rate ranges of 0.35 – 1.26, 1.26 – 1.35, and 1.35 – 2.35,
respectively, there was no statistically significant difference between these ranges (p = 0.940 and
p = 0.158).
A comparison was conducted between centrate with (n = 4) and without (n = 22) P recovery
at a constant surface loading rate of 2.7 g NH3/m2-day (Fig. 34). The MBBR performed at 59.9%
efficiency with centrate subjected to P recovery upstream. The reactor displayed an immediate
improvement with centrate without P recovery by performing at 65.6% efficiency. A statistical
comparison was conducted between these variables using a two-sample t-test (for a normally
distributed data set (AD: p > 0.05) of equal variance) in Minitab 17. The results in Table 9 indicate
that reactor performance is statistically different at the 95% confidence level when using centrate
with and without P recovery (p = 0.001). Therefore, P recovery significantly impacts reactor
performance by reducing reactor performance.

74
CHAPTER 5: SUMMARY AND CONCLUSION The findings presented in chapter 3 further advanced published sample prep and DNA
extraction protocols for fixed biofilm Anammox media. Results comparing the DNA
concentrations, purity, and spectrophotometry curves obtained from experiments using three
different DNA isolation kits revealed that the PowerBiofilm kit was most efficient at minimizing
biases. Selection of the PowerBiofilm kit also optimized DNA extraction results, because of the
chemical in the microbeads, which allowed for the breakdown of extracellular polymer substances
found in biofilms. Application of mechanical cell lysis techniques, including the use of liquid
nitrogen and a pestle, resulted in a more representative sample, and further mitigated biases.
Additionally, doubling inhibitor removal solution during DNA extraction reduced biases.
One of the research objectives was to determine whether correlations between the
microbial ecology data and the MBBR performance data could be determined from the use of
DNA extraction procedures and qPCR. The results from this study indicate that microbial ecology
data and MBBR performance data were not correlated. However, these findings only represent
data from one MBBR and the use of DNA extraction techniques which do not indicate activity of
the target gene. Therefore, it is recommended that future studies are conducted on multiple MBBRs
to obtain more representative results and the use of RNA extraction techniques to quantify the
activity of target genes.
Results from the full-scale suspended Anammox granule system indicated that the reactor
either had no AMX or concentrations too low to detect. These findings support the observations
made by on-site operators at the full-scale WWTP, who communicated that operational issues with
the pumps had occurred, which they hypothesized could be affecting the amount of AMX in the

75
reactor. Since AMX have a relatively slow growth rate of μ = 0.0027 h-1, as compared to AOB and
NOB, it is likely that the effects of the process upsets, due to the operational issues experienced
with the pumps, were not observed until late February, when the samples were taken.
It is recommended that the full-scale WWTP collect more samples, to develop a baseline
of data over time. Creating a baseline would allow for trends in the microbial ecology to be
observed which can then be correlated to the observed performance of the reactor, overflow, and
underflow streams. Another recommendation for the full-scale WWTP is to consider sequencing
samples which are difficult to reproduce. While the sequencing process is expensive, relative the
biomolecular tools used during this study, and requires approximately one month before the results
are available, the results could be compared to qPCR results and previous sequencing results to
help develop a more robust baseline.
The results presented in chapter 4 confirmed the hypothesis that the P recovery process
impacted the downstream deammonification process. The loss of total and bicarbonate alkalinity
was observed due to a decrease in pH because of increased struvite formation. It was found that a
lower pH increased the CO2 concentration, thus aiding the deammonification process. It was also
hypothesized that using alkalinity would be an accurate representation of the factors affecting
deammonification. However, alkalinity is comprised of other species than just carbonate, and
because Anammox rely on CO2 this study concluded that IC should be used to measure reactor
performance. This study also found that increasing the surface area loading rate (g NH3/m2-day)
decreased reactor performance. The reactor performance was statistically significantly different
when subjected to ranges of surface loading rates of 2.35 – 2.6 and 2.6 – 3.06 compared to the
surface area loading rate range of 0.35 – 1.26. Comparative analysis was conducted using a
constant surface area loading rate (2.7 g NH3/m2-day) on centrate with and without P recovery.
76
When using centrate with P recovery the MBBR performed the poorest at 59.9% efficiency.
However, the reactor displayed an immediate improvement when subjected to centrate without P
recovery by performing at 65.6% efficiency. Extrapolation of measured data indicates that if the
observed consumption ratio of 3.33:1 was achieved, the projected reactor efficiency would be
75.5% total inorganic nitrogen (TIN) removal at a loading rate of 2.7 g NH3/m2-day. It is
hypothesized that the concentration of bicarbonate limited deammonification efficiency with
respect to ammonia removal. To test this hypothesis, this study recommends further
experimentation to observe the effects of increasing the carbonate alkalinity concentration by
adding sodium bicarbonate (NaHCO3).
The integration of biomolecular tools WWT systems can be an effective approach to
optimize reactor performance. Use of biomolecular tools, such as DNA extraction techniques and
qPCR, can determine the relative abundance of a system which could provide a general sense of
the microbial ecology. Knowing the microbial ecology could allow WWTP operators to modify
operating conditions, such as pH, temperature, DO, alkalinity, influent NH4+-N and NH3-N flux,
and IC requirements, to promote AMX and AOB growth, while limiting NOB growth. The use of
biomolecular tools can also be helpful in determining correlations between modified factors that
affect the microbial ecology and reactor performance.

77
REFERENCES Abma, W.R., Driessen W., Haarhuis R., van Loosdrecht, M.C. (2010). Upgrading of sewage treatment plant by sustainable and cost-effective separate treatment of industrial wastewater. Water Sci Technol, 61(7):1715–1722. Adnan, A., Mavinic, D. S., and Koch, F. A. (2003a). Pilot-scale study of phosphorus recovery through struvite crystallization-II: Applying in-reactor supersaturation ratio as a process control parameter. Env Eng Sci, 2(6): 473-483. Adnan, A., Mavinic, D. S., and Koch, F. A. (2003b). Pilot-scale study of phosphorus recovery through struvite crystallization – examining the process feasibility. Env Eng Sci, 2(5): 315- 324. American Society for Testing and Materials. 1982. Standard Methods for Acidity or Alkalinity of Water. Publ. D1067-70 (reapproved 1977), American Soc. Testing & Materials, Philadelphia, PA. Batstone, D. J., Hülsen, T., Mehta, C. M., Keller, J. (2015). Platforms for energy and nutrient recovery from domestic wastewater: A review. Chemosphere, 140, 2-11. Blair, G., Zajdel, M. (1992). The polymerase chain reaction - already an established technique in biochemistry.
https://onlinelibrary.wiley.com/doi/pdf/10.1016/0307-4412%2892%2990106-V Booker, N. A., Priestley, A. J. and Fraser, I. H. (1999). Struvite formation in wastewater treatment plants: Opportunities for nutrient recovery. Env Tech, 20(7): 777-782. Bott, C. (2011). Nitrogen Removal 3.0: Integration of Anammox into Sidestream and Mainstream BNR Processes. http://www.chesapeake.org/stac/presentations/203_STAC%20Dec%202011%20Bott.pdf Caffaz, S., Bettazzi, E., Scaglione, D., Lubello, C. (2008). An integrated approach in a municipal WWTP: anaerobic codigestion of sludge with organic waste and nutrient removal from supernatant. Water Sci Technol, 58(3): 669-676. Carrera, J., Baeza, J., Lafuente, T. (2003). Biological nitrogen removal of high-strength ammonium industrial wastewater with two-sludge system. Water Res, 37(17): 4211-4221. Casagrande, C., Kunz, A., De Prá, M., Bressan, C., Soares, H. (2013). High nitrogen removal rate using ANAMMOX process at short hydraulic retention time. Water Sci Technol, 67(5): 968-975.

78
Cema, G., Plaza, E., Trela, J., and Surmacz-Gorska, J. (2011). Dissolved Oxygen as a Factor Influencing Nitrogen Removal Rates in a One-State System with partial Nitritation and Anammox process. Water Sci Technol, 64(5): 1009-1015. Coats, E.R., Watkins, D.L., Brinkman, C.K., Loge, F.J. 2011. Effect of Anaerobic HRT on Biological Phosphorus Removal and the Enrichment of Phosphorus Accumulating Organisms. Water Env Res, 83(5): 461-469. Colorado department of public health and environment water quality control commission. (2012). Regulation #85 nutrients management control regulation 5CCR 1002-85. https://www.colorado.gov/pacific/sites/default/files/WQ_nonpoint_source-Regulation- 85.pdf Cordell, D. (2008a). The Story of Phosphorus: missing global governance of a critical resource. SENSE Earth Systems Governance, Amsterdam, 24th–31st August 2008. Cordell, D., Drangert, J.-O., White, S. (2008b) The story of phosphorus: Global food security and food for thought. Global Env Change, 19(2): 292-305. De Long, S.K., Li, X., Bae, S., Brown, J.C., Raskin, L., Kinney, K.A., Kirisits, M.J. (2012). Quantification of genes and gene transcripts for microbial perchlorate reduction in fixed- bed bioreactors. App Microbiol, 112(3): 579-592. Dodds, W. K., Bouska W.W., Eitzmann J.L., Pilger T.J., Pitts K.L., Riley A.J., Schloesser J.T., Thornbrugh D.J. (2009). Eutrophication of U.S. freshwaters: analysis of potential economic damages. Env Sci Technol, 43(1): 9-12. Electric Power Research Institute. (2002). Water and Sustainability: U.S. Electricity Consumption for Water Supply & Treatment—The Next Half Century, EPRI, Palo Alto, CA: 2000. https://www.epri.com/#/pages/product/1006787/ Environmental Protection Agency. (2017). Nutrient Pollution, the Problem. https://www.epa.gov/nutrientpollution/problem Environmental Protection Agency. (2016). Title 40 Protection of Environment, Part 136. https://www.gpo.gov/fdsys/granule/CFR-2016-title40-vol25/CFR-2016-title40-vol25- part136 Fattah, K. P., Mavinic, D. S., Koch, F. A. (2012). Influence of process parameters on the characteristics of struvite pellets. Env Eng, 138(12): 1200-1209. Fattah, K. P., Zhang, Y., Mavinic, D. S. Koch, F. A. (2008a). Application of carbon dioxide stripping for struvite crystallization - I: Development of a carbon dioxide stripper model to predict CO2 removal and pH changes. Env Eng Sci, 7(4): 345-356.

79
Fattah, K. P. (2004). Pilot scale struvite recovery potential from centrate at Lulu Island Wastewater Treatment Plant. M.A.Sc. Thesis, Department of Civil Engineering, University of British Columbia, Vancouver, BC, Canada. Fattah, K. P., Mavinic, D. S., Koch, F. A. and Jacob, C. (2008b). Determining the feasibility of phosphorus recovery as struvite from filter press centrate in a secondary wastewater treatment plant. Env Sci and Health Part A-Toxic/hazardous Substances and Env Eng, 43(7): 756-764. Forrest, A. L., Fattah, K. P., Mavinic, D. S. and Koch, F. A. (2007). Application of artificial neural networks to effluent phosphate prediction in struvite recovery. Environmental Engineering and Science, 6(6): 713-725. Freed, T. (2007). Wastewater Industry Moving Toward Enhanced Nutrient Removal Standards. WaterWorld, http://ww.pennnet.com/articles/article_display.cfm?article_id=286210. Fukumoto, Yasuyuki, Kazuyoshi Suzuki, Kazutaka Kuroda, Miyoko Waki, and Tomoko Yasuda. (2011). “Effects of Struvite Formation and Nitratation Promotion on Nitrogenous Emissions such as NH3, N2O and NO during Swine Manure Composting.” Bioresource Technol 102 (2): 1468–74. Fux, C., Boehler, M., Huber, P., Brunner, I., Siegrist, H. (2002). Biological treatment of ammonium-rich wastewater by partial nitritation and subsequent anaerobic ammonium oxidation (Anammox) in a pilot plant. Biotechnol, 99(3): 295-306. Fux, C., Velten, S., Carozzi, V., Solley, D., Keller, J. (2006) Efficient and stable nitritation and denitritation of ammonium-rich sludge dewatering liquor using an SBR with continuous loading. Water Res, 40(14): 2765-2775. Gilbert, R.O. (1987). Statistical methods for environmental pollution monitoring. New York,
NY:Van Nostrand Reinhold. Grady, C., Daigger, G., Love, N., Filipe, C. (2011). Biological wastewater treatment. Boca Raton, FL: CRC Press Graham, D.W., Knapp, C.W., Van Vleck, E.S., Bloor, K., Lan, T.B., Graham, C.E. (2007). Experimental demonstration of chaotic instability in biological nitrification. ISME J I(5): 385-393. Güven, D., A. Dapena, B. Kartal, M. C. Schmid, B. Maas, K. van de Pas-Schoonen, S. Sozen, R. Mendez, H. J. M. Op den Camp, M. S. M. Jetten, M. Strous, and I. Schmidt. (2005). Propionate oxidation by and methanol inhibition of anaerobic ammonium-oxidizing bacteria. Appl Environ Microbiol, 71 (2): 1066-1071. Hach Company. (2014). Sulfide: USEPA methylene blue method 8131, DOC316-53-01136. www.hach.com/asset-get.download.jsa?id=7639983902
80
Hauck, M., Maalcke-Luesken, F., Jetten, M., Huijbregts, M. (2016). Removing nitrogen from wastewater with side stream anammox: What are the trade-offs between environmental impacts? Res Cons Recycl, 107: 212-219. Hao, X., Heijnen, J. J., van Loosdrecht, M. (2002a) Sensitivity analysis of biofilm model describing a one-stage completely autotrophic nitrogen removal (CANON) process. Biotechnol Bioeng, 77 (3): 266–277. Hu, Z.Y., Lotti, T., de Kreuk, M., Kleerebezem, R., van Loosdrecht, M., Kruit, J., Jetten, M.S.M., Kartal, B. (2013). Nitrogen Removal by a Nitritation-Anammox Bioreactor at Low Temperature. Appl Env Microbiol, 79(8): 2807-2812. Innerebner, G., Insam, H., Franke-Whittle, I.H., Wett, B. (2007). Identification of anammox bacteria in a full-scale deammonification plant making use of anaerobic ammonia oxidation. Syst Appl Microbiol, 30(5): 408–412. Irianni-Renno, M., Akhbari, D., Olson, M.R., Byrne, A.P., Lefevre, E., Zimbron, J., Lyverse, M., Sale, T.C., De Long, S.K. (2015). Comparison of bacterial and archaeal communities in depth-resolved zones in an LNAPL body. Appl Microbiol Biotechnol, 3347-3360. Isaka, K., Date, Y., Kimura, Y., Sumino, T., Tsuneda, S. (2008). Nitrogen removal performance using anaerobic ammonium oxidation at low temperatures. FEMS Microbiol Lett, 282(1): 32–38. Jaffer, Y., Clark, T. A., Pearce, P., Parsons, S. A. (2002). Potential phosphorus recovery by struvite formation. Water Res, 36(7): 1834-1842. Jin, T., Zhang, T., Yan, Q. (2010). Characterization and quantification of ammonia oxidizing archaea (AOA) and bacteria (AOB) in nitrogen-removing reactor using T-RLFP and qPCR. Appl Microbiol Biotechnol, 87(3): 1167-1176. Johnson, C. (2013). Suspended Growth SBR Deammonification System #1: DEMON. WEFTEC Conference Kampschreur, M., van der Star, W., Wielders, H., Mulder, J., Jetten, M., van Loosdrecht, M. (2008). Dynamics of nitric oxide and nitrous oxide emission during full-scale reject water treatment. Water Res, 42(3): 812–826. Khare, P., Raj, V., Chandran, S., Agarwal, S. (2014). Quantitative and qualitative assessment of DNA extracted from saliva for its use in forensic identification. J Foresnsic Dent Sci. 6(2): 81-85. Kuene, J. G. (2008). Anammox bacteria: from discovery to application. Nature, 6: 320-326.
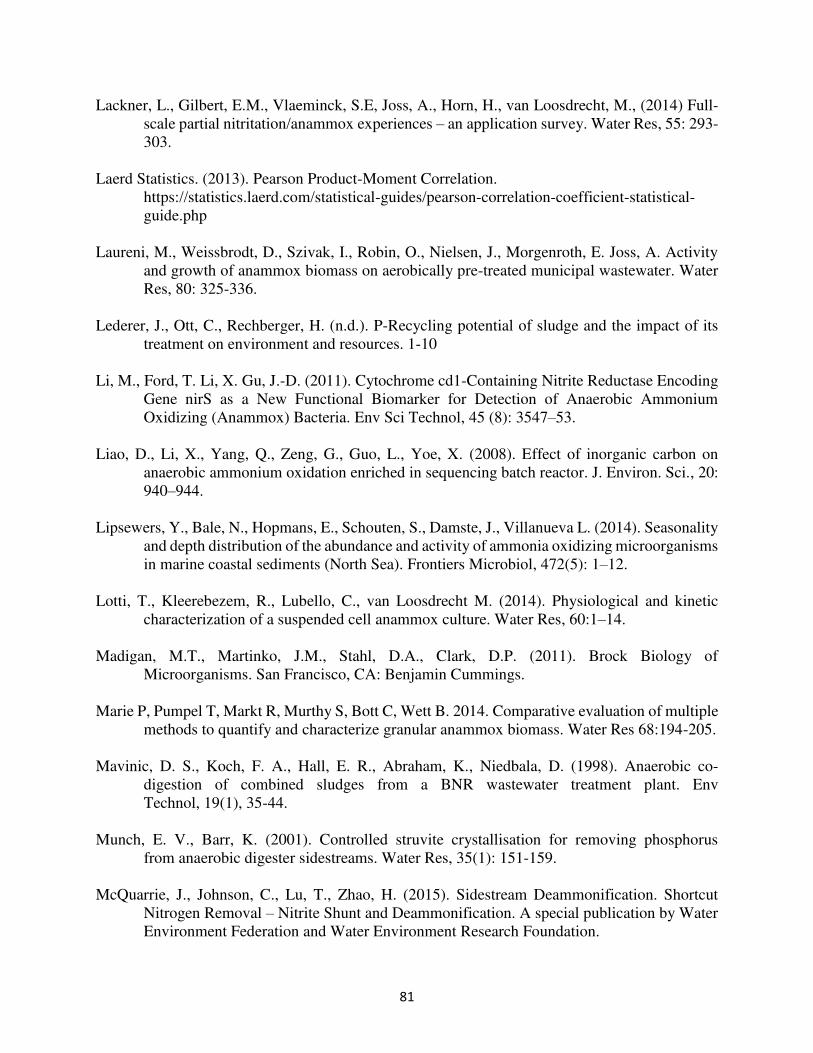
81
Lackner, L., Gilbert, E.M., Vlaeminck, S.E, Joss, A., Horn, H., van Loosdrecht, M., (2014) Full- scale partial nitritation/anammox experiences – an application survey. Water Res, 55: 293- 303. Laerd Statistics. (2013). Pearson Product-Moment Correlation.
https://statistics.laerd.com/statistical-guides/pearson-correlation-coefficient-statistical- guide.php Laureni, M., Weissbrodt, D., Szivak, I., Robin, O., Nielsen, J., Morgenroth, E. Joss, A. Activity and growth of anammox biomass on aerobically pre-treated municipal wastewater. Water Res, 80: 325-336. Lederer, J., Ott, C., Rechberger, H. (n.d.). P-Recycling potential of sludge and the impact of its treatment on environment and resources. 1-10 Li, M., Ford, T. Li, X. Gu, J.-D. (2011). Cytochrome cd1-Containing Nitrite Reductase Encoding Gene nirS as a New Functional Biomarker for Detection of Anaerobic Ammonium Oxidizing (Anammox) Bacteria. Env Sci Technol, 45 (8): 3547–53. Liao, D., Li, X., Yang, Q., Zeng, G., Guo, L., Yoe, X. (2008). Effect of inorganic carbon on anaerobic ammonium oxidation enriched in sequencing batch reactor. J. Environ. Sci., 20: 940–944. Lipsewers, Y., Bale, N., Hopmans, E., Schouten, S., Damste, J., Villanueva L. (2014). Seasonality and depth distribution of the abundance and activity of ammonia oxidizing microorganisms in marine coastal sediments (North Sea). Frontiers Microbiol, 472(5): 1–12. Lotti, T., Kleerebezem, R., Lubello, C., van Loosdrecht M. (2014). Physiological and kinetic characterization of a suspended cell anammox culture. Water Res, 60:1–14. Madigan, M.T., Martinko, J.M., Stahl, D.A., Clark, D.P. (2011). Brock Biology of Microorganisms. San Francisco, CA: Benjamin Cummings. Marie P, Pumpel T, Markt R, Murthy S, Bott C, Wett B. 2014. Comparative evaluation of multiple methods to quantify and characterize granular anammox biomass. Water Res 68:194-205. Mavinic, D. S., Koch, F. A., Hall, E. R., Abraham, K., Niedbala, D. (1998). Anaerobic co- digestion of combined sludges from a BNR wastewater treatment plant. Env Technol, 19(1), 35-44. Munch, E. V., Barr, K. (2001). Controlled struvite crystallisation for removing phosphorus from anaerobic digester sidestreams. Water Res, 35(1): 151-159. McQuarrie, J., Johnson, C., Lu, T., Zhao, H. (2015). Sidestream Deammonification. Shortcut Nitrogen Removal – Nitrite Shunt and Deammonification. A special publication by Water Environment Federation and Water Environment Research Foundation.

82
NAE. (2008). NAE GRAND CHALLENGES FOR ENGINEERING. http://www.engineeringchallenges.org/File.aspx?id=11574&v=34765dff Ni, S.-Q., & Zhang, J. (2013). Anaerobic Ammonium Oxidation: From Laboratory to Full-Scale Application. BioMed Res Intl, 2013: 1-10. O’Shaughnessy, M. (2015). Mainstream deammonification. (p.36). Alexandria, VA: IWA Publishing. Park, H., Sundar, S., Ma, Y., Chandran, K. (2015). Differentiation in the Microbial Ecology and Activity of Suspended and Attached Bacteria in a Nitration-Anammox Process. Biotechnol Bioeng, 112(2): 272-279. Persson, F., Suarez, C., Hermansson, M., Plaza, E., Sultana. R., Wilén, B. (2017). Community structure of partial nitritation‐anammox biofilms at decreasing substrate concentrations and low temperature. Morgenroth E, Flemming H, Azeredo J, et al., eds. Microbial Biotechnology. 2017;10(4):761-772. doi:10.1111/1751-7915.12435. Pitman, A.R., Deacon, S.L., Alexander, W.V. (1991) The thickening and treatment of sewage sludge to minimise phosphorus release. Water Res, 25(10): 1285-1294. Regmi, P., Holgate, B., Miller, M., Park, H., Chandran, K., Wett, B., Murthy, S., Bott, C. (2016). Nitrogen polishing in a fully anoxic Anammox MBBR treating mainstream nitritation- denitritationeffluent. Biotechnol and Bioeng, 113(3): 635-642. Rotthauwe, J., Witzel, K., Liesack, W. (1997). The ammonia monooxygenase structural gene amoA as a functional marker: molecular fine-scale analysis of natural ammonia-oxidizing populations. Appl Environ Microbiol, 63(12): 4704-4712. Sanseverino, I., Conduto, D., Pozzoli, L., Dobricic, S., Lettieri, T. (2016). JRC Technical Reports: Algal bloom and its economic impact. European commission. http://publications.jrc.ec.europa.eu/repository/bitstream/JRC101253/lbna27905enn.pdf Schalk, J., Oustad, H., Kuene, J., Jetten, M. (1997). The anaerobic oxidation of hydrazine: a novel reaction in microbial nitrogen metabolism. GEMS Microbiol Letters, 158: 61-67. Sharp, R., Niemiec, A., Khunjar, W., Galst, S., Deur, A. (2017). Development of a novel deammonification process for cost effective separate centrate and main plant nitrogen removal. In Proceeding of the International Conference on Modelling, Monitoring and Management of Water Pollution, Venice, Italy, 2016. Sliekers, A.O., Derwort, N., Gomez, J.L., Strous, M., Kuenen, J.G., Jetten, M.S. (2002). Completely autotrophic nitrogen removal over nitrite in one single reactor. Water Res, 36(10): 2475-2482.

83
Stratful, I., Scrimshaw, M.D., Lester, J.N. (2001). Conditions influencing the precipitation of magnesium ammonium phosphate. Water Res, 35(17): 4191-4199. Strous, M, Heijnen, J., Kuenen, J., Jetten, M. (1998). The sequencing batch reactor as a powerful tool for the study of slowly growing anaerobic ammonium-oxidizing microorganisms. Appl Microbiol Biotechnol, 50(5): 589-596. Strous, M., Heijnen, J., Kuenen, J., Jetten, M. (1999). Key physiology of anaerobic ammonium oxidation. Appl Environ Microbiol, 65(7): 3248-3250. Stumm, W., Morgan J.J. (1996). Aquatic Chemistry: Chemical Equilibria and Rates in Natural Waters. Hoboken, NJ: Wiley-Interscience. Suszyński, A. (2016). Smart solutions at advanced sewage sludge treatment plant. https://www.slideshare.net/EcoforumLviv/ostara-66998124. Szatkowska, B., Cema, G., Plaza, E., Trela, J., Hultman, B., (2007). One-stage system with partial nitritation and Anammox processes in moving-bed biofilm reactor. Water Sci Techno., 55 (8–9), 19–26. Szatkowska, B., Paulsrud, B. (2014). The Anammox process for nitrogen removal from wastewater – achievements and future challenges. https://vannforeningen.no/wp- content/uploads/2015/06/2014_902654.pdf. Tang, Ch.-J., Zheng, P., Mahmood, Q., Chen, J.-W. (2009) Start-up and inhibition analysis of the Anammox process seeded with anaerobic granular sludge. J Ind Microbiol Biotechnol, 36(8): 1093-1100. ThermoScientific. (2009). T042-TECHNICAL BULLETIN NanoDrop Spectrophotometers: 260/280 and 260-230 Ratios. http://www.nhm.ac.uk/content/dam/nhmwww/our- science/dpts-facilities-staff/Coreresearchlabs/nanodrop.pdf. Thöle, D., Cornelius, A., Rosenwinkel, K.H. (2005). Full scale experiences with deammonification of sludge liquer at Wastewater Treatment Plant Hattingen. GWF, Wasser/Abwasser 146(2): 104-09. United Nations. (2015). World population project to reach 9.7 billion by 2050. http://www.un.org/en/development/desa/news/population/2015-report.html. van der Star, W.R.L., Abma, W.R., Blommers, D., Mulder, J., Tokutomi, T., Strous, M. (2007). Startup of reactors for anoxic ammonium oxidation: Experiences from the first full-scale AMX reactor in Rotterdam. Water Res, 41(18): 4149-4163. Vázquez-Padín, J.R., Fernández, I., Morales, N., Campos, J.L., Mosquera-Corral, A., Méndez, R. (2011). Autotrophic nitrogen removal at low temperature. Water Sci Technol, 63(6):1282- 1288.

84
Veolia. (2015). Anita™ Mox AnoxKaldnes™ MBBR and IFAS technical datasheet. http://www.veoliawatertech.com/vwst- northamerica/ressources/documents/1/38337ANITA-Mox-Brochure-2014-New- Brandi.pdf Water Environment Federation. (2007). Biological nutrient removal processes. https://www.sciencetheearth.com/uploads/2/4/6/5/24658156/chapter_22_biological_nutri ent_removal_revised_6th_edition.pdf Wett, B. (2007). Development and implementation of a robust deammonification process. Water Sci Technol, 56(7): 81. White, D. (2016). Amplifying DNA: A.Recombinant DNA B.Polymerase Chain Reaction (PCR)
(animation). http://slideplayer.com/slide/10622699/
Wild, D., Kisliakova, A., Siegrist, H. (1997). Prediction of recycle phosphorus loads from anaerobic digestion. Water Res, 31(9): 2300-2308. Winkler, M, Kleerebezem, R., Kuenen, J., Yang, J., van Loosdrecht, M. (2011). Segregation of Biomass in Cyclic Anaerobic/Aerobic Granular Sludge Allows the Enrichment of Anaerobic Ammonium Oxidizing Bacteria at Low Temperatures. Env Sci Tech, 45(17): 7330-7337. World Resources Institute. (2008). World hypoxic and eutrophic coastal areas. http://www.wri.org/resource/world-hypoxic-and-eutrophic-coastal-areas Wu, L.N., Zhang, L.Y., Shi, X., Liu, T., Peng, Y.Z., Zhang, J. (2015). Analysis of the impact of reflux ratio on coupled partial nitrification-Anammox for co-treatment of mature landfill leachate and domestic wastewater. Bioresource Technol, 198: 207-214. Yokota, N., Watanabe, Y., Tokutomi, T., Kiyokawa, T., Hori, T., Ikeda, D., Song, K., Hosomi, M., Terada. (2018). High-rate nitrogen removal from waste brine by marine anammox bacteria in a pilot-scale UASB reactor. Appl Microbiol Biotechnol, 102(3): 1501- 1512. Zekker, I., Rikmann, E., Tenno, T., Vabamäe, P., Kroon, K., Loorits, L., Saluste., A, Tenno, T. (2011). Effect of HCO3
- concentration on anammox nitrogen removal rate in a moving bed biofilm reactor. J Env Technol, 33(20): 2263-2271.

85
APPENDIX
Figure 36- DNA extraction test 1 results from using the DNeasy DNA Isolation kit with vortex and scraping
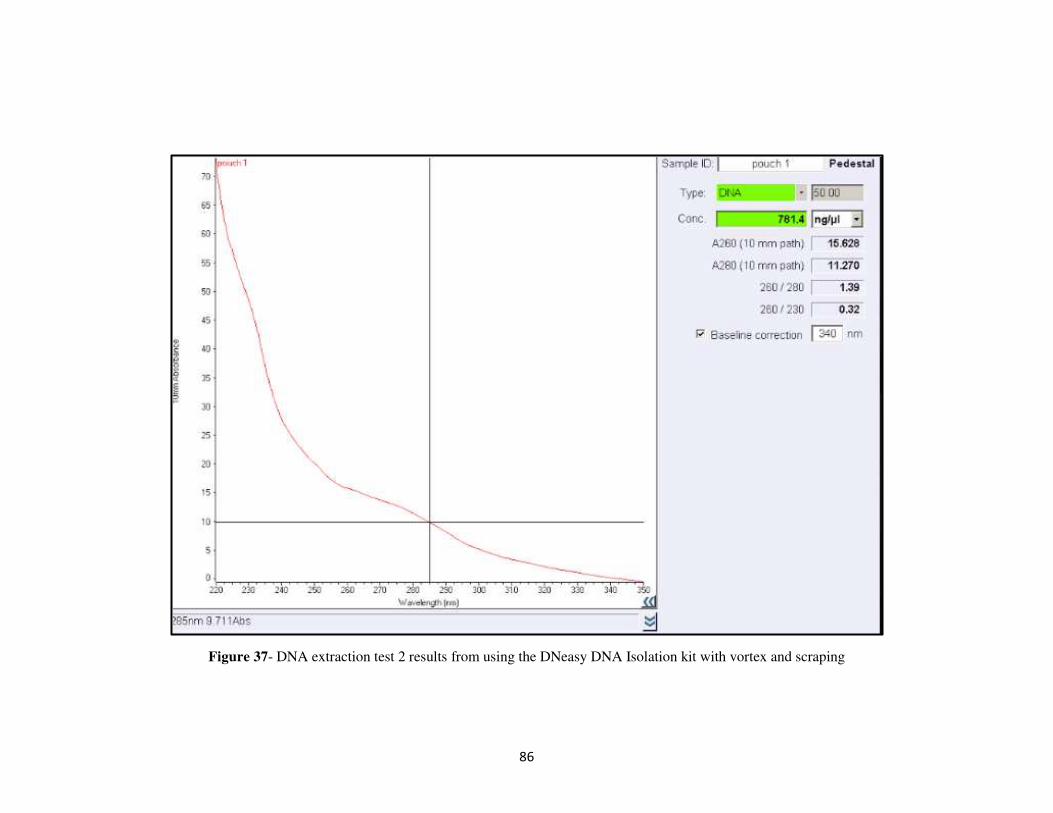
86
Figure 37- DNA extraction test 2 results from using the DNeasy DNA Isolation kit with vortex and scraping

87
Figure 38- DNA extraction test 3 results from using the DNeasy DNA Isolation kit with liquid nitrogen and smashing with a mortar and pestle

88
Figure 39- DNA extraction test 4 results from using the DNeasy DNA Isolation kit with liquid nitrogen and smashing with a mortar and pestle
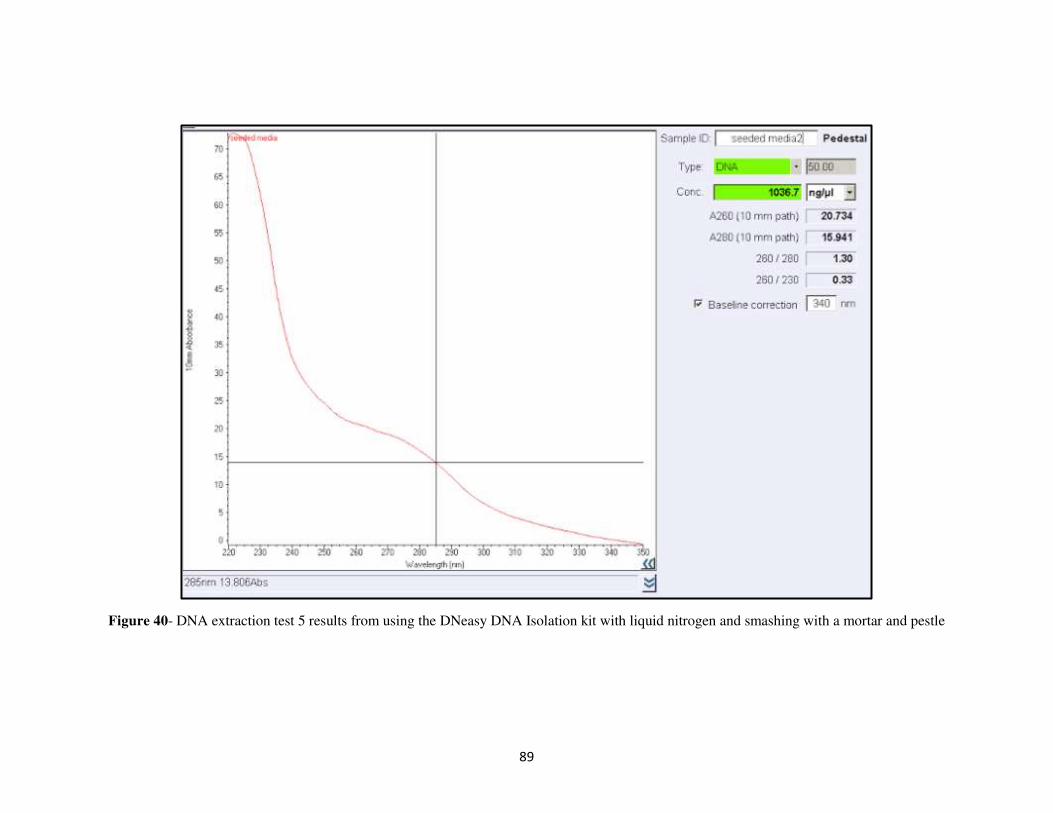
89
Figure 40- DNA extraction test 5 results from using the DNeasy DNA Isolation kit with liquid nitrogen and smashing with a mortar and pestle

90
Figure 41- DNA extraction test 6 results from using the PowerLyzer PowerSoil DNA Isolation kit with liquid nitrogen and smashing with a
mortar and pestle
91
Figure 42- DNA extraction test 7 results from using the PowerLyzer PowerSoil DNA Isolation kit with liquid nitrogen and smashing with a mortar and pestle

92
Figure 43- DNA extraction test 8 results from using the PowerLyzer PowerSoil DNA Isolation kit with liquid nitrogen and smashing with a mortar and pestle

93
Figure 44- DNA extraction test 9 results from using the PowerBiofilm DNA Isolation kit with liquid nitrogen and smashing with a mortar and pestle

94
Figure 45- DNA extraction test 10 results from using the PowerBiofilm DNA Isolation kit with liquid nitrogen and smashing with a mortar and pestle

95
LIST OF ABBREVIATIONS
AMX – anaerobic ammonia oxidizing bacteria
AD – Anderson-Darling
AOB – ammonia oxidizing bacteria
BNR – biological nitrogen removal
COD – chemical oxygen demand
CSU – Colorado State University
DNA – deoxyribonucleic acid
DO – dissolved oxygen
EBPR – enhanced biological phosphorus removal
EU – European Union
IC – inorganic carbon
N – nitrogen
MBBR – moving bed biofilm reactor
MWRD – metro wastewater reclamation district
NAE – National Academy of Engineering
NOB – nitrite oxidizing bacteria
O&M – operation and maintenance
OD – optical density
P – phosphorus
PBS – phosphate buffered saline
PFD – process flow diagram
QA/QC – quality assessment / quality control
96
qPCR – quantitative polymerase chain reaction
RNA – ribonucleic acid
TN – total nitrogen
TAN – total ammonium nitrogen
TIN – total inorganic nitrogen
TOC – total organic carbon
UASB – upflow anaerobic sludge blanket
US EPA – United States Environmental Protection Agency
VFA(s) – volatile fatty acid(s)
WWT – wastewater treatment
WWTP(s) – wastewater treatment plant(s)