thesis presentation
TRANSCRIPT

Key Contributors to DealValue at AstraZeneca
Myriam de Grijs
2015

Project Aims
1. How competitive is AstraZeneca in ‘deal making’?
2. What factors contribute to deal value at AstraZeneca, and other leading biopharmaceutical companies?

Methodology
Data collection
Desk research
Interviews
Data analysis
- Deal volume
- Deal focus
- Deal spending
- Deal type, etc.
Tally and thematic analysis

Scope
Time frame: deals closed January 2014 – April 2015
Deal types included: acquisitions, business unit swaps, business unit acquisitions, asset(s) acquisitions, rights agreements for asset(s), licensing deals, option deals for asset(s), option deals for company, partnerships, research collaborations, clinical trial collaborations, and collaborations for the development and commercialization of asset(s)
Companies: top 15 biopharmaceuticals according to 2014 revenue
Findings
How competitive is AstraZeneca in ‘deal making’?

Deal volumeFigure 2: Total deal volumes, according to deal type.
.
2
3
1
2
1
4
1
11
2
2
3
4
1
1
4
1
1
1
1
1
1
2
3
2
4
4
8
3
7
5
2
5
2
2
2
8
4
3
3
9
2
1
2
2
3
3
3
3
1
3
2
2
2
1
2
2
1
3
10
8
8
1
2
1
2
1
1
3
1
2
0 5 10 15 20 25 30 35
Gilead Sciences (3)
Abbvie (3)
Teva (4)
Amgen (5)
Bayer (7)
GlaxoSmithKline (9)
Novartis (10)
Pfizer (12)
Lilly (12)
Sanofi (18)
Roche (20)
Johnson&Johnson (21)
Bristol-Myers Squibb (24)
Merck & Co. (24)
AstraZeneca (32)
acquisition of company or business unit
acquisition of asset(s) or rights to asset(s)
licensing agreement
preclinical research collaboration
partnership across various stages of development
clinical trial collaboration
option deal on asset(s)
option deal on company

Deal spending
$60.00
$251.00
$470.00
$525.00
$1,018.00
$1,336.00
$2,007.50
$3,002.50
$3,874.00
$4,552.25
$5,448.00
$9,609.75
$13,807.00
$16,518.00
$19,135.00
Amgen (1/5)
Lilly (6/12)
Gilead Sciences (1/3)
Abbvie (2/3)
Sanofi (5/18)
Bristol-Myers Squibb (9/24)
Johnson&Johnson (7/21)
Bayer (4/7)
Teva (4/4)
AstraZeneca (6/30)
GlaxoSmithKline (4/9)
Roche (8/20)
Merck & Co. (7/24)
Novartis (6/10)
Pfizer (8/12)
Figure 3: Total spending on ‘deal making’ in Millions.
Deal focus
on
colo
gy
end
ocr
ine
and
m
etab
olic
imm
un
olo
gy
and
in
flam
mat
ion
cen
tral
n
ervo
us
syst
em
card
iova
scu
lar
infe
ctio
us
and
va
ccin
es
resp
irat
ory
op
hth
alm
olo
gy
hae
mat
olo
gy
der
mat
olo
gy
wo
man
’s
Hea
lth
neg
lect
ed
tro
pic
al
dis
ease
s
tran
spla
nta
tio
n
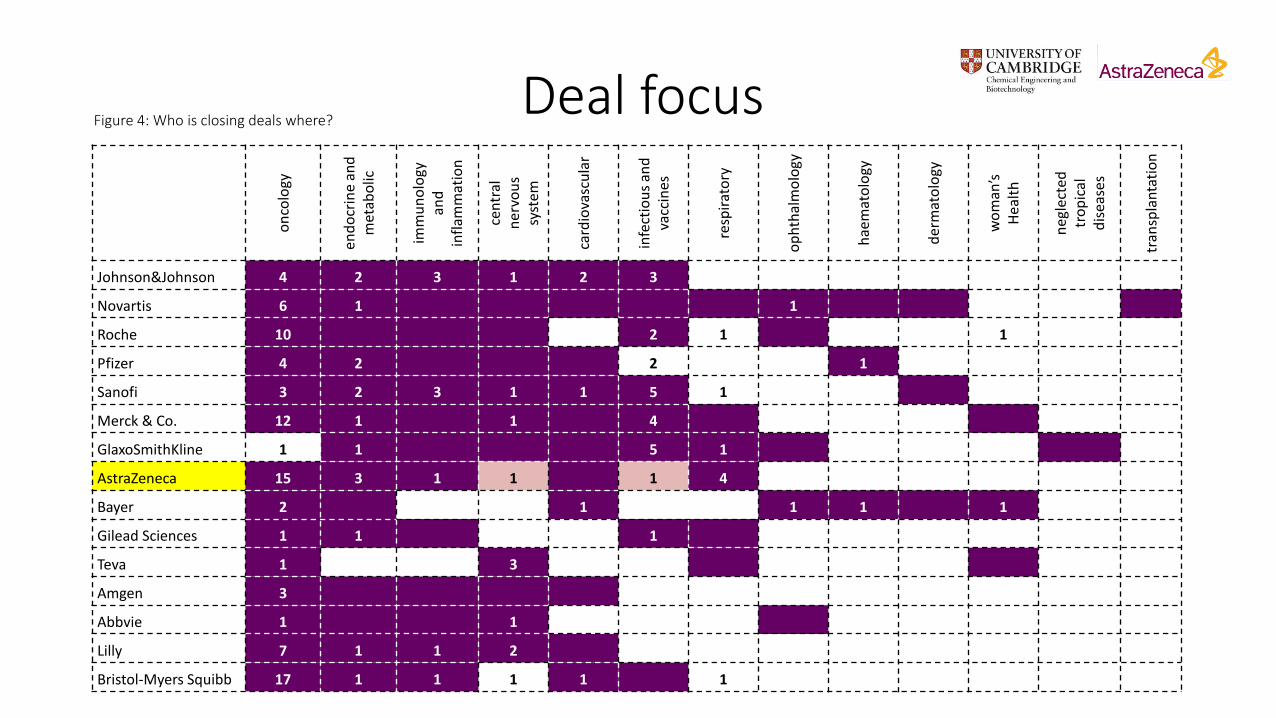
Johnson&Johnson 4 2 3 1 2 3
Novartis 6 1 1
Roche 10 2 1 1
Pfizer 4 2 2 1
Sanofi 3 2 3 1 1 5 1
Merck & Co. 12 1 1 4
GlaxoSmithKline 1 1 5 1
AstraZeneca 15 3 1 1 1 4
Bayer 2 1 1 1 1
Gilead Sciences 1 1 1
Teva 1 3
Amgen 3
Abbvie 1 1
Lilly 7 1 1 2
Bristol-Myers Squibb 17 1 1 1 1 1
Figure 4: Who is closing deals where?
Deal focus
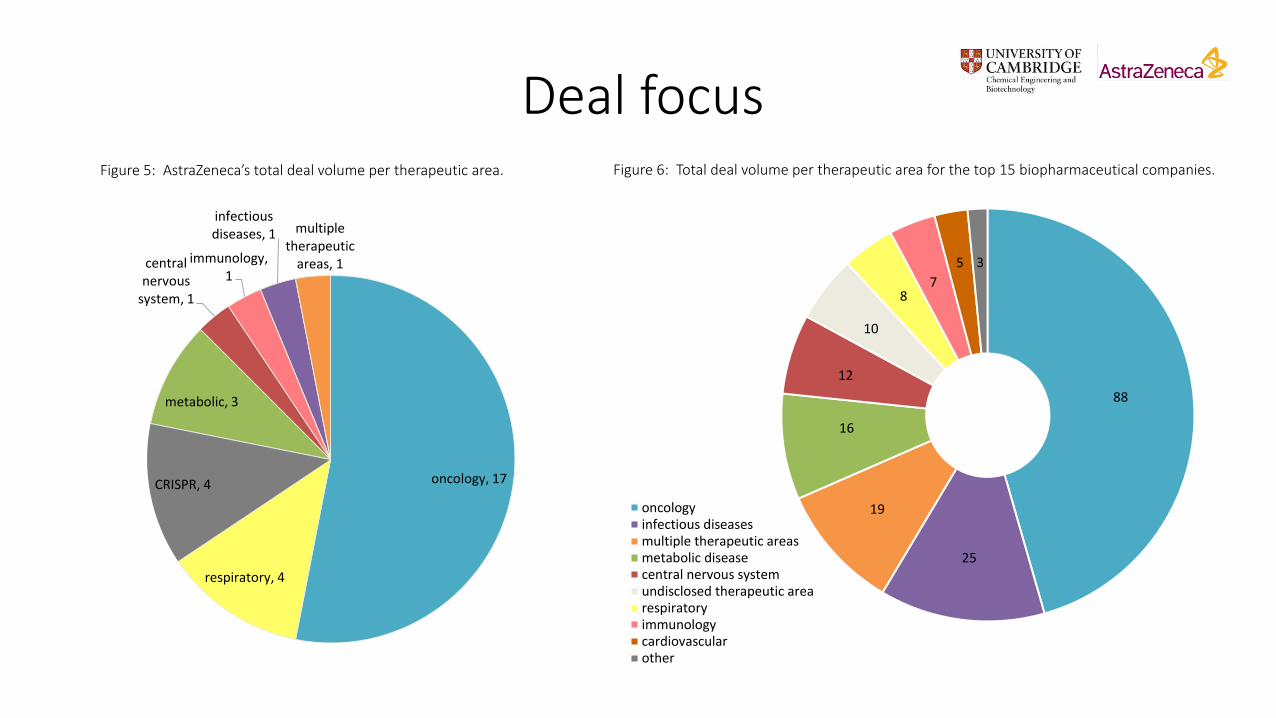
oncology, 17
respiratory, 4
CRISPR, 4
metabolic, 3
central nervous
system, 1
immunology, 1
infectious diseases, 1 multiple
therapeutic areas, 1
Figure 5: AstraZeneca’s total deal volume per therapeutic area.
88
25
19
16
12
10
87
5 3
oncologyinfectious diseasesmultiple therapeutic areasmetabolic diseasecentral nervous systemundisclosed therapeutic arearespiratoryimmunologycardiovascularother
Figure 6: Total deal volume per therapeutic area for the top 15 biopharmaceutical companies.

Benchmarking exerciseFigure 7: Graph depicting all licencing deals for preclinical oncology assets closed by the top 15 biopharmaceutical companies, for which the upfront values are publicly disclosed. The x-axis depicts the top 15 biopharmaceutical company, the partnering company and the modality of the asset(s).
$14.00 $20.00 $25.00 $27.00 $50.00 $60.00$125.00$76.00
$300.00
$530.00
$2,300.00
$298.00
$525.00 $575.00
$0.00
$500.00
$1,000.00
$1,500.00
$2,000.00
$2,500.00
Novartis AG AstraZeneca Plc Roche Holding AG Merck & Co., Inc. Bristol-Myers Squibb Co. Amgen Inc. Johnson & Johnson Inc.
Oxford BioMedica plc. Immunocore ltd. Curadev Pharma Privateltd.
Ablynx NV. CytomX Therapeutics,Inc.
Kite Pharma, Inc. MacroGenics, Inc.
CAR T-cells anti-CD3 antibodyfragment with high
affinity T-cell receptors
small-molecule bi- and tri-nanobodies probodies CAR T-cells humanized CD19 x CD3bispecific DART protein
Mill
ion
s
upfront payment potential royalties and/or milestones

Findings
What factors contribute to deal value at AstraZeneca,
and other leading biopharmaceutical companies?

Interviews
108
7
5
54
432
0
1
2
3
4
5
0 1 2 3 4 5 6 7
Men
tio
ns
by
exte
rnal
sta
keh
old
ers
(ou
t o
f fo
ur)
Mentions by AstraZeneca staff (out of six)
Oncology
Evolving deal types and structuring
Top three or nothing
Big pharma hesitant towards phase I/II/III assets
Pressure for deal flow
Modalities
Collaborations
Leadership
Pressure from Pfizer bid (AstraZeneca)
Orphan indications
Figure 8: Visual representation of themes identified as ‘key contributors to deal value at AstraZeneca’ by interviewees. The x-axis represents the number of times a theme was mentioned by AstraZeneca staff, the y-axis represents the number of times a theme was mentioned by external stakeholders, and the bubble size represents total number of times a theme was mentioned.

Phase of developmentFigure 9: Total deal volume closed by the top 15 biopharmaceutical companies, according to the asset(s) stage of development. Phase I clinical trial collaborations excluded.
Figure 10: Total deal volume closed by AstraZeneca, by asset(s) stage of development. Phase I clinical trial collaborations excluded.
109
10 6 717
28
no. of deals
18
21 1
3

Phase of development
$0.00
$50.00
$100.00
$150.00
$200.00
$250.00
$300.00
$350.00
preclinical ($37.14) phase I ($35.56)
phase II($22.50)
phase III($191.67)
approved and/orcommercialized
($90.00)
Mill
ion
sFigure 11: Licensing deals per development stage. Mean of upfront values paid per development stage in brackets (Millions). One data point represents the upfront value paid for one deal.

Conclusion
What factors contribute to deal value at AstraZeneca, and other leading biopharmaceutical companies?
Internal strategy and leadership
Properties of the asset AstraZeneca wishes to access
External pressures for performance
- Pascal Soriot- Science-led strategy- Oncology, respiratory and
metabolism

Conclusion
What factors contribute to deal value at AstraZeneca, and other leading biopharmaceutical companies?
Internal strategy and leadership
Properties of the asset AstraZeneca wishes to access
External pressures for performance
- Pfizer takeover- Shareholder and analyst
expectations- Top 3 or nothing

Conclusion
Internal strategy and leadership
Properties of the asset AstraZeneca wishes to access
External pressures for performance
What factors contribute to deal value at AstraZeneca, and other leading biopharmaceutical companies?
- Competition for a therapeutic area (demand vs supply)
- Development stage - Modality- Revenue stream- Multiple assets or a
single asset deal- Geographic location - Deal type and
structuring
Figure 12: Effect of geographic location onthe average pricing of an asset, in Millions
$1,086.77
$3,511.85
$80.93
$813.91
$2,763.43
$29.93$0.00
$500.00
$1,000.00
$1,500.00
$2,000.00
$2,500.00
$3,000.00
$3,500.00
$4,000.00
all deal types acquisitions ofcompany or
business unit
licensing deals
North America elsewhere

Based on the findings, what would this thesis recommend to AstraZeneca?- Carve out a clear strategy for each core therapeutic area
- Draw upon analysis presented in thesis as a starting point for future negotiations and valuations, e.g. figure 13 below.
Recommendations
Figure 13: Effect of deal type on deal structuring, based on all deals closed for preclinical stage oncology asset(s)closed by top 15 biopharmaceutical companies with full finances disclosed.
upfront payment (M) potential royalties and/or milestones (M)
acquisition of business unit or company $445.94 $502.50
47.02% 52.98%
collaboration $86.40 $866.80
9.06% 90.94%
licensing deal $45.86 $657.71
6.52% 93.48%

Questions