thesis report tk 142541 the influence of feed …
TRANSCRIPT

THESIS REPORT TK 142541
THE INFLUENCE OF FEED TEMPERATURE AND
STRIPPERS’ POSITION ON PRESSURE,
TEMPERATURE, MASS FLOW AND CONTROL OF
CRUDE DISTILLATION UNIT (CDU)
XAVIER CHIUAULA JÚNIOR
2313201801
ADVISORS
Prof. Ir. Renanto Handogo, MS., Ph.D.
Juwari, ST., M.Eng., Ph.D.
MASTER PROGRAM
TECHNOLOGY PROCESS
CHEMICAL ENGINEERING DEPARTMENT
FACULTY OF INDUSTRIAL TECHNOLOGY
INSTITUT TEKNOLOGI SEPULUH NOPEMBER
SURABAYA
2016


i
THE INFLUENCE OF FEED TEMPERATURE AND STRIPPERS’
POSITION ON PRESSURE, TEMPERATURE, MASS FLOW AND
CONTROL OF CRUDE DISTILLATION UNIT (CDU)
Student Name : Xavier Chiuaula Júnior
Student ID : 2313201801
Advisors : 1. Prof. Ir. Renanto Handogo, M.S., Ph.D.
2. Juwari Purwo Sutikno ST., M.Eng., Ph.D.
ABSTRACT
The crude distillation units are the first units used in oil refinery industry.
From distillation units, petroleum fractions such as naphtha, kerosene, diesel and
gas oil can be obtained for power supply and as feed in other industries. The aim of
this paper is to get the feed temperature and strippers position which can provide
highest profit in the refinery. Aspen Plus simulator was used to perform the
simulation. The temperature of furnace on Preflash column and strippers position
on the Pipestil column are the design variables. The quality of light ends, heavy
naphtha and diesel in the 95% ASTDMD86 was set constant at 130ᵒC, 190ᵒC and
222ᵒC respectively. The optimum condition was determined based on the maximum
profit and it happened when the temperature in the furnace of preflash column was
345ᵒC while strippers’ position on pipestil was at S1p.5-4, S2p.14-13 and S3p.19-
18 with a profit of USD54.93/m³. No significant changes was found on CDU profile
when the feed temperature or stripper position was changed. The deviation that
occurred was normal, therefore CDU operation was satisfying for all cases.
Keyword: Crude Distillation Unit (CDU), Stripper position, Optimization

iv
PREFACE
All honor and glory be to the King Jesus Christ for His grace that made
possible to start and finish the compilation of this report entitled “The influence of
Feed temperature and Strippers’ Position on Temperature, pressure and Mass
Flow in each Stage of Crude Distillation Unit CDU”. For the realization of this
thesis the author also acknowledges some individuals who directly or indirectly
provided their assistance, namely:
1. Prof. Dr. Renanto Handogo, MS, Ph.D., as the Coordinator of the
Graduate Program in Chemical Engineering FTI -. ITS, Supervisor I and
as Head of Planning and Process Control Laboratory and Mr. Juwari
Purwo Sutikno St M Eng., Ph.D. as Supervisor II for their guidance and
instructions;
2. Mr. and Mrs. Teachers and staff of the Department of Chemical
Engineering FTI-ITS;
3. The Indonesian Ministries of Developing Countries (KNB) thanks for all
financial help given during the study;
4. My parents, family and friends who supported me in prayer and love.
Finally, I hope that this thesis report be useful now and in the future. The author
recognizes there is deficiency in writing so suggestions and positive criticism
from the readers are welcome.
Surabaya, August 07th 2016
The Author:
ii
TABLE CONTENTS
ENDORSEMENT PAGE
ABSTRACT ............................................................................................................. ..i
TABLE CONTENTS ............................................................................................... .ii
PREFACE………………………………………………………………..…........…iv
LIST OF FIGURES ................................................................................................. .v
LIST OF TABLES ................................................................................................... .vi
LIST OF SYMBOLS ............................................................................................... vii
CHAPTER 1 INTRODUCTION
1.1 Background ..................................................................................... I-1
1.2 Problem formulation ....................................................................... I-3
1.3 Research scope ............................................................................... I-3
1.4 Research objective .......................................................................... I-3
1.5 Research benefits ............................................................................ I-3
CHAPTER 2 LITERATURE REVIEW
2.1 Optimization of CDU ..................................................................... II-1
2.2 Description of crude oil distillation process(CDU) ........................ II-2
2.2.1 The striping type design .............................................................. II-3
2.2.2 The installation of preflash drum ................................................ II-4
2.2.3 The installation of preflash column ............................................. II-5
2.2.4 Product from CDU ...................................................................... II-6
2.2.5 Variables of the CDU .................................................................. II-7
2.2.6 Mathematical modeling .............................................................. II-8
2.3 Software Aspen Plus ....................................................................... II-11
2.3.1 Thermodynamic model ............................................................... II-11
CHAPTER 3 RESEARCH METHODOLOGY
3.1 Research stages .............................................................................. III-1
3.2 Collection and processing data ....................................................... III-2
3.3 Research variables .......................................................................... III-3
3.4 Generating assay data of crude oil in Aspen Plus.. ........................ III-4
iii
3.5 Design model PFD steady state to define the base case ................. .III-4
3.6 Simulation the PFD over temperature variation in the preflash furnace
and strippers position ................................................................................ .III-5
3.7 Economic analysis…………………………………………………..III-5
3.8 Optimization……..………………………………………………….III-6
3.9 Dynamic simulation of PFD based on optimum case..….....……….III-7
3.10 Investigation of temperature, pressure and mass flow on CDU........III-9
CHAPTER 4 RESULTS AND DISCUSSIONS
4.1 Generating essay data of crude oil in Aspen Plus simulator………….IV-1
4.2 Design model PFD steady state to define the base case..…………......IV-2
4.2.1 Steady state simulation of the PFD over temperature variation in the
preflas hfurnace…...……………………………………………….……...IV-5
4.2.2 Simulation of PFD over variation of strippers position on pipestil
column…………………………………………………………………….IV-7
4.3 Economic analysis…………………………………………………….IV-9
4.4 Dynamic simulation based on optimum cas 2……………………….IV-12
4.5 Analysis of the influence of feed temperature and strippers position on
CDU profile…..…………………………………………………………IV-13
4.5.1 The influence of feed temperatur on temperature profile of
CDU……………………………………………………………………...IV-13
4.5.2 The influence of feed temperature on pressure profile of CDU…IV-15
4.5.3 The influence of feed temperatur on mass and vapor flow profile of
CDU………………….………………………………………………….IV-15
4.5.4 The influence of strippers’ position on temperature profile of
CDU……………………………………………………………………..IV-17
4.6 Dynamic simulation result…………………………………………….IV-19
CHAPTER 5 CONCLUSION AND RECOMMENDATION
5.1 Conclusion ..................................................................................... ...V-1
5.2 Recommendation ........................................................................... ...V-2
REFERENCE
APPENDIX
BIOS AUTHOR

v
LIST OF FIGURES
Figure 2.1 Pipestil column ............................................................................... II-3
Figure 2.2 Stripping type column..................................................................... II-4
Figure 2.3 Preflash drum and pipestil configuration ........................................ II-5
Figure 2.4 Preflash column and pipestil configuration .................................... II-6
Figure 2.5 Scheme of a column stage .............................................................. II-9
Figure 3.1 Research flow diagram………………….………………………..III-1
Figure 3.2 TBP curve from essay data of blended crude oil…………………III-2
Figure 3.3 Crude distillation unit………………………………………….... III-3
Figure 4.1 Comparison of TBP curve from laboratorium data with that generated
from using Aspen Plus …………………………………..…………………...IV-1
Figure 4.2 PFD of the base case simulation according to Luyben, 2013…….IV-3
Figure 4.3 TBP curve of blanding crude oil and base case RESIDUE1...…..IV-5
Figure 4.4 PFD from dynamic simulation according to Luyben, 2013……..IV-13
Figure 4.5 Profile of temperature on preflash column……..………………..IV-14
Figure 4.6 Profile of temperature on pipestil column………………………IV-14
Figure 4.7 Profile of pressure on preflash and pipestil column…..………....IV-15
Figure 4.8 Profile of liquid and vapor flow on each preflash trays.……..…IV-16
Figure 4.9 Profile of liquid and vapor flow on each pipestil trays.….…..…IV-16
Figure 4.10 Ratio between liquid living and vapor arriving on each CDU
trays…………………………………………………………………….……IV-18
Figure 4.11a Temperature profile of pipestil pipestil column…………….IV-19
Figure 4.11b Pressure profile of pipestil column……………………………IV-19
Figure 4.11c Profile of liquid and vapor flow on each pipestil trays.….…..IV-19
Figure 4.11d Profile of temperature on each pipestil trays.………….....…..IV-19
Figure 4.12 Behavior of CDU products flow…………………………….…IV-21
Figure 4.13 Temperatur controlers.………………………………………….IV-22
vi
LIST OF TABLES
Table 2.1 CDU product………………………………………………………....II-7
Table 3.1 Assay data of blending oil (40.57 ᵒAPI)………………….…………III-2
Table 3.2 Design variable for the base case simulation .................................. .III-4
Table 3.3 Base case column characteristics..……... …………….…………….III-5
Table 3.4 Flow control characteristics………………………………………IIIV-7
Table 3.5 Temperature control characteristics………………………………IIIV-8
Table 3.6 Pressure control characteristics…………………………………...IIIV-8
Table 3.7 Level control characteristics……………………………………...IIIV-8
Table 4.1 Estimated initial composition of crude oil……………….………….IV-2
Table 4.2 Result from steady state simulation of base case .....…….…………IV-3
Table 4.3 Results from the simulation over temperature variation in the preflash
furnace…………………………………………………………………………IV-6
Table 4.4 Results from the steady state simulation over variation of strippers
positions on pipestil column …………………………………………………..IV-7
Table 4.5 Crude oil purchase cost………………..… ………………………...IV-9
Table 4.6 Product sales for simulation over temperature variariation in the
preflash furnace………………………………………………………………IV-10
Table 4.7 Cost of furnace heat duty for simulation over temperature variariation in
the preflash furnace…………………………………………………………..IV-10
Table 4.8 Results from profit comparison for simulation over temperature
variariation in the preflash furnace…………………………………………...IV-10
Table 4.9 Product sales for simulation over variation of strippers position on
pipestil column……………………………………………………………….IV-11
Table 4.10 Cost of furnace heat duty for simulation over variation of strippers
position on pipestil column…………………………………………………...IV-12
Table 4.11 Results from profit comparison for simulation over variation of
strippers position on pipestil column…………………………………………IV-12
Table 4.12 Base case 2 side draw product specification………………..……IV-20
Table 4.13 Optimum case 2 side draw product specification……..…….……IV-20
Table 4.14 Integral of the time –weighted absolute error (ITAE)……………IV-24

vii
LIST OF SYMBOLS
Symbol Observation Unit
CDU Crude distillation unit -
FiL Feed mole flow of liquid from stage i Kmol/hr
Fv(i-1) Feed mole flow of vapor from stage i Kmol/hr
Li Liquid flow from stage i Kg/hr
Vi Vapor flow from stage i Kg/hr
Si The mole flow stripper product from stage i Kmol/hr
Hi Enthalpy of vapor from stage i J/kmol
hi Enthalpy of liquid from stage i J/kmol
ki Vapor-liquid equilibrium ratio -
HL Liquid hold up m3
Aai Active area of stage i m2
Adi Downcomer area of stage i m2
FL Liquid rate m3/s
lw Weir length m
CS Chao-Seader -
w Acentric factor -
(ho h) Enthalpy departure or residual enthaply J/kmol
(ho-h)o Simple fluid term or first order enthalpy departure J/kmol
(h h)1 The correction term or second order enthalpy departure J/kmol
vo Liquid fugacity coefficient of pure component -
V(o) Simple fugacity coefficient of fluid in the liquid state -
V(1) Fugacity coefficient correction factor -
Ø Fugacity coeficient of the vapor phase -
γ Activity coefficient -
δ Solubility parameter -

viii
Symbol Observation Unit
δm Solubility parameter for mixture -
ΔEv Vaporization energy J/kmol
Cs Steam supply cost US$/m3
CG Total variable cost of raising steam US$/Kg
Vcrude Volume of crude oil m3/hr
Ms Mass of steam Kg/hr
CF Steam fuel cost US$/Kg
ɑF Fuel cost US$/Kj
ȠB Overall boiler efficiency -
Hs Enthalpy of steam Kj/kg
hw Enthalpy of boiler feedwater Kj/Kg
CPH Cost of preheater heat US$/m3
EPH Energy required in preheater Kj/hr
λS Latent heat Kj/Kg
Cfi Furnace heat supply cost US$/m3
Efi Energy required in furnace Kj/hr
Bf Furnace fuel cost US$/Kj
LHVg Fuel low heating value Kj/kg
CO Blending crude oil purchase cost US$/m3
COi Individual crude oil purchase cost US$/m3
SP Total product sales US$/m3
SPi Individual product sale US$/m3
K Profit US$/m3
PF Preflash furnace
ix
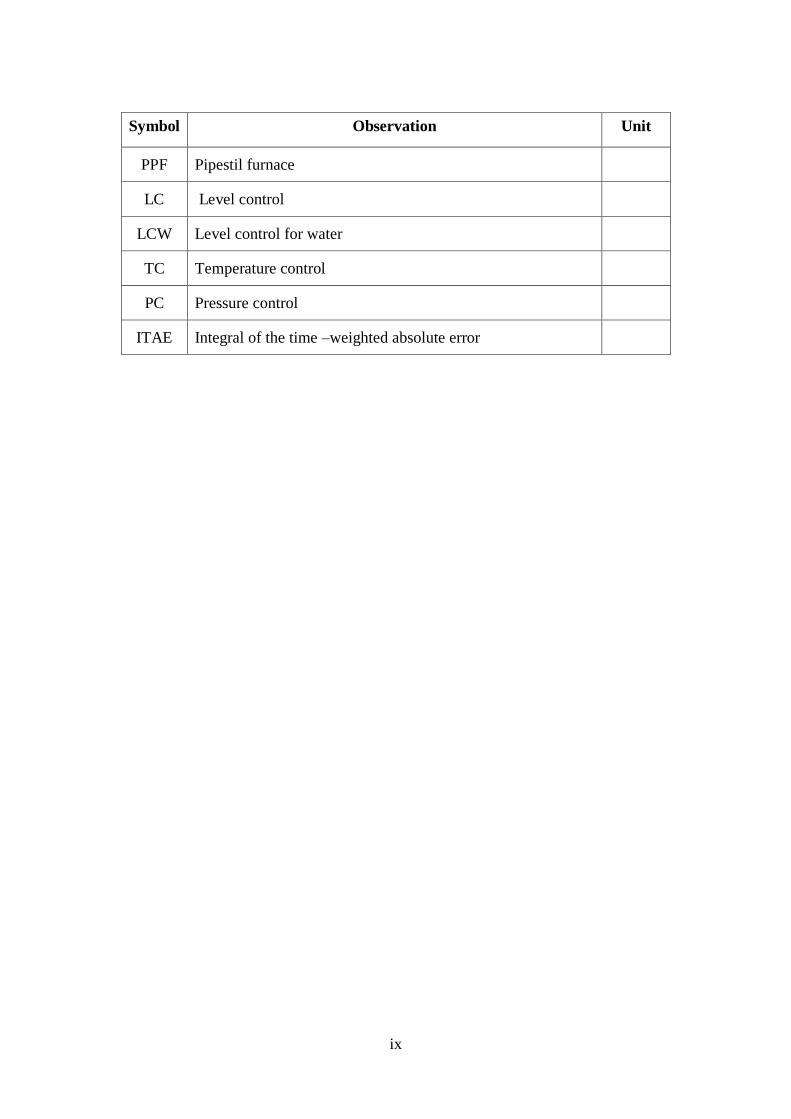
Symbol Observation Unit
PPF Pipestil furnace
LC Level control
LCW Level control for water
TC Temperature control
PC Pressure control
ITAE Integral of the time –weighted absolute error

x
(This page is intentionally left in blank)

I-1
CHAPTER 1
INTRODUCTION
1.1 Background
Oil refinery is an industrial plant where crude oil is processed and refined
into more useful products such as liquefied petroleum gases, petroleum naphtha,
gasoline, diesel fuel, asphalt, heating oil and kerosene. Early refinery were
predominantly distillation units, in 1861 kerosene, naphtha and tar was produced
by atmospheric distillation process involving a simple batch distillation of crude oil
with the objective of maximizing a kerosene production. In 1930 it was somehow
more complex because cracking and cooking unit started to appear but was still
essentially a distillation unit (Speight, 2011).
Nowdays the refinery is much more complex operation than the last 120
years, the process is normally based on distillation process using atmospheric or
vacuum distillation column. Watkins (1979) described the crude fractions in three
types - A, R and U which are characterized by their reflux, pump-back reflux,
pump-around reflux and top reflux respectively. The product from distillation
process goes to the conversion process where it will be resized and change their
structure using various processes as thermal catalytic reforming which according to
Simanszhenkov and Idem (2003) the temperatures of 510-565oC are employed in
the presence of hydrogen and moderate pressures to obtain gasoline with octane
number of 70 to 80 from heavy naphtha having octane number of 40. In the
alkylation process the benzene contained in the gasoline produced by thermal
cracking process are removed and Muraza (2015) in his work removed the benzene
from gasoline by alkylation using zeolite catalyst. The treatment process follows
the conversion process and its aim is to prepare hydrocarbon fractions for further
processing and transform it into the final product. The sulfur removing is an
example, Yahaya et al. (2013) in their research removed sulfur compounds in diesel
cut by using n-butyl-3-methyl pyridinium methylsufate as a supported ionic liquid
membrane. Finally the formulation and mixing processes are carried out where
fractionated hydrocarbons are mixture and some additives are added to obtain a
I-2
determined product specification. Kirgina (2014) developed the recipe which used
reformate, izomerizate, catalytic cracking gasoline, alkylate, isopentane and MTBE
to obtain blended gasoline. Since the residue from this unit is still containing many
solar fractions to maximize oil recovery an additional processing is carried out
using a vacuum distillation unit (VDU). This is done because the residue consists
of components with high boiling point, so that when it is processed through
atmospheric distillation, most of the residue will undergo cracking due to the higher
temperature required. Optimization in the operating conditions of CDU is required
to achieve better economic benefits. In order to shift the production towards those
distillates which carry added incentives for the refiners, optimization and instant
rectification of the processing conditions are required. The quality of products
needs to be analyzed by rigorous monitoring of the feed, Bagawejewcz (1997)
studied about effect of pump-arounds and steam in CDU, Viswanathan (1993)
found the optimum locations of trays feed for multiple feeds by maintain fix the
entering reflux tray and entering location of the boilup, Seo et al. (2000) also in his
work found an optimum feed tray with annual cost of $9.185.230 by considering
the energy consumption, operating cost and annual cost as objective functions.
Handogo (2011) obtained optimum feed temperature of 533K, the design variable
was the temperature of preflash column the optimum condition was found by
considering a maximum profit ($7.74/m3), Hossein, et al. (2013) studied about the
liquid weeping and the hydrodynamic behavior of a column equipped with the
circular sieve trays and Malvin (2014) developed a three-dimensional
computational fluid dynamic to characterize flow regimes in a sieve by considering
the pressure drop between trays and weep reflux.
The previous literature acknowledge that great progress has been achieved
in this issue, especially the relationship between the feed temperature, energy
recovery through the pump-around and the cost for all operational processes but
still have lack of data of relation between these listed factor with the stripper
position on CDU, which is the aim of this research. The design variable for this
research is the feed temperature of preflash column and the strippers’ position on
pipestil column. CDU profile is examined in order to determine the condition that

I-3
better influence it, by considering the 95% liquid volume ASTM D86 of products
and profit.
1.2 Problem formulation
The central question of this research is about how the feed temperature
and stripper position may influence the pressure, temperature and mass flow in each
stage of crude distillation unit(CDU) maintaining the quality of 95% liquid volume
ASTM D86 of. This research was chosen to increase the data of factor that influence
the operation of CDU.
1.3 Research scope
This research has the following scope and limits:
1. The system under study is the CDU, from which the
specified data of the feed will be extracted;
2. The simulation will be run in Aspen Plus V7.3 simulator;
3. The feed temperature and stripper position that better influence the
pressure, temperature and mass flow in each stage of CDU will be found by
comparing the advantages and objectives of this research.
1.4 Research Objective
The objective of this research is to determine the feed temperature and
strippers’ position which has a better influence on the pressure, temperature and
mass flow of each stage into the crude distillation unit, in order to obtain a product
according to the specification and with high profit.
1.5 Research benefits
This research will help to:
1. Understand the crude distillation unit(CDU);
2. Understand how the feed temperature and stripper position influence the
pressure, temperature and mass flow in each stage into the CDU in order
to obtain a product according to the specifications.

I-4
3. Get the feed temperature and stripper position that better influence the
pressure, temperature and mass flow in each stage into the CDU in order
to obtain a product according to the specifications.

II-1
CHAPTER 2
LITERATURE REVIEW
2.1 Optimization of CDU
The optimization tasks consist of finding the best solution for a given
process, applying mathematical results and numerical techniques to the process in
study. Ravindran et al. (2006) said that it is necessary to clearly delineate the
boundaries of the system to be optimized, to define the quantitative criterion on the
basis of witch candidates will be ranked to determine the best, to select the system
variables that will be used to characterize or identify candidates, and to define a
model that will express how the variables are related.
Optimization of crude CDU becomes more and more important case of
study due to the ecological requirements and high energy costs. Optimization of
CDU has been presented by various academic contributions especially in CO2
remover and heat exchanger network and most of them were using computer
simulaion. Gandalla (2013) in his work, optimization based on retrofit approach for
revamping an Egyptian CDU was performed by changing the column operating
conditions like pumparound flow rates, reflux ratio, stripping steam rate and
temperature across the pumparounds to reduce the energy consumption. Oni (2014)
improved a performance of an existing CDU increasing 4% of its initial overall
energy by using process simulation techniques and combined exergy and retrofit
methods to show what the process is capable to achieve under considerable expense
on the required capital investment. Recently, Luo (2015) in his paper shows a
systematic optimization approach produces a maximum annual economic benefit
of an existing crude oil distillation system by considering product output value and
energy consumption simultaneously.
2.2 Description of crude oil distillation process in CDU
In the processing of crude oil, CDU is the first unit and i t aims to separate
the mixture into various fractions such as naphtha, kerosene, diesel, atmospheric
gas oil and residue depending on their boiling points and each fraction can then be

II-2
moved to other refinery units. CDU is known as an atmospheric distillation
unit and it operates at pressures slightly above atmospheric pressure.
Table 2.1 CDU product
Cut Product End point (oC)
1 Off gas 10
2 Light straight run naphtha 70
3 Naphtha 180
4 Kerosene 240
5 Light diesel 290
6 Heavy diesel 340
7 Atm. Gas oil 370
8 Vacuum gas oil 390
9 Vacuum distillate 550
10 Vacuum residue -
Source: Fahim et al., 2010
Crude oil contains dissolved salts as a piece of composition and to prevent
equipment damage, the oil is desalted and liquefied before heading to the CDU.
Within the desalter, the crude oil is mixed with water in order to dissolve the salt
contained in the crude oil, then the salty water is separated and the amount of water
which is left in the crude oil is called diluted water. The desalted crude oil is
preheated in a heat exchanger and follows to the furnace where it is reheated to
about 340372ᵒC to promote a partial evaporation before entering in the main
column.
The column usually has 25 to 35 stages, 2 or 3 pumparounds which have
the function to ensure the reflux inside the column and Oh (2000) said that
pumparounds is one of the ways to change temperature profile. It has also one
condenser and three side streams for kerosene, diesel and atmospheric gas oil
productions. To obtain a clear separation, strippers are coupled on the main column
in every side stream, the strippers are fed with steam from the bottom in order
to vaporize lifted light components. By using steam to stripping the main column
and stripper columns an inexpensive separation process can be achieved, note that
reboilers are avoided into the CDU. Bagajewics (1997) also said that the usage of
reboiler in the main fractionation column and side-strippers as opposed to the steam
II-3
injection has been ruled out due to the high temperatures needed for a certain degree
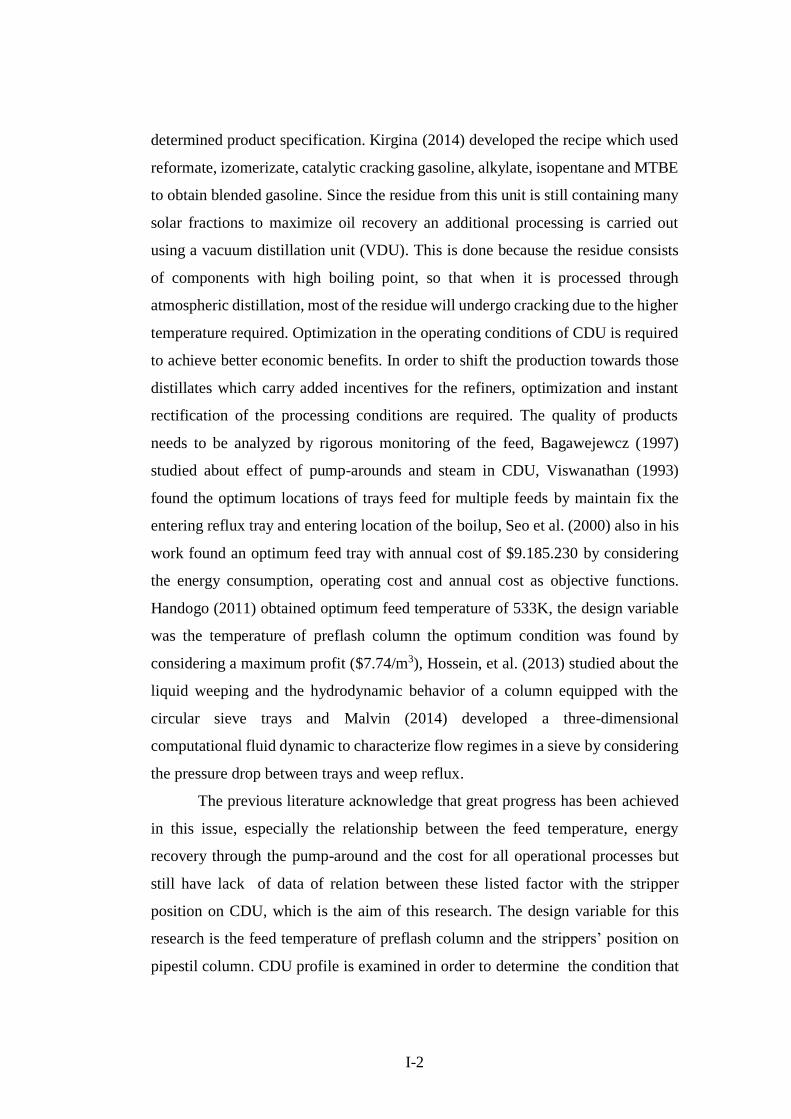
of separation. After partial vaporization, the oil goes into the pipestil flash zone
and produces heavy naphtha as distilled, residue as bottom product and kerosene,
diesel and atmospheric gas oil as side-stream product (Figure 2.1).
Furnace
Sour water
Desalter
HE
Water
Naphtha
Steam
Kerosene
Steam
Diessel
Steam
Gas oil
Pump-around 1
Pump-around 2
Residue
Crude oil
Steam
Figure 2.1 Pipestil column configuration according to Bagajewics (1997)
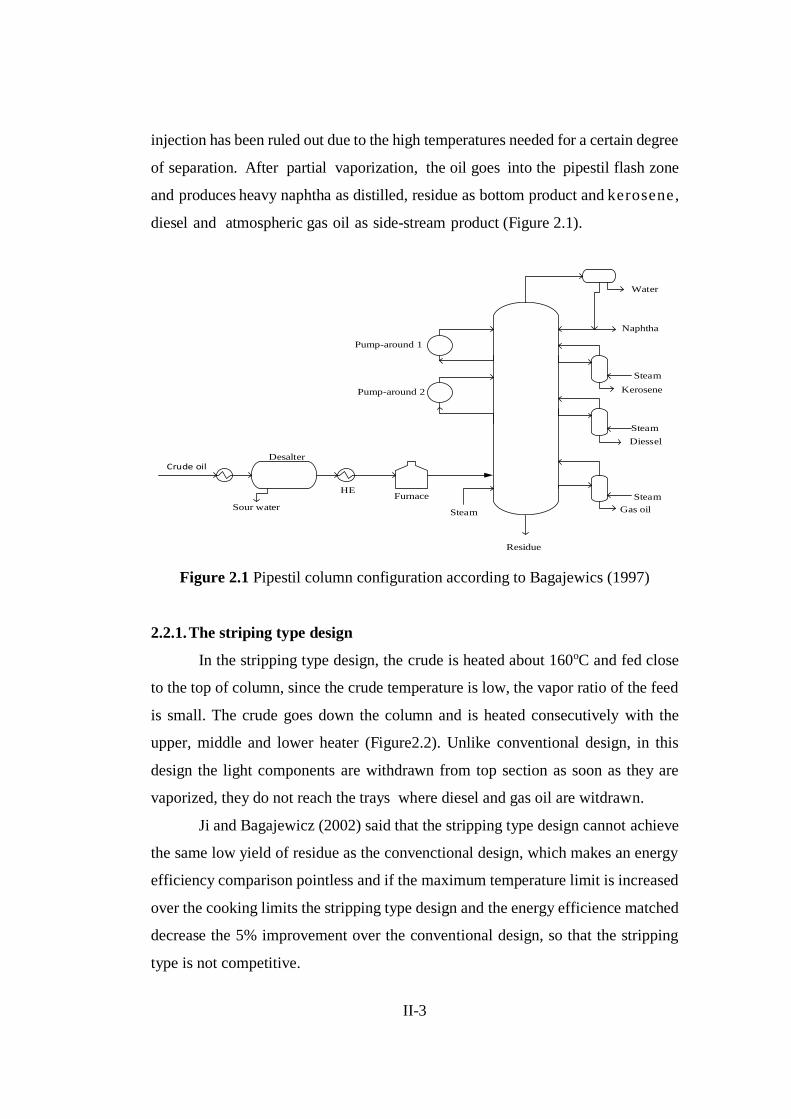
2.2.1. The striping type design
In the stripping type design, the crude is heated about 160oC and fed close
to the top of column, since the crude temperature is low, the vapor ratio of the feed
is small. The crude goes down the column and is heated consecutively with the
upper, middle and lower heater (Figure2.2). Unlike conventional design, in this
design the light components are withdrawn from top section as soon as they are
vaporized, they do not reach the trays where diesel and gas oil are witdrawn.
Ji and Bagajewicz (2002) said that the stripping type design cannot achieve
the same low yield of residue as the convenctional design, which makes an energy
efficiency comparison pointless and if the maximum temperature limit is increased
over the cooking limits the stripping type design and the energy efficience matched
decrease the 5% improvement over the conventional design, so that the stripping
type is not competitive.
II-4
Water
Naphtha
Steam
Kerosene
Steam
Diessel
Steam
Gas oil
Heater
Upper heater
Residue
Middle heater
Lower heater
Crude oil
Steam
Figure 2.2 Stripping type column from Ji and Bagajewics, 2002
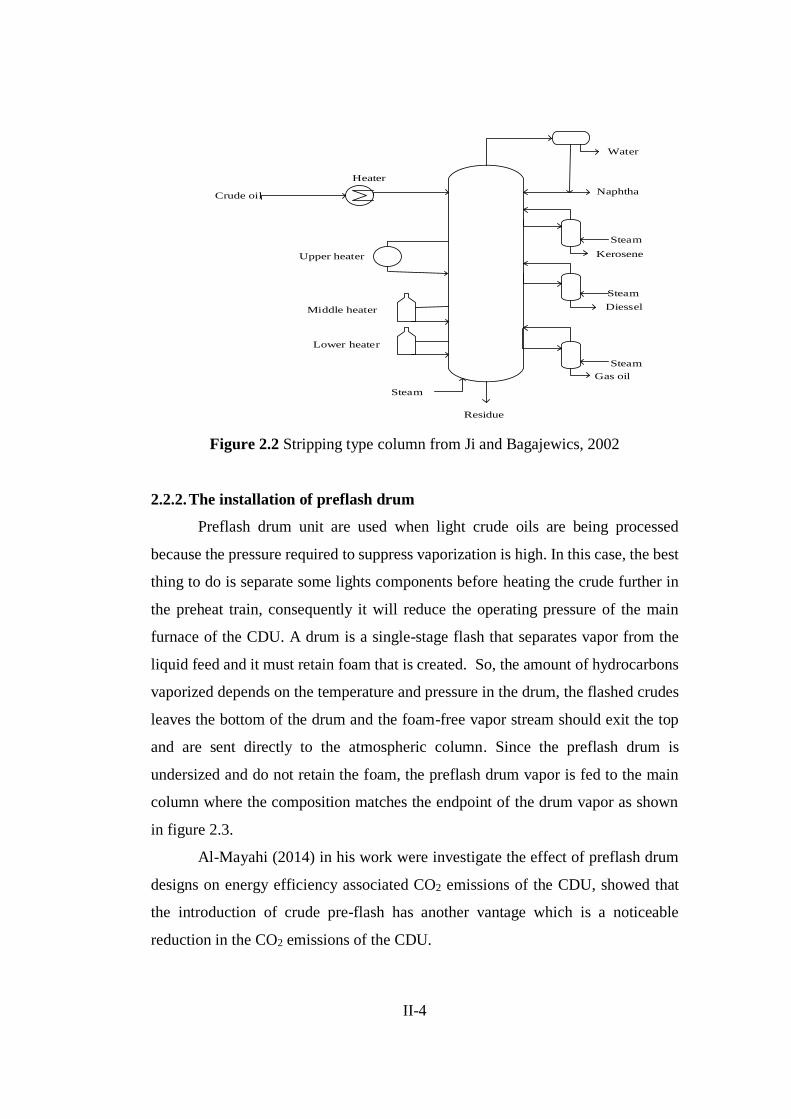
2.2.2. The installation of preflash drum
Preflash drum unit are used when light crude oils are being processed
because the pressure required to suppress vaporization is high. In this case, the best
thing to do is separate some lights components before heating the crude further in
the preheat train, consequently it will reduce the operating pressure of the main
furnace of the CDU. A drum is a single-stage flash that separates vapor from the
liquid feed and it must retain foam that is created. So, the amount of hydrocarbons
vaporized depends on the temperature and pressure in the drum, the flashed crudes
leaves the bottom of the drum and the foam-free vapor stream should exit the top
and are sent directly to the atmospheric column. Since the preflash drum is
undersized and do not retain the foam, the preflash drum vapor is fed to the main
column where the composition matches the endpoint of the drum vapor as shown
in figure 2.3.
Al-Mayahi (2014) in his work were investigate the effect of preflash drum
designs on energy efficiency associated CO2 emissions of the CDU, showed that
the introduction of crude pre-flash has another vantage which is a noticeable
reduction in the CO2 emissions of the CDU.

II-5
Crude oil
Furnace
Sour water
Desalter
HE
Water
Naphtha
Steam
Kerosene
Steam
Diessel
Steam
Gas oil
Pump-around 1
Pump-around 2
Residue
Steam
Figure 2.3 Preflash drum and Pipestil configuration from Al-Mayahi, 2014
2.2.3. The installation of preflash column
Pre-fractionation columns use trays and reflux to fractionate overhead
product from side-draw or bottom product streams. Unlike preflash drum where the
components in the light naphtha range are condensed in the condenser of the main
column, this column has their own overhead condenser where those components in
the light naphtha range are condensed in, and heavy naphtha are condensed in the
condenser of the main tower.

II-6
Crude oil
Furnace
Sour water
Desalter
HE
Water
Naphtha
Steam
Kerosene
Steam
Diessel
Steam
Gas oil
Pump-around 1
Pump-around 2
Residue
Furnace
HEHE
Light naphtha
Light
Steam
Figure 2.4 Preflash column and Pipestil configuration
The residue from Pipestil contain a significant amount of valuables oil that
cannot be distillated at atmospheric pressure because the temperature needed to
proceed the separation is so high and thermal cracking can takes place. Pujado &
David (2006) said that at atmospheric condition to achieve any meaningful degree
of vaporization the flash zone temperature would be extremely high (in excess of
482oC) to break or cracking. Wauquier (1998) stated that the reduce oil is heated in
a furnace at a maximum temperature of some 380 to 415oC or from 365 to 400oC
at the column inlet after isenthalpic flash along the transfer line, and fed into the
vacuum distillation column.
2.2.4. Variables of the CDU
Flash zone temperature - The temperature of the flash zone is set
so that a certain required amount of feed is flashed, and the higher the
temperature, the m o r e top product and the lower bottom product, but this
should not be greater than the allowed t e m p e r a t u r e because i t can cause
thermal decomposition (cracking) of the oil.
Top column pressure - The pressure at the top is fixed by the designer,
selected based on the available average condensation temperature in the condenser
and there will be also the difference between the bottom pressure and the trays
II-7
column pressure drop. The pressure depends on vapor pressure of the liquid at
the bottom of the column, which in turn also depends on the temperature of
the bottom column, if the temperature increases the vapor pressure of the liquid
will increase and consequently the column pressure and the temperature for
each tray will increase.
Top temperature column - The top temperature is one of the indicators
of naphtha end point, this should be high enough so that the top product wi l l
evaporate completely. If the temperature is higher, so many heavy components
(unwanted) also will be vaporized and will be in the top product, but if the
temperature is lower certain amount of desired product is condensed. If there
are product side draw, those amount of condensed product will be incorporated.
According to Fahim ( 2010), the top temperature must be controlled to be
14 17ᵒC higher than the dew point temperature for the water at the column
overhead pressure so that at liquid water is condensed, this is to prevent corrosion
due to the hydrogen chloride dissolved in liquid water.
Stripping stream - In the CDU, stripping steam is used to remove
lights ends embedded in sidedraw products, in order to obtain product w i t h
a maximum purity in an inexpensive separation process that is why the use of
reboilers in stripper is replaced by steam.
The steam when it comes in contact with the oil fraction, reduces their
partial pressure of vaporization, what will allow the unwanted dissolved
hydrocarbons b e vaporized at low temperatures. The steam can also be
introduced starting from the bottom of the main column with the same purpose
as mentioned above which is removing light components dissolved in heavy
petroleum fractions.
2.2.5. Mathematical modeling
As for binary systems, t h e calculation of equilibrium stages of a
multicomponent distillation process is performed by the normal procedure which

II-8
is the resolution of the MESH equations step by step. Mass balance, energy and
vapor-liquid equilibrium can be written for each component or pseudo-
components present in the mixture as well as an overall ba lance for the entire
column or for each stage. But as before reported by Saraf (2001) said that from
a practical point o f view, it is not possible to represent the feed crude oil
distillation or its products in terms of current component flow rates or mole
fractions since crude oil is a mixture of several hundred constituents that are not
easy to analyze. The Generally Accepted practice is to express composition of
crude oil in terms of a finite number of pseudo-components. Each pseudo-
component is treated as a single component, is in fact a complex mixture of
hydrocarbons with a range of boiling points within the narrow region say 25 ᵒC
wide.
Ti Stage i
Pi
Vi
V(i+1)Li
Si˅
Siᶫ Fiᶫ
F˅ (i+1)
L(i-1)
Figure 2.5 Scheme of a column stage
Mass balance
𝐿(𝑖−1) + 𝑉(𝑖+1) + 𝐹𝑖𝐿 + 𝐹(𝑖+1)
𝑉 = 𝐿𝑖 + 𝑉𝑖 + 𝑆𝑖 (1)
Component balance
𝐿(𝑖−1)𝑥(𝑖−1)𝑗 + 𝑉(𝑖+1)𝑦(𝑖+1)𝑗 + 𝐹𝑖𝐿𝑥𝑖𝑗 + 𝐹(𝑖−1)
𝑉 𝑦𝑖𝑗 = 𝐿𝑖𝑥𝑖𝑗 + 𝑉𝑖𝑦𝑖𝑗 + 𝑆𝑖𝑥𝑖𝑗 (2)
II-9
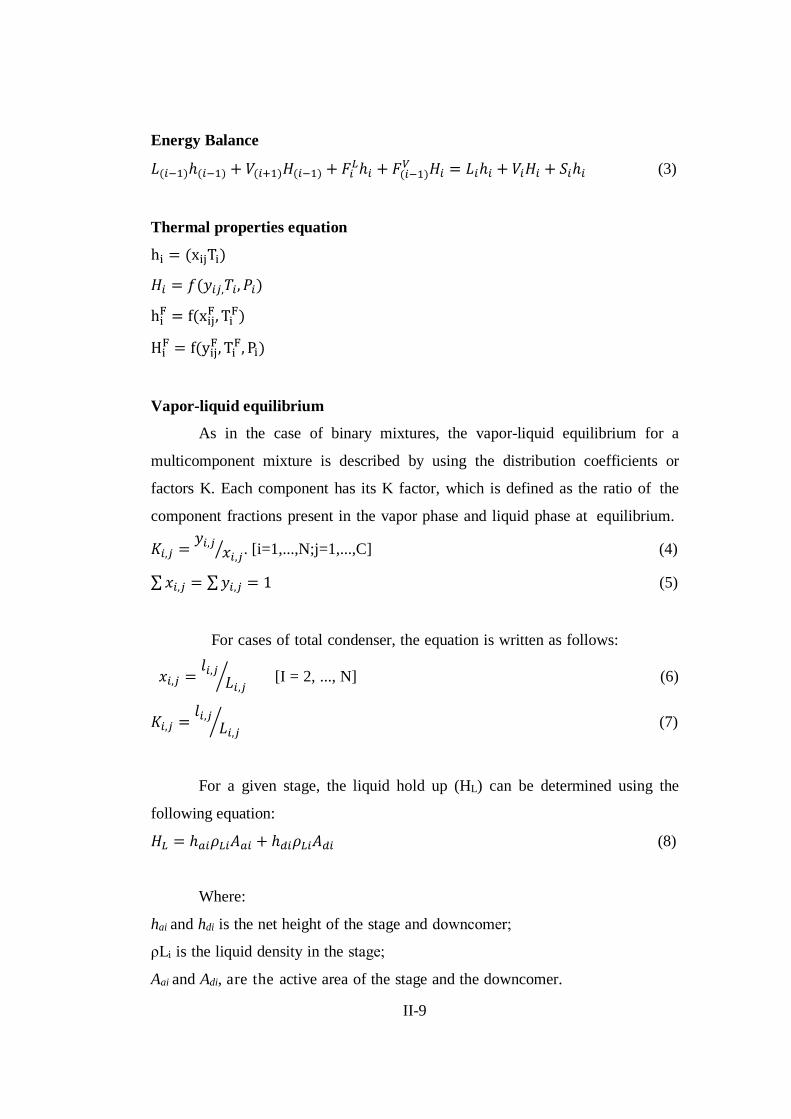
Energy Balance
𝐿(𝑖−1)ℎ(𝑖−1) + 𝑉(𝑖+1)𝐻(𝑖−1) + 𝐹𝑖𝐿ℎ𝑖 + 𝐹(𝑖−1)
𝑉 𝐻𝑖 = 𝐿𝑖ℎ𝑖 + 𝑉𝑖𝐻𝑖 + 𝑆𝑖ℎ𝑖 (3)
Thermal properties equation
hi = (xijTi)
𝐻𝑖 = 𝑓(𝑦𝑖𝑗,𝑇𝑖, 𝑃𝑖)
hiF = f(xij
F, TiF)
HiF = f(yij
F, TiF, Pi)
Vapor-liquid equilibrium
As in the case of binary mixtures, the vaporliquid equilibrium for a
multicomponent mixture is described by using the distribution coefficients or
factors K. Each component has its K factor, which is defined as the ratio of the
component fractions present in the vapor phase and liquid phase at equilibrium.
𝐾𝑖,𝑗 =𝑦𝑖,𝑗
𝑥𝑖,𝑗⁄ . [i=1,...,N;j=1,...,C] (4)
∑ 𝑥𝑖,𝑗 = ∑ 𝑦𝑖,𝑗 = 1 (5)
For cases of total condenser, the equation is written as follows:
𝑥𝑖,𝑗 =𝑙𝑖,𝑗
𝐿𝑖,𝑗⁄ [I = 2, ..., N] (6)
𝐾𝑖,𝑗 =𝑙𝑖,𝑗
𝐿𝑖,𝑗⁄ (7)
For a given stage, the liquid hold up (HL) can be determined using the
following equation:
𝐻𝐿 = ℎ𝑎𝑖𝜌𝐿𝑖𝐴𝑎𝑖 + ℎ𝑑𝑖𝜌𝐿𝑖𝐴𝑑𝑖 (8)
Where:
hai and hdi is the net height of the stage and downcomer;
ρLi is the liquid density in the stage;
Aai and Adi, are the active area of the stage and the downcomer.

II-10
The Francis equation can be used to relate HL at a certain stage and and
liquid flow.
𝐹𝐿 = 3.33 ∗ 0.5286 ∗ 𝑙𝑤 ∗ √ℎ3
(9)
Where FL is liquid flow rate, the length lw and weir length h of the liquid
exiting the weir or weir crest.
2.3 Software Aspen Plus
Aspen Tech is a provider of software and services for the process industries,
and Aspen Plus software is one of them, which is simple software that facilitates
the modeling of processes in oil refineries. Such processes are complex and
interrelated, this is the unique feature that makes them different from other
processes, starting with their own feed which is a complex mixture of hydrocarbons
with a wide difference in boiling point.
Through Aspen Plus can be developed models of simulation processes to
processing crude oil and then use that model to find better alternatives of operation
or simply optimize already existing processes. In oil refinery this units of separation
are interlinked, every unit having its specific product.
Usually the preflash column is the first in the sequence, used when the
mixture contains lights component or to unload the atmospheric furnace, to
eliminate vaporization at the furnace inlet control valves, to increase the naphtha
production and to debottleneck the crude column system. Luyben (2006) says that
in Aspen plus the Preflash tower is simulated as a Preflash column and Errico
(2008) in his work said that naphtha reduction in the top of the main column is an
aspect to be considered. So, if we want to keep the same end point for the naphtha
stream, the top temperature decrease with possible condensation phenomena and
consequent corrosion Possibility, in his work they used top temperature value
(higher than 100ᵒC) to avoid corrosion and a long running time apparatus.
The fleshad liquid is then pumped into the Pipestil, the pumps as well as
valves are standards. The column which are used are Petroleum fractionator

II-11
type, chosen in the library menu model that f o u n d at the bottom of the Aspen
plus window, one click on Petrofrac column and various options appear.
2.3.1 Thermodynamic model
Various thermodynamic packages designed to light hydrocarbons, and
gases such as Braun K10 packets, GraysonStread and ChaoSeader (CS) are
used in the Aspen Plus simulator. Aspen Plus (2006) states that the Braun K10
package is suitable f o r processes involving heavy oil and low pressure fractions,
best results will be obtained when using mixture of p u r e aliphatic or
aromatic as wel as mixtures involving light gases and high pressures the CS and
GraysonStread packages are recommended.
Aspen Plus recommends using CS package, w h i c h i s widely used in
research papers as the case of Haydary & Pavlik (2009) research u se d for
simulation in steadystate and dynamic of CDU and Handogo (2010) to
optimization t h e CDU. However Gutierrez et al (2014) said that although the
theorical base of CS package is not solid, simulator compensates it with their
wide crude database from all around the world. Its application has to be avoided
is outside its valid range, Aspen Tutorial recommends this package because its
application is reliable thanks to their wide source of information. The CS package
uses the following subpackages:
LeeKesler correlation for calculation of enthalpy
The proprieties of a real fluid in the LeeKesler method are related to be
properties of a simple fluid (w = 0) and those of reference fluid. The basic
parameters of the model are reduced pressure and temperature which should be
calculated based on mixing rules.
(ℎ𝑜−ℎ
𝑅𝑇𝑐) = (
ℎ𝑜−ℎ
𝑅𝑇𝑐)
𝑜
+ 𝑤 (ℎ𝑜−ℎ
𝑅𝑇𝑐)
1
(10)
(h0 h), (h0- h ) 0 and (h h)1 are the enthalpy departure o r residual
enthalpy, simple fluid term or first order enthalpy departure and the correction
term or second order enthalpy departure. YVC Rao (2004) said that

II-12
(ℎ𝑜−ℎ
𝑅𝑇𝑐)
𝑜
𝑎𝑛𝑑 (ℎ𝑜−ℎ
𝑅𝑇𝑐)
1
are Evaluated in the temperature range Tr = 0.3 to 4.0 and
pressure range Pr = 0.01 to 10.
Liquid fugacity coefficient of pure component (v o)
The liquid fugacity coefficient of pure component is a welldefined
property when the component exists as a liquid, but at condition where does not
exists a pure liquid, this value is hypothetical, such conditions occur in mixtures.
log 𝑣0 = log 𝑣(0) − 𝑤 log 𝑣(1) (11)
log 𝑣(0) = 𝐴0 +𝐴1
𝑇𝑟+ 𝐴2 ∗ 𝑇𝑟 + 𝐴3 ∗ 𝑇𝑟
2 + 𝐴4 ∗ 𝑇𝑟3 + 𝑃𝑟(𝐴5 + 𝐴6∗𝑇𝑟 + 𝐴7 ∗ 𝑇𝑟
2)
+ 𝑃𝑟(𝐴8 + 𝐴9∗𝑇𝑟)
log 𝑣(1) = −4.23893 + 8.65808 ∗ 𝑇𝑟 −1.2206
𝑇𝑟− 3.15224 ∗ 𝑇𝑟 − 0.025 ∗ (𝑃𝑟
− 0.6)
v (o), v (1) are simple fugacity coefficient of fluid in the liquid state and fugacity
coefficient correction factor.
RedlichKwuong state equation for fugacity coeficient of the vapor phase
(∅)
𝑙𝑛∅𝑖 = 𝑙𝑛 (𝑣
𝑣−𝑏) +
𝑏𝑖
𝑣−𝑏−
2 ∑ 𝑦𝑖𝑎𝑖𝑗
𝑅𝑇𝑏𝑙𝑛 (
𝑣
𝑣−𝑏) +
𝑎𝑏𝑖
𝑅𝑇𝑏2 (𝑙𝑛𝑣
𝑣+𝑏−
𝑏
𝑣+𝑏) – 𝑙𝑛𝑧 (12)
ScatchardHildebrand model for activity coefficient (γ)
The Hildebrand’s equa t ion i s expressed in terms of properties of pure
components and the solubility parameter (𝛿) is the square root of the ratio of
the vaporization energy (ΔEv) and molal volume of liquid (V).
𝛿𝑖 = (∆𝐸𝑣
𝑉)
1/2
(13)
Chao & Seader (1961) said ‘as a matter of pratical convenience the
standard reference temperature was chosen to be 25ᵒC, and the extensive

II-13
tabulation of density and heat of vaporization of a large number of
hydrocarbons at this temperature in API Project 44 were then immediately
available for the calculation of V and S’.
The solubility parameter of the blend is given by the volumetric average
of the components. According Albright (2009) those parameters are available
for numerous substances, and additional parameters can be readily determined
from their definitions, when the need arise, except for light gases.
𝛿𝑚 =∑ 𝑥𝑖𝑉𝑖𝛿𝑖
∑ 𝑥𝑖𝑉𝑖 (14)
𝑙𝑛𝛾𝑖 =𝑉𝑖∗(𝛿𝑖−𝛿)2
𝑅𝑇 (15)
The equilibrium value is then calculated using the formula:
𝐾𝑖 =𝑣𝑖𝛾𝑖
∅𝑖 (16)

II-14
(This page is intentionally left in blank)

III-1
CHAPTER 3
RESEARCH METHODOLOGY
3.1 Research stages
From this research, is expected to obtain the feed temperature and stripper
position that better influence the pressure, temperature and mass flow in each stage
of the Preflash and Pipestil column. The figure 3.1 shows the methodological
sequence that will be used to reach this objective.
Figure 3.1 Research flow diagram
Start
Collection and Processing data
Generating assay data of crude oil in Aspen Plus
Design model PFD steady state to define the
base case, using Aspen Plus
Simulation the PFD over temperature variation in
the preflash furnace and strippers position on
pipestil colum in order to obtain a optimum
conditions
Investigation of temperature, pressure
and mass flow on each columns tray
End
Economic analysis and Dynamic simulation
of PFD based on optimum case
III-2
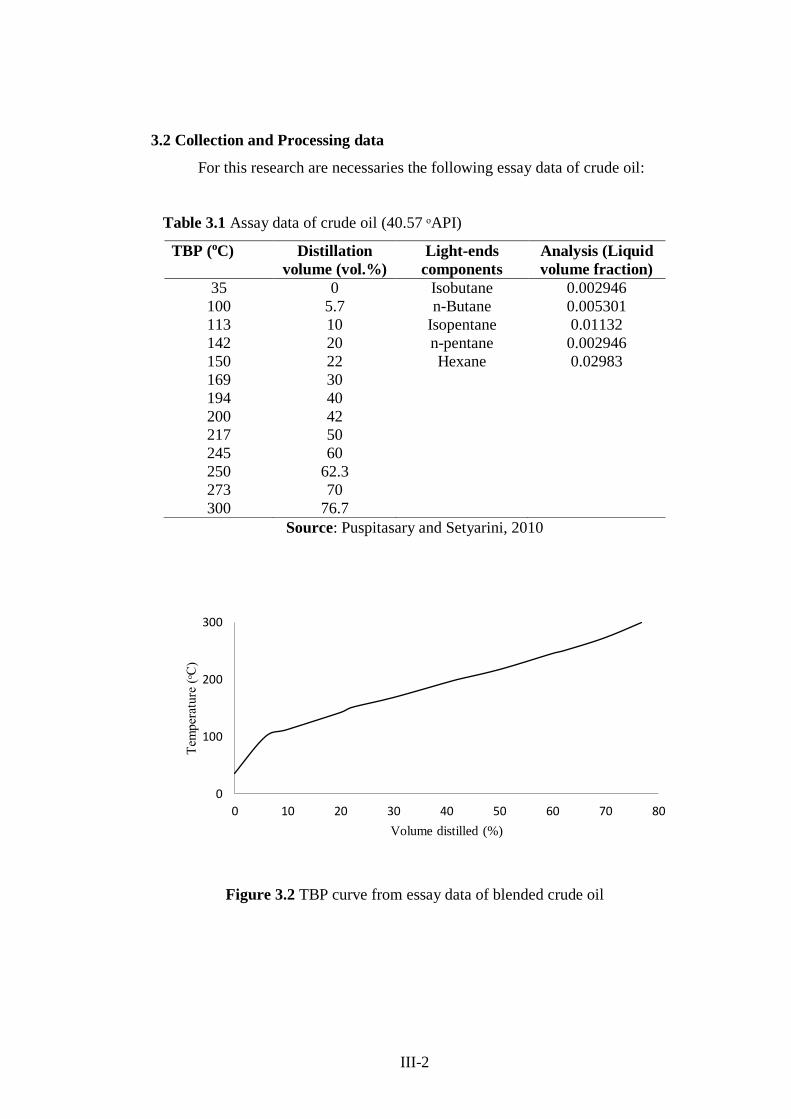
3.2 Collection and Processing data
For this research are necessaries the following essay data of crude oil:
Table 3.1 Assay data of crude oil (40.57 ᵒAPI)
TBP (oC) Distillation
volume (vol.%)
Light-ends
components
Analysis (Liquid
volume fraction)
35 0 Isobutane 0.002946
100 5.7 n-Butane 0.005301
113 10 Isopentane 0.01132
142 20 n-pentane 0.002946
150 22 Hexane 0.02983
169 30
194 40
200 42
217 50
245 60
250 62.3
273 70
300 76.7
Source: Puspitasary and Setyarini, 2010
Figure 3.2 TBP curve from essay data of blended crude oil
0
100
200
300
0 10 20 30 40 50 60 70 80
Tem
per
ature
(ᵒC
)
Volume distilled (%)
III-3
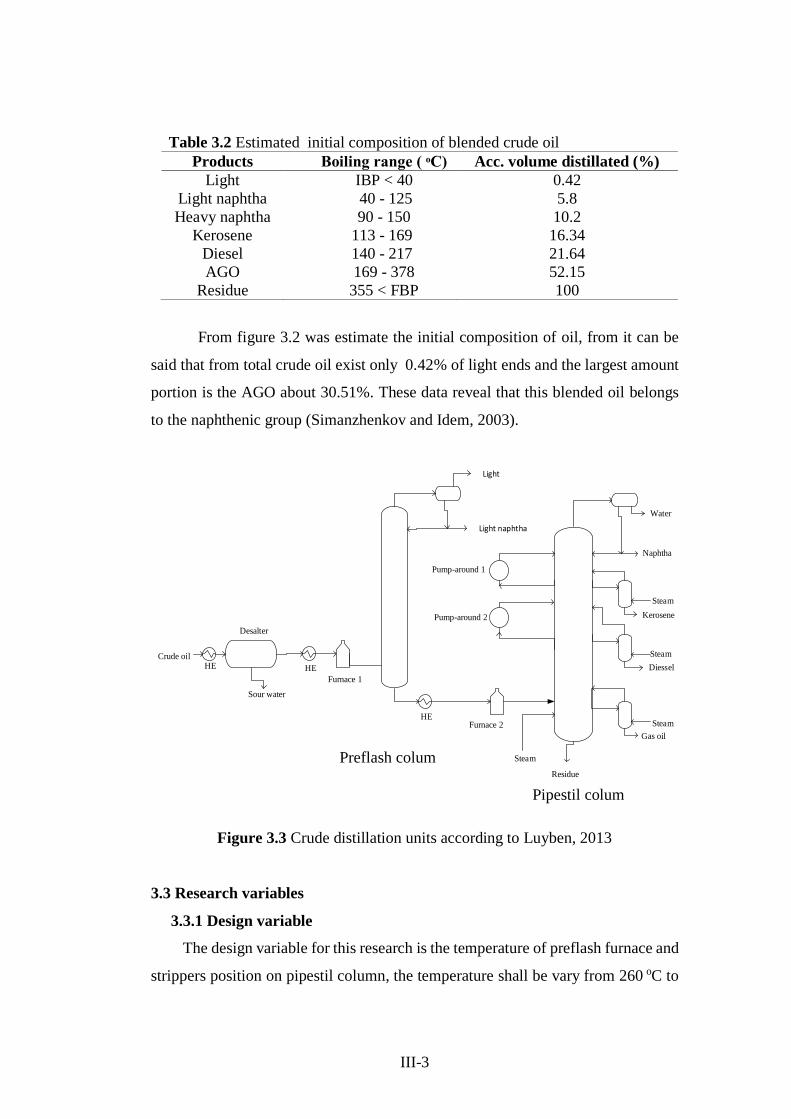
From figure 3.2 was estimate the initial composition of oil, from it can be
said that from total crude oil exist only 0.42% of light ends and the largest amount
portion is the AGO about 30.51%. These data reveal that this blended oil belongs
to the naphthenic group (Simanzhenkov and Idem, 2003).
Crude oil
Furnace 2
Sour water
Desalter
HE
Water
Naphtha
Steam
Kerosene
Steam
Diessel
Steam
Gas oil
Pump-around 1
Pump-around 2
Residue
Furnace 1
HEHE
Light naphtha
Light
Steam
Figure 3.3 Crude distillation units according to Luyben, 2013
3.3 Research variables
3.3.1 Design variable
The design variable for this research is the temperature of preflash furnace and
strippers position on pipestil column, the temperature shall be vary from 260 oC to
Table 3.2 Estimated initial composition of blended crude oil
Products Boiling range ( ᵒC) Acc. volume distillated (%)
Light IBP < 40 0.42
Light naphtha 40 - 125 5.8
Heavy naphtha 90 - 150 10.2
Kerosene 113 - 169 16.34
Diesel 140 - 217 21.64
AGO 169 - 378 52.15
Residue 355 < FBP 100
Preflash colum
Pipestil colum
III-4
350oC to avoid the cracking of light fraction, but during the simulation the
pumparround flow rate will be fixed.
3.3.3 Variables to be observed in each stage and in the output stream
The variables to be observed in each stage are the temperature, pressure and both
mass of liquid and vapor leaving the stage while in the output stream are: stream
product, reflux ratio and furnace heat duty of each unit.
3.4 Generating data assay crude oil in Aspen Plus
The generation of pseudo-components is the first step on simulation, since
the crude oil is mainly composed by complex mixture of hydrocarbons, so that will
be better generate a pseudo-component. Aspen Plus simulator has a special run to
generate it.
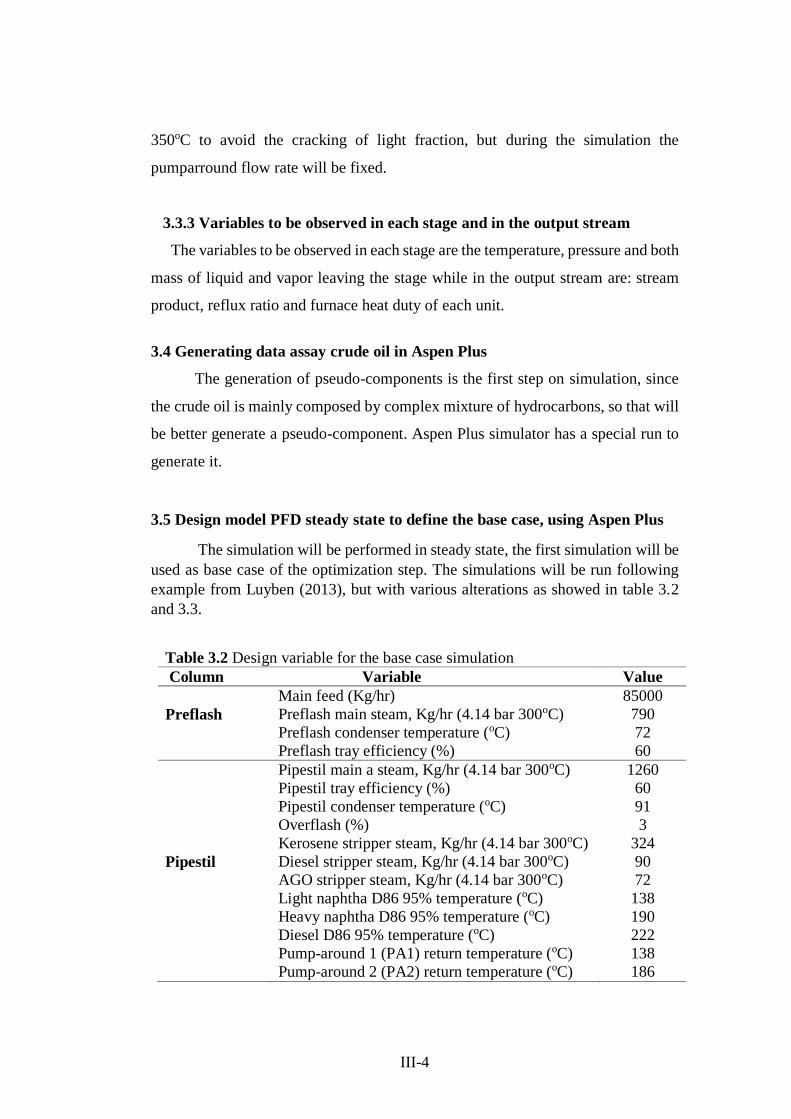
3.5 Design model PFD steady state to define the base case, using Aspen Plus
The simulation will be performed in steady state, the first simulation will be
used as base case of the optimization step. The simulations will be run following
example from Luyben (2013), but with various alterations as showed in table 3.2
and 3.3.
Table 3.2 Design variable for the base case simulation
Column Variable Value
Main feed (Kg/hr) 85000
Preflash Preflash main steam, Kg/hr (4.14 bar 300oC) 790
Preflash condenser temperature (oC) 72
Preflash tray efficiency (%) 60
Pipestil main a steam, Kg/hr (4.14 bar 300oC) 1260
Pipestil tray efficiency (%) 60
Pipestil condenser temperature (oC) 91
Overflash (%) 3
Kerosene stripper steam, Kg/hr (4.14 bar 300oC) 324
Pipestil Diesel stripper steam, Kg/hr (4.14 bar 300oC) 90
AGO stripper steam, Kg/hr (4.14 bar 300oC) 72
Light naphtha D86 95% temperature (oC) 138
Heavy naphtha D86 95% temperature (oC) 190
Diesel D86 95% temperature (oC) 222
Pump-around 1 (PA1) return temperature (oC) 138
Pump-around 2 (PA2) return temperature (oC) 186
III-5
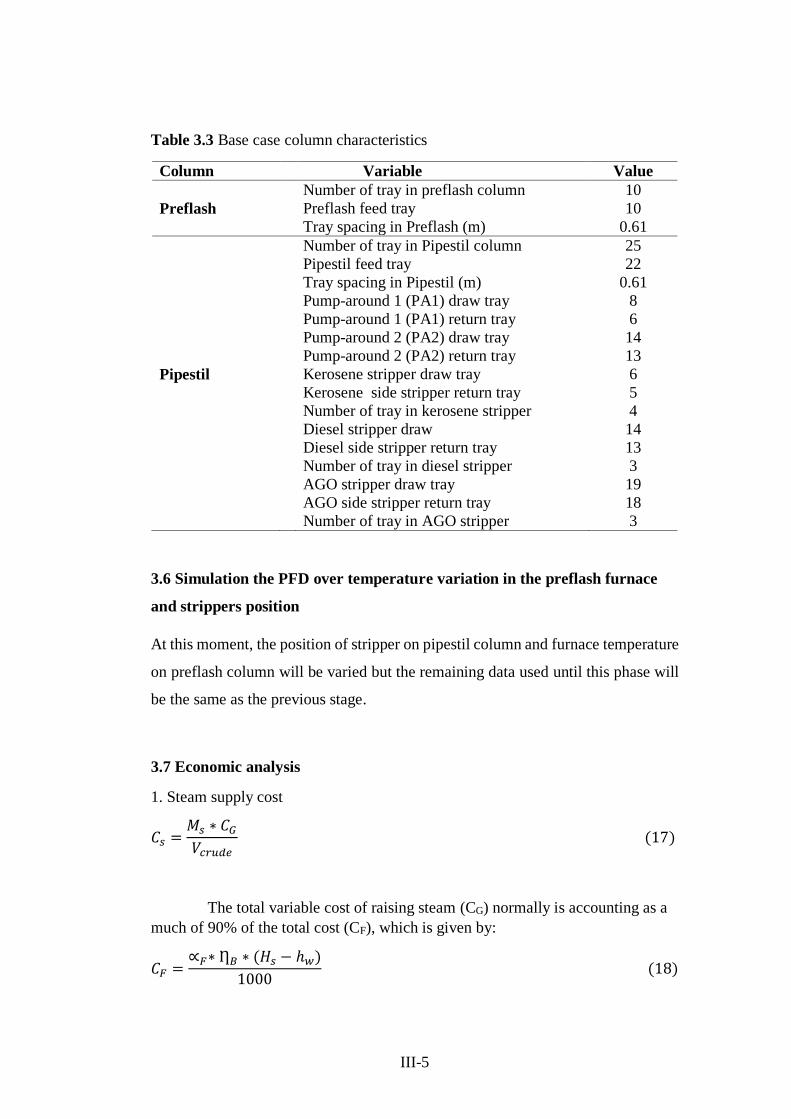
Table 3.3 Base case column characteristics
Column Variable Value
Number of tray in preflash column 10
Preflash Preflash feed tray 10
Tray spacing in Preflash (m) 0.61
Number of tray in Pipestil column 25
Pipestil feed tray 22
Tray spacing in Pipestil (m) 0.61
Pump-around 1 (PA1) draw tray 8
Pump-around 1 (PA1) return tray 6
Pump-around 2 (PA2) draw tray 14
Pump-around 2 (PA2) return tray 13
Pipestil Kerosene stripper draw tray 6
Kerosene side stripper return tray 5
Number of tray in kerosene stripper 4
Diesel stripper draw 14
Diesel side stripper return tray 13
Number of tray in diesel stripper 3
AGO stripper draw tray 19
AGO side stripper return tray 18
Number of tray in AGO stripper 3
3.6 Simulation the PFD over temperature variation in the preflash furnace
and strippers position
At this moment, the position of stripper on pipestil column and furnace temperature
on preflash column will be varied but the remaining data used until this phase will
be the same as the previous stage.
3.7 Economic analysis
1. Steam supply cost
𝐶𝑠 =𝑀𝑠 ∗ 𝐶𝐺
𝑉𝑐𝑟𝑢𝑑𝑒 (17)
The total variable cost of raising steam (CG) normally is accounting as a
much of 90% of the total cost (CF), which is given by:
𝐶𝐹 =∝𝐹∗ Ƞ𝐵 ∗ (𝐻𝑠 − ℎ𝑤)
1000 (18)

III-6
2. Preheater supply cost
𝐶𝑃𝐻 =𝐸𝑃𝐻 ∗ 𝑀𝑠 ∗ 𝐶𝐺
𝜆𝑠 ∗ 𝑉𝑐𝑟𝑢𝑑𝑒 (19)
3. Furnace supply cost
𝐶𝑓𝑖 =𝐸𝑓𝑖 ∗ 𝐵𝑓
𝐿𝐻𝑉𝑔 ∗ 𝑉𝑐𝑟𝑢𝑑𝑒 (20)
4. Purchase cost of blending crude oil
𝐶𝑂 =∑ 𝑥𝑖𝑉𝑐𝑖𝐶𝑂𝑖
𝑉𝑐𝑟𝑢𝑑𝑒 (21)
5. Value of product sales
𝑆𝑝 = ∑ 𝑆𝑝𝑖 ∗ 𝑉𝑖 (22)
6. Profit calculation
𝐾 = 𝑆𝑝 − (𝐶𝑆 + 𝐶𝑃𝐻 + ∑𝐶𝑓𝑖 + 𝐶𝑜) (23)
After getting result from Aspen plus, the profit is calculated to see how the
variation of feed temperature on Prelash column temperature and strippers positions
affect it, since all conditions of operation have been tried in attempt to produce more
diesel and kerosene which are expensive and higher demand products. The case
which have the higher profit will be considered as optimum case. The profit
calculations can be explored more in Handogo (2011) and Pupistasari and Setyarini
(2010).
3.8 Optimization
Optimization is to obtain the potential of this research that is determining
the feed temperature that best influence the temperature, pressure and mass flow of
each stage in CDU. In this stage, the profit obtained from these cases will be

III-7
compared. The case at which will found the highest profit will be the focus of
analysis of the infuence of feed temperature and strippers position.
3.9 Dynamic simulation of PFD based on optimum case
Since the steady state simulation and economic analysis is done, dynamic
simulation was performed to observe the response of products composition to a
change of the feed flow rate, the controlled variable was the temperature of 95% of
the ASTM D86 curve representing the composition. The pressure units such as
valves and pumps, that are not necessary for the steady-state simulation was
specified for this simulation. Sizing of the equipment is another requirement of the
dynamic simulation. The column diameter, tray spacing, tray active area, weir
length, weir height, reflux drum length and diameter are requested for the dynamic
simulation. All control charectesic of flow, temperature, pressure and level are
shown in table 3.4, 3.5, 3.6 and 3.7 respectively, all of them are based on Luyben
(2013)
Table 3.4 Flow control characteristics
Description FCmixoil FCpf-stm FCpp-stm FCstg19
Gain 0.5 0.5 0.5 0.5
Ʈi(min) 0.3 0.3 0.3 0.3
SP (m³/h) 713 2268 5444 68939
PV (Kg/h) 0 – 1425 0 - 4536 0 - 10888 30000 - 90000
OP (%) 50 50 50 50
Action Reverse Reverse Reverse Direct

III-8
Table 3.5 Temperature control characteristics
Description TCfurnace1 TCfurnace2
Gain 0,63 0,63
Ʈi(min) 5,28 5,28
Dead time (min) 1 1
SP (ᵒC) 232 356
PV range (ᵒC) 0 - 464 0 - 713
OP 50 50
Action Reverse Reverse
Table 3.6 Pressure control characteristics
Description PCcond1 PCcond2 PC-S1 PC-S2 PC-S3
Gain (%) 20 20 20 20 20
Ʈi (min) 12 12 12 12 12
SP (bar) 2.3 1.08 1.46 1.55 1.6
PV range (bar) 1.4 – 4.7 0.5 – 2.6 0.6 – 3 0.6 – 3 0.5 – 3.5
OP (%) 50 50 50 50 50
Action Direct Reverse Direct Direct Direct
Table 3.7 Level control characteristics
Description LC1 LC2 LC-W1 LC-W2 LCcond1 LCcond2
Gain 2 2 2 2 2 2
Ʈi(min) 9999 9999 9999 9999 9999 9999
SP (m) 2.4 0.068 0.025 0.02 0.79 0.42
PV range (m) 0 - 4.8 0 – 0.14 0 – 0.5 0-0.039 0 – 1.6 0 – 0.84
OP (%) 50 50 50 50 50 50
Action Direct Direct Direct Direct Direct Direct

III-9
3.10 Investigation of temperature, pressure and mass flow on each columns
tray
In this step, the temperature, pressure and mass flow of each stage will be
listed and compared with a theory to analyze the influence of feed temperature
strippers’ position on them.

III-10
(This page is intentionally left in blank)

IV-1
CHAPTER 4
RESULTS AND DISCUSSION
4.1 Generating essay data of crude oil in Aspen Plus simulator
The represention of crude oil and their cuts is not pratical in terms of
components because they are complex mixtures and then it is necessary to represent
them in terms of small fractions or pseudocomponent based on the distillation
curve. Before designing the model PFD steady state, assay data for blended oil was
made using Aspen Plus based on its laboratorium data (see table 3.1). This
simulation was perfomed in order to predict the oil composition and get a complete
percentage range (0% to 100%) of distilled oil and correspondent boiling point as
expected, while in the laboratory data the range is 0% until 76.7% only. After data
has been generated, both laboratory data and Aspen Plus data were used to plot a
TBP curve in order to compare predictions as shown in figure 4.1 and table 4.1.
Figure 4.1 Comparison of TBP curve from laboratorium data with that
generated from using Aspen Plus
From this graph the initial composition of the oil cuts is estimated, the
composition is given in percentage of distilled volume as showed in table 4.1. In
this table it is observed that the light components predicted is the smallest, about
0.42 and 0.62% for laboratoty and Aspen plus data respectivelly.
0
100
200
300
400
500
0 20 40 60 80 100
Tem
per
ature
(ᵒC
)
Volume distilled (%)
TBP Curve
TBP curve from laboratorium data
TBP curve generated using Aspen Plus

IV-2
The greater prediction cover the AGO cuts; 30.51% and 33% for laboratoty
and Aspen plus respectivelly. Although there is an insignificant deviation between
the prediction made through laboratory data and aspen Plus, the results are
satisfying and show how they are related.
From the total crude oil used only 1.2% of light components was obtained
and the largest amount was registered in AGO 48% . These data reveal that the
crude oil used in this simulation belongs to the naphthenic group (Simanzhenkov
and Idem, 2003).
4.2 Design model PFD steady state to define the base case, using Aspen Plus
In this research a Preflash column having trays and top reflux which
corresponds to the conventional top condenser of distillation column were used.
This pre-fractionator was conected to the main column called pipestil. The main
colum has pump-arround reflux, top reflux and strippers as shown in figure 4.2. The
simulation was made in Aspen Plus, the chosen thermodynamic package was
CHAO-SEADER because crude oil is a complex mixture of hydrocarbons and it is
impratical to be specified, this package is suitable for this kind of mixture (Hayday
and Pavlik, 2009).
For defining the base case, the temperature in preflash furnace was set to
be 260oC and the positions of these three strippers on pipestitil were S1p.6-5,
Table 4.1 Estimated initial composition of crude oil
Volume distillated (%)
Products Boiling range ( ᵒC) laboratory Aspen plus
Light IBP < 40 0.42 0.62
Light naphtha 40 - 125 0.58 9.52
Heavy naphtha 90 - 150 10.2 12.32
Kerosene 113 - 169 16.32 18.42
Diesel 140 - 217 21.64 21.22
AGO 169 - 378 52.15 54.22
Residue 355 < FBP 100 100
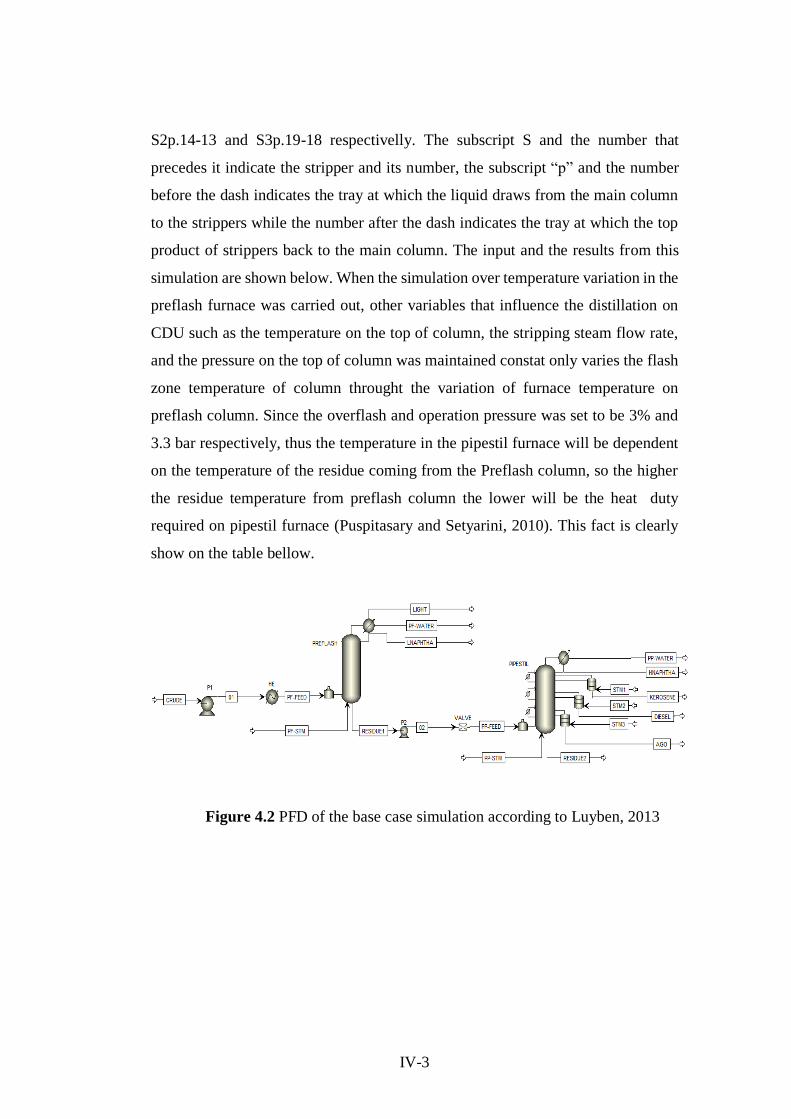
IV-3
S2p.14-13 and S3p.19-18 respectivelly. The subscript S and the number that
precedes it indicate the stripper and its number, the subscript “p” and the number
before the dash indicates the tray at which the liquid draws from the main column
to the strippers while the number after the dash indicates the tray at which the top
product of strippers back to the main column. The input and the results from this
simulation are shown below. When the simulation over temperature variation in the
preflash furnace was carried out, other variables that influence the distillation on
CDU such as the temperature on the top of column, the stripping steam flow rate,
and the pressure on the top of column was maintained constat only varies the flash
zone temperature of column throught the variation of furnace temperature on
preflash column. Since the overflash and operation pressure was set to be 3% and
3.3 bar respectively, thus the temperature in the pipestil furnace will be dependent
on the temperature of the residue coming from the Preflash column, so the higher
the residue temperature from preflash column the lower will be the heat duty
required on pipestil furnace (Puspitasary and Setyarini, 2010). This fact is clearly
show on the table bellow.
Figure 4.2 PFD of the base case simulation according to Luyben, 2013

IV-4
The table above shown that the larger amount of crude was converted into
AGO about 47,95%, a value very close to what was predicted initially whie only
1.16 of crude was converted into lights componentes.
Table 4.2 Result from steady state simulation of base case
Column Description Temperature of preflash furnace
260(oC)
Input (Kg/hr)
Crude oil 85000
PF-STM 790
Total input 85790
Product (Kg/hr)
LIGHT 983
Preflash LNAPHTHA 9316
PF-WATER 697
RESIDUE1 74794
Total product flow 85790
Reflux ratio 3.48
Heat duty (Gcal/hr)
Condenser duty -5.22
Furnace duty 8.21
Input (Kg/hr)
PP-STM 1260
STM1 324
STM2 90
STM3 72
RESIDUE1 74794
Total input 76540
Product (Kg/hr)
HNAPHTHA 9515
Pipestil KEROSENE 8344
DIESEL 2437
AGO 40758
RESIDUE2 13749
PP-WATER 1737
Total product 76540
Furnace temperature (ᵒC) 296
Reflux ratio 5.33
Heat duty (Gcal/hr)
Pumparround1 duty -1.19
Pumparround2 duty -0.17
Condenser duty) -6.97
Furnace duty 6.37

IV-5
Figure 4.3 TBP curve of blanding oil and base case RESIDUE1
The TBP curves above were made to show the importance of using the pre-
fractionator column which removes the light components at relatively low
temperatures to avoid cracking as well as to reduce heat energy requirement across
furnace and decrease overhead vapor load in the pipestil. From the graphic the
RESIDUE1 curve is relatively above the crude oil curve so the initial boiling point
was increasing from 35ᵒC to 106ᵒC also the T50% increased from 217ᵒC to 237ᵒC,
which means the biggest quantity of ligth materials was evaporated.
4.2.1 Steady state simulation of the PFD over temperature variation in the
preflash furnace
According to Budhiarto (2009) in the crude distillation unit system process
variables that affect the crude distillation unit include flash zone temperature of
distillation column, top column temperature, top pressure of the distillation column,
and the flow rate of stripping steam. The variable in this study is the furnace
temperature of preflash column that will affect the flash zone temperature of this
column. To perform this simulation, those other variables was maintained constant,
it is evident that the furnace temperature changes affect the equilibrium preflash
column and the flow rate of product preflash and pipestill, as shown in the following
table:
0
100
200
300
400
500
0 20 40 60 80 100
Tem
per
ature
(ᵒC
)
Percent distilled (%)
Crude oil
Base case RESIDUE1

IV-6
As shown in table 4.3, when the temperature increase from 260oC to 345oC
the production of LIGHT ends drops down from 983Kg to 476Kg while the
Table 4.3 Result from the simulation over temperature variation in the preflash
furnace
Column Description Temperature of preflash furnace (oC)
260 285 305 325 345
Input (Kg/hr)
Crude oil 85000 85000 85000 85000 85000
PF-STM 790 790 790 790 790
Total input 85790 85790 85790 85790 85790
Product (Kg/hr)
LIGHT 983 840 705 502 476
Preflash LNAPHTHA 9316 10129 10842 11933 12088
PF-WATER 697 709 717 727 727
RESIDUE1 74794 74112 73526 72628 72499
Total product flow 85790 85790 85790 85790 85790
Reflux ratio 3.48 4.91 5.89 6.53 7.55
Heat duty (Gcal/hr)
Condenser duty -5.22 -7.24 -8.83 -10.35 -11.84
Furnace duty 8.21 10.39 12.03 13.54 14.97
Input (Kg/hr)
PP-STM 1260 1260 1260 1260 1260
STM1 324 324 324 324 324
STM2 90 90 90 90 90
STM3 72 72 72 72 72
RESIDUE1 74794 74112 73526 72628 72499
Total input 76540 75858 75272 74374 74245
Product (Kg/hr)
HNAPHTHA 9515 8640 7912 6829 6655
Pipestil KEROSENE 8344 8323 8308 8290 8286
DIESEL 2437 2971 3351 3836 3942
AGO 40758 40996 41170 41406 41450
RESIDUE2 13749 13195 12797 12278 12175
PP-WATER 1737 1733 1734 1735 1737
Total product 76540 75858 75272 74374 74245
Furnace temperature (ᵒC) 296 298 300 302 303
Reflux ratio 5.33 5.95 6.55 7.64 7.86
Heat duty (Gcal/hr)
Pumparround1 duty -1.19 -1.18 -1.18 -1.17 -1.17
Pumparround2 duty -0.17 -0.17 -0.18 -0.18 -0.18
Condenser duty) -6.97 -6.94 -6.91 -6.84 -6.84
Furnace duty 6.37 6.20 6.13 6.09 6.01

IV-7
production of LNAPHTHA rose from 9316Kg to 12088Kg. This is due to the fact
of keeping consntante the top temperature on preflash column which was 72ºC in
this simulation. Thus, the larger of the feed temperature that comes to the flash
zone of preflash column greater will be the deviation of the temperature between
the top and bottom of the column and this increases the amount of condensed liquid.
Since the amount of condensate liquid increse so the reflux ratio will increase and
the production of LNAPHTHA being higher. Table 4.3 show that increasing
temparature cause less production of HNAPHTHA, this is because most naphtha
components were removed in the preflash column as LNAPHTHA product this fact
was also reported by Handogo, 2011.
4.2.2 Simulation of PFD over variation of strippers position on pipestil column
For this simulation the strippers positions on pipestil column was varied to
see its influence on the profile in each of CDU and the product specification. The
table 4.4 show the comparison between the simulations over variation on stripper
positions when the temperature in the preflash furnace was set at 345oC because is
were obtained higher production of DIESEL and KEROSENE the most expensive
product and with higher demand see appendix A.3. All those other variable
mentioned before was also constant.
Table 4.4 Results from the steady state simulation over variation of strippers
positions on pipestil column
Column Description Temperature of preflash furnace
345 (oC)
Input (Kg/hr)
Crude oil 85000 85000 85000 85000
PF-STM 790 790 790 790
Total input 85790 85790 85790 85790
Preflash Product (Kg/hr)
LIGHT 476 476 476 476
LNAPHTHA 12088 12088 12088 12088
PF-WATER 727 727 727 727
RESIDUE1 72499 72499 72499 72499
Total product flow 85790 85790 85790 85790
IV-8
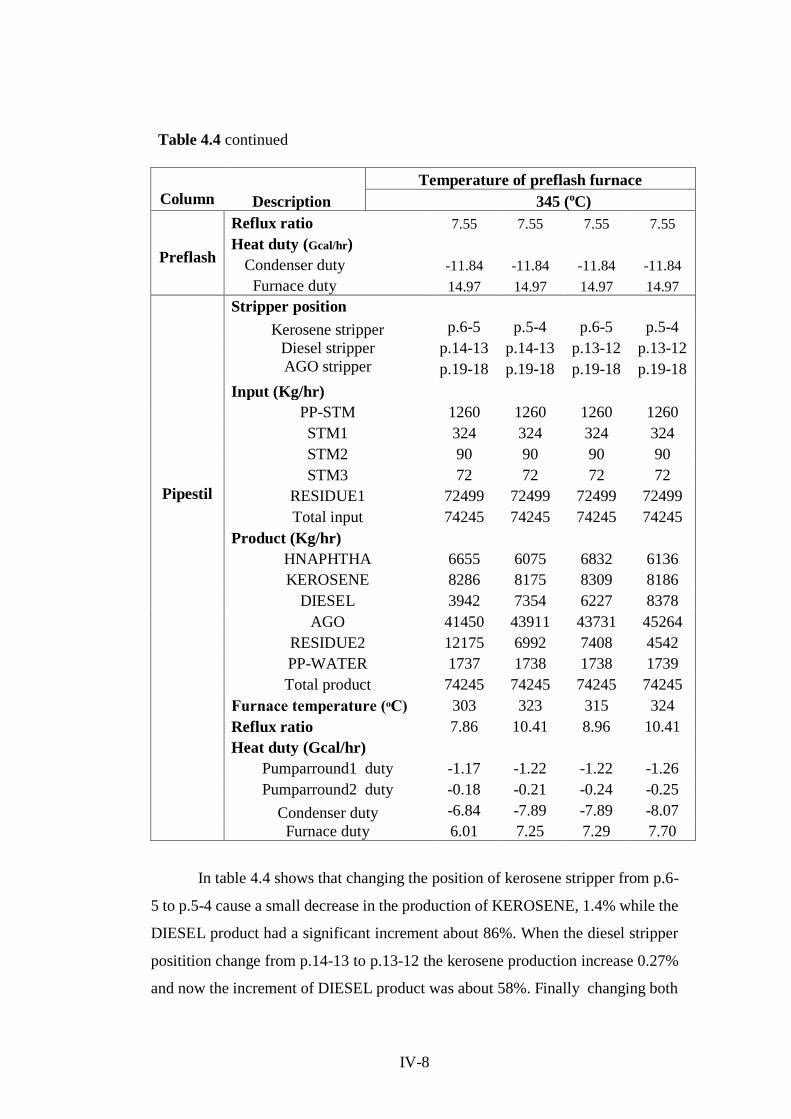
In table 4.4 shows that changing the position of kerosene stripper from p.6-
5 to p.5-4 cause a small decrease in the production of KEROSENE, 1.4% while the
DIESEL product had a significant increment about 86%. When the diesel stripper
positition change from p.14-13 to p.13-12 the kerosene production increase 0.27%
and now the increment of DIESEL product was about 58%. Finally changing both
Table 4.4 continued
Temperature of preflash furnace
Column Description 345 (oC)
Preflash
Reflux ratio 7.55 7.55 7.55 7.55
Heat duty (Gcal/hr)
Condenser duty -11.84 -11.84 -11.84 -11.84
Furnace duty 14.97 14.97 14.97 14.97
Stripper position
Kerosene stripper
Diesel stripper
AGO stripper
p.6-5 p.5-4 p.6-5 p.5-4
p.14-13 p.14-13 p.13-12 p.13-12
p.19-18 p.19-18 p.19-18 p.19-18
Input (Kg/hr)
PP-STM 1260 1260 1260 1260
STM1 324 324 324 324
STM2 90 90 90 90
STM3 72 72 72 72
Pipestil RESIDUE1 72499 72499 72499 72499
Total input 74245 74245 74245 74245
Product (Kg/hr)
HNAPHTHA 6655 6075 6832 6136
KEROSENE 8286 8175 8309 8186
DIESEL 3942 7354 6227 8378
AGO 41450 43911 43731 45264
RESIDUE2 12175 6992 7408 4542
PP-WATER 1737 1738 1738 1739
Total product 74245 74245 74245 74245
Furnace temperature (ᵒC) 303 323 315 324
Reflux ratio 7.86 10.41 8.96 10.41
Heat duty (Gcal/hr)
Pumparround1 duty -1.17 -1.22 -1.22 -1.26
Pumparround2 duty -0.18 -0.21 -0.24 -0.25
Condenser duty
Furnace duty
-6.84 -7.89 -7.89 -8.07
6.01 7.25 7.29 7.70

IV-9
kerosene and diesel strippers to p.5-4 and p.13-12 respectively DIESEL product in
this case was highest. Shifting up Kerosene Stripper decreases the intersection area
of the boiling temperatures between KEROSENE and DIESEL cuts, it mean that
those liquid at tray 6 flow to down trays. Thus rise the amount of downward liquid
and consequentely flowrate in the diesel side draw and the heat duty in Pipestil
furnace increase. Those changes did no affect the quality of products because those
side-draw products are taken from trays at which the temperature corresponds to
their cut point, also it means that there are dependence between the purity of those
cuts and with the composition profile whithin the column (Jobson, 2014).
4.3 Economic analysis
Below are presented the profits obtained from these simulation compared
above. Fisrt over the total cost of blending oil per meter cubic was determined using
Eq. 21, see table 4.5. Product sales was found by Eq. 22 see table 4.6 and 4.9, it is
clear that the case were the strippers positions was at S1p.5-4, S2p.14-13 and
S3p.19-18 was highest product sales value about 330.88US$/m3, see complete
comparison profit in appendix A.4. And then, since the LHV of furnace fuel was
47798Kj/Kg, the cost of furnaces heat was determined by Eq. 20 the results are
shown in table 4.7 and 4.10. Finally, supply steam cost of 0.43US$/m3 and preheat
cost of 2.4 US$/m3 was obtained by Eq. 17, see table 4.8 and 4.11. The price of
steam is much bigger than the cost of providing cooling water that is why the cost
of cooling water was not considered.
Table 4.5 Crude oil purchase cost
Crude oil type Price($/m3) Fraction Volume(m³/h) Cost(US$/h)
Lalang 270.375 0.08 8.288 2240.868
Ramba 271.25 0.3 31.08 8430.45
Duri 263.1875 0.32 33.152 8725.192
Geragai 271.25 0.3 31.08 8430.45
Total - 1 103.6 27826.96
Oil purchase cost, Co = 268.6 US$/m³
Source: Direktorat Jenderal minyak Dan Gas Bumi, 2016

IV-10
Table 4.6 Product sales for simulation over temperature variariation in the preflash
furnace
Temperature in the preflash furnace(oC)
Base
case Case2 Case3 Case4 Case5
Product(Kg/h) Price ($/m³) 260 285 305 325 345
LIGHT 285.30 69020
332.58 4673
368.58 4928
393.23 4683
393.14 1384
383.23 23220
321.59 5930
59160 49825 35654 33839
LNAPHTHA 5072 5418 5947 6020
HNAPHTHA 4471 4091 3527 3439
KEROSENE 4672 4664 4656 4652
DIESEL 1694 1915 2202 2261
AGO 23354 23458 23592 23615
RESIDUE2 5692 5518 5293 5248
Total(US$) 113838 104115 94888 80870 79074
Total(US$/m³) 312.91 315.91 319.35 326.25 327.35
Source: Oil Price Information Sistem, 2016
Table 4.7 Cost of furnace heat duty for simulation over temperature variariation
in the preflash furnace
Preflash furnace temperature (oC)
Base case Case2 Case3 Case4 Case5
Description 260 285 305 325 345
PF heat duty
(Kj/hr) 34388739 43516879 50350083 56687819 62677382
PF heat cost
(US$/m3) 2.56 3.23 3.74 4.21 4.66
PPF heat duty
(Kj/hr) 26649468 25945621 25677498 25487239 25162668
PPF heat cost
(US$/m3) 1.98 1.93 1.91 1.89 1.87
Source: Oil Price Information Sistem, 2016
Table 4.8 Results from profit comparison for simulation over temperature
variariation in the preflash furnace
Preflash furnace temperature (oC)
Base
case Case2 Case3 Case4
Optimum
case
Description 260 285 305 325 345
Product sale (US$/m3) 312.91 315.91 319.35 326.25 327.35
Cost of oil (US$/m3) 268.6 268.6 268.6 268.6 268.6
Cost of steam (US$/m3) 0.43 0.43 0.43 0.43 0.43
Cost of heat PF (US$/m3) 2.56 3.23 3.74 4.21 4.66

IV-11
In these calculations the annual capital cost was ignored because there's no
change in equipment design. After comparing the profit is noted that a highest profit
of US$ 51.78 is found at the furnace preflash temperature of 345oC (table 4.8). This
condiction was considered as optimum case in the study of the influence of
temperature on CDU profile.
Table 4.9 Product sales for simulation over variation of strippers position on
pipestil column
Temperature in the preflash furnace
345 (oC)
Base case2 Case6 Case7 Case8
p.6-5 p.5-4 p.6-5 p.5-4
p.14-13 p.14-13 p.13-12 p.13-12
Product(Kg/h)
Price ($/m³) p.19-18 p.19-18 p.19-18 p.19-18
LIGHT 285.30 332.58
368.58
393.23
393.14
383.23
321.59
33839 33839 33839 33839
LNAPHTHA 6020 6020 6020 6020
HNAPHTHA 3439 3140 3527 3174
KEROSENE 4652 4585 4664 4589
DIESEL 2261 4266 3597 4867
AGO 23615 24903 24822 25600
RESIDUE2 5248 3000 3181 1942
Total(US$) 79074 79753 79650 80031
Total(US$/m³) 327.35 330.88 329.19 330.42
Source: Oil Price Information Sistem, 2016
Table 4.8 continued
Preflash furnace temperature (oC)
Base
case Case2 Case3 Case4
Optimum
case
Description 260 285 305 325 345
Cost of heat PPF
(US$/m3) 1.98 1.93 1.91 1.89 1.87
Cost of cooling water
(US$/1000m3) 0.0087 0.0087 0.0087 0.0087 0.0087
Profit (US$/m3) 39.33 41.71 44.66 51.11 51.78
IV-12
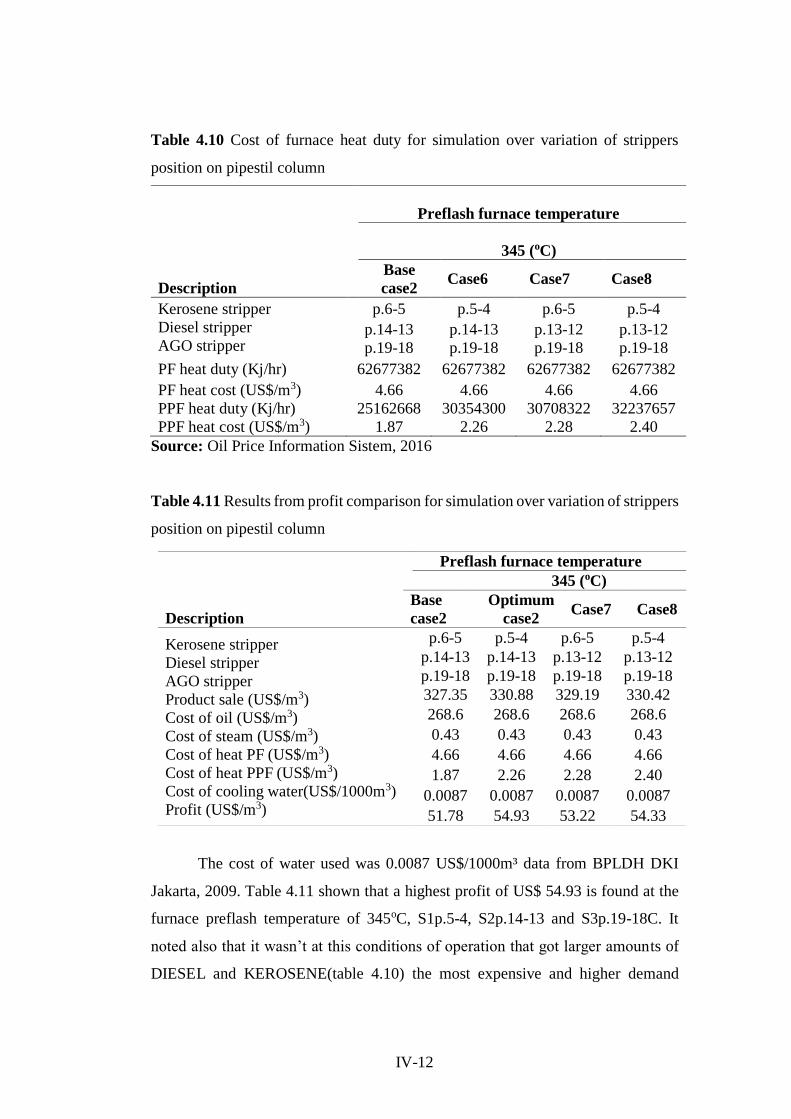
Table 4.10 Cost of furnace heat duty for simulation over variation of strippers
position on pipestil column
Preflash furnace temperature
345 (oC)
Description
Base
case2 Case6 Case7 Case8
Kerosene stripper
Diesel stripper
AGO stripper
p.6-5 p.5-4 p.6-5 p.5-4
p.14-13 p.14-13 p.13-12 p.13-12
p.19-18 p.19-18 p.19-18 p.19-18
PF heat duty (Kj/hr) 62677382 62677382 62677382 62677382
PF heat cost (US$/m3) 4.66 4.66 4.66 4.66
PPF heat duty (Kj/hr) 25162668 30354300 30708322 32237657
PPF heat cost (US$/m3) 1.87 2.26 2.28 2.40
Source: Oil Price Information Sistem, 2016
Table 4.11 Results from profit comparison for simulation over variation of strippers
position on pipestil column
The cost of water used was 0.0087 US$/1000m³ data from BPLDH DKI
Jakarta, 2009. Table 4.11 shown that a highest profit of US$ 54.93 is found at the
furnace preflash temperature of 345oC, S1p.5-4, S2p.14-13 and S3p.19-18C. It
noted also that it wasn’t at this conditions of operation that got larger amounts of
DIESEL and KEROSENE(table 4.10) the most expensive and higher demand
Preflash furnace temperature
345 (oC)
Description
Base
case2
Optimum
case2 Case7 Case8
Kerosene stripper
Diesel stripper
AGO stripper
Product sale (US$/m3)
Cost of oil (US$/m3)
Cost of steam (US$/m3)
Cost of heat PF (US$/m3)
Cost of heat PPF (US$/m3)
Cost of cooling water(US$/1000m3)
Profit (US$/m3)
p.6-5 p.5-4 p.6-5 p.5-4
p.14-13 p.14-13 p.13-12 p.13-12
p.19-18 p.19-18 p.19-18 p.19-18
327.35 330.88 329.19 330.42
268.6 268.6 268.6 268.6
0.43 0.43 0.43 0.43
4.66 4.66 4.66 4.66
1.87 2.26 2.28 2.40
0.0087 0.0087 0.0087 0.0087
51.78 54.93 53.22 54.33
IV-13
product. This condition was named as optmum case 2 when the infuence of strippers
position were analyzed while the first one was called base case 2.
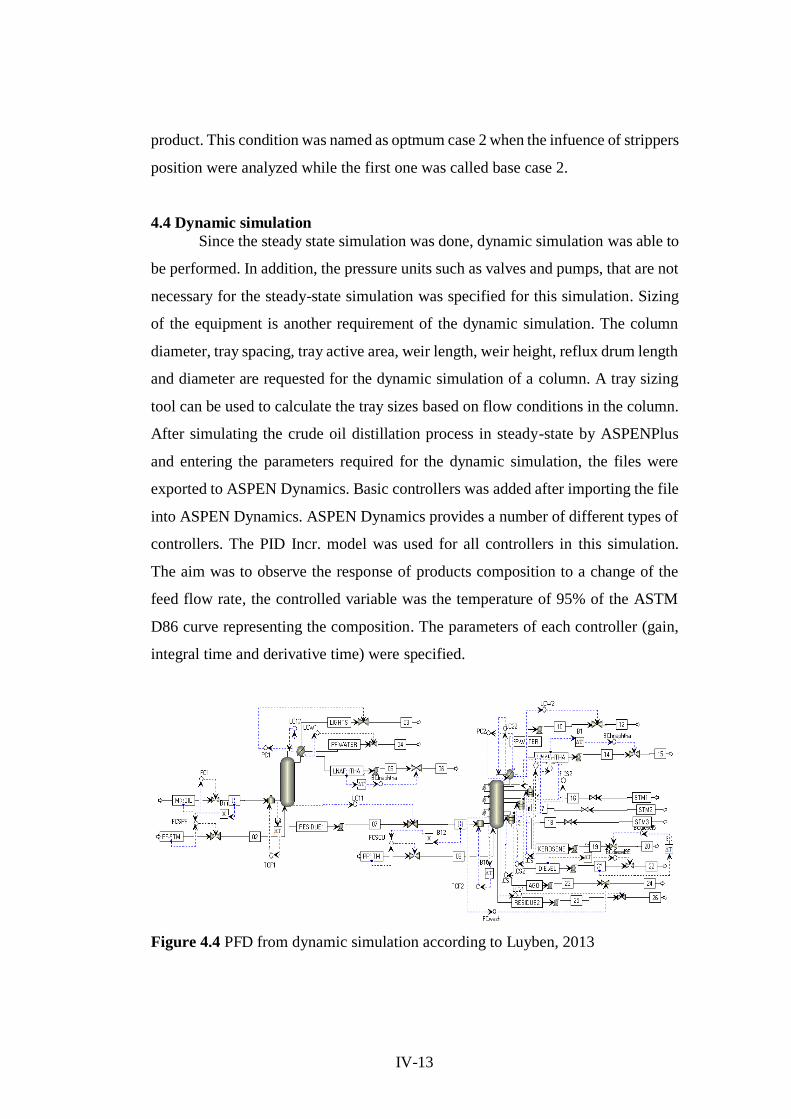
4.4 Dynamic simulation
Since the steady state simulation was done, dynamic simulation was able to
be performed. In addition, the pressure units such as valves and pumps, that are not
necessary for the steady-state simulation was specified for this simulation. Sizing
of the equipment is another requirement of the dynamic simulation. The column
diameter, tray spacing, tray active area, weir length, weir height, reflux drum length
and diameter are requested for the dynamic simulation of a column. A tray sizing
tool can be used to calculate the tray sizes based on flow conditions in the column.
After simulating the crude oil distillation process in steady-state by ASPENPlus
and entering the parameters required for the dynamic simulation, the files were
exported to ASPEN Dynamics. Basic controllers was added after importing the file
into ASPEN Dynamics. ASPEN Dynamics provides a number of different types of
controllers. The PID Incr. model was used for all controllers in this simulation.
The aim was to observe the response of products composition to a change of the
feed flow rate, the controlled variable was the temperature of 95% of the ASTM
D86 curve representing the composition. The parameters of each controller (gain,
integral time and derivative time) were specified.
Figure 4.4 PFD from dynamic simulation according to Luyben, 2013
IV-14
4.5 Analysis of the influence of feed temperature and strippers position on
CDU profile
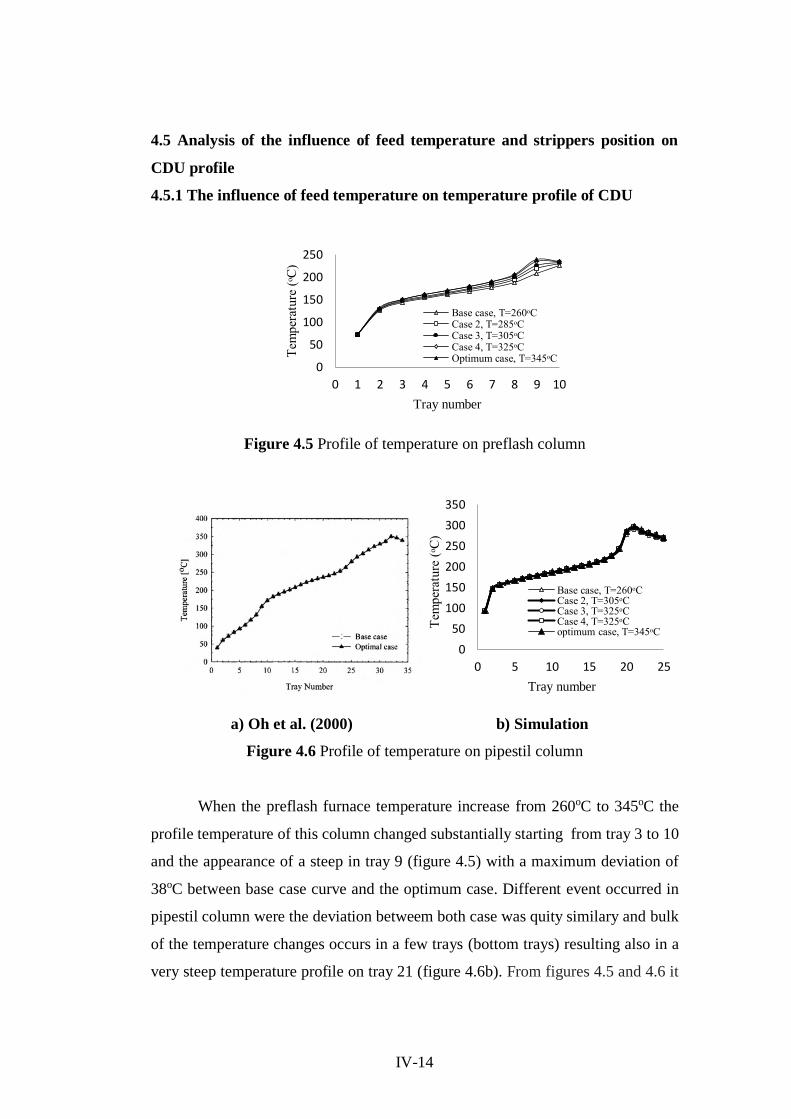
4.5.1 The influence of feed temperature on temperature profile of CDU
Figure 4.5 Profile of temperature on preflash column
a) Oh et al. (2000) b) Simulation
Figure 4.6 Profile of temperature on pipestil column
When the preflash furnace temperature increase from 260oC to 345oC the
profile temperature of this column changed substantially starting from tray 3 to 10
and the appearance of a steep in tray 9 (figure 4.5) with a maximum deviation of
38oC between base case curve and the optimum case. Different event occurred in
pipestil column were the deviation betweem both case was quity similary and bulk
of the temperature changes occurs in a few trays (bottom trays) resulting also in a
very steep temperature profile on tray 21 (figure 4.6b). From figures 4.5 and 4.6 it
0
50
100
150
200
250
0 1 2 3 4 5 6 7 8 9 10
Tem
per
ature
(ᵒC
)
Tray number
Base case, T=260ᵒCCase 2, T=285ᵒCCase 3, T=305ᵒCCase 4, T=325ᵒCOptimum case, T=345ᵒC
0
50
100
150
200
250
300
350
0 5 10 15 20 25
Tem
per
ature
(ᵒC
)
Tray number
Base case, T=260ᵒCCase 2, T=305ᵒCCase 3, T=325ᵒCCase 4, T=325ᵒCoptimum case, T=345ᵒC

IV-15
is noted that there is negligible difference between the temperature profiles of the
cases when the feeding temperature changed, since the temperature in each stage is
a function of the mass flow of the respective stage then it means that in each case
the flow it was satisfying and within the limits of tolerances.
The temperature profile of pipestil column was compared with the graph
presented by Oh (2000) the results from this comparison is shown in the figures
above (4.6a and 4.6b). The results of this validation are satisfactory because is
compatible with the literature although there are small discrepancies as the steep
localization. This fact is probably linked to four factors: the first is the difference in
the number of trays (35 trays for Oh paper and 25 for this research); second
difference is the feed tray was 33 and 22 respectivelly; third is the steam and feed
temperature and fourth is the stippers’ position. The comparison of the temperature
profile of preflash column was not possible due to lack of data. As in both columns
there was a substantial change in their profile temperature, it mean that there are
improvement in fractionation and a consequence changes in product quantity for
example the HNAPHTHA for the base case was obtained at 9515kg while with the
optimum case was obtained only at 6655kg of HNAPHTHA because increasing
feed temperature, the reflux ratio also rise in this case it was from 5.33 to 7.86 (table
4.3) that is why HNAPHTHA product become richer in light components and side
draw products thus as RESIDUE2 become rich in heavy components.
4.5.2 The influence of feed temperature on pressure profile of CDU
Figure 4.7a Profile of pressure on Figure 4.7b Profile of pressure on
Preflash column Pipestil column
1,8
2,2
2,6
3,0
3,4
1 2 3 4 5 6 7 8 9 10
Pre
ssure
(bar
)
Tray number
Base case, T=260ᵒCCase 2, T=285ᵒCCase 3, T=305ᵒCCase 4, T=325ᵒCOptimum case, T=345ᵒC
1,1
1,3
1,5
1,7
1 5 9 13 17 21 25
Pre
ssure
(bar
)
Tray number
Base case, T=260ᵒCCase 2, T=285ᵒCCase 3, T=305ᵒCCase 4, T=325ᵒCOptimum case, T=345ᵒC
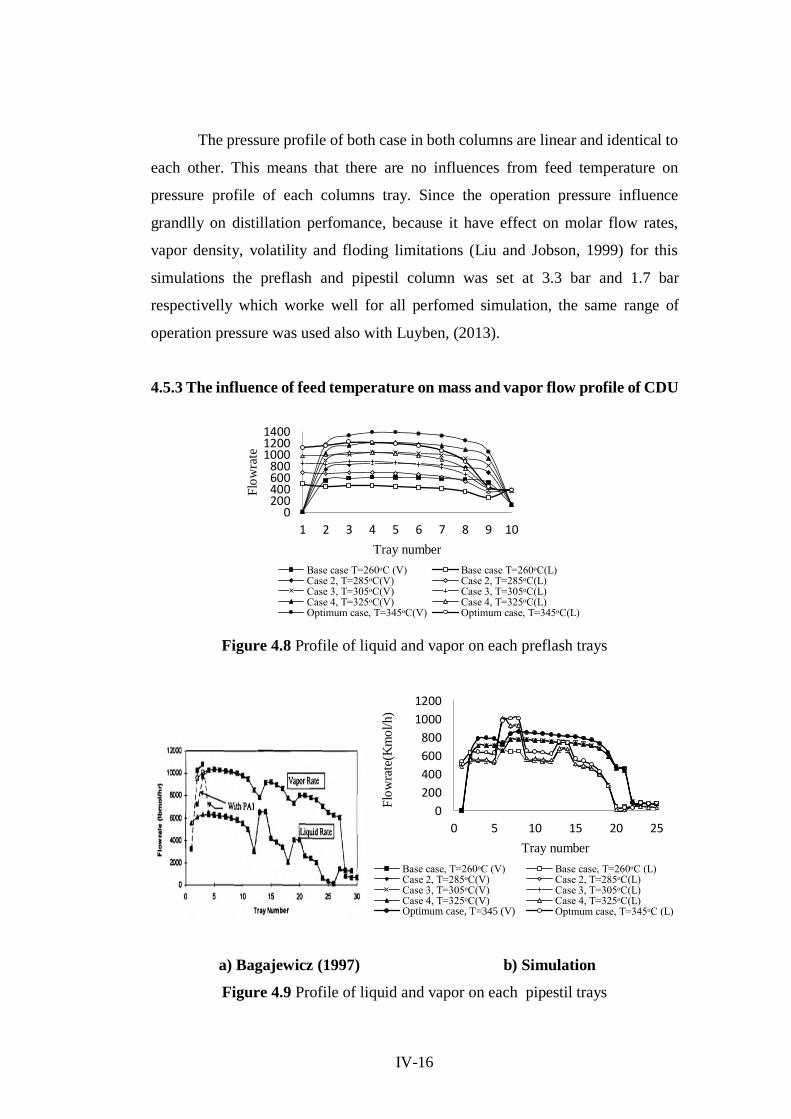
IV-16
The pressure profile of both case in both columns are linear and identical to
each other. This means that there are no influences from feed temperature on
pressure profile of each columns tray. Since the operation pressure influence
grandlly on distillation perfomance, because it have effect on molar flow rates,
vapor density, volatility and floding limitations (Liu and Jobson, 1999) for this
simulations the preflash and pipestil column was set at 3.3 bar and 1.7 bar
respectivelly which worke well for all perfomed simulation, the same range of
operation pressure was used also with Luyben, (2013).
4.5.3 The influence of feed temperature on mass and vapor flow profile of CDU
Figure 4.8 Profile of liquid and vapor on each preflash trays
a) Bagajewicz (1997) b) Simulation
Figure 4.9 Profile of liquid and vapor on each pipestil trays
0200400600800
100012001400
1 2 3 4 5 6 7 8 9 10
Flo
wra
te
Tray number
Base case T=260ᵒC (V) Base case T=260ᵒC(L)Case 2, T=285ᵒC(V) Case 2, T=285ᵒC(L)Case 3, T=305ᵒC(V) Case 3, T=305ᵒC(L)Case 4, T=325ᵒC(V) Case 4, T=325ᵒC(L)Optimum case, T=345ᵒC(V) Optimum case, T=345ᵒC(L)
0
200
400
600
800
1000
1200
0 5 10 15 20 25
Flo
wra
te(K
mo
l/h)
Tray number
Base case, T=260ᵒC (V) Base case, T=260ᵒC (L)Case 2, T=285ᵒC(V) Case 2, T=285ᵒC(L)Case 3, T=305ᵒC(V) Case 3, T=305ᵒC(L)Case 4, T=325ᵒC(V) Case 4, T=325ᵒC(L)Optimum case, T=345 (V) Optmum case, T=345ᵒC (L)

IV-17
The figures above shows the effect of incresing feed temperature on the
liquid and vapor tray rates. As shown in Figure 4.8, increasing the feed temperature
in the preflash furnace increases the deviation of vapor tray rates between the base
case and optimum case due to the high vaporization of feed at preflash column. So,
it means that increasing feed temperature, vaporization flow rate and vapor flow
rate will increase. The liquid rate of optimum case was higher also than the liquid
rate of base case because of the higher reflux ratio, 7.86, since the vapor ascend
must be equal to the descendent liquid to ensure mass exchange between them, so
the reflux must be higher to maintain the stability of temperature, pressure and
internal reflux in the column. The same behaviour was verified on pipestil column
but the liquid rate line for both case has a steep in tray 6 and 13 because is at this
tray where the pumparround liquid return to the main column. For both columns
there is no a disturbance in its operation caused by feed temperature changes, these
deviation is normal and the column operation was satisfying. The similar mass flow
profile of pipestil column was presented by Bagajewicz (1997) as shown in the
figure 4.9a. There are small discrepancies between this liquid and vapor profile due
to the differences in location of pumparounds and number o column trays.
Bagajewicz research the liquid draw from tray 15 through pumparound2 and it
return to the pipestil column on tray 13, the liquid also is taken from tray 21 and it
back to the main column on tray 19 while in this research the liquid draw from tray
8 through pumparound1 and it back on tray 6, and then the liquid is taken from tray
14 through pumparound2 and it back on tray 13 that is why there is diference in
steep localization.

IV-18
Figure 4.10a Ratio between liquid living Figure 4.10b Ratio between liquid
and vapor arriving in each preflash trays living and vapor arriving in each
pipestil trays pipestil trays
The Figures 4.10a and 4.10b clearly shows the effect of increasing
temperature on the ratio of liquid and vapor (L/V). Notice that the liquid vapor ratio
of optimum case in the preflash column become higher from tray 8 until the top
column, while in pipestil column it become higher from tray 19. It means that
fractionation was improved, however, volume of liquid which descends along the
column is greater thus thereby ensure improvement in internal reflux and minimized
the overvaporized materials without compromising the quality of product. As stated
by Silvestre (2005), this volume of liquid will be larger as the temperature of the
feed increases and if the temperature increase extremely, it may increase the
pressure drop between the trays causing floding and cracking of light materials in
furnace.
0,0
0,4
0,8
1,2
1,6
2,0
2,4
2,8
1 2 3 4 5 6 7 8 9 10
L/V
Tray number
Base case, T=260ᵒC
Case 2, T=285ᵒC
Case 3, T=305ᵒC
Case 4, T=325ᵒC
Optimum case, T=345ᵒC
0
0,4
0,8
1,2
1,6
1 5 9 13 17 21 25
L/V
Tray number
Base case, T=260ᵒC
Case 2, T=285ᵒC
Case 3, T=305ᵒC
Case 4, T=325ᵒC
Optimum case, T=345ᵒC
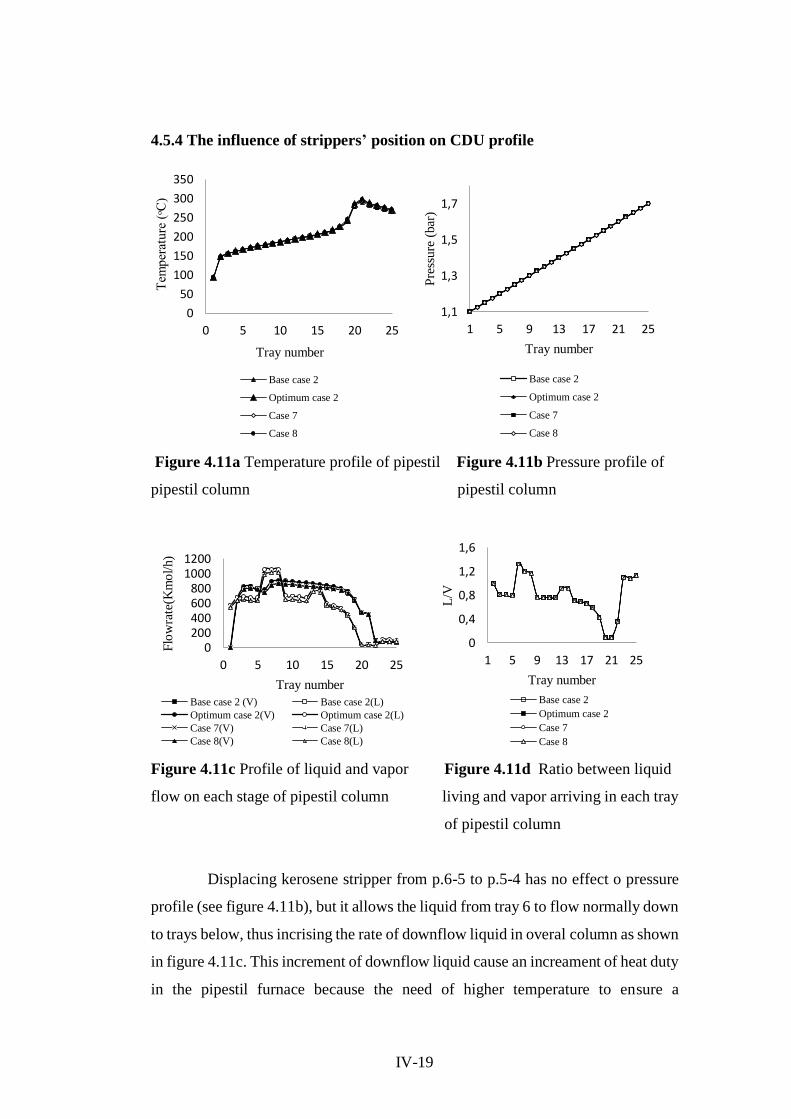
IV-19
4.5.4 The influence of strippers’ position on CDU profile
Figure 4.11a Temperature profile of pipestil Figure 4.11b Pressure profile of
pipestil column pipestil column
Figure 4.11c Profile of liquid and vapor Figure 4.11d Ratio between liquid
flow on each stage of pipestil column living and vapor arriving in each tray
pipestil trays of pipestil column
Displacing kerosene stripper from p.6-5 to p.5-4 has no effect o pressure
profile (see figure 4.11b), but it allows the liquid from tray 6 to flow normally down
to trays below, thus incrising the rate of downflow liquid in overal column as shown
in figure 4.11c. This increment of downflow liquid cause an increament of heat duty
in the pipestil furnace because the need of higher temperature to ensure a
0
50
100
150
200
250
300
350
0 5 10 15 20 25
Tem
per
ature
(ᵒC
)
Tray number
Base case 2
Optimum case 2
Case 7
Case 8
1,1
1,3
1,5
1,7
1 5 9 13 17 21 25
Pre
ssure
(bar
)
Tray number
Base case 2
Optimum case 2
Case 7
Case 8
0200400600800
10001200
0 5 10 15 20 25
Flo
wra
te(K
mo
l/h)
Tray number
Base case 2 (V) Base case 2(L)
Optimum case 2(V) Optimum case 2(L)
Case 7(V) Case 7(L)
Case 8(V) Case 8(L)
0
0,4
0,8
1,2
1,6
1 5 9 13 17 21 25
L/V
Tray number
Base case 2
Optimum case 2
Case 7
Case 8

IV-20
vaporization of back liquid, that is why the temperature profile on the botton trays
was high see figure 4.11b. All these have contributed to bulk temperature changes
to be higher in the pipestil column as shown in figure 4.11a. There is no significant
changes on CDU profile when strippers position was changed and it not effect the
CDU operation.
Table 4.12 Base case 2 side draw product specification
Variable Kerosene Diesel AGO
Stripper position p.6-5 p.14-13 p.19-18
Temperature (oC) 132.3 170.9 237.6
Pressura (bar) 1.2 1.4 1.5
Enthalpy (Gcal/hr) -3.2 -1.4 -13.1
Specific gravity 0.799 0.813 0.847
API gravity 45.7 42.6 35.5
95% vol. bp. ASTM D86 193 222 246.3
Table 4.13 Optimum case 2 side draw product specification
Variable Kerosene Diesel AGO
Stripper position p.5-4 p.14-13 p.19-18
Temperature (oC) 128.9 180.3 247
Pressura (bar) 1.2 1.4 1.5
Enthalpy (Gcal/hr) -3.1 -2.6 -13.8
Specific gravity 0.797 0.814 0.855
API gravity 46.1 42.4 33.9
95% vol. bp. ASTM D86 191.7 222 277
Tabel 4.12 and 4.13 shown the side draw product specification of both
cases. The comparison of product clearly shown that small deviaviation in
temperature, density occur between them, onle AGO had a highest deviation about
30,7 oC in the boiling point. Those changes did no affect the quality of kerosene,

IV-21
diesel and AGO because those side-draw products are taken from trays at which the
temperature corresponds to their cut point, accordingg to Leffler (2008) kerosene
cut range is 157oC - 232 oC, disel cut range 232 oC - 343 oC and AGO cut range 343
oC - 454 oC.
4.6 Dynamic simulation result
The products mass flow was observed after increasing and reducing the
feed flow of crude oil by 20%. Mass flow of the products was changed until the
composition (ASTM D86 95 % boiling point) reached the value corresponding to
the given product as shown in figures below:
Figure 4.12 Behavior of CDU products flow
0
100
200
300
400
500
0 1 2 3 4 5
Lig
ht
ends
(km
ol/
hr)
Time (hr)
-20% Of main feed
+20% Of main feed
700
750
800
850
900
950
0 1 2 3 4 5
ligh
t n
aph
(k
mo
l/h
r)
Time (hr)
-20% Of main feed
+20% Of main feed
200
250
300
350
400
450
0 1 2 3 4 5Hvy n
aphth
a (m
ol/
hr)
Time (hr)
- 20% Of main feed
+20 % Of main feed
0
100
200
300
400
500
0 2 4
Ker
ose
ne
(km
ol/
hr)
Time (hr)
-20% Of main feed
+20% Of main feed
100
200
300
400
500
0 1 2 3 4 5
Die
sel
(km
ol/
hr)
Time (hr)
-20% Of main feed
+20% Of main feed
0
50
100
150
200
250
0 1 2 3 4 5
AG
O (
km
ol/
hr)
Time (hr)
-20% of main feed
+20% of main feed

IV-22
Figures above shows the behavior of the CDU the disturbance of both
positive and negative 20% change are given in the setpoint of the main feed flow
control. Increasing the mass flow of the feed by 20%, the mass flow of the lights
ends (figure 4.12a) and heavy naphtha (figure 4.12c) reached a new steady-state at
higher and low rate flows; however, the mass flow of light naphtha and diesel flow
rate unexpectedly, although slightly, decreased as shown in figure 4.12b and 4.12d
respectively. The time necessary to reach a new steady-state for all product flow
rate was at 1.5 hr, the same event was reported by Hardary and Pavlik (2009). The
deviation of this method was significantly lower than that of the second method.
Experimental data for the simulation results verification in dynamic mode were not
available. Some limitation of ASPEN Dynamics in supporting different types of
column configurations and in dynamic simulation of the process start were found
(Aspen Plus, 2006).
a) Luyben (2013) b) Simulation
Figure 4.13 Temperature controllers
200
220
240
260
0 1 2 3 4 5
TF
1(º
C)
Time (hr)
-20% Of main feed
+20% Of main feed
320
340
360
380
400
0 1 2 3 4 5
TF
2(º
C)
Time (hr)
-20% Of main feed
+20% Of main feed

IV-23
a) Luyben (2013) b) Simulation
Figure 4.13 Temperature controllers, continued
The naphtha (light and heavy) and diesel flow was manipulated to control the
95% boiling point at 190oC and 222oC respectively also the 5% boiling point of
diesel was controlled but now manipulating kerosene flow ( Figure 4.4). The
disturbance of both positive and negative 20% change are given in the setpoint of
the main feed flow controller at time equal to 1hr, the changes are shown in figure
4.13. The figures above shown that the deviations in the 5% and 95% boiling points
180
185
190
195
200
0 1 2 3 4 5
95%
BP
Lig
ht
nap
hth
a (º
C)
Time (hr)
-20% Of main feed
+20% Of main feed
180
185
190
195
200
0 1 2 3 4 595%
BP
hvy n
aphth
a
(ºC
)Time (hr)
-20% Of main fedd
+20% of main feed
240
250
260
270
280
0 1 2 3 4 5
5%
BP
Die
sel
(ºC
)
Time (hr)
-20% Of main feed
+20% Of main feed
320
330
340
350
360
0 1 2 3 4 5
95%
Die
sel
(ºC
)
Time (hr)
-20% Of main feed
+20% Of main feed
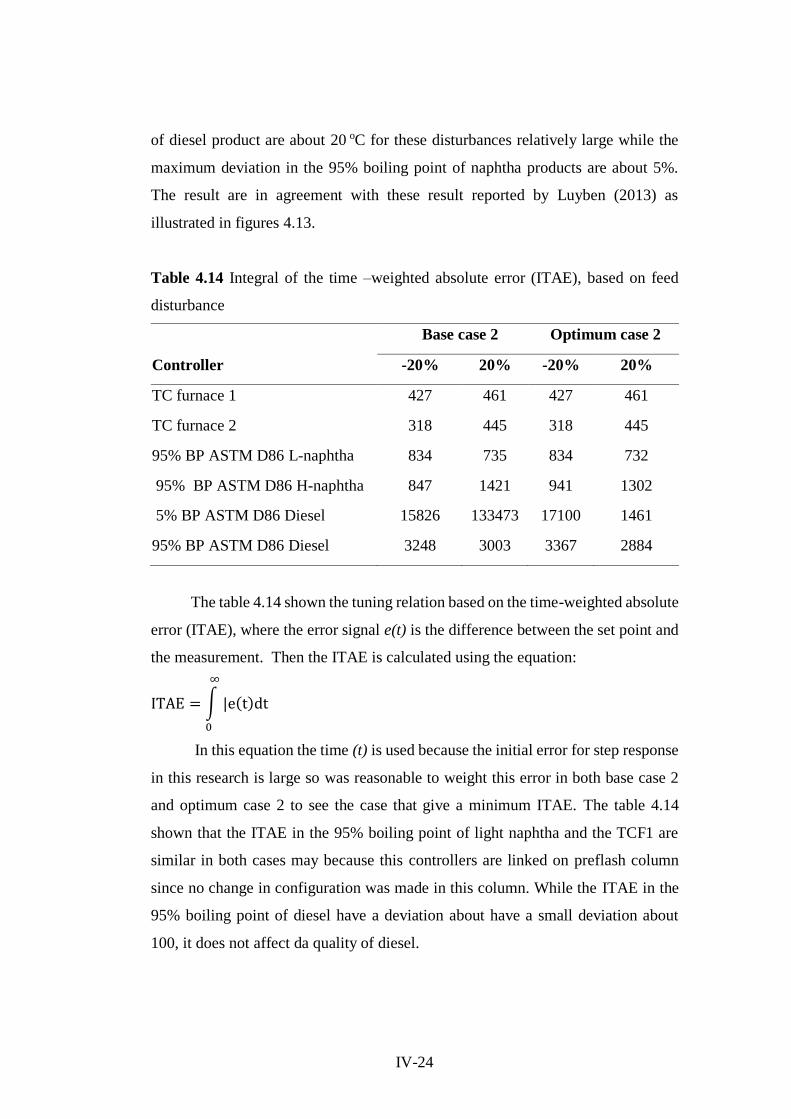
IV-24
of diesel product are about 20 oC for these disturbances relatively large while the
maximum deviation in the 95% boiling point of naphtha products are about 5%.
The result are in agreement with these result reported by Luyben (2013) as
illustrated in figures 4.13.
Table 4.14 Integral of the time –weighted absolute error (ITAE), based on feed
disturbance
Base case 2 Optimum case 2
Controller -20% 20% -20% 20%
TC furnace 1 427 461 427 461
TC furnace 2 318 445 318 445
95% BP ASTM D86 L-naphtha 834 735 834 732
95% BP ASTM D86 H-naphtha 847 1421 941 1302
5% BP ASTM D86 Diesel 15826 133473 17100 1461
95% BP ASTM D86 Diesel 3248 3003 3367 2884
The table 4.14 shown the tuning relation based on the time-weighted absolute
error (ITAE), where the error signal e(t) is the difference between the set point and
the measurement. Then the ITAE is calculated using the equation:
ITAE = ∫ |e(t)dt
∞
0
In this equation the time (t) is used because the initial error for step response
in this research is large so was reasonable to weight this error in both base case 2
and optimum case 2 to see the case that give a minimum ITAE. The table 4.14
shown that the ITAE in the 95% boiling point of light naphtha and the TCF1 are
similar in both cases may because this controllers are linked on preflash column
since no change in configuration was made in this column. While the ITAE in the
95% boiling point of diesel have a deviation about have a small deviation about
100, it does not affect da quality of diesel.
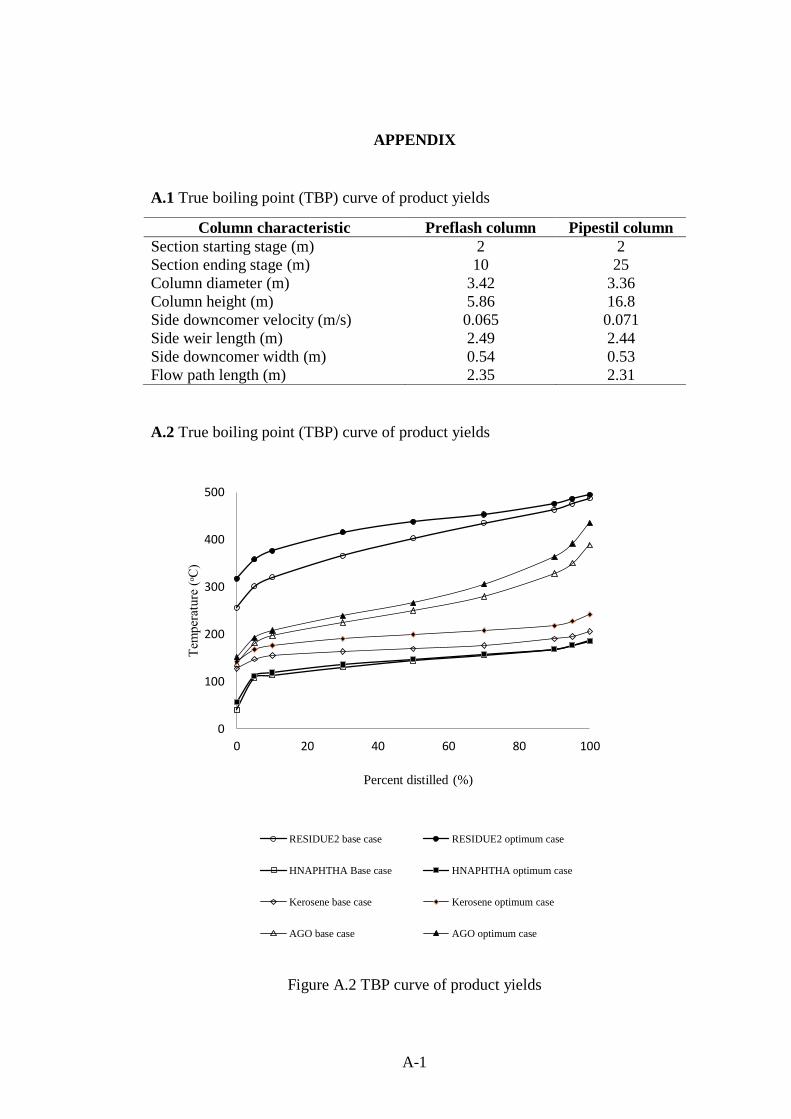
A-1
APPENDIX
A.1 True boiling point (TBP) curve of product yields
Column characteristic Preflash column Pipestil column
Section starting stage (m) 2 2
Section ending stage (m) 10 25
Column diameter (m) 3.42 3.36
Column height (m) 5.86 16.8
Side downcomer velocity (m/s) 0.065 0.071
Side weir length (m) 2.49 2.44
Side downcomer width (m) 0.54 0.53
Flow path length (m) 2.35 2.31
A.2 True boiling point (TBP) curve of product yields
Figure A.2 TBP curve of product yields
0
100
200
300
400
500
0 20 40 60 80 100
Tem
per
ature
(ᵒC
)
Percent distilled (%)
RESIDUE2 base case RESIDUE2 optimum case
HNAPHTHA Base case HNAPHTHA optimum case
Kerosene base case Kerosene optimum case
AGO base case AGO optimum case

A-2
A.3 cut range boiling point of base case and optimum case
Table A.3a cut range boiling point of base case
Product yield Cut boiling point range ASTM D86 (ᵒC)
LIGHTS 3.3 – 120.2
LNAPHTHA 28.9 – 130.8
HNAPHTHA 50.3 – 153.1
KEROSENE 125.4 – 177.1
DIESEL 147.5 – 206.8
ATG 164.8 – 356.9
RESIDUE2 292.3 – 458.9
Table A.3b cut range boiling point of optimum case
Product yield Cut boiling point range ASTM D86 (ᵒC)
LIGHTS 3.3 – 120.2
LNAPHTHA 27.5 – 129.4
HNAPHTHA 52.7 – 151.5
KEROSENE 124.1 – 176.4
DIESEL 145.2 – 206.6
ATG 164.8 – 356.9
RESIDUE2 302.5 – 458.8

A-3
A.3 Results from the steady state simulation with variation strippers positions on pipestil column
Table A.3 Results from simulation with variation strippers positions on pipestil
Column Description Temperature of preflash furnace (oC)
Base case 345 345 345 345
Kerosene stripper p.6-5 p.6-5 p.6-5 p.6-5 p.6-5
Stripper Diesel stripper p.14-13 p.14-13 p.13-12 p.12-11 p.14-13
AGO stripper p.19-18 p.19-18 p.19-18 p.19-18 p.20-19
a) Input (Kg/hr)
Crude oil 85000 85000 85000 85000 85000
PF-STM 790 790 790 790 790
Total input 85790 85790 85790 85790 85790
b) Product (Kg/hr)
LIGHT 983 476 476 476 476
LNAPHTHA 9316 12088 12088 12088 12088
Preflash PF-WATER 697 727 727 727 727
RESIDUE1 74794 72499 72499 72499 72499
Total product 85790 85790 85790 85790 85790
c) Reflux ratio 3.48 7.55 7.55 7.55 7.55
d). Heat duty (Gcal/hr)
Condenser duty -5.22 -11.84 -11.84 -11.84 -11.84
Furnace duty 8.21 14.97 14.97 14.97 14.97
a) Input (Kg/hr)
PP-STM 1260 1260 1260 1260 1260
STM1 324 324 324 324 324
STM2 90 90 90 90 90
STM3 72 72 72 72 72
RESIDUE1 74794 72499 72499 72499 72499
Total input 76540 74245 74245 74245 74245
b) Product (Kg/hr)
HNAPHTHA 9515 6655 6832 6957 6816
KEROSENE 8344 8286 8309 8341 8294
Pipestil DIESEL 2437 3942 6227 7788 6115
AGO 40758 41451 43731 45835 43622
RESIDUE2 13749 12175 7408 3586 7661
PP-WATER 1738 1737 1738 1738 1738
Total product 76540 74245 74245 74245 74245
c) Furnace temperature (ᵒC) 296 303 315 339 319
d) Reflux ratio 5.33 7.86 8.96 10.04 8.88
e)..Heat duty (Gcal/hr)
Pumparround1 duty -1.19 -11.17 -1.22 -1.27 -1.20
Pumparround2 duty 10.17 -0.18 -0.24 -0.30 -0.20
Condenser duty -6.97 -6.84 -7.89 -8.68 -7.70
Furnace duty 6.37 6.01 7.29 8.42 7.22

A-4
Table A.3 continued
Column Description Temperature of preflash furnace (oC)
345 345 345 345 345
Kerosene stripper p.6-5 p.6-5 p.6-5 p.6-5 p.6-5
Stripper Diesel stripper p.15-14 p.14-13 p.13-12 p.13-12 p.12-11
AGO stripper p.20-19 p.18-17 p.20-19 p.18-17 p.18-17
c) Input (Kg/hr)
Crude oil 85000 85000 85000 85000 85000
PF-STM 790 790 790 790 790
Total input 85790 85790 85790 85790 85790
d) Product (Kg/hr)
LIGHT 476 476 476 476 476
LNAPHTHA 12088 12088 12088 12088 12088
Preflash PF-WATER 727 727 727 727 727
RESIDUE1 72499 72499 72499 72499 72499
Total product 85790 85790 85790 85790 85790
c) Reflux ratio 7.55 7.55 7.55 7.55 7.55
d). Heat duty (Gcal/hr)
Condenser duty -11.84 -11.84 -11.84 -11.84 -11.84
Furnace duty 14.97 14.97 14.97 14.97 14.97
c) Input (Kg/hr)
PP-STM 1260 1260 1260 1260 1260
STM1 324 324 324 324 324
STM2 90 90 90 90 90
STM3 72 72 72 72 72
RESIDUE1 72499 72499 72499 72499 72499
Total input 74245 74245 74245 74245 74245
d) Product (Kg/hr)
HNAPHTHA 6761 6497 6928 6758 6919
KEROSENE 8279 8278 8314 8304 8338
Pipestil DIESEL 5532 1656 7458 5205 7277
AGO 42923 39694 45339 42582 45067
RESIDUE2 9012 16384 4467 9658 4906
PP-WATER 1738 1736 1738 1737 1738
Total product 74245 74245 74245 74245 74245
c) Furnace temperature (ᵒC) 314 290 334 312 333
d) Reflux ratio 8.59 7.06 9.75 8.41 9.66
e)..Heat duty (Gcal/hr)
Pumparround1 duty -1.18 -1.14 -1.24 -1.20 -1.26
Pumparround2 duty -0.17 -0.16 -0.25 -0.23 -0.30
Condenser duty -7.45 -6.17 -8.44 -7.32 -8.36
Furnace duty 6.87 5.25 8.12 6.76 8.05

A-5
Table A.3 continued
Column Description Temperature of preflash furnace (oC)
345 345 345 345 345
Kerosene stripper p.5-4 p.5-4 p.5-4 p.5-4 p.5-4
Stripper Diesel stripper p.15-14 p.14-13 p.14-13 p.14-13 p.13-12
AGO stripper p.20-19 p.19-18 p.20-19 p.18-17 p.19-18
e) Input (Kg/hr)
Crude oil 85000 85000 85000 85000 85000
PF-STM 790 790 790 790 790
Total input 85790 85790 85790 85790 85790
f) Product (Kg/hr)
LIGHT 476 476 476 476 476
LNAPHTHA 12088 12088 12088 12088 12088
Preflash PF-WATER 727 727 727 727 727
RESIDUE1 72499 72499 72499 72499 72499
Total product 85790 85790 85790 85790 85790
c) Reflux ratio 7.55 7.55 7.55 7.55 7.55
d). Heat duty (Gcal/hr)
Condenser duty -11.84 -11.84 -11.84 -11.84 -11.84
Furnace duty 14.97 14.97 14.97 14.97 14.97
e) Input (Kg/hr)
PP-STM 1260 1260 1260 1260 1260
STM1 324 324 324 324 324
STM2 90 90 90 90 90
STM3 72 72 72 72 72
RESIDUE1 72499 72499 72499 72499 72499
Total input 74245 74245 74245 74245 74245
f) Product (Kg/hr)
HNAPHTHA 6062 6075 6175 5826 6136
KEROSENE 8166 8175 8176 8169 8186
Pipestil DIESEL 7174 7354 8700 3640 8378
AGO 43722 43911 45731 40444 45263
RESIDUE2 7382 6992 3724 14428 4542
PP-WATER 1739 1739 1739 1737 1739
Total product 74245 74245 74245 74245 74245
c) Furnace temperature (ᵒC) 321 323 338 295 324
d) Reflux ratio 10.27 1041 11.43 8.49 10.41
e)..Heat duty (Gcal/hr)
Pumparround1 duty -1.21 -1.22 -1.24 -1.17 -1.26
Pumparround2 duty -0.17 -0.21 -0.22 -0.16 -0.25
Condenser duty -7.79 -7.89 -8.66 -6.46 -8.07
Furnace duty 7.30 7.25 8.34 5.65 7.70

A-6
Table A.3 continued
Column Description Temperature of preflash furnace (oC)
345 345 345 345 345
Kerosene stripper p.5-4 p.5-4 p.5-4 p.5-4 p.5-4
Stripper Diesel stripper p.13-12 p.13-12 p.12-11 p.12-11 p.15-14
AGO stripper p.20-19 p.18-17 p.19-18 p.18-17 p.19-18
g) Input (Kg/hr)
Crude oil 85000 85000 85000 85000 85000
PF-STM 790 790 790 790 790
Total input 85790 85790 85790 85790 85790
h) Product (Kg/hr)
LIGHT 476 476 476 476 476
LNAPHTHA 12088 12088 12088 12088 12088
Preflash PF-WATER 727 727 727 727 727
RESIDUE1 72499 72499 72499 72499 72499
Total product 85790 85790 85790 85790 85790
c) Reflux ratio 7.55 7.55 7.55 7.55 7.55
d). Heat duty (Gcal/hr)
Condenser duty -11.84 -11.84 -11.84 -11.84 -11.84
Furnace duty 14.97 14.97 14.97 14.97 14.97
g) Input (Kg/hr)
PP-STM 1260 1260 1260 1260 1260
STM1 324 324 324 324 324
STM2 90 90 90 90 90
STM3 72 72 72 72 72
RESIDUE1 72499 72499 72499 72499 72499
Total input 74245 74245 74245 74245 74245
h) Product (Kg/hr)
HNAPHTHA 6174 5826 6171 6131 5806
KEROSENE 8188 8169 8204 8202 8162
Pipestil DIESEL 8951 3640 9204 8615 3398
AGO 46132 40444 46502 45585 40278
RESIDUE2 3061 14428 2425 3972 14863
PP-WATER 1739 1737 1739 1739 1737
Total product 74245 74245 74245 74245 74245
c) Furnace temperature (ᵒC) 341 295 345 338 294
d) Reflux ratio 11.63 8.49 11.90 11.38 8.43
e)..Heat duty (Gcal/hr)
Pumparround1 duty -1.27 -1.17 -1.30 -1.29 -1.16
Pumparround2 duty -0.26 -0.16 -0.30 -0.31 -0.13
Condenser duty -8.79 -6.46 -8.95 -8.57 -6.40
Furnace duty 8.53 5.65 8.76 8.32 5.55
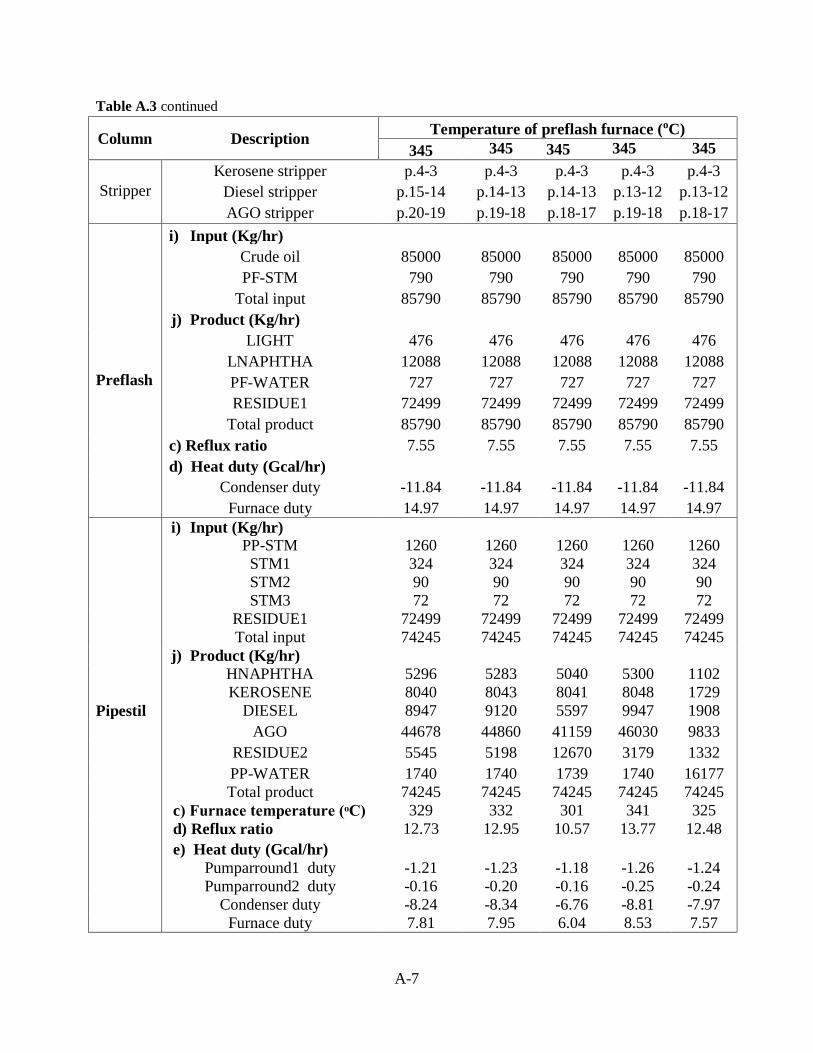
A-7
Table A.3 continued
Column Description Temperature of preflash furnace (oC)
345 345 345 345 345
Kerosene stripper p.4-3 p.4-3 p.4-3 p.4-3 p.4-3
Stripper Diesel stripper p.15-14 p.14-13 p.14-13 p.13-12 p.13-12
AGO stripper p.20-19 p.19-18 p.18-17 p.19-18 p.18-17
i) Input (Kg/hr)
Crude oil 85000 85000 85000 85000 85000
PF-STM 790 790 790 790 790
Total input 85790 85790 85790 85790 85790
j) Product (Kg/hr)
LIGHT 476 476 476 476 476
LNAPHTHA 12088 12088 12088 12088 12088
Preflash PF-WATER 727 727 727 727 727
RESIDUE1 72499 72499 72499 72499 72499
Total product 85790 85790 85790 85790 85790
c) Reflux ratio 7.55 7.55 7.55 7.55 7.55
d). Heat duty (Gcal/hr)
Condenser duty -11.84 -11.84 -11.84 -11.84 -11.84
Furnace duty 14.97 14.97 14.97 14.97 14.97
i) Input (Kg/hr)
PP-STM 1260 1260 1260 1260 1260
STM1 324 324 324 324 324
STM2 90 90 90 90 90
STM3 72 72 72 72 72
RESIDUE1 72499 72499 72499 72499 72499
Total input 74245 74245 74245 74245 74245
j) Product (Kg/hr)
HNAPHTHA 5296 5283 5040 5300 1102
KEROSENE 8040 8043 8041 8048 1729
Pipestil DIESEL 8947 9120 5597 9947 1908
AGO 44678 44860 41159 46030 9833
RESIDUE2 5545 5198 12670 3179 1332
PP-WATER 1740 1740 1739 1740 16177
Total product 74245 74245 74245 74245 74245
c) Furnace temperature (ᵒC) 329 332 301 341 325
d) Reflux ratio 12.73 12.95 10.57 13.77 12.48
e)..Heat duty (Gcal/hr)
Pumparround1 duty -1.21 -1.23 -1.18 -1.26 -1.24
Pumparround2 duty -0.16 -0.20 -0.16 -0.25 -0.24
Condenser duty -8.24 -8.34 -6.76 -8.81 -7.97
Furnace duty 7.81 7.95 6.04 8.53 7.57
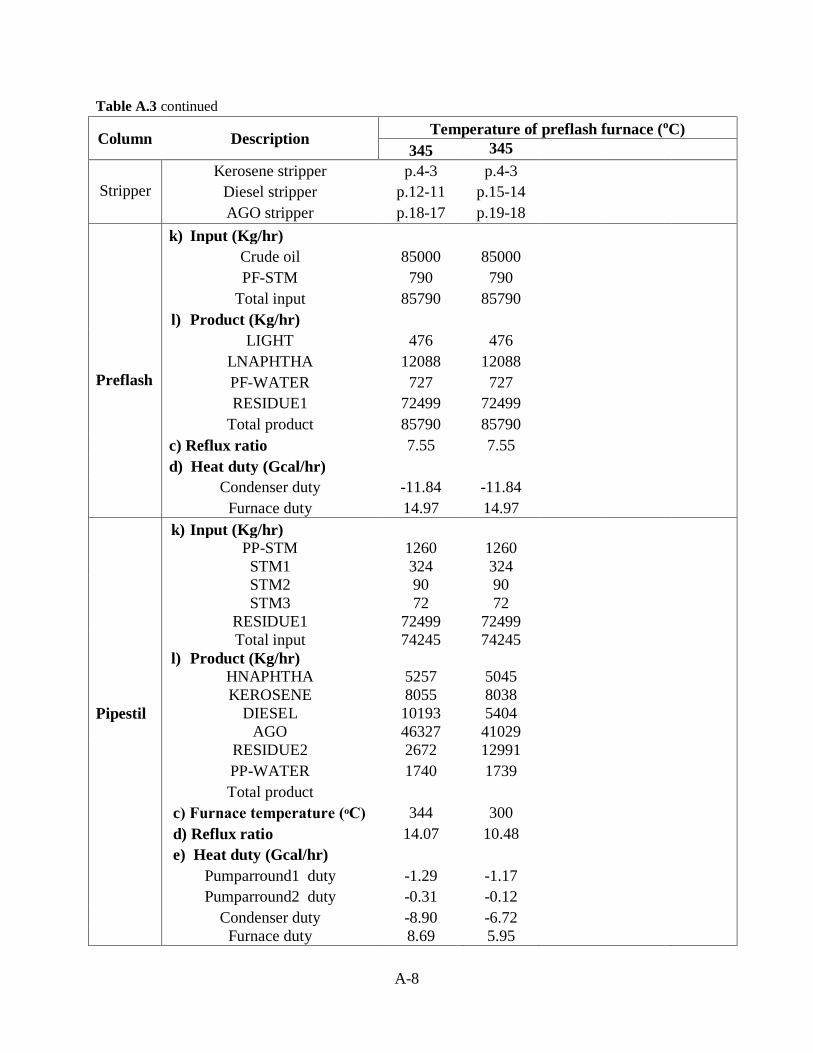
A-8
Table A.3 continued
Column Description Temperature of preflash furnace (oC)
345 345
Kerosene stripper p.4-3 p.4-3
Stripper Diesel stripper p.12-11 p.15-14
AGO stripper p.18-17 p.19-18
k) Input (Kg/hr)
Crude oil 85000 85000
PF-STM 790 790
Total input 85790 85790
l) Product (Kg/hr)
LIGHT 476 476
LNAPHTHA 12088 12088
Preflash PF-WATER 727 727
RESIDUE1 72499 72499
Total product 85790 85790
c) Reflux ratio 7.55 7.55
d). Heat duty (Gcal/hr)
Condenser duty -11.84 -11.84
Furnace duty 14.97 14.97
k) Input (Kg/hr)
PP-STM 1260 1260
STM1 324 324
STM2 90 90
STM3 72 72
RESIDUE1 72499 72499
Total input 74245 74245
l) Product (Kg/hr)
HNAPHTHA 5257 5045
KEROSENE 8055 8038
Pipestil DIESEL 10193 5404
AGO 46327 41029
RESIDUE2 2672 12991
PP-WATER 1740 1739
Total product
c) Furnace temperature (ᵒC) 344 300
d) Reflux ratio 14.07 10.48
e)..Heat duty (Gcal/hr)
Pumparround1 duty -1.29 -1.17
Pumparround2 duty -0.31 -0.12
Condenser duty -8.90 -6.72
Furnace duty 8.69 5.95
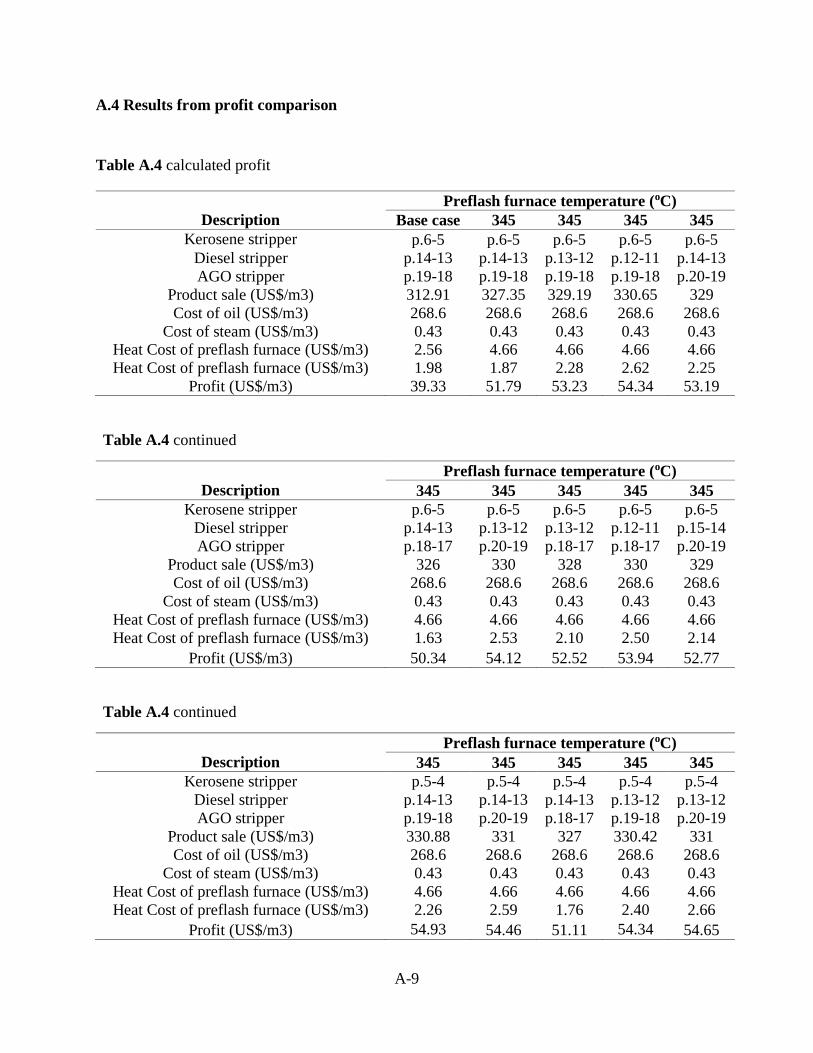
A-9
A.4 Results from profit comparison
Table A.4 calculated profit
Preflash furnace temperature (oC)
Description Base case 345 345 345 345
Kerosene stripper p.6-5 p.6-5 p.6-5 p.6-5 p.6-5
Diesel stripper p.14-13 p.14-13 p.13-12 p.12-11 p.14-13
AGO stripper p.19-18 p.19-18 p.19-18 p.19-18 p.20-19
Product sale (US$/m3) 312.91 327.35 329.19 330.65 329
Cost of oil (US$/m3) 268.6 268.6 268.6 268.6 268.6
Cost of steam (US$/m3) 0.43 0.43 0.43 0.43 0.43 Heat Cost of preflash furnace (US$/m3) 2.56 4.66 4.66 4.66 4.66
Heat Cost of preflash furnace (US$/m3) 1.98 1.87 2.28 2.62 2.25
Profit (US$/m3) 39.33 51.79 53.23 54.34 53.19
Table A.4 continued
Preflash furnace temperature (oC)
Description 345 345 345 345 345
Kerosene stripper p.6-5 p.6-5 p.6-5 p.6-5 p.6-5
Diesel stripper p.14-13 p.13-12 p.13-12 p.12-11 p.15-14
AGO stripper p.18-17 p.20-19 p.18-17 p.18-17 p.20-19
Product sale (US$/m3) 326 330 328 330 329
Cost of oil (US$/m3) 268.6 268.6 268.6 268.6 268.6
Cost of steam (US$/m3) 0.43 0.43 0.43 0.43 0.43
Heat Cost of preflash furnace (US$/m3) 4.66 4.66 4.66 4.66 4.66
Heat Cost of preflash furnace (US$/m3) 1.63 2.53 2.10 2.50 2.14
Profit (US$/m3) 50.34 54.12 52.52 53.94 52.77
Table A.4 continued
Preflash furnace temperature (oC)
Description 345 345 345 345 345
Kerosene stripper p.5-4 p.5-4 p.5-4 p.5-4 p.5-4
Diesel stripper p.14-13 p.14-13 p.14-13 p.13-12 p.13-12
AGO stripper p.19-18 p.20-19 p.18-17 p.19-18 p.20-19
Product sale (US$/m3) 330.88 331 327 330.42 331
Cost of oil (US$/m3) 268.6 268.6 268.6 268.6 268.6
Cost of steam (US$/m3) 0.43 0.43 0.43 0.43 0.43
Heat Cost of preflash furnace (US$/m3) 4.66 4.66 4.66 4.66 4.66
Heat Cost of preflash furnace (US$/m3) 2.26 2.59 1.76 2.40 2.66
Profit (US$/m3) 54.93 54.46 51.11 54.34 54.65

A-10
Table A.4 continued
Table A.4 continued
Table A.4 continued
Preflash furnace temperature (oC)
Description 345 345 345 345 345
Kerosene stripper p.5-4 p.5-4 p.5-4 p.5-4 p.5-4
Diesel stripper p.13-12 p.12-11 p.12-11 p.15-14 p.15-14
AGO stripper p.18-17 p.19-18 p.18-17 p.19-18 p.20-19
Product sale (US$/m3) 327 331.22 331 326 329
Cost of oil (US$/m3) 268.6 268.6 268.6 268.6 268.6
Cost of steam (US$/m3) 0.43 0.43 0.43 0.43 0.43
Heat Cost of preflash furnace (US$/m3) 4.66 4.66 4.66 4.66 4.66
Heat Cost of preflash furnace (US$/m3) 1.76 2.73 2.59 1.73 2.27
Profit (US$/m3) 51.11 54.80 54.34 50.98 53.40
Preflash furnace temperature (oC)
Description 345 345 345 345 345
Kerosene stripper p.4-3 p.4-3 p.4-3 p.4-3 p.4-3
Diesel stripper p.14-13 p.14-13 p.13-12 p.13-12 p.12-11
AGO stripper p.19-18 p.18-17 p.19-18 p.18-17 p.18-17
Product sale (US$/m3) 330.31 327 331.08 330 331
Cost of oil (US$/m3) 268.6 268.6 268.6 268.6 268.6
Cost of steam (US$/m3) 0.43 0.43 0.43 0.43 0.43
Heat Cost of preflash furnace (US$/m3) 4.66 4.66 4.66 4.66 4.66
Heat Cost of preflash furnace (US$/m3) 2.47 1.88 2.47 2.35 2.71
Profit (US$/m3) 54.15 51.83 54.91 53.72 54.86
Preflash furnace temperature (oC)
Description 345 345
Kerosene stripper p.4-3 p.4-3
Diesel stripper p.15-14 p.15-14
AGO stripper p.19-18 p.20-19
Product sale (US$/m3) 327 330
Cost of oil (US$/m3) 268.6 268.6
Cost of steam (US$/m3) 0.43 0.43
Heat Cost of preflash furnace (US$/m3) 4.66 4.66
Heat Cost of preflash furnace (US$/m3) 1.85 2.43
Profit (US$/m3) 51.74 54.08

A.5 Mass and vapor flow on each column stages
Table A.5c Mass and vapor flow on each stage of pipestil column (Base case)
Liquid flow Vapor flow Mass flow liquid Mass flow vapor Volume flow liquid Volume flow vapor
Stage on stage on stage from stage to stage from stage to stage
( kmol/hr): ( kmol/hr): (kg/hr): (kg/hr): (m³/hr): (m³/hr):
1 503 0 61980 61980 86,5 17926
2 535 600 67781 79033 101 21256
3 539 711 70422 81674 106 21217
4 535 715 71492 82744 107 20890
5 529 711 72042 83295 109 20940
6 659 721 136800 95383 207 22213
7 640 774 126588 97259 192 22103
8 650 780 127419 98091 193 21764
9 552 777 79044 98316 120 21329
10 545 770 79174 98447 120 20899
11 538 763 79240 98513 121 20479
12 531 756 79236 98509 121 20065
13 659 749 99532 100734 152 20451
14 653 746 99829 99803 153 19412
15 500 740 77702 99321 119 18959
16 484 729 76568 98188 117 18419
17 454 713 73944 95563 113 17673
18 393 683 67229 88849 102 16660
19 275 600 52712 71399 79,4 13507
20 47,0 482 4777 67082 7,04 12814
21 42,0 454 2373 64679 3,47 12626
22 57,1 104 17105 4616 23,9 2320
23 88,3 84,8 15960 3470 21,9 2118
24 84,1 79,2 15162 2673 20,6 1973
25 79,5 75,6 13749 1260 18,4 1941

Table A.5d Mass and vapor flow on each stage of pipestil column (Optimum case)
Liquid flow Vapor flow Mass flow liquid Mass flow vapor Volume flow liquid Volume flow vapor
Stage on stage on stage from stage to stage from stage to stage
( kmol/hr): ( kmol/hr): (kg/hr): (kg/hr): (m³/hr): (m³/hr):
1 570 0 71056 71056 99,0 20054
2 678 667 86380 94194 129,1 24747
3 684 825 89480 97294 134,5 24714
4 679 831 90731 98546 136,7 24859
5 678 780 92226 95936 139,4 22713
6 1052 779 145642 112705 220,5 25760
7 1058 896 147530 114594 223,9 25570
8 1054 901 148513 115577 225,8 25179
9 702 898 100270 115935 152,6 24689
10 694 891 100482 116147 153,2 24192
11 685 882 100583 116248 153,5 23692
12 674 873 100583 116247 153,7 23186
13 801 863 121451 119045 185,7 23637
14 790 853 121725 117175 186,4 22271
15 595 843 93630 116559 143,5 21693
16 571 826 92217 115146 141,4 21009
17 532 802 88853 111782 136,1 20055
18 445 763 78943 101872 120,5 18566
19 268 654 55254 74943 82,9 14102
20 46 477 3839 70606 5,60 13406
21 42 450 2345 69112 3,41 13303
22 26 87 8919 3187 12,36 2207
23 113 77 8249 2518 11,25 2078
24 104 74 7792 2060 10,52 1978
25 98 73 6992 1260 9,33 1941

Table A.5a Mass and vapor flow on each stage of preflash column (Base case)
Liquid flow Vapor flow Mass flow liquid Mass flow vapor Volume flow liquid Volume flow vapor
Stage on stage on stage from stage to stage from stage to stage
( kmol/hr): ( kmol/hr): (kg/hr): (kg/hr): (m³/hr): (m³/hr):
1 1127 7,72 109721 110198 24752 2885436
2 1163 1175 126790 140081 29586 3146594
3 1221 1337 138223 151514 32641 3102258
4 1218 1394 141476 154767 33669 2934344
5 1195 1391 142350 155641 34102 2748435
6 1153 1368 141781 155072 34166 2559195
7 1075 1326 137951 151243 33398 2342691
8 877 1248 121582 134873 29451 1995138
9 452 1050 78335 91626 18584 1426428
10 386 131 72499 790 16535 94634
Table A.5b Mass and vapor flow on each stage of preflash column (Optimum case)
Liquid flow Vapor flow Mass flow liquid Mass flow vapor Volume flow liquid Volume flow vapor
Stage on stage on stage from stage to stage from stage to stage
( kmol/hr): ( kmol/hr): (kg/hr): (kg/hr): (m³/hr): (m³/hr):
1 491 15,8 47626 48608 71,5 8775
2 442 546 47405 58400 73,1 9134
3 459 594 51099 62094 79,6 8880
4 458 611 52046 63041 81,6 8378
5 449 610 52109 63104 82,2 7847
6 435 601 51665 62661 81,9 7323
7 410 587 50428 61423 80,3 6780
8 363 562 47059 58054 75 6115
9 256 515 37220 48215 59 5345
10 407 135 74795 790 112 627

V-1
CHAPTER 5
CONCLUSION AND RECOMMENDATION
5.1 Conclusion
The influence of feed temperature and strippers’ position on CDU profile
was studied by employing variation on the furnace’s temperature in preflash
column and strippers’ positions on pipestil column. The optimal operating
conditions were obtained by calculating the maximum profit of USD54.93/m³, it
happened when the temperature in the furnace of preflash column was at 345ᵒC
while strippers’ position on pipestil was at S1p.5-4, S2p.14-13 and S3p.19-18.
Finally the CDU profile was verified, the results of this research are as follow:
1. When the feed temperature increases, the column’s temperature profile
changes substantially and the appearance of a steep in tray above the feed tray.
Since the temperatre on top of the column is constant, increasing the larger of the
feed temperature that comes to the flash zone of preflash column cause a larger
deviation of the temperature between the top and bottom of the column and this
increases the amount of condensed liquid that is why the temperature in the
bottom was high and it caused the steep to appear.
2. Incresing the feed temperature causes an increment of L/V, which means
that fractionation is improved, however, the volume of liquid which descends
along the column is greater and the internal reflux is improved which minimized
the over vaporized materials without compromising the quality of product.
3. The pressure profile of both case in both columns are linear and identical
to each other, it means that there are no influences from feed temperature or
striper position on pressure profile of each columns tray.
4. Displacing kerosene stripper from p.6-5 to p.5-4 increases the rate of
downflow liquid in overal column. This increment of downflow liquid causes an

V-2
increament of heat duty in the pipestil furnace because of the need of higher
temperature to ensure vaporization of back liquid, that is why the temperature
profile on the bottom trays was high.
5. Increasing the mass flow of the feed by 20%, the mass flow of the lights
ends and heavy naphtha reached a new steady-state at higher and low rate flows;
however, the mass flow of light naphtha and diesel flow rate unexpectedly,
although slightly, decreased in both type of disturbance but the time necessary to
reach a new steady-state for all product flow rate was at 1.5 hr. From this analysis
of stream product flow the deviations was small that is why do not influence the
products composition significantly.
6. No significant changes was found on CDU profile when the feed
temperature or stripper position was changed, the deviation is normal. The column
operation was satisfying for all cases no disturbance was verified in the CDU
operation.
5.2 Recommendation
In this study the suggestions to be considered is comparison of data
obtained with real plant in order to know the accuracy of those determined
conditions. Need also to change the percentages of individual crude oil used to
understand how it influence in the production of diesel and kerosene the more
expensive products and higher demand.

RFERENCES
.
1. Aspen Plus (2006), Physical Property Methods and Models, Aspen Plus Inc.,
Cambridge.
2. Bagajewics, M. (1997), “On the design flexibility of atmospheric crude
fractionation units”, Chem. Eng. Comm., Vol. 166, pag. 111-136.
3. Bagajewics, M. and Ji, S. (2001), “Rigorous procedure for the design of
conventional atmospheric crude fractionation units. Part 1: Targeting”, Ind.
Eng. Chem., Vol. 40, pag. 617-626.
4. Budhiarto, A. (2009), Buku Pintar Migas Indonesia, Ditigem Migas-ESDM,
Jakarta.
5. Direktorate Jenderal (2015), Harga Minyak Mentah Indonesia untuk Bulan
Augustus 2015, Jakarta.
6. Errico, M. (2009), “Energy saving in a crude distillation unit by a preflash
implementation”, Applied thermal engineering, Vol. 29, pag. 1642-1647.
7. Fahim, M., Al-Sahhaf, T. and Elkilani, A. (2010), Fundamentals of petroleum
refining, Elsevier, UK, pag. 83.
8. Gandalla, M. (2013), “A new optimization based retrofit approach for
revamping an Egyptian crude oil distillation unit”, Proceedings of 13th
conference – Advancements in renewable energy and clean environment, Ed:
Kamel, D. et al., British University in Egypt, Cairo, pag. 454-464.
9. Gutierrez, J. (2014), “Thermodynamic Properties for the Simulation of Crude
Oil”, Jounal of engineering research and applications, vol.4, pag.190-194.
10. Handogo, R. (2011), “Optimization on the performance of crude distillation
unit (CDU)”, Asia-pacific Journal of Chemical Engineering, Vol. 1, No. 7,
pag. S78-S87.
11. Haydary, J. and Pavlik, T. (2009), “Steady-state aned dynamic simulation of
crude oil distillation using Aspen plus and Aspen dynamic”, Petrolum and
coal, vol. 51, pag. 100-109.
12. Hossein, H.S., Zarei, A. and Rahimi, R. (2013), “CFD and experimental
studies of liquid weeping in circular sieve tray columns”, Chemical
Engineering Research and Design, No. 91, pag. 2333-2345.

13. Jobson, M. (2014), Distillations: Fundamentals and principles, Elsevier Inc.
Manchester.
14. Jones, D. S. and Pujadó, P.R. (2006), Handbook of petroleum processing,
Springer, USA.
15. Kirgina, M.V. (2014), “Complex system form gasoline blending
maintenance”, Proceeding of 15th international conference - Chemistry and
Chemical engineering in XXI, Eds. Sakhnevitch, B.V. et al., National Research
Tomsk Polytechnic University, Russia, pag. 289-296.
16. Luo, Y. (2013), “Simultaneous optimization for heat-integrated crude oil
distillation system”, Proceding of the 6th international conference on process
systems engineering, Eds: Wang, H. et al., Tianjin University, Tianjin, pag. 25-
27.
17. Luyben, L. (2006), Distillation Design and Control using Aspen Simulation,
New Jersey.
18. Malvin, A., Chan, A. and Lau, P.L. (2014), “CFD study of distillation sieve
tray flow regimes using the droplets size distribution technique”, Journal of
the Taiwan Institute of Chemical Engineers, No. 45, pag. 1354-1368.
19. Muraza, O. and Ahmad, G. (2015), “Role of zeolite catalysts for benzene
removal from gasoline via alkylation: A review”, Microporous and
Mesoporous Materiales, No. 213, pag. 169-180.
20. Oil Price Information Sistem (2016), a Dayly Report on Asia naphtha, LPG
and Gasoline Spot Price, www.globalpetrolprices.com acess data February
16th 2016.
21. Puspitasari, E. and Setyarini, A. (2010), Optimasi kinerja crude distillation
unit, Undergraduate final project, Institut Teknologi Sepuluh Nopember,
Surabaya.
22. Rahimpour, M.R., Irashahi, D., Paymooni, K., Bahmanpour, A.M., and
Shariati, A. (2011), “Simultaneous hydrogen and aromatics enhancement by
obtaining optimum temperaturevbprofile and hydrogen removal in naphtha
reforming; a novel theorical study”, International Journal Hydrogen Energy,
No. 36, pag. 8316-8326.

23. Ravindran, A., Ragsdell, K.M. and Reklaitis, G.V. (2006), Engineering
optimization, methods and applications, John Wiley & Sons, Inc., New Jersey,
pag. 2.
24. Saraf, D. (2010), “A crude distillation unit model suitable for online
applications”, Fuel processing technology, vol. 73, pag. 1-21.
25. Seo, J.W., Oh, M. and Lee, T.H. (2000), “Design optimization of crude oil
distillation”, Chemical engineering technology, Vol. 23, No. 3.
26. Silvestre, F. (2005), Inferência da curva de destillação ASTM da destilação
atmosférica para controle de avan,cado, Undgraduate final project,
Universidade federal de Santa Catarina, Florianópolis.
27. Simanzhenkov, V. and Idem, R. (2003), Crude oil chemistry, Marcel Denver
Inc., New York.
28. Speight, G.S. (2011), The refinery of future, first edition, Elsevier, UK.
29. Speight, J. (2014), High acid crudes, Elsevier, USA
30. Viswanatan, J. and Grossman, I.E. (1993), Optimal feed locations and number
of trays for distillation columns with multiple feeds”, Engineering Industrial
Design Center, Carnegie Mellon University, No. 32, Pennsylvania, pag. 2942-
2949.
31. Waheed, M.A. and Oni, A.O. (2015), “Perfomance improvement of a crude
oil distillation unit”, Aplied thermal engineering, Vol. 75, pag. 315-324.
32. Wankat, P.C. (2015), “Decreasing costs of distillation columns with vapor
feed”s, Chemical Engineering Science, No. 137, pag. 955-963.
33. Wauquier, J.P. (1998), Separation process, second ed,, TECHNIP, Paris.
34. Watkins, R.N. (1979), Petroleum refinery distillation, second edition, Gulf
Publishing Company, Houston.
35. Yahaya, G.O., Hamad, F., Bahamdan, A., Tammanan, V.R and Hamad, E.Z.
(2013), “Supported ionic liquid membrane and liquid-liquid extraction using
membrane for removal of sulfur compounds from diesel/crude oil”, Fuel
processing technology, No. 113, pag. 123-129.
36. YVC Rao (2004), Chemical engineering thermodynamic, India, pag. 232.

(This page is intentionally left in blank)

BIOS AUTHOR
Xavier Chiuaula Júnior or simply Xavi was born in
Tete/Mozambik on 28 July 1983. He did the high school
level in 2006 in the Secondary School of Lhanguene then
he continued his education in the Department of Chemistry
at the Universidade Pedagógica de Moçambique (UP)
where he obtained degree in Chemistry Teaching course
(2007 – 2011). To this end, the author completed a
monograph entitled “Techniques of Production and
Conservation of Juice from a Mixture of Orange and
Baobab Fruit”. From 2012-2013 the author worked as a
quality analyst at Sociedade Moçambicana de Medicamentos through this company which
obtained a training in Good Manufacturing Practices at Fiocruz Barsil and training in
operation of HPLC by Merk Mollipore. Then the author continues his education in graduation
in Chemical Engineering Department at Institut Teknologi Sepuluh Nopember with ID:
2313201801, the author does not forget to thank the Lord Jesus Christ, who gave love and
blessing to finish the thesis entitled “The influence of Feed temperature and Strippers’
Position on Temperature, pressure and Mass Flow in each Stage of Crude Distillation Unit
(CDU)”.
Email:
Greetings,
Xavier Chiuaula Júnior
Senior in Chemical Engineering