thesis samuelsson 050819 - diva portal
TRANSCRIPT

D
ep
art
me
nt
of
Te
ch
no
log
y,
Ma
the
ma
tic
s a
nd
Co
mp
ute
r S
cie
nc
e
THESIS 2005: PM02
Maria Samuelsson
Personality Types and Attributes in Software Engineering
Thesis
i
University of Trollhättan - Uddevalla Department of Informatics, Mathematics and Computer Science
Thesis for Master of Science in Software Engineering
Personality Types and Attributes in Software Engineering
Maria Samuelsson
Examiner: Dr. Robert Feldt Department of Computer Science
Adviser: Dr. Robert Feldt Department of Computer Science
Thesis
ii
Personality Types and Attributes in Software Engineering
Maria Samuelsson
Summary
The Software Engineering field consists of much more than technology and software, it includes almost all concepts found in a modern business, as for example quality factors, design, project management techniques and customer expectations, which makes the software industry a very broad field of study. It is our belief that a field as broad as Software Engineering must include all, or almost all, personality types found in society. Personality tests have been used for many years as a tool to find individuals that match the requirements for employment. When using a standardised personality test there are plenty of research to fall back on, when the goal is to find an individuals strong and week characteristics. However, almost no research has been made in how these personality types correlate with the software developers’ attitudes towards Software Engineering. It is very likely that there is a correlation between personality types and attitudes towards, working manner, change management, CASE-tools, standards and methods in Software Engineering. This study will explore what attitudes the software developers have and to examine if the correlation between personality traits and the software developers’ attitudes towards Software Engineering exists.
A web survey consisting of a personality test and a questionnaire was used to examine what attitudes and what kind of personality characteristics the software developers have. The result indicated a correlation between personality traits and some of the attitudes, but the result also indicated that personality traits is not the only and in all cases not the most significant factor. In some areas age, experience, sex and the ability to influence affect the software developers attitudes to a higher degree.
Publisher: University of Trollhättan ⋅⋅⋅⋅ Uddevalla, Department of Informatics, Mathematics and Computer Science Box 957, S-461 29 Trollhättan, SWEDEN Phone: + 46 520 47 50 00 Fax: + 46 520 47 50 99
Examiner: Robert Feldt Advisor: Robert Feldt Subject: Computer science Language: English Number: 2005:PM02 Date: August 15, 2005 Keywords Software Engineering, CASE-tools, standards, methods, survey, attitudes,
personality types, Five Factor Theory, change management

Personality Types and Attributes in Software Engineering
iii
Foreword
I want to thank the respondents at the companies that participated in the study. Without your participation, the study could not have been carried trough.
My examiner Robert Feldt has helped me with problems that have occurred during my thesis work. Thank you for your help and advice.
And for Peter, that always has been there for me. Thank you for all hours spent day and night, proofreading my thesis and for being a living oracle.
Personality Types and Attributes in Software Engineering
iv
Table of contents
Summary ____________________________________________________________ ii
Foreword ____________________________________________________________ iii
Nomenclature_________________________________________________________ vi
Abstract _____________________________________________________________ 1
1 Introduction ______________________________________________________ 1
2 Method __________________________________________________________ 3
2.1 Literature Study ____________________________________________________ 3
2.2 Questionnaire ______________________________________________________ 3
2.3 Deep Interview _____________________________________________________ 4
2.4 Personality Test_____________________________________________________ 5
2.5 Target group _______________________________________________________ 6
3 Design and Implementation _________________________________________ 7
3.1 Design of the Questionnaire ___________________________________________ 7
3.2 Design of the Personality Test _________________________________________ 8
4 Result ___________________________________________________________ 9
4.1 Questionnaire ______________________________________________________ 9 4.1.1 About You and Your Background ____________________________________________ 9 4.1.2 About the Company and Your Position ________________________________________ 9 4.1.3 About Your Work related Tasks _____________________________________________ 10 4.1.4 About CASE-tools and Working Manner I ____________________________________ 10 4.1.5 About CASE-tools and Working Manner II____________________________________ 10 4.1.6 About the Organization I___________________________________________________ 10 4.1.7 About the Organization II __________________________________________________ 11 4.1.8 About the Organization III _________________________________________________ 12 4.1.9 About You ______________________________________________________________ 13 4.1.10 About Research __________________________________________________________ 14 4.1.11 About the Organization ____________________________________________________ 14
4.2 Personality Test____________________________________________________ 15
5 Analysis ________________________________________________________ 17
5.1 Reduction Analysis _________________________________________________ 17
5.2 Correlations between Questions ______________________________________ 17
5.3 Correlations between Personality Test and Questionnaire_________________ 18
6 Discussion ______________________________________________________ 21
6.1 About the Result of the Study ________________________________________ 21
6.2 About the Result of the Analysis ______________________________________ 21 6.2.1 Correlations between Questions _____________________________________________ 21 6.2.2 Correlations between Personality Test and Questionnaire_________________________ 22
6.3 Future Questionnaire Design_________________________________________ 23

Personality Types and Attributes in Software Engineering
v
6.3.1 Before Reduction Analysis _________________________________________________ 23 6.3.2 Designing Questions and Alternatives of Answers ______________________________ 23 6.3.3 Tips for Future Questionnaire Studies ________________________________________ 24
6.4 Discussion around future Design of Personality Test _____________________ 24 6.4.1 Tips for Future Personality Tests ____________________________________________ 24
7 Conclusion ______________________________________________________ 25
8 Future Work ____________________________________________________ 26
9 References ______________________________________________________ 27
Appendix A : Personality Test _________________________________________ 28
Appendix B : Questionnaire __________________________________________ 34
Appendix C : Data for Analysis________________________________________ 40
Appendix D : Other Results ___________________________________________ 50

Personality Types and Attributes in Software Engineering
vi
Nomenclature
CASE-tools Computer Aided Software Engineering Tools Change management Evaluate, implement and to use new developed CASE-tools, processes and
standards. CMM Capability Maturity Model
Factor Something which is believed to have an effect on a response variable in an experiment [1]
Five Factor Theory Personality test that consists of five personality factors, OCEAN, Openness,
Conscientiousness, Extraversion, Agreeableness and Neuroticism ISO 9000 Quality management systems ISO 12207 Information technology - Software life cycle processes ISO 15288 Systems engineering - System life cycle processes P-CMM People Capability Maturity Model PSP Personal Software Process
Psychosocial Aspects of social and psychological behaviour RUP Rational Unified Process
Software Engineering The profession that creates and maintains software applications by applying technologies and practices from computer science, project management, engineering, application domains, and other fields. [1]
SPICE Software Process Improvement and Capability dEtermination Standards A quality or measure which is established by authority, custom, or general
consent [1] TSP Team Software Process
Working manner Using CASE-tools, processes and standards.

Personality Types and Attributes in Software Engineering
1
Maria Samuelsson Department of Technology, Mathematics and Computer Science
University of Trollhättan/Uddevalla
Box 957, S-461 29 Trollhättan, Sweden [email protected]
Abstract
Indicating a correlation between
software developers personality types and attitudes towards Software Engineering have
been the primary focus of this study. Results
have been acquired using a web survey
consisting of a questionnaire and a personality
test. The survey was sent to several Software
Engineering companies. Results from the survey
was analysed and the result indicates a
correlation between attitudes and personality
traits. The correlation was not so strong as it
was believed to be. Some reasons for this
include other factors that influence the software
developers attitudes such as age, sex and other external factors. Both the personality traits and
other factors that influence the software
developers attitudes will be discussed in this
study.
1 Introduction
Software consists of more than computer programs, it also includes documentation, configuration data and in most cases end user instructions. [2] Software development cannot be viewed as simply creating a program using a programming language. The many methods, processes and tools that have evolved during the years to aid software developers, have in many ways been standardised and we have come a long way from structured programming. The problems of building large and complex software systems has resulted in the concept, Software Engineering.
The increased complexity in computing systems was addressed as early as 1968 during a NATO conference in Germany. During the conference it was acknowledged that human limitations was making it increasingly hard to cope with the evolved complexity of the systems. The expression Software Engineering was popularized during this conference. While the early definitions of Software Engineering from the 1970s focused on its technical aspect, later writings refer to the nature of the field as an engineering profession. [3] Software
engineering has become the profession that creates and maintains software applications by applying technologies and practices from computer science, project management, engineering, application domains, and other fields. In the field of Software Engineering today, software developers are introduced to a number of concepts, that are not directly related to the technical aspects of software development, such as for example quality factors, design, project management techniques and user requirements and expectations. As the Software Engineering field has expanded beyond an almost purely technical realm since the early 1970s, the community is slowly realizing the importance of the human factor. As of today the bulk of research in Software Engineering is focused on the technical aspects. The research focusing on human aspects made so far is mostly focused on the fundamentals were software developers are categorized into different personality types and compared to a larger population. Capretz states that the software field is dominated by introverts who typically have a hard time communicating with the user. He also believes that this can partially explain why software systems are notorious for not meeting the end users requirements. [4] Capretz used the Myers Briggs personality type indicator in his study to categorize software developers into different personality types.
During our degree project, that investigated software developers attitudes towards Software Engineering and emphasized on human and social factors, we found several external factors that affected the attitudes of the software developers. As an example, we found a correlation between how satisfied software developers are with their working situation and to what degree they are involved in change management. [5] Human and social factors can have a significant influence on the end result of a software development project. [6] A software developer that is satisfied with his working situation is more likely to be more motivated and work more efficiently.
The current lack of understanding for how human, social and psychosocial factors affects the software developers, paired with the possibility that human and psychosocial factors can have a strong impact on the success of

Personality Types and Attributes in Software Engineering
2
software development projects and the end product merits further research.
It is widely accepted that personality types is a significant factor for fundamental social skills. We believe that there are more correlations to be found and that personality types is a significant factor for software developers attitudes towards Software Engineering. Personality traits affects an individuals reaction to different social situations so we claim that it is very likely that there also is a correlation between personality types and attitudes. More specifically attitudes towards, working manner, change management, CASE-tools, standards and methods in Software Engineering.
This study will explore what attitudes the software developers have and examine if the correlation between personality traits and the software developers’ attitudes towards Software Engineering exists and if so, what those correlations are. Our objectives are to investigate the respondents’ self perception and compare them to their attitudes towards Software Engineering.
To examine the software developers personality traits we will use the Five Factor Theory. Earlier research by Capretz, for instance, that relates to our area of study can not be compared to our results since we use the Five Factor Theory and Capretz uses the Myers-Briggs Type Indicator. This is because these personality tests are not comparable.
The Software Engineering field is to broad to reflect every possible correlation between attitudes and personality types so attitude questions have been delimited to a manageable number for this thesis work.
Three major companies in the Software Engineering field was invited to participate with respondents for 20 questionnaires and 20 personality tests. Two out of three of these companies turned down the invitation so the original delimitation of three companies with 20 respondents each had to be changed to be able to continue the study. Smaller Software Engineering companies was then invited, who could only participate with four to ten respondents each. The main goal, which was to get 60 respondents for the web survey, never changed. The table below will provide an overview of the answer frequency.
Table 1. answer frequency of the study
Companies invited to participate 98 Companies participating 10 Respondents invited to participate 60 Respondents participating 47
This study will not address how the
correlation between personality types and attitudes towards Software Engineering can be used within an enterprise. Nor will the study address how the information about personality types versus attitudes can or should be used for employment scenarios.
After this introductionary chapter, we will present different investigation methods and motivate our choice of method. After that, we describe the implementation of the study including the questionnaire design, scales and norms. Then we present the result with initial analysis of the data. Thereafter, the analysis of correlations is presented. Finally, we discuss the result of the study and present our conclusions.

Personality Types and Attributes in Software Engineering
3
2 Method
To reach the goal of the study, four methods were chosen as viable alternatives. The choice of methods was influenced by the fact that the study should be performed by a single individual during a 20 week period. The questionnaire, which is a quantitative method, will be used to gather the attitudes and opinions from the respondents. A literature study is performed to validate our chosen methods and to provide facts of research already done in the area of the study. The personality test is a quantitative method used to gather the respondents self perceived personality traits. Deep interviews could be used to clarify an individuals opinion and attitude to specific questions. Deep interview is a qualitative method.
Quantitative studies are preferably used when there are many respondents and time constraints is a factor or the geographical dispersion of the respondents are significant. It is also preferable to use quantitative studies when addressing delicate questions. When using questions like how often, how many and in what amount, meaning numerical and measurable data, it is preferable to use a quantitative study. A quantitative study is defined as objective.
A qualitative study is defined as subjective. When using complex questions that does not have predictable answers it is preferable to use a qualitative study as this will allow the interviewer to follow up and drill down into the respondents answers. When using questions like how would you describe, how do you feel about and questions starting with why, it is preferable to use a qualitative study.
The main purpose of this study is to find correlations between personality traits and attitudes. The data to be gathered in this study needs to be measurable for statistical analysis and thus, a quantitative study is a better choice for this study. Deep interviews could be used to complement the quantitative study.
An overview of the pros and cons of the different methods discussed in this chapter is presented in the following table.
Table 2. Summary over pros and cons of the different methods.
Characteristic Deep interview
Questionnaire Personality Test
Literature study
Amount of individual data
+ - - -
Complicated questions
+ - - -
Differentiation of answers
+ - - -
Control over the measure situation
+ - - -
Reduction + - - + Cost - + + + Amount of respondents
- + + +
Geographical dispersion
- + + +
Interviewer effect
- + + +
Delicate questions
- + + +
[5,7]
2.1 Literature Study
A literature study is defined by reviewing existing material, secondary data. By using a literature study as a method, the intent is usually to summarize a field to be able to broaden your conclusion of other methods. [5] A literature study needs to be performed on earlier research in the area of human aspects in Software Engineering. This will allow for a comparison of the result with other studies and can help in validating or in disregarding conclusions or correlations.
2.2 Questionnaire
Questionnaires are often a form, consisting of an amount of questions. The forms are dispatched and collected by traditional post, internal post in organisations, electronic form via email or online questionnaire via Internet. Questionnaires are preferably used when trying to reach a great amount of people.
Questionnaires are divided into two categories, standardized and none standardized. Standardized questionnaires implies that the same questions must be used for all of the respondents and the respondents environments are as similar as possible to each other. Most questionnaires are standardized. [8]
The questions in a questionnaire can be either open-ended or close-ended. Open-ended questions imply that the respondent himself can write down what he wants which gives the respondent a greater sense of freedom. A disadvantage of the open-ended question is that

Personality Types and Attributes in Software Engineering
4
if the respondent cannot easily express himself there is a risk that the respondent will not answer the question. Furthermore, open-ended questions are hard to process since the number of possible answers are unlimited.
Close-ended questions on the other hand are easy to answer and easy to process, but gives the respondent very little possibility to influence. When using close-ended questions it is very important to do a thorough investigation of the different alternatives of answers so the respondent can pick an answer from the existing alternatives. [9, 10] If the existing alternatives of answers still do not match the respondent’s opinion, either because a thorough investigation was not done or the number of possible answers are to great, an “other” alternative should be provided. This will allow the respondents an opportunity to show that the alternatives of answers do not match their opinions.
The questionnaire designed for this study includes some close-ended questions with an “other” alternative of answer that is open. These questions are used when the alternatives of answers are not entirely predictable, for example, the question what do you do in your line of work can have an almost indefinite number of valid answers. We believe that close-ended questions with an “other” alternative of answer can increase the answer frequency for questions with unpredictable answers.
Questions designed to examine if the respondents agree or disagree with a statement, often use the Likert scale. The Likert scale got its name from the American sociologist Rensis Likert and is today the most commonly used scale. [8] Questions using the Likert scale consists of a number of statements were the respondent must take a stand on how much he agrees or disagrees with the statement. This kind of scale is often used when trying to bring forward the respondents attitudes and opinions towards a specific phenomenon. [7, 11] The opinions about how to use scales in surveys differ. Some authors claim that an odd number of alternatives of answers, where the middle alternative express neither nor, should be used when the respondent does not want to take a stand. [10] Kýlen claims that an even number should be used since the middle alternative is a way for the respondent to avoid answering the question. Instead he asserts that a “do not know” alternative should be used. [8, 9, 10]
In our study, we use an even number of alternatives of answers because we do want the respondent to take a stand. If the respondent does not have an opinion or really does not know, we prefer to know that rather than risk having the respondent using the middle alternative.
Web questionnaires do not differ from a normal questionnaire in any important sense, but there are some advantages with using a web questionnaire compared to using a paper handout. Using web questionnaires is fast, inexpensive, easy and it makes it possible to present graphical information to a higher degree. Disadvantages are that you can only reach respondents with computer experience. This is not a risk when the target group consists of software developers. Web questionnaires are answered directly on a web page and the answers are saved on a web server. Since the answers are stored electronically it can be easier to compile and analyse the results.
Further advantages and disadvantages for the questionnaire as a method can be found in table2.
2.3 Deep Interview
We consider deep interviews to be a good complement to a questionnaire and the original intent was to use this to further validate the results of the questionnaire. However, due to a limited amount of time we leave this option open for future studies and delimit this work to use a web based survey.
Deep interviews are a non standardized form of an interview, which means that the questions are not prepared in advance, but arise and are adapted after the situation. [7, 12, 13] Since the questions are not prepared in advance, an interview guide which work like an agenda is used [9]
Deep interviews are often used when the subject is delicate and in feasibility research. It allows the researcher to explore an issue and to understand the behaviour and attitude of the respondent. [14, 15, 8, 16, 11] Questions like what, why and how are often used in deep interviews when trying to understand the behaviour of the respondent. [13]
Deep interviews are carried through face to face or via telephone. Some researchers claim that deep interviews should be taped so to not miss important facts during the interview. [14, 15] Others claim that taping an interview can make the respondent nervous and feel unpleasant with the situation which will lead to

Personality Types and Attributes in Software Engineering
5
that the answers will become formal and impersonal.
Advantages with deep interviews are that it is fast and gives direct feedback. You also have the opportunity to explain and rephrase yourself if the respondent does not understand. Some disadvantages are that they are expensive and time consuming. [16, 11, 13] Furthermore, it is important to be aware of the interviewer effect when using deep interviews as a method. Facial expression, eye movements, pitch of voice and body position can effect the respondent during the interview. [17]
2.4 Personality Test
The usage of personality tests have increased strongly during later years and is mostly used when trying to investigate differences between individuals or to examine differences in reactions within the same individual but in different situations. [18]
Personality tests have been used for many years as a tool to find individuals that match the requirements for employment and have since 1980 become more and more popular. [18] The main purpose of putting individuals into different categories based on their personality traits when looking to hire a new resource is to get a more predictable result after employment. The personality tests used when recruiting resources, usually aims to get only the most fundamental social skills of the individual.
The Five Factor Theory was derived in 1970 by two independent research teams, Paul Costa and Robert McCrae and Warren Norman and Lewis Goldberg. They were using slightly different methods, but arriving at the same result. Five broad dimensions of personality, regardless of language or culture. Thousands of people were participating in the study with hundreds of questions. The result was analysed with factor analysis. [19]
International Personality Item Pool, IPIP, are a scientific collaboratory for the development of advanced measures of personality and other individual differences. It was Goldberg that started the IPIP organization. He compared different personality tests and this has lead to that Goldberg has created his own items, which measure the same dimensions as the existing tests. The purpose was to make the information and research available to the public since the organizations that has been developing personality tests, have monopoly on these personality tests. [18]
The Five Factor Theory is nowadays the most widely, accepted and used model on personality. By using the Five Factor Theory, we can see a pattern in our personalities. [20]
The Big Five personality test is based on that the individuals have to estimate themselves in the different questions. Criticisms about the reliability of tests were the individuals estimate themselves have been stated. The reason given has been that the individuals do not answer how they really are, but describe themselves as they think somebody else wants them to be. Test results have shown a good reliability and validity on these kinds of tests and that the statement above is not entirely true. [18]
The Big Five got its name because the research teams found five broad dimensions of personality traits. Each of these dimensions are described as a factor for different personality traits. These are:
Neuroticism: Concerns emotional instability. Identifies individuals that are suffering of physical stress, have unrealistic ideas and strong desires. Individuals that have been placed low on the scale can be described as restless, nervous, instable, unpredictable and hypochondriac. Individuals that are placed high on the scale can be described as calm, relaxed, self-confident and satisfied with themselves. [18]
Extraversion: Investigates personal interaction, level of activity and the capacity to feel joy. Individuals that are placed high on the scale can be described as social, active, talkative, good judge of character, optimistic and fun. Individuals that are placed low on the scale are described as reserved, keeps people on a distance, are calm and wants to be alone. [18]
Agreeableness: Investigates the individuals’ merciful traits regarding thoughts, feelings and actions. Individuals that are placed high on the scale have a gentle way, are reliable, kind, kind-hearted, helpful, forgiving, naive and always believe the good in people. Individuals that are placed low on the scale are cynical, have an unpleasant manner, are suspicious, have difficulties working in a team, are rootless and are easily irritated and manipulative. [18]
Conscientiousness: Is about how organized, persistent and purposeful individuals are. Individuals that are placed high on the scale are organized, reliable, hard working, are self-disciplined, punctual, keep it clean around themselves, are ambitious and utilize advance planning. Individuals that are placed low on the scale are described as lazy, unrealistic,

Personality Types and Attributes in Software Engineering
6
thoughtless, have no direct goals, are negligent and have no self-discipline. [18]
Openness: Evaluates the need for searching, experiences and tolerance for and exploration of the unknown. Individuals that are placed high on the scale are described as curious, have a broad range of interests, are creative, original, imaginative and unconventional. Individuals that are placed low on the scale can be described as traditional, have few interests, are not creative, have unchanging opinions and have both feet firmly on the ground. [18]
One of the fundamentals for the Five Factor Theory is that the five factors are mutually independent of each other.
The properties of the five factors are inherited, but are changing over life and then becoming stable in adulthood. Experience does not affect the factors very much. [21]
IPIP Five Factor personality test consists of a 50 or 100-item inventory and both of them are public domain, which means that they can be freely downloaded and used without any permission.
2.5 Target group
The intended target group for the study should consist of software developers from companies based in Sweden that work with Software Engineering and perform the software development in Sweden. The target companies should preferably develop one or more products for commercial use. Companies were selected from the yellow pages based on that they were listed as data companies. The potential target companies were contacted by telephone. Each company was asked the following three questions: if they develop applications and systems for commercial use, if the development process is performed in Sweden and if they could participate in our study. In total 98 companies were contacted of which only ten companies matched the criteria and had the possibility to participate in the study. For an overview of the answer frequency see table 1.
When contacting the companies we asked to speak to one of the individuals responsible for the software developers at the company. In our first contact with the key persons at the companies, we explained the purpose and goal of our study. We also described how the raw data would be processed and that all answers of the respondents would be presented anonymously. In the second contact, when we dispatched the implemented web survey, we reminded them that when the result
was presented no respondent could be identified. We also informed them about how to reach the web survey and the intended time frame for the survey. The information was also sent by e-mail to the companies.
The invited group for the survey consists of software developers from the following companies, presented in an alphabetical order:
3L System was founded in 1976 and develops standard systems for construction,- real estate- and media line of businesses.
Abaris was set up in 1991 and provides software solutions and closely related services to companies in the areas of account administration, fund management, and private banking, to mention some.
Aldata Solution is one of the leading suppliers of software to the retail trade business. The company develops integrated solutions that make data capture, administration and analysis of complex information possible.
Backbone was founded in 1989 and provides software solutions to companies in the financial and industrial area.
Banqsoft was established in 1994 and is specializing in the development of financial services software.
Giraff Data was set up in 1994 and is primarily providing services to companies in the areas of banking, insurance, travel, energy and health care.
GoldWare Application was founded in 2003 and provides software solutions to companies and public administrations.
Proceedo was set up in 1998 and is a subsidiary company to Tele2. The company provides software solutions in the area of procurement.
Volvo Aero is a subsidiary company to Volvo AB and develops and produces high technological components to aircrafts and rocket engines.
WM-Data was founded in 1969 and provides software solutions to many companies in the Nordic areas.

Personality Types and Attributes in Software Engineering
7
3 Design and Implementation
The personality test and the questionnaire was included in a web based survey. We chose to put them together because of the risk of reduction when they are separated from each other. The web survey was hosted by a server at the University of Trollhättan/Uddevalla. An informal test was performed with the help of a software developer from a company that did not participate in the study. The test was done to validate that the survey did not require to much time to complete and that the answers of alternatives were relevant for the questions and for the respondent. Time to complete the survey were estimated to less than 40 minutes. The test respondent needed only 19 minutes to complete the survey but it is important to realize that various individuals require different amount of time to complete the survey.
A time frame of one week was the original intention for the survey. Because of vacations and product releases the companies could not participate to a high extent during the allotted time frame. Therefore, we expanded the time frame of the survey to overlap the main vacation period. In total the survey was open for six weeks.
Answers from the respondents participating in the study, were saved on the server and then downloaded in a readable text format for compilation. The result was compiled into tables for analysis. Data is presented in tables or diagrams.
3.1 Design of the Questionnaire
We chose to number the questions of the entire survey, since it is important for the respondents to know how far he has come in the questionnaire and how many questions that are left to be answered.
The questionnaire we used in our degree project, was used as a prototype when designing this year’s questionnaire. We have expanded the questionnaire with additional questions in this survey. These questions consists of statements where the respondent should chose either statement a or b, that are each others opposites. For example, Do you prefer to be responsible for: A: The entire development process or, B: a particular part. We added these questions because we wanted more
specific information about the respondents preferred choices. The questions were also partly designed to be used to complement the personality test. In the definitions of the personality traits from the Five Factor Theory we can see statements of how an individual is described if he is high or low on the scale. Using these statements we can further test the validity of the results by comparing the answers on some of these questions from the respondents to see if this matches the statement in the Five Factor Theory.
The additional questions can be found in Appendix B: Questionnaire, numbered from 90 to 98.
The goal of the study has guided us when constructing the questions. When constructing the questions in our study, it was very important to have in mind how the respondents would interpret the questions. To make the study repeatable, it is important that all respondents interpret the questions in the same way. We wanted to make the study repeatable so the study and the results can be validated by future studies. Other important factors that we had to consider before constructing the questions were that only one thing per question were asked for. If not, we would not have known what the respondents had answered on when analysing the result.
It is important to adapt the linguistic usage after the target group. If the respondent does not understand the question or the underlying meaning of the question, we cannot rely on the respondents answer. When designing the questions for our questionnaire, we adapted the linguistic usage after the target group of software developers.
The questions should govern the chain of thought so the questions are easily interpreted in the context in which they arise. Therefore, we used headings that describe the part of the survey visible to the respondent. The questionnaire, consisting of 56 questions, was therefore divided into different categories depending on the topic as shown below.
General questions about:
• The respondent • Different roles in Software
Engineering
Focus for the questionnaire, questions
about:
• CASE-tools and working
manner
• The organization
• Research
• The respondents self-image

Personality Types and Attributes in Software Engineering
8
When designing the answers we decided to use an even number of alternatives to make the respondent take a stand to the statements. The answer alternatives on scale questions range from 1, very low degree, to 4, very high degree. These alternatives vary from question to question in wording but not in scale. For example, very high degree, very important, very satisfied etc. However, the scale used is always ranged from 1 to 4.
The entire questionnaire can be found in Appendix B: Questionnaire.
3.2 Design of the Personality Test
We used the IPIP Five Factor personality test which consists of 50 questions. Each of the five factors includes ten questions. The questions used in the personality test were taken from IPIP’s website. The reason to why we chose this test with only 50 questions, depended on that the entire survey consisted of both a personality test and a questionnaire with a lot more questions. We did not want the respondents to get bored when answering the survey. This was because of the risk that the respondent would not complete or skip questions or even pick answers at random.
The respondents were requested to read each question and than rate how well they believed it described themselves on a five-point scale, very accurate to very inaccurate. They were also encouraged to answer the personality test thinking about how they usually feel and not how they feel in the moment when they answer the survey. To make sure the respondents have the right context in mind, we asked them to compare themselves to their peers when answering the questions.
IPIP, who is the founder of the personality test we used in this survey, claims that norms should not be used since they often are misleading. The norms should be developed by the individual that are producing the survey. We have chosen to calculate the median of the respondents on the five scales and use this norm when comparing the value with all respondents.
The entire personality test can be found in Appendix A: Personality Test.

Personality Types and Attributes in Software Engineering
9
4 Result
In this chapter, a selection of the result from the questionnaire is presented together with an initial analysis. The questions presented below were chosen because they are either a part of the analysis or they contain results worthy of notice. The result from the personality test is then presented.
The respondents individual results from the personality test can be found in Appendix C: Data for Analysis.
The results from the questions not presented in this chapter can be found in Appendix D: Other Results.
4.1 Questionnaire
4.1.1 About You and Your Background
Diagram 1.Sex ratio, question 51.
Sex?
0
20
40
A lternat ives o f answers
11 36
Female M ale
A statistical investigation that SCB did
for economically actives in the age 16-24 in the work group data specialists 2003, shows that 76 per cent are males and 24 per cent are females. [22] This is mirrored very well since the respondents participating in the study was divided into 77 per cent males and 23 per cent females. The answer frequency for this question is 100 per cent.
Diagram 2. Age distribution, question 54.
A g e?
0
5
10
15
A g e in years
13 13 8 4 3 4 1 1
25-30 31-35 36-40 41-45 46-50 51-55 56-60 >60
55 per cent of the respondents are
between 24 and 35 years old. 17 per cent are between 36 to 40 years old. 23 per cent of the respondents are between 41 and 55 years old. None of the respondents are less than 25 years old and four per cent are over 56 years old.
According to a statistical investigation, made by SCB in 2003, the average age for working data specialist in the age 16-64 are 39. [23] The median of the respondents’ range of age is 31-35.
The average age can not be calculated since the respondents’ ages are divided into ranges of five years. The answer frequency for this question is 100 per cent.
4.1.2 About the Company and Your
Position
Diagram 3. Level of experience, question 59.
How many years of experience do You have from any of
the above mentioned areas?
0
10
20
Alternatives of answers
Resp
on
den
ts
5 9 19 14
<2 2-5 6-10 >10
11 per cent of the respondents have
less than two years of experience, 19 per cent have 2-5 years of experience and 40 per cent have 6-10 years of experience. 30 per cent have more than ten years experience. This question has an answer frequency of 100 per cent.

Personality Types and Attributes in Software Engineering
10
4.1.3 About Your Work related Tasks
Diagram 4. Projects size, question 63.
What is no rmally the size o f Yo ur So ftware
Engineering pro jects?
0
10
20
A lternat ives o f answers
13 14 8 10
<3 months 3-6 months 7-12 months >12 months
28 per cent of the respondents have
stated that the project size is less than three months. 30 per cent have answered 3-6 months. 17 per cent have answered 7-12 months and 21 per cent have answered greater than 12 months. The answer frequency for the question is 96 per cent.
4.1.4 About CASE-tools and Working
Manner I
Diagram 5. Tool satisfaction, question 67.
How satisfied are You with the tool You are using?
0
10
20
30
Alternatives of answers
Re
sp
on
de
nts
12 27 3 0 2
Very sat isf ied Quite sat isf ied Quite unsat isf ied Unsat isf ied Do not know
26 per cent of the respondents are very
satisfied with the tool they are using. 57 per cent are quite satisfied and six per cent are quite unsatisfied. Four per cent of the respondents do not know.
The mean for this question is 3,2. Interesting to note is that a large
majority of the respondents are satisfied with the tool they are using. The answer frequency for this question is 94 per cent.
4.1.5 About CASE-tools and Working
Manner II
Diagram 6. Satisfied with standard, question 72.
How satisfied are You with the standard You are using?
0
5
10
Alternatives of answers
Re
sp
on
de
nts
1 8 5 1
Very sat isf ied Quite sat isf ied Quit e unsat isf ied Unsat isf ied
17 per cent of the respondents are quite
satisfied and two per cent are very satisfied with the standard they are using. 11 per cent are quite unsatisfied and two per cent are unsatisfied. The mean for this question is 2,6.
The answer frequency for this question is 32 per cent. The internal reduction for this question is very high compared to the other questions in the survey. We believe that many respondents do not know if the companies are using specific standards and we also suspect that many respondents do not know the difference between tools and standards. It is also possible, that because several of the companies participating have few employees and were founded in recent years, they are not using specific standards to any high extent.
4.1.6 About the Organization I
Diagram 7. Distribution of the need of changing the current working manner, question 74.
To what deg ree d o Y ou f eel t hat t here is a need t o change t he
current wo rking manner?
0
5
10
15
20
Degree
Re
sp
on
de
nts
7 17 12 4 4
High degree Quite high Quite low degree Low degree Do not know
15 per cent of the respondents have
stated to a high degree, 36 per cent to a quite high degree, 26 per cent to a quite low degree and eight per cent to a low degree. Eight per cent have stated that they do not know. The mean for this question is 2,7. This question has an answer frequency of 100 per cent.

Personality Types and Attributes in Software Engineering
11
Diagram 8. To what degree the companies are encouraging the respondents to use a specific working manner, question
75.
To what deegre do You feel that Your company is
encourageing You to use a specific working manner?
0
10
20
Degree
Resp
on
den
ts
1 16 9 13 8
High degree Quite high Quite low Low degree Do not
Two per cent of the respondents have
answered to a high degree. 34 per cent have answered to a quite high degree, 19 per cent to a quite low degree and 17 per cent to a low degree. The mean for this question is 1,8. The answer frequency for this question is 100 per cent.
Diagram 9. To what degree can the respondents chose working manner on their own, question 76.
To what degree do You feel that You are allowed to
chose working manner on Your own?
0
5
10
15
20
Degree
Re
sp
on
de
nts
7 17 9 10 2
High degree Quite high Quite low Low degree Do not know
15 per cent of the respondents have
answered to a high degree. 36 per cent have stated in quite high degree, 19 per cent in quite low degree and 21 per cent in low degree. 4 per cent have stated that they do not know.
This question has a mean at 1,8. This question has an answer frequency of 96 per cent.
Diagram 10. Can the respondents make decisions that increase the quality of their work, question
77.
To what degree do You feel that You can make
decisions that increase the quality of Your work?
0
10
20
30
Degree
Resp
on
den
ts
8 21 6 7 2
High degree Quit e high degree Quit e low degree Low degree Do not know
17 per cent of the respondents have
answered to a high degree. 45 per cent have answered to a quite high degree and 13 per cent to a quite low degree. 15 per cent have stated to a low degree and four per cent have answered that they do not know.
The mean for this question is 2,7. The answer frequency to this question is 94 per cent.
4.1.7 About the Organization II
Diagram 11. To what degree do the respondents feel that their work is challenging and interesting, question 79.
To what degree do you feel that Your work is
interesting and challenging?
0
10
20
30
Degree
Resp
on
den
ts
7 28 9 3
High degree Quit e high degree Quit e low degree Low degree
15 per cent of the respondents
answered to a high degree. 60 per cent have answered to a quite high degree, 19 per cent to a quite low degree and six per cent in low degree.
The mean for this question is 2,8. The answer frequency of this question is 100 per cent.

Personality Types and Attributes in Software Engineering
12
Diagram 12. Do the respondents think it is important with change management for themselves to be
satisfied, question 83.
How important is change management, for You to
feel satisfied with Your working situation?
0
10
20
30
A lternat ives o f answers
14 25 3 1 2
Very important Quite important Less important Not important Do not know
30 per cent of the respondents have
answered very important. 53 per cent state that it is quite important. Six per cent state that it is less important and two per cent state that it is not important. Four per cent state that they do not know.
The mean for this question is 3,2. The answer frequency to this question is 96 per cent.
4.1.8 About the Organization III
Table 3. Result of question 87. What is Your main reason for change management?
Customer satisfaction 10 Own initiative 6 Quality of the end product 20 Keep up with industry standards 1 Financial reason 1 Enterprising people in the company 2 Do not know 6
43 per cent of the respondents
answered quality of the end product. 21 per cent answered customer satisfaction and 13 per cent own initiative. Two per cent have answered keep up with industry standards and two financial reasons. Four per cent have answered enterprising people in the company an 13 per cent have stated that they do not know. The answer frequency for this question is 98 per cent.
Table 4. Result from question 88. What do You think is the companies main reason for change
management?
Customer satisfaction 9
Financial reason 14
Quality of the end product 5
Own initiative 3 Enterprising people in the company
4
Keep up with industry standards
1
Do not know 8
The respondents’ opinions about what
they think the companies’ reasons for change management are, are presented above. The answer frequency to this question is 94 per cent.
Table 5. Result from question 89. What do You think the companies main reason should be?
Customer satisfaction 11
Financial reason 9
Quality of the end product 23
Keep up with industry standards 2 Enterprising people in the company
1
Other 1
Do not know 1
49 per cent of the respondents have answered quality of the end product. 23 per cent have answered customer satisfaction and 19 per cent financial reason. Four per cent have answered keep up with industrial standards and two per cent enterprising people in the company. Two per cent have answered other and two per cent have stated that they do not know. The answer frequency for this question is 100 per cent.

Personality Types and Attributes in Software Engineering
13
4.1.9 About You
Diagram 13. Distribution of how the respondents prefer to work, question 91.
Do You prefer to work
0
10
20
30
40
Al t e r na t i v e s of a nswe r s
11 36
As the day developes After a given schedule, pro ject
77 per cent of the respondents have
answer that they prefer to work after a given schedule and 23 per cent have stated as the day develops. The answer frequency for this question is 100 per cent.
Diagram 14. Distribution of doing several things at once, question 92.
Do You prefer doing
0
10
20
30
Alternatives of answers
Resp
on
den
ts
20 27
Several things at once One thing at a time
57 per cent of the respondents have
answered that they prefer doing one thing at a time and 43 per cent have answered several things at once. This question has an answer frequency of 100 per cent.
Diagram 15. Distribution of preferring to work in a team, question 93.
You prefer to work
0
10
20
30
Alternatives of answers
Resp
on
den
ts
22 25
By Your self In a team
53 per cent of the respondents have
answered that they prefer work in a team and 47 per cent prefer to work by themselves. The answer frequency for this question is 100 per cent.
Diagram 16.Prefer to be responsible for entire development process, question 94.
Do You prefer to be responsible for
0
10
20
30
Alternatives of answers
Resp
on
den
ts
21 25
Entire developement Particular part
53 per cent of the respondents have
answered that they prefer to be responsible for particular part and 45 per cent entire development process. The answer frequency for this question is 98 per cent.
Table 6. Result from question 95. Do You prefer to work in?
Short projects lasting up to a couple of months
22
Longer projects lasting for several months up to a year
24
The distribution of the alternatives of
answers is presented above. The answer frequency for this question is 98 per cent.
Diagram 17. Preferred level of engagement, question 96.
Do You prefer to work with
0
10
20
30
40
Alternatives of answers
Re
sp
on
den
ts
8 30 8
Pro ject start upFrom project start to
project end
Short contributions as
needed
64 per cent of the respondents have
answered that they prefer to work from project start to project end. 17 per cent have answered project start and 17 per cent have stated short contributions as needed. This question has an answer frequency of 98 per cent. A majority of the respondents prefer to work from project start to project end. The reason for this can be that the respondents can by working from project start to project end get more varying working tasks and they also have the opportunity to see the result of what they have been doing. Developers working with short contributions do not often have the opportunity to see the end result.

Personality Types and Attributes in Software Engineering
14
Diagram 18. Preferring parts to work with, question 97.
If You could chose, would You prefer to
work with
20
25
Alternatives of answers
Resp
on
den
ts
22 24
technical parts soft parts
47 per cent have stated that if they
could chose, they had preferred working with technical parts and 51 per cent with soft parts. The answer frequency for this question is 98 per cent.
Table 7. Result of question 98. You work best/ most
efficiently when?
Your manager prioritize Your tasks 6
You can prioritize Your own tasks 40 85 per cent of the respondents work
best when they can prioritize their own tasks. Since developers work creatively when they are creating something, we understand that the respondents prefer to work when they can prioritize their own task without a manager that tells them exactly what to do and in what order. Only 13 per cent of the respondents have answered when their manager prioritizes. This question has an answer frequency of 98 per cent
4.1.10 About Research
Diagram 19. Importance of research towards new working manners, question 100.
How important is it w ith research towards new
working manner in Software Engineering?
0
20
40
Alternatives of answ ers
Resp
on
den
ts
12 26 1 3 5
Very important Quite important Less important Not important Do not know
26 per cent have stated that it is very
important with research towards new working manners. 55 per cent have stated quite important and two per cent less important. Six per cent have stated not important and 11 per cent have stated that they do not know.
The mean for this question is 3,1. The answer frequency for this question is 100 per cent.
4.1.11 About the Organization
Table 8. Result from question 101. Which of the following alternatives is the closest match to Your company?
Alternative Description Respondents
A Many levels with active management from Your closest superior. Almost no cooperation between departments.
10
B Relative flat organization where the closest manager leads the day to day business.
19
C Closes manager works as a part of the team. Great possibility to influence as an employee.
17
21 per cent of the respondents
answered with alternative A. 40 per cent have answered with alternative B. 36 per cent answered with alternative C. See table eight above. This question has an answer frequency of 98 per cent.
Table 9. Result from question 102. To what degree do You
feel that the management style within the company gives You opportunity to influence?
High degree 5 Quite high degree 23 Quite low degree 13 Low degree 6
11 per cent of the respondents
answered to a high degree. 49 per cent to a quite high degree. 28 per cent to a quite low degree and 13 per cent answered that they do not know.
This question has a mean at 2,6. This question has an answer frequency of 100 per cent.

Personality Types and Attributes in Software Engineering
15
Table 10. Result from question 104. To what degree do You feel that the management style within the
company supports and helps?
High degree 2 Quite high degree 17 Quite low degree 18 Low degree 8
Four per cent of the respondents have
answered to a high degree. 36 per cent have to a quite high degree. 38 per cent have stated to a quite low degree and 17 per cent have answered to a low degree.
The mean for this question is 2,5. The answer frequency for this question is 96 per cent.
Diagram 20. Satisfaction over the working situation, question 105.
How satisfied are You with Your working situation?
0
10
20
30
Alternatives of answ ers
Re
sp
on
de
nts
8 26 10 1
Very satisfied Quite satisfied Quite Unsatisfied
17 per cent of the respondents have
answered very satisfied. 55 per cent have answered quite satisfied. 21 per cent have answered quite unsatisfied and two per cent unsatisfied.
The mean for this question is 2,9. This question has an answer frequency of 96 per cent.
4.2 Personality Test
The answer frequency, for all questions in the personality test, was 100 per cent. The results from the personality test are presented below. The respondents have been placed on the scales, for every factor of the Five Factor Theory, based on their result in the personality test.
Diagram 21. Agreeableness
Agreeableness
0
10
20
30
40
50
0 10 20 30 40 50
RespondentsS
ca
le
The median for the agreeableness factor is 39. 18 respondents are placed over the median and 21 respondents under. Eight respondents have the same value as the median. Diagram 22. Extraversion
Extraversion
0
10
20
30
40
50
60
0 10 20 30 40 50
Respondents
Sc
ale
Of the respondents, 21 have a higher
value than the median on the extraversion factor. Five respondents have the same value as the median which is 33. 21 respondents have a lower value than the median.

Personality Types and Attributes in Software Engineering
16
Diagram 23. Conscientiousness
Conscientiousness
0
10
20
30
40
50
0 10 20 30 40 50
Respondents
Scale
The median on the conscientiousness
factor is 36 and eight respondents are placed on the same value. 21 respondents have a higher value than the median and 18 respondents have a lower value.
Diagram 24. Openness
Openess
0
10
20
30
40
50
0 10 20 30 40 50
Respondents
Sc
ale
17 of the respondents have a higher
value than 38, which is the median for the openness factor. Nine persons have the same value as the median and 21 respondents have lower value.
Diagram 25. Neuroticism
Neuroticism
0
10
20
30
40
50
0 10 20 30 40 50
Respondents
Sc
ale
The median on the neuroticism factor
is 37 and six respondents have the same value as the median. 20 respondents have a higher value than the median and 21 have a lower value.
Personality Types and Attributes in Software Engineering
17
5 Analysis
The questions have been analysed by themselves and in correlation to each other. The analysis have been carried out one question at a time and when a correlation was found to another question it was noted for further analysis. The result from the personality test was compared to each of the questions in an attempt to find correlations. We suspected that some correlations could be found before performing the actual analysis. For example, team work and extraversion was known to be correlated in theory. The analysis is presented in two parts, to begin with the correlations between the questions from the questionnaire is introduced. After this, the correlations between the personality test and the questionnaire is presented. Conclusions and correlations are discussed further in chapter 6. Discussion.
The data for the analysis can be found in Appendix C: Data for Analysis.
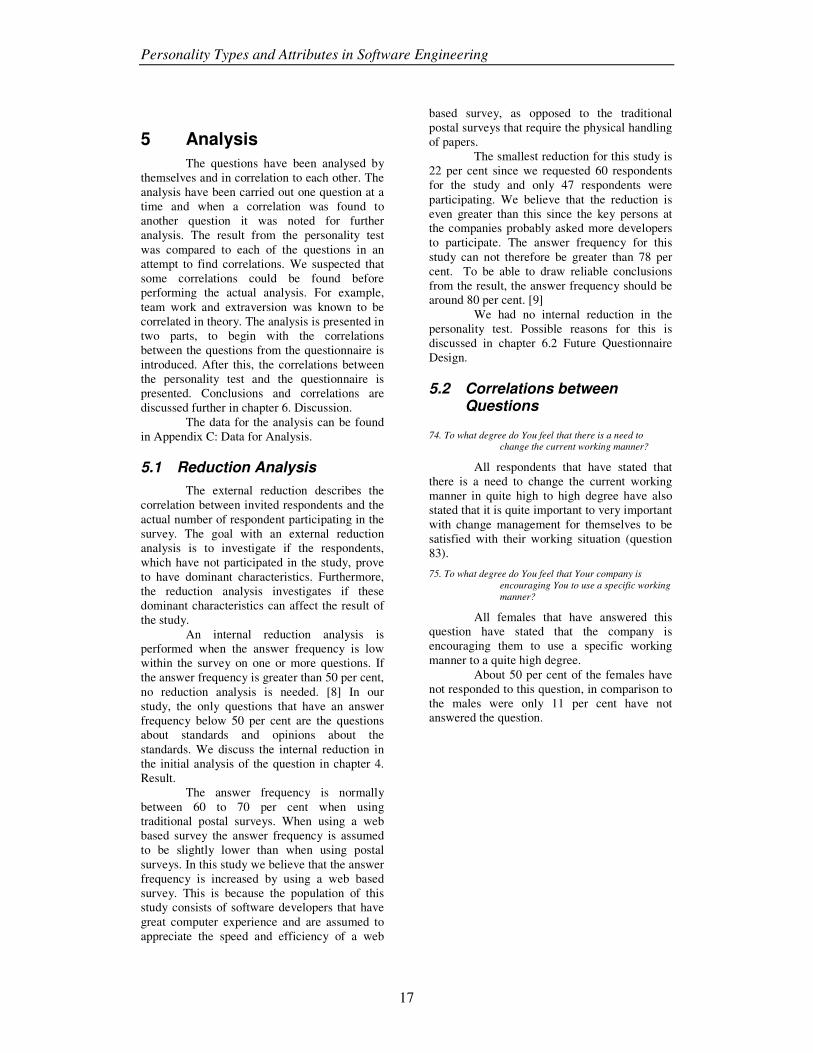
5.1 Reduction Analysis
The external reduction describes the correlation between invited respondents and the actual number of respondent participating in the survey. The goal with an external reduction analysis is to investigate if the respondents, which have not participated in the study, prove to have dominant characteristics. Furthermore, the reduction analysis investigates if these dominant characteristics can affect the result of the study.
An internal reduction analysis is performed when the answer frequency is low within the survey on one or more questions. If the answer frequency is greater than 50 per cent, no reduction analysis is needed. [8] In our study, the only questions that have an answer frequency below 50 per cent are the questions about standards and opinions about the standards. We discuss the internal reduction in the initial analysis of the question in chapter 4. Result.
The answer frequency is normally between 60 to 70 per cent when using traditional postal surveys. When using a web based survey the answer frequency is assumed to be slightly lower than when using postal surveys. In this study we believe that the answer frequency is increased by using a web based survey. This is because the population of this study consists of software developers that have great computer experience and are assumed to appreciate the speed and efficiency of a web
based survey, as opposed to the traditional postal surveys that require the physical handling of papers.
The smallest reduction for this study is 22 per cent since we requested 60 respondents for the study and only 47 respondents were participating. We believe that the reduction is even greater than this since the key persons at the companies probably asked more developers to participate. The answer frequency for this study can not therefore be greater than 78 per cent. To be able to draw reliable conclusions from the result, the answer frequency should be around 80 per cent. [9]
We had no internal reduction in the personality test. Possible reasons for this is discussed in chapter 6.2 Future Questionnaire Design.
5.2 Correlations between Questions
74. To what degree do You feel that there is a need to change the current working manner?
All respondents that have stated that there is a need to change the current working manner in quite high to high degree have also stated that it is quite important to very important with change management for themselves to be satisfied with their working situation (question 83).
75. To what degree do You feel that Your company is encouraging You to use a specific working manner?
All females that have answered this question have stated that the company is encouraging them to use a specific working manner to a quite high degree.
About 50 per cent of the females have not responded to this question, in comparison to the males were only 11 per cent have not answered the question.

Personality Types and Attributes in Software Engineering
18
79. To what degree do you feel that Your work is interesting and challenging?
The possibility to make decisions that increase the quality of the respondents work, seems to be a factor for how interesting and challenging they consider their work to be and this is in turn related to how satisfied they are with their working situation.
70 per cent of the respondents that answered high degree on question 79. To what degree do you feel that Your work is interesting and challenging, also answered high degree on question 77. To what degree do You feel that You can make decisions that increase the quality of Your work. Furthermore, all respondents that have answered high degree on question 79 also feel that they are quite satisfied to very satisfied with their work (question 105).
Of the respondents that answered low degree on question 79, 66 per cent answered low degree and 33 per cent quite low degree on question 77.
Table 11. Comparison question 77, 79 and 105
Question. 77 Question. 79 Question. 105
4. High degree 4. High degree 4. High degree 4. High degree 4. High degree 4. High degree 3. Quite high degree 4. High degree 4. High degree 3. Quite high degree 4. High degree 4. High degree 4. High degree 4. High degree 3. Quite high degree 4. High degree 4. High degree 3. Quite high degree 4. High degree 4. High degree 3. Quite high degree 2. Quite low degree 1. Low degree 2. Quite low degree 1. Low degree 1. Low degree 1. Low degree 1. Low degree 1. Low degree 3. Quite high degree
92. Do You prefer doing
70 per cent of the respondents that prefer to work with several things at once also prefer to work in a team. 60 per cent of the respondents that prefer to work with several things at once prefer to be responsible for the entire development process. 60 per cent of the respondents that prefer to work with several things at once wants to work with soft parts. Only 41 per cent of the respondents that prefer doing one thing at a time, prefer to work by themselves.
101. Which of the following alternatives is the closest match to Your company?
When doing a deeper investigation of the question, we can see that different respondents within the same company have different opinions about how the company is structured.
104. To what degree do You feel that the management style within the company supports and helps?
84 per cent of the respondents that have answered in quite high to high degree on this question have also answered quite high to high degree on question 102. To what degree do You feel that the management style within the company gives You opportunity to influence.
95 per cent of the respondents that have answered quite high to high degree on this question have also answered quite high to high degree on question 105. How satisfied are You with Your working situation? 91 per cent of the respondents that have answered in quite low to low degree on question 105 have also answered in quite low to low degree on question 104.
Even if the management style within the company is a factor for the respondents to feel satisfied with their working situation, it is clearly not the only factor that can be seen in question 105.
5.3 Correlations between Personality Test and Questionnaire
54. Age distribution
When analyzing this question and comparing it to the personality test we see that agreeableness is descending with age. When looking at the table below, it seems quite clear that respondents below the age of 30 have a significantly higher representation in the scale above median for the agreeableness factor. Furthermore, the age category 45 to above 60, are overrepresented in the lower scale of agreeableness.
It is possible that with increased experience most people have made mistakes and learned from them, thus it is feasible that people will become stronger and less sensitive with age. To further investigate this theory, we compared the years of experience, question 59, to the result in the table below. What we found was that not only age was a factor. We also discovered a correlation between the years of experience, age and agreeableness. We investigated the answers from the respondents that were under the age of 30 and had an agreeableness factor below median. What we discovered was that 75 per cent of these all had more experience than the respondents found in the higher scale of agreeableness.
Table 12. Distribution over age and agreeableness
< Median Median > Median Age < 30 31% 8% 62% Age > 45 67% 22% 11%

Personality Types and Attributes in Software Engineering
19
51. Sex ratio
We can not see any distinct differences between males and females when comparing their personality factors except for a small deviance in agreeableness. Females’ median for the agreeableness factor is 37 compared to the males median 40. We do not consider this to be significant mostly because of that the population is quite small and that the difference is only from 37 to 40 on a 50 point scale.
72. How satisfied are You with the standard You are using?
Of the respondents that have answered the question, 69 per cent are above the median on the neuroticism factor. We can find no explanation to why people that have answered the question have a more stable personality. We believe that this is only a statistical deviation. None of the females have answered this question.
87. What is Your main reason for change management?
67 per cent of the respondents, who answered customer satisfaction on this question, also believe that the companies’ main reason is customer satisfaction (question 88). 56 per cent of the above mentioned, also believes that the companies main reason for change management should be customer satisfaction (question 89).
75 per cent of the respondents that answered with customer satisfaction in question 87, are above median on the extraversion scale and 75 per cent are below median on the conscientiousness scale. The correlation between extraversion and customer satisfaction might possibly be explained with that extraverted individuals, who work with customers, also put the customer in focus. We can not find an explanation to why this category of respondents is below median on the conscientiousness scale.
89. What do You think the companies main reason should
be?
59 per cent of the respondents that believe that the quality of the end product is their reason for change management, also believe that the companies’ main reason should be the same.
Further correlations to this question are presented in question 87. What is Your main reason for change management.
93. You prefer to work
Only 23 per cent of the respondents that prefer to work by themselves are above the median on the agreeableness scale.
Only 5 per cent of the respondents that prefer to work by themselves want to work with project start up. As opposed to, 28 per cent of those who wants to work in a team also wants to work with the project start.
We were surprised by the result that the respondents that prefer to work by themselves, are not significantly lower on the extraversion scale. Being an extravert individual is obviously not the most significant factor for preferring team work as oppose to working alone.
96. Do You prefer to work with
None of the respondents that prefer to work with the project start up are below median on the agreeableness and extraversion scale.
88 per cent of the respondents that prefer to work with project start up also prefer to work in a team and prefer to do several things at once. Furthermore, all respondents that have stated that they prefer project start up, also want to be able to prioritize their own tasks.
63 per cent of the respondents that prefer to work with short contributions are below the median on the agreeableness scale.
97. If You could chose, would You prefer to work with
18 per cent of the females in the questionnaire group want to work with technical parts. 82 per cent of the females prefer to work with soft parts.
55 per cent of the respondents that prefer to work with technical parts are below the median on the agreeableness scale.
98. You work best/ most efficiently when
67 per cent of the respondents that have answered that they work best when their manager prioritize their tasks are below the median for the agreeableness factor. Only 17 per cent of the respondents that work best when their manager prioritizes their tasks are above the median for conscientiousness.
100. How important is it with research towards new working manner in Software Engineering?
75 per cent of the respondents that do not feel that research is important are below the median on the agreeableness scale.

Personality Types and Attributes in Software Engineering
20
102. To what degree do You feel that the management style within the company gives You opportunity
to influence?
83 per cent of the respondents that have answered low degree on question 102, are below the median on the extraversion scale. 80 per cent of the respondents that have answered high degree on this question are above median on the extraversion scale.
67 per cent of the respondents that have answered in low degree work within a company that has many levels.
80 per cent of the respondents that have answered in high degree on this question are above median on the neuroticism scale.
105. How satisfied are You with Your working situation?
When comparing this question to other perception questions in the study, we have found that the respondents, despite the fact that they have given a negative answer on many questions, are satisfied with their work.
67 per cent of the respondents that are very satisfied with their working situation are above median on the neuroticism scale. 67 of the respondents that have answered very satisfied on this question are under median on the conscientiousness scale. 67 per cent of the respondents that have answered very satisfied on this question are above median on the extraversion scale.

Personality Types and Attributes in Software Engineering
21
6 Discussion
The work that has been made during this study is presented below. The chapter includes the results from the study and the work as a whole with tips for future questionnaire and personality test design.
6.1 About the Result of the Study
We believe that the results from the study would have been different if we have had the possibility to do a more thorough selection in the population. The original intent was to invite only three companies with 20 respondents each, this would have given us a more homogeneous population. The study however was concluded using a small number of respondents from ten companies, which makes the population less homogeneous. We believe that if the study was repeated, the result would vary to some extent as the survey was answered by few respondents from many different environments. It is our belief that the result would be affected to a lower degree if there were a greater number of respondents answering the survey.
6.2 About the Result of the Analysis
First the correlations between the questions themselves, from the questionnaire, are discussed. In this part we focus on the questions were we have found no correlation to the personality test but found questions that correlates to each other. The second part of the discussion, addresses the questions were we have found correlations to different personality traits. We will try to explain and provide theories to the correlations found. Conclusions can be found in chapter 7.
6.2.1 Correlations between Questions
When we investigated if there were any differences between the respondents sexes and what they preferred to work with, we found that over 80 per cent of the females wanted to work with soft parts as opposed to the males were the answers were evenly distributed between technical and soft parts. A conclusion we have drawn is that sex is a greater factor than any personality traits in some cases. We
suspect that this is how it really looks like today in a bigger population.
We found that females in a higher degree experienced the company to encourage them to use a specific working manner as oppose to the males who in a higher degree believes that the company does not encourage them to use a specific working manner. We can only speculate to why this is the case. Either females are treated differently at the companies or males and females perceive their working situation differently. Further investigation is needed to answer this question. The internal reduction for the questionnaire is significantly higher for the females than for the males. We have found no explanation for this.
All respondents that feel there is a need to change the working manner they are using also believe it is important with change management for themselves to be satisfied with their working situation. This correlation is more easily explained as an individual that wants to change the working manner must take an active interest in change management, unless someone else changes the working manner for them.
Respondents that feel that they can make their own decisions also feel that their work is challenging and interesting and they are also very satisfied with their working situation. A viable theory for this phenomenon could be that the working situation becomes more challenging if the respondents have the possibility to make their own decisions. We also believe that it is very important that the respondents feel that their work is challenging and interesting for them to be more satisfied with their working situation. Only 11 per cent of the respondents that are very satisfied with their working situation work in an organization with many levels. This again, strengthens our theory that the ability to influence is a factor for the respondents to feel satisfied with their working situation.
When doing a deeper investigation of what the respondents felt was the closest match to their company, we can see that different respondents within the same company have different opinions about how the company is organized. The reason for this can be that the respondents that have not answered with the same alternative within the same company can work at different departments and have different amounts of managers above them. A respondent that has only a few managers can feel that the company has a rather flat organization, and a respondent that has more managers can feel that the organization has a rather hierarchical organization.

Personality Types and Attributes in Software Engineering
22
95 per cent of the respondents that feel that the management style helps and supports them are very satisfied with their working situation. This leads us to believe that management style is a significant factor for the respondents to feel satisfied with their working situation. We are convinced that there are more factors than management style that affect how satisfied the respondents are with their working situation. More correlations to this can be found in the next chapter.
When comparing question 105, how satisfied are you with your working situation, to other perception questions in the study, we have found that the respondents, despite the fact that they have given a negative answer on many questions, are quite satisfied with their work. We speculate if this can be related to our national character that it is typically Swedish to give an answer that is neither nor positive or negative on a question like this one, despite the fact that the respondent actually is very unsatisfied or very satisfied. It is very easy for the respondents to not take a stand and not think about how he really feels.
6.2.2 Correlations between Personality
Test and Questionnaire
When analyzing the questions, we have found that there is a correlation between respondents that have given no answer or do not know as alternative with personality type. We have found that respondents that have given these alternatives are below median on the neuroticism scale. We cannot explain this.
Agreeableness is descending with age. We found a correlation between age, agreeableness and experience. We find it viable to believe that with age and experience individuals tend to loose some of their youthful naivety as they are likely to make mistakes and learn from them. We believe that in some cases individuals who are about to start their career, might have an overly positive view about how it is to work in a Software Engineering company. The illusion can then easily be shattered when the individual gains experience and possibly gets a more realistic view of the business. We believe this can be a viable explanation to why agreeableness is descending with age and experience.
When analyzing the respondents that have answered customer satisfaction to be their main reason for change management, we also found that this group for the most parts also believed that this is the company’s main reason. More than half of this group also stated that the
company’s main reason should be customer satisfaction. This group is also overrepresented on the higher scale of extraversion. It is possible that people who are extravert are more likely to be placed in a position that requires customer relations. This could be an explanation to why an extravert individual feels that customer satisfaction is more important than for example quality of the end product. We can further strengthen this theory with the fact that respondents that are placed low on the extraversion scale and higher on the conscientiousness scale chose quality of the end product as their main reason. Most of the respondents that have chosen quality of the end product as their main reason believe that the company’s main reason is financial. The conclusion we have drawn is that higher extraversion is a factor for putting the customer in focus and higher conscientiousness is a factor for putting the end product in focus.
The correlation that respondents that are very satisfied with their working situation are above median on both the neuroticism and extraversion scale has been found. The same respondents are under the median on the conscientiousness scale. We believe that there are many factors that affect why the respondents are very satisfied with their working situation and to some degree it is obvious that personality traits such as extraversion and neuroticism is a factor. It is in our opinion very likely that stable individuals are less affected by their working situation than an individual that are low on the scale. Furthermore, an extravert individual is probably more likely to communicate, discuss and to solve issues with their peers than an introvert individual is.
All respondents that prefer to work with the project start up are above median on both the agreeableness and extraversion scale. Working with project start up includes meetings, brainstorming etc. This could be a reason to why all respondents are high on the extraversion scale. One of the definitions for the agreeableness factor is that individuals low on the scale can have problems working in a team. This further strengthen our theory as almost all respondents that prefer to work with the project start up also prefers to work in a team. The respondents that prefer to work with project start up also wants to work with several things at once and prefer to prioritize their own tasks.
The respondents that prefer their manager to prioritize their tasks are overrepresented on the lower scale of conscientiousness and agreeableness. They also prefer to work from project start to project end.

Personality Types and Attributes in Software Engineering
23
Our conclusion is that these respondents feel more comfortable not having to make decisions on their own. This is well in line with the scale description of the factors, conscientiousness and agreeableness.
83 per cent of the respondents that feel that the management style do not give them a possibility to influence are low on the extraversion scale. Individuals with a low extraversion are defined as reserved and keeps people at a distance. This could be an explanation to why they feel it is hard to influence. The majority of the respondents that feel that the management style does not give them a possibility to influence, work in an organization with many levels. Many levels in an organization usually means more red tape and the closest manager might not have the possibility to make all decisions on his own. Our conclusion is that it is harder to influence for an individual with low extraversion and even more difficult if you work in an organization with many levels. Furthermore, we see that respondents who feel that the management style gives them a possibility to influence are overrepresented on the higher scale of neuroticism. In our study, individuals placed high on this scale are described as self confident, secure, calm and relaxed. A conclusion we can draw is that there is several factors that affect the perception of the possibility to influence under the management style. An extraverted, self confident and secure individual, working at a company with few levels probably has the greatest possibility to influence. Only 11 per cent of the respondents that are very satisfied with their working situation work in an organization with many levels. This again, strengthens our theory that the ability to influence is a factor for the respondents to feel satisfied with the working situation.
6.3 Future Questionnaire Design
6.3.1 Before Reduction Analysis
Before we sent out an invitation to the companies to participate in the survey, we had some considerations about how we should do the dispatching.
We learned from last year when doing our degree project, that it is very difficult - if not to say impossible, to do a reduction analysis when the key persons themselves choose which developers to invite and when they also perform the actual dispatching to the participants.
Despite of the above mentioned, we chose to do the same way this year. We sent out an invitation to the key persons at the companies to participate and the key persons themselves dispatched the invitation to developers that they considered to be viable. We did this because of the fact that we wanted as many respondents as possible to participate in our study since we knew that the external reduction always will become higher than we want to believe.
We dispatched an invitation to the companies as early as we could to increase the answer frequency. We also sent out a reminder to increase the answer frequency. Despite that, 78 per cent of the invited respondents were participating.
The reason to why there was an external reduction on the questionnaire but not on the personality test is a question we have been considering. We believe that the reason is that the personality test contains easily answered questions were the respondents are asked to chose the alternative that first come to their minds. They can give the answer directly without thinking and pondering which alternative that fits the question asked. It could also have been that the study consisted of too many questions. The entire study began with the personality test which could have been more interesting for the respondents to answer. The personality test also takes less time to answer.
6.3.2 Designing Questions and
Alternatives of Answers
Before constructing questions with different alternatives of answers, it is very important to have in mind the scattering of respondents and how the companies participating are organized. We tried to do this in advance, but now afterwards we realize that our assumptions were not valid. Because of this mistake, the majority of the respondents have answered with the other alternative in the questionnaire. Therefore, it is necessary to do a thorough investigation of possible alternatives of answers.
When designing the alternatives of answers, we almost forgot to make them mutually excluded. For example, when we worked with the alternatives to the question 54. Age, we first wrote down the alternative 25-30 and 30-35. If any of the respondents is exactly 30 years old, how should he know which alternative he should choose? We reworked the alternatives to this question to 25-30 and 31-35.

Personality Types and Attributes in Software Engineering
24
6.3.3 Tips for Future Questionnaire
Studies
The following should be kept in mind when constructing questionnaire studies:
• The purpose of the survey shall govern the choice of method to use
• Invite many companies to participate as early as possible
• Send out reminder to companies participating many times
• Control the reduction by your self • Important to inform companies and
respondents participating about ethics and confidentiality
• Short time between invitation and implementation of survey due to product releases and vacations
• Do a thorough investigation of alternatives of answers
• Not too many questions in total in the survey
• To use a correct linguistic for making the respondents interpret the question in a correct way.
• Important to do a literature study of possible investigations methods before you can assume they are not licensed.
• Complement different investigation methods to get as valid results as possible
6.4 Discussion around future Design of Personality Test
6.4.1 Tips for Future Personality Tests
The references used for the Five Factor Theory, describe the individuals that are placed high on the neuroticism scale as worried, nervous, instable, unpredictable and hypochondriacs. Individuals that are placed low on the scale are described as calm, relaxed, secure and self confident. However, the personality test we received was translated to Swedish. In the Swedish version the scale for the neuroticism factor was reversed and neuroticism was translated to stability. This is important to have in mind when interpreting the result as an individual placed high on the scale, on neuroticism, actually are a stable person.
Our plan was to use the Myers-Briggs Type Indicator when doing our survey since all related research found have been done with MBTI. However, since the MBTI requires a license to use, we could not use this test. The
earlier research in personality types and attitudes towards Software Engineering, could not be compared to our result when using the Five Factor Theory because of the fact that these two tests are not comparable to each other.
Considering other factors than earlier research we believe that the Five Factor Theory have several advantages over MBTI. For example, MBTI is considered to be more outdated then the Five factor Theory as it is an evolvement of MBTI. The Five Factor Theory also supports more personality types as MBTI is limited to 16 distinct personality types. MBTI describes the personality types as fixed versus the Five Factor Theory that describes personalities as more or less on scales. The Five Factor Theory is less an approximation compared to MBTI since the Five Factor Theory indicates exactly were on the scales an individual are placed. MBTI leaves no room between their distinct personality types.

Personality Types and Attributes in Software Engineering
25
7 Conclusion The question at issue for this study is
to investigate if there is a correlation between personality types and attitudes towards Software Engineering.
The conclusion we have drawn is that higher extraversion is a factor for putting the customer in focus and higher conscientiousness is a factor for putting the end product in focus.
Further conclusions we can draw is that there is several factors that affect the perception of the possibility to influence under the management style. An extraverted, self confident and secure individual, working at a company with few levels probably has the greatest possibility to influence. Other interesting conclusions are that agreeableness is descending with age and increased experience. Experience can also be a factor unrelated to age, younger people that have more experience are also placed under the median on the agreeableness factor.
Finally, we believe that there is a correlation between personality types and attitudes towards Software Engineering. However, it is probably not the most significant factor. We have found that several other factors, as for example management style, the ability to influence, organization, working manners and change management, affect the developers attitudes towards Software Engineering.
Based on the analysis in chapter 5 and the conclusions we have drawn, we consider that the question at issue for the study is answered. We have shown that personality traits influence several of the software developers opinions and attitudes towards different aspects of Software Engineering.

Personality Types and Attributes in Software Engineering
26
8 Future Work We believe it would have been
interesting to follow up the results from the questionnaire and the personality test with deep interviews. One thought we had with the deep interviews were to ask the respondents were he would place him self on the five scales on the personality test and then compare the respondents self perception with the respondents actual result from the personality test.
It would also have been interesting, asking the respondents in the deep interviews why they have answered all questions in the personality test and why there was a greater reduction on the questionnaire.
To get more interesting and reliable results from the study, we had preferred doing a thorough selection of the population. This is hard since it is difficult to get respondents and companies involved in surveys.

Personality Types and Attributes in Software Engineering
27
9 References [1] Wikipedia Phrase [Electronic] Available: <http://en.wikipedia.org/wiki/ > [2005-08-19] [2] Sommerville, Ian (2004) Software
Engineering. Boston: Addison-Wesley. [3] Tomayko, James E. & Hazzan, Orit (2004). Human Aspects of Software Engineering. Hingham: Charles River Media. [4] Capretz, Luiz Fernando (2002) Personality
types in Software Engineering. Oxford: Elsevier Science Ltd. [5] Samuelsson, Maria. Attitudes in Software
Engineering - A Feasibility Study in how
Developers Attitudes affect Their Work [Electronic] Available: http://www2.bibliotek.htu.se/exarb/T04-058.pdf [2005-08-12] [6] Michale, John, Björnar, Tessem & Frank Maurer Human and Social Factors of Software
Engineering – Workshop Summary [Electronic] Available: http://ebe.cpsc.ucalgary.ca/ebe/attach?page=Root.PublicationList%2FJohnEtAl2005.pdf [2005-08-12] [7] Ejlertsson, Göran (1996). Enkäten i
praktiken – en handbok i enkätmetodik. Lund: Studentlitteratur. [8] Trost, Jan (1993). Kvalitativa intervjuer. Lund: Studentlitteratur. [9] Kýlen, Jan-Axel (1994). Fråga rätt vid enkäter, intervjuer, observationer och läsning. Stockholm: Kýlen. [10] Robson, Colin (1993). Real world research
– A resource for social scientists and
practitioner researches. Oxford: Blackwell Publishers Ltd. [11]Andersson, Bengt-Erik (2001). Som man
frågar får man svar - en introduktion i intervju-
och enkätteknik. Stockholm: Prisma. [12] Krag Jacobsen, Jan (1993). Intervju-
konsten att lyssna och fråga. Lund: Studentlitteratur.
[13]Seidman, Irving (1998). Interviewing as
qualitative research - A guide for researchers in
education and the social sciences. London: Teachers College Press. [14] PRA Inc The Indepth Interview
[Electronic] Available: <http://www.pra.ca/resources/indepth.pdf> [2005-05-03] [15] OrientPacific Depth Interviews [Electronic] Available: <http://www.orientpacific.com/depth-interviews.htm [16] Surveys-forecast In depth interviews [Electronic] Available: http://www.surveys-forecasts.com/indepth.htm> [2005-05-03] [17] Ekholm, Mats & Fransson. Anders (1992). Praktisk intervjuteknik. Göteborg: Norstedt . [18] Möberg, Rebecka & Persson, Helena (2004) Sambandet mellan personlighet och
yrkesmässiga intressen: En begreppsvalidering av ett personlighetstest baserat på
femfaktorteorin. Lund: Lunds Universitet. [19] OutOfService The Big Five Personality
Test [Electronic] Available: http://www.outofservice.com/bigfive/info/ [2005-08-12] [20] Mirrorgate Big Five PersonlighetsProfil
[Electronic] Available: <http://www.mirrorgate.se/prodblad.B5.pdf> [2005-08-12] [21] Malmén, Anna & Ohlin, Brita 2004) Utvärdering av “30” aspekter- en
kvalitetskontroll av ett personlighetstest grundat
på femfatormodellen.Lund: Lunds Universitet [22] SCB Yrkesstrukturen i Sverige 2003
[Electronic] Available: <http://www.scb.se/templates/Publikation____132533.asp> [2005-08-12] [23] SCB Yrkesstrukturen i Sverige 2003 [Electronic] Available: <http://www.scb.se/templates/Publikation____132535.asp> [2005-08-12]

Personality Types and Attributes in Software Engineering
28
Appendix A : Personality Test 1. Är grundlig i mitt arbete
5. stämmer precis
4. stämmer bra
3. stämmer delvis
2. stämmer dåligt
1. stämmer inte alls 2. Blir lätt upprörd
5. stämmer precis
4. stämmer bra
3. stämmer delvis
2. stämmer dåligt
1. stämmer inte alls 3. Sympatiserar med andras känslor
5. stämmer precis
4. stämmer bra
3. stämmer delvis
2. stämmer dåligt
1. stämmer inte alls 4. Smiter undan mina plikter
5. stämmer precis
4. stämmer bra
3. stämmer delvis
2. stämmer dåligt
1. stämmer inte alls 5. Har utmärkta ideer
5. stämmer precis
4. stämmer bra
3. stämmer delvis
2. stämmer dåligt
1. stämmer inte alls
6. Är alltid förberedd
5. stämmer precis
4. stämmer bra
3. stämmer delvis
2. stämmer dåligt
1. stämmer inte alls 7. Sätter igång konversationer
5. stämmer precis
4. stämmer bra
3. stämmer delvis
2. stämmer dåligt
1. stämmer inte alls 8. Har ofta förekommande humörsvängningar
5. stämmer precis
4. stämmer bra
3. stämmer delvis
2. stämmer dåligt
1. stämmer inte alls 9. Känner mig sällan nere
5. stämmer precis
4. stämmer bra
3. stämmer delvis
2. stämmer dåligt
1. stämmer inte alls 10. Är avslappnad för det mesta
5. stämmer precis
4. stämmer bra
3. stämmer delvis

Personality Types and Attributes in Software Engineering
29
2. stämmer dåligt
1. stämmer inte alls 11. Lämnar mina saker liggande överallt
5. stämmer precis
4. stämmer bra
3. stämmer delvis
2. stämmer dåligt
1. stämmer inte alls 12. Känner mig inte speciellt bekymrad för andra
5. stämmer precis
4. stämmer bra
3. stämmer delvis
2. stämmer dåligt
1. stämmer inte alls 13. Följer ett schema
5. stämmer precis
4. stämmer bra
3. stämmer delvis
2. stämmer dåligt
1. stämmer inte alls 14. Gör hushållsarbete genast
5. stämmer precis
4. stämmer bra
3. stämmer delvis
2. stämmer dåligt
1. stämmer inte alls 15. Har svårt att förstå abstrakta ideer
5. stämmer precis
4. stämmer bra
3. stämmer delvis
2. stämmer dåligt
1. stämmer inte alls 16. Är ointresserad i andra människors problem
5. stämmer precis
4. stämmer bra
3. stämmer delvis
2. stämmer dåligt
1. stämmer inte alls 17. Förolämpar folk
5. stämmer precis
4. stämmer bra
3. stämmer delvis
2. stämmer dåligt
1. stämmer inte alls 18. Är intresserad av människor
5. stämmer precis
4. stämmer bra
3. stämmer delvis
2. stämmer dåligt
1. stämmer inte alls 19. Blir lätt störd
5. stämmer precis
4. stämmer bra
3. stämmer delvis
2. stämmer dåligt
1. stämmer inte alls 20. Är den som håller igång på ett party
5. stämmer precis
4. stämmer bra
3. stämmer delvis

Personality Types and Attributes in Software Engineering
30
2. stämmer dåligt
1. stämmer inte alls 21. Lägger uppmärksamhet på detaljer
5. stämmer precis
4. stämmer bra
3. stämmer delvis
2. stämmer dåligt
1. stämmer inte alls 22. Tar mig tid för andra
5. stämmer precis
4. stämmer bra
3. stämmer delvis
2. stämmer dåligt
1. stämmer inte alls 23. Känner mig bekväm med människor omkring mig
5. stämmer precis
4. stämmer bra
3. stämmer delvis
2. stämmer dåligt
1. stämmer inte alls 24. Får människor att känna sig väl till mods
5. stämmer precis
4. stämmer bra
3. stämmer delvis
2. stämmer dåligt
1. stämmer inte alls 25. Tycker om ordning
5. stämmer precis
4. stämmer bra
3. stämmer delvis
2. stämmer dåligt
1. stämmer inte alls 26. Tycker inte om att dra uppmärksamhet till mig
5. stämmer precis
4. stämmer bra
3. stämmer delvis
2. stämmer dåligt
1. stämmer inte alls 27. Har ett gott hjärta
5. stämmer precis
4. stämmer bra
3. stämmer delvis
2. stämmer dåligt
1. stämmer inte alls 28. Har ett rikt ordförråd
5. stämmer precis
4. stämmer bra
3. stämmer delvis
2. stämmer dåligt
1. stämmer inte alls 29. Är full av ideer
5. stämmer precis
4. stämmer bra
3. stämmer delvis
2. stämmer dåligt
1. stämmer inte alls 30. Håller mig i bakgrunden
5. stämmer precis
4. stämmer bra
3. stämmer delvis

Personality Types and Attributes in Software Engineering
31
2. stämmer dåligt
1. stämmer inte alls 31. Har lite att säga
5. stämmer precis
4. stämmer bra
3. stämmer delvis
2. stämmer dåligt
1. stämmer inte alls 32. Pratar inte mycket
5. stämmer precis
4. stämmer bra
3. stämmer delvis
2. stämmer dåligt
1. stämmer inte alls 33. Har inte något emot att vara i centrum för uppmärksamheten
5. stämmer precis
4. stämmer bra
3. stämmer delvis
2. stämmer dåligt
1. stämmer inte alls 34. Är tyst tillsammans med främlingar
5. stämmer precis
4. stämmer bra
3. stämmer delvis
2. stämmer dåligt
1. stämmer inte alls 35. Oroar mig över saker
5. stämmer precis
4. stämmer bra
3. stämmer delvis
2. stämmer dåligt
1. stämmer inte alls 36. Pratar med en massa olika människor under en fest
5. stämmer precis
4. stämmer bra
3. stämmer delvis
2. stämmer dåligt
1. stämmer inte alls 37. Är egentligen inte intresserad av andra
5. stämmer precis
4. stämmer bra
3. stämmer delvis
2. stämmer dåligt
1. stämmer inte alls 38. Blir lätt stressad
5. stämmer precis
4. stämmer bra
3. stämmer delvis
2. stämmer dåligt
1. stämmer inte alls 39. Känner mig ofta nere
5. stämmer precis
4. stämmer bra
3. stämmer delvis
2. stämmer dåligt
1. stämmer inte alls 40. Har ett humör som svänger mycket
5. stämmer precis
4. stämmer bra

Personality Types and Attributes in Software Engineering
32
3. stämmer delvis
2. stämmer dåligt
1. stämmer inte alls 41. Glömmer ofta att lägga tillbaka saker på sin plats
5. stämmer precis
4. stämmer bra
3. stämmer delvis
2. stämmer dåligt
1. stämmer inte alls 42. Känner andra människors känslor
5. stämmer precis
4. stämmer bra
3. stämmer delvis
2. stämmer dåligt
1. stämmer inte alls 43. Skapar förvirring omkring mig
5. stämmer precis
4. stämmer bra
3. stämmer delvis
2. stämmer dåligt
1. stämmer inte alls 44. Förstår saker snabbt
5. stämmer precis
4. stämmer bra
3. stämmer delvis
2. stämmer dåligt
1. stämmer inte alls 45. Blir lätt irriterad
5. stämmer precis
4. stämmer bra
3. stämmer delvis
2. stämmer dåligt
1. stämmer inte alls 46. Är fantasilös
5. stämmer precis
4. stämmer bra
3. stämmer delvis
2. stämmer dåligt
1. stämmer inte alls 47. Ägnar tid åt att fundera på saker
5. stämmer precis
4. stämmer bra
3. stämmer delvis
2. stämmer dåligt
1. stämmer inte alls 48. Är ointresserad av abstrakta ideer
5. stämmer precis
4. stämmer bra
3. stämmer delvis
2. stämmer dåligt
1. stämmer inte alls 49. Använder svåra ord
5. stämmer precis
4. stämmer bra
3. stämmer delvis
2. stämmer dåligt
1. stämmer inte alls 50. Har en vild fantasi
5. stämmer precis
4. stämmer bra
3. stämmer delvis

Personality Types and Attributes in Software Engineering
33
2. stämmer dåligt 1. stämmer inte alls

Personality Types and Attributes in Software Engineering
34
Appendix B : Questionnaire Om dig och din bakgrund
51. Kön?
Kvinna
Man 52. Namn? 53. Epostadress? 54. Ålder?
< 25
25-30
31-35
36-40
41-45
46-50
51-55
56-60
> 60 55. Vad har du för utbildning?
Grundskola
Gymnasium
Folkhögskola
Internutbildning
Högskola/Universitet
Annat: 56. Om du läst vid universitet/högskola, vilken av följande utbildningar har du fullföljt?
Civilingenjör
Datavetenskaplig
Programvaruteknik
Systemvetenskaplig
Annat: Om företaget och din position
57. Företagsnamn?
58. Yrke?
Metodansvarig
Produktutvecklingschef
Programmerare
Projektledare
Systemarkitekt
Annat: 59. Hur många års erfarenhet har du av något av ovanstående områden inom programvaruteknik?
< 2
2-5
6-10
> 10 60. Hur många år har du varit anställd på ditt nuvarande jobb?
< 2
2-5
6-10
> 10 61. Vad arbetar du med?
Design
Dokumentation
Kravhantering
Kravställan
Kundkontakt
Personalansvar
Programmering
Projektledning
Testning
Verifiering & Validering
Annat:

Personality Types and Attributes in Software Engineering
35
Om arbetsuppgifterna 62. Vilken typ av produkter utvecklar du främst för?
Inbyggda system
Klient applikationer
Server applikationer
Webb applikationer
Telecom
Annat: 63. Vad är det för storlek på projekten du utvecklar?
< 3 månader
3-6 månader
7-12 månader
> 12 månader Om verktyg och arbetssätt I
64. Vilka verktyg använder du dig av idag?
ArgoUML
IDE Eclipse
Parasoft
Rational Rose
SunOne
TogetherSoft
Visual Studio
WithClass
Dezign
Annat: 65. Vilket verktyg anser du vara det mest viktiga i ditt arbete?
ArgoUML
IDE Eclipse
Parasoft
Rational Rose
SunOne
TogetherSoft
Visual Studio
WithClass
Dezign
Oracle Designer
Annat: 66. I vilken grad anser du att verktyget du använder dig av hjälper dig i ditt arbete?
4. Mycket
3. Ganska mycket
2. Ganska lite
1. Inte alls
Vet ej 67. Hur nöjd är du med det verktyg som du använder dig av idag?
4. Mycket nöjd
3. Ganska nöjd
2. Ganska missnöjd
1. Missnöjd
Vet ej 68. Om du saknar något verktyg i ditt arbete, vilket? Om verktyg och arbetssätt II
69. Vilka standarder använder du dig av idag?
CMM (Capability Maturity Model)
ISO 12207 (Software Life Cycle Process)
ISO 15288 (Life Cycle Management)
ISO 9000 (Quality Management)
P-CMM (People Capability Maturity Model)
PSP (Personal Software Process)
RUP (Rational Unified Process)
SPICE (Software Process Improvement and Capability dEtermination)
TSP (Team Software Process)
Annat:

Personality Types and Attributes in Software Engineering
36
70. Vilken standard anser du vara den mest viktiga i ditt arbete?
CMM (Capability Maturity Model)
ISO 12207 (Software Life Cycle Process)
ISO 15288 (Life Cycle Management)
ISO 9000 (Quality Management)
P-CMM (People Capability Maturity Model)
PSP (Personal Software Process)
RUP (Rational Unified Process)
SPICE (Software Process Improvement and Capability dEtermination)
TSP (Team Software Process)
Annat: 71. I vilken grad anser du att standarden du använder dig av hjälper dig i ditt arbete?
4. Mycket
3. Ganska mycket
2. Ganska lite
1. Inte alls
Vet ej 72. Hur nöjd är du med den standard som du använder dig av idag?
4. Mycket nöjd
3. Ganska nöjd
2. Ganska missnöjd
1. Missnöjd
Vet ej Om organisationen I 73. Varför har du valt det arbetssätt som du använder dig av?
Företagskultur bestämmer
Jobbat tidigare med arbetssättet och vet att det är bra
Nytänkande
Tips
Vet ej
Annat:
74. I vilken grad anser du att det finns behov av att förändra det arbetssätt som du använder dig av?
4. Hög grad
3. Ganska hög grad
2. Ganska låg grad
1. Låg grad
Vet ej 75. I vilken grad anser du att företaget uppmuntrar till att använda specifika arbetssätt?
4. Hög grad
3. Ganska hög grad
2. Ganska låg grad
1. Låg grad
Vet ej 76. I vilken grad anser du att du själv får välja arbetssätt?
4. Hög grad
3. Ganska hög grad
2. Ganska låg grad
1. Låg grad
Vet ej 77. I vilken grad anser du att du själv kan fatta beslut som ökar kvaliteten på ditt arbete?
4. Hög grad
3. Ganska hög grad
2. Ganska låg grad
1. Låg grad
Vet ej 78. I vilken grad anser du att det arbetssätt du använder dig av tillåter dig att vara kreativ?
4. Hög grad
3. Ganska hög grad
2. Ganska låg grad
1. Låg grad
Vet ej

Personality Types and Attributes in Software Engineering
37
Om organisationen II 79. I vilken grad anser du att ditt arbete är intressant och utmanande?
4. Hög grad
3. Ganska hög grad
2. Ganska låg grad
1. Låg grad
Vet ej 80. På ditt företag introduceras nya arbetssätt i utvecklingsarbetet genom:?
Bransch utvecklas och kräver nya arbetssätt
Nya standarder tillkommer
Nyanställning
Resurser som jobbar med förändringsarbete
Utbildning
Vet ej
Annat: 81. I vilken grad anser du att det senaste införandet av ett nytt arbetssätt i ett utvecklingsprojekt var en förbättring av ditt arbete?
4. Hög grad
3. Ganska hög grad
2. Ganska låg grad
1. Låg grad
Vej ej 82. Hur viktigt anser du det vara med förändringsarbete, för de produkter ni utvecklar?
4. Mycket viktigt
3. Ganska viktigt
2. Mindre viktigt
1. Inte viktigt alls
Vet ej
83. Hur viktigt anser du det vara med förändringsarbete, för dig själv att känna dig nöjd med din arbetssituation?
4. Mycket viktigt
3. Ganska viktigt
2. Mindre viktigt
1. Inte viktigt alls
Vet ej Om organisationen III 84. Vad tror du krävs för att företaget ska kunna införa nya arbetssätt idag?
Branschstandard
Kundkrav
Nyckelpersoner tror på arbetssätt
Öppenhet inför nya arbetssätt
Vet ej
Annat: 85. I vilken grad anser du att företaget inför etablerade arbetssätt kontra nyutvecklade arbetssätt?
4. Hög grad
3. Ganska hög grad
2. Ganska låg grad
1. Låg grad
Vet ej 86. I vilken grad anser du dig själv jobba med förändringsarbete?
4. Hög grad
3. Ganska hög grad
2. Ganska låg grad
1. Låg grad
Vet ej 87. Vad är din primära orsak till förändringsarbete?
Driftiga personer i företaget
Egna initiativ
Ekonomiska skäl
Hålla branschstandard
Kundtillfredsställelse

Personality Types and Attributes in Software Engineering
38
Slutproduktens kvalitet
Vet ej
Annat 88. Vad tror du är företagets primära orsak till förändringsarbete?
Driftiga personer i företaget
Egna initiativ
Ekonomiska skäl
Hålla branschstandard
Kundtillfredsställelse
Slutproduktens kvalitet
Vet ej
Annat 89. Vad anser du företagets primära orsak till förändringsarbete borde vara?
Driftiga personer i företaget
Egna initiativ
Ekonomiska skäl
Hålla branschstandard
Kundtillfredsställelse
Slutproduktens kvalitet
Vet ej
Annat Om dig
90. Är du mest effektiv när:
du arbetar efter en given ordning, eller
du får välja ordning själv? 91. Jobbar du helst:
efter ett givet schema, projektplan, eller
så som dagen kommer? 92. Trivs du bäst med att arbeta:
med flera saker samtidigt, eller
en sak i taget?
93. Du trivs bäst att arbeta:
i grupp, eller
enskilt? 94. Trivs du bäst med att ansvara för:
hela utvecklingsprocessen, eller
viss del? 95. Föredrar du att jobba i:
korta projekt som varar längst i någon månad, eller
långa projekt som varar i flera månader upp till ett år? 96. Föredrar du att jobba med:
uppstart av projekt, eller
från början till slut, eller
punktinsats? 97. Om du fick välja, skulle du helst vilja jobba med:
tekniska delar, eller
mjuka delar? 98. Du arbetar bäst/mest effektivt när:
närmaste chef prioriterar dina arbetsuppgifter, eller
du själv kan prioritera dina arbetsuppgifter? Om forskning 99. Hur håller du dig uppdaterad vad gäller den senaste forskningen inom Software Engineering (SV: Programvaruteknik)?
Branschtidskrifter
Diskussionsforum
Företagsnätverk
Internet
Personliga kontakter
Utbildning
Vet ej
Annat:

Personality Types and Attributes in Software Engineering
39
100. Hur viktigt anser du det vara med forskning med nya arbetssätt inom Software Engineering (SV: Programvaruteknik)?
4. Mycket viktigt
3. Ganska viktigt
2. Mindre viktigt
1. Inte viktigt alls
Vet ej Om organisationen
101. Vilket av följande alternativ stämmer bäst in på ditt företag?
Många nivåer med direktstyrning från närmaste chef. Lite samarbete mellan avdelningarna
Relativt platt organisation där närmaste chef leder verksamheten
Närmaste chef jobbar som en i teamet. Stora påverkningsmöjligheter som anställd 102. I vilken grad upplever du att ledarskapsstilen inom företaget ger dig möjlighet till inflytande?
4. Hög grad
3. Ganska hög grad
2. Ganska låg grad
1. Låg grad
Vet ej
103. I vilken grad upplever du att ledarskapsstilen inom företaget ger dig möjlighet till kreativt arbete?
4. Hög grad
3. Ganska hög grad
2. Ganska låg grad
1. Låg grad
Vet ej 104. I vilken grad upplever du att ledarskapsstilen inom företaget underlättar och hjälper dig i ditt arbete?
4. Hög grad
3. Ganska hög grad
2. Ganska låg grad
1. Låg grad
Vet ej 105. Hur nöjd är du med ditt arbete?
4. Mycket nöjd
3. Ganska nöjd
2. Lite nöjd
1. Inte alls nöjd
Vet ej 106. Om du kunde förändra en sak i ditt arbete för att öka din tillfredsställelse och produktivitet, vad skulle det vara?

Personality Types and Attributes in Software Engineering
40
Appendix C : Data for Analysis
Respondents Agreeableness Openness Conscientiousness Extraversion Neuroticism
1 45 38 35 47 32 2 24 49 35 38 35 3 36 38 35 26 27 4 43 42 38 33 45 5 44 39 40 40 36 6 42 32 37 35 41 7 42 37 42 33 42 8 40 33 34 38 37 9 39 44 36 37 35 10 30 48 31 37 38 11 41 46 29 30 49 12 30 36 38 21 29 13 50 42 36 40 34 14 39 31 38 22 36 15 38 34 36 29 37 16 43 33 35 37 40 17 40 38 30 31 33 18 38 35 42 33 24 19 38 38 30 27 32 20 44 39 37 48 26 21 38 34 35 38 37 22 41 41 36 41 39 23 37 39 31 27 35 24 39 35 33 39 39 25 40 31 39 33 36 26 37 37 33 27 43 27 43 44 39 47 44 28 39 36 33 38 42 29 43 39 33 40 44 30 39 38 38 31 31 31 36 34 40 32 31 32 35 35 31 29 35 33 39 38 36 31 39 34 31 34 36 24 30 35 43 44 41 48 45 36 33 40 43 23 34 37 38 35 36 37 37 38 38 38 35 42 33 39 36 23 36 23 42 40 35 38 40 31 45 41 39 33 37 27 43 42 31 31 38 24 39 43 32 40 42 20 29 44 39 42 34 36 49 45 47 38 40 42 37 46 31 35 37 28 37 47 41 40 40 33 40

Personality Types and Attributes in Software Engineering
41
Respondents 51. Sex? 54. Age?
59. How many years of experience do
You have in the above mentioned areas?
63. What is normally the size of Your
Software Engineering projects?
1 Male 31-35 < 2 År No answer 2 Male 25-30 6-10 År 3-6 Mån 3 Male 25-30 6-10 År 3-6 Mån 4 Male 31-35 6-10 År 3-6 Mån 5 Female 25-30 < 2 År 3-6 Mån 6 Male 25-30 2-5 År 3-6 Mån 7 Male 25-30 2-5 År 3-6 Mån 8 Female 25-30 2-5 År 3-6 Mån 9 Male 41-45 > 10 År 7-12 Mån 10 Male 31-35 6-10 År > 12 Mån 11 Male 25-30 2-5 År 3-6 Mån 12 Male 31-35 6-10 År > 12 Mån 13 Female 25-30 2-5 År < 3 Mån 14 Female 36-40 > 10 År < 3 Mån 15 Female 46-50 > 10 År 3-6 Mån 16 Female 36-40 6-10 År > 12 Mån 17 Male 31-35 6-10 År 3-6 Mån 18 Male 31-35 > 10 År 7-12 Mån 19 Male 36-40 6-10 År 3-6 Mån 20 Male 31-35 6-10 År < 3 Mån 21 Female 36-40 6-10 År 7-12 Mån 22 Male 41-45 > 10 År 3-6 Mån 23 Male 36-40 6-10 År 7-12 Mån 24 Male 51-55 > 10 År > 12 Mån 25 Female 31-35 > 10 År 7-12 Mån 26 Male 51-55 > 10 År > 12 Mån 27 Male 46-50 > 10 År > 12 Mån 28 Male 25-30 6-10 År 3-6 Mån 29 Male 41-45 6-10 År > 12 Mån 30 Female 31-35 6-10 År 7-12 Mån 31 Male 25-30 6-10 År 7-12 Mån 32 Male 31-35 2-5 År < 3 Mån 33 Female 31-35 < 2 År No answer 34 Male 41-45 2-5 År > 12 Mån 35 Male 25-30 < 2 År < 3 Mån 36 Male 36-40 6-10 År > 12 Mån 37 Male 31-35 6-10 År 3-6 Mån 38 Male 25-30 2-5 År < 3 Mån 39 Male 46-50 6-10 År < 3 Mån 40 Male 31-35 2-5 År < 3 Mån 41 Male 56-60 > 10 År < 3 Mån 42 Male 51-55 > 10 År < 3 Mån 43 Female > 60 > 10 År < 3 Mån 44 Male 36-40 6-10 År < 3 Mån 45 Male 36-40 > 10 År > 12 Mån 46 Male 51-55 > 10 År 7-12 Mån 47 Male 25-30 < 2 År < 3 Mån

Personality Types and Attributes in Software Engineering
42
Respondent
67. How satisfied are You with
the tool You are using?
72. How satisfied are You with
the standard You are using?
74. To what degree do You feel that there is a need to
change the current working manner?
1 Do not know No answer No answer 2 3. Quite satisfied Do not know 1. Low degree 3 4. Very satisfied Do not know 2. Quite low degree 4 3. Quite satisfied Do not know 3. Quite high degree 5 4. Very satisfied No answer 2. Quite low degree 6 3. Quite satisfied No answer 2. Quite low degree 7 4. Very satisfied 4. Very satisfied 2. Quite low degree 8 3. Quite satisfied No answer No answer 9 3. Quite satisfied Do not know 4. High degree 10 3. Quite satisfied Do not know 3. Quite high degree 11 4. Very satisfied No answer 4. High degree 12 3. Quite satisfied Do not know 3. Quite high degree 13 2. Less satisfied Do not know No answer 14 3. Quite satisfied Do not know No answer 15 3. Quite satisfied No answer 3. Quite high degree 16 3. Quite satisfied No answer 4. High degree 17 3. Quite satisfied 2. Less satisfied 4. High degree 18 4. Very satisfied Do not know No answer 19 3. Quite satisfied 2. Less satisfied 4. High degree 20 4. Very satisfied 1. Unsatisfied 3. Quite high degree 21 3. Quite satisfied Do not know 2. Quite low degree 22 3. Quite satisfied 3. Quite satisfied 3. Quite high degree 23 3. Quite satisfied Do not know 3. Quite high degree 24 3. Quite satisfied No answer 3. Quite high degree 25 3. Quite satisfied Do not know 3. Quite high degree 26 4. Very satisfied 3. Quite satisfied 3. Quite high degree 27 3. Quite satisfied 2. Less satisfied 3. Quite high degree 28 3. Quite satisfied 2. Less satisfied 3. Quite high degree 29 Do not know 3. Quite satisfied 2. Quite low degree 30 4. Very satisfied Do not know No answer 31 4. Very satisfied Do not know 3. Quite high degree 32 3. Quite satisfied Do not know 3. Quite high degree 33 No answer No answer 2. Quite low degree 34 3. Quite satisfied 3. Quite satisfied 2. Quite low degree 35 2. Less satisfied 3. Quite satisfied 3. Quite high degree 36 No answer No answer No answer 37 3. Quite satisfied Do not know 3. Quite high degree 38 3. Quite satisfied 3. Quite satisfied 2. Quite low degree 39 3. Quite satisfied 2. Less satisfied 4. High degree 40 2. Less satisfied Do not know 3. Quite high degree 41 4. Very satisfied 3. Quite satisfied 2. Quite low degree 42 4. Very satisfied No answer 1. Low degree 43 Do not know Do not know 1. Low degree 44 3. Quite satisfied 1. Unsatisfied 4. High degree 45 4. Very satisfied Do not know 2. Quite low degree 46 3. Quite satisfied Do not know 2. Quite low degree 47 3. Quite satisfied 3. Quite satisfied 1. Low degree
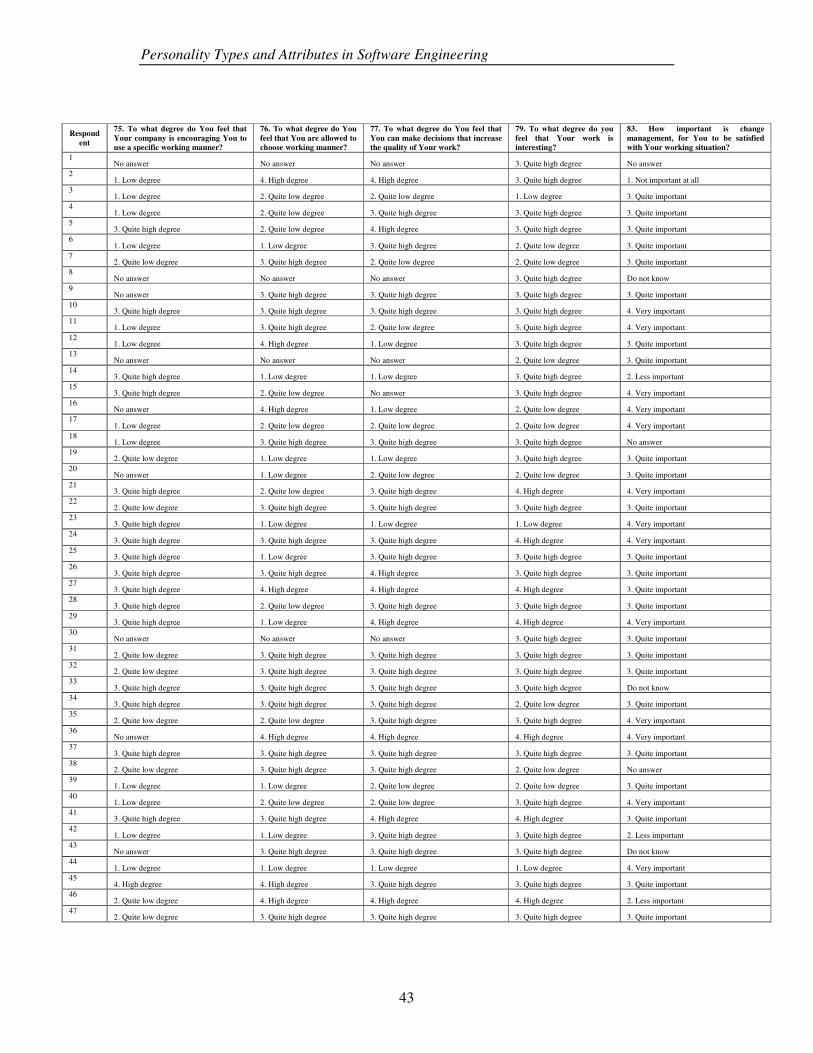
Personality Types and Attributes in Software Engineering
43
Respond
ent
75. To what degree do You feel that
Your company is encouraging You to
use a specific working manner?
76. To what degree do You
feel that You are allowed to
choose working manner?
77. To what degree do You feel that
You can make decisions that increase
the quality of Your work?
79. To what degree do you
feel that Your work is
interesting?
83. How important is change
management, for You to be satisfied
with Your working situation?
1 No answer No answer No answer 3. Quite high degree No answer
2 1. Low degree 4. High degree 4. High degree 3. Quite high degree 1. Not important at all
3 1. Low degree 2. Quite low degree 2. Quite low degree 1. Low degree 3. Quite important
4 1. Low degree 2. Quite low degree 3. Quite high degree 3. Quite high degree 3. Quite important
5 3. Quite high degree 2. Quite low degree 4. High degree 3. Quite high degree 3. Quite important
6 1. Low degree 1. Low degree 3. Quite high degree 2. Quite low degree 3. Quite important
7 2. Quite low degree 3. Quite high degree 2. Quite low degree 2. Quite low degree 3. Quite important
8 No answer No answer No answer 3. Quite high degree Do not know
9 No answer 3. Quite high degree 3. Quite high degree 3. Quite high degree 3. Quite important
10 3. Quite high degree 3. Quite high degree 3. Quite high degree 3. Quite high degree 4. Very important
11 1. Low degree 3. Quite high degree 2. Quite low degree 3. Quite high degree 4. Very important
12 1. Low degree 4. High degree 1. Low degree 3. Quite high degree 3. Quite important
13 No answer No answer No answer 2. Quite low degree 3. Quite important
14 3. Quite high degree 1. Low degree 1. Low degree 3. Quite high degree 2. Less important
15 3. Quite high degree 2. Quite low degree No answer 3. Quite high degree 4. Very important
16 No answer 4. High degree 1. Low degree 2. Quite low degree 4. Very important
17 1. Low degree 2. Quite low degree 2. Quite low degree 2. Quite low degree 4. Very important
18 1. Low degree 3. Quite high degree 3. Quite high degree 3. Quite high degree No answer
19 2. Quite low degree 1. Low degree 1. Low degree 3. Quite high degree 3. Quite important
20 No answer 1. Low degree 2. Quite low degree 2. Quite low degree 3. Quite important
21 3. Quite high degree 2. Quite low degree 3. Quite high degree 4. High degree 4. Very important
22 2. Quite low degree 3. Quite high degree 3. Quite high degree 3. Quite high degree 3. Quite important
23 3. Quite high degree 1. Low degree 1. Low degree 1. Low degree 4. Very important
24 3. Quite high degree 3. Quite high degree 3. Quite high degree 4. High degree 4. Very important
25 3. Quite high degree 1. Low degree 3. Quite high degree 3. Quite high degree 3. Quite important
26 3. Quite high degree 3. Quite high degree 4. High degree 3. Quite high degree 3. Quite important
27 3. Quite high degree 4. High degree 4. High degree 4. High degree 3. Quite important
28 3. Quite high degree 2. Quite low degree 3. Quite high degree 3. Quite high degree 3. Quite important
29 3. Quite high degree 1. Low degree 4. High degree 4. High degree 4. Very important
30 No answer No answer No answer 3. Quite high degree 3. Quite important
31 2. Quite low degree 3. Quite high degree 3. Quite high degree 3. Quite high degree 3. Quite important
32 2. Quite low degree 3. Quite high degree 3. Quite high degree 3. Quite high degree 3. Quite important
33 3. Quite high degree 3. Quite high degree 3. Quite high degree 3. Quite high degree Do not know
34 3. Quite high degree 3. Quite high degree 3. Quite high degree 2. Quite low degree 3. Quite important
35 2. Quite low degree 2. Quite low degree 3. Quite high degree 3. Quite high degree 4. Very important
36 No answer 4. High degree 4. High degree 4. High degree 4. Very important
37 3. Quite high degree 3. Quite high degree 3. Quite high degree 3. Quite high degree 3. Quite important
38 2. Quite low degree 3. Quite high degree 3. Quite high degree 2. Quite low degree No answer
39 1. Low degree 1. Low degree 2. Quite low degree 2. Quite low degree 3. Quite important
40 1. Low degree 2. Quite low degree 2. Quite low degree 3. Quite high degree 4. Very important
41 3. Quite high degree 3. Quite high degree 4. High degree 4. High degree 3. Quite important
42 1. Low degree 1. Low degree 3. Quite high degree 3. Quite high degree 2. Less important
43 No answer 3. Quite high degree 3. Quite high degree 3. Quite high degree Do not know
44 1. Low degree 1. Low degree 1. Low degree 1. Low degree 4. Very important
45 4. High degree 4. High degree 3. Quite high degree 3. Quite high degree 3. Quite important
46 2. Quite low degree 4. High degree 4. High degree 4. High degree 2. Less important
47 2. Quite low degree 3. Quite high degree 3. Quite high degree 3. Quite high degree 3. Quite important

Personality Types and Attributes in Software Engineering
44
Respondents 87. What is Your main reason for
chachange management?
88. What do You think is the company’s main
reason for change management?
89. What do You think the
company’s main reason 1 Customer satisfaction No answer No answer 2 Customer satisfaction Customer satisfaction Customer satisfaction 3 Own initiative No answer Do not know 4 Own initiative Financial reason Financial reason 5 No answer Quality of the end product Customer satisfaction 6 No answer Do not know Quality of the end product 7 No answer Own initiative Quality of the end product 8 Do not know Do not know Do not know 9 Own initiative Enterprising people in the company Quality of the end product 10 Customer satisfaction Quality of the end product Financial reason 11 No answer Do not know Financial reason 12 Quality of the end product Financial reason Customer satisfaction 13 Do not know Do not know Customer satisfaction 14 Quality of the end product Quality of the end product Quality of the end product 15 Do not know Customer satisfaction Quality of the end product 16 Customer satisfaction Financial reason Quality of the end product 17 Financial reason Do not know Financial reason 18 Quality of the end product Financial reason Quality of the end product 19 Quality of the end product Financial reason Financial reason 20 Do not know Do not know Quality of the end product 21 Quality of the end product Financial reason Quality of the end product 22 Quality of the end product Customer satisfaction Customer satisfaction 23 Quality of the end product Do not know Other: All alternatives 24 Enterprising people in the company No answer Enterprising people in the
company 25 Quality of the end product Financial reason Financial reason 26 Quality of the end product Financial reason Financial reason 27 Quality of the end product Customer satisfaction Customer satisfaction 28 Customer satisfaction Customer satisfaction Customer satisfaction 29 Customer satisfaction Customer satisfaction Customer satisfaction 30 Do not know Do not know Quality of the end product 31 Own initiative Enterprising people in the company Quality of the end product 32 Customer satisfaction Customer satisfaction Quality of the end product 33 No answer No answer Keep up with industry standards 34 Enterprising people in the company Enterprising people in the company Financial reason 35 Own initiative Own initiative Customer satisfaction 36 No answer Quality of the end product Quality of the end product 37 Customer satisfaction Customer satisfaction Customer satisfaction 38 Do not know Financial reason Quality of the end product 39 Quality of the end product Financial reason Quality of the end product 40 Own initiative Own initiative Quality of the end product 41 Customer satisfaction Customer satisfaction Customer satisfaction 42 Quality of the end product Quality of the end product Quality of the end product 43 Quality of the end product Financial reason Quality of the end product 44 Quality of the end product Financial reason Quality of the end product 45 Quality of the end product Financial reason Quality of the end product 46 Quality of the end product Financial reason Quality of the end product 47 Quality of the end product Customer satisfaction Quality of the end product

Personality Types and Attributes in Software Engineering
45
Respondents 91. Do You perform more efficiently when 92. Do You prefer doing 93. You prefer to work 94. Do You prefer to be responsible for
1 After a given schedule, project plan Several things at once In a team No answer 2 After a given schedule, project plan One thing at a time By Your self Particular part 3 After a given schedule, project plan One thing at a time By Your self Entire development process 4 As the day develops Several things at once In a team Particular part 5 After a given schedule, project plan One thing at a time By Your self Entire development process 6 After a given schedule, project plan One thing at a time In a team Entire development process 7 After a given schedule, project plan Several things at once In a team Entire development process 8 After a given schedule, project plan Several things at once By Your self Particular part 9 After a given schedule, project plan Several things at once In a team Entire development process 10 As the day develops Several things at once By Your self Entire development process 11 After a given schedule, project plan One thing at a time In a team Entire development process 12 As the day develops One thing at a time By Your self Entire development process 13 As the day develops Several things at once In a team Particular part 14 After a given schedule, project plan One thing at a time In a team Particular part 15 After a given schedule, project plan Several things at once In a team Particular part 16 After a given schedule, project plan One thing at a time In a team Particular part 17 After a given schedule, project plan Several things at once In a team Entire development process 18 After a given schedule, project plan One thing at a time By Your self Entire development process 19 After a given schedule, project plan Several things at once In a team Entire development process 20 After a given schedule, project plan One thing at a time In a team Particular part 21 After a given schedule, project plan One thing at a time In a team Particular part 22 After a given schedule, project plan Several things at once In a team Entire development process 23 After a given schedule, project plan One thing at a time In a team Particular part 24 After a given schedule, project plan Several things at once In a team Entire development process 25 After a given schedule, project plan Several things at once In a team Particular part 26 As the day develops Several things at once In a team Entire development process 27 After a given schedule, project plan Several things at once By Your self Particular part 28 After a given schedule, project plan One thing at a time In a team Particular part 29 After a given schedule, project plan Several things at once In a team Entire development process 30 After a given schedule, project plan One thing at a time By Your self Particular part 31 After a given schedule, project plan One thing at a time In a team Particular part 32 After a given schedule, project plan One thing at a time By Your self Particular part 33 After a given schedule, project plan Several things at once By Your self Entire development process 34 After a given schedule, project plan One thing at a time By Your self Particular part 35 After a given schedule, project plan Several things at once In a team Entire development process 36 After a given schedule, project plan One thing at a time By Your self Entire development process 37 After a given schedule, project plan One thing at a time By Your self Entire development process 38 After a given schedule, project plan One thing at a time In a team Particular part 39 As the day develops One thing at a time By Your self Particular part 40 As the day develops One thing at a time In a team Particular part 41 As the day develops One thing at a time By Your self Particular part 42 After a given schedule, project plan One thing at a time By Your self Particular part 43 As the day develops Several things at once By Your self Particular part 44 As the day develops One thing at a time By Your self Particular part 45 After a given schedule, project plan One thing at a time By Your self Particular part 46 As the day develops One thing at a time By Your self Entire development process 47 After a given schedule, project plan Several things at once By Your self Entire development process

Personality Types and Attributes in Software Engineering
46
Respondents 95. Do You prefer to work in 96. Do You prefer to work with
97. If You could chose, would
You prefer to work with
1 No answer No answer No answer 2 Longer projects lasting for several months up to a year From project start to project end Technical parts 3 Longer projects lasting for several months up to a year From project start to project end Technical parts 4 Longer projects lasting for several months up to a year Project start up Technical parts 5 Short projects lasting up to a couple of months From project start to project end Soft parts 6 Longer projects lasting for several months up to a year From project start to project end Technical parts 7 Short projects lasting up to a couple of months Project start up Soft parts 8 Short projects lasting up to a couple of months From project start to project end Soft parts 9 Short projects lasting up to a couple of months Project start up Technical parts 10 Longer projects lasting for several months up to a year From project start to project end Technical parts 11 Longer projects lasting for several months up to a year From project start to project end Technical parts 12 Longer projects lasting for several months up to a year From project start to project end Technical parts 13 Short projects lasting up to a couple of months Project start up Soft parts 14 Longer projects lasting for several months up to a year From project start to project end Soft parts 15 Longer projects lasting for several months up to a year From project start to project end Technical parts 16 Longer projects lasting for several months up to a year From project start to project end Soft parts 17 Longer projects lasting for several months up to a year From project start to project end Technical parts 18 Short projects lasting up to a couple of months From project start to project end Technical parts 19 Short projects lasting up to a couple of months Short contributions as needed Soft parts 20 Short projects lasting up to a couple of months From project start to project end Soft parts 21 Longer projects lasting for several months up to a year From project start to project end Technical parts 22 Longer projects lasting for several months up to a year Project start up Technical parts 23 Short projects lasting up to a couple of months Short contributions as needed Technical parts 24 Short projects lasting up to a couple of months Project start up Soft parts 25 Longer projects lasting for several months up to a year Project start up Soft parts 26 Short projects lasting up to a couple of months From project start to project end Soft parts 27 Longer projects lasting for several months up to a year Short contributions as needed Technical parts 28 Longer projects lasting for several months up to a year From project start to project end Technical parts 29 Longer projects lasting for several months up to a year Short contributions as needed Soft parts 30 Longer projects lasting for several months up to a year From project start to project end Soft parts 31 Longer projects lasting for several months up to a year From project start to project end Soft parts 32 Short projects lasting up to a couple of months Short contributions as needed Technical parts 33 Longer projects lasting for several months up to a year From project start to project end Soft parts 34 Short projects lasting up to a couple of months Short contributions as needed Technical parts 35 Short projects lasting up to a couple of months From project start to project end Soft parts 36 Short projects lasting up to a couple of months Short contributions as needed Soft parts 37 Longer projects lasting for several months up to a year From project start to project end Soft parts 38 Short projects lasting up to a couple of months From project start to project end Soft parts 39 Longer projects lasting for several months up to a year From project start to project end Soft parts 40 Longer projects lasting for several months up to a year From project start to project end Soft parts 41 Short projects lasting up to a couple of months From project start to project end Soft parts 42 Short projects lasting up to a couple of months From project start to project end Technical parts 43 Short projects lasting up to a couple of months From project start to project end Soft parts 44 Short projects lasting up to a couple of months Short contributions as needed Technical parts 45 Short projects lasting up to a couple of months Project start up Technical parts 46 Longer projects lasting for several months up to a year From project start to project end Technical parts 47 Short projects lasting up to a couple of months From project start to project end Soft parts
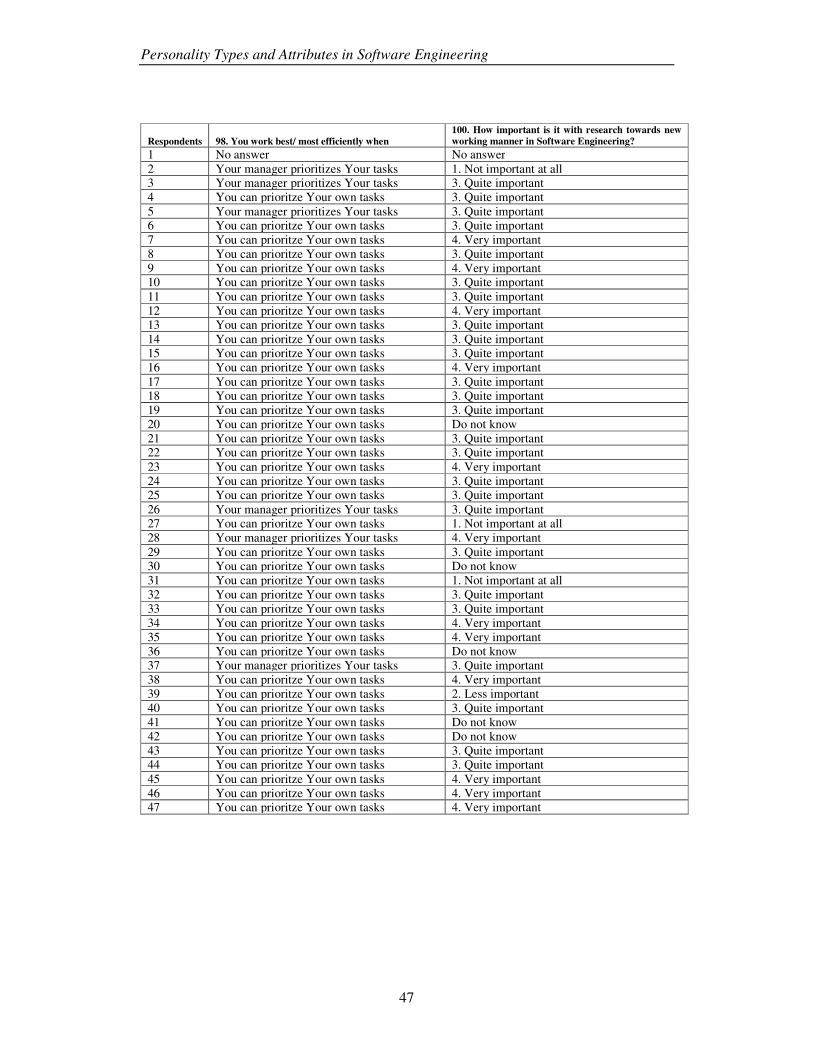
Personality Types and Attributes in Software Engineering
47
Respondents 98. You work best/ most efficiently when
100. How important is it with research towards new
working manner in Software Engineering?
1 No answer No answer 2 Your manager prioritizes Your tasks 1. Not important at all 3 Your manager prioritizes Your tasks 3. Quite important 4 You can prioritze Your own tasks 3. Quite important 5 Your manager prioritizes Your tasks 3. Quite important 6 You can prioritze Your own tasks 3. Quite important 7 You can prioritze Your own tasks 4. Very important 8 You can prioritze Your own tasks 3. Quite important 9 You can prioritze Your own tasks 4. Very important 10 You can prioritze Your own tasks 3. Quite important 11 You can prioritze Your own tasks 3. Quite important 12 You can prioritze Your own tasks 4. Very important 13 You can prioritze Your own tasks 3. Quite important 14 You can prioritze Your own tasks 3. Quite important 15 You can prioritze Your own tasks 3. Quite important 16 You can prioritze Your own tasks 4. Very important 17 You can prioritze Your own tasks 3. Quite important 18 You can prioritze Your own tasks 3. Quite important 19 You can prioritze Your own tasks 3. Quite important 20 You can prioritze Your own tasks Do not know 21 You can prioritze Your own tasks 3. Quite important 22 You can prioritze Your own tasks 3. Quite important 23 You can prioritze Your own tasks 4. Very important 24 You can prioritze Your own tasks 3. Quite important 25 You can prioritze Your own tasks 3. Quite important 26 Your manager prioritizes Your tasks 3. Quite important 27 You can prioritze Your own tasks 1. Not important at all 28 Your manager prioritizes Your tasks 4. Very important 29 You can prioritze Your own tasks 3. Quite important 30 You can prioritze Your own tasks Do not know 31 You can prioritze Your own tasks 1. Not important at all 32 You can prioritze Your own tasks 3. Quite important 33 You can prioritze Your own tasks 3. Quite important 34 You can prioritze Your own tasks 4. Very important 35 You can prioritze Your own tasks 4. Very important 36 You can prioritze Your own tasks Do not know 37 Your manager prioritizes Your tasks 3. Quite important 38 You can prioritze Your own tasks 4. Very important 39 You can prioritze Your own tasks 2. Less important 40 You can prioritze Your own tasks 3. Quite important 41 You can prioritze Your own tasks Do not know 42 You can prioritze Your own tasks Do not know 43 You can prioritze Your own tasks 3. Quite important 44 You can prioritze Your own tasks 3. Quite important 45 You can prioritze Your own tasks 4. Very important 46 You can prioritze Your own tasks 4. Very important 47 You can prioritze Your own tasks 4. Very important

Personality Types and Attributes in Software Engineering
48
Respondents 101. Which of the following alternatives is the closest match to Your company?
1 Relative flat organisation where the closest manager leads the day to day business
2 Closes manager works as a part of the team. Great possibility to influence as an employee 3 No answer 4 Closes manager works as a part of the team. Great possibility to influence as an employee 5 Relative flat organisation where the closest manager leads the day to day business 6 Relative flat organisation where the closest manager leads the day to day business 7 Many levels with active management from Your closest supperior. Almost no cooperation between departments 8 Many levels with active management from Your closest supperior. Almost no cooperation between departments 9 Closes manager works as a part of the team. Great possibility to influence as an employee 10 Closes manager works as a part of the team. Great possibility to influence as an employee
11 Closes manager works as a part of the team. Great possibility to influence as an employee 12 Many levels with active management from Your closest supperior. Almost no cooperation between departments 13 Relative flat organisation where the closest manager leads the day to day business
14 Relative flat organisation where the closest manager leads the day to day business 15 Closes manager works as a part of the team. Great possibility to influence as an employee 16 Relative flat organisation where the closest manager leads the day to day business
17 Many levels with active management from Your closest supperior. Almost no cooperation between departments 18 Relative flat organisation where the closest manager leads the day to day business 19 Closes manager works as a part of the team. Great possibility to influence as an employee 20 Relative flat organisation where the closest manager leads the day to day business 21 Closes manager works as a part of the team. Great possibility to influence as an employee 22 Closes manager works as a part of the team. Great possibility to influence as an employee
23 Many levels with active management from Your closest supperior. Almost no cooperation between departments 24 Relative flat organisation where the closest manager leads the day to day business 25 Closes manager works as a part of the team. Great possibility to influence as an employee
26 Relative flat organisation where the closest manager leads the day to day business 27 Closes manager works as a part of the team. Great possibility to influence as an employee 28 Closes manager works as a part of the team. Great possibility to influence as an employee 29 Closes manager works as a part of the team. Great possibility to influence as an employee 30 Relative flat organisation where the closest manager leads the day to day business 31 Relative flat organisation where the closest manager leads the day to day business 32 Closes manager works as a part of the team. Great possibility to influence as an employee
33 Closes manager works as a part of the team. Great possibility to influence as an employee 34 Many levels with active management from Your closest supperior. Almost no cooperation between departments 35 Many levels with active management from Your closest supperior. Almost no cooperation between departments
36 Closes manager works as a part of the team. Great possibility to influence as an employee 37 Closes manager works as a part of the team. Great possibility to influence as an employee 38 Relative flat organisation where the closest manager leads the day to day business 39 Relative flat organisation where the closest manager leads the day to day business 40 Many levels with active management from Your closest supperior. Almost no cooperation between departments 41 Many levels with active management from Your closest supperior. Almost no cooperation between departments 42 Relative flat organisation where the closest manager leads the day to day business 43 Many levels with active management from Your closest supperior. Almost no cooperation between departments 44 Relative flat organisation where the closest manager leads the day to day business
45 Relative flat organisation where the closest manager leads the day to day business 46 Relative flat organisation where the closest manager leads the day to day business 47 Relative flat organisation where the closest manager leads the day to day business
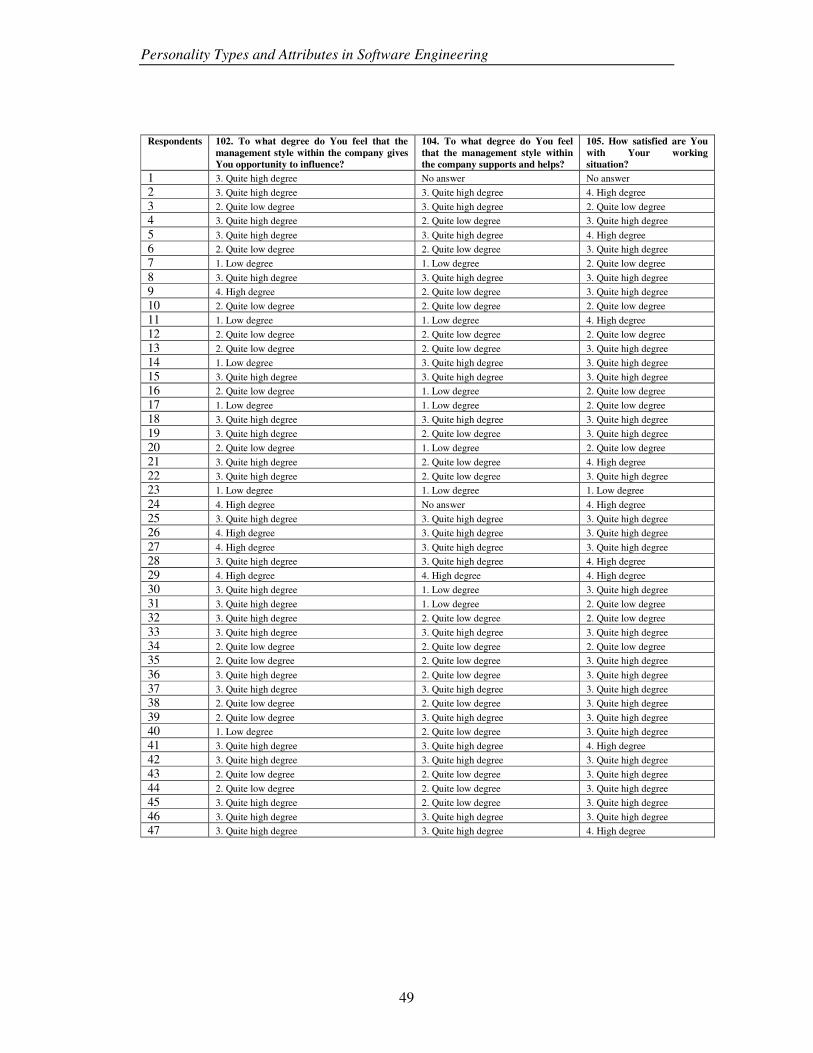
Personality Types and Attributes in Software Engineering
49
Respondents 102. To what degree do You feel that the
management style within the company gives
You opportunity to influence?
104. To what degree do You feel
that the management style within
the company supports and helps?
105. How satisfied are You
with Your working
situation?
1 3. Quite high degree No answer No answer 2 3. Quite high degree 3. Quite high degree 4. High degree 3 2. Quite low degree 3. Quite high degree 2. Quite low degree 4 3. Quite high degree 2. Quite low degree 3. Quite high degree
5 3. Quite high degree 3. Quite high degree 4. High degree 6 2. Quite low degree 2. Quite low degree 3. Quite high degree 7 1. Low degree 1. Low degree 2. Quite low degree
8 3. Quite high degree 3. Quite high degree 3. Quite high degree 9 4. High degree 2. Quite low degree 3. Quite high degree 10 2. Quite low degree 2. Quite low degree 2. Quite low degree 11 1. Low degree 1. Low degree 4. High degree 12 2. Quite low degree 2. Quite low degree 2. Quite low degree 13 2. Quite low degree 2. Quite low degree 3. Quite high degree 14 1. Low degree 3. Quite high degree 3. Quite high degree 15 3. Quite high degree 3. Quite high degree 3. Quite high degree 16 2. Quite low degree 1. Low degree 2. Quite low degree 17 1. Low degree 1. Low degree 2. Quite low degree 18 3. Quite high degree 3. Quite high degree 3. Quite high degree 19 3. Quite high degree 2. Quite low degree 3. Quite high degree 20 2. Quite low degree 1. Low degree 2. Quite low degree 21 3. Quite high degree 2. Quite low degree 4. High degree 22 3. Quite high degree 2. Quite low degree 3. Quite high degree 23 1. Low degree 1. Low degree 1. Low degree
24 4. High degree No answer 4. High degree 25 3. Quite high degree 3. Quite high degree 3. Quite high degree 26 4. High degree 3. Quite high degree 3. Quite high degree
27 4. High degree 3. Quite high degree 3. Quite high degree 28 3. Quite high degree 3. Quite high degree 4. High degree 29 4. High degree 4. High degree 4. High degree 30 3. Quite high degree 1. Low degree 3. Quite high degree 31 3. Quite high degree 1. Low degree 2. Quite low degree 32 3. Quite high degree 2. Quite low degree 2. Quite low degree 33 3. Quite high degree 3. Quite high degree 3. Quite high degree 34 2. Quite low degree 2. Quite low degree 2. Quite low degree 35 2. Quite low degree 2. Quite low degree 3. Quite high degree
36 3. Quite high degree 2. Quite low degree 3. Quite high degree 37 3. Quite high degree 3. Quite high degree 3. Quite high degree 38 2. Quite low degree 2. Quite low degree 3. Quite high degree
39 2. Quite low degree 3. Quite high degree 3. Quite high degree 40 1. Low degree 2. Quite low degree 3. Quite high degree 41 3. Quite high degree 3. Quite high degree 4. High degree 42 3. Quite high degree 3. Quite high degree 3. Quite high degree 43 2. Quite low degree 2. Quite low degree 3. Quite high degree 44 2. Quite low degree 2. Quite low degree 3. Quite high degree 45 3. Quite high degree 2. Quite low degree 3. Quite high degree 46 3. Quite high degree 3. Quite high degree 3. Quite high degree 47 3. Quite high degree 3. Quite high degree 4. High degree

Personality Types and Attributes in Software Engineering
50
Appendix D : Other Results
120Diagram 3. Level of education, question55.
Level of education
0
10
20
30
40
50
A lternatives o f answers
19 23 40 5 3
Compulsory
school
Upper
secondary Universit y
Int ernal
educat ion
Folk high
school
85 per cent of the respondents has an university education. 11 per cent has internal education and 6 per cent has folk high school education.
Diagram 4. Completed education, question 56.
If You have attended university, which of
the following programs have You
completed?
0
5
10
15
20
Alternatives of answers
Re
sp
on
de
nts
5 12 8 16
Computer
Science
Software
Engineering
M aster of
EngineeringOther
Out of the 87 per cent that answered
the question, 26 per cent has given Software Engineering as alternative. 17 per cent of the respondents have answered Master of Engineering and 11 per cent Computer Science.
34 per cent has given Other as alternative. Some examples that have been given for the Other alternative are electronics, EDP and Bachelor of Business Administration.
Table 1. Result from question 57. Company name?
Company Respondents
participating
A 7 B 17 C 3 D 2 E 3 F 1 G 3 H 3 I 1 J 5 No answer 2
The result from the question is presented in table 1. Two of the companies involved in the survey have stated that no information can be presented in a way that makes it possible to see what their respondents have answered. Therefore, the companies have been presented as company A-J in this question. The reason given for this is that it might reflect badly on the company if it shows that they have a lower answer frequency than the other companies participating.
Table 2. Result from question 58. Profession?
Programmer 23 System Architect 4 Project Manager 3 Product Development Manager 3 Other 13
The distribution of professions is presented above. Of the 28 per cent of the respondents that has chosen Other as alternative, some has answered consultant, team lead and client delivery executive.
Diagram 6. Year of employment, question 60.
For how many years have You been employed
at Your current company?
0
20
Alternatives of answer
Resp
on
den
ts
12 14 12 9
<2 2-5 6-10 >10
All respondents in the questionnaire
group have answered this question. 26 per cent have worked less than two years, 30 per cent have worked 2-5 years and 26 per cent have worked 6-10 years. 19 per cent have worked more than ten years at the current company.

Personality Types and Attributes in Software Engineering
51
Table 3. Result from question 61. What do You do in Your line of work?
Requirement Engineering 20 Customer Relation 20 Programming 40 Personnel Management 6 Documentation 19 Design 25 Project Management 11 Testing 17 Verification & Validation 15 Requirement Elicitation 7 Other 6
The different areas that the respondents
work with are presented above. Some of the answers given for the Other alternative are support, education and leadership.
Diagram 7. Product distribution, question 62.
What kind of products do You develop?
0
5
10
15
20
25
30
Alternatives of answers
Resp
on
den
ts
24 9 5 4 2
Client Server WebEmbedded
SystemsOther
Six per cent of the respondents have
not answered the question. 51 per cent work with client applications, 19 per cent with server applications and 11 per cent work with web applications. Nine per cent of the respondents work with embedded systems.
Diagram 9. Tool distribution, question 64.
What tools do You use in Your line of work?
0
20
40
Alternatives of answers
23 23
Visual Studio Other
49 per cent of the respondents stated
Visual Studio. 49 per cent chose the Other alternative and gave other examples such as intelliJ (9 %), Idea Eclipse (9 %) and SQL server (9 %). The rest of the other alternatives were evenly scattered.
Diagram 10. Distribution of the most important tools, question 65.
W hich t oo l do Y ou consider t o be t he most import ant in
Y our l ine o f work?
10
20
30
A lternat ives o f answers
20 18
Visual Studio Other
This question was answered by 80 per
cent of the respondents. 43 per cent of the respondents think
that Visual Studio is the most important tool. 39 per cent answered the Other alternative and stated for example that IntelliJ and idea Eclipse are the most important tools.
Diagram 11. Distribution of how much the tools are helping
the respondents, question 66.
To what degree do You consider that the tool is helping
You?
0
20
40
Alternatives of answers
De
gre
e
21 16 6 0 3
High degree Quite high degree Quite low degree Low degree Do not know
44 per cent of the respondents believe
that the tool they are using is helping them in high degree. 30 per cent state in quite high degree and 13 per cent of the respondents believe that the tool in quite low degree is helping them. The mean for this question is 3,3.
Table 4. Result of question 68. If You lack any specific tool, please specify which one
Answer Respondents
Good versioning system 1
Better database tool 1
Fault management system 1
Better debug system 1
This question is an open question were the respondents were able to state if they lack any specific tool. The answers given are presented above.
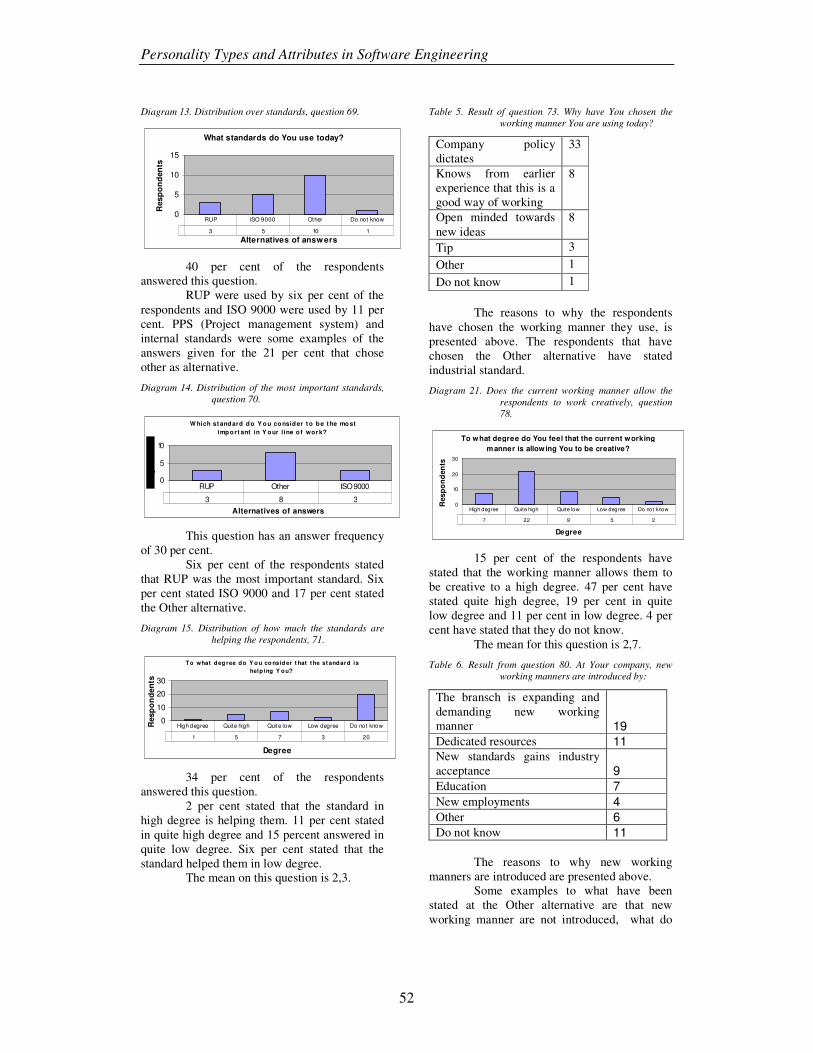
Personality Types and Attributes in Software Engineering
52
Diagram 13. Distribution over standards, question 69.
What standards do You use today?
0
5
10
15
Alternatives of answers
Resp
on
den
ts
3 5 10 1
RUP ISO 9000 Other Do not know
40 per cent of the respondents
answered this question. RUP were used by six per cent of the
respondents and ISO 9000 were used by 11 per cent. PPS (Project management system) and internal standards were some examples of the answers given for the 21 per cent that chose other as alternative.
Diagram 14. Distribution of the most important standards, question 70.
W hich st and ard d o Y o u co nsid er t o b e t he mo st
imp o rt ant in Y o ur line o f work?
0
5
10
Alternatives of answers
3 8 3
RUP Other ISO 9000
This question has an answer frequency
of 30 per cent. Six per cent of the respondents stated
that RUP was the most important standard. Six per cent stated ISO 9000 and 17 per cent stated the Other alternative.
Diagram 15. Distribution of how much the standards are helping the respondents, 71.
To what deg ree do Y o u co nsid er t hat t he st andard is
help ing Y ou?
0
10
20
30
Degree
Resp
on
de
nts
1 5 7 3 20
High degree Quite high Quite low Low degree Do not know
34 per cent of the respondents
answered this question. 2 per cent stated that the standard in
high degree is helping them. 11 per cent stated in quite high degree and 15 percent answered in quite low degree. Six per cent stated that the standard helped them in low degree.
The mean on this question is 2,3.
Table 5. Result of question 73. Why have You chosen the working manner You are using today?
Company policy dictates
33
Knows from earlier experience that this is a good way of working
8
Open minded towards new ideas
8
Tip 3
Other 1
Do not know 1
The reasons to why the respondents have chosen the working manner they use, is presented above. The respondents that have chosen the Other alternative have stated industrial standard.
Diagram 21. Does the current working manner allow the
respondents to work creatively, question 78.
To what degree do You feel that the current working
manner is allowing You to be creative?
0
10
20
30
Degree
Res
po
nd
en
ts
7 22 9 5 2
High degree Quite high Quite low Low degree Do not know
15 per cent of the respondents have
stated that the working manner allows them to be creative to a high degree. 47 per cent have stated quite high degree, 19 per cent in quite low degree and 11 per cent in low degree. 4 per cent have stated that they do not know.
The mean for this question is 2,7.
Table 6. Result from question 80. At Your company, new working manners are introduced by:
The bransch is expanding and demanding new working manner 19
Dedicated resources 11 New standards gains industry acceptance 9
Education 7
New employments 4
Other 6
Do not know 11
The reasons to why new working manners are introduced are presented above.
Some examples to what have been stated at the Other alternative are that new working manner are not introduced, what do

Personality Types and Attributes in Software Engineering
53
you mean with new working manner and it is not done.
Diagram 2. Do the respondents think it is important with
change management for the end product, question 82.
How important is change management, for the products You are developing, according to You?
0
10
20
Alternatives of answers
19 19 2 1 5
Very important Quite important Less important No t important Do no t know
This question has an answer frequency
of 98 per cent. 40 per cent of the respondents believe
that is very important with change management for the end product. 40 per cent state that it is quite important. Four per cent state that it less important and two per cent that it is not important. 11 per cent state that they do not know how important it is.
The mean for this question is 4,4.
Table 7. Result of question 84. What do You think the
company requires, to implement new working manners?
Key resources believe in the concept 39 Openness towards new ideas 25 Customer requirements 20 Industry standards 6 Do not know 3 Other 1
The respondents have in this question stated what they think is needed for implementing new working manners and it is presented above.
Diagram 25. Implementing new working manner versus established working manner, question 85.
To what degree do You feel that the company
implements new working manner versus
established working manner?
0
5
10
15
20
Degree
Resp
on
den
ts
1 12 10 7 17
High degree Quite high Quite low Low degree Do not know
The answer frequency of this question
is 100 per cent. Two per cent have stated that the
company implements new working manner in high degree. 26 per cent have stated in quite high degree. 21 per cent have stated in quite low
degree and 15 per cent in low degree. 36 per cent have stated that they do not know.
The mean for this question is 2,2.
Diagram 26. Respondents involved in change management, question 86.
T o what degree do Yo u co nsider Yo urself be
invo lved in change management?
0
10
20
D egree
4 11 16 14 1
High degree Quite high Quite low Low degree Do no t
98 per cent of the respondents have
answered this question. Nine per cent have stated that they
consider themselves to be involved in change management to a high degree. 23 per cent have stated in quite high degree and 34 per cent in quite low degree. 29 per cent have stated in low degree and two per cent has stated that they do not know.
The mean for this question is 2,1.
Diagram 27. Distribution of how to work efficiently,
question 90.
Do You perform more efficiently when
0
20
40
Alternatives of answ ers
Resp
on
den
ts
38 8
You can chose working order You work by a given working
This question has an answer frequency
of 98 per cent. 81 per cent of the respondents have
stated that they work more efficiently if they can chose working order. 17 per cent have stated if they work by a given order.
Table 13. Result from question 99. How do You keep up to date in the latest research in Software
Engineering?
Internet 27 Personal contacts 18 Message boards 8 Education 8 IT magazines 18 Internal company network 5 Other 3 Do not know 8
The respondents’ ways to keep up to date in the latest research is presented above.
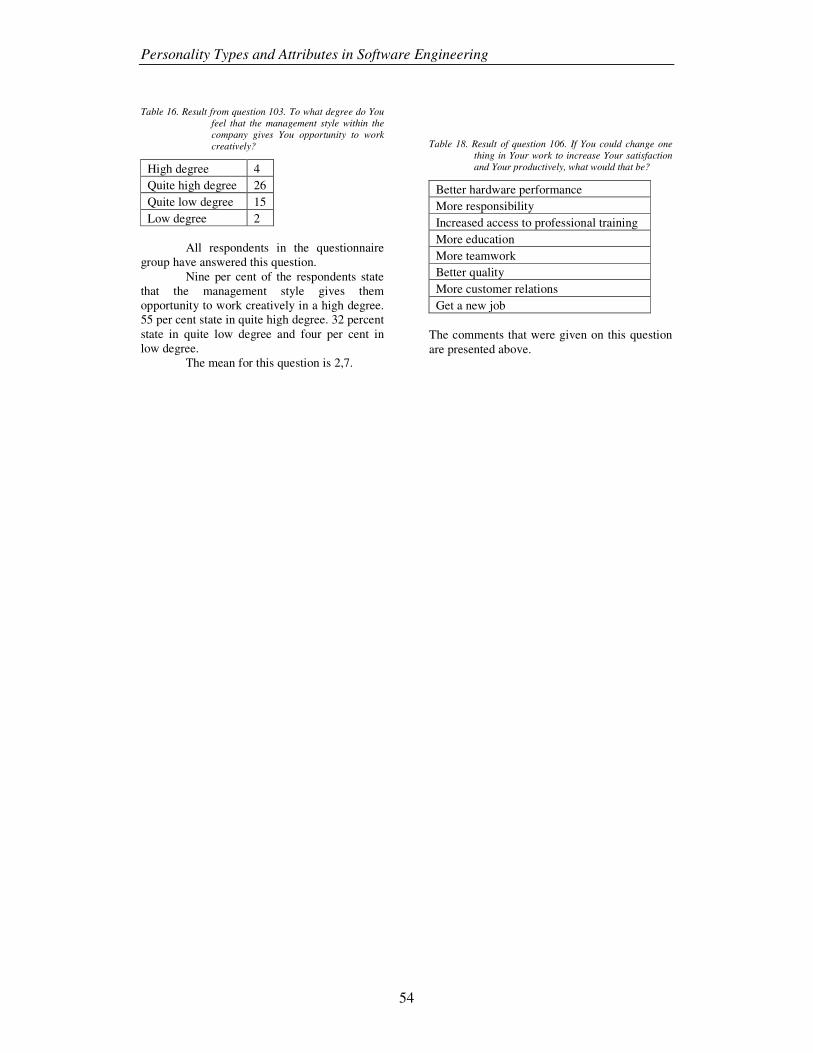
Personality Types and Attributes in Software Engineering
54
Table 16. Result from question 103. To what degree do You feel that the management style within the company gives You opportunity to work creatively?
High degree 4 Quite high degree 26 Quite low degree 15 Low degree 2
All respondents in the questionnaire
group have answered this question. Nine per cent of the respondents state
that the management style gives them opportunity to work creatively in a high degree. 55 per cent state in quite high degree. 32 percent state in quite low degree and four per cent in low degree.
The mean for this question is 2,7.
Table 18. Result of question 106. If You could change one thing in Your work to increase Your satisfaction and Your productively, what would that be?
Better hardware performance More responsibility Increased access to professional training More education More teamwork Better quality More customer relations Get a new job
The comments that were given on this question are presented above.