thesis solid waste management: a comparative …
TRANSCRIPT
THESIS
SOLID WASTE MANAGEMENT: A COMPARATIVE CARBON FOOTPRINT AND COST ANALYSIS
Submitted by
Andy Carroll
Department of Civil and Environmental Engineering
In partial fulfillment of the requirements
For the Degree of Master of Science
Colorado State University
Fort Collins, Colorado
Spring 2018
Maste ’s Co ittee:
Advisor: Sybil Sharvelle Co Advisor: Christopher A. Bareither
Jason Quinn

Copyright by Andrew Carroll 2018
All Rights Reserved
ii
ABSTRACT
SOLID WASTE MANAGEMENT: A COMPARATIVE CARBON FOOTPRINT AND COST ANALYSIS
As the o ld’s u a populatio o ti ues to g o , the eed to effi ie tl a age the esulti g
solid aste ge e atio ill e o e i easi gl i po ta t. Cu e tl , ost of the o ld’s solid aste is
landfilled or disposed of in open dumps. Landfilling organic solid waste leads to the production of
methane, which is a strong greenhouse gas (GHG). In addition, urban areas with high densities and
limited open land may find it hard to accommodate large landfill footprints. Thus, increased awareness
of climate change and landfill diversion has prompted many municipalities and solid waste planners to
find synergistic waste management alternatives to landfilling. However, waste management strategies
vary from region to region, so site-specific data and analysis are often required to determine
appropriate waste management options. A carbon footprint study using life cycle analysis (LCA) was
conducted to compare multiple scenarios of organic waste management strategies for two cities: Fort
Collins, Colorado, USA and Todos Santos, Baja California Sur, Mexico. Fort Collins is a progressive city
within the developed world, and has a strong green ethic, whereas Todos Santos is considered to be in
the developing world, where resources are not as abundant and financial limitations exist. LCA is a
cradle-to-grave analysis tool designed to assess the environmental impacts of a process. A side-by-side
comparison of GHG emissions associated with site-specific organic waste management options was
conducted for each city. Along with the environmental impacts, the economic aspects of waste
management are important in any city, especially Todos Santos. Thus, a cost analysis of compost
facilities and recycling was conducted for Todos Santos.
In Fort Collins, four scenarios were compared to the status quo of landfilling organic waste,
deemed the No-Action Scenario. The four scenario were: Scenario AD 1 - anaerobic digestion of
iii
commercial food waste, and the remainder of organic waste being composted regionally using a transfer
station; Scenario AD 2 - anaerobic digestion of commercial food waste with co-generation, with the
remainder of organic waste being composted regionally without using a transfer station; Scenario
Regional Compost with TS - Regional compost of all organic waste using a transfer station; and Scenario
Regional Compost without TS - Regional compost of all organic waste without using a transfer station.
The functional unit was one metric ton (Mg) of organic waste diverted from the landfill. The only
environmental impact category analyzed was GHG emissions expressed as kg CO2 equivalents; thus, this
study is referred to as carbon footprint, instead of a full ISO standard LCA. Scenario AD 1 was found to
produce the least GHG emissions (130.7 kg CO2 equivalents/functional unit), followed by Scenario AD 2
(168.8 kg CO2 equivalents/functional unit), Scenario Regional Compost with TS (197.1 kg CO2
equivalents/functional unit), Scenario Regional Compost without TS (249.8 kg CO2 equivalents/functional
unit), and finally the No-Action Scenario produced the most GHG emissions (780.4 197.1 kg CO2
equivalents/functional unit).
The primary reason the No-Action Scenario produces the highest GHG emissions is because Fort
Collins sends municipal solid waste (MSW) to two different landfills: one with landfill gas (LFG) collection
and one without. This analysis found that GHG emissions due to landfilling could be greatly reduced
(69%) if all organic waste is sent to the landfill with a LFG collection system. In addition, if Fort Collins
reduces the number of current waste haulers from three to one, there would be a drop in emissions of
7% for the No-Action Scenario, 29% for Scenario AD 1, 44% for Scenario AD 2, 20% for Scenario Regional
Compost with TS, and 36% for Scenario Regional Compost without TS.
Todos Santos does not have an engineered landfill. Solid waste is collected and transported to
an open dump on the outskirts of the city. Two different scenarios were compared to the status quo, or
No-Action Scenario, of landfilling organic waste. The scenarios were: Scenario Local WC - Organic waste
is composted locally at the current landfill using windrow composting); and Scenario Local SAC - Organic
iv
waste is composted locally using static aeration composting. The functional unit and environmental
impact categories were the same as the Fort Collins analysis. Scenario Local WC produced the lowest
GHG emissions (101.5 kg CO2 equivalents/functional unit), followed by Scenario Local SAC (153.9 kg CO2
equivalents/functional unit), and finally the No-Action Scenario produced the most GHG emissions
(1,487.9 kg CO2 equivalents/functional unit). The lack of LFG capture at the current landfill explains the
high GHG emissions. The primary difference between static aerated and windrow compost regarding
GHG emissions is static aerated compost produces higher nitrous oxide and methane emissions than
windrow compost. While windrow and static aerated compost produce lower GHG emissions than
landfilling, the financial conditions for compost in Todos Santos are unknown. A capital cost analysis
found that a windrow compost facility would cost about 1.5 times more than a static aerated compost
facility; however, the demand and revenue from selling compost would still need to be analyzed prior to
implementation of a compost facility.
Recycling in Todos Santos is not as established as recycling in Fort Collins. Currently, there is a
small drop-off recycling facility in Todos Santos called Punto Verde. Utilizing best available data, it is
estimated that Punto Verde only collects about 1% of the total available recyclables. If 100% of the
recyclables are collected the value is estimated to be about $87,000 per year. However, increasing
recycling rates in Todos Santos is difficult due to long transportation routes, lack of government support,
and cultural attitudes that have not embraced recycling as the norm. This analysis has shown that there
is a potential revenue stream for recyclables in Todos Santos; however, education campaigns, financial
incentives, and key stakeholder support are needed to improve recycling rates.
This study found that landfilling without LFG capture produced the most GHG emissions in both
a developed, environmentally progressive city, and a city in a developing country with economic and
cultural restraints surrounding sustainable waste management. Furthermore, this study highlighted the
need for site-specific analysis when assessing waste management improvements for a city or

v
municipality. Transfer stations and efficient waste collection will vary by location, but are important to
quantify as transportation plays a key role in waste management. In addition, selecting feasible
alternatives to the status quo will require conversations with stakeholders and assessment of site-
specific data, ideally before any assessment is conducted.

vi
ACKNOWLEDGEMENTS
I would like to thank my parents, Shelly and Cory Carroll, for motivating me to return to school
to pursue this degree. Also, thanks to my girlfriend, Melissa James, for travelling to Todos Santos with
our group, and for the support she gave during my time at Colorado State University.
I would also like to thank my co-advisor Dr. Chris Bareither for the opportunity to work and
travel to Todos Santos to study waste management first hand. It has been a pleasure to work with you,
and I am very grateful that I was able to work on such a unique project. Furthermore, I would like to
thank my advisor Dr. Sybil Sharvelle for her support and guidance throughout my entire career at CSU.
Thank you for the opportunity to work on a vast array of projects, and for the courses that have
furthered my understanding in environmental engineering. Also, thanks to Dr. Jason Quinn for serving
on my graduate committee.

vii
TABLE OF CONTENTS
ABSTRACT ...................................................................................................................................................................... ii
ACKNOWLEDGEMENTS ................................................................................................................................................. vi
Chapter 1: Introduction ................................................................................................................................................. 1
1.1 Fort Collins, Colorado .......................................................................................................................................... 2
1.2 Todos Santos, Baja California Sur, Mexico ........................................................................................................... 3
1.3 Objectives ............................................................................................................................................................ 4
Chapter 2: BACKGROUND .............................................................................................................................................. 5
2.1 Site Information ................................................................................................................................................... 5
Fort Collins, Colorado, USA .................................................................................................................................... 5
Todos Santos, Baja California Sur, Mexico ............................................................................................................. 7
2.2 Literature Review ............................................................................................................................................... 11
2.2.1 Life Cycle Analysis ....................................................................................................................................... 11
2.2.2 Carbon Footprint/LCA as a Tool for Waste Management Decision Making ............................................... 13
2.2.3 Carbon Footprint/LCA for Organic Waste in Developing Countries ........................................................... 14
Chapter 3: Material Flow Analysis and Approaches for Carbon Footprint Reduction in Fort Collins, CO ................... 16
3.1 Introduction ....................................................................................................................................................... 16
3.2 Material Flow Analysis of Food Waste .............................................................................................................. 17
3.3 Summary of Previous Study on Anaerobic Digestion of Food Waste ................................................................ 21
3.4 Carbon Footprint of Organic Waste Diversion Options in Fort Collins, CO ....................................................... 22
3.4.1 Objectives ................................................................................................................................................... 22
3.4.2 Scenario Description and Justification ........................................................................................................ 22
3.4.3 Functional Unit ........................................................................................................................................... 25
3.4.4 Impacts considered ..................................................................................................................................... 26
3.4.5 System Diagrams ........................................................................................................................................ 26

viii
3.4.6 Methods and Background........................................................................................................................... 29
3.4.5 Results......................................................................................................................................................... 42
3.4.6 Scenario Analysis ........................................................................................................................................ 44
3.4.7 Conclusions ................................................................................................................................................. 46
Chapter 4: Carbon Footprint and Cost Analysis of Organic Waste Management Option in Todos Santos, Baja
California Sur, Mexico .................................................................................................................................................. 48
4.1 Introduction ....................................................................................................................................................... 48
4.2 Objectives .......................................................................................................................................................... 49
4.3 Scenario Description and Justification ............................................................................................................... 49
4.4 Functional Unit .................................................................................................................................................. 50
4.5 Impacts Considered ........................................................................................................................................... 50
4.6 System Diagrams ............................................................................................................................................... 51
4.7 Methodology ..................................................................................................................................................... 52
4.7.1 Compost ...................................................................................................................................................... 53
4.7.2 Windrow Composting ................................................................................................................................. 54
4.7.3 Static Aerated Composting ......................................................................................................................... 54
4.7.4 Landfill ........................................................................................................................................................ 58
4.7.5 Transportation ............................................................................................................................................ 59
4.8 Results ............................................................................................................................................................... 60
4.9 Capital Cost Analysis .......................................................................................................................................... 61
4.10 Scenario Analysis ............................................................................................................................................. 63
4.11 Conclusions ...................................................................................................................................................... 64
Chapter 5: Recycling Cost Analysis for Todos Santos .................................................................................................. 67
5.1 Introduction ....................................................................................................................................................... 67
5.2 Methodology ..................................................................................................................................................... 69
5.3 Results ............................................................................................................................................................... 71
5.4 Conclusion ......................................................................................................................................................... 72
ix
Chapter 6: Summary and Conclusions ......................................................................................................................... 74
Next Steps for Fort Collins ....................................................................................................................................... 78
Next Steps for Todos Santos .................................................................................................................................... 78
References ................................................................................................................................................................... 80
Appendix A: Food Waste Material Flow Analysis Report ............................................................................................ 88
Appendix B: Food Waste Diversion: A Comparative Carbon Footprint Study using Life Cycle Analysis .................... 118
Appendix C: Compost Background Data .................................................................................................................... 126
Appendix D: Compost GHG Emissions ....................................................................................................................... 128
x
LIST OF TABLES
Table 1: Waste Classification in Baja California Sur ....................................................................................................... 9
Table 2: Scenarios for Organic Waste Disposal ........................................................................................................... 24
Table 3: Inputs and Outputs for Compost Model ........................................................................................................ 33
Table 4: Fertilizer Credit Assumptions ......................................................................................................................... 34
Table 5: Larimer County and North Weld Landfill Parameters .................................................................................... 38
Table 6: Inputs and Outputs for Larimer County Landfill ............................................................................................ 38
Table 7: Description of Transportation Distances for Each Scenario........................................................................... 40
Table 8: Organic Waste End of Life Breakdown* ......................................................................................................... 44
Table 9: Description of Organic Waste Management Options .................................................................................... 50
Table 10: Chemical and Moisture Composition of Food Waste and Wood Shavings* ................................................ 54
Table 11: Inputs and Outputs for Static Aerated Compost Model .............................................................................. 57
Table 12: Inputs and outputs for Todos Santos Landfill .............................................................................................. 59
Table 13: Description of Transportation Distances for Each Scenario ........................................................................ 60
Table 14: Equipment Cost Breakdown of Windrow and Static Aerated Compost ...................................................... 62
Table 15: Recycling Data for Punto Verde ................................................................................................................... 69
Table 16: Potential Revenue of Recyclables in Todos Santos ...................................................................................... 70
Table 17: Revenue Comparison for Baling of Recyclables1 .......................................................................................... 72
Table 18. Educational Sector Subcategories ................................................................................................................ 94
Table 19. EPA Parameters used to Estimate Food Waste for Educational Institutions ............................................... 95
Table 20. Food Retailers at the Lory Student Center ................................................................................................... 97
Table 21. Food Wholesalers and Distributors Sector Subcategories ........................................................................... 98
Table 22. Food Manufactures and Processors Sector Subcategories .......................................................................... 99
Table 23. Hospitality Sector Subcategory .................................................................................................................. 100
Table 24. Food Retailers Sector Subcategories ......................................................................................................... 101

xi
Table 25. Residential Food Waste ............................................................................................................................. 102
Table 26. Other Sector Subcategories ....................................................................................................................... 103
Table 27. Residential and Commercial Contributions to Landfill .............................................................................. 106
Table 28. Food Waste Disposed to Landfill................................................................................................................ 107
Table 29. Food Loss in Fort Collins, Colorado ............................................................................................................ 107
Table 30. Total Food Loss from Various Sectors ........................................................................................................ 108
Table 31 Sources Used for Diesel Use ....................................................................................................................... 126
Table 32 Sources Used for Emissions of Nitrogen Fertilizer ...................................................................................... 126
Table 33 Sources Used for Feedstock Decrease ........................................................................................................ 127
Table 34 Sources Used for Emissions of Phosphorus Fertilizer ................................................................................. 127
Table 35: Literature Review of GHG Emissions Associated with Composting ........................................................... 128
Table 36: Statistical Values for GHG Emissions Associated with Composting ........................................................... 130

xii
LIST OF FIGURES
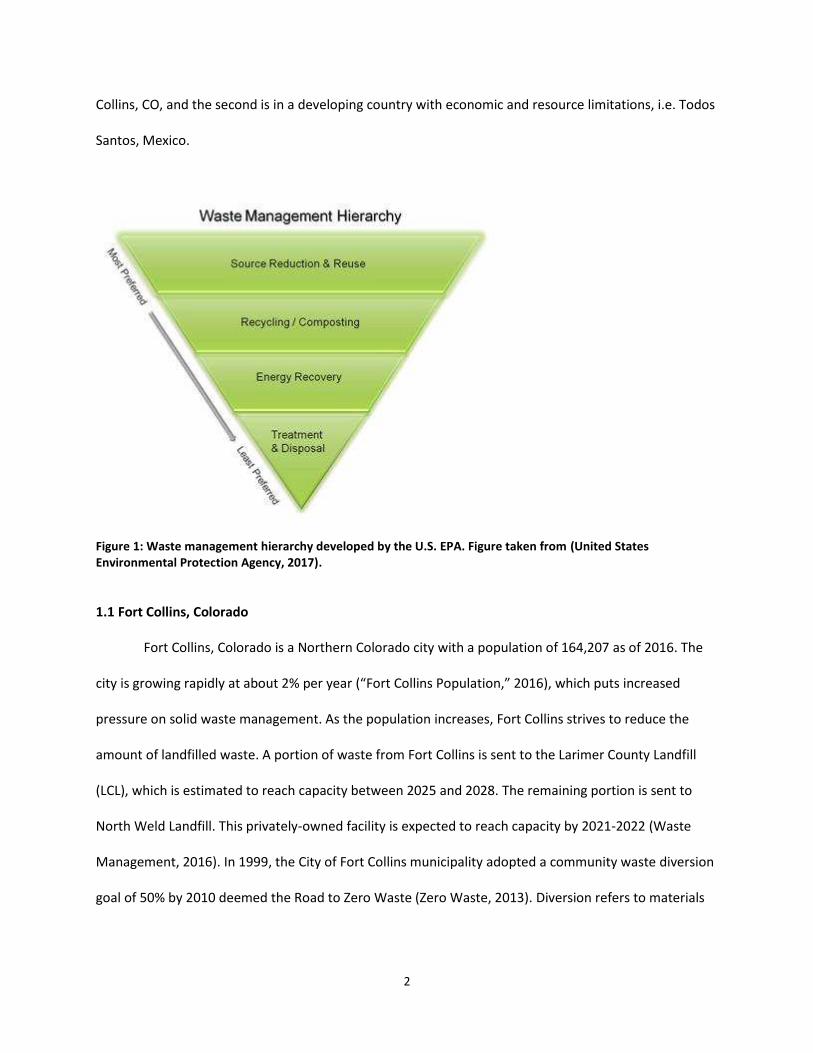
Figure 1: Waste management hierarchy developed by the U.S. EPA. Figure taken from (United States
Environmental Protection Agency, 2017). ..................................................................................................................... 2
Figure 2: Garbage that is ready to be picked up by the municipality in Todos Santos. ................................................. 8
Figure 3: MFA of food waste generation by various sectors in Fort Collins. ............................................................... 19
Figure 4: Food waste generated in Fort Collins by Sector. .......................................................................................... 20
Figure 5: Food waste generated by just the commercial sector. ................................................................................ 20
Figure 6: Schematic of organic diversion scenarios for Fort Collins. ........................................................................... 25
Figure 7: System diagram for anaerobic digestion. ..................................................................................................... 27
Figure 8: System diagram for compost. ....................................................................................................................... 28
Figure 9: System diagram for both the North Weld and Larimer County Landfills. .................................................... 29
Figure 10: GHG emissions associated with each phase of the compost process. ....................................................... 35
Figure 11: Aggregated GHG emission sources for landfilling organic waste. .............................................................. 39
Figure 12: Emissions for different transportation scenarios. ...................................................................................... 42
Figure 13: Overall GHG emissions for each scenario. .................................................................................................. 43
Figure 14: Scenario analysis showing a scenario, called Larimer County Landfill*, in which all organic waste is sent
to the Larimer County Landfill, instead of being split between the North Weld and Larimer County Landfills.......... 45
Figure 15: Net emissions assuming the number of waste haulers in Fort Collins is reduced from three to one. ....... 46
Figure 16: Waste Stream for Mexico. Values taken from (Dirección de Planeación Urbana y Ecología, 2011). The
values are applied to Todos Santos' waste composition. ............................................................................................ 49
Figure 17: System diagram for static aerated compost and windrow compost. ......................................................... 51
Figure 18: System diagram for landfilling organic waste in Todos Santos. ................................................................. 52
Figure 19: Emissions for each process of static aeration composting. ........................................................................ 58
Figure 20: GHG emissions associated with each scenario. See Table 13 for detailed description of each scenario. .. 61
xiii
Figure 21: Comparison of GHG emissions of a theoretical new landfill with LFG capture to the No Action, Static
Aerated Compost, and Windrow Compost Scenarios. ................................................................................................ 64
Figure 22: GHG emissions associated with different levels of composting organic waste using a static aerated
system. ......................................................................................................................................................................... 65
Figure 23: Location of Punto Verde in reference to the CSU Center and the restaurant, Jazzamango....................... 68
Figure 24: Theoretical revenue from different recycling collection rates. The current collection is based on values
from Punto Verde. ....................................................................................................................................................... 71
Figure 25. Total MSW Generation (By Material), 2013. .............................................................................................. 89
Figure 26. Generic Example of a Material Flow Analysis. ............................................................................................ 90
Figure 27. EPA Food Recovery Hierarch. ..................................................................................................................... 90
Figure 28: Overall process of the residential scenario. Food waste is initially generated in households, and is sent to
the wastewater treatment plant via the sewer system. ........................................................................................... 121
Figure 29: Overall process of the commercial scenario. Food waste is initially generated in households, and is sent
to the wastewater treatment plant via the sewer system. ....................................................................................... 122

1
Chapter 1: Introduction
Over the next 20 to 30 years the world will experience large increases in urban populations,
especially in developing countries (United Nations, 2014). With this increase comes the need to
effectively manage the resulting solid waste in a way that is beneficial for both human and
environmental health. Solid waste management is also a contributor to climate change. Municipal solid
waste accounts for nearly 5% of total global greenhouse gas emissions, and 12% of global methane (CH4)
emissions are generated from landfills (World Bank, 2012). Thus, implementing integrated solid waste
management (ISWM) programs in developed and developing countries will become increasingly
important to maintain human health and environment sustainability.
ISWM is defined as a comprehensive waste prevention, recycling, composting, and disposal
program (EPA, 2002). A schematic of ISWM strategies from the U.S. Environmental Protection Agency
(EPA) is shown in Figure 1. Waste management strategies rank from source reduction being the most
preferred, followed by recycling, energy recovery, treatment, and finally disposal. Furthermore, a major
goal of ISWM in low-, middle-, and high-income countries is a paradigm shift toward viewing waste as a
resource as opposed to a burden. This can be achieved through various recycling programs, waste-to-
energy technologies, and treatments such as composting. Generally, these waste management
techniques are more commonly applied in high-income countries than low- to middle-income countries,
due to available funding, professional expertise, and project feasibility. In many low- to middle-income
countries, open dumping/burning is the usual method for waste management; however, there is a
growing push away from this due to the negative consequences on public and environmental well-being.
Rega dless of a ou t ’s developmental status, designing or analyzing waste management strategies
requires consideration of social, environmental, and financial factors. This study presents two site-
specific analyses on waste management. The first is in a community in the developed world. i.e. Fort
2
Collins, CO, and the second is in a developing country with economic and resource limitations, i.e. Todos
Santos, Mexico.
Figure 1: Waste management hierarchy developed by the U.S. EPA. Figure taken from (United States
Environmental Protection Agency, 2017).
1.1 Fort Collins, Colorado
Fort Collins, Colorado is a Northern Colorado city with a population of 164,207 as of 2016. The
city is growing rapidly at about 2% per year Fo t Colli s Populatio , , which puts increased
pressure on solid waste management. As the population increases, Fort Collins strives to reduce the
amount of landfilled waste. A portion of waste from Fort Collins is sent to the Larimer County Landfill
(LCL), which is estimated to reach capacity between 2025 and 2028. The remaining portion is sent to
North Weld Landfill. This privately-owned facility is expected to reach capacity by 2021-2022 (Waste
Management, 2016). In 1999, the City of Fort Collins municipality adopted a community waste diversion
goal of 50% by 2010 deemed the Road to Zero Waste (Zero Waste, 2013). Diversion refers to materials

3
generated within Fort Collins that are recycled or composted. In 2014, Fort Collins achieved a 68.4%
diversion rate, and has since set new goals of 75% by 2020, 90% by 2025, and zero waste by 2030.
In addition to reducing waste sent to the landfill, Fort Collins has also adopted ambitious goals
regarding greenhouse gas (GHG) emissions. Among these are reducing GHG emissions 20% below the
2005 levels by 2020, 80% below the 2005 levels by 2030, and carbon neutral by 2050 (City of Fort
Collins, 2015). Waste management can play an integral role in reducing GHG emissions by eliminating
organic materials from the landfill. Organic waste can decompose anaerobically in a landfill and produce
a mixture of gas that is approximately 50% carbon dioxide (CO2) and 50% CH4. The CO2 is considered
biogenic, i.e., produced by natural decomposition process. However, the CH4 produced occurred due to
anthropogenic activities and is considered non-biogenic. In addition, CH4 is a GHG that is 25 times more
efficient at trapping atmospheric heat than CO2. Thus, diverting organic waste from the landfill not only
helps achieve goals set forth in the Road to Zero Waste, but can also help reduce GHG emissions.
1.2 Todos Santos, Baja California Sur, Mexico
Todos Santos is a small town on the west coast of Baja California Sur with a population of 5,148
as of 2010. Similar to Fort Collins, Todos Santos is experiencing increased growth rates with the
population increasing by 25% from 2005 to 2010 (Pickering et al., 2015). Although the downtown is kept
fairly litter free, there is not an effective waste management strategy for final disposal. Garbage can be
found scattered throughout the natural landscape, even encroaching onto natural preserves. In a
community-needs assessment conducted in 2015, waste management was highlighted as a community
priority, and more spe ifi all , pu li health, e i o e tal health, isual o ta i atio , a d la k of
cultural awareness surrounding waste and proper disposal were community concerns (Pickering et al.,
2015).

4
Although the need for better waste management has been highlighted by the community, there
are several hurdles. An obvious constraint is the financial requirements of waste management
programs. Collection costs alone can take up to 80-90% of the total solid waste management budget,
leaving limited financial resources for proper-end-of-life disposal (United Nations, 2011). However,
increasing efficiencies throughout a waste management system as well as creative financing methods
such as public-private partnerships can reduce costs. The support of the citizens and government is
critical when implementing any civil infrastructure project. In addition, cultural attitudes about waste
management take time to change. Transitioning from the status quo of waste management in Todos
Santos will require educational campaigns, financial incentives, and key stakeholder support. In Todos
Santos, there is evidence of this culture change beginning to take place in the form of a small recycling
facility, supportive local government personnel, and educational opportunities for children.
1.3 Objectives
The objective of this study was to use a common methodology to compare and highlight
beneficial solid waste management options for two very different municipalities. In both Fort Collins and
Todos Santos, a carbon footprint, using life cycle analysis (LCA) methodology, was used to compare GHG
emissions for various organic waste management scenarios. In addition, a financial analysis was
conducted for recycling and composting in Todos Santos. This analysis is designed to span the triple
bottom line, i.e., social, environmental, and economic conditions and factors.

5
Chapter 2: BACKGROUND
2.1 Site Information
Fort Collins, Colorado, USA
Fort Collins, Colorado has an established and effective waste management program. Unlike
most cities, the waste collection system in Fort Collins is conducted via three commercial waste haulers,
instead of the more common approach whereby the municipality handles all waste collection.
Consumers are allowed to choose which hauler to employ, and payment is based on the amount of
olu e eside ts ge e ate. This s ste is efe ed to as pa -as-you-th o PAYT , he e eside ts
pay different rates based on the size of their trash cans. This type of policy is designed to decrease
household waste generation, based on the incentive that the less waste a resident generates the less
they will have to pay for collection. Fort Collins has several different end stages for MSW disposal
including landfill, compost facilities, and recycling.
Landfill
Fort Collins sends MSW to two different landfills; approximately 56% is sent to the Larimer
County Landfill and 44% is sent to North Weld Landfill Management Facility (City of Fort Collins Staff,
personal communication, 2016). The Larimer County Landfill employs a landfill gas capture system
where the collected gas is flared. According the Larimer County website, tipping fees for 2017 are $6.05
per cubic yard for household trash, commercial waste, and green waste. Compacted waste has a tipping
fee of $6.97/cubic yard. The Larimer County Landfill is expected to reach capacity around 2025
(Carcasson, 2016).

6
The North Weld Landfill is owned and operated by Waste Management. The landfill has a
voluntary landfill gas collection system, in which collected gas is passed through an activated carbon
filtration system to control odor (Waste Management, 2016). Since activated carbon filtration does not
remove methane, the North Weld Landfill is modeled as having no landfill gas collection system for the
purposes of quantifying GHG emissions. The landfill is expected to close by between 2021-2022 (Waste
Management, 2016)
Compost
Composting is a well understood and utilized technique for organic waste management. For the
purposes of this analysis, a privately owned and operated windrow composting facility within Larimer
County was analyzed. Windrow compost requires heavy duty machinery and is a technique usually
employed in large-scale composting facilities. The compost piles are physically turned to introduce
oxygen and promote effective composting. The facility modeled in this analysis is located in Eaton,
Colorado and accepts organic waste from residential and commercial sources.
Recycling
Fort Collins has single-stream recycling that is built into the cost of waste collection. In other
words, residents and businesses who pay for garbage collection automatically receive a collection bin for
single-stream recycling. Single-stream recycling is the process of collecting paper, cardboard, plastic
containers, metal containers, and glass all in one bin. Fort Collins also has a facility called the Timberline
Recycling Center that allows residents and businesses to drop off common recyclables such as
cardboard, paper, mixed bottles and cans, and glass for no extra fee. Hard to recycle materials such as
paint, motor oil, antifreeze, etc. require a $5 fee. The recycling program in Fort Collins was not analyzed
7
in this study as the focus in Fort Collins was on organic waste management. However, the recycling
program in Fort Collins is useful to provide background for potential recycling for Todos Santos.
Todos Santos, Baja California Sur, Mexico
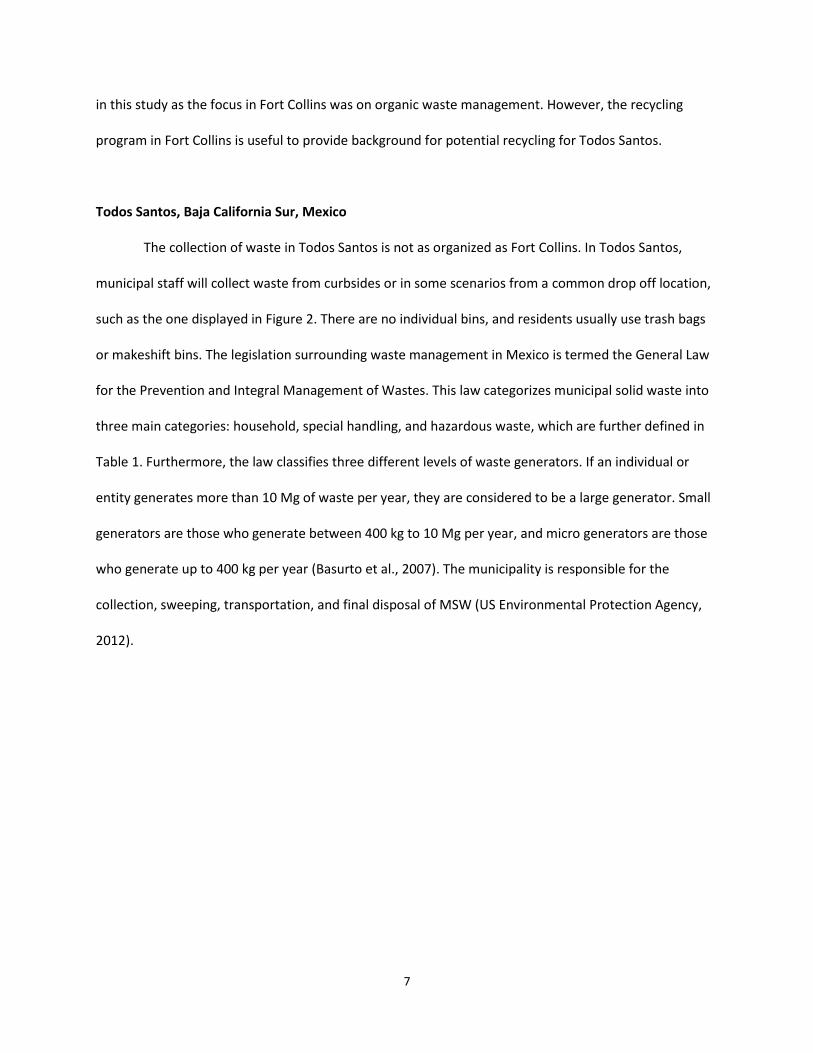
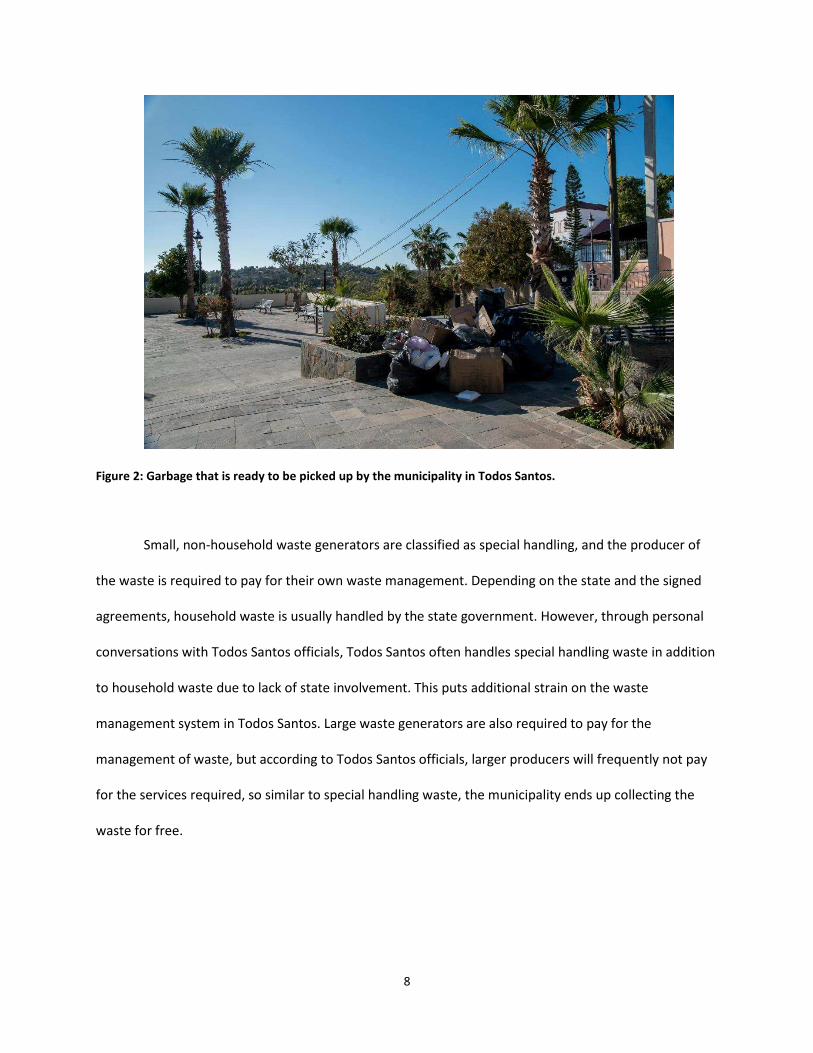
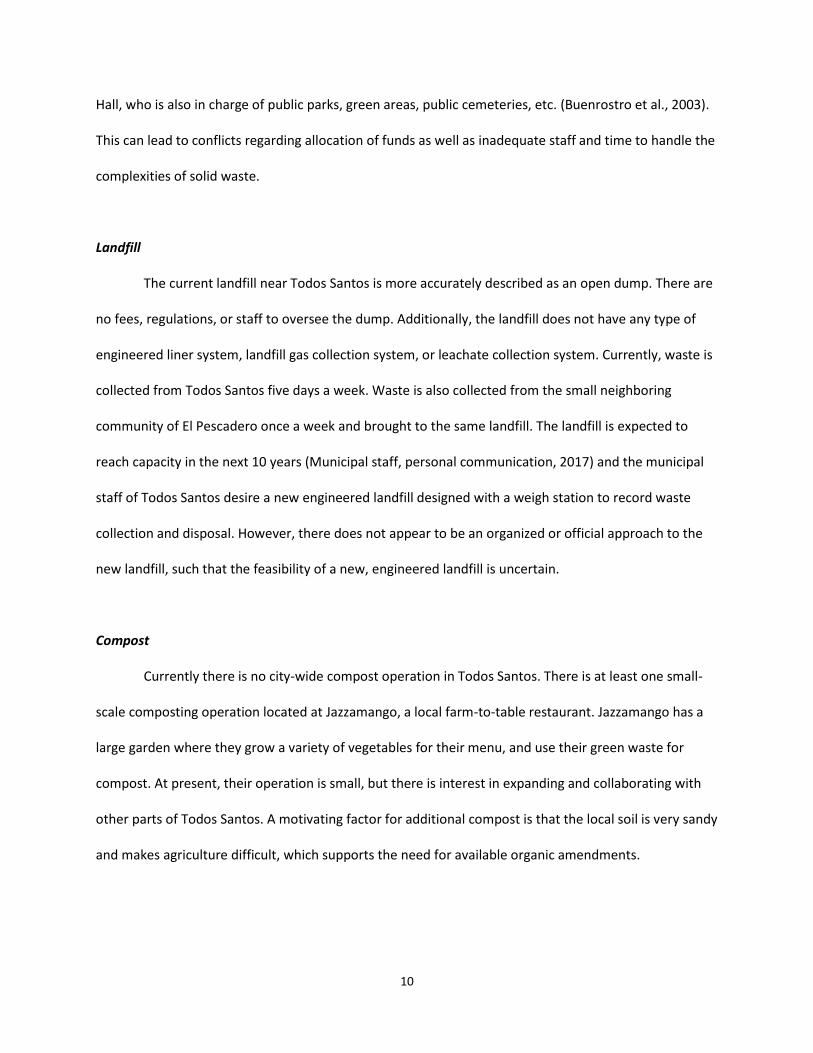
The collection of waste in Todos Santos is not as organized as Fort Collins. In Todos Santos,
municipal staff will collect waste from curbsides or in some scenarios from a common drop off location,
such as the one displayed in Figure 2. There are no individual bins, and residents usually use trash bags
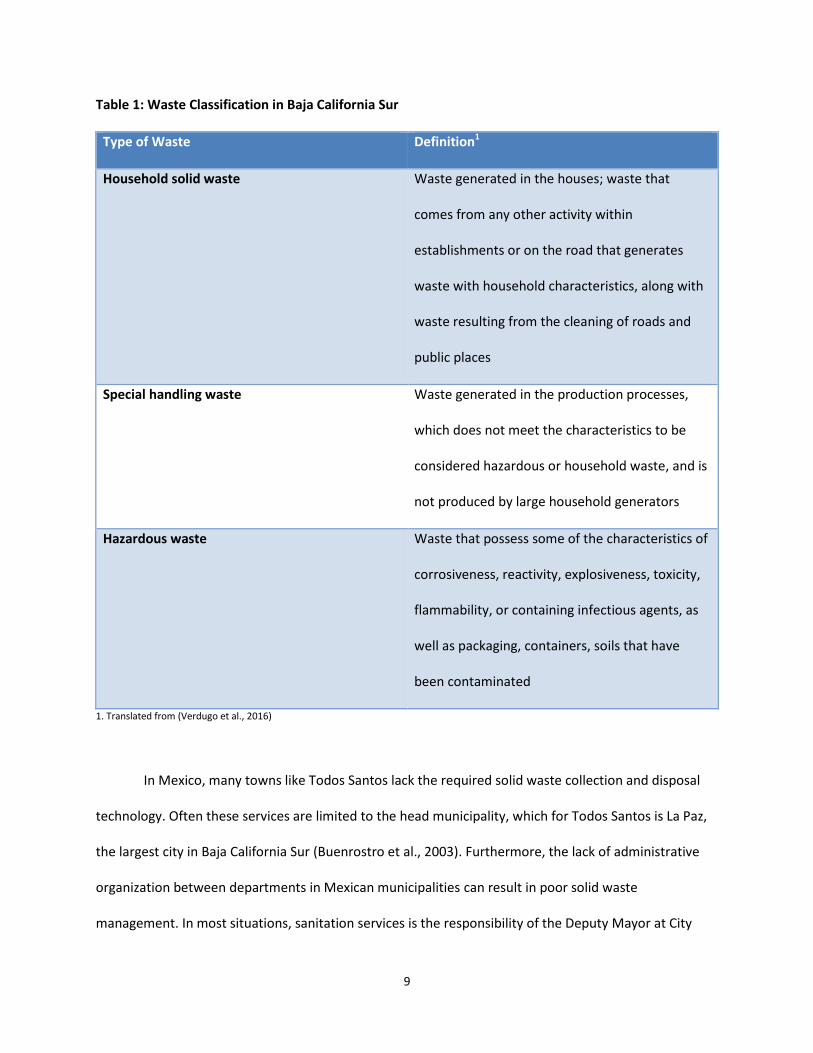
or makeshift bins. The legislation surrounding waste management in Mexico is termed the General Law
for the Prevention and Integral Management of Wastes. This law categorizes municipal solid waste into
three main categories: household, special handling, and hazardous waste, which are further defined in
Table 1. Furthermore, the law classifies three different levels of waste generators. If an individual or
entity generates more than 10 Mg of waste per year, they are considered to be a large generator. Small
generators are those who generate between 400 kg to 10 Mg per year, and micro generators are those
who generate up to 400 kg per year (Basurto et al., 2007). The municipality is responsible for the
collection, sweeping, transportation, and final disposal of MSW (US Environmental Protection Agency,
2012).
8
Figure 2: Garbage that is ready to be picked up by the municipality in Todos Santos.
Small, non-household waste generators are classified as special handling, and the producer of
the waste is required to pay for their own waste management. Depending on the state and the signed
agreements, household waste is usually handled by the state government. However, through personal
conversations with Todos Santos officials, Todos Santos often handles special handling waste in addition
to household waste due to lack of state involvement. This puts additional strain on the waste
management system in Todos Santos. Large waste generators are also required to pay for the
management of waste, but according to Todos Santos officials, larger producers will frequently not pay
for the services required, so similar to special handling waste, the municipality ends up collecting the
waste for free.
9
Table 1: Waste Classification in Baja California Sur
Type of Waste
Definition1
Household solid waste Waste generated in the houses; waste that
comes from any other activity within
establishments or on the road that generates
waste with household characteristics, along with
waste resulting from the cleaning of roads and
public places
Special handling waste Waste generated in the production processes,
which does not meet the characteristics to be
considered hazardous or household waste, and is
not produced by large household generators
Hazardous waste Waste that possess some of the characteristics of
corrosiveness, reactivity, explosiveness, toxicity,
flammability, or containing infectious agents, as
well as packaging, containers, soils that have
been contaminated
1. Translated from (Verdugo et al., 2016)
In Mexico, many towns like Todos Santos lack the required solid waste collection and disposal
technology. Often these services are limited to the head municipality, which for Todos Santos is La Paz,
the largest city in Baja California Sur (Buenrostro et al., 2003). Furthermore, the lack of administrative
organization between departments in Mexican municipalities can result in poor solid waste
management. In most situations, sanitation services is the responsibility of the Deputy Mayor at City
10
Hall, who is also in charge of public parks, green areas, public cemeteries, etc. (Buenrostro et al., 2003).
This can lead to conflicts regarding allocation of funds as well as inadequate staff and time to handle the
complexities of solid waste.
Landfill
The current landfill near Todos Santos is more accurately described as an open dump. There are
no fees, regulations, or staff to oversee the dump. Additionally, the landfill does not have any type of
engineered liner system, landfill gas collection system, or leachate collection system. Currently, waste is
collected from Todos Santos five days a week. Waste is also collected from the small neighboring
community of El Pescadero once a week and brought to the same landfill. The landfill is expected to
reach capacity in the next 10 years (Municipal staff, personal communication, 2017) and the municipal
staff of Todos Santos desire a new engineered landfill designed with a weigh station to record waste
collection and disposal. However, there does not appear to be an organized or official approach to the
new landfill, such that the feasibility of a new, engineered landfill is uncertain.
Compost
Currently there is no city-wide compost operation in Todos Santos. There is at least one small-
scale composting operation located at Jazzamango, a local farm-to-table restaurant. Jazzamango has a
large garden where they grow a variety of vegetables for their menu, and use their green waste for
compost. At present, their operation is small, but there is interest in expanding and collaborating with
other parts of Todos Santos. A motivating factor for additional compost is that the local soil is very sandy
and makes agriculture difficult, which supports the need for available organic amendments.
11
Recycling
The only facility that accepts recycling in Todos Santos is a small, grass roots facility called Punto
Verde. Punto Verde serves primarily as a free drop-off facility, although staff members will also pick up
recyclables. Workers at the facility hand-sort all materials, and then transport the recyclables to either
La Paz or Cabo San Lucas, depending on the material. According to Alex Miro, the founder of Punto
Verde, the majority of recyclables come from foreigners living in the Todos Santos area, as opposed to
native Mexican residents.
2.2 Literature Review
2.2.1 Life Cycle Analysis
Life Cycle Analysis (LCA) is a cradle-to-grave system analysis tool designed to assess the
environmental impacts of a product or process. Numerous environmental impacts can be analyzed
assuming the necessary data and software are available. Common environmental impacts include global
warming, freshwater eutrophication, terrestrial eco-toxicity and acidification, and human toxicity.
Although LCA is a elati el e t pe of a al sis, ha i g ee de eloped p i a il i the ’s, the
International Organization for Standardization (ISO) has set standards and guidelines for proper LCA
practices.
There are two general types of LCA, consequential and attributional. Consequential LCA is
designed to provide information on the impacts of a system and consequences that could occur outside
of the system or product. Attributional LCA offers information regarding the impacts of the product or
system, but does not consider the indirect consequences brought about by the change in the product or
system. Consequential LCAs are much more complicated as they rely on economic models, policy
changes, and other highly-dependent variables that generate results that should be interpreted with
12
caution (Brander et al., 2008). Distinguishing between the two types of LCA is important before
beginning any LCA. All methods used in this paper are based on attributional LCA.
The overall process for conducting an LCA follows four main steps: 1) goal and scope definition,
2) inventory analysis, 3) impact assessment, and 4) interpretation of results (Curran, 2016). The goal and
scope must be clearly formulated and expressed before attempting to undertake any type of analysis.
According to ISO, the goal of an LCA needs to state the intended application, reasons for the study, and
intended audience. The scope is similarly critical and defines the system boundary, the system being
analyzed, impact categories, assumptions, limitations, and data necessities. The scope section also
o tai s the fu tio al u it, hi h is defi ed as the fu tio the s stem delivers at the product or unit
le el (Curran, 2016). Assigning functional units to different products or processes is important to
develop comparisons. For example, if liquid dishwasher detergent is being compared to powdered
dishwasher detergent, the functional unit might be the amount of detergent needed to clean a certain
number of dishes.
Inventory analysis is the act of compiling all data requirements for energy and material inputs
and is often the most time consuming aspect of LCA (Rebitzer et al., 2004). Various software products
with large databases are available to assist in this inventory phase, but users must understand the
assumptions made when using these databases. The impact assessment will often vary depending on
the LCA. Different impact categories include global warming, freshwater eco-toxicity, mineral resources,
ionizing radiation, acidification, eutrophication, among others. Uncertainty associated with various
impact assessments should be considered when choosing impact categories (Curran, 2016). Due to the
fact that the only impact category chosen for this thesis is GHG emissions, this study is classified as a
carbon footprint utilizing LCA methodology instead of a full LCA.
Interpretation of the results of an LCA should consist of at least three phases: identify significant
issues from the inventory and impact assessment steps, check and evaluate the completeness and
13
sensitivity results, and state the conclusions, limitations, and recommendations (Curran, 2016). The
main objective of the interpretation phase is to determine the degree of confidence in the final results,
and to express those results as fairly and accurately as possible. LCA rarely yields a black and white
answer, and the complexity contained in the outcome of an LCA needs to be communicated. Often, a
sensitivity analysis can be conducted in order to test the effect of system boundaries, parameter values,
and impact categories on the overall result of the LCA (Guo et al., 2012). Sensitivity analysis can reduce
uncertainty and lead to higher transparency.
2.2.2 Carbon Footprint/LCA as a Tool for Waste Management Decision Making
Life cycle analysis can provide solid waste decision makers with an excellent framework to
compare different waste management scenarios (Banar et al., 2009). In addition, as the importance of
sustainable waste management increases throughout the world, LCA is being utilized more and more as
a tool to improve and analyze current waste management techniques (Laurent et al., 2014). The holistic
nature of LCA is ideal for comparing environmental and economic impacts of waste management
strategies. However, LCA is often time and data intensive, which is enhanced even more when analyzing
complex systems such as solid waste where practices are site-specific. In fact, due to differences in
environments and city cultures, local research is often required (Chen et al., 2008).
A literature review of 222 LCA studies by Laurent et al. (2014) led to several important
conclusions regarding waste management. Of particular interest was their major finding that the studies
were mainly focused in Europe, with only a few in developing countries (Laurent et al., 2014). In
addition, Laurent et al. (2014) reported that many of the studies overlooked waste types outside of
household waste and found that a generalization of LCA results of waste management techniques is
difficult due to local conditions. However, this lack of generalization is exactly what allows for LCA to be
a more useful tool than widespread waste management hierarchies su h as the R’s , i.e. edu e,

14
reuse, recycle, and recover. Site-specific characteristics can be built into LCA models, which will lead to
more useful conclusions and recommendations for policy makers.
An example of the site-specific nature of LCA can be seen in studies that compare landfilling
waste to other waste management options. The majority of LCA papers agree that landfilling solid waste
is the least environmentally favorable option when compared to recycling and incineration (Moberg et
al., 2005). However, different waste types and local conditions such as transportation, technology,
temporal scale, and impact assessments can change or even make landfilling more preferable (Moberg
et al., 2005). Another variable that can influence the results of an LCA are the system boundaries. This
will ensure that all credits and burdens within the system are assigned correctly (Clift et al., 2000).
Transparency in the goal and scope section is critical when examining the results of any LCA.
2.2.3 Carbon Footprint/LCA for Organic Waste in Developing Countries
As mentioned previously, there are limited published studies regarding LCAs conducted in
developing countries. This is logical, as LCA can be data intensive and data on waste management in
developing countries is often limited. Nevertheless, developing countries can strongly benefit from LCA
or carbon footprint analysis on waste management. Depending on the country, waste management
technologies that are low-tech and can be scaled to community variants to offer a good initial option for
waste management. Cities in developing countries generally spend 30-50% of their operating budgets on
waste management, yet only collect between 50 to 80% of the waste generated (Medina, 2000). Often
the only option for collected waste is uncontrolled, unmanned, open dumps.
A case study comparing composting, anaerobic digestion, and open landfilling in Ghana found
that both composting and anaerobic digestion reduced GHG emissions by 41% and 58%, respectively,
compared to open landfilling (Galgani et al., 2014). The study also analyzed the economic sustainability
of compost, biogas from anaerobic digestion, and biochar (carbon dense substance used as a soil
15
amendment). Without subsidies or income from carbon markets, Galgani et al. (2014) found that none
of the three technologies would have a positive return on investment. However, carbon markets could
make the organic waste technologies economically sustainable with carbon prices within 30-84 Euros
per Mg. Even with the volatile nature of carbon markets, analyzing the carbon footprint is critical in
determining the overall success of potential organic waste management options.
A separate case study of waste disposal options for traditional markets in Indonesia utilized LCA
to compare the technologies. The study found that composting in labor intensive plants, centralized
composting using a wheel loader, centralized biogas production from anaerobic digestion, and electricity
production from landfill gas all had lower environmental impacts compared to open landfilling (Aye et
al., 2006). Biogas production from anaerobic digestion was reported to have the lowest environmental
impacts followed by the two composting options, and finally landfilling with electricity production. The
study also included an economic analysis that found composting in centralized plants to have the
highest benefit-to-cost ratio. Composting in centralized plants was deemed by the authors to have the
highest potential for success, due to the strong economic incentives and moderate to low
environmental impacts. This study illuminates the point that economic incentives are extremely
advantageous to include in conjunction with LCA, especially in developing countries.
16
Chapter 3: Material Flow Analysis and Approaches for Carbon Footprint Reduction in Fort
Collins, CO
3.1 Introduction
Fort Collins, Colorado has adopted ambitious goals regarding GHG emissions. Due to these
objectives, there is strong interest in diverting waste and managing the waste in a sustainable way.
There are several opportunities that exist for organic waste that aid in resource recovery and landfill
di e sio . Also, due to the No th Weld La dfill’s la k of LFG aptu e, a ae o i digestio (AD) and
composting are ways to reduce GHG emissions, and increase organic waste diversion. Compost is a
natural process whereby organic matter is broken down by various fungi, worms, and bacteria. Compost
is primarily used for soil amendment, but can also be used as a natural pesticide, erosion control, and
bioremediation. Anaerobic digestion is a technology used around the world in which microorganisms
break down organic material in an anaerobic environment and produce biogas. Biogas is primarily
composed of approximately 60-65% methane, which can used in a cogeneration process to produce
electricity and capture heat (Sosnowski et al., 2003).
To highlight best organic waste management strategies to achieve carbon footprint benefits, a
study on food waste was first undertaken. A material flow analysis (MFA) was conducted in order to
understand the mass of food waste generated in Fort Collins. The results of this MFA spurred the
undertaking of a separate study conducted by City of Fort Collins staff that analyzed food waste
diversion to the anaerobic digesters at the Drake Wastewater Reclamation Facility (DWRF). This study is
summarized in Section 3.3. Utilizing the MFA along with the results of the City study on anaerobic
digestion of food waste, a carbon footprint analysis of organic waste management as a whole was
conducted (Section 3.4).

17
3.2 Material Flow Analysis of Food Waste
Food waste is a strong candidate for diversion, i.e., being utilized in compost or anaerobic
digestion instead of landfilled. A useful first step toward developing any type of waste management plan
is to first understand the flows and amounts of the waste materials. To identify opportunities for food
waste diversion and reduction, a Material Flow Analysis (MFA) was conducted. MFA is an analytical way
to quantify flows and stocks of materials through a defined geographical area and over a set period of
time. In this case, the geographical area was Fort Collins and the time frame was one year. MFA helps to
reduce the complexity of the system, while still providing a basis for sound decision-making. In addition,
MFA assists in establishing priorities regarding environmental protection, resource conservation, and
waste management. When used in conjunction with tools such as LCA, the results can yield a waste
stream mass balance along with the associated environmental impacts for waste management
techniques.
In Fort Collins food waste is a ubiquitous waste stream that makes up a relatively large
percentage of both residential (34%) and commercial (43%) organic waste (SloanVasquezMcAfee, 2016).
When food waste is sent to the landfill, it is subject to scavenging from animals, aerobic decomposition,
and anaerobic decomposition. Anaerobic decomposition results in the production of methane, a GHG 25
times more potent than CO2 (IPCC, 2007). Furthermore, the embodied energy within food can be
beneficially used for compost or anaerobic digestion.
The food waste MFA was calculated using a 2014 City of Fort Collins business database that
included business name, North American Industry Classification System (NAICS) code, and number of
employees (see Appendix A for full report). The various businesses in Fort Collins were sorted into 8
categories that include Education, Food Wholesaler and Distributors, Food Manufacturers and
Processors, Hospitality/Healthcare, Food Retailers, Residential, Food Bank for Larimer County, and
Other. The total mass balance of food waste generation by category shows that a total of 32,616 short

18
tons or 29,589 Mg of food waste is generated per year in Fort Collins (Figure 3). Residential food waste
makes up slightly more than half of the total food waste produced in Fort Collins (Figure 4). When
commercial food waste is broken down into the various sectors, over half of the commercial food waste
comes from food retailers (Figure 5).

19
Figure 3: MFA of food waste generation by various sectors in Fort Collins.

20
Figure 4: Food waste generated in Fort Collins by Sector.
Figure 5: Food waste generated by just the commercial sector.
Residential 55%
Food Retailers
26%
Food Wholesalers
and Distributors
8%
Food Manufacturer
s and Processers
3%
Other 3%
Education 2%
Hospitality/ Healthcare
2% Food Bank
1%
Food Retailers 57%
Food Wholesalers
and Distributors
18%
Food Manufacturer
s and Processers
8%
Other 7%
Education 5%
Hospitality/ Healthcare
2% Food Bank
1%

21
3.3 Summary of Previous Study on Anaerobic Digestion of Food Waste
Diverting food waste to anaerobic digesters is an area of interest for Fort Collins. A study
conducted by city staff examined environmental impacts of food waste disposal at DWRF (See Appendix
B for report summary). Delivery of food waste to DWRF consisted of two scenarios. The first, referred to
as the residential scenario, involved sending residential food to DWRF via the sewer system. Woody
materials such as yard waste are not well suited for the current anaerobic digesters at DWRF. The food
waste would then go through the same treatment plant processes as regular wastewater, whereby the
anaerobic digesters would produce biogas that would be combusted in a co-generation system, i.e.
electricity generation from internal combustion engines and heat capture to be used for digester
heating. The second scenario, referred to as the commercial scenario, assumed a truck transported
commercial food waste to DWRF. The food waste would then be sorted to remove contaminants and
then added directly to the anaerobic digesters with the biogas would again be used for co-generation.
Of particular interest to Fort Collins, given limited digester capacity, was to assess which method of food
waste delivery resulted in lower GHG emissions.
The results of this study found that the net GHG emissions of the commercial scenario was -89.8
kg CO2 eq/Mg of food waste, whereas the residential scenario yielded 129.7 kg CO2 eq/Mg of food
waste. The commercial scenario produced less GHG emissions for two primary reasons. The first is the
production of a residential food waste processor, i.e. garbage disposal, creates surprisingly large GHG
emissions from the manufacturing, packaging, and distribution of the unit. Also, residential food waste
processors have relatively short lifespans (10 years). The commercial scenario also grinds and processes
food waste, but it is likely that industrial food processors are more efficient than individual, smaller
processors. This efficiency lowers the GHG emission to processed output ratio over the food processors
lifespan. Secondly, adding food waste directly to the anaerobic digesters in the commercial scenario
produces significantly more biogas than the residential scenario, as no losses occur in the sewer or
22
during superfluous wastewater processing. Increased biogas per mass of food waste input results in
more electricity and heat production, leading to a much larger energy credit for the commercial
scenario. GHG emissions associated with truck transportation did not offset the benefits of the larger
energy credit.
The commercial scenario resulted in net negative GHG emissions. The emission factor of -89.8
kg CO2 eq/Mg of food waste was thus utilized for all anaerobic digestion scenarios in the subsequent
analyses.
3.4 Carbon Footprint of Organic Waste Diversion Options in Fort Collins, CO
3.4.1 Objectives
The objective of this carbon footprint is to conduct a carbon footprint analysis of organic waste
management in Fort Collins using results from Sections 3.1 and 3.2.
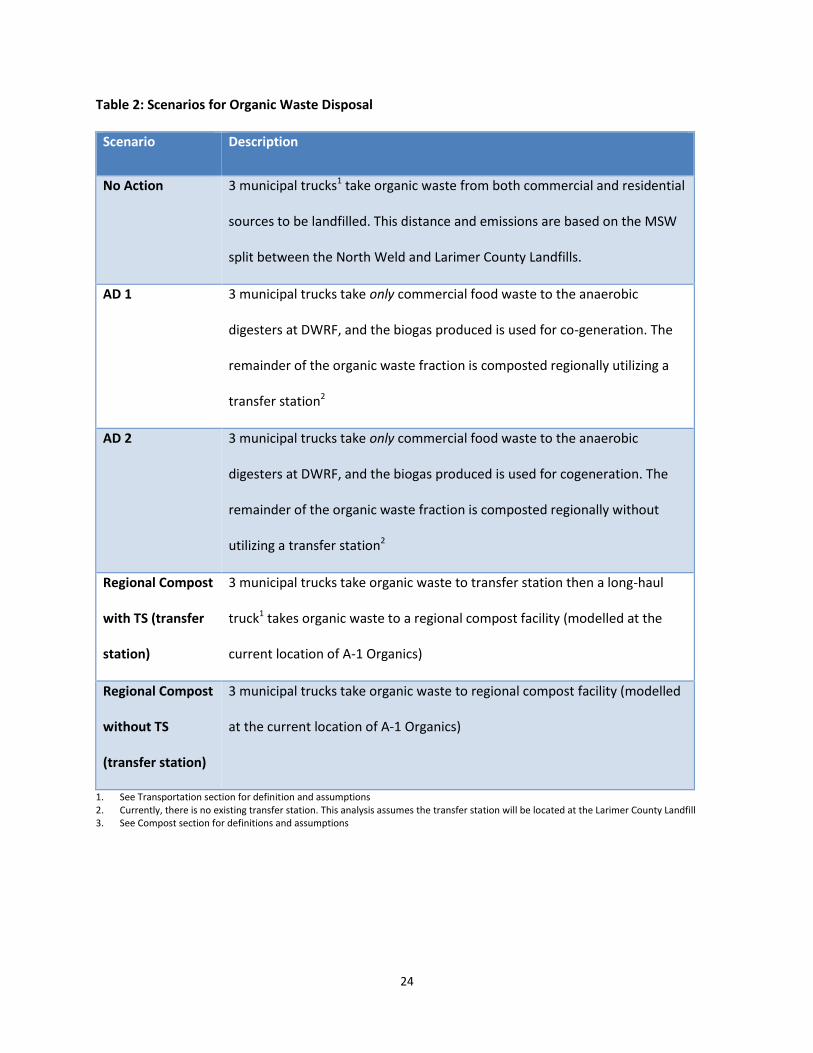
3.4.2 Scenario Description and Justification
GHG emissions for both compost and anaerobic digestion were compared to the status quo of
landfilling organic waste. Several different scenarios were analyzed to create a more holistic view of the
Cit ’s options which are depicted in Table 2 and shown graphically in Figure 6. The four scenario are:
Scenario AD 1 (Anaerobic digestion of commercial food waste with co-generation, and the remainder of
organic waste being composted regionally using a transfer station), Scenario AD 2 (Anaerobic digestion
of commercial food waste with co-generation, with the remainder of organic waste being composted
regionally without using a transfer station), Scenario Regional Compost with TS (Regional compost of all
organic waste using a transfer station), and Scenario Regional Compost without TS (Regional compost of
all organic waste without using a transfer station).
23
Transportation plays a key role in GHG emissions for each scenario. Transfer stations should
always be considered when transportation of waste goes beyond city boundaries. This analysis includes
scenarios that use a transfer station and scenarios that do not. In addition, the fact that Fort Collins has
three different waste haulers was taken into account. The geographic scope is within the confines of
Larimer and Weld Counties.
Anaerobic digestion of commercial food waste was shown to have a net negative GHG emission
value in Section 3.3, and was thus deemed a suitable method of organic waste management. Residential
food waste collection is not analyzed in the study, but represents another potential option should
collection of commercial food waste prove favorable. Commercial food waste represents only a small
fraction of total organic waste in Fort Collins. The remainder of the organic waste consists of residential
food waste, residential yard waste, residential wet/contaminated paper, commercial yard waste, and
commercial wet/contaminated paper. These fractions of organic waste were assumed to be composted
regionally with a transfer station (Scenario AD 1) and without (Scenario AD 2).
Regional compost was chosen over local compost because there is currently no existing large
scale, local compost facility. Difficulties in land permitting and funding logistics add complications to
building a local compost facility, and thus the current regional facility is assumed to represent the most
likely option for composting in Fort Collins. The regional facility is modelled based on an existing facility
about 35 kilometers outside of Fort Collins. Similar to the anaerobic digestion scenarios, the compost
analysis shows scenarios with a transfer station (Scenario Regional Compost with TS) and without a
transfer station (Scenario Regional Compost without TS).
24
Table 2: Scenarios for Organic Waste Disposal
Scenario Description
No Action 3 municipal trucks1 take organic waste from both commercial and residential
sources to be landfilled. This distance and emissions are based on the MSW
split between the North Weld and Larimer County Landfills.
AD 1 3 municipal trucks take only commercial food waste to the anaerobic
digesters at DWRF, and the biogas produced is used for co-generation. The
remainder of the organic waste fraction is composted regionally utilizing a
transfer station2
AD 2 3 municipal trucks take only commercial food waste to the anaerobic
digesters at DWRF, and the biogas produced is used for cogeneration. The
remainder of the organic waste fraction is composted regionally without
utilizing a transfer station2
Regional Compost
with TS (transfer
station)
3 municipal trucks take organic waste to transfer station then a long-haul
truck1 takes organic waste to a regional compost facility (modelled at the
current location of A-1 Organics)
Regional Compost
without TS
(transfer station)
3 municipal trucks take organic waste to regional compost facility (modelled
at the current location of A-1 Organics)
1. See Transportation section for definition and assumptions 2. Currently, there is no existing transfer station. This analysis assumes the transfer station will be located at the Larimer County Landfill 3. See Compost section for definitions and assumptions
25
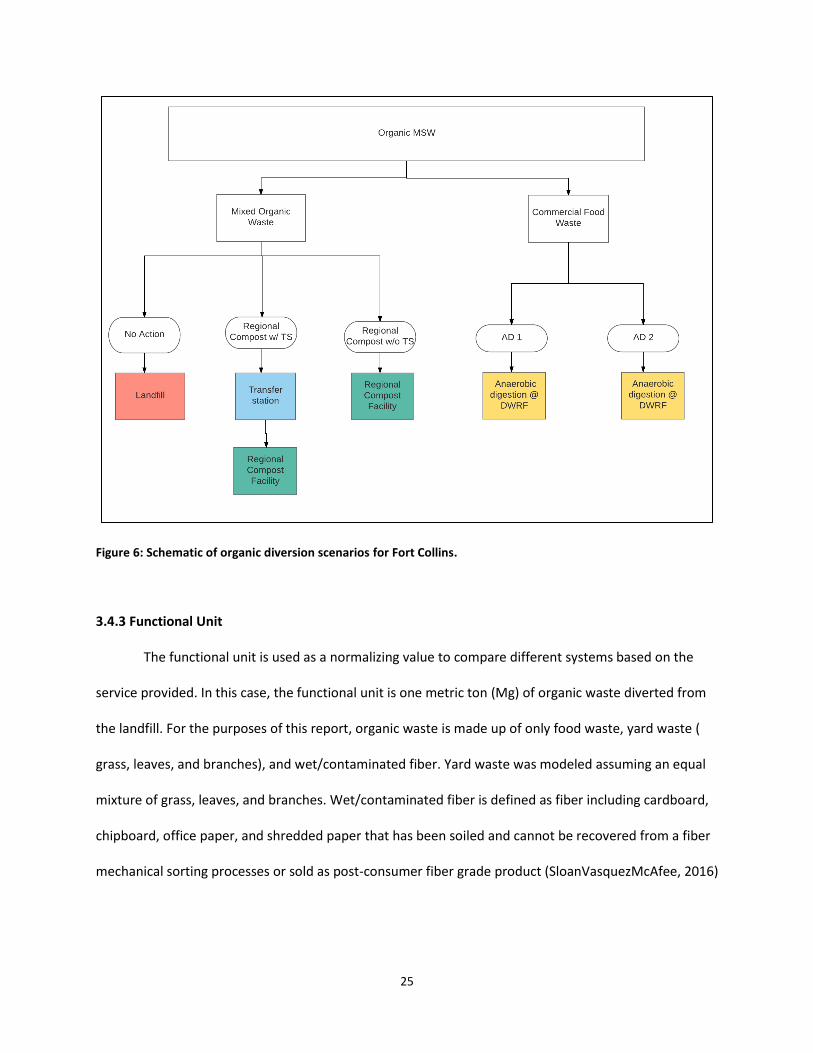
Figure 6: Schematic of organic diversion scenarios for Fort Collins.
3.4.3 Functional Unit
The functional unit is used as a normalizing value to compare different systems based on the
service provided. In this case, the functional unit is one metric ton (Mg) of organic waste diverted from
the landfill. For the purposes of this report, organic waste is made up of only food waste, yard waste (
grass, leaves, and branches), and wet/contaminated fiber. Yard waste was modeled assuming an equal
mixture of grass, leaves, and branches. Wet/contaminated fiber is defined as fiber including cardboard,
chipboard, office paper, and shredded paper that has been soiled and cannot be recovered from a fiber
mechanical sorting processes or sold as post-consumer fiber grade product (SloanVasquezMcAfee, 2016)

26
3.4.4 Impacts considered
This study was not a full ISO 1440 standard LCA in that the main impact category considered was
GHG emissions reported in kg CO2 equivalent (eq). Thus, the study is considered a carbon footprint study
that incorporates an LCA methodology. Biogenic CO2 sources were excluded from this analysis. Biogenic
CO2 emissions are defined as emissions related to the natural carbon cycle such as decomposition,
fermentation, or metabolic digestion. In addition, any effects of carbon sequestration on GHG emissions
have been neglected. This is done because there still lacks an overall consensus on the most suitable
means to do so in LCA methods (Brandão et al., 2013). Assuming a 100-yr global warming potential
timeframe, CH4 has a CO2 factor of 25 and N2O has a CO2 factor of 298 (IPCC, 2007). New values of CO2
equivalents for both CH4 and N2O have been released by the IPCC as of 2014; however the values from
the 2007 report are utilized for consistency purposes. Methane has been updated to a CO2 factor of 28
and N2O a CO2 factor of 265 (IPCC, 2014). These values would increase all landfill emissions, while
compost and anaerobic digestion emissions would only change slightly due to an increase in N2O
emissions and a decrease in CH4 emissions.
3.4.5 System Diagrams
The system diagrams for the organic waste disposal options graphically display how the carbon
footprint analysis was conducted. In the anaerobic digestion analysis, food waste is hauled to DWRF and
is sorted and processed to remove contaminants before being added to the anaerobic digesters. The
outputs of the anaerobic digestion process are biogas to be used in cogeneration, biosolids that are
land-applied, and centrate that is re-treated at the DWRF (Figure 7).
27
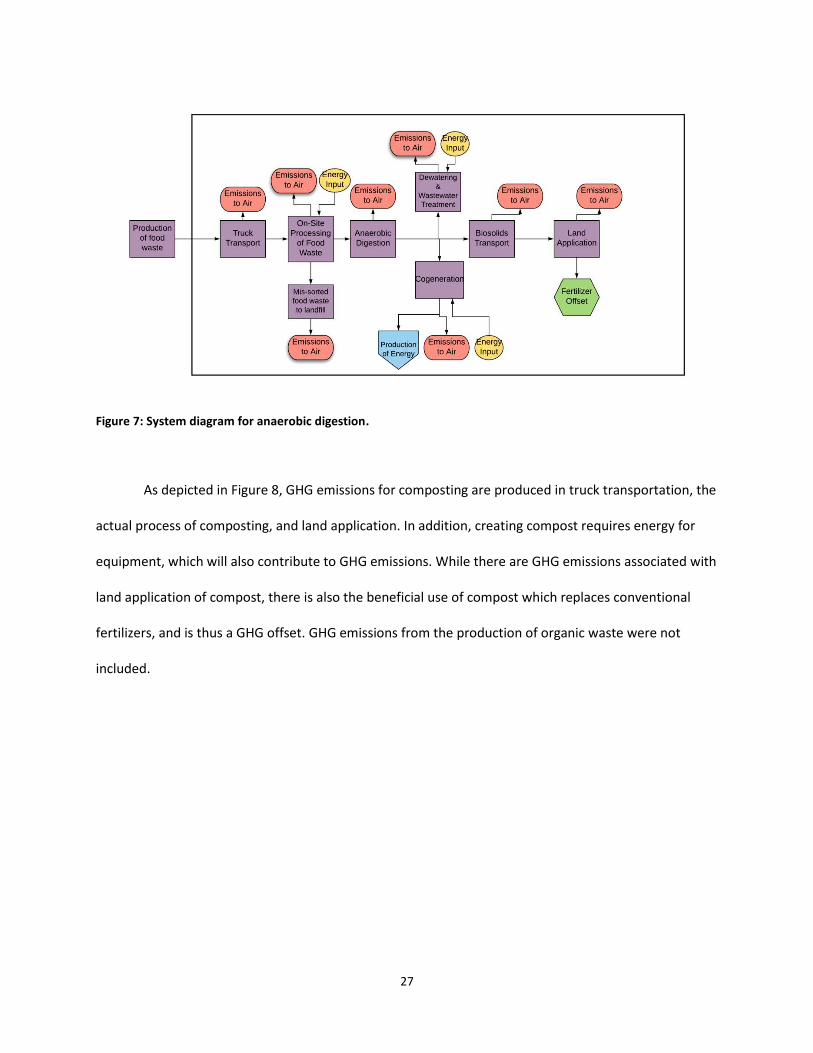
Figure 7: System diagram for anaerobic digestion.
As depicted in Figure 8, GHG emissions for composting are produced in truck transportation, the
actual process of composting, and land application. In addition, creating compost requires energy for
equipment, which will also contribute to GHG emissions. While there are GHG emissions associated with
land application of compost, there is also the beneficial use of compost which replaces conventional
fertilizers, and is thus a GHG offset. GHG emissions from the production of organic waste were not
included.

28
Figure 8: System diagram for compost.
GHG emissions for landfilling organic waste are generated from transportation of organic waste,
as well as GHG emissions produced at the landfills from both anaerobic decomposition and combustion
of fuel for heavy duty machinery (Figure 9). GHG emissions from the production of organic waste were
not included.
29
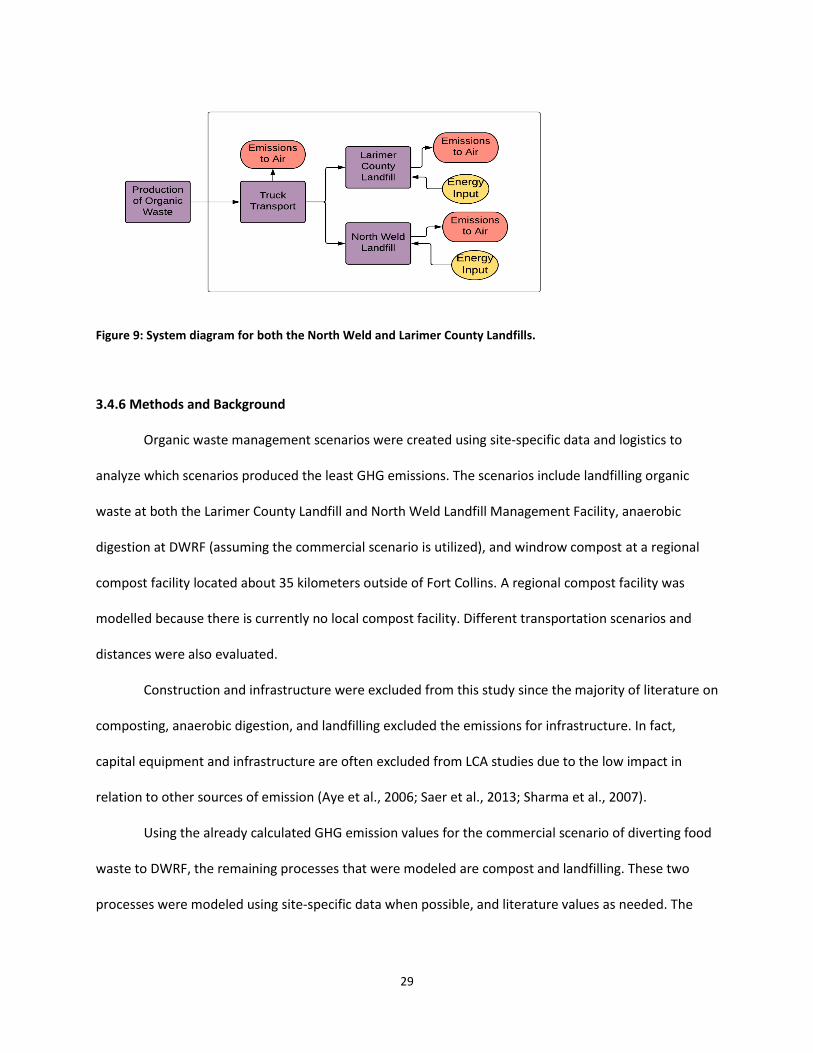
Figure 9: System diagram for both the North Weld and Larimer County Landfills.
3.4.6 Methods and Background
Organic waste management scenarios were created using site-specific data and logistics to
analyze which scenarios produced the least GHG emissions. The scenarios include landfilling organic
waste at both the Larimer County Landfill and North Weld Landfill Management Facility, anaerobic
digestion at DWRF (assuming the commercial scenario is utilized), and windrow compost at a regional
compost facility located about 35 kilometers outside of Fort Collins. A regional compost facility was
modelled because there is currently no local compost facility. Different transportation scenarios and
distances were also evaluated.
Construction and infrastructure were excluded from this study since the majority of literature on
composting, anaerobic digestion, and landfilling excluded the emissions for infrastructure. In fact,
capital equipment and infrastructure are often excluded from LCA studies due to the low impact in
relation to other sources of emission (Aye et al., 2006; Saer et al., 2013; Sharma et al., 2007).
Using the already calculated GHG emission values for the commercial scenario of diverting food
waste to DWRF, the remaining processes that were modeled are compost and landfilling. These two
processes were modeled using site-specific data when possible, and literature values as needed. The

30
transportation scenarios played a key role in this analysis and were modeled using site-specific
distances.
3.4.6.1 Anaerobic Digestion
Concerning food waste, anaerobic digestion was more efficient when collecting food waste via
truck than sewer (see Section 3.3). Woody materials such as yard waste and wet/contaminated fibers
are not well suited for the current anaerobic digesters at DWRF. Thus, the only feasible option for
anaerobic digestion is source-separated food waste from commercial sources such as grocery stores,
restaurants, etc. Since the functional unit in this report is one Mg of total organic waste, treatment of
the additional organic waste along with the digestion of food waste had to be considered. Commercial
food waste accounts for 28% of the total organic stream (SloanVasquezMcAfee, 2016). Thus, all
emissions for anaerobic digestion were multiplied by 28% and the remaining yard waste was assumed to
be composted (see Compost Subsection of Section 2.1 for a detailed description of assumptions and
emission factors). Therefore, the total emissions for anaerobic digestion at DWRF were calculated using
Equation 1.
� � = [ . � � � � + . � � � � � � ��� � � ] (1)
Emissions at DWRF= -89.8 kg CO2 eq/Mg of food waste
Emissions at regional compost facility= 96.7 kg CO2 eq/Mg of feedstock
31
3.4.6.2 Windrow Compost
The compost system was modelled based on an existing regional compost facility located about
35 kilometers outside of Fort Collins. The raw inputs and outputs for this compost system are
summarized in Table 3.
The existing regional facility utilizes large windrow composting piles to compost organic waste
such as food waste and yard waste. According to operators of the facility, the material they receive is
well balanced with carbon and nitrogen, so they do not purchase additives or bulking material.
Therefore, there is no need for a system expansion to incorporate the addition of bulking material.
Diesel combustion-The combustion of diesel for composting operations plays a large role in the overall
GHG emissions. A literature review was conducted, and based on seven different sources, an average
diesel use per Mg of organic waste composted was calculated. The A-1 Organics facility utilizes standard
diesel burning equipment such as a tub grinder, front end loader, and a windrow turner for their
composting operations. Due to the lack of data on diesel usage for each type of machine described
above, an aggregate fuel use was calculated based on literature that analyzed similar windrow
composting facilities. The results of this literature review are summarized in Table 35 . The average CO2
emission per liter of diesel combusted in industrial equipment was calculated using GaBi life cycle
assessment software and National Renewable Energy Laboratory (NREL) life cycle inventory data.
Electricity usage- Per A-1 Organics operators, no electricity is used for their composting process.
GHG emissions-Emissions from composting vary across the literature. A literature review of compost
emissions was conducted (see Appendix D: Table 35) and highlighted that methane, N2O, and ammonia
can be produced during windrow composting. As ammonia is not considered a GHG by the

32
Intergovernmental Panel on Climate Change (IPCC), ammonia was not included in this analysis. N2O is a
long-lived GHG has a CO2 equivalent of 298.
Based on the large range of emission values, outliers were identified by calculating upper and
lower fences. By calculating the first, second, and third quartiles along with inner quartile range the
lower fence was calculated using Equation 2 and the upper fence was calculated using Equation 3
(Mendenhall et al., 2012). All data points that were above the upper fence were excluded and an
average was calculated from the remaining values (see Appendix C: Table 36 for further details). The
same procedure was utilized for N2O emissions (see Appendix C: Table 36). Ammonia plays a large role
in the acidification and eutrophication impacts of LCA, but was not considered in this study since this
particular LCA is designed to analyze GHG emissions.
� � � = � � − .5 ∗ � � � � (2) � � = � � + .5 ∗ � � � � (3)
Mass reduction- The composting process significantly reduces the initial mass of the feedstock. An
average mass decrease from initial feedstock to mature compost was taken from three different sources
(see Appendix C: Table 33) and resulted in 29% of the initial feedstock.
Transportation of Compost to Clients- The facility delivers finished compost to various customers. The
distance can be seen in Table 3 and is a best estimate based on communication with facility operators.
OpenLCA was utilized to estimate emissions from transportation of the compost. For the municipal
t u k, NREL’s diesel fuel si gle u it sho t haul t u k south est as used alo g ith Re ipe idpoi t H
impact categories. The gross vehicle weight was increased to 27.2 Mg to reflect industry weights of
typical garbage trucks. The average payload of these trucks was 10.43 Mg based on conversations with
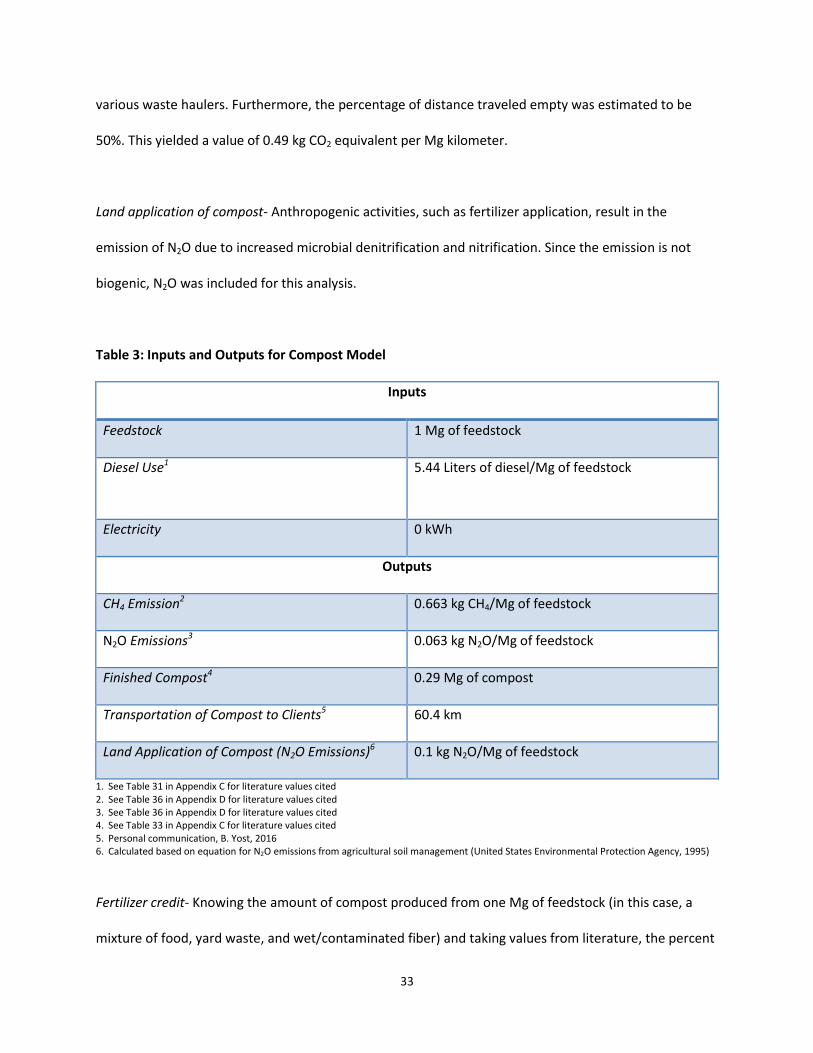
33
various waste haulers. Furthermore, the percentage of distance traveled empty was estimated to be
50%. This yielded a value of 0.49 kg CO2 equivalent per Mg kilometer.
Land application of compost- Anthropogenic activities, such as fertilizer application, result in the
emission of N2O due to increased microbial denitrification and nitrification. Since the emission is not
biogenic, N2O was included for this analysis.
Table 3: Inputs and Outputs for Compost Model
Inputs
Feedstock 1 Mg of feedstock
Diesel Use1 5.44 Liters of diesel/Mg of feedstock
Electricity 0 kWh
Outputs
CH4 Emission2 0.663 kg CH4/Mg of feedstock
N2O Emissions3 0.063 kg N2O/Mg of feedstock
Finished Compost4 0.29 Mg of compost
Transportation of Compost to Clients5 60.4 km
Land Application of Compost (N2O Emissions)6 0.1 kg N2O/Mg of feedstock
1. See Table 31 in Appendix C for literature values cited 2. See Table 36 in Appendix D for literature values cited 3. See Table 36 in Appendix D for literature values cited 4. See Table 33 in Appendix C for literature values cited 5. Personal communication, B. Yost, 2016 6. Calculated based on equation for N2O emissions from agricultural soil management (United States Environmental Protection Agency, 1995)
Fertilizer credit- Knowing the amount of compost produced from one Mg of feedstock (in this case, a
mixture of food, yard waste, and wet/contaminated fiber) and taking values from literature, the percent

34
mass of nitrogen, phosphorus, and potassium (NPK) was calculated. One study reports 2.0% nitrogen,
0.3% phosphorus, and 0.8% potassium (van Haaren et al., 2010) while another reports 1.84% Nitrogen,
0.51% Phosphorus, and 2.07% Potassium (Levis et al., 2013). These values were averaged (Table 4).
The ratio to which compost replaces conventional fertilizer was also considered. The ratio of
compost to conventional nitrogen fertilizer is 0.4 (Levis et al., 2013). In other words, 1 unit of nitrogen
fertilizer is the equivalent of 2.5 units of compost. Phosphorus and potassium are reported to replace
conventional fertilizer on a 1:1 ratio (Levis et al., 2013). Once the ratio of fertilizer replacement was
calculated, an average emission rate per kg of fertilizer was used to calculate emissions for NPK (Table
4).
Table 4: Fertilizer Credit Assumptions
Fertilizer Credit Value
Average nitrogen content of compost 1.92%
Average phosphorus content of compost 0.41%
Average potassium content of compost 1.44%
Average CO2 emissions per kg nitrogen fertilizer1 3.80 kg CO2/kg nitrogen fertilizer
Average CO2 emissions per kg phosphorus
fertilizer2
1.81 kg CO2/kg phosphorus fertilizer
CO2 emissions per kg potassium fertilizer3 0.41 kg CO2/kg potassium fertilizer
1. See Table 32 in Appendix C for literature values cited 2. See Table 34 in Appendix C for literature values cited 3. (Levis et al., 2013)
The overall GHG emissions from the entire composting process can be seen in Figure 10. Diesel
use, land application of compost, and transportation of compost to customers represent the largest

35
emissions. The calculated fertilizer offset is negative, as it replaces the need for conventional fertilizers
and reduces the total emissions of composting.
Figure 10: GHG emissions associated with each phase of the compost process.
3.4.6.3 Landfill
The City of Fort Collins disposes MSW in two landfills. One is the Larimer County Landfill and the
other is the North Weld Landfill, a privately-owned landfill in Ault, Colorado. According to the City,
approximately 56% of MSW generated in Fort Collins goes to the Larimer County Landfill, and the
remaining 44% goes to the North Weld Landfill. Major components of landfill design include the landfill
liner and landfill gas (LFG) collection system, which can vary from landfill to landfill. The liner is used to
prevent leachate from draining into water sources through runoff. The LFG system is used to collect gas
produced from the degradation of organic waste. The Larimer County Landfill has a LFG collection
system whereby the gas is collected and flared. Flaring landfill gas oxidizes methane, and the remaining
32
17 19
-11
29 30
116
-20
0
20
40
60
80
100
120
140
kg
CO
2 e
q/
Mg
Org
an
ic W
ast
e
36
CO2 emissions are biogenic. The North Weld Landfill does not collect landfill gas for flaring or recovery
(R3 Consulting Group, 2016) .
Diesel emissions- The Larimer County Landfill reported using 293,819.1 liters of diesel fuel in 2004 and
accepted 130,983 Mgs of waste (Santin, 2013). Normalizing this value to liters of diesel per Mg of waste
resulted in 2.2 liters of diesel per Mg of waste. This value was also applied to the North Weld Landfill
since operations are assumed to be similar to that of the Larimer County Landfill.
Landfill emissions- In landfills, organic waste often undergoes anaerobic decomposition, which produces
landfill gas (LFG) comprised primarily of methane and CO2. For the purposes of this LCA, the CO2 is
considered biogenic, since CO2 production is part of the natural carbon cycle. However, methane
production is counted as an emission source, due to anaerobic conditions created due to anthropogenic
activities (i.e., landfilling). Methane emissions due to food waste and yard waste were calculated
assuming a 100 year timespan. This is the approximate amount of time for 95% of the possible LFG to be
produced under a dry landfill scenario (U.S. EPA, 2015). The additional 5% of potential LFG production
was not included, as it results in a negligible increase in landfill GHG emissions. Therefore, this study
assumed 100% biodegradation of organic waste over 100 years. Fort Collins falls under a dry landfill
category, which is classified as receiving fewer than 508 mm of annual precipitation (U.S. EPA, 2015).
The Larimer County Landfill has a landfill gas collection system while the North Weld Landfill
does ot. The EPA’s WARM Ve sio epo ts t pi al olle tio effi ie ies to e . % for landfills
(U.S. EPA, 2015). The methane emitted from the two landfills was calculated using Equation 4 (Di Bella
et al., 2011) where P = production of methane, R = landfill gas recovery efficiency, and O = oxidation of
methane.
37
= − − (4)
The methane production associated with landfilling food waste is 1.93 MgCO2 eq/Mg (U.S. EPA,
2015). Yard waste was calculated by averaging the methane generation of grass, leaves, and branches,
which yielded 0.76 MgCO2 eq/Mg (U.S. EPA, 2015).The wet/contaminated fiber was assumed to be
primarily soiled paper waste, and as such, the methane generation of corrugated containers,
newspaper, and phone book were averaged resulting in 1.73 MgCO2 eq/Mg (U.S. EPA, 2015). The
functional unit of 1 Mg of organic waste consists of 49.6% food waste, 33% yard waste and 17.4%
wet/contaminated fiber (SloanVasquezMcAfee, 2016). Based o these alues, the P i E . 4 is
calculated to be 1,509.6 kg CO2 eq/Mg of organic waste
As can be seen in Table 5, there is a large difference between emissions at the Larimer County
La dfill a d e issio s at the No th Weld La dfill, hi h efle t No th Weld’s la k of olle tio s ste .
For the purposes of modelling landfill emissions, the percentage of waste landfilled at each location
(56% in Larimer County Landfill and 44% in North Weld Landfill) was used to calculate an aggregate
emission factor. This factor was used to calculate the aggregate landfill GHG emissions for Fort Collins,
and can be seen in Figure 11 . The inputs and outputs are summarized for the Larimer County and the
North Weld Landfills (Table 6). While the inputs for both landfills are the same, the methane emissions
differ significantly due to the difference in LFG capture.

38
Table 5: Larimer County and North Weld Landfill Parameters
Larimer County Landfill North Weld Landfill
E 178.1 (kg CO2 eq/Mg of organic waste) 1358.6 kg CO2 eq/Mg of organic
waste
P 1509.6 (kg CO2 eq/Mg of organic waste) 1509.6 kg CO2 eq/Mg of organic waste
R 68.2%1 0%
O 20%2 10%3
. This alue efle ts a d la dfill , i.e. less tha i hes of a ual p e ipitatio (U.S. EPA, 2015) 2. With gas collection system before final landfill cover placement (U.S. EPA, 2015) 3. Without gas collection system or final cover (U.S. EPA, 2015)
Table 6: Inputs and Outputs for Larimer County Landfill
Inputs
Larimer County Landfill North Weld Landfill
Waste 0.56 Mg of organic waste 0.44 Mg of organic waste
Diesel Use 2.2 Liters of diesel/Mg of organic
waste
2.2 Liters of diesel/Mg of organic
waste
Outputs
Larimer County Landfill North Weld Landfill
Methane emission 178.1 kg CO2 eq/Mg of organic waste 1,358.6 kg CO2 eq/Mg of organic
waste

39
Figure 11: Aggregated GHG emission sources for landfilling organic waste.
3.4.6.4 Transportation
The assumptions made for the transportation analysis are summarized in Table 7.
T a spo tatio pla s a i po ta t ole i this a al sis due to the Cit ’s i te est i the diffe e t disposal
scenarios. Also, the fact that the City has three independent waste haulers adds inefficiencies that
exacerbate CO2 emissions.
Organic waste pickup routes were modeled assuming 21 km per Mg of organic waste, which is
typical of municipal waste collection routes where there is only 1 waste hauler (City of Loveland Solid
Waste Division, Personal Communication, October 3, 2016). Due to the fact that Fort Collins has three
independent waste haulers, the overall distance travelled was assumed to be three times greater. For
the two local anaerobic digestion scenarios, an additional 8 km was added to the route due to the fact
that the trucks have to return back to where they started after being emptied. The 8 km reflects the
distance from DWRF to the relative center of Fort Collins (identified at 40.560240, -105.076670).
13
690 703
0
100
200
300
400
500
600
700
800
Diesel Use Aggregate Emissions Total
kg
CO
2 e
q/M
g O
rga
nic
Wa
ste

40
Table 7: Description of Transportation Distances for Each Scenario
Scenario Distance
(municipal truck)
Distance (long-
haul truck)
Assumptions
No Action 158.1 km 0 km Three waste haulers take organic
waste to landfill using municipal truck
Assumed distance of 21 km per truck
for organic waste pickup
32 km round-trip from the center of
Fort Collins to Larimer County Landfill
and North Weld Landfill based on
MSW split to each landfill.
AD 1 115.3 km 53.4 km Three waste haulers take commercial
food waste to DWRF using municipal
truck.
Assumed distance of 21 km for food
waste pickup
13 km round-trip from center of Fort
Collins to DWRF.
The remainder of organic waste is
collected and transported based on the
Regional Compost with TS scenario
AD 2 226.7 km 0 km Three waste haulers take commercial
food waste to DWRF using municipal
truck.
Assumed distance of 21 km for food

41
waste pickup
13 km round-trip from center of Fort
Collins to DWRF.
The remainder of organic waste is
collected and transported based on the
Regional Compost without TS scenario.
Regional
Compost with
TS
120.7 km 74.03 km Three waste haulers collect organic
waste using a municipal truck and
transport waste to transfer station at
Larimer County Landfill.
One long haul truck transports waste
from transfer station to regional
compost facility.
Regional
Compost
without TS
275.2 km 0 km Three waste haulers collect organic
waste using a municipal truck and
transport waste to regional compost
facility
Transportation emission factors- OpenLCA was utilized to estimate emissions from transport. For the
u i ipal t u k, NREL’s diesel fuel si gle u it sho t haul t u k south est as used alo g ith Re ipe
midpoint H impact categories. The gross vehicle weight was increased to 27.2 Mg to reflect industry
weights of typical garbage trucks. The average payload of these trucks was 10.43 Mg based on
conversations with various waste haulers. Furthermore, the percentage of distance traveled empty was
estimated to be 50%. This yielded 0.49-kg CO2 equivalent per Mg kilometer.
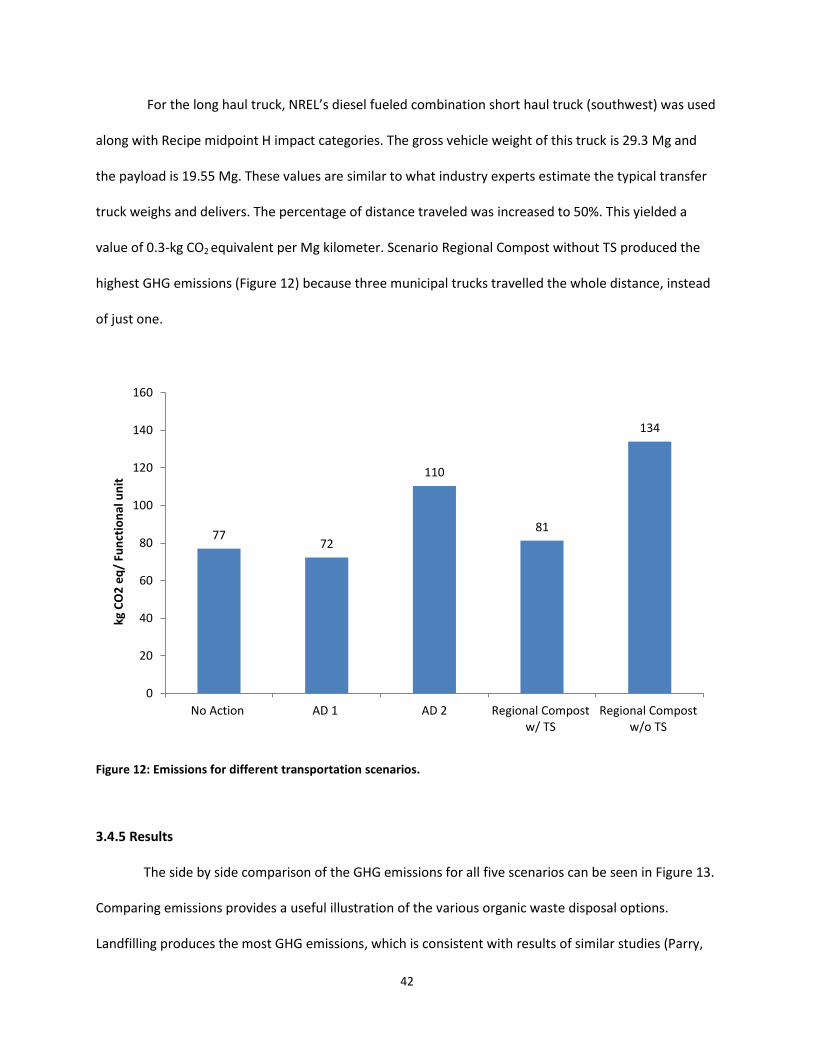
42
For the long haul t u k, NREL’s diesel fueled o i atio sho t haul t u k south est as used
along with Recipe midpoint H impact categories. The gross vehicle weight of this truck is 29.3 Mg and
the payload is 19.55 Mg. These values are similar to what industry experts estimate the typical transfer
truck weighs and delivers. The percentage of distance traveled was increased to 50%. This yielded a
value of 0.3-kg CO2 equivalent per Mg kilometer. Scenario Regional Compost without TS produced the
highest GHG emissions (Figure 12) because three municipal trucks travelled the whole distance, instead
of just one.
Figure 12: Emissions for different transportation scenarios.
3.4.5 Results
The side by side comparison of the GHG emissions for all five scenarios can be seen in Figure 13.
Comparing emissions provides a useful illustration of the various organic waste disposal options.
Landfilling produces the most GHG emissions, which is consistent with results of similar studies (Parry,
77 72
110
81
134
0
20
40
60
80
100
120
140
160
No Action AD 1 AD 2 Regional Compostw/ TS
Regional Compostw/o TS
kg
CO
2 e
q/
Fu
nct
ion
al
un
it
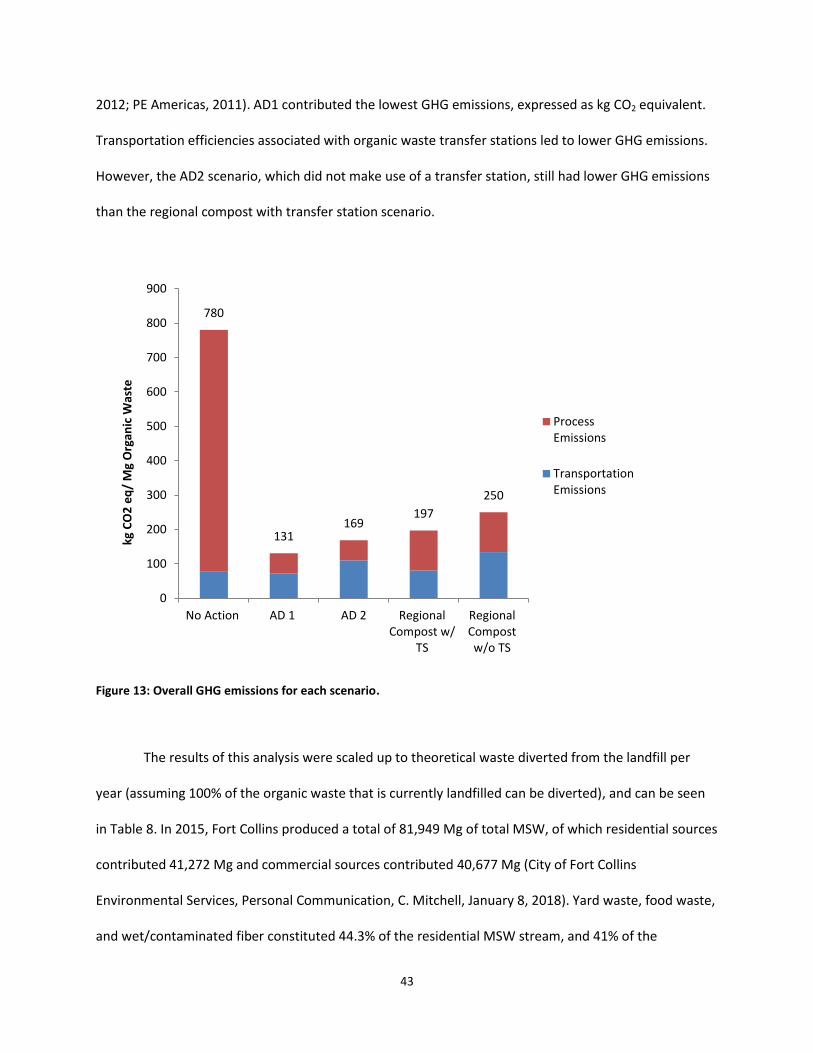
43
2012; PE Americas, 2011). AD1 contributed the lowest GHG emissions, expressed as kg CO2 equivalent.
Transportation efficiencies associated with organic waste transfer stations led to lower GHG emissions.
However, the AD2 scenario, which did not make use of a transfer station, still had lower GHG emissions
than the regional compost with transfer station scenario.
Figure 13: Overall GHG emissions for each scenario.
The results of this analysis were scaled up to theoretical waste diverted from the landfill per
year (assuming 100% of the organic waste that is currently landfilled can be diverted), and can be seen
in Table 8. In 2015, Fort Collins produced a total of 81,949 Mg of total MSW, of which residential sources
contributed 41,272 Mg and commercial sources contributed 40,677 Mg (City of Fort Collins
Environmental Services, Personal Communication, C. Mitchell, January 8, 2018). Yard waste, food waste,
and wet/contaminated fiber constituted 44.3% of the residential MSW stream, and 41% of the
780
131 169
197
250
0
100
200
300
400
500
600
700
800
900
No Action AD 1 AD 2 RegionalCompost w/
TS
RegionalCompostw/o TS
kg
CO
2 e
q/
Mg
Org
an
ic W
ast
e
ProcessEmissions
TransportationEmissions
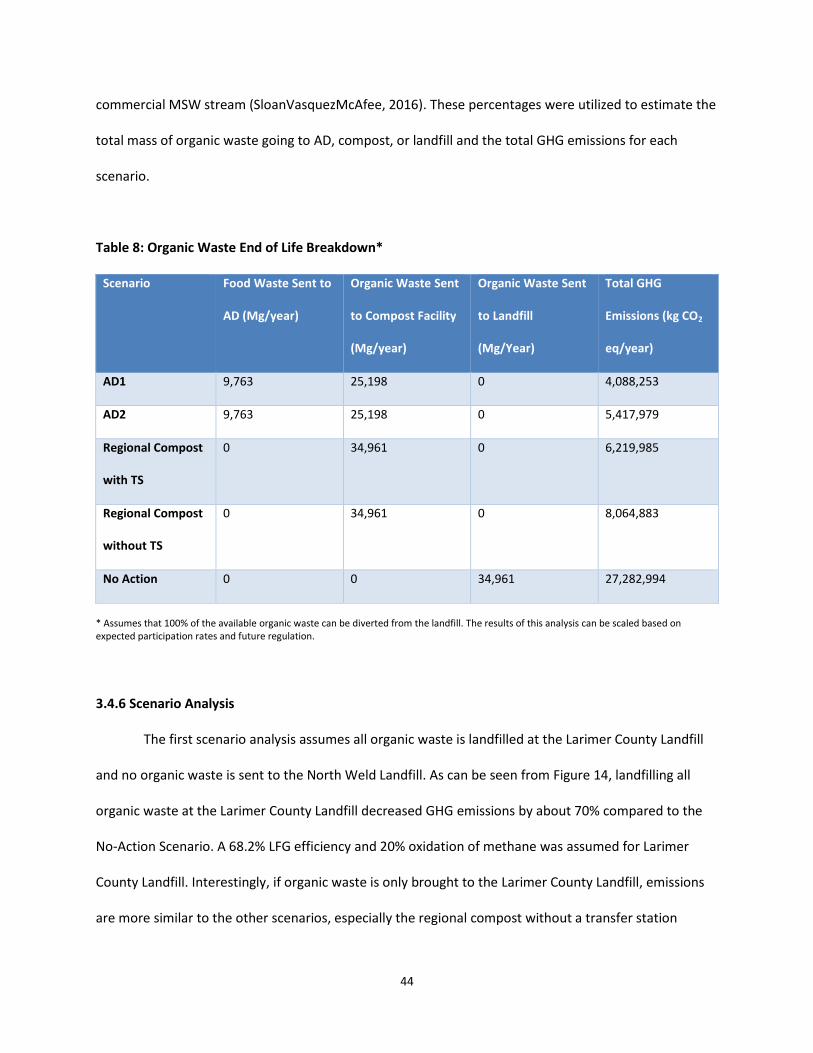
44
commercial MSW stream (SloanVasquezMcAfee, 2016). These percentages were utilized to estimate the
total mass of organic waste going to AD, compost, or landfill and the total GHG emissions for each
scenario.
Table 8: Organic Waste End of Life Breakdown*
Scenario Food Waste Sent to
AD (Mg/year)
Organic Waste Sent
to Compost Facility
(Mg/year)
Organic Waste Sent
to Landfill
(Mg/Year)
Total GHG
Emissions (kg CO2
eq/year)
AD1 9,763 25,198 0 4,088,253
AD2 9,763 25,198 0 5,417,979
Regional Compost
with TS
0 34,961 0 6,219,985
Regional Compost
without TS
0 34,961 0 8,064,883
No Action 0 0 34,961 27,282,994
* Assumes that 100% of the available organic waste can be diverted from the landfill. The results of this analysis can be scaled based on expected participation rates and future regulation.
3.4.6 Scenario Analysis
The first scenario analysis assumes all organic waste is landfilled at the Larimer County Landfill
and no organic waste is sent to the North Weld Landfill. As can be seen from Figure 14, landfilling all
organic waste at the Larimer County Landfill decreased GHG emissions by about 70% compared to the
No-Action Scenario. A 68.2% LFG efficiency and 20% oxidation of methane was assumed for Larimer
County Landfill. Interestingly, if organic waste is only brought to the Larimer County Landfill, emissions
are more similar to the other scenarios, especially the regional compost without a transfer station
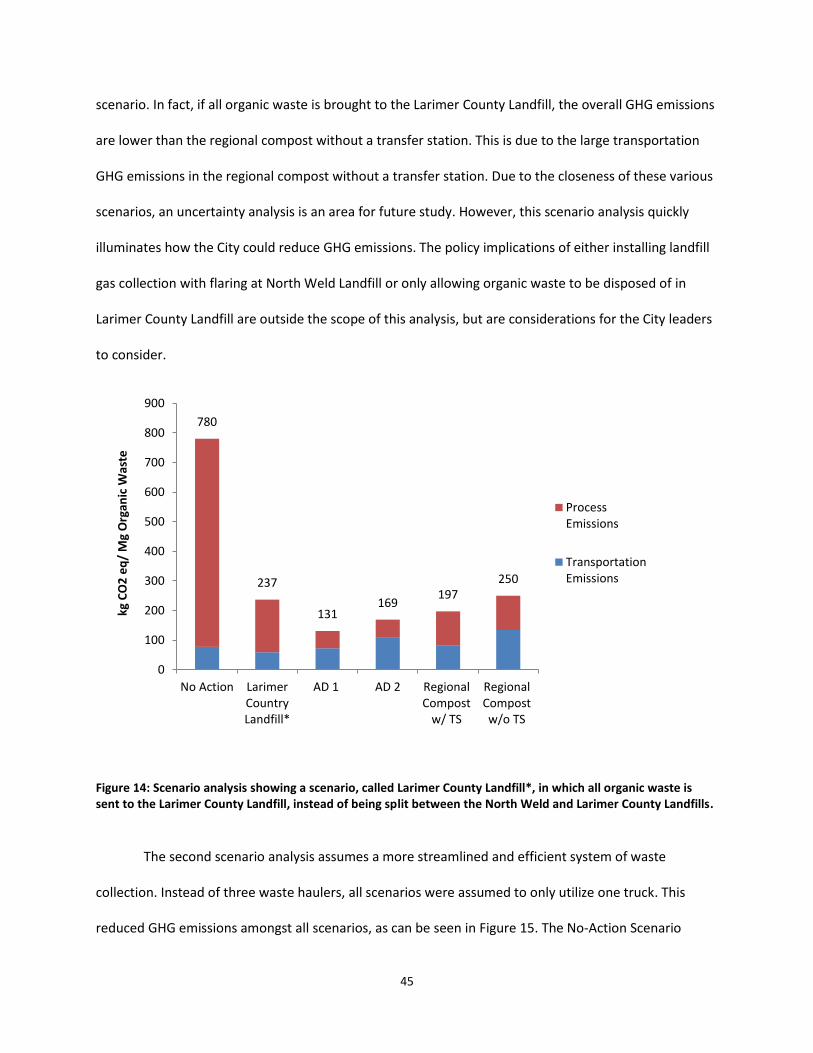
45
scenario. In fact, if all organic waste is brought to the Larimer County Landfill, the overall GHG emissions
are lower than the regional compost without a transfer station. This is due to the large transportation
GHG emissions in the regional compost without a transfer station. Due to the closeness of these various
scenarios, an uncertainty analysis is an area for future study. However, this scenario analysis quickly
illuminates how the City could reduce GHG emissions. The policy implications of either installing landfill
gas collection with flaring at North Weld Landfill or only allowing organic waste to be disposed of in
Larimer County Landfill are outside the scope of this analysis, but are considerations for the City leaders
to consider.
Figure 14: Scenario analysis showing a scenario, called Larimer County Landfill*, in which all organic waste is
sent to the Larimer County Landfill, instead of being split between the North Weld and Larimer County Landfills.
The second scenario analysis assumes a more streamlined and efficient system of waste
collection. Instead of three waste haulers, all scenarios were assumed to only utilize one truck. This
reduced GHG emissions amongst all scenarios, as can be seen in Figure 15. The No-Action Scenario
780
237
131 169
197 250
0
100
200
300
400
500
600
700
800
900
No Action LarimerCountryLandfill*
AD 1 AD 2 RegionalCompost
w/ TS
RegionalCompostw/o TS
kg
CO
2 e
q/
Mg
Org
an
ic W
ast
e
ProcessEmissions
TransportationEmissions
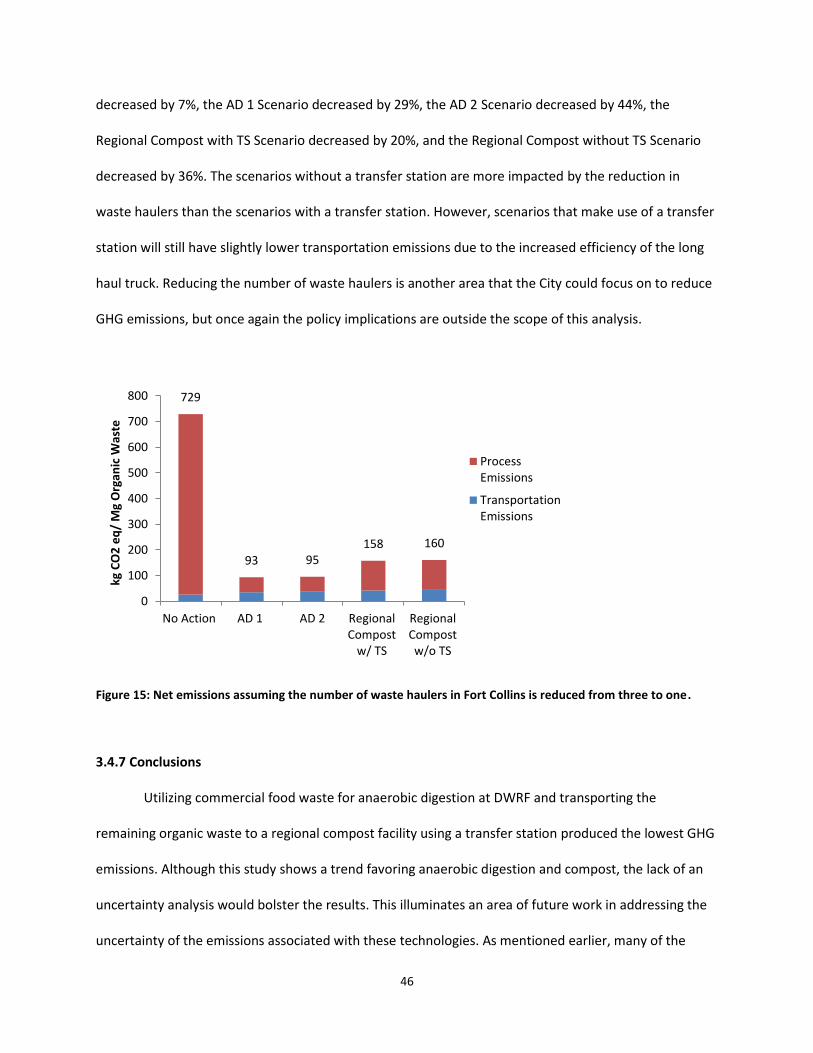
46
decreased by 7%, the AD 1 Scenario decreased by 29%, the AD 2 Scenario decreased by 44%, the
Regional Compost with TS Scenario decreased by 20%, and the Regional Compost without TS Scenario
decreased by 36%. The scenarios without a transfer station are more impacted by the reduction in
waste haulers than the scenarios with a transfer station. However, scenarios that make use of a transfer
station will still have slightly lower transportation emissions due to the increased efficiency of the long
haul truck. Reducing the number of waste haulers is another area that the City could focus on to reduce
GHG emissions, but once again the policy implications are outside the scope of this analysis.
Figure 15: Net emissions assuming the number of waste haulers in Fort Collins is reduced from three to one.
3.4.7 Conclusions
Utilizing commercial food waste for anaerobic digestion at DWRF and transporting the
remaining organic waste to a regional compost facility using a transfer station produced the lowest GHG
emissions. Although this study shows a trend favoring anaerobic digestion and compost, the lack of an
uncertainty analysis would bolster the results. This illuminates an area of future work in addressing the
uncertainty of the emissions associated with these technologies. As mentioned earlier, many of the
729
93 95 158 160
0
100
200
300
400
500
600
700
800
No Action AD 1 AD 2 RegionalCompost
w/ TS
RegionalCompostw/o TS
kg
CO
2 e
q/
Mg
Org
an
ic W
ast
e
ProcessEmissions
TransportationEmissions

47
biological emissions vary substantially throughout the literature, which could have implications on the
analysis. Although a statistical study was conducted for compost emissions, more advanced software or
a more in-depth statistical review of the literature would most likely yield a stronger uncertainty
analysis.
The results of this carbon footprint are in line with the vast majority of literature related to GHG
emissions of landfills, compost, and anaerobic digestion. Utilizing the updated 2014 IPCC global warming
potential for CH4 and N2O would not change the overall rank of the scenarios when comparing GHG
emissions. The No Action scenario would still produce the highest GHG emissions, followed by AD 1,
AD2, Regional Compost with TS, and finally Regional Compost without TS. The 2014 IPCC global warming
potentials would lead to an increase in landfill emissions, a very slight decrease in the AD 1 and AD 2
scenario, and a slight increase in the Regional Compost with TS and Regional Compost without TS.
The various transportation scenarios show that transfer stations result in lower overall
emissions when transporting waste long distances. This is useful for decision makers when considering
the costs of building and staffing a transfer station. Furthermore, if the City is interested in ways to
reduce GHG emissions without using the wastewater treatment plant or building new infrastructure,
eliminating organic waste sent to the North Weld Landfill results in a 69% decrease in landfill emissions
associated with Fort Collins’ solid aste.
48
Chapter 4: Carbon Footprint and Cost Analysis of Organic Waste Management Option in
Todos Santos, Baja California Sur, Mexico
4.1 Introduction
The municipality of Todos Santos, Baja California Sur, Mexico has identified improved waste
management as a community need. The negative aesthetics of waste accumulation, lack of awareness
for appropriate waste disposal, and public and environmental health related to open dumping and
burning were identified as chief concerns (Pickering et al., 2015).
Assessing the current landfill composition is critical when building alternative scenarios to divert
organic waste. Unlike Fort Collins, there have been no studies conducted on the current landfill
composition in Todos Santos. Therefore, due to limited available data, the average waste composition
for Mexico (Figure 16) was assumed representative of Todos Santos. Organic waste constitutes 51% of
total waste, and developing sustainable waste management alternatives for this fraction will decrease
the amount of waste landfilled and decrease GHG emissions compared to current waste management
practices. Furthermore, depending on financial markets, compost facilities could be developed to
provide a source of revenue and job creation.
To highlight best organic waste management strategies to achieve carbon footprint benefits, a
site visit to Todos Santos was conducted in June 2017. The site visit illuminated both the lack of an
engineered landfill, and any large scale compost facilities. Speaking with several stakeholders both at
Colorado State University and in Todos Santos, it was apparent that compost is the most feasible organic
waste management in Todos Santos.

49
Figure 16: Waste Stream for Mexico. Values taken from (Dirección de Planeación Urbana y Ecología, 2011). The
values are applied to Todos Santos' waste composition.
4.2 Objectives
The goal of this study was to quantify the carbon footprint of organic waste management in
Todos Santos. Furthermore, a capital cost analysis comparing static aerated composting and windrow
composting was conducted. The cost assessment and carbon footprint analysis were considered
together when proposing best organic waste management options for Todos Santos.
4.3 Scenario Description and Justification
Several different scenarios were analyzed to create a more holistic view for organic waste
management, and are summarized in Table 9. GHG emissions for windrow composting and static
aerated compost were compared to the status quo of landfilling organic waste. The small population of
Todos Santos and lack of anaerobic digesters at the municipal wastewater treatment plant, rendered
anaerobic digestion as an impractical organic waste alternative. Currently, there is no large scale
compost facility in Todos Santos, so assessing the GHG emissions and cost of both static aerated and
windrow composting techniques is beneficial. Both the static aerated compost facility and windrow
Organic, 51%
Paper and
Cardboard,
15%
Plastic, 6%
Glass, 6%
Metal, 3%
Textile, 2% Non
Recyclables,
17%
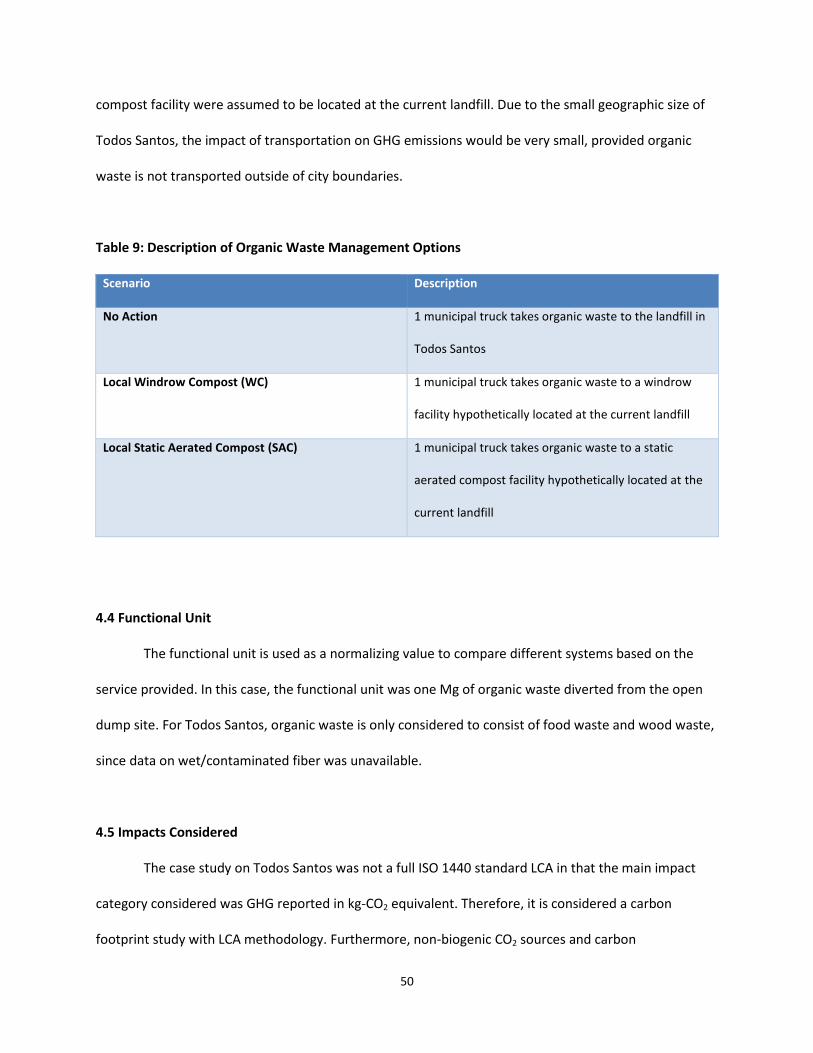
50
compost facility were assumed to be located at the current landfill. Due to the small geographic size of
Todos Santos, the impact of transportation on GHG emissions would be very small, provided organic
waste is not transported outside of city boundaries.
Table 9: Description of Organic Waste Management Options
Scenario Description
No Action 1 municipal truck takes organic waste to the landfill in
Todos Santos
Local Windrow Compost (WC) 1 municipal truck takes organic waste to a windrow
facility hypothetically located at the current landfill
Local Static Aerated Compost (SAC) 1 municipal truck takes organic waste to a static
aerated compost facility hypothetically located at the
current landfill
4.4 Functional Unit
The functional unit is used as a normalizing value to compare different systems based on the
service provided. In this case, the functional unit was one Mg of organic waste diverted from the open
dump site. For Todos Santos, organic waste is only considered to consist of food waste and wood waste,
since data on wet/contaminated fiber was unavailable.
4.5 Impacts Considered
The case study on Todos Santos was not a full ISO 1440 standard LCA in that the main impact
category considered was GHG reported in kg-CO2 equivalent. Therefore, it is considered a carbon
footprint study with LCA methodology. Furthermore, non-biogenic CO2 sources and carbon
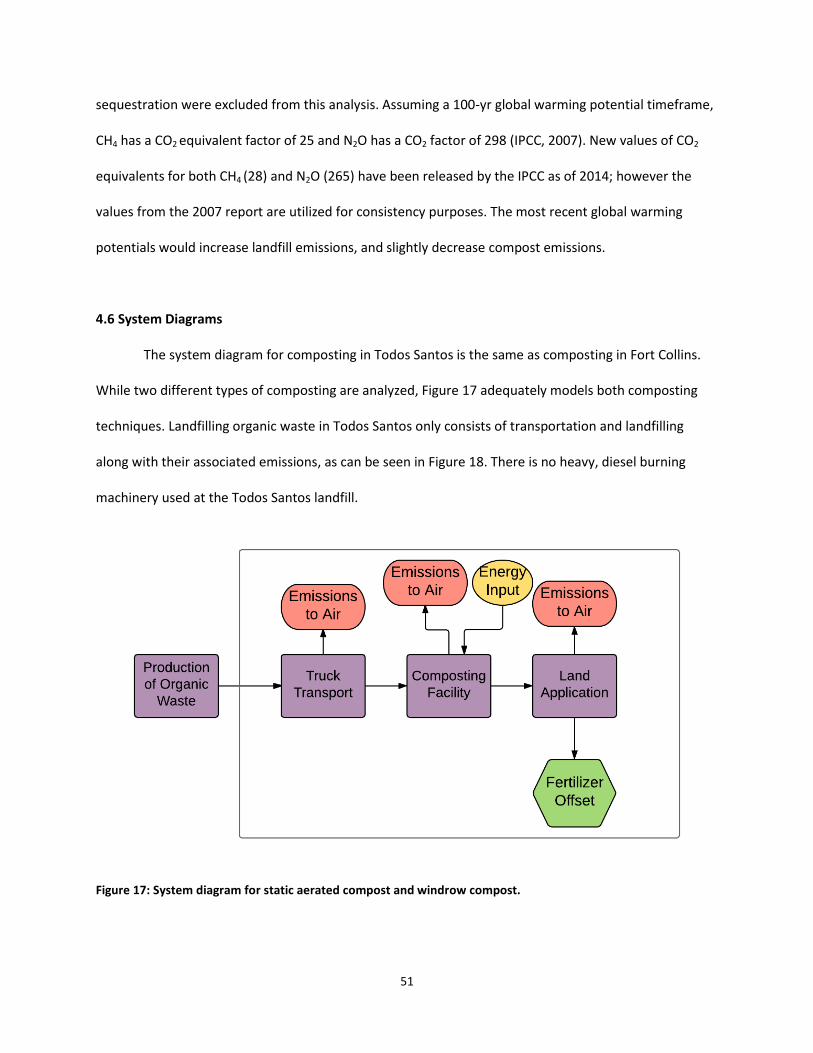
51
sequestration were excluded from this analysis. Assuming a 100-yr global warming potential timeframe,
CH4 has a CO2 equivalent factor of 25 and N2O has a CO2 factor of 298 (IPCC, 2007). New values of CO2
equivalents for both CH4 (28) and N2O (265) have been released by the IPCC as of 2014; however the
values from the 2007 report are utilized for consistency purposes. The most recent global warming
potentials would increase landfill emissions, and slightly decrease compost emissions.
4.6 System Diagrams
The system diagram for composting in Todos Santos is the same as composting in Fort Collins.
While two different types of composting are analyzed, Figure 17 adequately models both composting
techniques. Landfilling organic waste in Todos Santos only consists of transportation and landfilling
along with their associated emissions, as can be seen in Figure 18. There is no heavy, diesel burning
machinery used at the Todos Santos landfill.
Figure 17: System diagram for static aerated compost and windrow compost.
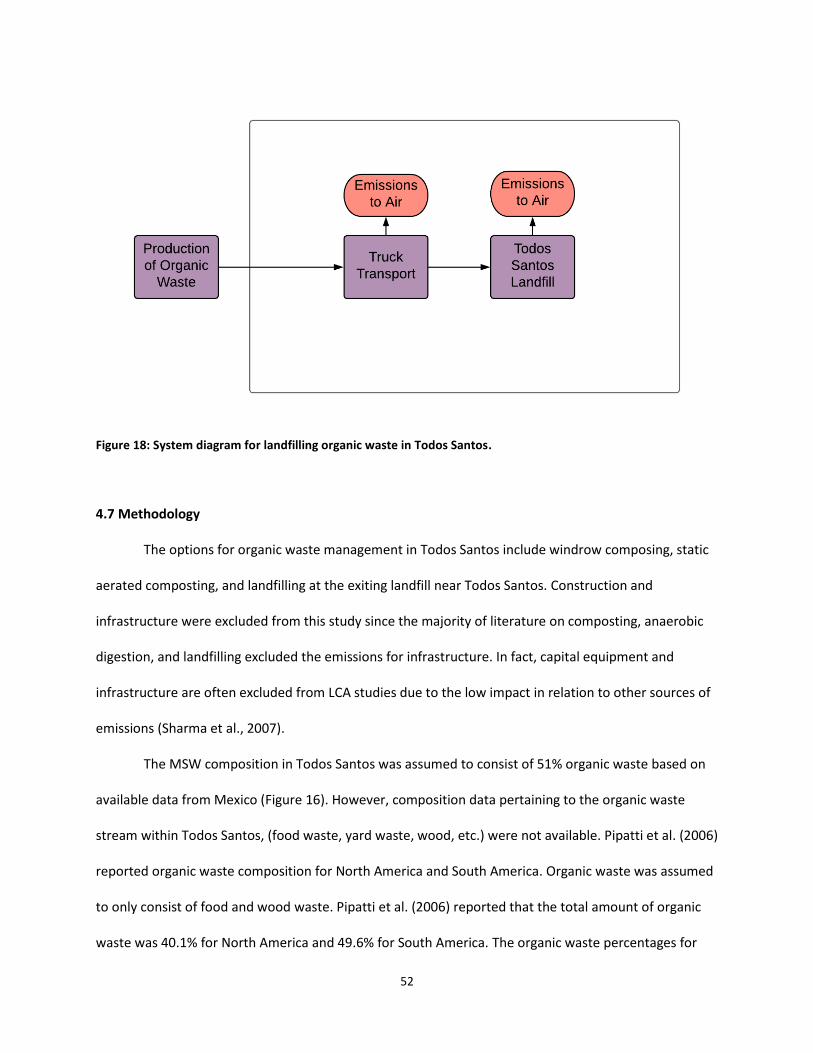
52
Figure 18: System diagram for landfilling organic waste in Todos Santos.
4.7 Methodology
The options for organic waste management in Todos Santos include windrow composing, static
aerated composting, and landfilling at the exiting landfill near Todos Santos. Construction and
infrastructure were excluded from this study since the majority of literature on composting, anaerobic
digestion, and landfilling excluded the emissions for infrastructure. In fact, capital equipment and
infrastructure are often excluded from LCA studies due to the low impact in relation to other sources of
emissions (Sharma et al., 2007).
The MSW composition in Todos Santos was assumed to consist of 51% organic waste based on
available data from Mexico (Figure 16). However, composition data pertaining to the organic waste
stream within Todos Santos, (food waste, yard waste, wood, etc.) were not available. Pipatti et al. (2006)
reported organic waste composition for North America and South America. Organic waste was assumed
to only consist of food and wood waste. Pipatti et al. (2006) reported that the total amount of organic
waste was 40.1% for North America and 49.6% for South America. The organic waste percentages for
53
South America match Todos Santos more closely than North America, so South American literature
values were used in this analysis even though Todos Santos is in North America. Food and wood waste
make up 44.9% and 4.7%, respectively, of the MSW stream in South American countries (Pipatti et al.,
2006).
4.7.1 Compost
Currently, there are no large-scale composting facilities within the Todos Santos area. Thus,
before any type of compost facility is to be constructed, the organic waste composition needs to be
analyzed. Maintaining a proper carbon to nitrogen ratio is critical for achieving high quality compost.
Using values from Pipatti et al. (2006), food waste makes up 90.5% of organic waste and wood waste
makes up the additional 9.5%. For the purposes of this analysis, a 25 carbon-to- it oge atio R was
utilized. The mass of each type of feedstock was calculated using Equation 5 (Richard et al., 1996). Wood
waste was assumed to be chipped into wood shavings for all modeled compost operations.
Using the values from Table 10, for every ton of compost feedstock, only 0.75% is required to be
wood chips, which is much less than the existing 9.5%. In other words, food waste will be the limiting
variable for creating an ideal organic waste mixture to compost. Therefore, based on the assumed waste
characteristics and quantity, the target C:N ratio of 25 can be met without the addition of outside
compost materials.
Q =Q *N *(R-
CN
)*( -M )N *(C
N -R)*( -M ) (5)
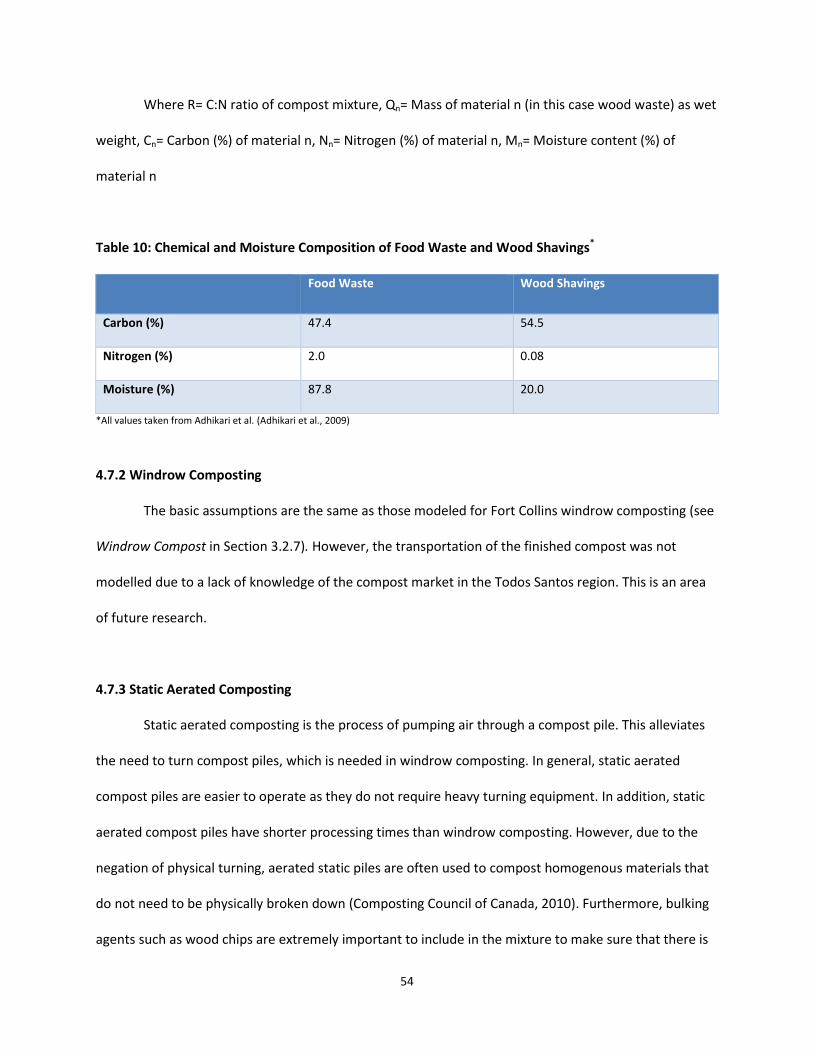
54
Where R= C:N ratio of compost mixture, Qn= Mass of material n (in this case wood waste) as wet
weight, Cn= Carbon (%) of material n, Nn= Nitrogen (%) of material n, Mn= Moisture content (%) of
material n
Table 10: Chemical and Moisture Composition of Food Waste and Wood Shavings*
Food Waste Wood Shavings
Carbon (%) 47.4 54.5
Nitrogen (%) 2.0 0.08
Moisture (%) 87.8 20.0
*All values taken from Adhikari et al. (Adhikari et al., 2009)
4.7.2 Windrow Composting
The basic assumptions are the same as those modeled for Fort Collins windrow composting (see
Windrow Compost in Section 3.2.7). However, the transportation of the finished compost was not
modelled due to a lack of knowledge of the compost market in the Todos Santos region. This is an area
of future research.
4.7.3 Static Aerated Composting
Static aerated composting is the process of pumping air through a compost pile. This alleviates
the need to turn compost piles, which is needed in windrow composting. In general, static aerated
compost piles are easier to operate as they do not require heavy turning equipment. In addition, static
aerated compost piles have shorter processing times than windrow composting. However, due to the
negation of physical turning, aerated static piles are often used to compost homogenous materials that
do not need to be physically broken down (Composting Council of Canada, 2010). Furthermore, bulking
agents such as wood chips are extremely important to include in the mixture to make sure that there is
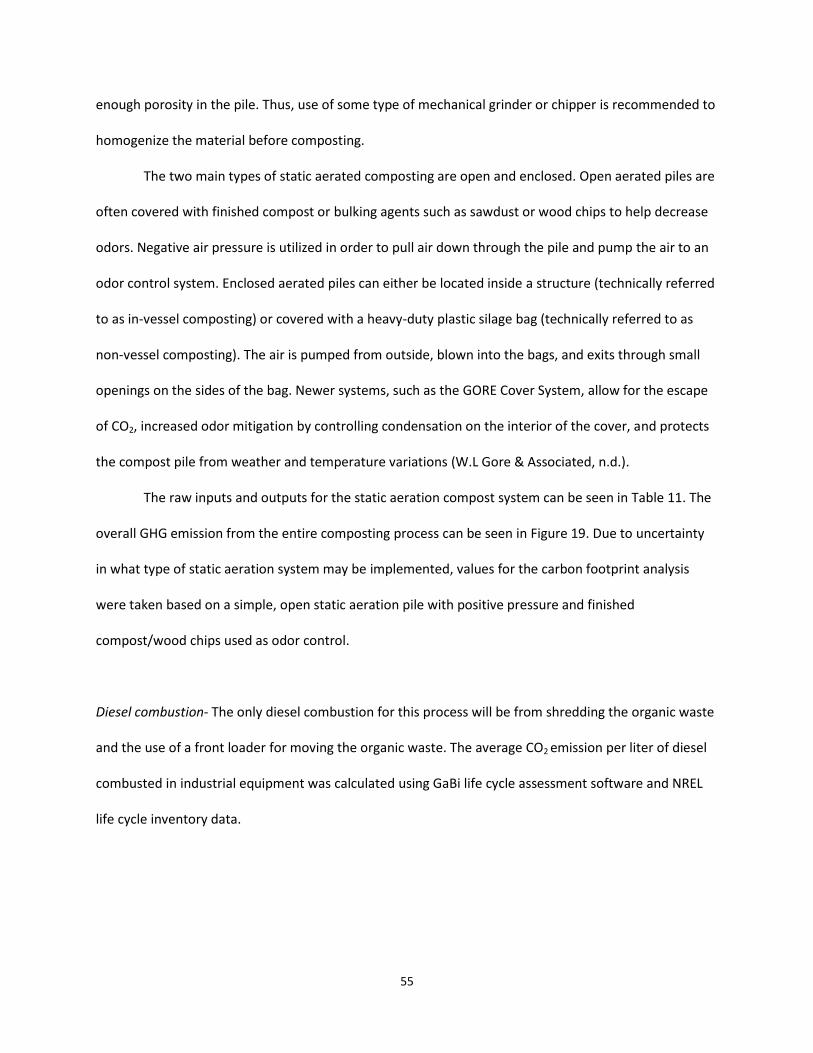
55
enough porosity in the pile. Thus, use of some type of mechanical grinder or chipper is recommended to
homogenize the material before composting.
The two main types of static aerated composting are open and enclosed. Open aerated piles are
often covered with finished compost or bulking agents such as sawdust or wood chips to help decrease
odors. Negative air pressure is utilized in order to pull air down through the pile and pump the air to an
odor control system. Enclosed aerated piles can either be located inside a structure (technically referred
to as in-vessel composting) or covered with a heavy-duty plastic silage bag (technically referred to as
non-vessel composting). The air is pumped from outside, blown into the bags, and exits through small
openings on the sides of the bag. Newer systems, such as the GORE Cover System, allow for the escape
of CO2, increased odor mitigation by controlling condensation on the interior of the cover, and protects
the compost pile from weather and temperature variations (W.L Gore & Associated, n.d.).
The raw inputs and outputs for the static aeration compost system can be seen in Table 11. The
overall GHG emission from the entire composting process can be seen in Figure 19. Due to uncertainty
in what type of static aeration system may be implemented, values for the carbon footprint analysis
were taken based on a simple, open static aeration pile with positive pressure and finished
compost/wood chips used as odor control.
Diesel combustion- The only diesel combustion for this process will be from shredding the organic waste
and the use of a front loader for moving the organic waste. The average CO2 emission per liter of diesel
combusted in industrial equipment was calculated using GaBi life cycle assessment software and NREL
life cycle inventory data.

56
Electricity usage- Electricity will be required to pump air through the compost pile. For a general static
aerated pile it takes 0.69 kWh/Mg (Levis et al., 2013). The conversion from kWh to kg CO2 equivalent in
Mexico is 0.689 kg CO2eq kWh-1 (Metz et al., 2005).
GHG emissions- Methane and N2O emissions from static aerated composting are higher compared to
windrow composting (Levis et al., 2013). According to Levis et al. (2013), the portion of emitted carbon
that is methane is 1.59 times higher for static aerated compost than windrow composting. In addition,
Levis et al. (2013) found that the portion of emitted nitrogen that is N2O is 4.5 times higher for static
aerated compost than windrow compost. Windrow composting and static aeration composting were
both assumed to emit the same amount of carbon and nitrogen. Thus, CH4 emissions for windrow
composting (see Windrow Composting in Section 3.2.7) were multiplied by 1.59. The same technique
was utilized to calculate N2O emissions.
Mass reduction- Mass reduction from static aerated composting was assumed to be same as Windrow
Compost (Section 3.2.7).
Land applications of compost- N2O emissions resulting from land application of static aerated compost
were assumed to be the same as windrow compost. Therefore, the emissions are calculated in the same
manner as described in Windrow Compost (Section 3.2.7).
57
Table 11: Inputs and Outputs for Static Aerated Compost Model
Inputs
Feedstock 1 Mg of feedstock
Diesel Use1 1.5 Liters of diesel/Mg of feedstock
Electricity2 3.8 kWh/ton of feedstock
Outputs
Methane Emission3 1.05 kg CH4/Mg of feedstock
N2O Emissions4 0.309 kg N2O/Mg of feedstock
Finished Compost5 0.29 Mg of compost
Land Application of Compost (N2O Emissions)6 0.1 kg N2O/Mg of feedstock
1. (Andersen et al., 2010) 2. (Levis et al., 2013) 3. See Table 35 in Appendix D for literature values cited 4. See Table 36 in Appendix D for literature values cited 5. See Table 33 in Appendix C for literature values cited 6. Calculated based on equation for N2O emissions from agricultural soil management (United States Environmental Protection Agency, 1995)
Fertilizer credit- The compost produced from static aeration was assumed to consist of the same
chemical and physical properties as that produced in windrow composting. See Windrow Compost
(Section 3.2.7) for detailed assumptions.

58
Figure 19: Emissions for each process of static aeration composting.
4.7.4 Landfill
Todos Santos disposes MSW in an open dump style landfill with no LFG capture. There is no on-
site management of the waste, so no heavy equipment is utilized.
Diesel use- There is no diesel fuel combustion at the Todos Santos landfill.
Landfill emissions- Landfill GHG emissions for food and yard waste are assumed to be the same as
emissions at the North Weld Landfill for the Fort Collins carbon footprint, see Landfill (Section 4.1.7) for
detailed assumptions and values. Emissions from wet/contaminated paper were excluded due to lack of
9 0.5
26
84
-11
30
139
-15
5
25
45
65
85
105
125
145
165
Diesel Use AerationEmissions
MethaneCompostEmissions
NitrousOxide
Emissions
FertilizerOffset
LandApplicationof Compost
TotalEmissions
Kg
CO
2 e
q/
Mg
Org
an
ic W
ast
e

59
data. According to the EPA, a 100-yr time period is roughly the amount of time needed to produce 95%
of the potential landfill gas for a dry climate landfill (U.S. EPA, 2015). Since both landfills are in climates
classified as dry, the assumed 100 year global warming time frame is an appropriate assumption.
Furthermore, it was assumed that 100% of the organic waste will biodegrade after the 100 years.
Equation 4 was used to calculate total methane emissions.
Table 12 shows the inputs and outputs for the Todos Santos landfill. Due to a lack of gas
collection system, the oxidation rate at the Todos Santos landfill is 10% (U.S. EPA, 2015). The GHG
emission for the landfill is 1,472.8 kg CO2 eq/Mg of organic waste.
Table 12: Inputs and outputs for Todos Santos Landfill
Inputs
Waste 1 Mg of organic waste
Outputs
Methane emission 1,472.8 kg CO2 eq/Mg of organic
waste
4.7.5 Transportation
Collection and transportation of organic waste in Todos Santos is difficult to model, as there are
no existing compost facilities. For the purposes of this analysis, either a windrow or static aerated
compost facility was assumed located at the current landfill. The various scenarios are summarized in
Table 13. Organic waste pickup routes were assumed to be the same as the Fort Collins scenario (21 km
per Mg of organic waste). The trip to the current landfill was measured to be 10 km from the center of
Todos Santos (identified at 23.447787, -110.225188).

60
Table 13: Description of Transportation Distances for Each Scenario
Scenario Distance (municipal truck) Assumptions
No Action 31 km One waste hauler takes organic
waste to current landfill
Localized Windrow Compost 31 km One waste hauler takes organic
waste to windrow compost facility
located at the current landfill
Localized Static Aerated Compost 31 km One waste hauler takes organic
waste to static aerated compost
facility located at current landfill
Emission factors- The municipal truck used for waste collection in Todos Santos was assumed to be the
same as the truck used in the Fort Collins analysis. The municipal truck contributes 0.49 kg CO2
equivalent per Mg kilometer (see Transportation emission factors in Section 3.2.7.4 for more details).
Due to the fact that all scenarios transport organic waste the same distance, each scenario produced
15.1 kg CO2 eq/MG of organic waste.
4.8 Results
The side by side comparison of the GHG emissions for all three scenarios can be seen in Figure
20. Similar to the Fort Collins analysis, landfilling produces the largest GHG emissions, followed by static
aerated compost, and windrow compost. The primary reason windrow compost resulted in lower GHG
emissions was due to lower N2O and CH4 emissions than static aerated compost operations. Small
differences in CH4, and especially N2O emissions, correlate to large differences in total GHG emissions,
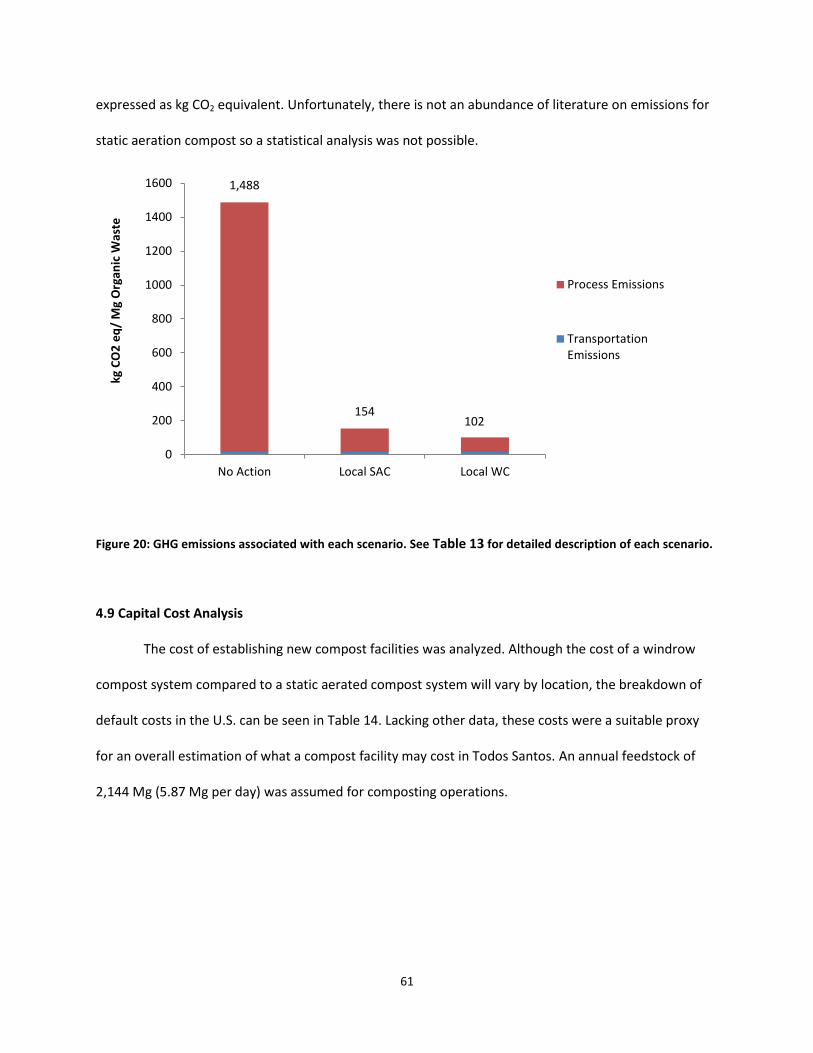
61
expressed as kg CO2 equivalent. Unfortunately, there is not an abundance of literature on emissions for
static aeration compost so a statistical analysis was not possible.
Figure 20: GHG emissions associated with each scenario. See Table 13 for detailed description of each scenario.
4.9 Capital Cost Analysis
The cost of establishing new compost facilities was analyzed. Although the cost of a windrow
compost system compared to a static aerated compost system will vary by location, the breakdown of
default costs in the U.S. can be seen in Table 14. Lacking other data, these costs were a suitable proxy
for an overall estimation of what a compost facility may cost in Todos Santos. An annual feedstock of
2,144 Mg (5.87 Mg per day) was assumed for composting operations.
1,488
154 102
0
200
400
600
800
1000
1200
1400
1600
No Action Local SAC Local WC
kg
CO
2 e
q/
Mg
Org
an
ic W
ast
e
Process Emissions
TransportationEmissions
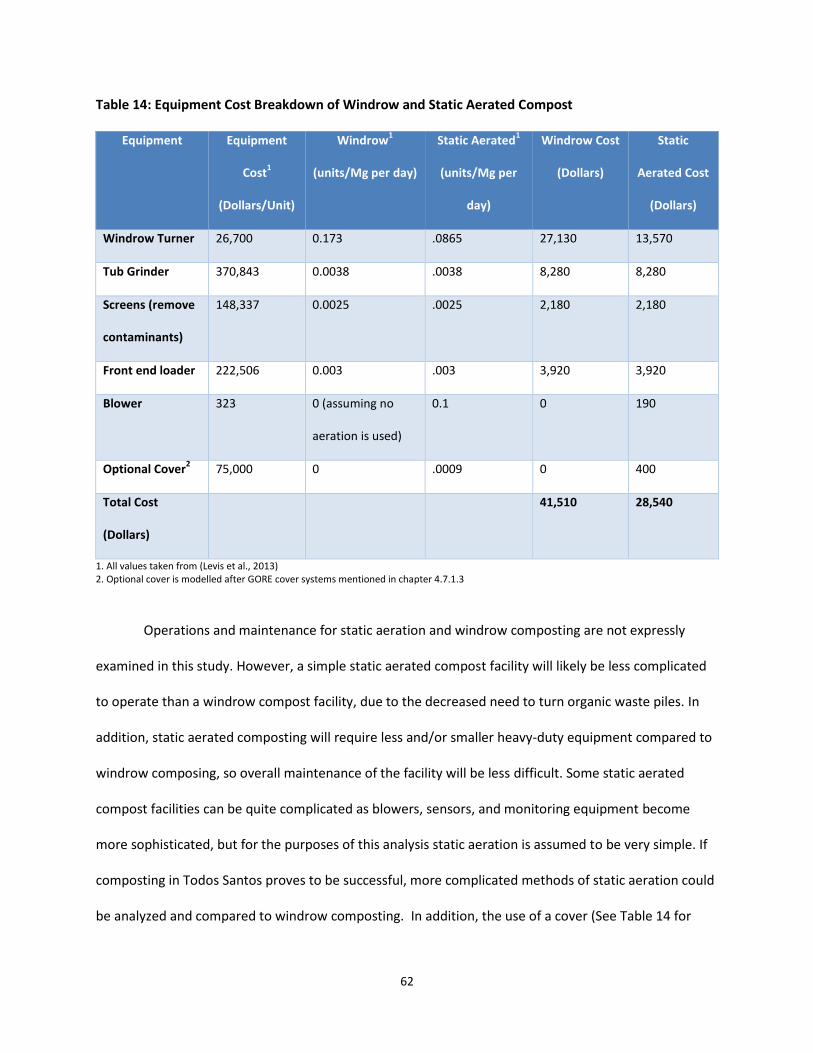
62
Table 14: Equipment Cost Breakdown of Windrow and Static Aerated Compost
Equipment Equipment
Cost1
(Dollars/Unit)
Windrow1
(units/Mg per day)
Static Aerated1
(units/Mg per
day)
Windrow Cost
(Dollars)
Static
Aerated Cost
(Dollars)
Windrow Turner 26,700 0.173 .0865 27,130 13,570
Tub Grinder 370,843 0.0038 .0038 8,280 8,280
Screens (remove
contaminants)
148,337 0.0025 .0025 2,180 2,180
Front end loader 222,506 0.003 .003 3,920 3,920
Blower 323 0 (assuming no
aeration is used)
0.1 0 190
Optional Cover2 75,000 0 .0009 0 400
Total Cost
(Dollars)
41,510 28,540
1. All values taken from (Levis et al., 2013) 2. Optional cover is modelled after GORE cover systems mentioned in chapter 4.7.1.3
Operations and maintenance for static aeration and windrow composting are not expressly
examined in this study. However, a simple static aerated compost facility will likely be less complicated
to operate than a windrow compost facility, due to the decreased need to turn organic waste piles. In
addition, static aerated composting will require less and/or smaller heavy-duty equipment compared to
windrow composing, so overall maintenance of the facility will be less difficult. Some static aerated
compost facilities can be quite complicated as blowers, sensors, and monitoring equipment become
more sophisticated, but for the purposes of this analysis static aeration is assumed to be very simple. If
composting in Todos Santos proves to be successful, more complicated methods of static aeration could
be analyzed and compared to windrow composting. In addition, the use of a cover (See Table 14 for
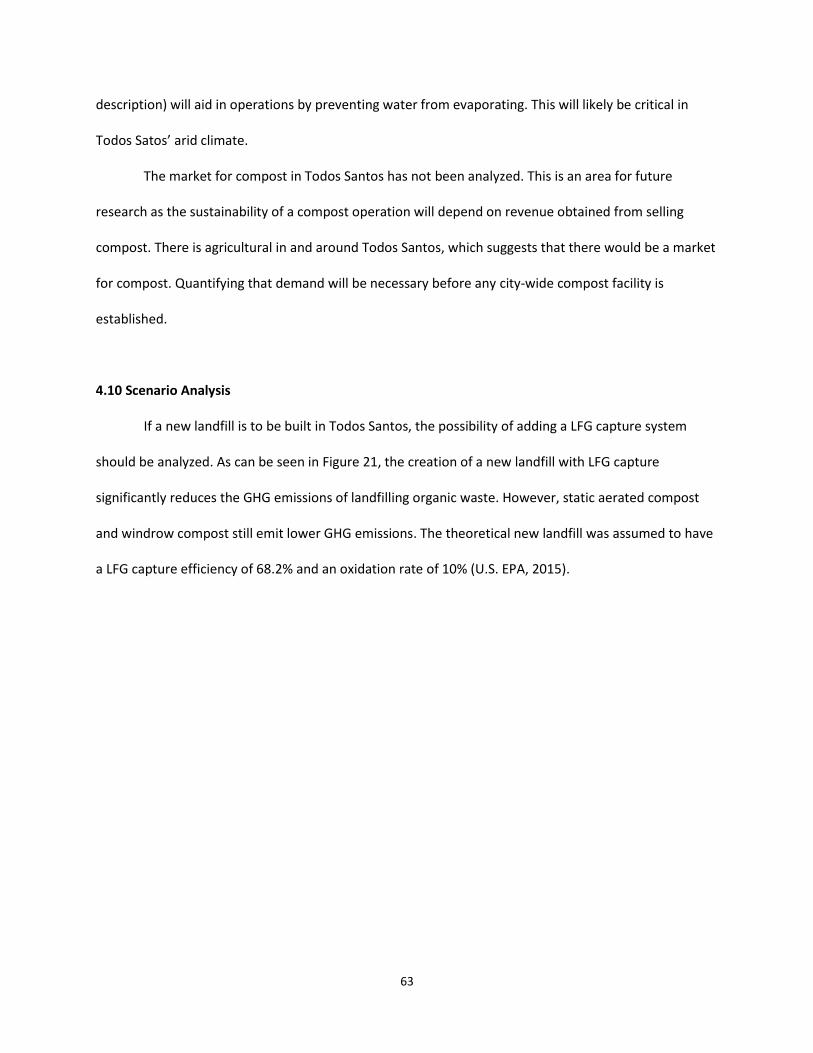
63
description) will aid in operations by preventing water from evaporating. This will likely be critical in
Todos “atos’ a id li ate.
The market for compost in Todos Santos has not been analyzed. This is an area for future
research as the sustainability of a compost operation will depend on revenue obtained from selling
compost. There is agricultural in and around Todos Santos, which suggests that there would be a market
for compost. Quantifying that demand will be necessary before any city-wide compost facility is
established.
4.10 Scenario Analysis
If a new landfill is to be built in Todos Santos, the possibility of adding a LFG capture system
should be analyzed. As can be seen in Figure 21, the creation of a new landfill with LFG capture
significantly reduces the GHG emissions of landfilling organic waste. However, static aerated compost
and windrow compost still emit lower GHG emissions. The theoretical new landfill was assumed to have
a LFG capture efficiency of 68.2% and an oxidation rate of 10% (U.S. EPA, 2015).
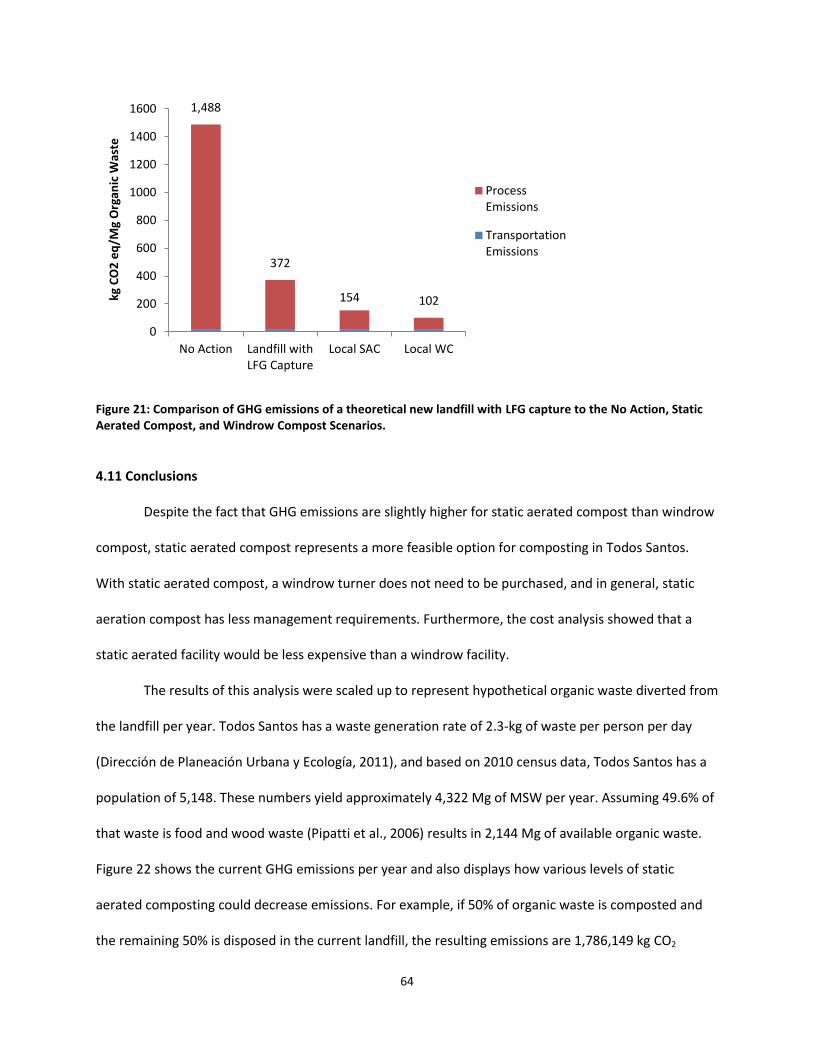
64
Figure 21: Comparison of GHG emissions of a theoretical new landfill with LFG capture to the No Action, Static
Aerated Compost, and Windrow Compost Scenarios.
4.11 Conclusions
Despite the fact that GHG emissions are slightly higher for static aerated compost than windrow
compost, static aerated compost represents a more feasible option for composting in Todos Santos.
With static aerated compost, a windrow turner does not need to be purchased, and in general, static
aeration compost has less management requirements. Furthermore, the cost analysis showed that a
static aerated facility would be less expensive than a windrow facility.
The results of this analysis were scaled up to represent hypothetical organic waste diverted from
the landfill per year. Todos Santos has a waste generation rate of 2.3-kg of waste per person per day
(Dirección de Planeación Urbana y Ecología, 2011), and based on 2010 census data, Todos Santos has a
population of 5,148. These numbers yield approximately 4,322 Mg of MSW per year. Assuming 49.6% of
that waste is food and wood waste (Pipatti et al., 2006) results in 2,144 Mg of available organic waste.
Figure 22 shows the current GHG emissions per year and also displays how various levels of static
aerated composting could decrease emissions. For example, if 50% of organic waste is composted and
the remaining 50% is disposed in the current landfill, the resulting emissions are 1,786,149 kg CO2
1,488
372
154 102
0
200
400
600
800
1000
1200
1400
1600
No Action Landfill withLFG Capture
Local SAC Local WC
kg
CO
2 e
q/M
g O
rga
nic
Wa
ste
ProcessEmissions
TransportationEmissions
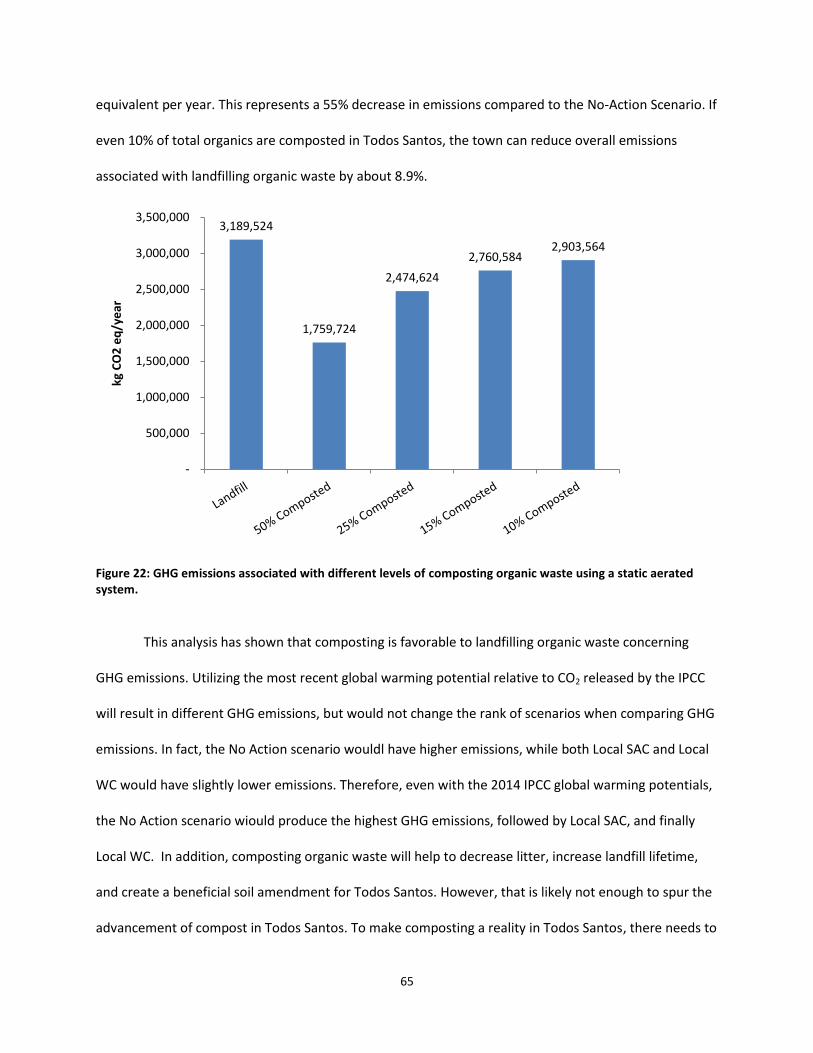
65
equivalent per year. This represents a 55% decrease in emissions compared to the No-Action Scenario. If
even 10% of total organics are composted in Todos Santos, the town can reduce overall emissions
associated with landfilling organic waste by about 8.9%.
Figure 22: GHG emissions associated with different levels of composting organic waste using a static aerated
system.
This analysis has shown that composting is favorable to landfilling organic waste concerning
GHG emissions. Utilizing the most recent global warming potential relative to CO2 released by the IPCC
will result in different GHG emissions, but would not change the rank of scenarios when comparing GHG
emissions. In fact, the No Action scenario wouldl have higher emissions, while both Local SAC and Local
WC would have slightly lower emissions. Therefore, even with the 2014 IPCC global warming potentials,
the No Action scenario wiould produce the highest GHG emissions, followed by Local SAC, and finally
Local WC. In addition, composting organic waste will help to decrease litter, increase landfill lifetime,
and create a beneficial soil amendment for Todos Santos. However, that is likely not enough to spur the
advancement of compost in Todos Santos. To make composting a reality in Todos Santos, there needs to
3,189,524
1,759,724
2,474,624
2,760,584 2,903,564
-
500,000
1,000,000
1,500,000
2,000,000
2,500,000
3,000,000
3,500,000
kg
CO
2 e
q/y
ea
r

66
financial incentives, community leadership, and political leadership. Future research is required to fully
understand the economic market for compost in Todos Santos and even the greater Baja California Sur
area. To display the potential feasibility of composting, a hotel in Pescadero (neighboring community
located 13 km from Todos Santos) has started a small, pilot-scale compost operation to manage their
own organic waste (T. Molines, personal communication, December 12, 2017). This is designed to show
political leadership that composting is a viable means of disposing of organic waste and can also
produce a useable soil amendment. The pilot project is in the early stages, but the project represents
the beginnings of a movement towards more sustainable organic waste management.
67
Chapter 5: Recycling Cost Analysis for Todos Santos
5.1 Introduction
Recycling programs not only help decrease materials being sent to the landfill and ease the
pressure on virgin materials, but can also be a source for income and local job generation. Currently,
Todos Santos has a small, grass roots recycling facility called Punto Verde (see Figure 23 for location).
The facility is operated and owned by Alex Miro and is staffed primarily with volunteers. According to
Miro, about 95% of the people that bring recyclables to Punto Verde are foreigners, while the vast
majority of the native Mexican population in Todos Santos throws away their recyclables (A. Miro,
personal communication, June 4, 2017). This culture is common in all of Baja California Sur, and
organizations throughout the region are engaged in educational campaigns to increase recycling. In the
nearby city of La Paz, there is a large-scale recycling facility that has five industrial balers and ships the
majority of their materials to Guadalajara, Mexico (Operations staff, personal communication, June 8,
2017). From there, some of the materials are re-processed (e.g., paper into toilet paper). The majority of
the materials are shipped to the U.S. and are finally recycled in China. According to staff at the La Paz
facility, the reason more materials are not processed in Mexico is due to the delicate and easily
compromised nature of recycling (e.g. contamination, impurities, etc.). In addition, governmental
regulations concerning material quality make the process expensive.

68
Figure 23: Location of Punto Verde in reference to the CSU Center and the restaurant, Jazzamango.
Punto Verde is currently a fenced off, unpaved area where various types of recyclables are
sorted and stored for future transport. As can be seen in Figure 23, Punto Verde is a small facility
compared to the CSU Center. Several obstacles, including the lengthy transportation chain and the lack
of waste management, make recycling in Todos Santos difficult. The distance between La Paz and Todos
Santos alone (84 kilometers) creates barriers in cost efficiency. However, Miro believes that the most
important way forward to create an efficient recycling program is through education. Punto Verde offers
a hands-on approach to teach local children and adults the benefits of recycling, which in his opinion is
the best way to encourage a culture change.
In order to provide an estimate of the current value of recyclables being thrown away, a cost
analysis was conducted. In addition, potential improvements in facility efficiencies, such as utilizing a
baler to increase densities of recyclables, were examined.
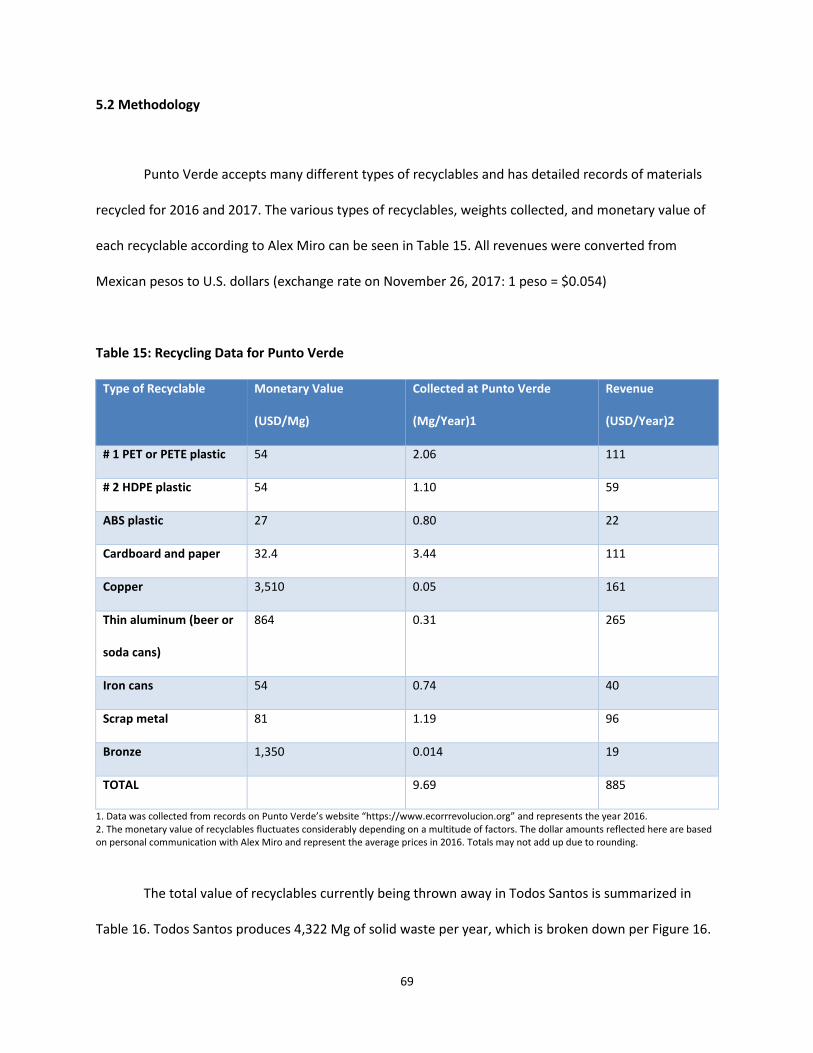
69
5.2 Methodology
Punto Verde accepts many different types of recyclables and has detailed records of materials
recycled for 2016 and 2017. The various types of recyclables, weights collected, and monetary value of
each recyclable according to Alex Miro can be seen in Table 15. All revenues were converted from
Mexican pesos to U.S. dollars (exchange rate on November 26, 2017: 1 peso = $0.054)
Table 15: Recycling Data for Punto Verde
Type of Recyclable Monetary Value
(USD/Mg)
Collected at Punto Verde
(Mg/Year)1
Revenue
(USD/Year)2
# 1 PET or PETE plastic 54 2.06 111
# 2 HDPE plastic 54 1.10 59
ABS plastic 27 0.80 22
Cardboard and paper 32.4 3.44 111
Copper 3,510 0.05 161
Thin aluminum (beer or
soda cans)
864 0.31 265
Iron cans 54 0.74 40
Scrap metal 81 1.19 96
Bronze 1,350 0.014 19
TOTAL 9.69 885
1. Data was collected from records on Punto Ve de’s e site https:// .e o e olu io .o g and represents the year 2016. 2. The monetary value of recyclables fluctuates considerably depending on a multitude of factors. The dollar amounts reflected here are based on personal communication with Alex Miro and represent the average prices in 2016. Totals may not add up due to rounding.
The total value of recyclables currently being thrown away in Todos Santos is summarized in
Table 16. Todos Santos produces 4,322 Mg of solid waste per year, which is broken down per Figure 16.
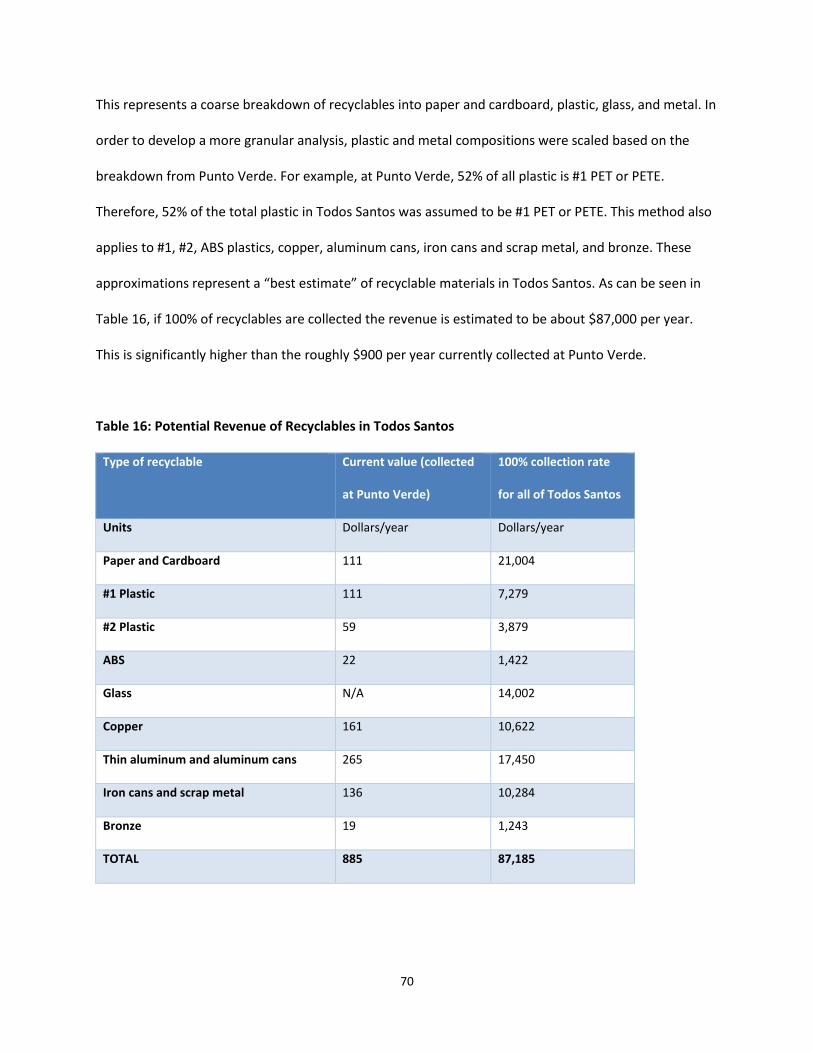
70
This represents a coarse breakdown of recyclables into paper and cardboard, plastic, glass, and metal. In
order to develop a more granular analysis, plastic and metal compositions were scaled based on the
breakdown from Punto Verde. For example, at Punto Verde, 52% of all plastic is #1 PET or PETE.
Therefore, 52% of the total plastic in Todos Santos was assumed to be #1 PET or PETE. This method also
applies to #1, #2, ABS plastics, copper, aluminum cans, iron cans and scrap metal, and bronze. These
app o i atio s ep ese t a est esti ate of e la le ate ials i Todos “a tos. As can be seen in
Table 16, if 100% of recyclables are collected the revenue is estimated to be about $87,000 per year.
This is significantly higher than the roughly $900 per year currently collected at Punto Verde.
Table 16: Potential Revenue of Recyclables in Todos Santos
Type of recyclable Current value (collected
at Punto Verde)
100% collection rate
for all of Todos Santos
Units Dollars/year Dollars/year
Paper and Cardboard 111 21,004
#1 Plastic 111 7,279
#2 Plastic 59 3,879
ABS 22 1,422
Glass N/A 14,002
Copper 161 10,622
Thin aluminum and aluminum cans 265 17,450
Iron cans and scrap metal 136 10,284
Bronze 19 1,243
TOTAL 885 87,185
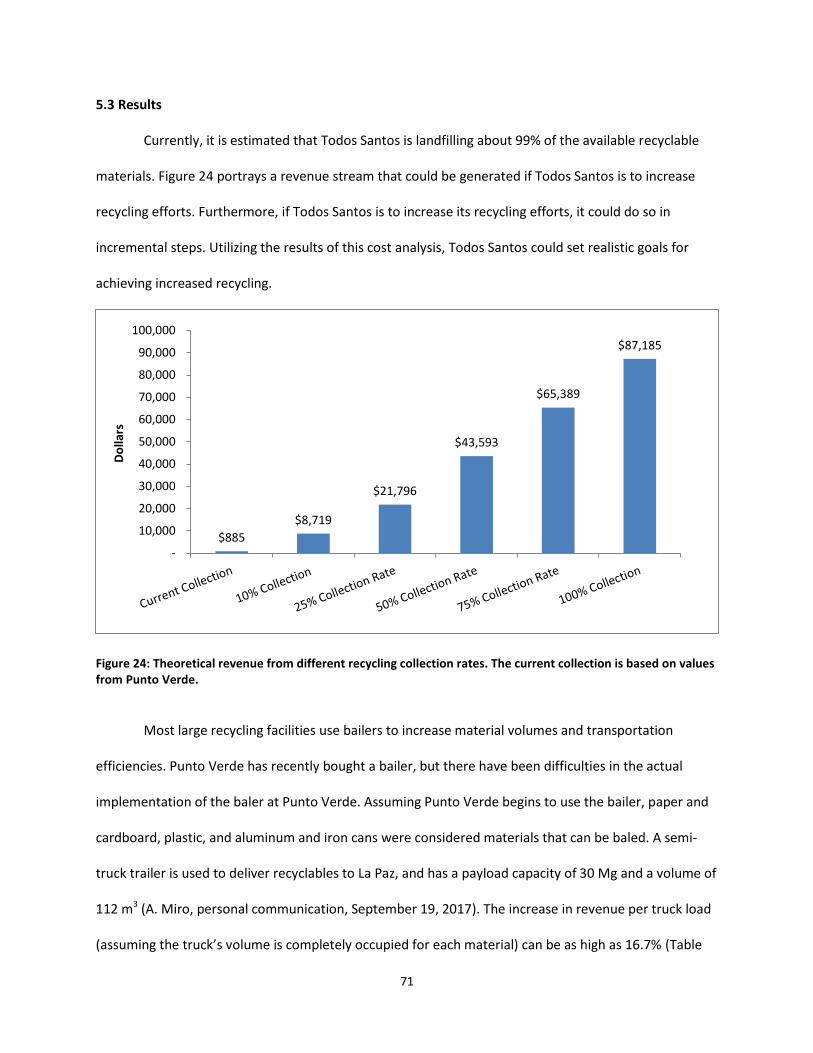
71
5.3 Results
Currently, it is estimated that Todos Santos is landfilling about 99% of the available recyclable
materials. Figure 24 portrays a revenue stream that could be generated if Todos Santos is to increase
recycling efforts. Furthermore, if Todos Santos is to increase its recycling efforts, it could do so in
incremental steps. Utilizing the results of this cost analysis, Todos Santos could set realistic goals for
achieving increased recycling.
Figure 24: Theoretical revenue from different recycling collection rates. The current collection is based on values
from Punto Verde.
Most large recycling facilities use bailers to increase material volumes and transportation
efficiencies. Punto Verde has recently bought a bailer, but there have been difficulties in the actual
implementation of the baler at Punto Verde. Assuming Punto Verde begins to use the bailer, paper and
cardboard, plastic, and aluminum and iron cans were considered materials that can be baled. A semi-
truck trailer is used to deliver recyclables to La Paz, and has a payload capacity of 30 Mg and a volume of
112 m3 (A. Miro, personal communication, September 19, 2017). The increase in revenue per truck load
(assuming the tru k’s olu e is o pletel o upied fo ea h ate ial a e as high as . % (Table
$885
$8,719
$21,796
$43,593
$65,389
$87,185
-
10,000
20,000
30,000
40,000
50,000
60,000
70,000
80,000
90,000
100,000
Do
lla
rs

72
17). In some cases, when the truck is fully loaded, the weight of some materials such as paper and
cardboard, #1 plastic, and iron/tin cans exceeded the 30 Mg payload of the truck. In such instances the
truck was assumed to only be loaded to 30 Mg.
Table 17: Revenue Comparison for Baling of Recyclables1
Material Revenue with Baler (dollars/truck load) Revenue without baler
(dollars/truck load)
Increased
Revenue
Factor
from
Using
Baler
Paper and Cardboard 972.0 441.3 2.2
#1 1620.0 107.6 15.0
#2 1435.3 86.1 16.7
ABS 717.6 89.7 8.0
Aluminum cans 14352.5 2870.5 5.0
Iron/tin cans 1620.0 538.2 3.0
1. Density values for materials that are loose vs. baled are taken from the EPA (United States Environmental Protection Agency, 1997)
5.4 Conclusion
The results of this analysis show that there is a market and possible revenue stream to support
recycling efforts in Todos Santos. Table 16 shows that only small fractions of the recyclables in Todos
Santos are collected at Punto Verde. Recycling collection policies either at a governmental or community
level could allow for incremental increases in collection rates. However, there are many obstacles to
overcome. Some are tangible obstacles such as lack of governmental support and lack of financial
73
incentives. Other obstacles are harder to quantify such as a general lack of community culture
surrounding recycling. For Punto Verde specifically, the current recyclable collection rates are not high
enough to make the facility viable. Students at Colorado State University majoring in the Department of
Design and Merchandising are currently working with Punto Verde to develop more awareness among
the community. The main goals of this effort are to create educational billboards that can be placed
around Todos Santos, develop a better work environment (e.g., bathroom, shade, etc.), and work with
Punto Verde to develop the most streamlined collection and sorting operation possible. The recent
addition of a baler is a possible way to increase revenue streams and make Punto Verde more financially
sustainable.
When comparing recycling in Todos Santos to Fort Collins, the differences are stark. However,
the success of recycling operations in Fort Collins is relatively new, and took years to foster. Some
factors that led to the current success include strong leadership by City officials and education programs
for residents, businesses, and even visitors (Zero Waste Associates, 2013). City staff have remarked that
the feel the uestio a o g the ajo it of eside ts a d usi esses i Fo t Colli s is o lo ge h
should I e le? ut i stead ho should I e le? Achieving this same shift in Todos Santos will
likely be even more challenging than for Fort Collins due to lack of political leadership, but
collaborations between community leaders, universities, and volunteer organizations will help push the
overall movement forward.
74
Chapter 6: Summary and Conclusions
A carbon footprint analysis of different organic waste management strategies was conducted for
Fort Collins, Colorado, USA and Todos Santos, Baja California Sur, Mexico. Fort Collins is an
environmentally progressive town that has the financial means to implement expensive organic waste
management alternatives to landfilling. Todos Santos faces barriers for organic waste management due
to economics and cultural attitudes. Both of the carbon footprint analyses used life cycle assessment
methodologies to predict GHG emissions of various organic waste management scenarios. While these
scenarios differed between Fort Collins and Todos Santos, it was found that landfilling organic waste
produced the highest GHG emissions for both towns.
In Fort Collins, Scenario AD 1 was found to produce the least GHG emissions (130.7 kg CO2
equivalents/functional unit), followed by Scenario AD 2 (168.8 kg CO2 equivalents/functional unit),
Scenario Regional Compost with TS (197.1 kg CO2 equivalents/functional unit), Scenario Regional
Compost without TS (249.8 kg CO2 equivalents/functional unit), and finally the No Action Scenario, which
produced the most GHG emissions (780.4 197.1 kg CO2 equivalents/functional unit). The AD 1 scenario
generated the least amount of GHG emissions due to the net negative emissions of the anaerobic
digestion process and the utilization of transfer station to transport the remainder of the organic waste
to a regional compost facility. In addition, a transfer station will always reduce overall GHG emissions
when compared to a similar process scenario. For example, AD 1 and AD 2 have the same process
emissions, but AD1 has a much lower transportation emission (Figure 13). This is mainly due to the fact
that Fort Collins has three waste haulers, so combining organic waste at a transfer station, and only
using one truck to transport waste will always decrease emissions.
While the AD 1 Scenario produced the lowest GHG emissions of all scenarios, the actual
implementation of this scenario is very complicated. Engineering modifications to heat exchangers,
75
pipes, pumps, etc. will need to be conducted in order to accommodate both increased food waste and a
co-generation system. In addition, policy decisions regarding food waste collection participation rates
and fees will need to be addressed in order to ensure a steady stream of food waste. Nevertheless, this
analysis has shown that the AD 1 Scenario is the most environmentally favorable option (with regards to
GHG emissions) and should be explored further to help the City meet its GHG reduction goals.
Generally speaking, an important discovery of this study was that if Fort Collins sends 100% of
its waste to Larimer County Landfill instead of splitting it between North Weld Landfill, GHG emissions
for the landfill decrease by about 69% (see Figure 14). This result illuminates the fact that in Fort Collins,
a landfill with an LFG captures system produces similar, and in this case lower, GHG emissions to the
Regional Compost without TS Scenario. The comparable emissions can be attributed to the high
transportation emissions associated with the Regional Compost without TS Scenario. The process
emissions for windrow composting organic waste are lower than landfilling with a LFG capture system,
but the geographic distances and waste collection methods in Fort Collins display the importance of
transportation in this carbon footprint analysis.
In Todos Santos, the carbon footprint analysis found that windrow composting produces the
least GHG emissions. Landfilling organic waste produces 10 times more GHG emissions than either static
aerated compost or windrow compost, due to the lack of any LFG capture system. Static aerated
composting was found to produce more N2O and CH4 emissions than windrow composing, which due to
the large CO2 equivalents of CH4 and N2O, results in higher GHG emissio s. U like the Fo t Colli s’
carbon footprint, transportation does not play a key role in the Todos Santos analysis, as transportation
distances were assumed to be the same for all scenarios. However, this assumption could change
depending on a multitude of variables including available land, partnerships between towns, etc.
The IPCC 2007 global warming potentials for CH4 and N2O have been updated as of 2014.
Methane has been updated to a CO2 factor of 28 and N2O a CO2 factor of 265 (IPCC, 2014). The IPCC

76
2007 values were utilized for this study, however using the 2014 potentials would not change the
ordinal ranking of scenarios. For Fort Collins, the No Action scenario will still produce the highest GHG
emissions, followed by AD 1, AD2, Regional Compost with TS, and finally Regional Compost without TS
regardless of whether the 2007 or 2014 global warming potentials are used. For Todos Santos, the No
Action scenario will similarly produce the highest GHG emissions, followed by Local SAC, and Local WC
produced the least GHG emissions, again irrespective of 2007 or 2014 global warming potentials.
The capital cost analysis of windrow versus static aerated compost facilities showed that a
windrow facility is about 1.5 times more expensive than a static aerated facility, due primarily to the
heavy equipment needed for windrow composting. Operation and maintenance requirements were not
analyzed for windrow or static aerated composting. It is hypothesized that a simple static aerated
compost facility will be easier to operate than a windrow facility, primarily due to the decreased
necessity of organic waste turning. However a thorough operations cost analysis should be conducted
for composting in Todos Santos. Despite the slightly higher GHG emissions that occur with windrow
compost, the lower capital cost of static aerated compost make it a more feasible option.
A critical future area of study is an analysis of the current market for compost, i.e. demand,
revenue streams, etc. It is hypothesized that due to the current agricultural areas within Todos Santos,
there is the potential demand for compost, but this would need to be confirmed. Furthermore, the
actual collection of organic waste is a complicated issue that would require further analysis. In order to
assure that there is a steady stream of organic waste available for compost, there would need to be a
dedicated collection service. Collection could be via municipality or independent entrepreneurs.
Recycling in Todos Santos is in its infancy stages, but has the potential to grow if community and
government leaders can change existing cultural attitudes. This analysis has shown that only about 1% of
the recyclables in Todos Santos are collected (Figure 24. In addition, in Todos Santos, there is an
estimated $87,000 of recyclables produced per year. While it is unlikely to collect the full value of the

77
available recyclables, small steps can be taken to incrementally increase recycling in Todos Santos.
Similar to compost in Todos Santos, the financial logistics of recycling need to be considered to produce
long lasting impacts. Through increased education, stakeholder leadership, and support from local
government, incremental goals for sustainable waste management can be set and achieved.
The social aspects of sustainable waste management are usually more qualitative in nature, but
equally important to address. Fort Collins and Todos Santos both require community participation to
create a culture of sustainable waste management, be it organics or recyclables. Fort Collins has
developed a strong practice of recycling and landfill diversion, while Todos Santos struggles with open
dumping, disposal of garbage in natural areas, and lack of recycling. However, the culture in Fort Collins
took time to develop, and was promoted through education, stakeholder leadership, and support from
local government. Utilizing similar methods, Todos Santos can set incremental goals to compost organic
waste and increase recycling rates.
Regardless of a it ’s e o o i , e i o e tal, o so ial ethi s, it is i po ta t to o side lo al
waste management conditions that may impact transportation, feasible technologies, and stakeholder
support. These local conditions were addressed before alternative solutions were created for Fort
Collins and Todos Santos. Once feasible scenarios for organic waste diversion were identified, a carbon
footprint analysis utilizing LCA methodology produced a holistic, comparative assessment that
highlighted best organic management options for reducing GHG emissions in each city. Disposing of
organic waste in landfills without LFG capture was the primary reason the landfilling scenarios produced
the most GHG emissions for both Todos Santos and Fort Collins. In addition, the cost assessment of
compost techniques conducted for Todos Santos showed that static aeration would be less expensive to
implement than windrow compost. The recycling cost analysis illuminated that about 99% of the
recyclables in Todos Santos are currently being disposed of in the open dump. This represents a lost
78
opportunity for Todos Santos in the form of revenue, potential job creation, and an improved
aesthetics/green connotation of Todos Santos.
Next Steps for Fort Collins
It is recommended that the City of Fort Collins conduct an analysis on the feasibility of both food
waste and organic waste collection. When and if the City decides to move forward on organic waste
diversion, collection will likely need to incorporate both residential and commercial sources. This will
translate to increased costs for both collectors and customers. Furthermore, Fort Collins should analyze
the possible tradeoffs between building a transfer station to transport organic waste and building their
own local compost facility. A local compost facility would decrease GHG emissions associated with
transporting organic waste regionally, but the land acquisition and permitting of compost facilities is
often difficult.
Next Steps for Todos Santos
Fort Collins has a large amount of both accurate and granular data surrounding solid waste
composition. This data is extremely useful when comparing both GHG emissions and cost for different
solid waste disposal options. Todos Santos would benefit from a comprehensive waste audit to
determine actual waste composition, as opposed to the best estimates used in this analysis.
In addition, the results of this analysis have shown that the current organics in Todos Santos
could support either a windrow or static aerated compost facility. However, a market analysis of
compost demand in the Todos Santos or even the Baja California Sur area would provide crucial
information regarding the financial logistic of large scale compost facilities. If a market analysis is
conducted and reveals there is not enough demand for compost in Todos Santos, efforts can still be
undertaken to promote small scale local composting that can be used on farms or even small residential
79
gardens. Moreover, collection of organic waste should be planned and handled either by the
municipality or by an independent business/entrepreneur.
Efforts to increase recycling rates in Todos Santos should continue. Figure 24 shows different
levels of revenue from recyclables, and should be utilized as a template to set incremental recycling
goals. Also, increased education campaigns and potential partnerships with neighboring cities should be
highlighted to help decrease the costs associated with transporting recyclable materials.
There has been continued description of fires and air pollution at the Todos Santos landfill while
writing this thesis. A proper analysis of the existing landfill should be conducted to highlight
improvements that can be done in the near term. If a new landfill is going to be built in the future, a plan
for landfill cover, gas collection, and other maintenance should be conducted.
The long term success of any waste management program will depend on the participation of
the local community. To promote recycling and compost initiatives, continuous and well organized
events should be held to educate and foster interest from the community. The goal of these events
should be to not only display different methods of solid waste management, but to also explain why a
change in historical practices could be advantageous. Local media such as papers or brochures should be
utilized to help spread information whenever possible. In addition, it is important that the community
perceives how they will directly benefit from increased compost and recycling. In smaller cities such as
Todos Santos, creative incentives should be offered to citizens for participating in new waste
management programs. For example, if a citizen transports or signs up for an organic waste collection
service, they could receive a discount when purchasing the finished compost. Financial or other forms of
incentives will help to develop a community culture that is not only interested in sustainable waste
management, but will also take pride in it.

80
References
Adhikari, B. K., Barrington, S., Martinez, J., & King, S. (2009). Effectiveness of three bulking agents for
food waste composting. Waste Management, 29(1), 197–203.
https://doi.org/10.1016/j.wasman.2008.04.001
Andersen, J. K., Boldrin, A., Christensen, T. H., & Scheutz, C. (2010). Mass balances and life-cycle
inventory for a garden waste windrow composting plant (Aarhus, Denmark). Waste Management
& Resear h : The Jour al of the I ter atio al Solid Wastes a d Pu li Clea si g Asso iatio , ISWA,
28(11), 1010–1020. https://doi.org/10.1177/0734242X10360216
Aye, L., & Widjaya, E. R. (2006). Environmental and economic analyses of waste disposal options for
traditional markets in Indonesia. Waste Management, 26(10), 1180–1191.
https://doi.org/10.1016/j.wasman.2005.09.010
Banar, M., Cokaygil, Z., & Ozkan, A. (2009). Life cycle assessment of solid waste management options for
Eskisehir, Turkey. Waste Management, 29(1), 54–62.
https://doi.org/10.1016/j.wasman.2007.12.006
Basu to, D., & “oza, R. . Me i o’s fede al aste egulatio s: A o e ie . EM: Air and Waste
Ma age e t Asso iatio ’s Magazi e for E iro e tal Ma agers, (JAN.), 6–9. Retrieved from
http://pubs.awma.org/gsearch/em/2007/1/basurto.pdf
Boldrin, A. et. (2009). Composting and compost utilization: Accounting of greenhouse gases and global
warming contributions. Waste Management & Research, 27, 800–812.
Brandão, M., Levasseur, A., Ki s h au , M. U. F., Weide a, B. P., Co ie, A. L., Jø ge se , “. V., …
Chomkhamsri, K. (2013). Key issues and options in accounting for carbon sequestration and
temporary storage in life cycle assessment and carbon footprinting. The International Journal of
Life Cycle Assessment, 18(1), 230–240. https://doi.org/10.1007/s11367-012-0451-6

81
Brander, M., Tipper, R., Hutchison, C., & Davis, G. (2008). Consequential and attributional approaches to
LCA: a Guide to policy makers with specific reference to greenhouse gas LCA of biofuels.
Econometrica Press, 44(April), 1–14. Retrieved from
http://onlinelibrary.wiley.com/doi/10.1002/cbdv.200490137/abstract%5Cnhttp://www.globalbioe
nergy.org/uploads/media/0804_Ecometrica_-
_Consequential_and_attributional_approaches_to_LCA.pdf%5Cnhttp://d3u3pjcknor73l.cloudfront.
net/assets/media/pdf/approachest
Brown, S., Beecher, N., & Carpenter, A. (2010). Calculator tool for determining greenhouse gas emissions
for biosolids processing and end use. Environmental Science and Technology, 44(24), 9509–9515.
https://doi.org/10.1021/es101210k
Buenrostro, O., & Bocco, G. (2003). Solid waste management in municipalities in Mexico: Goals and
perspectives. Resources, Conservation and Recycling, 39(3), 251–263.
https://doi.org/10.1016/S0921-3449(03)00031-4
Cadena, E., Colón, J., Artola, A., Sánchez, A., & Font, X. (2009). Environmental impact of two aerobic
composting technologies using life cycle assessment. International Journal of Life Cycle Assessment,
14(5), 401–410. https://doi.org/10.1007/s11367-009-0107-3
Carcasson, M. (2016). North Front Range Regional Wasteshed Planning Fall 2016 Public Forums Raw
Data Report. Retrieved from https://www.libarts.colostate.edu/cpd/wp-
content/uploads/sites/48/2017/05/wasteshed-forums-f16-raw-data-report-.pdf
Chen, T.-C., & Lin, C.-F. (2008). Greenhouse gases emissions from waste management practices using
Life Cycle Inventory model. Journal of Hazardous Materials, 155(1–2), 23–31.
https://doi.org/10.1016/j.jhazmat.2007.11.050
City of Fort Collins. (2015). Fort Collins 2015 Climate Action Plan Framework.
Clift, R., Doig, A., & Finnveden, G. (2000). The Application of Life Cycle Assessment to Integrated Solid

82
Waste Management. Trans IChemE, 78(4), 279–287. https://doi.org/10.1205/095758200530790
Composting Council of Canada. (2010). Composting Processing Technologies, 4769(416), 15.
Curran, M. A. (2016). Overview of Goal and Scope Definition in Life Cycle Assessment. Springer,
Dordrecht. Retrieved from https://link.springer.com/chapter/10.1007/978-94-024-0855-3_1
Di Bella, G., Di Trapani, D., & Viviani, G. (2011). Evaluation of methane emissions from Palermo
municipal landfill: Comparison between field measurements and models. Waste Management,
31(8), 1820–1826. https://doi.org/10.1016/j.wasman.2011.03.013
Dirección de Planeación Urbana y Ecología. (2011). Programa Estatal para la Prevención y Gestión
Integral de Residuos para el Estado de Baja California Sur.
EPA. (2002). What Is Integrated Solid Waste Management? United States, 6.
https://doi.org/10.1002/9780470999677
Fort Collins Population. (2016). Retrieved from http://worldpopulationreview.com/us-cities/fort-collins-
population/
Galgani, P., van der Voet, E., & Korevaar, G. (2014). Composting, anaerobic digestion and biochar
production in Ghana. Environmental-economic assessment in the context of voluntary carbon
markets. Waste Management, 34(12), 2454–2465. https://doi.org/10.1016/j.wasman.2014.07.027
Guo, M., & Murphy, R. J. (2012). LCA data quality: Sensitivity and uncertainty analysis. Science of the
Total Environment, 435–436, 230–243. https://doi.org/10.1016/j.scitotenv.2012.07.006
IPCC. (2007). Climate Change 2007: The Physical Science Basis. Cambridge University Press.
https://doi.org/10.1017/CBO9781107415324.004
IPCC. (2014). Summary for Policymakers. Climate Change 2014: Synthesis Report. Contribution of
Working Groups I, II and III to the Fifth Assessment Report of the Intergovernmental Panel on
Climate Change. https://doi.org/10.1017/CBO9781107415324
Komilis, D. P., & Ham, R. K. (2004). Life-Cycle Inventory of Municipal Solid Waste and Yard Waste
83
Windrow Composting in the United States. Journal of Environmental Engineering, 11(130), 1390–
1400. https://doi.org/10.1061/(ASCE)0733-9372(2004)130:11(1390)
Laurent, A., Bakas, I., Clavreul, J., Bernstad, A., Nie o, M., Ge til, E., … Ch iste se , T. H. . Re ie
of LCA studies of solid waste management systems - Part I: Lessons learned and perspectives.
Waste Management, 34(3), 573–588. https://doi.org/10.1016/j.wasman.2013.10.045
Levis, J. W., & Barlaz, M. (2013). Composting Process Model Documentation, (September), 1–44.
Retrieved from http://www4.ncsu.edu/~jwlevis/AD.pdf
Martínez-Blanco, J., Colón, J., Gabarrell, X., Font, X., Sánchez, A., Artola, A., & Rieradevall, J. (2010). The
use of life cycle assessment for the comparison of biowaste composting at home and full scale.
Waste Management, 30(6), 983–994. https://doi.org/10.1016/j.wasman.2010.02.023
Medina, M. (2000). Scavenger cooperatives in Asia and Latin America. Global Development Network.
Resources, Conservation and Recycling, 31, 51–69.
Mendenhall, W., Beaver, R. J., & Beaver, B. M. (2012). Introduction to Probability and Statistics (14th
ed.). Cengage Learning.
Metz, B., Kuijpe s, L., “olo o , “., A de se , “. O., Da idso , O., Po s, J., … Me er, L. (2005).
Safeguarding the Ozone Layer and the Global Climate System.
Moberg, Å., Finnveden, G., Johansson, J., & Lind, P. (2005). Life cycle assessment of energy from solid
waste - Part 2: Landfilling compared to other treatment methods. Journal of Cleaner Production,
13(3), 231–240. https://doi.org/10.1016/j.jclepro.2004.02.025
Parry, D. L. (2012). Sustainable Food Waste Evaluation. Retrieved from
http://search.ebscohost.com.subzero.lib.uoguelph.ca/login.aspx?direct=true&db=nlebk&AN=6051
85&site=ehost-live&scope=site
PE Americas. (2011). Life Cycle Assessment of Systems for the Management and Disposal of Food Waste,
(November 2010), 130.
84
Pickering, K., Campbell, M., Kita, K., Straatmann, D., Castro, A., Rodriguez, F., & Purdy, A. (2015). Todos
Santos Community Assessment. Todos Santos. Retrieved from
https://webcms.colostate.edu/todos-santos-new/media/sites/104/2016/05/Todos-Santos-
Community-Assesment-Report-2015.pdf
Pipatti, R., “ha a, C., Ya ada, M., Al es, J. W. “., Gao, Q., Gue dehou, G. H. “., … Vieira, S. M. M.
(2006). Waste Generation, Composition and Management Data 2006 IPCC Guidelines for National
Greenhouse Gas Inventories. ICPP Guidelines for National Greenhouse Gas Inventories, 5, 23.
Retrieved from http://www.ipcc-
nggip.iges.or.jp/public/2006gl/pdf/5_Volume5/V5_2_Ch2_Waste_Data.pdf
R3 Consulting Group, I. (2016). Regional Wasteshed Planning ( North Front Range ) Final Report.
Retrieved from
https://www.colorado.gov/pacific/sites/default/files/DEHS_RREO_FY16Report_Fort Collins.pdf
Rebitzer, G., Ek all, T., F is hk e ht, R., Hu kele , D., No is, G., R d e g, T., … Pe i gto , D. W. .
Life cycle assessment Part 1: Framework, goal and scope definition, inventory analysis, and
applications. Environment International, 30(5), 701–720.
https://doi.org/10.1016/j.envint.2003.11.005
Richard, T., & Trautmann, N. (1996). C/N Ratio. Retrieved August 1, 2018, from
http://compost.css.cornell.edu/calc/cn_ratio.html
Saer, A., Lansing, S., Davitt, N. H., & Graves, R. E. (2013). Life cycle assessment of a food waste
composting system: Environmental impact hotspots. Journal of Cleaner Production, 52, 234–244.
https://doi.org/10.1016/j.jclepro.2013.03.022
Santin, R. (2013). Life Cycle Assessment of Alternatives for Organic Fraction of Municipal Solid Waste
Ma age e t i Fort Colli s aster’s thesis . Colorado State University.
Sharma, G., & Campbell, a. (2007). Life cycle inventory and life cycle assessment for windrow
85
composting systems. Re y led Orga i s U it, U i ersity of Ne South …, 171. Retrieved from
http://scholar.google.com/scholar?hl=en&btnG=Search&q=intitle:Life+Cycle+Inventory+and+Life+
Cycle+Assessment+for+Windrow+Composting+Systems#2%5Cnhttp://scholar.google.com/scholar?
hl=en&btnG=Search&q=intitle:Life+cycle+inventory+and+life+cycle+assessment+f
SloanVasquezMcAfee. (2016). Waste Composition and Characterization Analysis City of Fort Collins ,
Colorado, (November).
Sosnowski, P., Wieczorek, A., & Ledakowicz, S. (2003). Anaerobic co-digestion of sewage sludge and
organic fraction of municipal solid wastes. Advances in Environmental Research, 7(3), 609–616.
https://doi.org/10.1016/S1093-0191(02)00049-7
U.S. Environmental Protection Agency. (2015). A Summary of the GHG Implications of Composting.
Retrieved from https://www3.epa.gov/warm/pdfs/Composting.pdf
U.S. Environmental Protection Agency. (2016). Documentation for Greenhouse Gas Emission and Energy
Factors Used in the Waste Reduction Model ( WARM ), (March).
U.S. EPA. (2015). A Summary of the GHG Implications of Landfilling. Waste Reduction Model, 13, 1–26.
Retrieved from https://www3.epa.gov/warm/pdfs/Landfilling.pdf
United Nations. (2011). Municipal Solid Waste Management. Turning Waste into Resources. Shanghai
Manual – A Guide for Sustainable Urban Development in the 21st Century, (2010), 1–36.
United Nations. (2014). World Urbanization Prospects 2014. Demographic Research, 32.
https://doi.org/(ST/ESA/SER.A/366)
United States Environmental Protection Agency. (1995). Inventory of U.S. Greenhouse Gas Emissions and
Sinks: 1990-1994. Retrieved from
https://nepis.epa.gov/Exe/ZyNET.exe/40000LXO.TXT?ZyActionD=ZyDocument&Client=EPA&Index=
1995+Thru+1999&Docs=&Query=&Time=&EndTime=&SearchMethod=1&TocRestrict=n&Toc=&Toc
Entry=&QField=&QFieldYear=&QFieldMonth=&QFieldDay=&IntQFieldOp=0&ExtQFieldOp=0&XmlQ
86
uery=
United States Environmental Protection Agency. (1997). Measuring Recycling A Guide for State and Local
Governments. Washingto, DC. Retrieved from
https://nepis.epa.gov/Exe/ZyNET.exe/100011CF.TXT?ZyActionD=ZyDocument&Client=EPA&Index=
1995+Thru+1999&Docs=&Query=&Time=&EndTime=&SearchMethod=1&TocRestrict=n&Toc=&Toc
Entry=&QField=&QFieldYear=&QFieldMonth=&QFieldDay=&IntQFieldOp=0&ExtQFieldOp=0&XmlQ
uery=
United States Environmental Protection Agency. (2017). Sustainable Materials Management: Non-
Hazardous Materials and Waste Management Hierarchy. Retrieved from
https://www.epa.gov/smm/sustainable-materials-management-non-hazardous-materials-and-
waste-management-hierarchy
US Environmental Protection Agency. (2012). Municipal Guide for Comprehensive Management of E
waste in the Northeast of Mexico. Retrieved from
https://www.epa.gov/sites/production/files/documents/municipal-guide-ewaste-2012-02-
english.pdf
van Haaren, R., Themelis, N. J., & Barlaz, M. (2010). LCA comparison of windrow composting of yard
wastes with use as alternative daily cover (ADC). Waste Management, 30(12), 2649–2656.
https://doi.org/10.1016/j.wasman.2010.06.007
Verdugo, P., & Claudia, B. (2016). Diagnóstico de la Gestión Integral de los residuos sólidos urbanos para
el Municipio de La Paz , Baja (Vol. 52).
W.L Gore & Associated, I. (n.d.). GORE Cover For Organic Waste Treatment. Retrieved September 1,
2018, from https://www.gore.com/resources/gore-cover-for-biosolids-
composting?from=%5B%22content_type%3A321%22%2C%22language%3Aen%22%5D
Waste Management. (2016). North Weld Landfill. Retrieved from

87
https://www.wmsolutions.com/pdf/factsheet/North_Weld_Landfill_Fact_Sheet.pdf
World Bank. (2012). What a Waste: A Global Review of Solid Waste Management. Urban Development
Series, 3–116. Retrieved from www.worldbank.org/urban
Zero Waste Associates. (2013). Road to Zero Waste Plan. City of Fort Collins, Colorado. Retrieved from
http://www.fcgov.com/recycling/pdf/RZW_Report_Jan2014.pdf
88
Appendix A: Food Waste Material Flow Analysis Report
Introduction
Food waste in the United States is a complicated issue to understand, and harder still to mitigate.
According to the United States Environmental Protection Agency (EPA), food waste is the second largest
category of municipal solid waste (MSW) sent to landfills in the United States and makes up about 14.6
percent of the total waste stream (EPA, 2015), as shown in Figure 1. Furthermore, it is estimated that 31
percent of the edible and available food supply at the retail and consumer level goes uneaten (Buzby et
al., 2014). There are obvious restraints and difficulties to reducing food waste due the nature of food
itself, i.e. spoilage, supply and demand, shipping, etc. Opportunities still exist for waste reduction and
waste-to-energy technologies. In order to identify opportunities for food waste diversion and reduction,
a Material Flow Analysis (MFA) was conducted to better understand the food waste streams in Fort
Collins, Colorado. MFA is an analytical way to quantify flows and stocks of materials through a defined
geographical area and over a set period of time. In this case the geographical area was Fort Collins,
Colorado and the time frame was one year. MFA is a useful tool because it helps to reduce the
complexity of the system while still providing a basis for sound decision making. It also assists in
establishing priorities regarding environmental protection, resource conservation, and especially waste
management. When used in conjunction with tools such as Life Cycle Analysis, the results can yield
waste streams with associated environmental impacts. This is an area for future study.

89
Figure 25. Total MSW Generation (By Material), 2013.
A useful first step in understanding food waste within a complicated system, such as a city, is creating a
MFA that details the flows and stocks within that system. This MFA was conducted for the entire year of
2014 and the system boundary was the city of Fort Collins, Colorado. The various flows that occur, i.e. to
grocery stores, restaurants, residents, etc. are important to understand because they illuminate the
highest contributors to food waste. Data is represented in mass, and due to the law of conservation of
mass, inputs should in theory equal outputs (see Figure 2). A full mass balance is difficult to conduct
since human consumption, decomposition, and other factors make balancing the flows extremely
diffi ult. Ho e e , MFA se es as a useful tool to gai a i d’s e e ie of he e the a ious ua tities
of food waste are originating and how it is being disposed of.

90
Figure 26. Generic Example of a Material Flow Analysis.
Due to the limited lifespan left at the Larimer County Landfill, there is a need to identify opportunities
for material diversion. Food waste is a strong candidate due to the embodied energy within food which
can be used for industrial uses. Diverting food waste from the landfill not only increases the landfill
lifespan, but can also be a source of renewable energy.
Figure 27. EPA Food Recovery Hierarch.
91
Goal of the Study
The goal of this study is to provide quality information for decision makers about the flow of food and
food waste in and out the city of Fort Collins, as well as the associated impacts of disposal methods, by:
Systematically estimating how much food moves through the community, organized by sector
and disposal method.
Offering insight into the highest and best use for organic, non-ligneous waste material (i.e. food
scraps).
Highlighting potential public and private partnerships.
Sparking future research into the material management of organics.
Acronyms and Definitions
Food Loss – The a ou t of edi le food, postha est, that is a aila le fo hu a o su ptio ut is ot
consumed for any reason. It includes cooking loss and natural shrinkage (e.g., moisture loss); loss from
old, pests, o i ade uate li ate o t ol; a d plate aste Buz , .
Food Waste – A o po e t of food loss a d o u s he a edi le ite goes u o su ed, such as
food discarded by retailers due to undesirable color or blemishes and plate waste discarded by
o su e s (Buzby et al., 2014).
MFA - Mate ial Flo A al sis: a ap ua tif i g the flo of ate ials i a defi ed situatio a d o e a
set period of time. The software used to conduct a MFA for food in Fort Collins is STAN (SubSTance flow
ANalysis) and was developed by the University of Vienna in Austria.

92
MSW - Municipal Solid Waste
Methodology:
Food Input Estimation Methodology:
Data from the United States Department of Agriculture (USDA) was utilized to calculate total food
supply. According to the USDA study 1,388 pounds of food was available per capita in 2010 (Buzby et al.,
2014). This number was converted to tons and multiplied by the population of Fort Collins in 2014
(156,480 people) to estimate total food input. This yielded a total amount of 108,597 tons of available
food per year.
Food Waste Estimation Methodology
The results of this study were calculated using a 2014 City of Fort Collins business database that included
business name, North American Industry Classification System (NAICS) code, and number of employees
(based on total employees as opposed to full-time employees). The database was further sorted to only
include businesses with a food retail license. This resulted in a database containing 580 businesses.
The California Department of Resources Recycling and Recovery commissioned an extensive study
conducted by Cascadia Consulting Group. This study broke down waste generation rates for businesses
on a per employee per year basis using NAICS codes (Cascadia Consulting Group, 2015). Equation 1
displays a generic version of the California method formula.
93
Food Waste/year= �� × � × � (1)
We= tons of waste per employee per year according to specific NAICS (based on total employees)
Ne= Number of employees
Fw= Percentage of food waste out of total waste (based on total employees and NAICS number)
This method was useful for the Fort Collins project because it included all relevant businesses as well as
provided a means of calculating food waste based on data that was readily available, i.e. number of total
employees per business. The California study methodology was used to calculate food waste for the
majority of businesses in Fort Collins.
The Environmental Protection Agency (EPA) has recently been designing a tool for calculating food
waste (U.S. Environmental Protection Agency, 2015b) . The EPA study does not include as many NAICS
codes, since it is intended for national use and cannot afford to be as detailed. It was useful for this
project to cross check different methodologies to produce as much accuracy in predictions as possible.
The organizations with a food retail license in Fort Collins were lumped into 8 sectors. The breakdown is
as follows:
Education
Food Wholesalers and Distributors
Food Manufacturers and Processors
Hospitality/Healthcare
Food Retailers
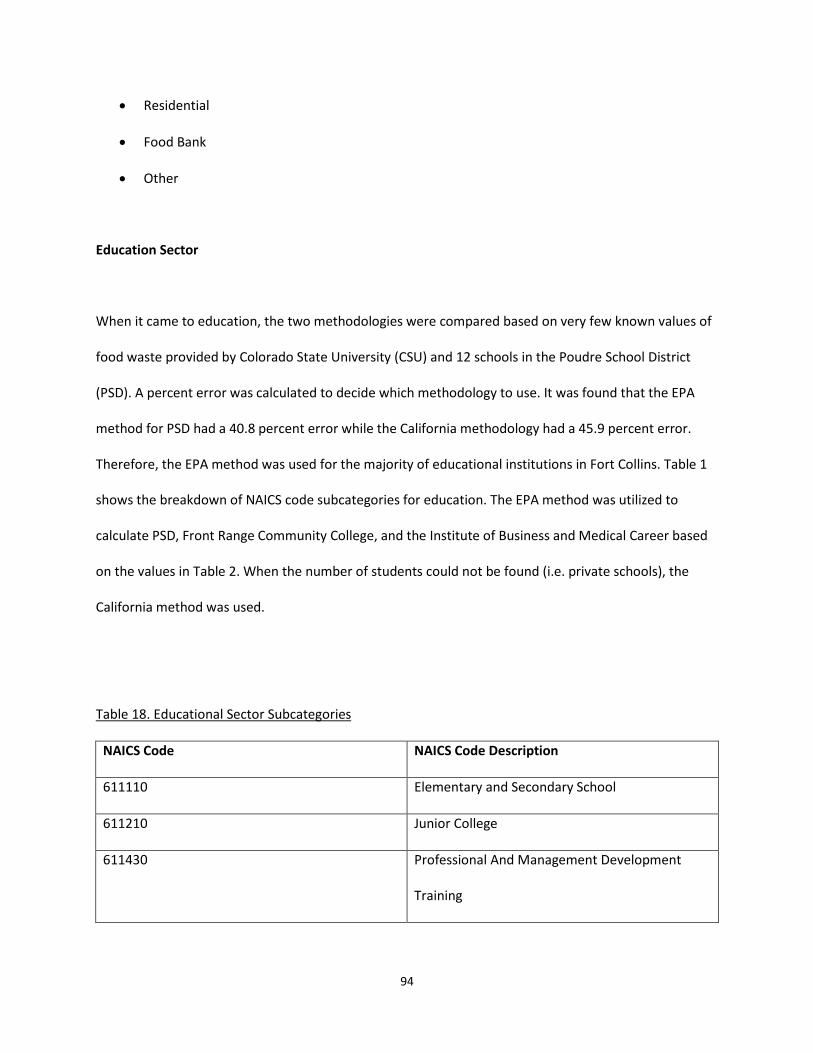
94
Residential
Food Bank
Other
Education Sector
When it came to education, the two methodologies were compared based on very few known values of
food waste provided by Colorado State University (CSU) and 12 schools in the Poudre School District
(PSD). A percent error was calculated to decide which methodology to use. It was found that the EPA
method for PSD had a 40.8 percent error while the California methodology had a 45.9 percent error.
Therefore, the EPA method was used for the majority of educational institutions in Fort Collins. Table 1
shows the breakdown of NAICS code subcategories for education. The EPA method was utilized to
calculate PSD, Front Range Community College, and the Institute of Business and Medical Career based
on the values in Table 2. When the number of students could not be found (i.e. private schools), the
California method was used.
Table 18. Educational Sector Subcategories
NAICS Code NAICS Code Description
611110 Elementary and Secondary School
611210 Junior College
611430 Professional And Management Development
Training
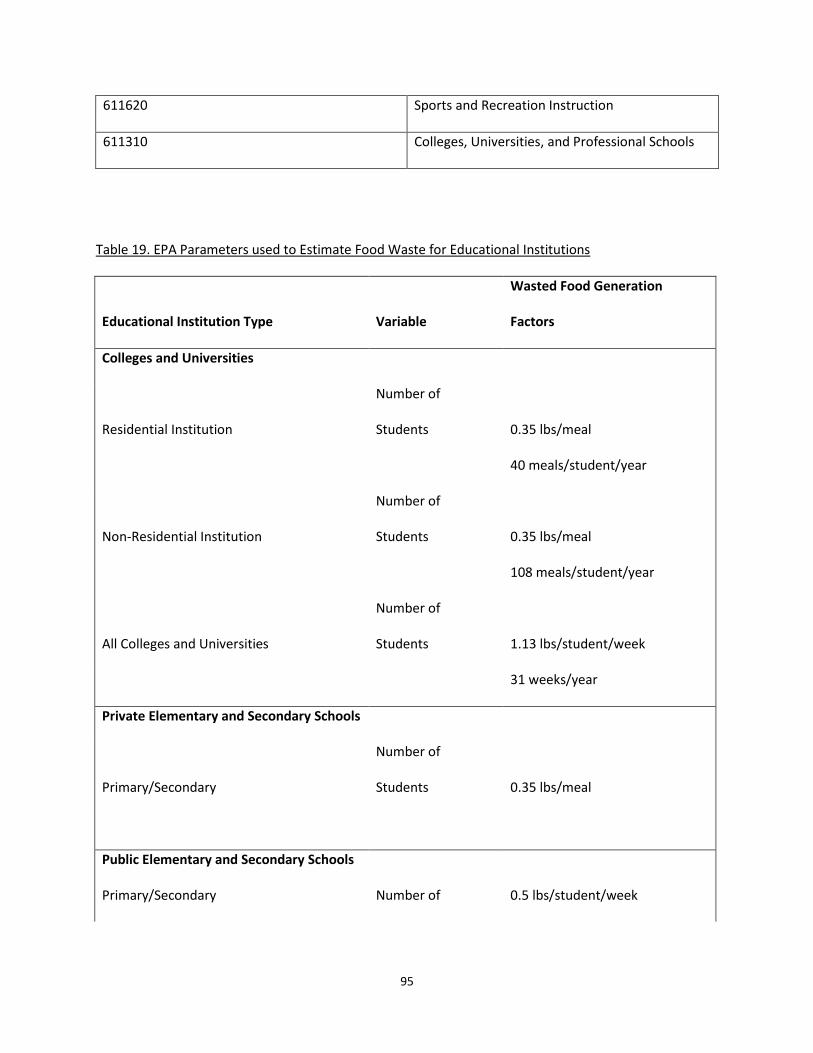
95
611620 Sports and Recreation Instruction
611310 Colleges, Universities, and Professional Schools
Table 19. EPA Parameters used to Estimate Food Waste for Educational Institutions
Educational Institution Type Variable
Wasted Food Generation
Factors
Colleges and Universities
Residential Institution
Number of
Students 0.35 lbs/meal
40 meals/student/year
Non-Residential Institution
Number of
Students 0.35 lbs/meal
108 meals/student/year
All Colleges and Universities
Number of
Students 1.13 lbs/student/week
31 weeks/year
Private Elementary and Secondary Schools
Primary/Secondary
Number of
Students 0.35 lbs/meal
Public Elementary and Secondary Schools
Primary/Secondary Number of 0.5 lbs/student/week

96
Students
40 weeks/year
Elementary School
Number of
Students 1.13 lbs/student/week
40 weeks/year
Middle School
Number of
Students 0.73 lbs/student/week
40 weeks/year
High School
Number of
Students 0.35 lbs/student/week
40 weeks/year
Pre-K
Number of
Students 1.13 lbs/student/week
40 weeks/year
K-12
Number of
Students 0.72 lbs/student/week
40 weeks/year
CSU is a difficult institution to calculate due to its numerous food sources. These include the dining halls,
Lory Student Center (LSC), Hughes stadium, Moby arena, and Morgan library. Some businesses at the
LSC were listed in the city database but not all (see Table 3). For the current study, it was decided to use
the known values of food waste coming from the dining halls as the total waste from CSU. This may have
resulted in an underestimate of food waste generation and a more rigorous estimate should be
conducted if this work is continued in the future.
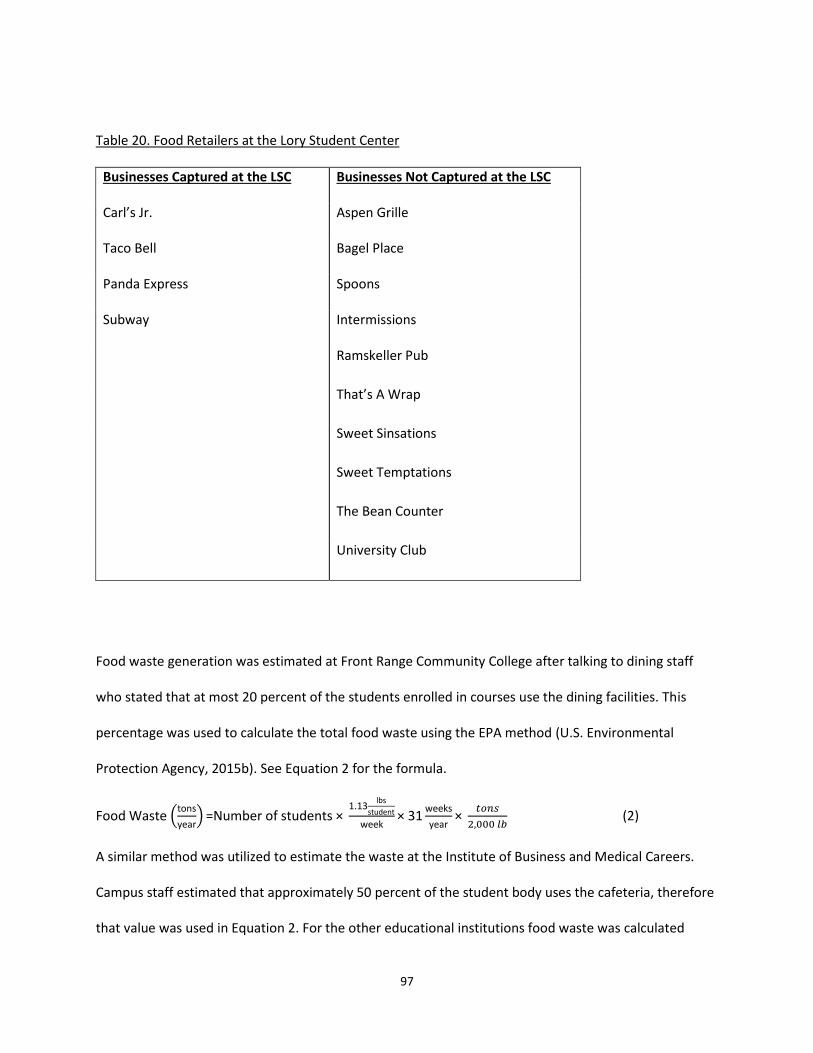
97
Table 20. Food Retailers at the Lory Student Center
Businesses Captured at the LSC Businesses Not Captured at the LSC
Ca l’s J . Aspen Grille
Taco Bell Bagel Place
Panda Express Spoons
Subway Intermissions
Ramskeller Pub
That’s A W ap
Sweet Sinsations
Sweet Temptations
The Bean Counter
University Club
Food waste generation was estimated at Front Range Community College after talking to dining staff
who stated that at most 20 percent of the students enrolled in courses use the dining facilities. This
percentage was used to calculate the total food waste using the EPA method (U.S. Environmental
Protection Agency, 2015b). See Equation 2 for the formula.
Food Waste to sea
=Nu e of stude ts × . l s
stude teek
× eeksea
× 2,000 �� (2)
A similar method was utilized to estimate the waste at the Institute of Business and Medical Careers.
Campus staff estimated that approximately 50 percent of the student body uses the cafeteria, therefore
that value was used in Equation 2. For the other educational institutions food waste was calculated
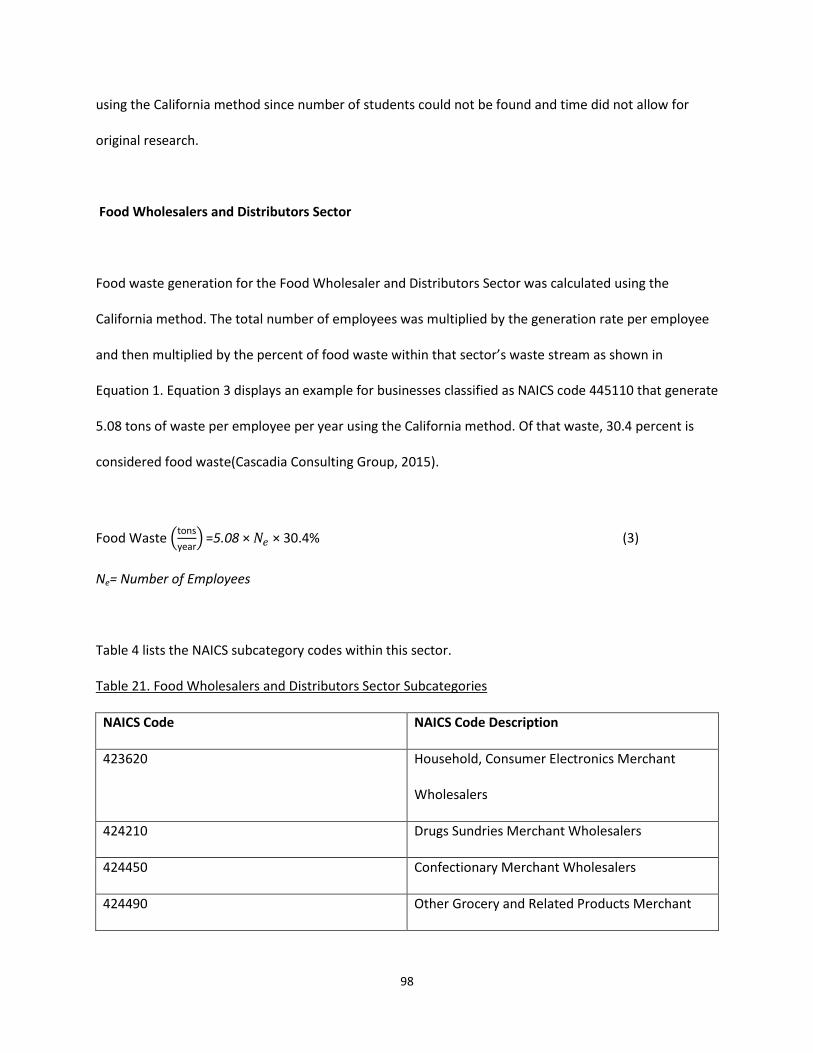
98
using the California method since number of students could not be found and time did not allow for
original research.
Food Wholesalers and Distributors Sector
Food waste generation for the Food Wholesaler and Distributors Sector was calculated using the
California method. The total number of employees was multiplied by the generation rate per employee
a d the ultiplied the pe e t of food aste ithi that se to ’s aste stream as shown in
Equation 1. Equation 3 displays an example for businesses classified as NAICS code 445110 that generate
5.08 tons of waste per employee per year using the California method. Of that waste, 30.4 percent is
considered food waste(Cascadia Consulting Group, 2015).
Food Waste to sea
=5.08 × � × . % (3)
Ne= Number of Employees
Table 4 lists the NAICS subcategory codes within this sector.
Table 21. Food Wholesalers and Distributors Sector Subcategories
NAICS Code NAICS Code Description
423620 Household, Consumer Electronics Merchant
Wholesalers
424210 Drugs Sundries Merchant Wholesalers
424450 Confectionary Merchant Wholesalers
424490 Other Grocery and Related Products Merchant
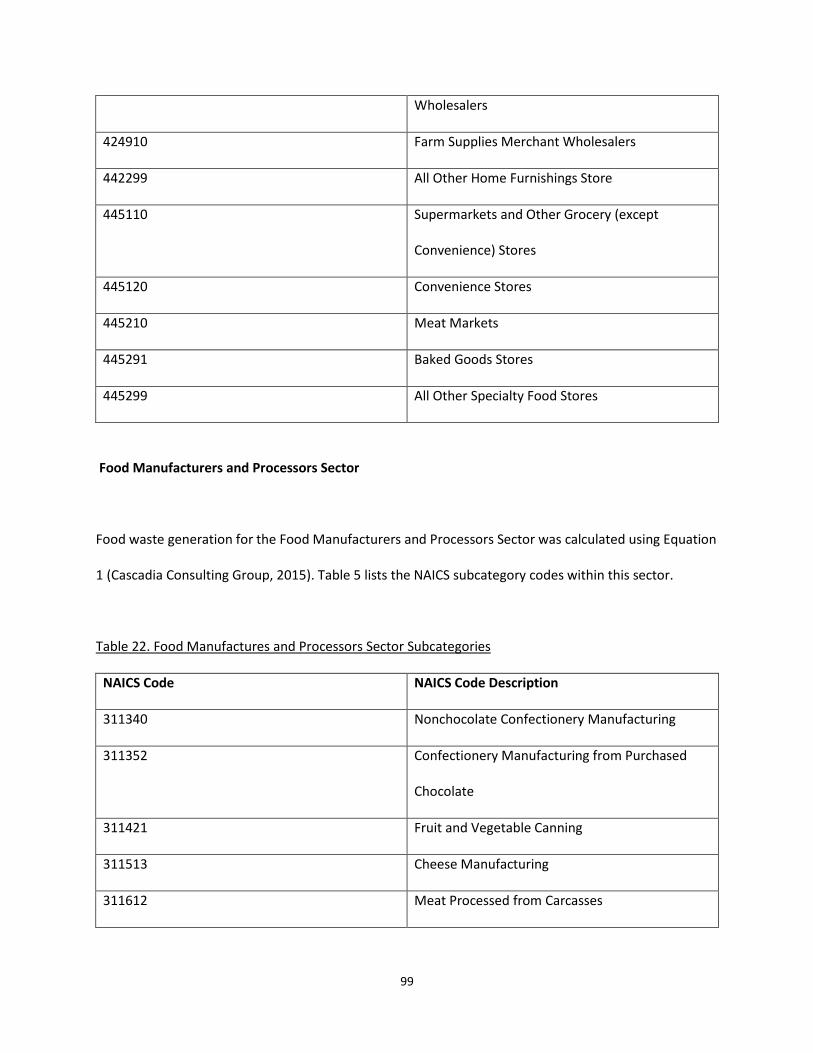
99
Wholesalers
424910 Farm Supplies Merchant Wholesalers
442299 All Other Home Furnishings Store
445110 Supermarkets and Other Grocery (except
Convenience) Stores
445120 Convenience Stores
445210 Meat Markets
445291 Baked Goods Stores
445299 All Other Specialty Food Stores
Food Manufacturers and Processors Sector
Food waste generation for the Food Manufacturers and Processors Sector was calculated using Equation
1 (Cascadia Consulting Group, 2015). Table 5 lists the NAICS subcategory codes within this sector.
Table 22. Food Manufactures and Processors Sector Subcategories
NAICS Code NAICS Code Description
311340 Nonchocolate Confectionery Manufacturing
311352 Confectionery Manufacturing from Purchased
Chocolate
311421 Fruit and Vegetable Canning
311513 Cheese Manufacturing
311612 Meat Processed from Carcasses

100
311811 Retail Bakeries
311821 Cookie and Cracker Manufacturing
311911 Roasted Nuts and Peanut Butter Manufacturing
311920 Coffee and Tea Manufacturing
311942 Spice and Extract Manufacturing
311991 Perishable Prepared Food Manufacturing
312120 Breweries
312130 Wineries
312140 Distilleries
325412 Pharmaceutical Preparation Manufacturing
Hospitality/healthcare Sector
Food waste generation for the Hospitality Sector was calculated using Equation 1 (Cascadia Consulting
Group, 2015). Table 6 lists the NAICS subcategory codes within this sector.
Table 23. Hospitality Sector Subcategory
NAICS Code NAICS Code Description
621420 Outpatient Mental Health and Substance Abuse
Center
621498 All Other Outpatient Care Centers
622110 General Medical and Surgical Hospitals
623110 Nursing Care Facilities

101
623220 Residential Mental Health and Substance Abuse
Facilities
623311 Continuing Care Retirement Communities
623312 Assisted Living Facilities for the Elderly
721110 Hotels
Food Retailers Sector
Food waste generation for the Food Retailers Sector was calculated using Equation 1 (Cascadia
Consulting Group, 2015). Table 7 lists the NAICS subcategory codes within this sector.
Table 24. Food Retailers Sector Subcategories
NAICS Code NAICS Code Description
722310 Food Service Contractors
722320 Caterers
722330 Mobile food Services
722410 Drinking Places (Alcoholic Beverages)
722511 Full-Service Restaurants
722513 Limited-Service Restaurants
722515 Snack and Nonalcoholic Beverage Bars
Residential Sector
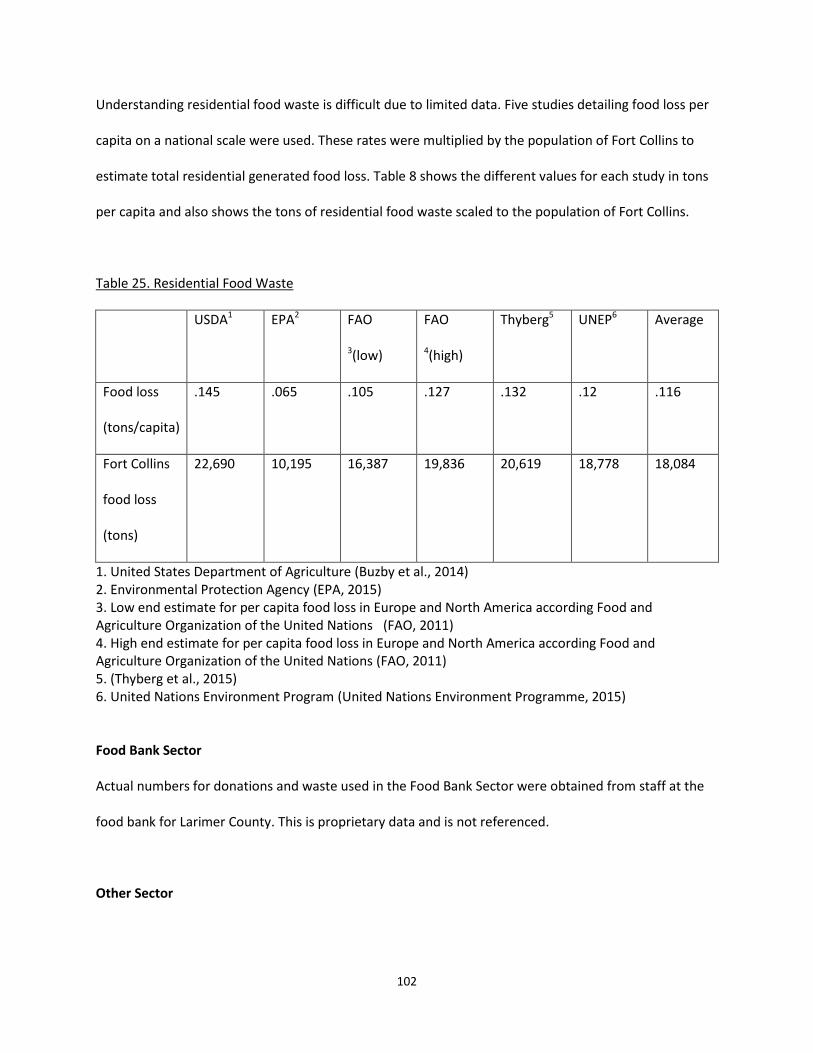
102
Understanding residential food waste is difficult due to limited data. Five studies detailing food loss per
capita on a national scale were used. These rates were multiplied by the population of Fort Collins to
estimate total residential generated food loss. Table 8 shows the different values for each study in tons
per capita and also shows the tons of residential food waste scaled to the population of Fort Collins.
Table 25. Residential Food Waste
USDA1 EPA2 FAO
3(low)
FAO
4(high)
Thyberg5 UNEP6 Average
Food loss
(tons/capita)
.145 .065 .105 .127 .132 .12 .116
Fort Collins
food loss
(tons)
22,690 10,195 16,387 19,836 20,619 18,778 18,084
1. United States Department of Agriculture (Buzby et al., 2014) 2. Environmental Protection Agency (EPA, 2015) 3. Low end estimate for per capita food loss in Europe and North America according Food and Agriculture Organization of the United Nations (FAO, 2011) 4. High end estimate for per capita food loss in Europe and North America according Food and Agriculture Organization of the United Nations (FAO, 2011) 5. (Thyberg et al., 2015) 6. United Nations Environment Program (United Nations Environment Programme, 2015)
Food Bank Sector
Actual numbers for donations and waste used in the Food Bank Sector were obtained from staff at the
food bank for Larimer County. This is proprietary data and is not referenced.
Other Sector
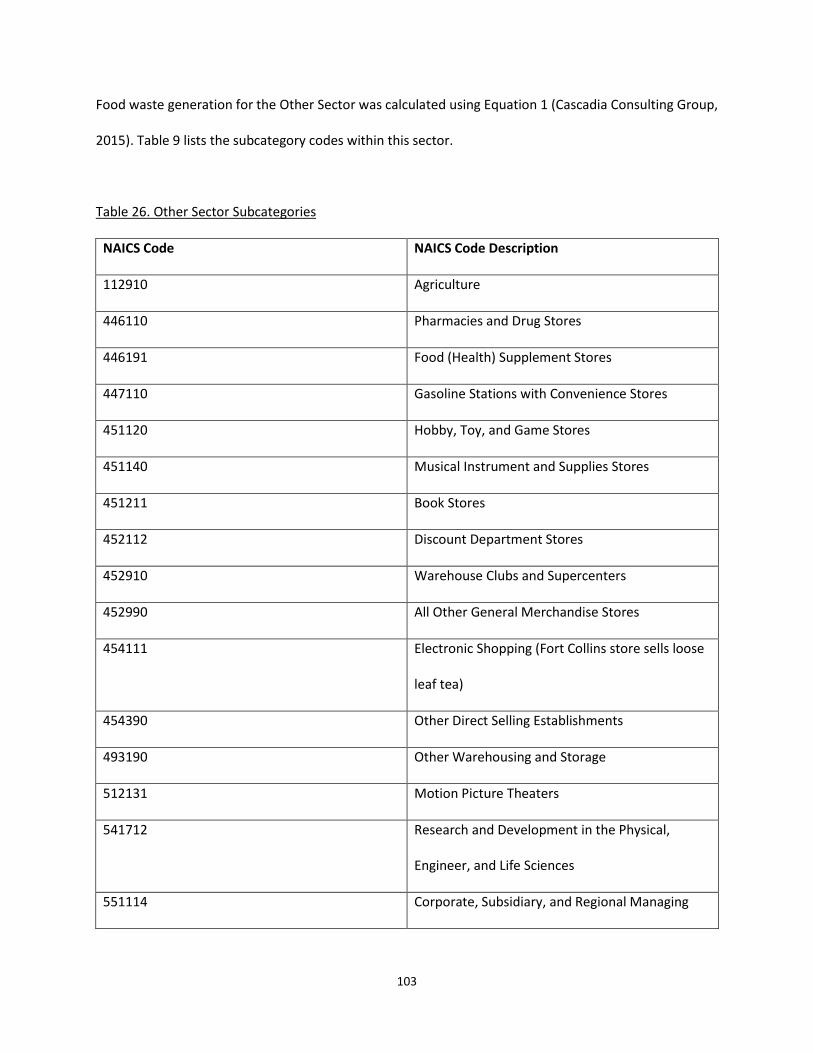
103
Food waste generation for the Other Sector was calculated using Equation 1 (Cascadia Consulting Group,
2015). Table 9 lists the subcategory codes within this sector.
Table 26. Other Sector Subcategories
NAICS Code NAICS Code Description
112910 Agriculture
446110 Pharmacies and Drug Stores
446191 Food (Health) Supplement Stores
447110 Gasoline Stations with Convenience Stores
451120 Hobby, Toy, and Game Stores
451140 Musical Instrument and Supplies Stores
451211 Book Stores
452112 Discount Department Stores
452910 Warehouse Clubs and Supercenters
452990 All Other General Merchandise Stores
454111 Electronic Shopping (Fort Collins store sells loose
leaf tea)
454390 Other Direct Selling Establishments
493190 Other Warehousing and Storage
512131 Motion Picture Theaters
541712 Research and Development in the Physical,
Engineer, and Life Sciences
551114 Corporate, Subsidiary, and Regional Managing
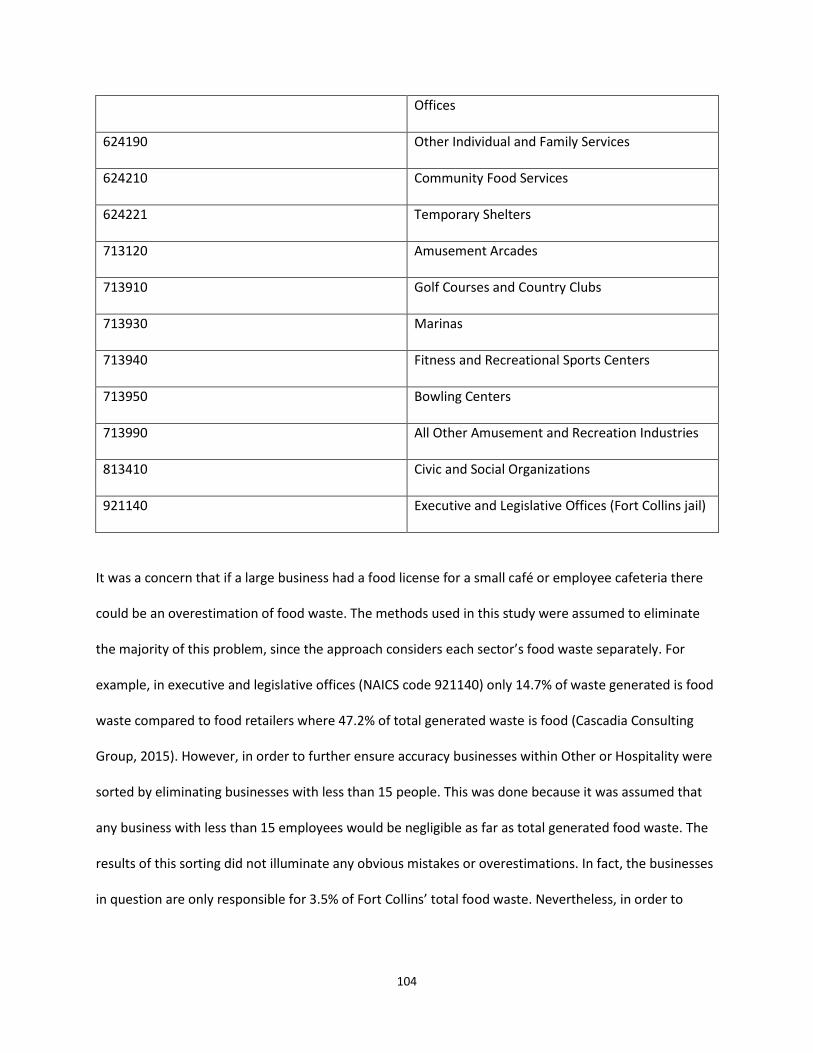
104
Offices
624190 Other Individual and Family Services
624210 Community Food Services
624221 Temporary Shelters
713120 Amusement Arcades
713910 Golf Courses and Country Clubs
713930 Marinas
713940 Fitness and Recreational Sports Centers
713950 Bowling Centers
713990 All Other Amusement and Recreation Industries
813410 Civic and Social Organizations
921140 Executive and Legislative Offices (Fort Collins jail)
It was a concern that if a large business had a food license for a small café or employee cafeteria there
could be an overestimation of food waste. The methods used in this study were assumed to eliminate
the majority of this p o le , si e the app oa h o side s ea h se to ’s food aste sepa atel . Fo
example, in executive and legislative offices (NAICS code 921140) only 14.7% of waste generated is food
waste compared to food retailers where 47.2% of total generated waste is food (Cascadia Consulting
Group, 2015). However, in order to further ensure accuracy businesses within Other or Hospitality were
sorted by eliminating businesses with less than 15 people. This was done because it was assumed that
any business with less than 15 employees would be negligible as far as total generated food waste. The
results of this sorting did not illuminate any obvious mistakes or overestimations. In fact, the businesses
i uestio a e o l espo si le fo . % of Fo t Colli s’ total food waste. Nevertheless, in order to
105
further validate the results original research was required. Unfortunately time and response rates from
contacted individuals delayed quality checks. This is an area for future work if this study is continued.
Results
The final MFA shows that in 2014 a total amount of 32,616 tons of total food waste was generated in
the city of Fort Collins. This corresponds to 30 percent of the total available food supply, which
correlates with what the UDSA predicts. It can be seen that residential waste is the largest contributor to
total food loss, which also corresponds to the literature. The final MFA (Figure 3) is presented as a
Sankey diagram where the width of the arrow is proportional to the flow value. The food input value of
108,597 tons was not included because its large size skewed the overall figure, making the smaller flows
difficult to distinguish. Figure 4 displays the overall breakdown of each sector by percent. For the
purposes of this report all sectors excluding residential are classified as commercial. Figure 5 displays the
breakdown of the commercial scenario.
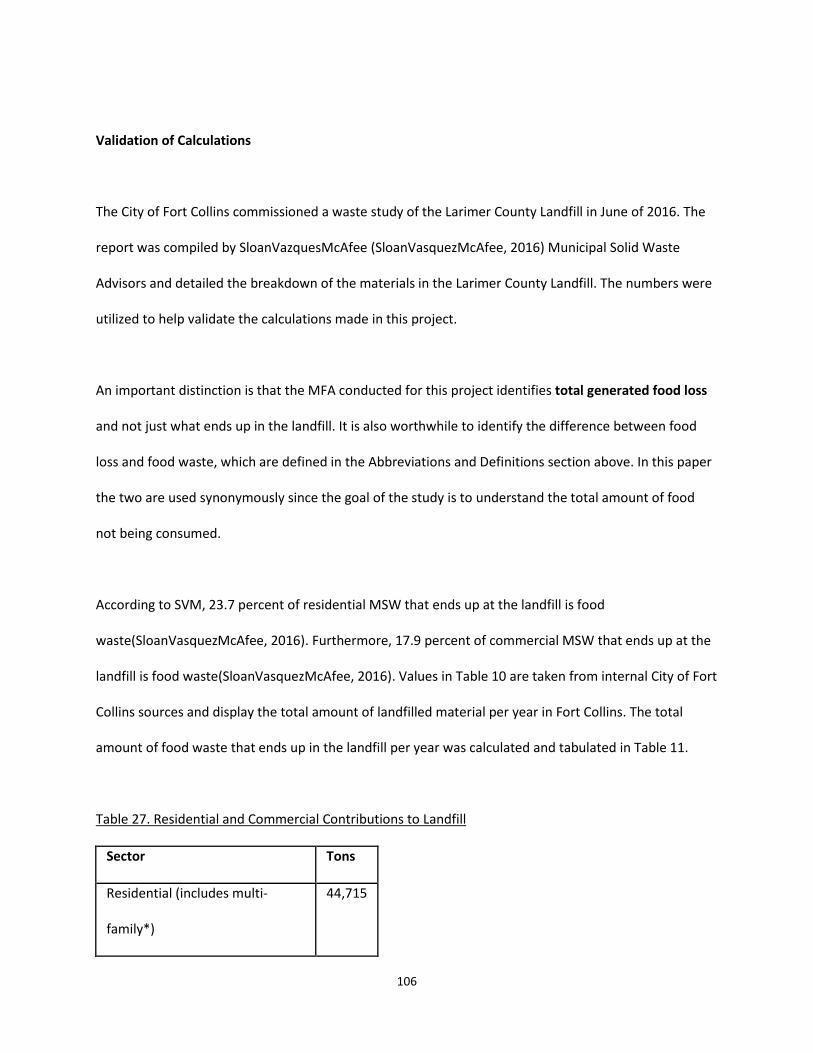
106
Validation of Calculations
The City of Fort Collins commissioned a waste study of the Larimer County Landfill in June of 2016. The
report was compiled by SloanVazquesMcAfee (SloanVasquezMcAfee, 2016) Municipal Solid Waste
Advisors and detailed the breakdown of the materials in the Larimer County Landfill. The numbers were
utilized to help validate the calculations made in this project.
An important distinction is that the MFA conducted for this project identifies total generated food loss
and not just what ends up in the landfill. It is also worthwhile to identify the difference between food
loss and food waste, which are defined in the Abbreviations and Definitions section above. In this paper
the two are used synonymously since the goal of the study is to understand the total amount of food
not being consumed.
According to SVM, 23.7 percent of residential MSW that ends up at the landfill is food
waste(SloanVasquezMcAfee, 2016). Furthermore, 17.9 percent of commercial MSW that ends up at the
landfill is food waste(SloanVasquezMcAfee, 2016). Values in Table 10 are taken from internal City of Fort
Collins sources and display the total amount of landfilled material per year in Fort Collins. The total
amount of food waste that ends up in the landfill per year was calculated and tabulated in Table 11.
Table 27. Residential and Commercial Contributions to Landfill
Sector Tons
Residential (includes multi-
family*)
44,715
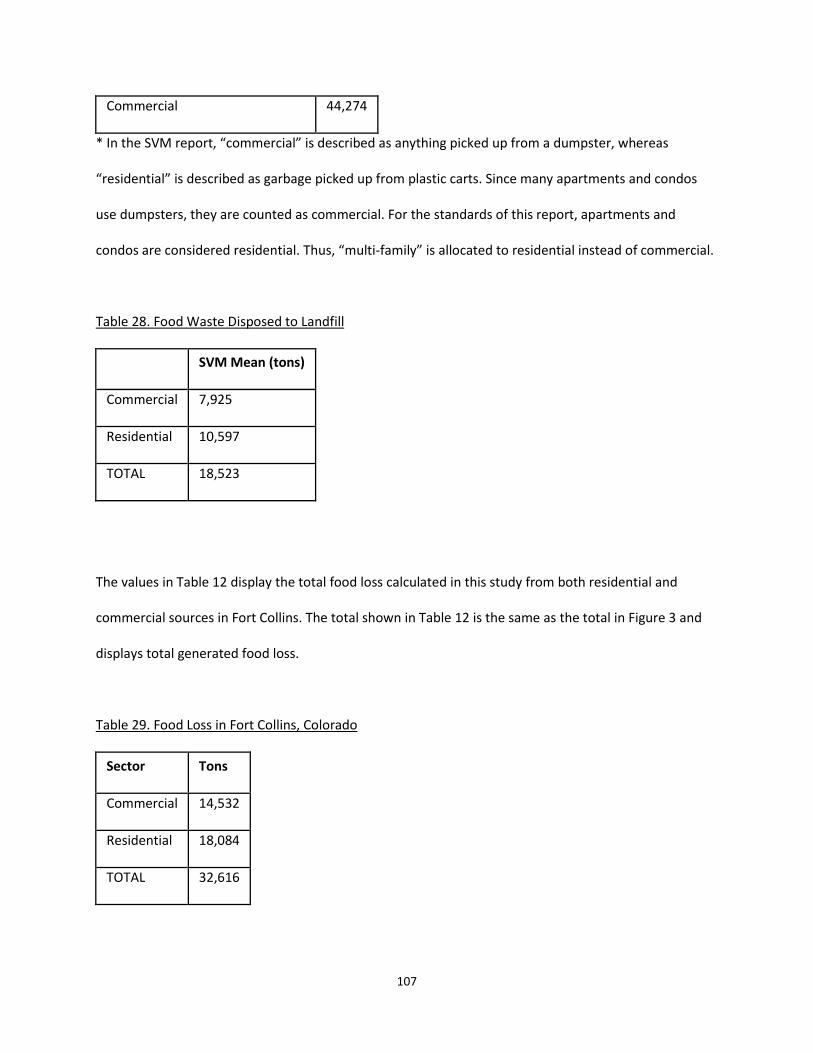
107
Commercial 44,274
* I the “VM epo t, o e ial is des i ed as a thi g pi ked up f o a du pste , he eas
eside tial is des i ed as ga age pi ked up f o plasti a ts. “i e a apa t e ts a d o dos
use dumpsters, they are counted as commercial. For the standards of this report, apartments and
o dos a e o side ed eside tial. Thus, ulti-fa il is allo ated to eside tial i stead of o e ial.
Table 28. Food Waste Disposed to Landfill
SVM Mean (tons)
Commercial 7,925
Residential 10,597
TOTAL 18,523
The values in Table 12 display the total food loss calculated in this study from both residential and
commercial sources in Fort Collins. The total shown in Table 12 is the same as the total in Figure 3 and
displays total generated food loss.
Table 29. Food Loss in Fort Collins, Colorado
Sector Tons
Commercial 14,532
Residential 18,084
TOTAL 32,616

108
There are significant differences between Table 11 and Table 12 due to the discrepancies between the
scopes of the studies. Table 11 details the tons of food that are sent to the landfill while Table 12
displays the total generated food loss in Fort Collins. According to the above tables about 57 percent of
total food waste generated in Fort Collins ends up in a landfill. In both Table 11 and 12 more than 50
percent of the food waste is due to residential.
An attempt was made to empirically add up all sources of food loss in Fort Collins (see Table 13). Adding
up the total estimates of landfill, compost, donations to the local food bank, and food disposed via
garbage disposal amounts to 28,472 tons of total generated food loss. Comparing the totals in Tables 12
and 13, a percent error of 14.56 was calculated.
Table 30. Total Food Loss from Various Sectors
Tons
Landfill 18,523
Compost1 1,512
Donations2 4,227
Sewer3 4,209
TOTAL 28,472
1. Food waste that currently gets composted from commercial sources in Fort Collins in addition to what the food bank for Larimer County composts.
2. Food donations received by the Food Bank for Larimer County 3. Average food waste to disposal per person per year taken from EPA estimate (U.S.
Environmental Protection Agency, 2014)
109
Conclusions
Results of this study clearly show that residential food waste contributes more to total MSW than all
sectors combined. This is a key conclusion of the study and illustrates the importance of residential food
waste diversion. In some parts of the country, such as Boulder, Colorado, and other parts of the world,
residential organics are collected in separate bins. In the vast majority of cases, organics includes both
food waste and yard waste. Currently, this type of service does not exist in Fort Collins, but there has
been expressed interest in the possibility by City staff. It should be noted that yard waste is not an ideal
candidate for anaerobic digestion so a mixed stream of organics (yard and food waste) would be better
suited for compost.
Another potential option for residential food waste diversion is utilizing the garbage disposal units that
are currently installed in the majority of Fort Collins homes. This has obvious implications and is subject
to numerous factors. A hotspot life cycle analysis is currently being conducted by the City of Fort Collins
Environmental Services staff that attempts to understand these factors.
The results of the MFA also display the relative contributions of the commercial sector. It can be seen
from Figure 6 that food retailers and food wholesalers and distributors are the two largest contributors
to food waste. Thus, it would likely make the most sense to focus food waste diversion efforts on these
two sectors. Potential public-private opportunities could be developed within these sectors to increase
efficiencies. For example, there are waste water treatment plants in California such as Central Marin
Sanitation Agency that accept commercial sources of food waste for use in their anaerobic digesters.
These digesters produce methane and can be used as a renewable source of energy (Kennedy/Jenks
Consultants, 2008).
This study has aided in the understanding of food waste in Fort Collins by showing the relevant stocks
and flows in a reproducible, understandable, and transparent way. It provides a strong foundation for
any other analyses that are done on food waste in Fort Collins.

110
References
Adhikari, B. K., Barrington, S., Martinez, J., & King, S. (2009). Effectiveness of three bulking agents for
food waste composting. Waste Management, 29(1), 197–203.
https://doi.org/10.1016/j.wasman.2008.04.001
Andersen, J. K., Boldrin, A., Christensen, T. H., & Scheutz, C. (2010). Mass balances and life-cycle
inventory for a garden waste windrow composting plant (Aarhus, Denmark). Waste Management
& Resear h : The Jour al of the I ter atio al Solid Wastes a d Pu li Clea si g Asso iatio , ISWA,
28(11), 1010–1020. https://doi.org/10.1177/0734242X10360216
Aye, L., & Widjaya, E. R. (2006). Environmental and economic analyses of waste disposal options for
traditional markets in Indonesia. Waste Management, 26(10), 1180–1191.
https://doi.org/10.1016/j.wasman.2005.09.010
Banar, M., Cokaygil, Z., & Ozkan, A. (2009). Life cycle assessment of solid waste management options for
Eskisehir, Turkey. Waste Management, 29(1), 54–62.
https://doi.org/10.1016/j.wasman.2007.12.006
Basu to, D., & “oza, R. . Me i o’s fede al aste egulatio s: A o e ie . EM: Air and Waste
Ma age e t Asso iatio ’s Magazi e for E iro e tal Ma agers, (JAN.), 6–9. Retrieved from
http://pubs.awma.org/gsearch/em/2007/1/basurto.pdf
Boldrin, A. et. (2009). Composting and compost utilization: Accounting of greenhouse gases and global
warming contributions. Waste Management & Research, 27, 800–812.
Brandão, M., Levasseur, A., Kirschbaum, M. U. F., Weide a, B. P., Co ie, A. L., Jø ge se , “. V., …
Chomkhamsri, K. (2013). Key issues and options in accounting for carbon sequestration and
temporary storage in life cycle assessment and carbon footprinting. The International Journal of
Life Cycle Assessment, 18(1), 230–240. https://doi.org/10.1007/s11367-012-0451-6

111
Brander, M., Tipper, R., Hutchison, C., & Davis, G. (2008). Consequential and attributional approaches to
LCA: a Guide to policy makers with specific reference to greenhouse gas LCA of biofuels.
Econometrica Press, 44(April), 1–14. Retrieved from
http://onlinelibrary.wiley.com/doi/10.1002/cbdv.200490137/abstract%5Cnhttp://www.globalbioe
nergy.org/uploads/media/0804_Ecometrica_-
_Consequential_and_attributional_approaches_to_LCA.pdf%5Cnhttp://d3u3pjcknor73l.cloudfront.
net/assets/media/pdf/approachest
Brown, S., Beecher, N., & Carpenter, A. (2010). Calculator tool for determining greenhouse gas emissions
for biosolids processing and end use. Environmental Science and Technology, 44(24), 9509–9515.
https://doi.org/10.1021/es101210k
Buenrostro, O., & Bocco, G. (2003). Solid waste management in municipalities in Mexico: Goals and
perspectives. Resources, Conservation and Recycling, 39(3), 251–263.
https://doi.org/10.1016/S0921-3449(03)00031-4
Buzby, J. C., Farah-Wells, H., & Hyman, J. (2014). The Estimated Amount, Value, and Calories of
Postharvest Food Losses at the Retail and Consumer Levels in the United States. SSRN Electronic
Journal, (121), 39. https://doi.org/10.2139/ssrn.2501659
Cadena, E., Colón, J., Artola, A., Sánchez, A., & Font, X. (2009). Environmental impact of two aerobic
composting technologies using life cycle assessment. International Journal of Life Cycle Assessment,
14(5), 401–410. https://doi.org/10.1007/s11367-009-0107-3
Carcasson, M. (2016). North Front Range Regional Wasteshed Planning Fall 2016 Public Forums Raw
Data Report. Retrieved from https://www.libarts.colostate.edu/cpd/wp-
content/uploads/sites/48/2017/05/wasteshed-forums-f16-raw-data-report-.pdf
Cascadia Consulting Group. (2015). 2014 Generator-Based Characterization of Commercial Sector
Disposal and Diversion in California. State Of California.
112
Chen, T.-C., & Lin, C.-F. (2008). Greenhouse gases emissions from waste management practices using
Life Cycle Inventory model. Journal of Hazardous Materials, 155(1–2), 23–31.
https://doi.org/10.1016/j.jhazmat.2007.11.050
City of Fort Collins. (2015). Fort Collins 2015 Climate Action Plan Framework.
Clift, R., Doig, A., & Finnveden, G. (2000). The Application of Life Cycle Assessment to Integrated Solid
Waste Management. Trans IChemE, 78(4), 279–287. https://doi.org/10.1205/095758200530790
Composting Council of Canada. (2010). Composting Processing Technologies, 4769(416), 15.
Curran, M. A. (2016). Overview of Goal and Scope Definition in Life Cycle Assessment. Springer,
Dordrecht. Retrieved from https://link.springer.com/chapter/10.1007/978-94-024-0855-3_1
Di Bella, G., Di Trapani, D., & Viviani, G. (2011). Evaluation of methane emissions from Palermo
municipal landfill: Comparison between field measurements and models. Waste Management,
31(8), 1820–1826. https://doi.org/10.1016/j.wasman.2011.03.013
Dirección de Planeación Urbana y Ecología. (2011). Programa Estatal para la Prevención y Gestión
Integral de Residuos para el Estado de Baja California Sur.
EPA. (2002). What Is Integrated Solid Waste Management? United States, 6.
https://doi.org/10.1002/9780470999677
EPA. (2015). Advancing Sustainable Materials Management: 2013 Fact Sheet. Retrieved from
https://www.epa.gov/sites/production/files/2015-09/documents/2013_advncng_smm_fs.pdf
FAO. (2011). Global Food Losses and Food Waste-Extent Causes and Prevention.
Fort Collins Population. (2016). Retrieved from http://worldpopulationreview.com/us-cities/fort-collins-
population/
Galgani, P., van der Voet, E., & Korevaar, G. (2014). Composting, anaerobic digestion and biochar
production in Ghana. Environmental-economic assessment in the context of voluntary carbon
markets. Waste Management, 34(12), 2454–2465. https://doi.org/10.1016/j.wasman.2014.07.027

113
Guo, M., & Murphy, R. J. (2012). LCA data quality: Sensitivity and uncertainty analysis. Science of the
Total Environment, 435–436, 230–243. https://doi.org/10.1016/j.scitotenv.2012.07.006
IPCC. (2007). Climate Change 2007: The Physical Science Basis. Cambridge University Press.
https://doi.org/10.1017/CBO9781107415324.004
Kennedy/Jenks Consultants. (2008). Methane Capture Feasibility Study. City of San Rafael and Central
Marin Sanitation Agency.
Komilis, D. P., & Ham, R. K. (2004). Life-Cycle Inventory of Municipal Solid Waste and Yard Waste
Windrow Composting in the United States. Journal of Environmental Engineering, 11(130), 1390–
1400. https://doi.org/10.1061/(ASCE)0733-9372(2004)130:11(1390)
Laurent, A., Bakas, I., Clavreul, J., Bernstad, A., Nie o, M., Ge til, E., … Ch iste se , T. H. . Re ie
of LCA studies of solid waste management systems - Part I: Lessons learned and perspectives.
Waste Management, 34(3), 573–588. https://doi.org/10.1016/j.wasman.2013.10.045
Levis, J. W., & Barlaz, M. (2013). Composting Process Model Documentation, (September), 1–44.
Retrieved from http://www4.ncsu.edu/~jwlevis/AD.pdf
Martínez-Blanco, J., Colón, J., Gabarrell, X., Font, X., Sánchez, A., Artola, A., & Rieradevall, J. (2010). The
use of life cycle assessment for the comparison of biowaste composting at home and full scale.
Waste Management, 30(6), 983–994. https://doi.org/10.1016/j.wasman.2010.02.023
Medina, M. (2000). Scavenger cooperatives in Asia and Latin America. Global Development Network.
Resources, Conservation and Recycling, 31, 51–69.
Mendenhall, W., Beaver, R. J., & Beaver, B. M. (2012). Introduction to Probability and Statistics (14th
ed.). Cengage Learning.
Metz, B., Kuijpe s, L., “olo o , “., A de se , “. O., Da idso , O., Po s, J., … Meyer, L. (2005).
Safeguarding the Ozone Layer and the Global Climate System.
Moberg, Å., Finnveden, G., Johansson, J., & Lind, P. (2005). Life cycle assessment of energy from solid

114
waste - Part 2: Landfilling compared to other treatment methods. Journal of Cleaner Production,
13(3), 231–240. https://doi.org/10.1016/j.jclepro.2004.02.025
Parry, D. L. (2012). Sustainable Food Waste Evaluation. Retrieved from
http://search.ebscohost.com.subzero.lib.uoguelph.ca/login.aspx?direct=true&db=nlebk&AN=6051
85&site=ehost-live&scope=site
PE Americas. (2011). Life Cycle Assessment of Systems for the Management and Disposal of Food Waste,
(November 2010), 130.
Pickering, K., Campbell, M., Kita, K., Straatmann, D., Castro, A., Rodriguez, F., & Purdy, A. (2015). Todos
Santos Community Assessment. Todos Santos. Retrieved from
https://webcms.colostate.edu/todos-santos-new/media/sites/104/2016/05/Todos-Santos-
Community-Assesment-Report-2015.pdf
Pipatti, R., Sharma, C., Yamada, M., Alves, J. W. S., Gao, Q., Guendehou, G. H. S., … Vieira, S. M. M.
(2006). Waste Generation, Composition and Management Data 2006 IPCC Guidelines for National
Greenhouse Gas Inventories. ICPP Guidelines for National Greenhouse Gas Inventories, 5, 23.
Retrieved from http://www.ipcc-
nggip.iges.or.jp/public/2006gl/pdf/5_Volume5/V5_2_Ch2_Waste_Data.pdf
R3 Consulting Group, I. (2016). Regional Wasteshed Planning ( North Front Range ) Final Report.
Retrieved from
https://www.colorado.gov/pacific/sites/default/files/DEHS_RREO_FY16Report_Fort Collins.pdf
Rebitze , G., Ek all, T., F is hk e ht, R., Hu kele , D., No is, G., R d e g, T., … Pe i gto , D. W. .
Life cycle assessment Part 1: Framework, goal and scope definition, inventory analysis, and
applications. Environment International, 30(5), 701–720.
https://doi.org/10.1016/j.envint.2003.11.005
Richard, T., & Trautmann, N. (1996). C/N Ratio. Retrieved August 1, 2018, from

115
http://compost.css.cornell.edu/calc/cn_ratio.html
Saer, A., Lansing, S., Davitt, N. H., & Graves, R. E. (2013). Life cycle assessment of a food waste
composting system: Environmental impact hotspots. Journal of Cleaner Production, 52, 234–244.
https://doi.org/10.1016/j.jclepro.2013.03.022
Santin, R. (2013). Life Cycle Assessment of Alternatives for Organic Fraction of Municipal Solid Waste
Ma age e t i Fort Colli s aster’s thesis . Colorado State University.
Sharma, G., & Campbell, a. (2007). Life cycle inventory and life cycle assessment for windrow
composting systems. Re y led Orga i s U it, U i ersity of Ne South …, 171. Retrieved from
http://scholar.google.com/scholar?hl=en&btnG=Search&q=intitle:Life+Cycle+Inventory+and+Life+
Cycle+Assessment+for+Windrow+Composting+Systems#2%5Cnhttp://scholar.google.com/scholar?
hl=en&btnG=Search&q=intitle:Life+cycle+inventory+and+life+cycle+assessment+f
SloanVasquezMcAfee. (2016). Waste Composition and Characterization Analysis City of Fort Collins ,
Colorado, (November).
Sosnowski, P., Wieczorek, A., & Ledakowicz, S. (2003). Anaerobic co-digestion of sewage sludge and
organic fraction of municipal solid wastes. Advances in Environmental Research, 7(3), 609–616.
https://doi.org/10.1016/S1093-0191(02)00049-7
Thyberg, K. L., Tonjes, D. J., & Gurevitch, J. (2015). Quantification of Food Waste Disposal in the United
States: A Meta-Analysis. Environmental Science and Technology, 49(24), 13946–13953.
https://doi.org/10.1021/acs.est.5b03880
U.S. Environmental Protection Agency. (2014). Food Waste Scoping Analysis, (Office of resource
conservation and recovery), 5.
U.S. Environmental Protection Agency. (2015a). A Summary of the GHG Implications of Composting.
Retrieved from https://www3.epa.gov/warm/pdfs/Composting.pdf
U.S. Environmental Protection Agency. (2015b). Sector-Specific Data Sources and Wasted Food

116
Estimation Methodolgies Used.
U.S. Environmental Protection Agency. (2016). Documentation for Greenhouse Gas Emission and Energy
Factors Used in the Waste Reduction Model ( WARM ), (March).
U.S. EPA. (2015). A Summary of the GHG Implications of Landfilling. Waste Reduction Model, 13, 1–26.
Retrieved from https://www3.epa.gov/warm/pdfs/Landfilling.pdf
United Nations. (2011). Municipal Solid Waste Management. Turning Waste into Resources. Shanghai
Manual – A Guide for Sustainable Urban Development in the 21st Century, (2010), 1–36.
United Nations. (2014). World Urbanization Prospects 2014. Demographic Research, 32.
https://doi.org/(ST/ESA/SER.A/366)
United Nations Environment Programme. (2015). Food Waste: The Facts. Retrieved January 1, 2016,
from http://www.worldfooddayusa.org/food_waste_the_facts
United States Environmental Protection Agency. (1995). Inventory of U.S. Greenhouse Gas Emissions and
Sinks: 1990-1994. Retrieved from
https://nepis.epa.gov/Exe/ZyNET.exe/40000LXO.TXT?ZyActionD=ZyDocument&Client=EPA&Index=
1995+Thru+1999&Docs=&Query=&Time=&EndTime=&SearchMethod=1&TocRestrict=n&Toc=&Toc
Entry=&QField=&QFieldYear=&QFieldMonth=&QFieldDay=&IntQFieldOp=0&ExtQFieldOp=0&XmlQ
uery=
United States Environmental Protection Agency. (1997). Measuring Recycling A Guide for State and Local
Governments. Washingto, DC. Retrieved from
https://nepis.epa.gov/Exe/ZyNET.exe/100011CF.TXT?ZyActionD=ZyDocument&Client=EPA&Index=
1995+Thru+1999&Docs=&Query=&Time=&EndTime=&SearchMethod=1&TocRestrict=n&Toc=&Toc
Entry=&QField=&QFieldYear=&QFieldMonth=&QFieldDay=&IntQFieldOp=0&ExtQFieldOp=0&XmlQ
uery=
United States Environmental Protection Agency. (2017). Sustainable Materials Management: Non-
117
Hazardous Materials and Waste Management Hierarchy. Retrieved from
https://www.epa.gov/smm/sustainable-materials-management-non-hazardous-materials-and-
waste-management-hierarchy
US Environmental Protection Agency. (2012). Municipal Guide for Comprehensive Management of E
waste in the Northeast of Mexico. Retrieved from
https://www.epa.gov/sites/production/files/documents/municipal-guide-ewaste-2012-02-
english.pdf
van Haaren, R., Themelis, N. J., & Barlaz, M. (2010). LCA comparison of windrow composting of yard
wastes with use as alternative daily cover (ADC). Waste Management, 30(12), 2649–2656.
https://doi.org/10.1016/j.wasman.2010.06.007
Verdugo, P., & Claudia, B. (2016). Diagnóstico de la Gestión Integral de los residuos sólidos urbanos para
el Municipio de La Paz , Baja (Vol. 52).
W.L Gore & Associated, I. (n.d.). GORE Cover For Organic Waste Treatment. Retrieved September 1,
2018, from https://www.gore.com/resources/gore-cover-for-biosolids-
composting?from=%5B%22content_type%3A321%22%2C%22language%3Aen%22%5D
Waste Management. (2016). North Weld Landfill. Retrieved from
https://www.wmsolutions.com/pdf/factsheet/North_Weld_Landfill_Fact_Sheet.pdf
World Bank. (2012). What a Waste: A Global Review of Solid Waste Management. Urban Development
Series, 3–116. Retrieved from www.worldbank.org/urban
Zero Waste Associates. (2013). Road to Zero Waste Plan. City of Fort Collins, Colorado. Retrieved from
http://www.fcgov.com/recycling/pdf/RZW_Report_Jan2014.pdf
118
Appendix B: Food Waste Diversion: A Comparative Carbon Footprint Study using Life Cycle
Analysis
Introduction:
The te food aste ofte i plies egati e o otatio s of ei g u de so e o u desi a le.
However, the inherent properties of food waste and even organic waste in general can create
oppo tu ities fo sustai a le p a ti es, he e it is t a sfo ed f o a aste i to a useful esou e.
Furthermore, diverting food waste from the landfill will not only help Fort Collins become a zero waste
city, but can also aid in decreasing greenhouse gas emissions. The purpose of this report is to examine
the advantages and disadvantages of several different options for food waste management in Fort
Collins based on greenhouse gas emissions. In addition to reducing greenhouse gas emissions, food
waste diversion from the landfill will help Fort Collins achieve its goal of zero waste by 2030.
Driver 1: Fort Collins as a Zero Waste City
The City of Fort Collins, Colo ado is dedi ated to e o i g a ze o aste it . A goal of % aste
diversion from the landfill was set in 1999, and in 2014 Fort Collins achieved a 68.4 diversion rate. The
current goal set by the Fort Collins City Council is to achieve zero waste by 2030. In 2016 the consulting
firm Sloan Vazquez McAfee conducted a study to categorize the composition and characteristics of Fort
Colli s’ solid aste that is se t to the La i e Cou t La dfill. The a al sis as o du ted fo
residential, commercial, and construction and demolition waste for both Fall and Spring of 2016. The
results of the two season study found that on average food waste accounts for 34.3% of residential
organic waste, and 43.4% of commercial organic waste. Due to these large percentages, food waste
diversion will be instrumental in helping Fort Collins achieve its zero waste goals.
119
Driver 2: Decreasing GHG Emissions
Fort Collins is also determined to decrease greenhouse gas (GHG) emissions. Ambitious goals have been
set for reducing GHG emissions including a 20% reduction below 2005 levels by 2020, 80% below 2005
levels by 2030, and carbon neutral by 2050. When food waste is sent to a landfill, it decomposes to
produce a mixture of various gases of about 50% carbon dioxide (CO2) and 50% methane (CH4). The CO2
emissions are classified as biogenic, or in other words, emissions that are considered to be part of the
natural carbon cycle. However, the CH4 produced is not part of this natural cycle and is 25 times more
potent than CO2 on a 100 year timescale (recent reports from the GPC suggest it may be even higher).
Thus, CH4 emissions from food waste can have large implications on overall city GHG emissions.
Diverting food waste from the landfill will help the City achieve their GHG reduction goals.
Food Waste Material Flow Analysis
Food waste in the United States is a complicated issue to understand, and harder still to mitigate.
A o di g to the U ited “tates E i o e tal P ote tio Age EPA food aste is the se o d la gest
catego of u i ipal solid aste M“W se t to la dfills i the U ited “tates a d akes up a out
14.6% of the total waste stream. There are obvious restraints and difficulties to reducing food waste due
the nature of food itself, i.e. spoilage, supply and demand, shipping, etc. but there still exist
opportunities for waste reduction and waste to energy technologies.
Utilizing Food Waste at Drake Wastewater Reclamation Facility
120
The two season waste composition study found that food waste accounts for 34.3% of residential
organic waste, and 43.4% of commercial organic waste. One particularly option that Fort Collins was
interested in investigating is sending food waste to the anaerobic digesters at the Drake Wastewater
Reclamation Facility (DWRF). Anaerobic digesters are utilized in wastewater treatment plants to reduce
the amount of organic matter that will ultimately need to be transported to landfills or other disposal
facilities. The bacteria responsible for breaking down organic waste produce CO2, CH4, and heat,
collectively referred to as biogas, which can be used as a fuel source for generators, boilers, internal
combustion engines, or other mechanisms for energy production. If no energy recovery equipment is in
place, biogas is typically flared. Currently, the facility combusts the portion of the biogas required to
heat its digesters and flares the surplus biogas. Opportunities have been identified by the City to add co-
generation engines to generate renewable electricity as well as capture heat to utilize in the anaerobic
digeste s. The additio of food aste to the fa ilit ’s a ae o i digeste s ill i ease the a ou t of
biogas produced, which will in turn increase the potential for energy production in a co-generation
scenario.
Food Waste Diversion Scenarios
Delivery of food waste to DWRF consisted of two different scenarios. The first, referred to as the
residential scenario, involved sending residential food to DWRF via the sewer system. The food waste
would then go through the same treatment plant processes as regular wastewater (see Figure 2). The
second scenario, referred to as the commercial scenario, assumed a truck transported commercial food
waste to DWRF. The food waste would then be sorted to remove contaminants and then added directly
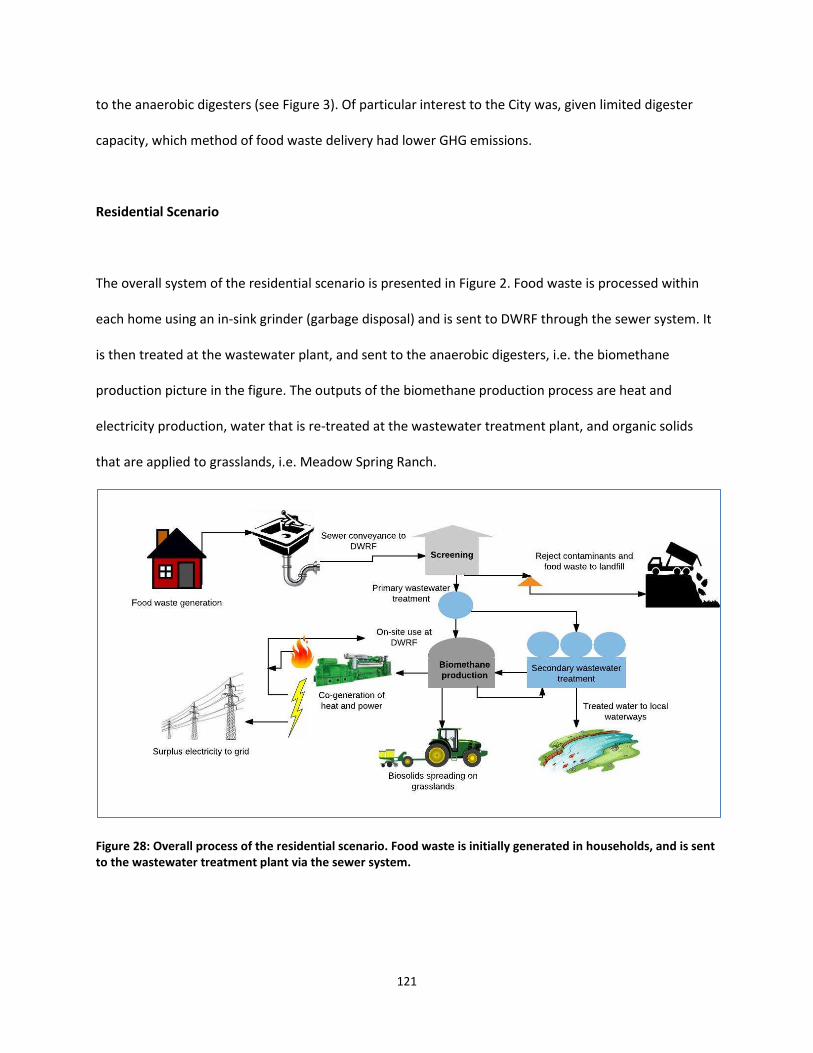
121
to the anaerobic digesters (see Figure 3). Of particular interest to the City was, given limited digester
capacity, which method of food waste delivery had lower GHG emissions.
Residential Scenario
The overall system of the residential scenario is presented in Figure 2. Food waste is processed within
each home using an in-sink grinder (garbage disposal) and is sent to DWRF through the sewer system. It
is then treated at the wastewater plant, and sent to the anaerobic digesters, i.e. the biomethane
production picture in the figure. The outputs of the biomethane production process are heat and
electricity production, water that is re-treated at the wastewater treatment plant, and organic solids
that are applied to grasslands, i.e. Meadow Spring Ranch.
Figure 28: Overall process of the residential scenario. Food waste is initially generated in households, and is sent
to the wastewater treatment plant via the sewer system.
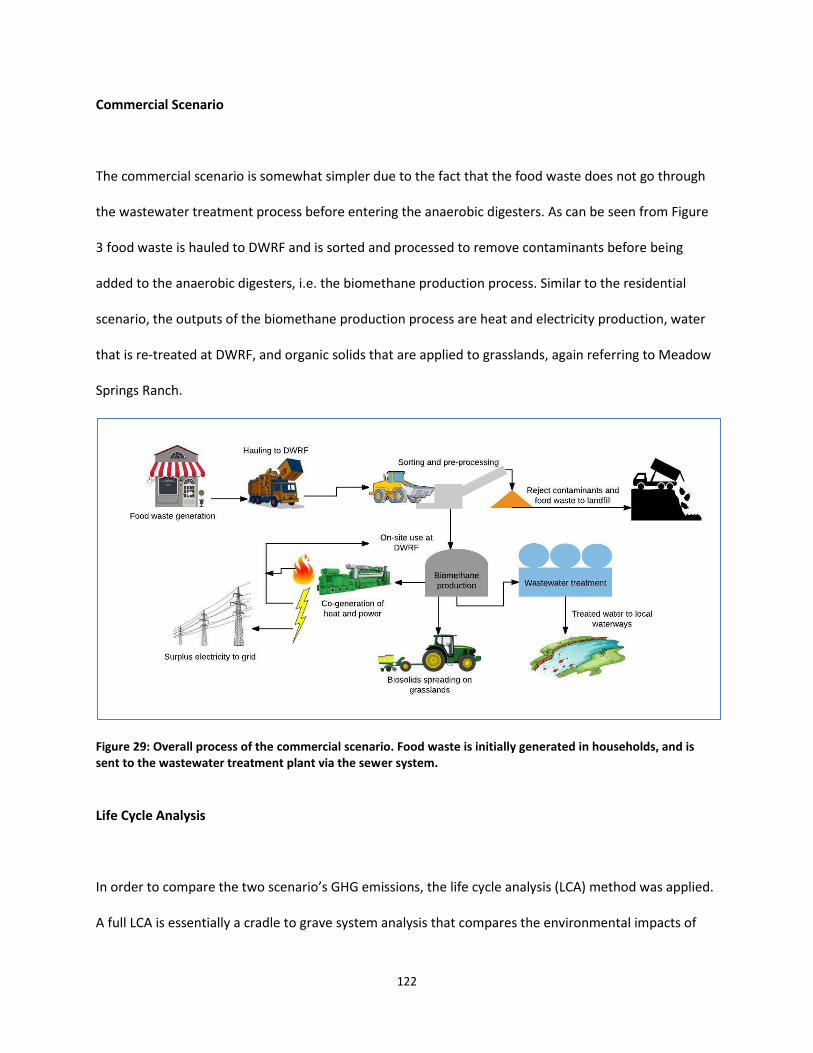
122
Commercial Scenario
The commercial scenario is somewhat simpler due to the fact that the food waste does not go through
the wastewater treatment process before entering the anaerobic digesters. As can be seen from Figure
3 food waste is hauled to DWRF and is sorted and processed to remove contaminants before being
added to the anaerobic digesters, i.e. the biomethane production process. Similar to the residential
scenario, the outputs of the biomethane production process are heat and electricity production, water
that is re-treated at DWRF, and organic solids that are applied to grasslands, again referring to Meadow
Springs Ranch.
Figure 29: Overall process of the commercial scenario. Food waste is initially generated in households, and is
sent to the wastewater treatment plant via the sewer system.
Life Cycle Analysis
I o de to o pa e the t o s e a io’s GHG e issio s, the life le a al sis LCA ethod as applied.
A full LCA is essentially a cradle to grave system analysis that compares the environmental impacts of
123
two or more processes/products. Environmental impacts often include global warming, acidification,
eutrophication, human and eco-toxicity, and resource depletion. Due to data and budgetary constraints
this report only analyzes global warming (GHG emissions) impacts, and net water demand. LCA is a
useful resource for decision makers to compare the advantages and disadvantages of the two food
waste management options.
To insure scenarios are compared on an equal basis, LCA utilizes a functional unit. A functional unit is a
way to measure the service or function that the analyzed process provides. In the case of this study, the
functional unit is one metric ton of food waste diverted from the landfill.
Results
GHG Emissions
Ultimately, the commercial scenario proved favorable to the residential scenario. The commercial
scenario resulted in lower overall GHG emissions and lower water consumption. The net GHG emissions
were 1.3*10-1 tons CO2 eq/Metric ton of food waste for the residential scenario and -8.98*10-2 tons CO2
eq/Metric ton of food waste for the commercial scenario. It is significant to note that the commercial
scenario produced net negative GHG emissions. Figure 4 displays an aggregated view of the various
processes emissions and credits for each scenario.
Water Consumption
Water usage was calculated to be 10 times higher for the residential scenario. The authors utilized
literature values from previous studies to arrive at this number. The residential scenario requires more
water to dilute the food waste to a mixture where it can be ground down in a household garbage
124
disposal. The commercial scenario does not require additional water due to the intrinsic moisture of
food waste. In other words, adding food waste directly to the anaerobic digesters will not require any
additional water.
Conclusion
The results of this analysis provided several interesting conclusions.
1. The production of a residential food waste processor, i.e. garbage disposal, creates surprisingly
large emissions from the manufacturing, packaging, and distribution of the unit. The
commercial scenario also grinds and processes food waste, but it is likely that industrial food
processors are more efficient than individual, smaller processors and see higher volumes of
food waste, lowering the resource to processed output ratio over their lifespan.
2. Adding food waste directly to the anaerobic digesters in the commercial scenario produces
significantly more biogas than the residential scenario as no losses occur in the sewer or during
superfluous wastewater processing. Increased biogas per food waste input results in more
electricity and heat production, leading to a much larger energy credit for the commercial
scenario. Truck transportation did not offset the benefits of the larger energy credit.
3. In contrast to the commercial scenario, the residential scenario saw lower resource and energy
efficiency from equipment (mentioned in conclusion 1) and higher losses due to degradation
during sewer transportation and wastewater treatment processes. While still much lower in
terms of emissions than the landfill, given the limited digester capacity at DWRF, the
commercial scenario provides more energy for the same initial amount of food waste.
4. Water consumption is 10 times higher for the residential scenario, due to the dilution of food
waste required for a household garbage disposal.
125
Bottom Line Summary
The material flow analysis conducted provided an estimate of how much and where food waste is being
generated in Fort Collins. To compare GHG emissions for two different food waste diversion strategies,
LCA methodology was utilized. This carbon footprint study found that the commercial scenario was not
only superior to the residential scenario, but also resulted in net negative GHG emissions. In addition,
the commercial scenario resulted in 10 times less water consumption than the residential scenario.
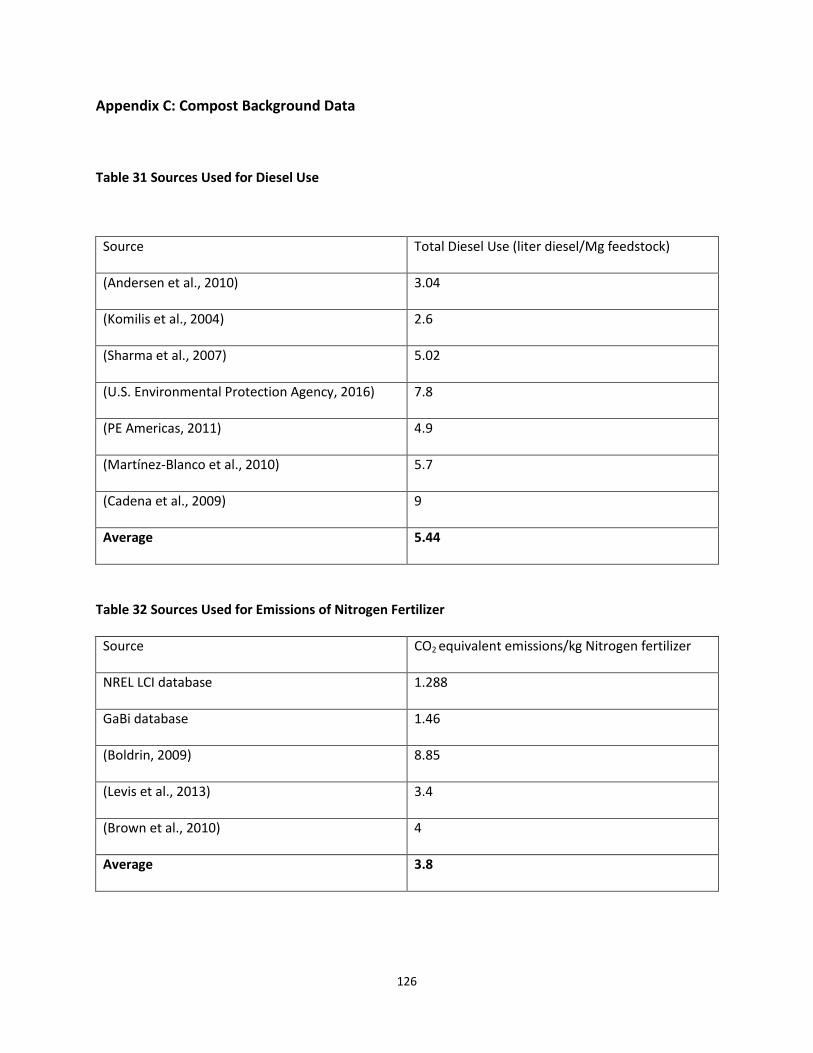
126
Appendix C: Compost Background Data
Table 31 Sources Used for Diesel Use
Source Total Diesel Use (liter diesel/Mg feedstock)
(Andersen et al., 2010) 3.04
(Komilis et al., 2004) 2.6
(Sharma et al., 2007) 5.02
(U.S. Environmental Protection Agency, 2016) 7.8
(PE Americas, 2011) 4.9
(Martínez-Blanco et al., 2010) 5.7
(Cadena et al., 2009) 9
Average 5.44
Table 32 Sources Used for Emissions of Nitrogen Fertilizer
Source CO2 equivalent emissions/kg Nitrogen fertilizer
NREL LCI database 1.288
GaBi database 1.46
(Boldrin, 2009) 8.85
(Levis et al., 2013) 3.4
(Brown et al., 2010) 4
Average 3.8
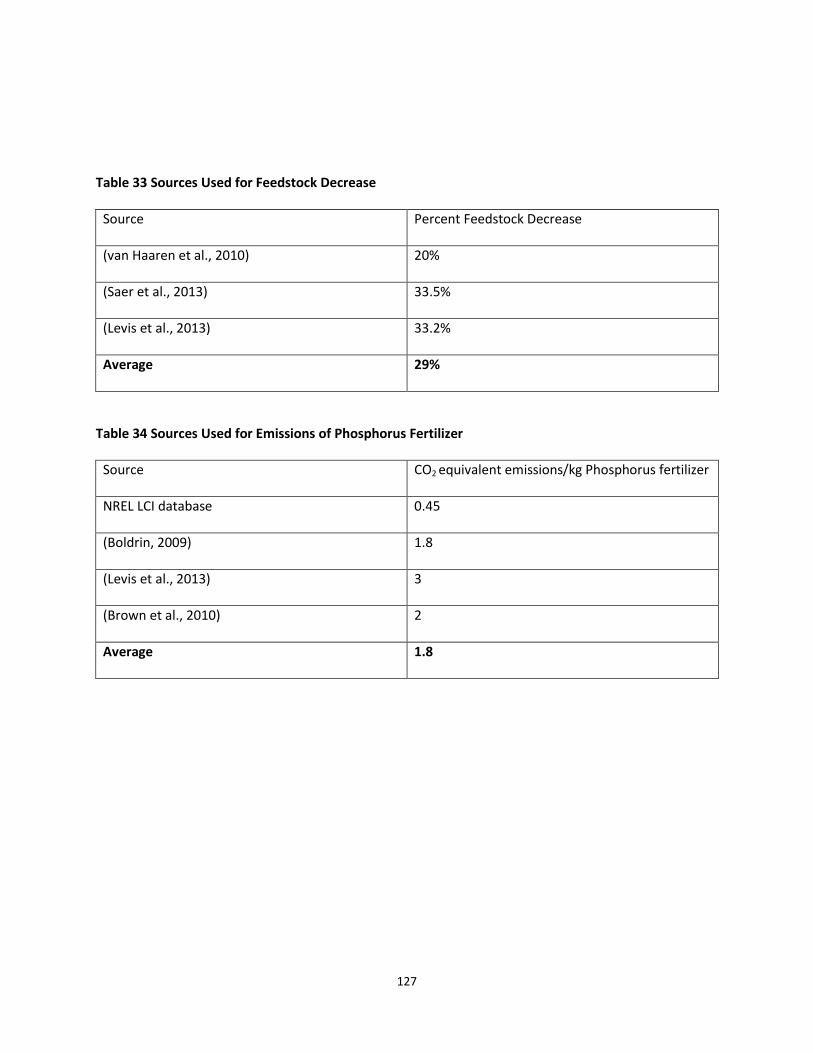
127
Table 33 Sources Used for Feedstock Decrease
Source Percent Feedstock Decrease
(van Haaren et al., 2010) 20%
(Saer et al., 2013) 33.5%
(Levis et al., 2013) 33.2%
Average 29%
Table 34 Sources Used for Emissions of Phosphorus Fertilizer
Source CO2 equivalent emissions/kg Phosphorus fertilizer
NREL LCI database 0.45
(Boldrin, 2009) 1.8
(Levis et al., 2013) 3
(Brown et al., 2010) 2
Average 1.8
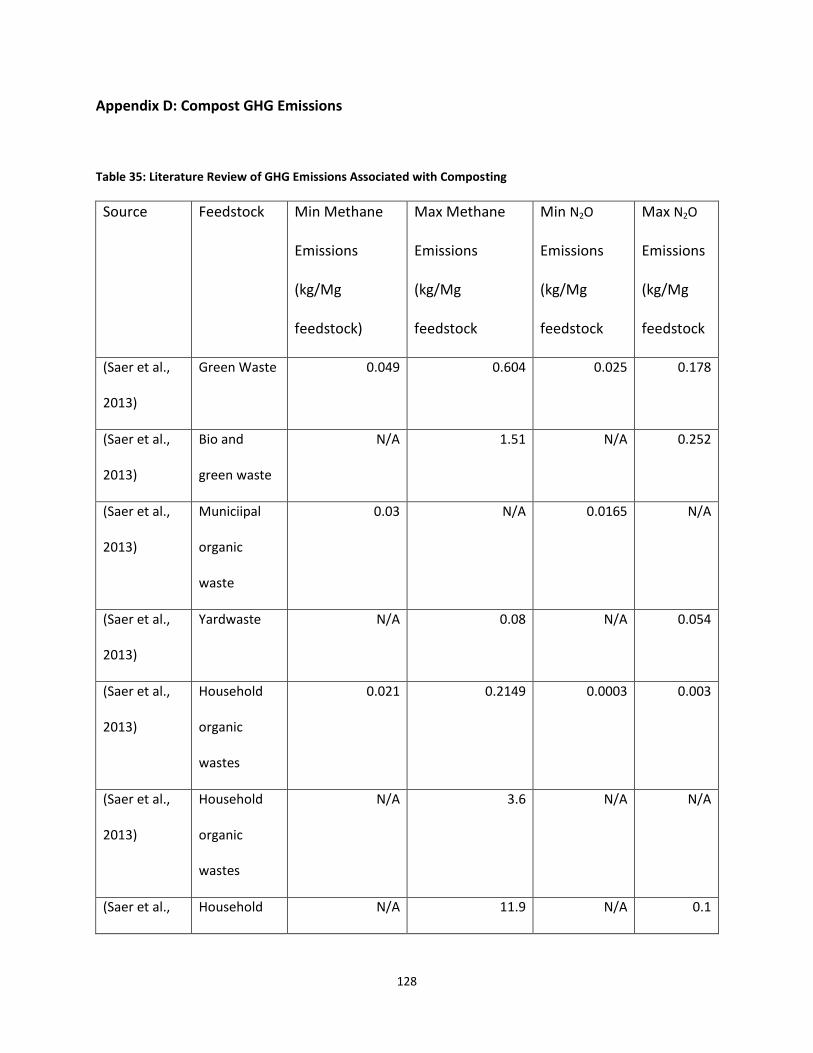
128
Appendix D: Compost GHG Emissions
Table 35: Literature Review of GHG Emissions Associated with Composting
Source Feedstock Min Methane
Emissions
(kg/Mg
feedstock)
Max Methane
Emissions
(kg/Mg
feedstock
Min N2O
Emissions
(kg/Mg
feedstock
Max N2O
Emissions
(kg/Mg
feedstock
(Saer et al.,
2013)
Green Waste 0.049 0.604 0.025 0.178
(Saer et al.,
2013)
Bio and
green waste
N/A 1.51 N/A 0.252
(Saer et al.,
2013)
Municiipal
organic
waste
0.03 N/A 0.0165 N/A
(Saer et al.,
2013)
Yardwaste N/A 0.08 N/A 0.054
(Saer et al.,
2013)
Household
organic
wastes
0.021 0.2149 0.0003 0.003
(Saer et al.,
2013)
Household
organic
wastes
N/A 3.6 N/A N/A
(Saer et al., Household N/A 11.9 N/A 0.1

129
2013) organic
wastes with
yard waste
(Saer et al.,
2013)
Household
organic
wastes with
leaves
N/A 0.172 N/A 0.022
(Saer et al.,
2013)
Mixture of
olive
branches,
leaves
N/A 7 N/A N/A
(Saer et al.,
2013)
4.8 0.08
(Saer et al.,
2013)
Household
organic
wastes with
leaves and
branches
0.08 0.3 0.04 0.1
(Saer et al.,
2013)
Household
organic
wastes with
leaves and
branches
N/A 0.2 N/A 0.11

130
(Saer et al.,
2013)
Food waste N/A 0 N/A 0
(van Haaren
et al., 2010)
Yard waste 2.3 E -05 2.3 E -05 N/A N/A
(Martínez-
Blanco et al.,
2010)
Organic
form
municipal
solid waste
0.034 0.034 0.092 0.092
(Levis et al.,
2013)
Miscellanou
s organic
waste
3.7 3.7 0.0192 0.0192
(Andersen et
al., 2010)
Garden
waste
1.9 1.9 N/A N/A
(U.S.
Environment
al Protection
Agency,
2015)
Biowaste 0.2425 0.2425 0.1465 0.1465
Table 36: Statistical Values for GHG Emissions Associated with Composting
Methane Emissions (kg/Mg
Feedstock)
N2O Emissions (kg/Mg
Feedstock
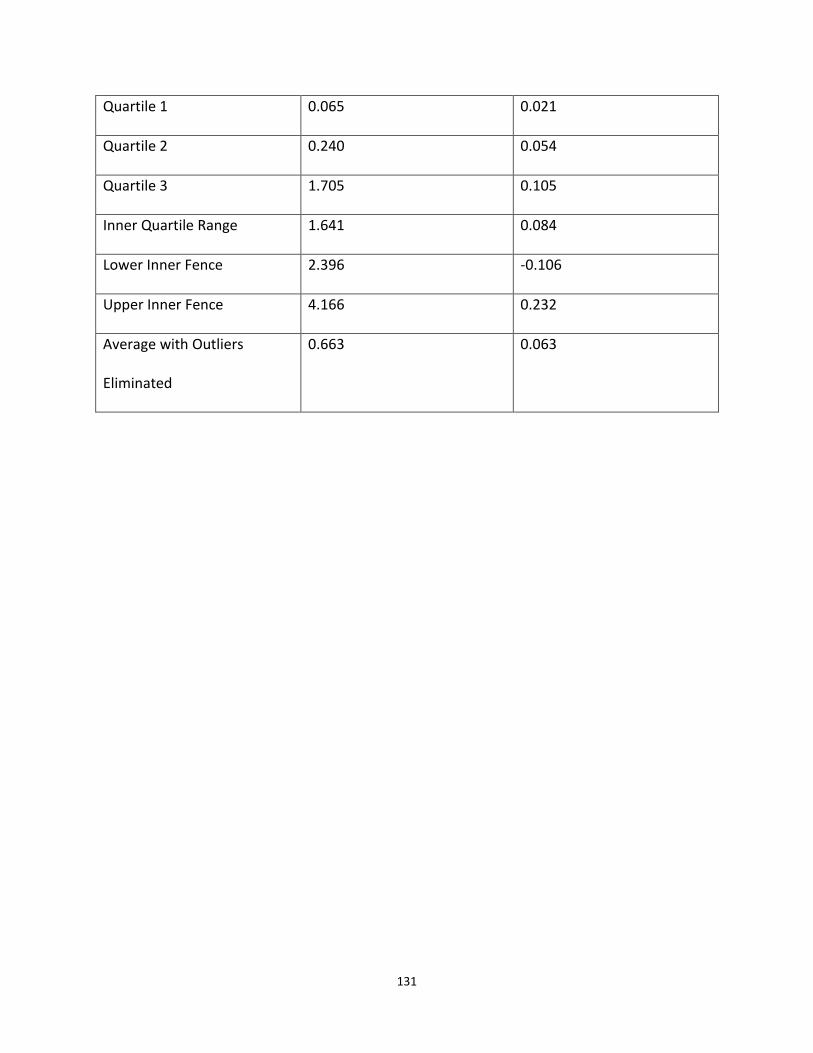
131
Quartile 1 0.065 0.021
Quartile 2 0.240 0.054
Quartile 3 1.705 0.105
Inner Quartile Range 1.641 0.084
Lower Inner Fence 2.396 -0.106
Upper Inner Fence 4.166 0.232
Average with Outliers
Eliminated
0.663 0.063