thesis title - white rose university...
TRANSCRIPT

Systems Biology study of distinct actions by short-
chain fatty acids in colon cancer cell-lines
Thesis submitted for the degree of
Doctor of Philosophy
The University of Sheffield
by
Josephine Kilner
Chemical and Biological Engineering
Department of Oncology, The Medical School
The University of Sheffield
July 2013
i

J Kilner
Abstract
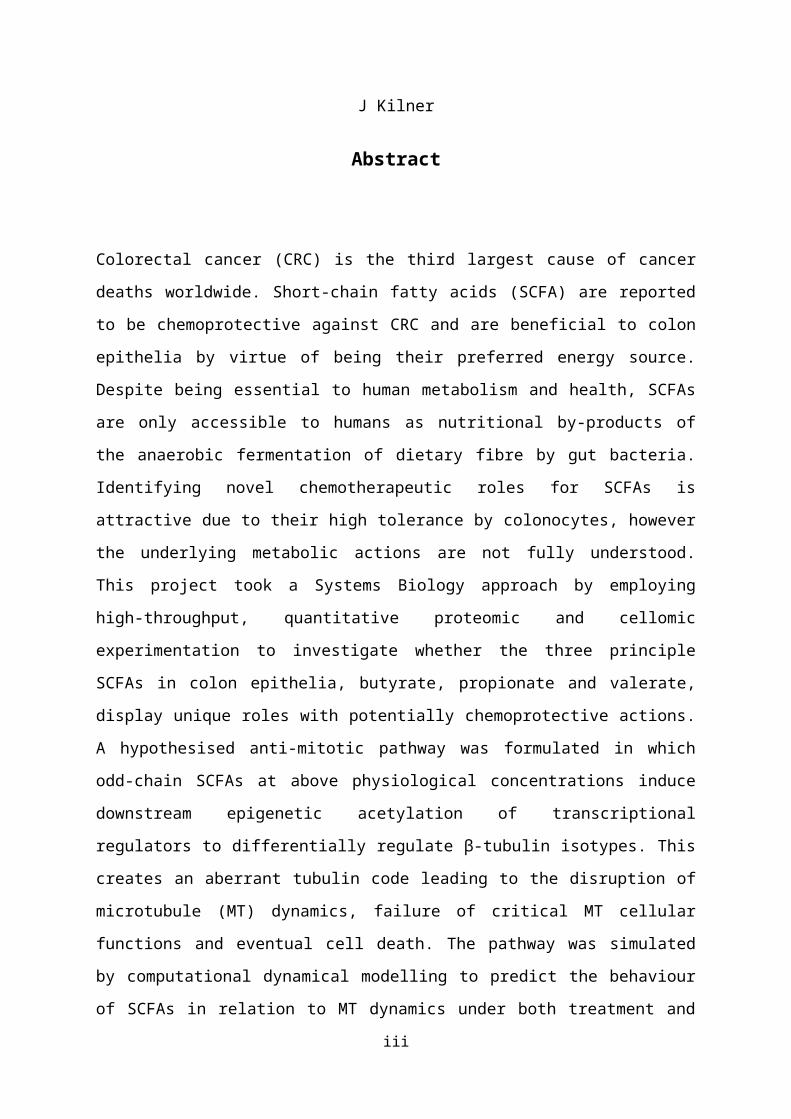
Colorectal cancer (CRC) is the third largest cause of cancer deaths worldwide.
Short-chain fatty acids (SCFA) are reported to be chemoprotective against CRC and
are beneficial to colon epithelia by virtue of being their preferred energy source.
Despite being essential to human metabolism and health, SCFAs are only
accessible to humans as nutritional by-products of the anaerobic fermentation of
dietary fibre by gut bacteria. Identifying novel chemotherapeutic roles for SCFAs is
attractive due to their high tolerance by colonocytes, however the underlying
metabolic actions are not fully understood. This project took a Systems Biology
approach by employing high-throughput, quantitative proteomic and cellomic
experimentation to investigate whether the three principle SCFAs in colon epithelia,
butyrate, propionate and valerate, display unique roles with potentially
chemoprotective actions. A hypothesised anti-mitotic pathway was formulated in
which odd-chain SCFAs at above physiological concentrations induce downstream
epigenetic acetylation of transcriptional regulators to differentially regulate β-tubulin
isotypes. This creates an aberrant tubulin code leading to the disruption of
microtubule (MT) dynamics, failure of critical MT cellular functions and eventual cell
death. The pathway was simulated by computational dynamical modelling to predict
the behaviour of SCFAs in relation to MT dynamics under both treatment and
physiological conditions. This verified the plausibility of the hypothesis and provided
valuable insights into the underlying mechanisms. Bioinformatic searches, combined
with proteomic evidence, indicated that propionate and valerate, the odd-chain
SCFAs, differentially regulated pro-tumourigenic β-tubulin isotypes. The alteration of
the β-tubulin expression pattern countered potential metabolic adaptions in colon
cancer cells, suggesting a chemopreventive action. Anti-microtubule drugs (AMD)
are among the most successful chemotherapies to date, however their toxicity and
drug resistance increase with successive rounds of treatment. This project has
demonstrated that odd-chain SCFAs may act as novel chemotherapeutics by
reducing the negative effects of AMDs while enhancing their efficacy.
ii
Acknowledgements
It could not have achieved this doctoral thesis without the help of many good friends
and colleagues. Although it is not possible to mention everyone here, I would like
them to know how much I have appreciated their support.
I am extremely grateful to my supervisors Dr Stephen Wilkinson and Dr Bernard
Corfe for giving me this wonderful opportunity, and for their guidance and
enthusiasm throughout this project. Many thanks go to my colleagues and friends at
the University. I would especially like to thank Dr Caroline Evans and Joanna
Chowdry for sharing their expertise in iTRAQ mass spectrometry and High Content
Biology. I enjoyed our collaborations.
A special thank you goes to all my family and friends for their support and
encouragement - and for reminding me there is life beyond research.
Above all, my deepest thanks go to my Mum, my brother Dave and Clare Parkin,
who’s been the greatest friend. They never stopped believing in me, helped me
through the toughest times and shared the good times.
I am grateful to the EPSRC for providing the funding (EP/E036252/1) for this
research.
iii
iv

Author Publications
Submitted and published during the course of this doctoral project; 2010–2013
1. Corfe BM, Kilner J, Chowdry J, Benson RSP, Griffiths GJ, Evans CA. Application of
High Content Biology to yield Quantitative Spatial Proteomic Information on Protein
Acetylations. Methods in molecular biology (Clifton, N.J.) 2013;981:37-45.
2. Kilner J, Waby JS, Chowdry J, Khan AQ, Noirel J, Wright PC, et al. A proteomic
analysis of differential cellular responses to the short-chain fatty acids butyrate, valerate
and propionate in colon epithelial cancer cells. Molecular Biosystems 2012;8(4):1146-
56.
3. Kilner J, Corfe BM, Wilkinson SJ. Modelling the microtubule: towards a better
understanding of short-chain fatty acid molecular pharmacology. Molecular Biosystems
2011;7(4):975-83.
4. Kilner J, Zhu L, Ow SY, Evans C, Corfe BM. Assessing the Loss of Information through
Application of the ‘Two-hit Rule’ in iTRAQ Datasets. JIOMICS 2011;1:124-34.
v

Contents
ABSTRACT..............................................................................................................................II
ACKNOWLEDGEMENTS.......................................................................................................III
AUTHOR PUBLICATIONS......................................................................................................V
CONTENTS............................................................................................................................VI
LIST OF FIGURES................................................................................................................XII
LIST OF TABLES.................................................................................................................XVI
ABBREVIATIONS..............................................................................................................XVIII
1. INTRODUCTION..................................................................................................................1
1.1. RESEARCH AIM................................................................................................................1
1.1.1. Project purpose.......................................................................................................1
1.1.2. Principle outcomes and contributions to future science and medicine...................2
1.1.3. Metabolic pathway and protein selection................................................................3
1.1.4. Formulation of the hypothesis.................................................................................4
1.2. THESIS STRUCTURE.........................................................................................................4
1.3. COLORECTAL CANCER.....................................................................................................7
1.3.1. Background and current status of colorectal cancer...............................................7
1.3.2. The cellular structure, roles and health of colon epithelia.......................................7
1.4. SHORT-CHAIN FATTY ACIDS..............................................................................................9
1.4.1. Physiological structures and functions of short-chain fatty acids (SCFA)...............9
1.4.2. SCFAs in a physiological environment.................................................................11
1.4.3. Chain-length dependent functions of SCFAs........................................................12
1.4.4. SCFAs as inhibitors of histone deacetylases and promoters of acetylation.........13
1.4.5. SCFAs as regulators of gene expression in colon epithelial cells........................14
1.4.6. SCFAs in colorectal cancer...................................................................................14
1.5. MICROTUBULES AND THE CELLULAR CYTOSKELETON......................................................15
1.5.1. The cellular cytoskeleton......................................................................................15
1.5.2. Microtubules..........................................................................................................15
1.5.3. The tubulin code...................................................................................................16
1.5.4. The roles of β-tubulin isotypes in cancer..............................................................17
1.5.5. Microtubule dynamics and dynamic instability......................................................19
1.5.6. Anti-microtubule drugs..........................................................................................23
1.5.7. β-tubulin nomenclature.........................................................................................24
1.6. SYSTEMS BIOLOGY........................................................................................................25
2. COLON CANCER CELL LINES AND CELL CULTURE....................................................27
vi

2.1. INTRODUCTION TO CELL LINES........................................................................................27
2.2. INTRODUCTION TO CELL CULTURE...................................................................................29
2.3. CELL CULTURE, TREATMENT AND HARVESTING................................................................30
2.3.1. Cell culture pipeline...............................................................................................30
2.3.2. Cell culture reagents.............................................................................................32
2.3.3. Cell culture protocol..............................................................................................32
2.3.4. SCFA treatment and harvesting protocols............................................................33
2.3.5. Preparation of whole cell lysates for proteomic studies........................................34
2.3.6. Preparation of whole cell samples for flow cytometry analyses............................35
2.3.7. Protein concentration assays................................................................................35
2.3.8. Protein integrity assays by polyacrylamide gel electrophoresis (PAGE)..............35
2.4. CELL CULTURE RESULTS................................................................................................36
2.4.1. The half maximal inhibitory concentration (IC50)...................................................36
2.4.2. Biological replicates and protein integrity..............................................................39
3. MULTI-PLEX ITRAQ PROTEOMICS CONFIRMED THAT ODD AND EVEN-CHAIN
SCFAS DIFFERENTIALLY REGULATE DISTINCT SETS OF PROTEINS IN HCT116
COLON CANCER CELLS, INCLUDING Β-TUBULIN ISOTYPES.........................................40
3.1. CONTRIBUTION OF MULTI-PLEX ITRAQ TO THE OVERALL PROJECT...................................40
3.2. INTRODUCTION TO PROTEOMICS.....................................................................................40
3.2.1. Multi-plex iTRAQ proteomics................................................................................40
3.1.2. Multi-plex iTRAQ analysis of cytoskeletal proteins...............................................43
3.3. MULTI-PLEX ITRAQ: PROJECT OUTLINE..........................................................................44
3.3.1. Experimental approaches.....................................................................................44
3.3.2. Data analysis and data-mining..............................................................................45
3.3.3. Multi-plex iTRAQ analyses pipelines....................................................................46
3.3.4. SCFA biological replicates....................................................................................48
3.4. MULTI-PLEX ITRAQ: EXPERIMENTAL METHODS...............................................................49
3.4.1. Multi-plex iTRAQ reagents and solutions for protein labelling..............................49
3.4.2. Strong cation exchange (SCX) and High-performance liquid chromatography
(HPLC)............................................................................................................................50
3.4.3. Multi-plex iTRAQ tandem-mass spectrometry......................................................51
3.4.4. Multi-plex iTRAQ spectra analysis........................................................................51
3.4.5. Phenyx analysis (post-mass spectrometry)..........................................................52
3.4.6. Post-Phenyx analysis............................................................................................54
3.4.7. uTRAQ quantitation..............................................................................................54
3.4.8. SignifiQuant quantitation.......................................................................................55
3.4.9. Multi-plex iTRAQ quality control by correlation plots and dendrograms...............56
vii

3.5. MULTI-PLEX ITRAQ: RESULTS.......................................................................................57
3.5.1. Relative quantification by multi-plex iTRAQ mass spectrometry..........................57
3.5.2. Propionate quadruplet results: Protein matches and quantification data..............61
3.5.3. SCFA duplicate data-mining: Protein matches and quantification data................61
3.5.4. Differential regulation of cytoskeletal proteins......................................................62
3.5.5. Correlation and cluster analyses of the biological replicates................................65
3.5.6. Orthogonal validation of differential regulated proteins........................................67
3.6. MULTI-PLEX ITRAQ: DISCUSSION...................................................................................68
3.7. MULTI-PLEX ITRAQ: KEY CONCLUSIONS........................................................................72
4. HIGH CONTENT ANALYSIS SHOWED THAT ODD-CHAIN SCFAS DISTINCTLY
PERTURB MT CYTOSKELETAL INTEGRITY AND MITOTIC PATHWAYS COMPARED TO
EVEN-CHAIN SCFAS............................................................................................................73
4.1. CONTRIBUTION OF HIGH CONTENT ANALYSIS TO THE OVERALL PROJECT.........................73
4.2. INTRODUCTION TO HIGH CONTENT ANALYSIS..................................................................73
4.2.1. HCA background...................................................................................................73
4.2.2. HCA study aims....................................................................................................74
4.3. HCA: PROJECT OUTLINE................................................................................................76
4.3.1. HCA of MT cytoskeletal integrity...........................................................................76
4.3.2. HCA of cell cycle progression and the biphasic response....................................76
4.4. HCA: EXPERIMENTAL METHODS.....................................................................................77
4.4.1. General reagents and solutions............................................................................77
4.4.2. HCT116 cell culture and treatment in 96 well-plates............................................78
4.4.3. Immunocytochemistry of actin and tubulin cytoskeletal structures.......................79
4.4.4. HCA quantification of cytoskeletal integrity...........................................................79
4.4.5. Data-mining HCA cell cycle data for the biphasic response.................................81
4.4.6. HCA statistical analysis.........................................................................................81
4.5. HCA: RESULTS.............................................................................................................82
4.5.1. Defining a novel parameter for MT-fibre integrity.................................................82
4.5.2. Effect of SCFA treatments on MT cytoskeletal integrity.......................................83
4.5.3. HCA cell cycle progression and the biphasic response........................................86
4.6. HCA: DISCUSSION.........................................................................................................92
4.7. HCA: KEY CONCLUSIONS..............................................................................................94
5. FLOW CYTOMETRY INDICATED A TIME-DEPENDENT DIFFERENCE IN CELL CYCLE
RESPONSE IN HCT116 CELLS BETWEEN ODD AND EVEN-CHAIN SCFA TREATMENTS
...............................................................................................................................................95
5.1. CONTRIBUTION OF FLOW CYTOMETRY TO THE OVERALL PROJECT....................................95
5.2. FLOW CYTOMETRY IN SYSTEMS BIOLOGY.......................................................................95
viii

5.3. THE CELL CYCLE............................................................................................................96
5.3.1. The cell cycle and checkpoints.............................................................................96
5.3.2. The cell cycle’s role in cancer development.........................................................98
5.4. INTRODUCTION TO FLOW CYTOMETRY.............................................................................99
5.4.1. Flow cytometry cell cycle analysis........................................................................99
5.4.2. Flow cytometry analysis of cell cycle arrest........................................................101
5.4.3. The effect of aneuploidy and hyperploidy in flow cytometry analysis.................102
5.5. FLOW CYTOMETRY: PROJECT OUTLINE.........................................................................102
5.6. FLOW CYTOMETRY: EXPERIMENTAL METHODS...............................................................103
5.7. FLOW CYTOMETRY: RESULTS.......................................................................................106
5.7.1. Flow cytometry cell cycle spectra.......................................................................106
5.7.2. Flow cytometry cell cycle data............................................................................109
5.8. FLOW CYTOMETRY: DISCUSSION..................................................................................112
5.9. FLOW CYTOMETRY: KEY CONCLUSIONS........................................................................113
6. WESTERN BLOT ANALYSIS PROVIDED ORTHOGONAL VALIDATION OF THE MULTI-
PLEX ITRAQ RESULTS IN RESPECT OF Β-TUBULIN ISOTYPE EXPRESSION IN HCT116
CELLS TREATED WITH SCFAS.........................................................................................114
6.1. CONTRIBUTION OF WESTERN BLOTTING TO THE OVERALL PROJECT:..............................114
6.2. INTRODUCTION TO WESTERN BLOTTING........................................................................114
6.2.1. Western blotting background..............................................................................114
6.3. WESTERN BLOTTING: EXPERIMENTAL METHODS............................................................115
6.3.1. Western blotting and densitometry protocols......................................................115
6.3.2. Statistical analysis...............................................................................................116
6.4. WESTERN BLOTTING: RESULTS....................................................................................116
6.4.1. Overview of the Western blotting results............................................................116
6.4.2. Expression levels of β-tubulin isotypes following 24 h SCFA treatments...........118
6.4.3. Expression levels of β-tubulin isotypes following time-course SCFA treatments
......................................................................................................................................119
6.4.4. Western blot analysis of loading controls............................................................119
6.4.5. Western blot densitometry data..........................................................................120
6.5. WESTERN BLOTTING: DISCUSSION................................................................................122
6.6. KEY CONCLUSIONS: WESTERN BLOTTING.....................................................................123
7. BIOINFORMATICS AND PATHWAY ANALYSIS CONFIRMED THAT ODD-CHAIN
SCFAS, PROPIONATE AND VALERATE, UNIQUELY TARGET MITOTIC EVENTS IN
HCT116 COLON CANCER CELLS, DISTINCTLY FROM BUTYRATE..............................124
7.1. CONTRIBUTION OF BIOINFORMATICS TO THE OVERALL PROJECT.....................................124
7.2. BIOINFORMATICS: PROJECT OUTLINE............................................................................124
ix

7.3. BIOINFORMATIC TOOLS AND RESOURCES......................................................................126
7.3.1. Phenyx................................................................................................................126
7.3.2. UniProt and NCBInr............................................................................................126
7.3.3. BLAST.................................................................................................................127
7.3.4. SABioscience......................................................................................................127
7.3.5. Gene Expression Atlas, GXA..............................................................................128
7.3.6. Reactome’s Pathway Expression and ID mapping tools....................................128
7.3.7. STRING..............................................................................................................130
7.4. BIOINFORMATICS RESULTS...........................................................................................130
7.4.1. Phenyx................................................................................................................130
7.4.2. BLAST.................................................................................................................130
7.4.3. SABioscience......................................................................................................131
7.4.4. The Gene Expression Atlas (GXA).....................................................................132
7.4.5. Pathway mapping and expression analysis........................................................133
7.4.6. String Functional Partners..................................................................................142
7.5. BIOINFORMATICS: DISCUSSION.....................................................................................143
7.6. KEY CONCLUSIONS: BIOINFORMATICS..........................................................................144
8. COMPUTATIONAL DYNAMICAL MODELLING SUPPORTS A HYPOTHESISED SCFA-
TARGETED MITOTIC PATHWAY IN WHICH ODD-CHAIN SCFAS ACT AS ANTI-MITOTIC
DESTABILISING AGENTS BY DISRUPTING MT-DYNAMIC INSTABILITY......................145
8.1. CONTRIBUTION OF COMPUTATIONAL DYNAMICAL MODELLING TO THE OVERALL PROJECT. 145
8.2. INTRODUCTION TO COMPUTATIONAL DYNAMICAL MODELLING..........................................145
8.2.1. Computational dynamical modelling of the hypothesised pathway....................145
8.2.2. Microtubules and dynamic instability..................................................................146
8.3. MODEL DESIGN AND KINETIC PARAMETERS...................................................................148
8.3.1. Design rationale..................................................................................................150
8.3.2. Kinetic equations (ODE).....................................................................................153
8.3.3. Kinetic rate constants..........................................................................................155
8.3.4. Initial reactant concentrations.............................................................................157
8.3.5. Physiological predictions.....................................................................................161
8.3.6. Comparison of computational model parameters to reported experimental in vitro
data...............................................................................................................................162
8.3.7. Comparison of computational model parameters to experimental data.............163
8.4. TIME-COURSE SIMULATIONS.........................................................................................164
8.5. COMPUTATIONAL DYNAMICAL MODELLING: RESULTS......................................................166
8.6. DISCUSSION AND FUTURE DIRECTIONS.........................................................................178
9. PROJECT CONCLUSION...............................................................................................180
x

9.1. HYPOTHESES FORMULATION........................................................................................180
9.1.1. The hypothesis....................................................................................................180
9.1.2. Experimental and bioinformatic contributions.....................................................181
9.1.3. Impact of computational dynamical modelling....................................................182
9.2. PROJECT CONCLUSIONS AND CONTRIBUTIONS TO SCIENCE AND MEDICINE......................183
BIBLIOGRAPHY..................................................................................................................185
APPENDIX I: MULTI-PLEX ITRAQ QUANTITATION..................................................................195
APPENDIX II: BIOINFORMATICS AND PATHWAY ANALYSES.....................................................207
xi

List of Figures
Figure 1.1. Thesis navigation map
Figure 1.2. Micrograph of colon epithelia
Figure 1.3. HDAC classes: Pathways in cancer
Figure 1.4. The MT cycle of dynamic instability
Figure 1.5. Schematic ‘monte carlo’ illustration of the MT capping model
Figure 1.6. Facilitated diffusion
Figure 2.1. HCA micrograph of the cellular cytoskeleton of HCT116 colon cancer
cells
Figure 2.2. Micrograph HCT116 cells at low density and at log growth (~70%–
80% confluence)
Figure 2.3. IC50 values for SCFA treatments of HCT116
Figure 2.4. Protein integrity SDS-PAGE gel for SCFA-treated HCT116 cells
Figure 3.1. Multi-plex iTRAQ analysis pipeline for a) Propionate quadruplet
experiment; b) SCFA duplicate experiments
Figure 3.2. Multi-plex iTRAQ QSTAR SCX spectrum showing the isobaric ion
peaks
Figure 3.3. Multi-plex iTRAQ histogram of linear fold-changes of differentially
regulated cytoskeletal proteins in SCFA-treated HCT116 cells
Figure 3.4. Multi-plex iTRAQ Venn diagram showing differentially regulated
cytoskeletal proteins in SCFA-treated HCT116 cells
Figure 3.5. Multi-plex iTRAQ correlation plots for the propionate quadruplet
biological replicates
xii

Figure 3.6. Multi-plex iTRAQ dendrogram for the propionate quadruplet
biological replicates
Figure 4.1. HCA 96-well plate plan and resulting fluorescent micrographs of the
HCT116 cellular cytoskeleton after SCFA treatments
Figure 4.2. HCA micrographs of the cellular cytoskeleton in SCFA-treated
HCT116 cells
Figure 4.3. HCA quantification of MT-fibre integrity in SCFA-treated HCT116
cells
Figure 4.4. HCA cell cycle analysis of SCFA-treated HCT116 cells at 24 h and
48 h
Figure 5.1. The cell cycle diagram describing the different phases and
checkpoints
Figure 5.2. A typical flow cytometry histogram (sprectra0 for normal untreated
cells
Figure 5.3. Representative flow cytometry dot plots showing sub-population
grouping of cells and gating
Figure 5.4. Flow cytometry plots for untreated and SCFA-treated HCT116 cells
Figure 5.5. Flow cytometry histograms of cell count vs. cell cycle phase for the
time-course SCFA treatment of HCT116 cells
Figure 5.6. Flow cytometry histograms showing the time course tends in the cell
cycle with SCFA-treated HCT116 cells
Figure 6.1. Western blot immunofluorescent images of differentially expressed
β-tubulin isotypes in SCFA-treated HCT116 cells
Figure 6.2. Western blot densitometry histograms differentially expressed β-
tubulin isotypes in SCFA-treated HCT116 cells
xiii

Figure 7.1. Gene Expression Atlas (GXA) bioinformatic data compared to multi-
plex iTRAQ results for β-tubulin isotype expression in HCT116 cells
Figure 7.2. Reactome ‘Starry-sky’ map of biological metabolic pathways
Figure 7.3. Pathway ID Mapping colour-coded hierarchy tree of multi-plex
iTRAQ data from SCFA-treated HCT226 cells
Figure 7.4. Mitotic pathways enriched in proteins differentially expressed in
SCFA-treated HCT116 cells
Figure 7.5. Pathway-mining to sub-mitotic pathways from multi-plex iTRAQ data
of SCFA-treated HCT116 cells
Figure 7.6. Protein-Protein interactions [STRING] between β2c-tubulin, β3-
tubulin, β1-tubulin and closest functional partners
Figure 8.1. Qualitative schematic model of the hypothesised metabolic pathway
Figure 8.2. MT ‘Dynamicity’: in silico relationships between MT-dynamic
instability parameters
Figure 8.3. Inter-relationship between MT-fibres and β-tubulin subunits through
polymerisation; hydrolysis; and re-phosphorylation
Figure 8.4. Parameter matching of in silico Tubb concentrations vs. in vitro multi-
plex iTRAQ data for β-tubulin isotypes at steady state
Figure 8.5. Dynamical Simulations showing suppression of MT-dynamics as a
consequence of SCFA treatments
Figure 8.6. Comparisons of computational model predictions vs. experimental
HCA and flow-cytometry data
Figure 8.7. Model predictions vs. reported experimental observations for MT-
stabilising and destabilising treatments
xiv

Figure 8.8. Model predictions vs. reported experimental observations of
physiological metabolic behaviour
xv

List of Tables
Table 1.1. Chemical structure and carbon chain length of SCFAs in the colon.
Table 1.1. Chemical structure and carbon chain length of SCFAs in the colon
Table 1.2. The β-tubulin (β1, β3, β2c) expression profiles in tumour and normal
tissues
Table 1.3. The approved nomenclature for β-tubulin genes
Table 2.1. IC50 values for the cell cycle check points induced by SCFA
treatments of HCT116 colon cancer cells
Table 3.1. Multi-plex iTRAQ–Phenyx; Quantification parameters; and protein
numbers
Table 3.2. Multi-plex iTRAQ data for significantly differentially cytoskeletal
proteins
Table 3.3. Summary of the twenty proteins having the greatest fold-changes in
SCFA-treated HCT116 colon cancer cells
Table 4.1. HCA MT-fibre integrity in SCFA-treated HCT116 colon cancer cells
Table 4.2. HCA MT-fibre fragmentation in SCFA-treated HCT116 colon cancer
cells
Table 4.3a 24 h HCA cell cycle analysis for SCFA-treated HCT116 cells
Table 4.3b 48 h HCA cell cycle analysis for SCFA-treated HCT116 cells
Table 5.1. Flow cytometry: mean percentage of cells at each cell cycle phases
in SCFA-treated HCT116
Table 6.1. Western blot densitometry analyses for β-tubulin isotypes
differentially regulated in SCFA-treated HCT116
xvi
Table 7.1. Pathway expression analyses of mitotic pathways enriched by
SCFA-treatment of HCT116 cells
Table 8.1. Ordinary Differential Equations (ODE) defining the kinetic reactions
in the computationally modelled hypothesised pathway
Table 8.2. Parameter overview of the computational dynamical model for the
hypothesised mitotic pathway
Table 8.3. Parameter values and ranges used in the model based on best
estimates
Table 8.4. Parameter overview of the initial concentrations selected for the
computational dynamical model
Table 8.5. Definition of the in silico Tubb parameter: The weighted combined
fold-change of β-tubulin isotypes
Table 8.6. Reported experimental data for MT-dynamicity parameters from
time-lapse fluorescence microscopy studies (Destabilisation;
Stabilisation; Physiological)
Table 8.7. Computational model outputs for MT-dynamicity parameters and
steady-state protein concentrations for simulated SCFA-treatments
in the hypothesised anti-mitotic pathway
Table 8.8. Comparisons between experimental the reported experimental data
(destabilisation; stabilisation) and computational model outputs of
MT-dynamicity parameters
Table 8.9. Physiological predictions: Comparisons between computational
model outputs of MT-dynamicity parameters with reported
experimental physiological data
xvii

Abbreviations
[Grouped by association]
SCFA Short-chain fatty acid
CRC Colorectal cancer
IBD Inflammatory bowel disease
HDAC Histone deacetylase
HDACi Histone deacetylase inhibitor
PTM Post-translational modification
MT Microtubules
IF Intermediate filaments
TF Transcription factor
MAP Microtubule associated protein
AMD Anti-microtubule drug
iTRAQ isobaric Tag for Relative and Absolute Quantitation
LC MS/MS Liquid chromatography-tandem mass spectrometry
SCX Strong cation exchange
OHW One-hit wonder
IC Isotope correction
MC Median correction
MTC Multi-test correction
HCA High Content Analysis
FACS Fluorescent activated cell sorting
ICC Immunocytochemistry
PAGE Polyacrylamide gel electrophoresis
SBML Systems Biology mark-up language
ODE Ordinary differential equation
xviii

GTP Guanosine diphosphate
GDP Guanosine triphosphate
CC Critical concentration (tubulin)
xix

1. Introduction
1.1. Research aim
1.1.1. Project purpose
Butyrate, propionate and valerate are short-chain fatty acids (SCFA) produced by
anaerobic fermentation of dietary fibre by gut bacteria. They are associated with
health-promoting benefits in colon epithelial cells, including chemoprevention of
colorectal cancer (CRC) by acting through metabolic pathways that promote
acetylation [1-3], however the details underlying the mechanisms are not fully
established. In the preceding study by the author it was found that these SCFAs
differentially regulated unique sets of proteins [4], therefore the purpose of this project
was to identify and investigate one or more of the mechanisms involved. A Systems
Biology approach was employed in which the wealth of quantitative experimental
data generated in this and the preceding project was analysed while exploiting the
rapidly expanding genomic and protein databases and pathway analysis tools that
are now available [4, 90]. The plausibility of the resulting hypothesis was tested by
developing a computational mechanistic model to replicate and perform temporal
simulations of the proposed pathway in silico. Additional ‘what if’ scenarios were
simulated to make experimentally testable predictions and provide directions for
future investigations.
In order to identify potential pathways for investigation, data from the preceding
project were mined [4, 90]. As a result, the initial focus of this project was microtubule
(MT) structural and functional mechanisms. This combination of hypothesis-driven
1

and data-driven approaches proved to be an effective technique for advancing
understanding of SCFA behaviour in colon epithelial cells and to identify candidate
molecular targets associated with SCFAs to act in novel chemotherapies of CRC.
1.1.2. Principle outcomes and contributions to future science and medicine
This project has confirmed that different SCFAs have distinct and shared
metabolic actions in colon cancer epithelial cells.
The project has identified and verified a metabolic pathway by which MT
structural dynamics are distinctly targeted by propionate and valerate, the odd-
chain SCFAs, in HCT116 colon cancer cells.
The project has reinforced the value of employing a Systems Biology approach
including computational mechanistic modelling for studying biological systems in
a post-omic era.
A simple but effective computational dynamical model has been developed that
may be adapted for similar MT-targeted investigations.
Although the evidence in this project was derived from colon cancer lines in vitro,
the implications of the results may have pharmacological value for other colonic
diseases, such as inflammatory bowel disease (IBD), Crohn's disease and
ulcerative colitis (UC).
2

1.1.3. Metabolic pathway and protein selection
The purpose of this project was to explore the pathways that were unique to
individual SCFA treatments in colon cancer epithelial cells. In order to determine the
most probable pathways for initial investigation a preliminary examination of the
existing proteomic evidence [4, 90] was carried out. The twenty proteins with the
greatest fold changes following SCFA treatments of HCT116 colon cancer cells
relative to untreated cells were identified. The proteins that were common to all
SCFAs were primarily involved in diverse generic functions such as glycolysis or
protein folding. Nine of the remaining proteins were distinctly regulated by either
propionate and/or valerate (the odd-chain SCFAs) including four β-tubulin isoforms.
No other protein family was similarly represented. This data is described in Table 3.3
in the mass spectrometry chapter. Further evidence supporting an MT-based
pathway was provided by quantitative cellomic experimentation and bioinformatic
pathway analysis. It is acknowledged that there will be other candidate pathways,
however among the top twenty proteins displaying the greatest distinct fold changes,
the β-tubulins isoforms were those most worth investigating.
3

1.1.4. Formulation of the hypothesis
As the project progressed, the decision to explore an MT pathway was consistently
verified by the experimental evidence, leading to the formulation of the following
hypothesis. The plausibility of this hypothesis was then successfully tested by
computational dynamical modelling.
“At above-physiological concentrations, the odd-chain SCFAs, propionate and
valerate, promote downstream epigenetic acetylation at specific β-tubulin
transcriptional binding sites in HCT116 colon cancer cells, thereby altering the
expression profile of β-tubulin isotypes. This in turn creates an aberrant
tubulin code which perturbs microtubule dynamic instability and prevents
microtubules from correctly performing their cellular functions, eventually
leading to mitotic arrest and cell death.”
1.2. Thesis Structure
This study applied a Systems Biology approach to observe the effects of treating
HCT116 colon cancer cells with SCFAs [5, 6]. Complementary high-performance
experimental, bioinformatic and computational techniques were combined to provide
a system-wide view. Each contributed independent and valuable evidence into a
cohesive whole, leading to the modular design of this thesis.
The rationale behind the organisation of this thesis was to present the central
themes of the project: colorectal cancer; short-chain fatty acids; and microtubules in
the main introduction. Each of the subsequent chapters describes an individual
experimental, bioinformatic or computational sub-project along with their contribution
4

to the whole project. Each chapter is divided into the following sections: an overview
or background of that study or technique; the experimental outline or model design; a
description of the methods and tools employed; followed by the results and
discussion. A final chapter brings together the key findings of the whole project into a
conclusion. Figure 1.1 provides a navigation map.
Figure 1.1. Navigation map of the thesis.
1. Chapter 1: The introduction chapter states the purpose, study plan and central
themes of the project: colorectal cancer; short-chain fatty acids (SCFA);
microtubules (MT) and their dynamics, and discusses how these may be
connected in the progression of colorectal cancer (CRC).
5

2. Chapter 2: Describes the cell culture and SCFA treatment protocols of HCT116
colon cancer cell lines that were used throughout this project.
3. Chapter 3: Multi-plex iTRAQ mass spectrometry, a high-throughput proteomic
technique, was used to identify significantly differentially expressed β-tubulin
isotype proteins in SCFA-treated HCT116 cells.
4. Chapter 4: High Content Analysis (HCA) quantitative microscopy was the
cellomic technique used for investigating MT cytoskeletal integrity in HCT116
cells following SCFA treatments.
5. Chapter 5: Flow cytometry cell cycle analysis provided time-response evidence to
support the HCA cell cycle results.
6. Chapter 6: Western blotting provided orthogonal validation of the multi-plex
iTRAQ mass spectrometry results.
7. Chapter 7: Bioinformatics was invaluable for interpreting the wealth of
experimental data generated by the high-throughput experimental techniques in
this project and offered revealing insights into the mechanisms involved.
8. Chapter 8: Computational dynamical modelling replicated and simulated the
hypothesised pathway, testing its plausibility and offering directions and
predictions for future investigations.
9. Chapter 9: The project conclusion brings together the contributions from each of
the experimental, bioinformatic and computational modelling steps to formulate a
final hypothesis. The potential importance of this work in understanding SCFA
metabolic actions in colon epithelial cancer cells and potential CRC therapies it
discussed.
6

1.3. Colorectal cancer
1.3.1. Background and current status of colorectal cancer
Colorectal cancer is the third most common cancer and fourth highest cause of
cancer-related deaths worldwide. In the UK, where CRC is the fourth most common
cancer and the second highest cause of cancer death, approximately 110 people
were newly diagnosed with bowel cancer every day in 2010 [7].
Despite improvements in screening and treatment, the incidence and mortality rates
remain high. Much of this is due to a ‘Western diet’ and lifestyle, such as red and
processed meat, obesity and physical inactivity. Furthermore, epidemiological
evidence is showing rapid increases in the incidences of CRC in countries adopting
more westernised lifestyles and in migrants moving from low to high-risk countries.
Conversely, changes in diet and lifestyle have been found to reduce the risk [7].
1.3.2. The cellular structure, roles and health of colon epithelia
The primary role of the colon is the reabsorption of water during stool formation and
the absorption of small nutrients [8]. The inner layer of the colon wall, the mucosa,
contains crypts (Figure 1.2) and multiple digestive glands [9]. Colon epithelia are
continually exposed to hydrochloric acids and digestive enzymes and therefore have
one of the fastest cell turnover rates and are among the most dynamic cells in the
body [10]. It is estimated that the entire colonic epithelial population is renewed every
three days in humans. New epithelial cells are developed at the base of the crypts
where some remain to undergo further division while others migrate to the surface to
replace existing cells. The old cells undergo programmed cell death, or apoptosis,
and are eventually shed into the stools. If coordination is lost between cell
7

proliferation at the base of the crypts and cell death at the top, for example due to
genetic mutations, there can be an excessive increase in the number of cells
generated, which can cause crypt fission and the development of polyps. If further
mutations occur, this process can lead to the development of malignant tumours and
cancer [11].
The health of the colon is intimately linked with the diet by virtue of physical
proximity, physiology and metabolic functions. Although SCFAs are essential to
human metabolism and have a positive impact on colon health, we are unable to
manufacture them ourselves. Instead, we rely on gut bacteria to produce them as a
side product of anaerobic fermentation of ingested fibre. As such, the colon has a
close symbiotic relationship with the gut flora that inhabit it [12]. In return, we offer
them a host environment and, ideally, a ready supply of dietary fibre [12, 13].
Diseases of the colon that are associated with low fibre diets include ulcerative colitis
(UC), inflammatory bowel disease (IBD) and Crohn’s disease, which is a form of IBD.
An exception is coeliac disease which is exacerbated by fibre, requiring a gluten free
diet [14].
8

Figure 1.2. The colon wall is composed of (A) columnar epithelia which contain (B) gland, or
goblet, cells and (C) stem cells. The stem cells originate at the base of the crypts and
migrate to the surface to replace mucosa cells which are continually subject to damage from
bile and gastric acids and shed into the stools. This micrograph was kindly donated by J.
Wild, Department of Oncology, The University of Sheffield [9].
1.4. Short-chain fatty acids
1.4.1. Physiological structures and functions of short-chain fatty acids (SCFA)
Short-chain fatty acids (SCFA) are short un-branched chains 2 to 6 carbons in length
(Table 1.1) [3]. They are naturally occurring by-products of the diet and as such, are
directly absorbed into the colon lumen where they are preferentially utilised as fuel
by colon epithelial cells [15]. In addition to being a fuel source, SCFAs have metabolic
actions in colon epithelia with health-promoting and chemopreventive effects. These
are discussed extensively in several reviews [1-3].
9

In order of carbon chain length, the principle SCFAs are acetate (2C); propionate
(3C); butyrate (4C); valerate (5C); and caproate (6C). In addition, there are several
related branched chain molecules including valproic acid (VPA; 8C), a derivative of
valerate, and organic anions such as lactate, formate and succinate. However, it is
the SCFAs with less than 5Cs that are most associated with altering the acetylation
status in colon epithelia [3, 16]. These are the focus of this project.
Table 1.1. Chemical structure and carbon chain length of SCFAs
SCFA Structure No. of C atoms
AcetateCH3COOH
2
PropionateC2H5-COOH
3
ButyrateC3H7-COOH
4
ValerateC4H9-COOH
5
CaproateC5H11-COOH
6
Acetate, butyrate and propionate are found at molar ratios of 60:20:20 in the colon,
at concentrations between 40–80 mM, 10–20 mM and 10–25 mM, respectively [16-18].
Valerate and caproate are produced in lesser amounts.
Following absorption, the SCFAs are utilised by the colon epithelia and/or
transported into the portal vein and from there to the liver and peripheral tissues
where they are metabolised [19]. Unlike the other SCFAs, acetate is rapidly
10

transported to the liver where it is either used in the synthesis of long chain fatty
acids during the final stages of cholesterol synthesis or used as an energy source by
peripheral tissues. Conversely, 70%–90% of butyrate remains in the colon epithelia
where it is utilised as their preferred fuel source. Propionate acts as both a fuel
source for colon epithelia and as a substrate for gluconeogenesis in the liver.
Similarly, valerate is metabolised in the colon epithelia and transported to the liver
where it is both glucogenic and ketogenic. Caproate is the most efficiently extracted
of all the SCFAs and is taken up by the liver where it is strongly ketogenic. These
metabolic actions are described in a variety of publications [12, 13, 17, 20, 21]. The
efficiency of SCFA absorption from the colon into the epithelia and from there to the
liver and peripheral tissues is thought to be chain-length specific [1].
1.4.2. SCFAs in a physiological environment
Nutritional metabolites, including SCFAs, frequently work in collaboration within the
human body. There is evidence that SCFAs not only act together synergistically or
additively within colon epithelia in vivo [22-24], but also competitively or individually in
specific metabolic pathways [23, 25]. Much of this evidence has been derived from
ruminant or animal feeds studies [24, 25]; for example, antibiotics can be most effective
when administered in the presence of all three SCFAs [26]. Butyrate is acknowledged
to be the most potent of the SCFAs in apoptotic pathways and some apoptotic
effects related to hyperacetylation are only observed with butyrate [3, 23]; conversely
other effects are only related to the odd-chain SCFAs, i.e. propionate and valerate [3].
Propionate has been observed together with butyrate in certain pathways; whereas
propionate acts alone or inhibits butyrate in others [24]. Valerate and butyrate have
also been found to act competitively [26]. Although it is generally accepted that
11

butyrate is chemopreventive against CRC, butyrate has been found to promote
tumour formation under certain conditions. This is termed the ‘butyrate paradox’ and
may be linked to confounding factors that exist in vivo [22]. To date, butyrate has been
the most extensively researched of the SCFAs in colon epithelia [1, 3].
1.4.3. Chain-length dependent functions of SCFAs
Propionate (3C) and valerate (5C) are odd-chain SCFAs, whereas acetate (2C) and
butyrate (4C) are even-chain SCFAs; furthermore, each SCFA has a unique
concentration in the colon [16]. This offers the possibility that their shared and distinct
actions are not only a function of structural interactions but are also based on their
physiological concentration [3, 25], with evolutionary foundations related to dietary
sources [26].
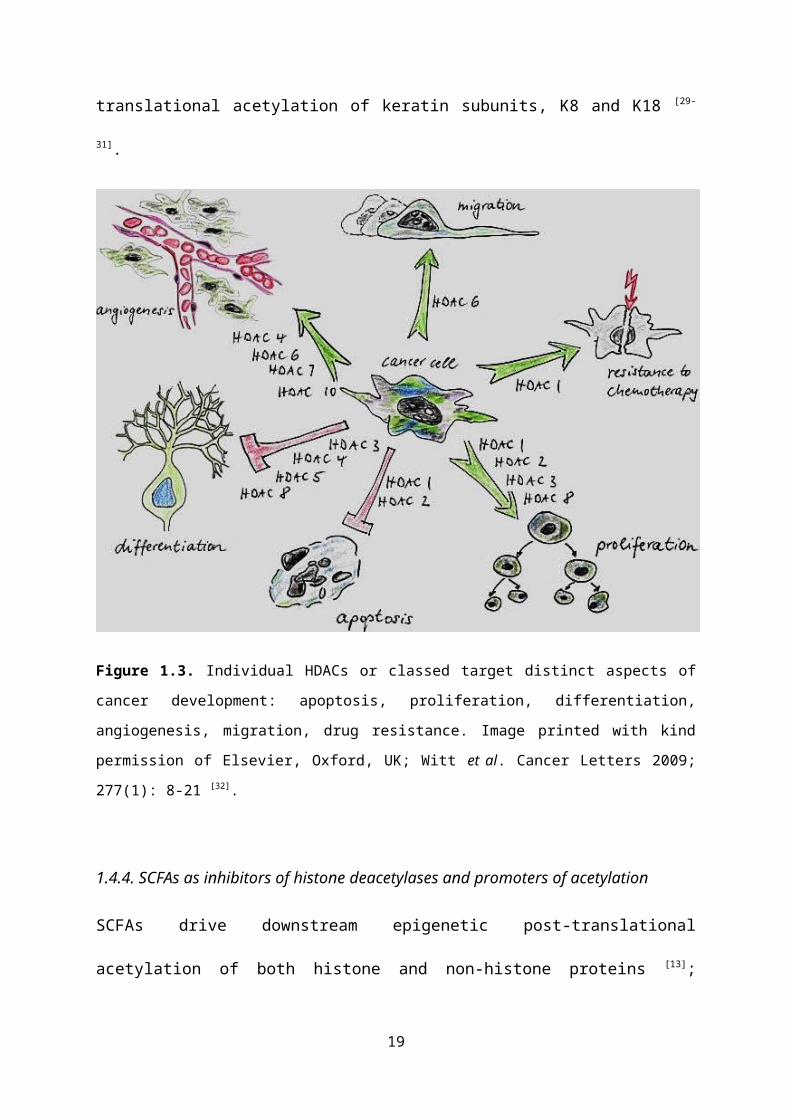
The different SCFAs differentially target different classes of histone deacetylases
(HDAC) [27]. This would have consequences in cancer development where HDAC
classes are involved in specific aspects of tumourigenesis (Figure 1.3). For example,
HDAC1, which is primarily associated with butyrate [28], has roles in apoptosis,
proliferation and resistance, whereas HDAC4 acts in differentiation and
angiogenesis. However, SCFAs do not target HDAC6, the HDAC associated with
MTs, so cannot alter MT function through this acetylation pathway. As such, any
actions SCFAs have in MTs must be though alternative pathways; for example, by
targeting MT dynamics via indirect synthesis of tubulin subunits, as is the hypothesis
of this study. This is supported by the observation that SCFAs act in a chain-length
manner in certain tissues leading to a proposal that individual SCFAs are involved in
determining which genes are transcribed [1]. A similar effect is observed in
intermediate filaments (IF) where SCFAs have a direct effect on the structural
12

integrity and functions of IFs via post-translational acetylation of keratin subunits, K8
and K18 [29-31].
Figure 1.3. Individual HDACs or classed target distinct aspects of cancer development:
apoptosis, proliferation, differentiation, angiogenesis, migration, drug resistance. Image
printed with kind permission of Elsevier, Oxford, UK; Witt et al. Cancer Letters 2009; 277(1):
8-21 [32].
1.4.4. SCFAs as inhibitors of histone deacetylases and promoters of acetylation
SCFAs drive downstream epigenetic post-translational acetylation of both histone
and non-histone proteins [13]; however, the mechanisms are currently under debate.
The established view is that they are histone deacetylase inhibitors (HDACi) [3, 33].
The more recent hypothesis is that SCFAs mediate acetylation by virtue of having
different intermediates in beta-oxidation [34], thereby shifting the balance of
13

acetylation-deacetylation reactions towards acetylation. The even-chain SCFAs
(acetate & butyrate) enter the TCA cycle via acetyl- and butyryl-CoA pathways;
whereas the odd-chain SCFAs (propionate and valerate) enter the TCA cycle via
propionyl-, valeryl-CoA and succinate pathways [8]. Maps describing the underlying
metabolisms are provided by KEGG, an open-access resource [35].
1.4.5. SCFAs as regulators of gene expression in colon epithelial cells
By promoting histone acetylation, SCFAs alter gene expression through chromatin
remodelling, thereby opening up DNA to transcription. In contrast, by promoting
acetylation of non-histone regulatory proteins, cofactors and transcription factors
(TF), SCFAs have more specific roles in altering gene expression [36]. These have
been found to include genes involved in DNA synthesis, such as Sp1, p53, p21, p27,
[36, 37] the anti-apoptotic Bcl-z and pro-apoptotic Bid and Bim genes [38], and critical cell
cycle regulators, such as cyclins A and D1, leading to G1 cell cycle arrest and
inhibition of cell cycle progression [39]. In vitro studies in colon cancer cells have
reported that butyrate initiates apoptosis [1, 45], inhibits proliferation and promotes
differentiation by upregulation of BAK, downregulation of BclxL, downregulation of
the Bcl2 family of proteins [13], downregulation of cyclin B1, a protein involved in the
regulation of mitosis, and increased expression of the cell cycle inhibitor p21 [40].
1.4.6. SCFAs in colorectal cancer
Increasing attention is being directed towards discovering regulatory proteins that
can act synergistically with anti-cancer drugs in order to reduce the negative effects
of drug resistance and toxicity [41]. These include proteins that regulate transcription
14

by inhibiting or inducing post-translational modifications (PTM), such as HDACis.
However, despite their initial promise, several clinical trials have been halted due to
excess toxicity or other negative effects; for example, Vorinostat, an HDACi with
drug approval as an anti-cancer agent [42], was found to cause excessive toxicity with
minimal beneficial outcome if used in combination with other anti-cancer drugs [43].
In contrast, SCFAs are natural dietary products that are not only tolerated by colon
epithelia but offer beneficial effects. Therefore, they offer attractive possibilities for
the treatment and prevention of CRC.
1.5. Microtubules and the Cellular cytoskeleton
1.5.1. The cellular cytoskeleton
The cellular cytoskeleton is composed of three principle structures: actin
microfilaments; intermediate filaments (IF); and microtubule fibres (MT). Both actin
microfilaments and IFs maintain cell shape by acting as tensors; conversely, MTs act
as ‘beams’ [8]. IFs are composed of keratins, with keratins 8, 18 and 19 those most
associated with colon epithelia [29]. MTs are composed of α- and β- tubulin subunits in
the form of heterodimers.
1.5.2. Microtubules
Microtubules are central to many cellular functions including maintaining cell shape,
intra and inter cell motility and formation and function of the mitotic spindle during
mitosis and cell division. The α- and β- tubulin subunits form αβ-heterodimers; these
polymerise in a head-to-tail manner to form protofilaments; the protofilaments align in
15

a cylindrical arrangement to form fibres 25 to 30 nm in diameter. Typically there are
13 protofilaments in each MT fibre [8]. The polarity of the αβ-heterodimers
preferentially promotes assembly at the plus end with the minus end associated with
anchoring. There are believed to be 8 α and 7 β tubulin isoforms [44]. The ability of
MT-fibres to rapidly disassemble and reassemble allows them to respond to cellular
cues, such as formation of the mitotic spindle during cell division [45].
1.5.3. The tubulin code
Tubulin isoforms are evolutionarily highly conserved with most variations occurring in
the last 15 sequences of the β-tubulin c-termini tails (CTT) [45]. These variations
define how they will interact with microtubule associated proteins (MAP), kinesin and
dynein motors and which PTMs they will undergo [46]. The combinatorial multiplication
of β-tubulin isoforms, MAPs and PTMs creates a complex ‘tubulin code’ [44, 47] which
directs tubulin functions, alters MT architecture and dictates MT dynamics [48].
Different β-tubulin isotypes are often tissue specific and associated with tissue-
specific functions [45]. In addition, β-tubulin isotypes often cluster in families of
identical or similar isoforms to attract groups of MAPs which work together to
perform specialised tasks [49]. These clusters contribute to the code.
The proportion and arrangement of β-tubulin isotypes along the fibres defines the
tubulin code, therefore changing their overall balance and distribution through
differential regulation can perturb the code. This can be exploited by drug treatments
to prevent cancer cells from proliferating [50], making this mechanism an attractive
target for chemotherapeutics. However, the complexity of the code prevents simple
predictions of how different actions may affect cellular processes in cancer cells; for
16

example, upregulation of one β-tubulin isoform may advantageously alter MT-
dynamics but also alter the expression and behaviour of neighbouring β-tubulin
isoforms [46].
1.5.4. The roles of β-tubulin isotypes in cancer
The different expression patterns of β-tubulin isoforms between cancer cells and
normal cells may reflect how they oppose normal MT function [51, 52]. Changes in
expression patterns have been observed in early and advanced stage tumours [53, 54].
MT metabolic adaptions have been implicated in enhanced proliferation, drug
resistance and the grade and advancement of cancer [41]. The β3-tubulin, β1-tubulin
and β2c-tubulin isotypes have all been associated with cancer progression [55, 56]. β3-
tubulin is almost exclusively found in neuronal cells where it is associated with low-
grade glioma in brain tumours [57]. It is only present at very low levels in other non-
tumour tissues and almost absent in neoplastic tumours and well-differentiated
tumours [45, 55]. However its overexpression in almost all other cancer tissue types is
associated with the most advanced, invasive and poorly differentiated tumours [56, 58].
Both β3-tubulin and β1-tubulin are linked to drug resistance [55, 56] and over-
expression of β3-tubulin and β5-tubulin has been found to destabilise MT-dynamics
in ovarian and lung cancer cells [56, 58] and may be implicated in opposing the
stabilising effect of anti-microtubule drugs, such as paclitaxels. Both β3-tubulin and
β6-tubulin overexpression are being explored as biomarkers [55, 58].
The expression patterns of β-tubulin isoforms are often different between tumour
tissues (in vivo) and cell lines (in vitro) [52]. For example, ovarian, kidney, prostate,
breast and lung cancer tissues all upregulate β1-tubulin and β3-tubulin but
17

downregulate β2c-tubulin [51]; whereas their corresponding cell lines upregulate all
three β-tubulin isoforms [51]. Metastasising cells are an exception as they are reported
to upregulate β2c-tubulin in lymph nodes [59]. This suggests the expression patterns
may be associated with rapidly growing and aggressive cancer cells as oppose to
tissue type.
Although information on β-tubulin isotype expression in CRC is scarce, both colon
tumour tissues and HCT116 cells display similar patterns [52]: both upregulate β1-
tubulin in common with most other cancer types, but both also and downregulate β3-
tubulin and β2c-tubulin [51]. These patterns are summarised in Table 1.2
Table 1.2. The β-tubulin (β1, β3, β2c) expression patterns show that unlike other cancers,
colon cancer cell lines display similar patterns in both tumour tissues and cell lines. The final
row in this table indicates that SCFA treatment of HCT116 colon cancer cells induces the
reverse pattern compared to untreated cells.
Tissue / Cell line β1-tubulin β3-tubulin β2c-tubulin
Tumour tissues
(ovarian; kidney; prostate; breast; lung)
↑ ↑ ↓
(lymph nodes) ↑ ↑ ↑Cell lines
(ovarian; kidney; prostate; breast; lung)
↑ ↑ ↑
Colon Cancer
Tissues & Cell lines
(untreated)↑ ↓ ↓
HCT116 cell lines
(SCFA-treated)↓ ↑ ↑
Specific MAPs are recruited by different β-tubulin isotypes. The MAPs have
characteristics that determine the rate of MT growth [60], therefore different classes of
β-tubulin isoforms are either associated with MT-stabilising or MT-destabilising
18

actions [61]. It is possible that cancer cells require a balance between destabilising
MTs, to increase MT dynamics in order to enhance proliferation and invasiveness,
and stabilising MTs to maintain sufficient control to ensure that functions such as
formation of the mitotic spindle are performed correctly for cell division. HCT116
colon cancer cells are inherently highly dynamic [10], therefore the downregulation of
β3-tubulin which has been reported to destabilise MT-dynamics [56, 58], may indicate
that HCT116 cells need to shift the balance towards stabilisation. In contrast, ovarian
and lung cancer cells which have slower turnover rates may need to upregulate β3-
tubulin in order to increase MT dynamics to enhance proliferation [50]. This offers cells
a mechanism of regulatory control at different stages of the cell cycle and between
different tissues by β-tubulin recruitment of specific MAPs according to their need [62].
An extensive review of MT structural processes has been provided by Nogales [63].
1.5.5. Microtubule dynamics and dynamic instability
MTs perform their multiple roles by being able to rapidly grow or shrink in response
to cellular cues through a mechanism termed dynamic instability [62, 64]. This is a cycle
of growth through subunit assembly (or rescue), followed by rapid dissociation (or
catastrophe). Despite intensive investigations, many details of MT dynamics are
poorly understood. Time-lapse microscopy [65], high resolution crystallographic
structural studies [66], biochemical, biophysical and computational modelling have
provided valuable insights [67, 68]. The favoured view is the GTP capping model [69].
This is based on the premise that each α- and β-tubulin subunit has a single GTP
binding site and can only polymerise onto MT-fibres in their phosphorylated form.
Once assembled, the α-tubulin-GTP sites are non-exchangeable and these subunits
19

remain stable within the fibre. In contrast, the β-tubulin-GTP sites readily, though
irreversibly, hydrolyse to GDP once a new β-tubulin-GTP subunit has attached to
them. The GDP subunits are unstable and the fibre is only protected by the single
layer of protective β-tubulin-GTP subunits at the MT tip, known as a cap. It is this
close coupling of β-tubulin polymerisation and hydrolysis that releases the energy
required for continued polymerisation [48].
MT growth continues until the supply of free β-tubulin-GTP subunits in the vicinity of
the fibre tip falls below a critical concentration (CC) [64]. This exposes the unstable
hydrolysed GDP-subunits, causing rapid disassembly of the MT-fibre, termed
catastrophe. Once free in the cytosol, the released β-tubulin-GDP subunits are able
to re-phosphorylate, restoring the CC, allowing fibre growth to resume, termed
rescue. CC is not only a function of tubulin subunit availability but also related to the
state of MT dynamics, so during destabilisation, when catastrophe events increase,
the CC for rescue also increases [69].
The loss of the cap and subsequent catastrophe and rescue describe a non-
equilibrium, but highly orchestrated, cycle of growth and shrinkage. This is illustrated
in Figure 1.4.
20
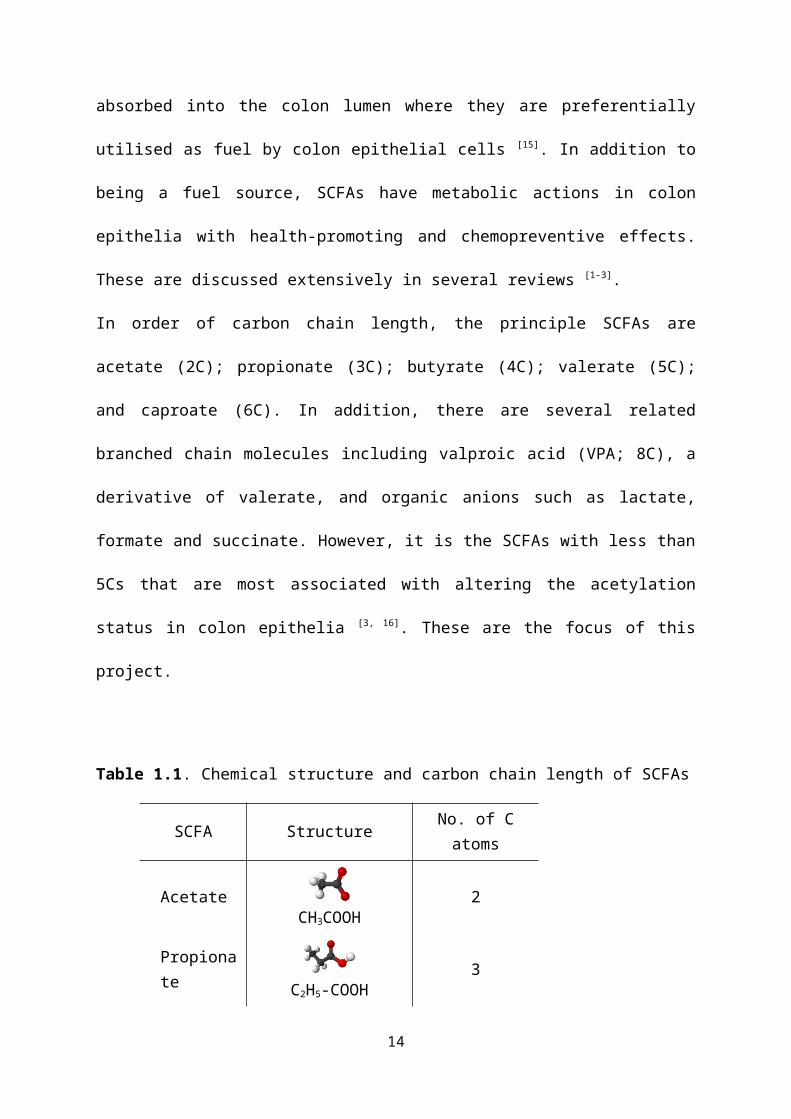
Figure 1.4. The MT cycle of dynamic instability. Slow growth is followed by rapid
dissociation (catastrophe) until regrowth (rescue) can resume. The switch between the two
states depends on the number of free phosphorylated (GTP) β-tubulin subunits in the
cytosol. Image printed with permission of the American Society for Cell Biology, Bethesda,
MD, USA. Kline-Smith SL, Walczak. Molecular Biology of the Cell 2002;13(8):2718-31 [132].
The formation of the protective cap is a cooperative event with the addition of each
new tubulin-GTP subunit increasing the number of binding sites available for further
subunit attachment [70, 71]. This may act in parallel with facilitated, or directed diffusion
in which the probability of a free β-tubulin-GTP subunit encountering an MT-fibre
increases as the length and number of MT-fibres increases [72]. The polarity of MT-
fibres, by virtue of the αβ-heterodimers, directs a colliding subunit toward the plus, or
growth, end. Both these mechanisms are illustrated in Figures 1.5 and 1.6 [73, 72].
21
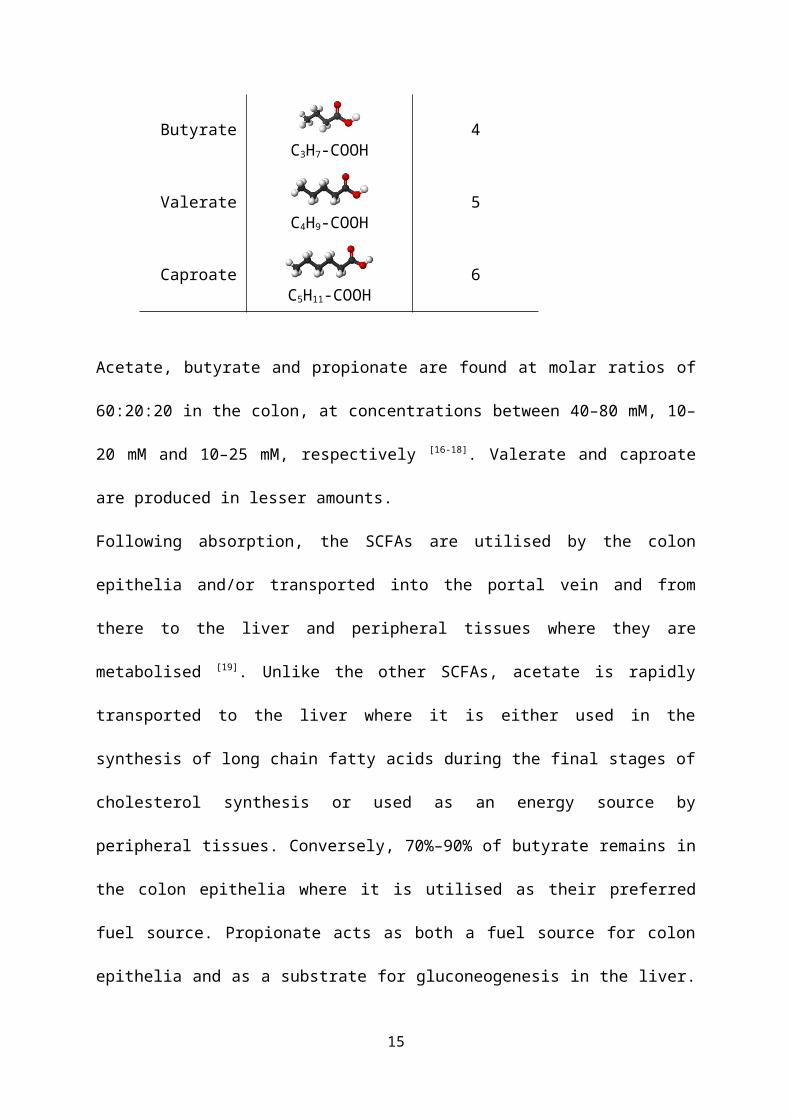
Figure 1.5. Schematic ‘monte carlo’ illustration of the MT capping model. The layer of β-
tubulin-GTP subunits forms a protective cap at the end of the MT fibre. The attachment of
each β-tubulin-GTP subunit provides an extra binding site for a subsequent attachment.
Eventually the number of free subunits in the vicinity of the fibre tip falls below a critical
concentration (CC) and the cap is lost, leading to rapid dissociation of the unprotected αβ-
subunits, termed catastrophe. [dark green, β-tubulin-GTP; dark red, β-tubulin-GDP; light
green/red, α-tubulin]. Image printed with permission from NCBI PubMed, Bethesda, MD,
USA. Martin et al. Biophysical Journal 1993; 65(2):578-96 [70].
Figure 1.6. Illustration of facilitated diffusion. Collisions between subunits and the MT fibre
are random. (A) In the classical view the probability that a free β-tubulin-GTP subunit will
encounter a fibre tip is low. (B) The presence of an attractive force, by virtue of the αβ-
heterodimer polarity, facilitates colliding subunits to ‘slide’ along the fibre towards the ‘+’ tip,
thereby increasing the probability of subunit attachment. Image printed with permission of
PLos. Mechulam et al. Computational Biology 2009; 5(1) [72].
22

Additional contributory factors include the formation of β-tubulin-GTP rescue islands
during MT-fibre assembly [73]. This proposes that because some β-tubulin isoforms
are more hydrolysis-resistant than others, they remain as tubulin-GTP remnants
within the MT-fibre in order to act as transient protective caps. This introduces
pauses during depolymerisation thereby reducing the number of catastrophes. β5-
tubulin forms such stabilising patches suggesting that downregulation of β5-tubulin
will increase destabilising activity [48]. A second consideration is the effect of cell
boundaries in vivo. These could restrict the number of free tubulin-GTP subunits
available for assembly, forcing MTs to compete for a limited supply [68].
1.5.6. Anti-microtubule drugs
Targeting MTs, in particular their role in mitosis, has proved to be one of the most
successful anti-cancer strategies to date [53]. Paclitaxels and vinca alkaloids are
among the most widely used anti-microtubule drugs (AMD). They act by disrupting
MT dynamics though over-stabilisation or destabilisation, respectively, leading to an
inability to undergo dynamic instability, or else undergo excessive dissociation.
However, AMDs show varying degrees of toxicity and increasing drug resistance
with successive rounds of treatment.
It is increasingly recognised that regulation of complex MT cellular pathways
originates with β-tubulin isotype transcription [60]. This offers an alternative approach
to traditional stabilising-destabilising AMDs by regulating transcription of different β-
tubulin isoforms or MAPs by targeting the regulatory proteins involved their
transcription. In this way SCFAs, which alter post-translational acetylation of histones
and TFs, may act as anti-mitotic agents in parallel with other anti-microtubule agents.
23

Therefore, understanding how MT dynamics can be altered though differential
expression of β-tubulin isotypes may enable targeted chemotherapeutic strategies to
be devised. In addition, by determining the net effect of β-tubulin isoform patterns at
particular stages of cancer progression may help avoid potential conflicts or improve
current therapies when drugs and anti-mitotic agents are used in combination.
1.5.7. β-tubulin nomenclature
There are several commonly used synonyms for each β-tubulin isotype. The
approved nomenclature for β-tubulin genes and proteins is defined by The HUGO
Gene Nomenclature Committee (HGNC). In general, these have been used
throughout this project. However, to avoid confusion between the β-tubulin isotype
and generic β-tubulin, the alternative synonym was adopted (β1-tubulin); and
because the Phenyx analysis of the multi-plex iTRAQ data returned the synonym,
β2c-tubulin, in place of the HUGO-approved β4b-tubulin, β2c-tubulin was also
adopted for this project (Table 1.3).
24

Table 1.3. The approved nomenclature for β-tubulin genes as defined by The HUGO Gene
Nomenclature Committee (HGNC). The names adopted in this project are highlighted in bold
text.
Approved Name Approved Symbol Synonyms, previous names and previous symbols
β-tubulin(β1-tubulin)
TUBB beta1-tubulin; Tubb5; TUBB1; TUBB5
β3-tubulin TUBB3 beta-4; TUBB4
β4b-tubulin(β2c-tubulin)
TUBB4B tubulin, beta 2C; TUBB2C
β5-tubulin (refer to β1-tubulin)
1.6. Systems Biology
Systems Biology is an inter-disciplinary field that is rapidly is gaining attention in
bioscience research as a technique for studying complex biological systems [6, 74, 5]. It
is especially relevant in this post-genomic era where many areas of research are rich
in data but hypothesis-poor [75]. Although Systems Biology is a relatively new field in
oncology research, it is proving a valuable tool for understanding the biological
mechanisms underlying tumour development and for identifying novel targets for
cancer therapeutics [76, 77].
A key aspect of Systems Biology is that it can be both data-driven and hypothesis-
driven [75]. The two approaches complement each other when attempting to
understand the relationships between ‘causes’ and ‘effects’ [78]. A hypothesis-driven
approach links a proposed ‘cause’ or ‘theory’ to observed ‘effects’ and ‘evidence’ and
is often applied to prove or disprove a hypothesis. A data-driven approach evaluates
25
multiple ‘effects’ to predict a ‘cause’ in order to formulate a new hypothesis; this can
then be tested experimentally via a second hypothesis-driven approach, thereby
forming a ‘cycle of knowledge’ [75]. This iterative cycle enables the wealth of
information that can be generated through quantitative high-throughput technologies,
and data from the rapidly expanding bioinformatic databases, to be maximised [75].
Computational mechanistic or dynamical modelling is becoming an integral part of
Systems Biology, due in part to being able to manage the large number of molecular
components and their complex interactions when conducting a system-wide study.
26

2. Colon cancer cell lines and cell culture
2.1. Introduction to cell lines
Human immortal cell lines provide biological models for observing and manipulating
metabolic pathways and mechanisms in vitro. Their wide availability and
reproducibility enable multiple experiments to be carried out and directly compared
within an experiment, between studies or globally between different groups.
Guidelines to their use are provided by the UKCCCR (UK Coordinating Committee
on Cancer Research). More recently detailed bioinformatic information on the
genetic makeup of cell lines has added to their value [81] . In oncology research, cell
lines are frequently employed to explore the efficacy of drugs or to discover potential
molecular targets for chemotherapies.
Each cell line originates from a single cell source and is associated with a specific
organism and disease state; for example, HCT116 cells for human colon cancer. Cell
lines have several advantages over in vivo models in that they avoid many the
confounding factors and non-uniformities that are associated with in vivo models [82] .
Although laboratory animal models being based on a single genetic line can also
overcome many of these limitations, there are differences between human and
animal metabolisms. However, each cell line has its own unique characteristics and
mutations which may not be translatable across phenotypes and must be
considered.
The choice of cell line depends on the requirements of the study. HCT116 cells are a
primary colon carcinoma cell line, originating from the large intestine of a human
male [83]. At the initiation of this project, the direction of focus had not been
27

established, therefore HCT116 cells were selected for reasons of consistency with
previous studies. In addition, they have the ability to grow fast, with high
reproducibility, and are robust compared to most other colon carcinoma cell lines,
such as Caco-2 or HT29 [84]. Conversely, their small size and reduced ability to form
an epithelium-like layer can make them less suitable for microscopy visualisation of
internal cellular structures compared to CaCo-2 cells, which are larger and more
appropriate for cytoskeletal observations [84]. However, recent developments in
cellomic techniques, such HCA, have allowed high-quality micrographs of HCT116
cells to be obtained for cytoskeletal research (Figure 2.1) [85], including several
published studies by our group [29, 31].
Figure 2.1. HCA micrograph of the cellular cytoskeleton in HCT116 colon cancer cells. The
red cell is undergoing mitosis displaying reorganisation of the actin cytoskeleton: [green,
microtubules; red, actin; blue, nuclei]. This micrograph, was kindly donated by J. Chowdry [85]
and taken using the HCA facility at Imagen Biotech Ltd, Manchester [86].
28

2.2. Introduction to cell culture
Cell culture is a method used to grow live cells under controlled conditions, allowing
a small number of cells to be amplified into a much larger population for
experimentation. Starter cell lines are maintained in liquid nitrogen until required and
then recovered for culture. A series of cultures from the same source can be grown
under identical environmental conditions for biological replicates or different
treatment regimens.
In order to keep cells viable and free from contamination, cell culture must be carried
out under strict sterile conditions and the cells supplied with sufficient nutrients by
the growth media. Typically, cells are maintained at 37C in a humidified atmosphere
of 5% CO2. To minimise the risk of contamination from bacteria or yeast in the
atmosphere, cell culture is performed in a sterile laminar flow cabinet and antibiotics,
such as penicillin-streptomycin are added to the growth media.
Depending on the cell line, cells are either grown in suspension or on surfaces in flat
flasks or plates. Colon epithelial cells are adherent, therefore the latter approach is
adopted. During propagation they proceed from a lag phase, as they adjust to their
environment, to a logarithmic phase when they begin to multiply exponentially, until
they eventually reach full confluence (100%) and cover the entire substrate area
(Figure 2.2). At this point the nutrients become depleted and overcrowding leads to
cell senescence and an accumulation of floating apoptotic and necrotic cells. To
overcome this, a technique known as passaging is adopted whereby a small
subculture of cells is split from the growing population and reseeded in fresh media.
Growing cells are at their most viable during their logarithmic phase, at
29

approximately 70%–80% confluence, and this is the optimal density to sub-divide
them; however, passaging cannot be continued indefinitely as senescence begins to
occur after approximately 50 passages. At this stage a new starter culture needs to
be recovered from storage and the process started again.
Once the cells have established and a sufficient number have grown, usually at pre-
logarithmic phase, the cells can be treated with the required drugs or compounds,
harvested and prepared for subsequent experimentation.
Figure 2.2. HCT116 cells under culture: a) at low density as they become established; b) at
logarithmic stage (~70%–80%). Micrographs printed with permission of ATCC, Middlesex,
UK; Cat. No. CCL-247.
2.3. Cell culture, treatment and harvesting
2.3.1. Cell culture pipeline
The HCT116 human colon cancer cell line was used as the starter cell line for all
experiments. After culture and amplification, the cells were treated with butyrate,
30

propionate or valerate. Untreated cells were cultured under the same environmental
conditions as controls. The following treatment times and SCFA concentrations were
applied depending on the requirements of the proteomic and cellomic experiments:
For multi-plex iTRAQ proteomic studies, approximately 100µg per sample were
required; for HCA cellomics, approximately 1 x 10⁴ cells per 100μl well were
required; for flow cytometry, approximately 1 x 10⁶ per sample were required; and for
Western blotting, approximately 10 μg protein per sample were required.
1. For the SCFA studies, the treatment concentrations were butyrate, 4mM;
propionate, 11 mM; and valerate, 9 mM. These were used for SCFA multi-plex
iTRAQ mass spectrometry and Western blotting quality control experiments.
2. For the propionate multi-plex iTRAQ experiment experiments, the treatment
concentration was 11 mM.
3. For the SCFA dose response experiments, the treatment concentrations were
between 0 mM and 20 mM SCFA for 24 h. These were used for the HCA
cytoskeletal experiments.
4. For the SCFA time-course experiments, the treatment concentrations butyrate,
4mM; propionate, 11 mM; and valerate, 9 mM for 3 h, 6 h, 12 h and 24 h. These
were used for flow cytometry cell cycle analysis experiments.
Four to six individual cell cultures were prepared for each experimental condition to
ensure sufficient biological replicates for statistical analyses. The cultures selected
were those with the highest yields and the greatest protein integrity.
The experimental pipeline was as follows:
1. Cell culture and amplification
31

2. Treatment with SCFAs (butyrate, propionate, valerate or untreated
controls)
3. Harvesting
4. Preparation of whole cells or proteins from whole cell lysates
5. Protein concentration assays
6. Protein integrity analysis by SDS-PAGE (polyacrylamide gel
electrophoresis).
2.3.2. Cell culture reagents
Phosphate-buffered saline Dulbecco “A” solution (PBS) was supplied by Oxoid
(Basingstoke, UK). DMEM (Dulbecco/Vogt-modified Minimal Essential Medium) with
1 g/l D-glutamine, 4 mM L-glutamine, 110 mg/l sodium pyruvate and 25 mM HEPES
was supplied by Gibco Life Technologies (Invitrogen, UK) was supplemented with
penicillin (5% (v/v); 10,000 units/ml), streptomycin (10,000 μg/ml), both from Gibco,
and 10% (v/v) heat-deactivated fetal calf serum (FCS), supplied by Biosera (Sussex,
UK). Butyrate, propionate and valerate were supplied by Sigma (UK). Corning T25,
T125 or T175 culture flasks (25 ml, 125 ml or 175 ml, respectively) were used for cell
culture and were purchased from Sigma.
HCT116 colon carcinoma cell lines were laboratory stocks. All cell lines used in this
laboratory are screened bimonthly for mycoplasma contamination. No mycoplasma
was detected in these cells or any other in the laboratory during this study.
For polyacrylamide gel electrophoresis (PAGE), ‘All Blue Precision Plus’ protein
standards and ‘Instant Blue Coomassie’ stain were supplied by BioRad (UK).
32

2.3.3. Cell culture protocol
HCT116 cells double their number approximately every 24 h with an optimal time for
passaging at around four days depending on the seeding density. In general, two to
three passages were performed to amplify enough cells for four flasks, one for each
SCFA treatment plus an untreated control, with each flask prepared using the same
media and under identical environmental conditions.
Cell culture was carried out following established procedures. Briefly, a starter
aliquot of HCT116 colon carcinoma cell line was recovered from liquid nitrogen;
seeded in T25, T125, or T175 flasks at a density of 1.6 x10³ cells/cm; cultured in
DMEM media and incubated for four days at 37°C in a humidified incubator at 5%
CO2. They were passaged at the logarithmic stage (70%–80% confluence). Cells
were detached between passages by trypsinization for 4 min at 37°C. Confluency
was assessed under an optical microscope; viability and cell counts were determined
by loading 20 µl culture on a haemocytometer (Improved Neubauer chamber) with
Trypan Blue vital stain in a 1:1 ratio to distinguish viable (unstained cells) from non-
viable cells (blue). The passages were repeated until four flasks were populated
ready for the different treatments.
2.3.4. SCFA treatment and harvesting protocols
After seeding flasks for the final passage, the cells were grown under culture for 24 h
to allow the cells to adhere to the flask surface. They were then treated with SCFAs
at either IC50 (G2/M) concentrations or between 0–20 mM for dose response
experiments. Untreated cells were prepared for controls. After treating, the cells were
returned to the incubator to continue growing for the specified times (either 24 h or
33

0–24 h for the time course experiments). Depending on the severity of treatments,
they each acquired different levels of confluence, health and viability.
With the exception of the HCA experiments which were performed in 96-well plates
as described below, the cells were harvested after treatment by scraping to release
them from the plate surfaces (instead of trypsinization), transferred to PBS buffer in
Falcon tubes (Sigma) and centrifuged to remove any residual media by discarding
the supernatant. The cell pellet was resuspended in PBS buffer for subsequent lysis
or whole cell analysis.
For HCA, both culture and treatment protocols were carried out in 96-well plates.
Instead of being harvested, the cells were fixed in situ and stained with fluorescent
antibodies to highlight cellular proteins and structures of interest, or with Hoescht to
identify the nuclei. These procedures are described in detail in the following sections.
2.3.5. Preparation of whole cell lysates for proteomic studies
Lysis was performed to release the proteins from the cells for proteome analysis.
The cells were resuspended in 1 M TEAB-0.05% SDS lysis buffer. Sodium dodecyl
sulfate (SDS) is a detergent which ruptures the nuclear membrane to solubilise the
proteins. Proteolysis and degradation of the proteins was minimised by adding a
protease inhibitor cocktails and keeping the samples on ice at -4C. In order to
fragment the DNA, which otherwise remains as a dense gel, the samples were
sonicated using a Bioruptor (Diagenode) for 10–15× 30 s cycles. The whole cell
lysates were stored at -80C until required.
34

2.3.6. Preparation of whole cell samples for flow cytometry analyses
Harvested cells in PBS were gently centrifuged in a microfuge at 1000 rpm, and then
fixed by resuspension in 1 ml 70% ice-cold ethanol which was added drop-wise and
vortexed to prevent aggregation and clumping. RNAse was added to remove RNA
from the cells which could distort the results. The cells were then flash frozen in
liquid nitrogen and stored at -80C until required.
2.3.7. Protein concentration assays
In order to measure the protein concentrations of the cell lysates, protein assays
were performed in comparison to standard Bradford protein assay reagents (BSA;
BioRad, UK). The lysates were loaded in a 96-well microplate, in triplicate, alongside
a BSA concentration series and their absorbance was measured at 595 nm using a
Multi-detection Reader (BioTek). The protein concentrations were determined by
plotting their absorbance against the standard BSA curve.
2.3.8. Protein integrity assays by polyacrylamide gel electrophoresis (PAGE)
For confirmation of protein integrity, the lysates were resolved by electrophoresis on
a one-dimensional 10% SDS-PAGE gel against an All Blue Precision Plus (BioRad)
standard molecular weight ladder, following standard protocols. This technique
separates proteins on a gel according to their molecular weights. The proteins are
negatively charged to enable them to migrate between electrodes. Smaller proteins
migrate faster through the pores of the gel compared to larger proteins. The key
elements of the SDS-PAGE protocol are as follows:
35

1. Proteins were denatured to unfold them and conferred with a negative charge by
using an SDS-based buffer followed by heat shock at 95C for 5 min.
2. Lysates containing equal amounts of protein (30–50 μg) were loaded onto the gel
to ensure direct comparisons. Laemmli blue loading buffer was added to the
lysates so that the leading edge of the proteins could be tracked during
electrophoresis. This is a glycerol-based buffer so the samples sink the base of
the loading pockets and don’t diffuse into the electrophoresis buffer during
loading. The All Blue standard protein ladder was also loaded into one of the
pockets.
3. After migrating, the proteins were stained by immersing the gel in Coomassie blue
stain on a rocking bed for 30 min at room temperature. The protein bands were
visualised and photographed on a white-light box.
2.4. Cell culture results
2.4.1. The half maximal inhibitory concentration (IC50)
The half maximal inhibitory concentration (IC50) is the amount of drug, in this case
SCFA, required to inhibit a metabolic process by half. The corresponding half
maximal effective concentration (EC50) is the amount of substance required to induce
an effect. Because many biological functions are sigmoidal, both are useful
measures of a drug’s effectiveness. In the preceding project [4, 90], the high-throughput
capacity of HCA was exploited to quantify the effect of different SCFAs in HCT116
cells in a dose response experiment. The cells were treated with butyrate, propionate
or valerate at concentrations between 0–20 mM for treatment times of 24 h or 48 h.
The data were compiled to calculate the cell count and percentage of cells at each
36

phase of the cell cycle, for each treatment condition. Each treatment was performed
in triplicate to allow statistical analysis to be carried out. The results were analysed
by the author and by Dr J Waby. A consensus was reached that the statistically most
robust results were the IC50 values for G2/M arrest at 24 h. Table 2.1 gives the mean
SCFA IC50 values for each treatment condition. Figure 2.3 gives a graphical overview
of the cell counts, cell cycle and IC50 results at both 24 h and 48 h treatment times.
Table 2.1. IC50 values for different cell cycle check points induced by SCFA treatments of
HCT116 colon cancer cells. The quantitative data was compiled by HCA and statistical
analysis performed using GraphPad Prism v5. Software. A graphical overview is shown in
Figure 2.3.
Cell cycle IC50 [mM] SD
(treatment time) butyrate propionate valerate butyrate propionate valerate
G1 (24 h) 4.5 10.9 10.0 1.18 1.30 n/a
G2/M (24 h) 3.9 10.6 9.0 1.13 1.18 n/a
G1 (48 h) 2.0 2.0 1.9 indeterminate
G2/M (48 h) 3.1 14.3 10.1 1.25 indeterminate
37

a) Cell count of HCT116
cells after 24 h treatment
with SCFAs between 0–
20 mM)
b) Cell count of HCT116
cells after 48 h treatment
with SCFAs between 0–
20 mM)
c) IC50 values for SCFA
treatments of HCT116 at
24 h and 48 h. Values for
G1 cell cycle arrest and
G2/M cell cycle arrest
(Table 2.1).
Figure 2.3. Determination of treatment conditions: HCT116 cells were treated with SCFAs
between 0–20 mM for 24 h or 48 h. The cell counts and the percentages of cells at each
phase of the cell cycle were quantified by HCA. There is a clear reduction in cell count with
each treatment. A consensus was reached based on these results that the IC50 values for
G2/M arrest were the statistically most robust for subsequent experimentation.
38

2.4.2. Biological replicates and protein integrity
A sufficient number of biological replicates of SCFA-treated HCT116 colon cancer
cells were prepared to give the required protein yields at high protein integrity (Figure
2.4) for subsequent experimentation. Protein lysates and whole cell samples were
prepared with minimal protein degradation of aggregation.
Figure 2.4. 10% SDS-PAGE protein gel showing protein integrity of the HCT116 cells after
culture and treatment with SCFAs. [AB, all-blue protein marker; B, butyrate; P, propionate; V,
valerate; C, untreated control. The AB ladder gives protein masses in kDa].
39

3. Multi-plex iTRAQ proteomics confirmed that odd and even-chain
SCFAs differentially regulate distinct sets of proteins in HCT116
colon cancer cells, including β-tubulin isotypes
3.1. Contribution of multi-plex iTRAQ to the overall project
Multi-plex iTRAQ is a state-of-the art proteomic technique that can identify
changes to the whole proteome by different treatments in cells, and identify those
that are unique to an individual treatment.
Multi-plex iTRAQ was able to determine if the odd and even-chain SCFAs
displayed distinct actions in HCT116 colon cancer cells.
Multi-plex iTRAQ provided high-quality quantitative data from multiple biological
replicates of HCT116 cells treated with SCFAs.
3.2. Introduction to proteomics
Global proteomics is one of a new set of ‘omics’ techniques, which also encompass
genomics, metabolomics and cellomics. These can deliver vast amounts of data on
molecular systems. Bioinformatics and pathway analysis can put the ‘omics’ data
into context to enable advances to be made in understanding complex biological
processes and mechanisms from which hypotheses can be generated.
3.2.1. Multi-plex iTRAQ proteomics
Multi-plex iTRAQ (isobaric tag for relative and absolute quantitation) mass
spectrometry is a state-of-the-art proteomic technique, able to assess the entire
40

proteome of treated cells at specific points of the cell cycle and investigate changes
in protein expression by identifying which proteins are significantly up or
downregulated relative each other, control samples, different treatments conditions
or PTMs. High-quality data generation and developments in proteomic approaches
enable valuable insights to be gained into many cellular processes [29, 87].
Multi-plex describes the use of isobaric tags to label different samples with unique
stable reporter ions to identify and relatively quantify the large number of peptides
and proteins generated upon fragmentation. Ground-up shotgun proteomics, named
from the early mass spectrometry analysis of DNA, and liquid chromatography
tandem mass spectrometry (LC MS/MS), which exploits nano-chromatography, are
able to provide high-resolution separation of peptide fragments prior to analysis.
Each fragmented peptide has a distinct signature based upon its mass/charge (m/z)
ratio. The relative expression of the proteome from up to eight biological replicates or
different treatment conditions can be evaluated reproducibly within a single
experiment. Amine-reactive isobaric tags are utilised to label the primary amines of
all the peptides on trypsin digestion. Their associated stable reporter ions enable the
resulting spectra to be relatively quantified by analysing the reporter groups. The
isotype reporter ions have masses of 113, 114, 115, 116, 117, 118, 119, and 121. A
reporter ion with a mass of 120 is not used, as this is the mass of phenylalanine
immonium and would therefore obscure the results. By combining the tagged
samples in a 1:1 ratio, the relative intensities of the signals will represent the relative
abundances of the analysed peptides in each sample, as the resulting protein
expression profiles can be compared on a ratiometric basis to determine the
relationships between them.
41

Although multi-plex iTRAQ has proved to be an effective and robust tool, which has
successfully contributed to advances in understanding complex biological
mechanisms [87], it is necessary to validate and support the results by independent,
complementary experiments. This is because the analyses rely on statistical
comparisons between peptides and protein databanks. In addition, multi-plex iTRAQ
using the shotgun approach underestimates the results. The reasons, and strategies
to ameliorate this, are discussed in detail in ‘iTRAQ Underestimation in Simple and
Complex Mixtures: “The Good, the Bad and the Ugly” by Ow et al [88]..
A review comparing mass spectrometry techniques is given by Evans et al [89]. These
include the following: if two or more precursor ions with similar m/z ratios, and similar
passage times during HPLC, are selected for fragmentation they will be sequenced
and quantified at the same time [89]. In addition, when comparing multiple replicates,
the number of peptides identified by all the replicates will be lower than the total
because the set of peptides identified by each assay is random. Hardware and
software approaches, such as isotopic correction [88], can improve accuracy, and
despite the underestimation in protein abundance, the direction of differential up or
down regulation is generally unaffected [88, 89]. For this study, multi-plex iTRAQ was
considered the best technique to use by offering high-throughput quantitative
capability with proven results. A strength of iTRAQ is that it can be utilised in
discovery mode, meaning samples can be objectively analysed for differences, from
which pathways emerge. This was a key aim of the project.
42

3.1.2. Multi-plex iTRAQ analysis of cytoskeletal proteins
Interpreting multi-plex iTRAQ data and understanding the implications of changes
within the proteome can be highly complex because of the many different interlinking
pathways and mechanisms involved. For this reason, observations from
complementary techniques are often employed to suggest directions for focus. In this
study, evidence from HCA quantitative cellomics had indicated that the SCFAs
induced MT cytoskeletal breakdown with a concurrent increase in G2/M mitotic
arrest in HCT116 cells. Preliminary analysis of the iTRAQ data had identified β-
tubulin isotypes as being among the most differentially regulated protein group
between the SCFAs (Table 3.3) [4]. A recent hypothesis proposing a ‘tubulin code’
[47], suggested that cytoskeletal formation and function may be linked with β-tubulin
isotype expression. Although cytoskeletal proteins are relatively abundant in cells,
and therefore small differences between samples are frequently detected, there was
increased interest in these specific β-tubulin isotypes as they were uniquely targeted
by the odd-chain SCFAs and have been associated with invasive and aggressive
colon cancers [56]. Taken together, the evidence directed the focus of this project
towards β-tubulin isotypes and MT cytoskeletal proteins with an aim to understand
the pathways involved.
43

3.3. Multi-plex iTRAQ: Project outline
Detailed descriptions are given in the experimental methods.
3.3.1. Experimental approaches
This study took two separate approaches to determine the proteins differentially
regulated in HCT116 colon cancer cells by SCFA treatments. The first involved a
multi-plex iTRAQ experiment carried out on quadruplicate biological replicates of
propionate treated samples compared to untreated control samples. The second
approach was based solely on targeted data-mining of the raw, but still unexplored,
multi-plex iTRAQ data generated in the previous multi-plex iTRAQ experiment [4, 90].
This has been performed on biological duplicates of butyrate, propionate and
valerate treated samples.
As discussed above, orthogonal validation is essential when interpreting iTRAQ
results. In this study, Western blotting confirmed the iTRAQ observations in relation
to the direction of change (up or down regulation).
The peptide fragments identified by the multi-plex iTRAQ experiments were matched
against the following protein databanks: SwissProt/TrEMBL (also known as UniProt)
[91] and NCBInr [92]. Each has their own advantages. SwissProt is manually curated
and cross-referenced and TrEMBL is computationally analysed and includes entries
awaiting full manual annotation. Although SwissProt/TrEMBL often lags behind other
databases in numbers of proteins, it is considered the ‘gold standard’ database.
NCBInr is also an established protein databank respected by the scientific
community. It is a non-redundant database compiled from several other databases,
44

including SwissProt, and has the advantage of being more up-to-date and can
therefore identify additional proteins.
A quality control overview of the experimental protocols and data processing was
gained by analysing the iTRAQ labelling efficiencies, percentages of peptide hits,
coverage and confidence values (Table 3.1). Correlation plots (scatter plots) and
dendrograms (cluster analysis) provided quality assurance for the biological
replicates.
3.3.2. Data analysis and data-mining
Quantitation analyses of the multi-plex iTRAQ-Phenyx data was performed using
‘uTRAQ’ and ‘SignifiQuant’ statistical software applications developed in house. The
methods underlying uTRAQ and SignifiQuant are described in greater detail in the
experimental methods. (Application creator, J. Noirel, The University of Sheffield [93]).
Propionate was selected for the quadruplet iTRAQ experiment because it shared
regulatory effects with both butyrate and valerate. By increasing the number of
biological replicates to the maximum of four (with four corresponding control
samples), confidence in the statistical analyses and quality control assessments
could be enhanced. The analysis pipeline for the propionate quadruplet biological
replicate data is shown in Figure 3.1.
The SCFA duplicate biological replicate data generated during the preceding multi-
plex iTRAQ experiment had already been analysed using high-stringency
SignifiQuant quantitation and had been published [90]; however, a considerable
wealth of quantitation data from uTRAQ analysis remained unexplored. This was
mined more comprehensively by cross-referencing the uTRAQ and SignifiQuant
45

analysis results against the UniProt and NCBInr databases to exploit the respective
advantages of both. Although SignifiQuant is the ‘Gold standard’ technique for
determining differential regulation, the added layer of analysis often causes
potentially important significantly differentiated proteins to be suppressed. In
contrast, uTRAQ identifies all the proteins that are significantly differentially
regulated >SD from the mean, and therefore includes false negatives that are
excluded by SignifiQuant. By understanding their relative strengths and weaknesses,
the two approaches can be complementary, maximising the information returned.
3.3.3. Multi-plex iTRAQ analyses pipelines
The multi-plex iTRAQ analysis pipelines are given in Figure 3.1. (a) For the
propionate quadruplet experiment, where both the iTRAQ experiment and data
analysis were performed in this project, the complete pipeline was followed. (b) For
the SCFA duplicate experiment, only the data-mining pipeline was followed in order
to comprehensively explore the differential expression of cytoskeletal proteins,
particularly those associated with MT β-tubulin subunits.
46

Figure 3.1. Multi-plex iTRAQ analysis pipeline for proteins significantly differentially
regulated by SCFA treatments of HCT116 cells: a) Propionate quadruplet experiment; b)
SCFA duplicate experiment. After quantification, protein data from both experiments were
combined and proteins differentially regulated with the highest significances and/or greatest
number of peptide hits were selected.
A) Pipeline for SignifiQuant analysis (highest stringency analysis):
1. Multi-plex iTRAQ data were submitted to Phenyx to generate peptide
fragment and protein data.
2. The results were quantitated by uTRAQ statistical analysis to identify
proteins differentially regulated [93].
3. uTRAQ data was taken forward for SignifiQuant [93] analysis.
4. Proteins differentially regulated with the highest significance (MTC; p<0.05)
were selected.
47
B) Pipeline for data-mining by uTRAQ frequency (SD) analysis to identify all proteins
significantly differentially expressed including those suppressed by SignifiQuant
analysis:
1. uTRAQ quantitation identified the linear fold changes of proteins differentially
regulated by SCFA treatments relative to untreated HCT116 cells.
2. The means and SD of the fold-changes were calculated, and proteins with
fold changes >SD were considered significantly differentially regulated.
C) Further, complementary experimentation and bioinformatic analyses:
1. Data from both multi-plex iTRAQ experiments (propionate quadruplets and
SCFA duplicates) and both analysis methods (SignifiQuant and uTRAQ
data-mining) were compiled and combined.
2. Cytoskeletal proteins differentially regulated with the highest level of
significance were selected for comparison with the complementary HCA
cellomic data.
3. β-tubulin fold change data were taken forward to the computational
dynamical model for parameter matching (Modelling chapter).
4. All data for differentially regulated proteins were submitted for bioinformatic
pathway analyses, described in detail in the Bioinformatics chapter.
3.3.4. SCFA biological replicates
Sample reproducibility is essential to ensure that significant changes can be
distinguished from random variations. Reproducible trends in proteomic methods can
be achieved with two or three biological replicates [94], however multi-plex iTRAQ
enables up to eight samples to be compared. In the previous SCFA experiment,
biological duplicates of three different SCFA treatments and untreated controls had
48

been compared [4, 90]. For the propionate experiment carried out in this project,
biological quadruplets of propionate samples were compared to quadruplet
replicates of untreated control samples. The reproducibly between the biological
replicates was determined by constructing correlation plots to measure how closely
the replicates grouped (Figure 3.5).
3.4. Multi-plex iTRAQ: Experimental methods
3.4.1. Multi-plex iTRAQ reagents and solutions for protein labelling
Biological replicates of total cell lysates from SCFA-treated and untreated HCT116
cells were prepared as previously described. Four biological replicates of propionate
treated samples and four untreated control samples were taken forward for the 8-
plex iTRAQ experiment. These were proteolytically digested with trypsin and labelled
according to the protocol outlined by Applied Biosystems. This entailed taking the
samples to a final volume of 21 μl at 5 mg protein/ml in 1 M TEAB/0.05% SDS. The
samples were reduced by adding 2 μl 50 mM TCEP (Sigma) and incubated at 60°C
for 1 h. Cysteine residues were blocked by adding 1 μl MMTS (Sigma) at room
temperature for 10 min. Trypsin at 4 μg/μl in resuspension buffer (50 mM acetic acid)
was made up to 1 μg/μl in TEAB to the correct pH, 10 μg was then added to each
sample which were incubated overnight at 37°C in a humidified atmosphere of 5%
CO2. The trypsin digest was verified by SDS-PAGE using 5 μg of each sample.
Isopropanol (50 μl) was added to each of the 8-iTRAQ reagents (Applied
Biosystems) before they were added to their respective biological replicates. The
isobaric labels were assigned as follows for the propionate quadruplet experiment:
propionate, 113, 114, 115, 116; untreated, 117, 118, 119, 121. In the previous SCFA
49

experiment: untreated, 113, 114; butyrate, 115, 116; propionate, 117, 118; valerate,
119, 121. The samples were incubated at room temperature for 2 h. All the samples
were pooled in a 1:1 ratio and dried in a vacuum centrifuge (Eppendorf Concentrator
5301). The samples were reconstituted in 90 μl of 20% acetonitrile and 0.1% formic
acid. The pH was adjusted to pH2, the 8-plex peptide mixture was sonicated and any
precipitate was pelleted and discarded by centrifugation.
3.4.2. Strong cation exchange (SCX) and High-performance liquid chromatography
(HPLC)
Peptide pre-fractionation was carried out on a BioLC HPLC (Dionex, Surrey, UK)
using a PolySulfoethyl-A Pre-Packed Column (PolyLC, Columbia, MD) with a 5 μm
particle size and column dimensions of 100 mm × 4.6 mm i.d., 200 Å pore size. SCX
was achieved using a low ionic buffer A (20% acetonitrile, 0.1% formic acid) and a
high ionic buffer B (20% acetonitrile, 0.1% formic acid, 500 mM KCl). Each sample
was loaded onto the column and washed for at least 60 min at a flow rate of 0.4
ml/min with 100% SCX Buffer A to remove salts, TCEP and unincorporated iTRAQ
reagent. Peptides were separated using a gradient of SCX Buffer B at the same flow
rate of 400 μl/min. Buffer B levels were increased from 0%–25% from 5 min to 30
min; then from 25%–100% over 5 min; followed by 26%–100% over the next 15 min.
Buffer B was held for another 5 min for isocratic washing prior to column re-
equilibration with buffer A. The sample injection volume was 100 μl and the liquid
flow rate was 0.4 ml/min. The SCX chromatogram was monitored using UVD170U
ultraviolet detector and Chromeleon software v.6.50 (Dionex LC Packings). Fractions
were collected using a Foxy Jr. (Dionex) fraction collector in 30 s intervals (between
16–32 min) or 1 min intervals (0–16 min and 32–49 min) in low-binding 1.5 ml
50
microcentrifuge (Eppendorf) tubes to minimise unspecific binding loss. Fractions
were vacuum-concentrated prior to LC-MS/MS analysis.
3.4.3. Multi-plex iTRAQ tandem-mass spectrometry
Fractions that had been collected by offline separation were eluted through the
Famos-Ultimate 3000 nano-LC system (Dionex LC Packings) interfaced with a
QSTAR XL (Applied Biosystems; MDS-Sciex) tandem ESI-QUAD-TOF MS. Vacuum
dried fractions were resuspended in loading buffer (3% acetonitrile, 0.1%
trifluoroacetic acid) and injected and captured into a 0.3 × 5 mm trap column (3 μm
C18 Dionex-LC Packings). Trapped samples were then eluted into a 0.075 × 150
mm analytical column (3 μm C18 Dionex-LC Packings) using an automated binary
gradient with a flow of 300 nl/min from 95% buffer A to 35% buffer B over 90 min,
followed by a 5 min ramp to 95% buffer B with isocratic washing for 10 min.
Predefined 1 s 350−1600 m/z MS survey scans were acquired with up to two
dynamically excluded precursors selected for a 3 s MS/MS (m/z 65−2000) scan. The
collision energy range was increased by 20% compared to the unlabelled peptides in
order to overcome the stabilising effect of the basic N-terminal derivatives and to
achieve equivalent fragmentation as recommended by Applied Biosystems.
3.4.4. Multi-plex iTRAQ spectra analysis
Multi-plex iTRAQ data analysis was carried out following established protocols as
previously described [95]. Tandem MS data generated from the QSTAR XL were first
converted to Mascot generic format (MGF) peaklists via the mascot.dll embedded
script (v.1.6; release No. 25) in Analyst QS v.1.1 (Applied Biosystems; MDS-Sciex).
51

The spectra deconvolution was disabled around the iTRAQ reporter region (113–119
and 121 m/z).
3.4.5. Phenyx analysis (post-mass spectrometry)
The MGF files were submitted via remote access to Phenyx (GeneBio, Geneva), an
open-source search engine which calculates the intensity of the iTRAQ reporter ions
relative to precursor mass intensity. Phenyx returned peptide fragments matched
against user selected protein databanks to identify the statistically most likely
proteins. Relative quantification was achieved by referencing the iTRAQ reporter
intensities for the peptides to the centroided data provided in the MGF peak-lists.
The calculation performs fixed modification of MMTS cysteines and 8-plex iTRAQ
modifications on N-terminal lysines (K). User defined criteria for the Phenyx analysis
included setting the databanks and tolerances. For this study, the following criteria
were applied:
a) Protein databanks for the SCFA experiment: NCBInr (20080221), accessed
23/07/2009; SwissProt (20100511), accessed 09/08/2010.
b) For the propionate experiment: SwissProt (20100427), accessed 05/05/2010.
c) Mass tolerances for identification were set to 0.4 Da MS and 0.4 Da MS/MS.
d) Peptide level filters were set to a z-score of 5.0.
e) Significance was set to a p-value of 0.0001.
f) Phenyx protein scores were set using a total z-score of 20.
Phenyx returned the following protein and peptide metadata (Table 3.1):
52
a) Databank ID: The Databank name and corresponding protein ID (UniProt, AC;
NCBInr, gi).
b) score: The protein score based on the Databank ID score.
c) valid pept. seq: The number of validated unique peptide sequences on the
protein. This number directly influences the protein coverage.
d) valid pept†: The number of valid peptides on the protein, taking into
consideration any redundant valid peptides.
e) pept*: The total number of identified peptides (valid and non-valid).
f) % Cov: The % coverage of the protein by the validated non-redundant
peptides.
g) Description: The full protein description.
* Valid vs. non-valid peptides: There will be some peptides returned by Phenyx that
are shared by two or more isoforms of the same protein. The software assigns the
peptide sequence to the more abundant protein isoform, i.e. the isoform which has
more supporting peptides in the data set. This will be set as the 'valid' peptide.
Although the ‘invalid’ peptide has the same sequence as the 'valid', it is assigned to
the less abundant protein isoform. It should be noted that the assignment is not
always correct and is a compromise made by the software.
† Valid peptide sequence (‘valid pept seq’) is the parameter used for interpretation of
the iTRAQ results. This gives the number of validated unique peptide sequences on
the protein. Because trypsin cleavages occur at the c-termini of lysine (K) and
arginine (R), a peptide sequence can be validated by several peptides, e.g. the
sequence QIGAEKRCSSTR can be represented by QIGAEKR or QIGAEK, which
represent 2, 1 and 0 missed cleavages. These peptides are mapped back to the full
53

protein sequence which determines the protein coverage (the percentage of the
protein sequence covered).
Proteins identified by <3 peptides, along with reverse hits (REVS), were discounted
from further analyses. By convention, one-hit wonders, (OHW) are extended to
include proteins identified by 2 peptides (i.e. <3 peptides); however, this approach is
currently under debate [96, 97]. The confidence and quality of the data were established
based on these parameters.
3.4.6. Post-Phenyx analysis
Phenyx data from successful peptide matches were submitted for protein
quantitation analysis (Quant) to generate protein fold change data between samples
and controls. The process was automated using software tools developed in-house
(uTRAQ and SignifiQuant) [88, 93, 98]. Briefly, the reporter ion intensities were relatively
compared to generate lists of ratios, these were median-normalised and false
positives were limited by setting a z-score (z = 7) and logarithmic p-value (p = 10-6).
3.4.7. uTRAQ quantitation
Application creator, J. Noirel, The University of Sheffield [93].
uTRAQ returned the relative fold levels of differential expression between proteins
from treated samples relative to those from control samples [93]. Results were given
as log and linear values, with isotope correction and median correction applied and
associated error factors, as described below. To identify proteins significantly
differentially expressed, a frequency plot was constructed as follows: the means and
54

standard deviation (SD) of the uTRAQ data were calculated and proteins with fold
changes >1 SD from the mean were considered significant (#); and those >2 SD
from the mean were considered highly significant (##).
Isotope correction (IC) was performed by an algorithm which takes the similarity of
reporter intensity profiles into account. Median correction (MC) applies a baseline
correction so that sample-to-sample comparisons can be performed.
3.4.8. SignifiQuant quantitation
Application creator, J. Noirel, The University of Sheffield [93].
SignifiQuant is a theoretically improved analysis tool compared to uTRAQ frequency
plots that processes the uTRAQ data using a statistical strategy to apply higher
levels of stringency to the data [88, 93]. In addition to setting p-values, SignifiQuant
gives an option for multiple test correction (MTC) which reduces the number of false
positives; however, this is often at the expense of false negatives, therefore it may
reject some of the proteins which are significantly differentially regulated. In contrast,
the uTRAQ SD-frequency analysis ensures that more false negatives are correctly
identified but may accept more false positives. The choice of p-value was based on
experience, this is because the p-values are arbitrary and the FDR (false discovery
rate) cannot be inferred from a threshold p-value. A p-value of 0.05 (without MTC) for
two replicates has been found to give an FDR less than 1%, therefore this value was
applied.
A decision was made to target the cytoskeletal proteins in the SCFA-duplicate
dataset by uTRAQ SD-frequency analysis, but to restrict analysis of the propionate
quadruplet dataset to SignifiQuant as this data had not previously been analysed.
55

3.4.9. Multi-plex iTRAQ quality control by correlation plots and dendrograms
Quality control of the multi-plex iTRAQ protocol was performed by constructing
correlation (or scatter) plots, and dendrograms (cluster analysis) to determine how
closely the biological replicates matched, and how the different treatments clustered
relative to each other. The correlation plots gave pair-wise comparisons between the
biological replicates by plotting log2 fold-changes for each dataset against another.
Ideally these should follow a straight line with a gradient of 1 but in reality there is
always an element of scatter. Pearson’s correlation coefficient is frequently used to
measure the strength of linear correlation between two sets of data when data is
parametric, i.e. both measurements are continuous and normally distributed, and this
was the method adopted here. This gives a value between +1 and -1, where +1 is
maximum positive correlation (dependence) and -1 is maximum independence.
Correlations were performed between each pair of data (117:118 and 119:121), each
having a total of 331 rows. A second correlation was performed between all four
replicates in a two-dimensional array, calculated by comparing each replicate against
the others, giving a total of 1986 rows, as follows:
P117:P118P117:P119P117:P121P118:P119P118:P121P119:P121
The dendrograms showed how the reporter ions, and therefore the peptides, from
the treated and untreated biological replicates clustered. High correlation between
replicates gives maximum overlap indicating high reproducibility. Ideally there should
56

be low divergence between similar treatments, particularly between the reference
controls where they have important consequences on the quality of data. iTRAQ is a
shotgun proteomic technique, therefore the peptides identified for each sample are
random so the overlap between replicates can vary in the dendrogram. In the event
of a significant mismatch, it is often preferable to discount one of the replicates. The
replicate that is discarded is generally the one that produces the highest levels of
scatter.
3.5. Multi-plex iTRAQ: Results
3.5.1. Relative quantification by multi-plex iTRAQ mass spectrometry
Relative quantification was derived by comparing the individual iTRAQ reporter ion
intensities, with each sample tagged by a unique reporter ion representing a different
SCFA treatment. Peptide fragments are identified by their m/v signatures following
fragmentation, and SCX fractionation enabled single peptide spectra to be analysed.
Figure 3.2 is a representative MS/MS spectrum showing the isobaric reporter ion
peaks, 113–121, for a trypsin labelled peptide fraction from an SCFA-treated
HCT116 sample.
57

Figure 3.2. Representative QSTAR spectrum for an SCX fraction (#29) showing the isobaric
ion peaks (113–121) for the pooled trypsin tagged SCFA-treated and untreated HCT116
samples. MS/MS Information about this fraction is given at the top left including fraction
number and mass to charge ratio (749.9 m/z).
Labelling efficiency, the percentage of lysines tagged by the reporter ions, the
percentage of reverse peptide hits (REV) and percentage of one-hit wonders (OHW),
where a protein was identified by <3 valid peptides, were calculated from the Phenyx
58
peptide fragment data and Phenyx summary data, as described in the experimental
methods. The labelling efficiency was >95% and the percentage of reverse peptide
hits <5%. These verified the quality of the multi-plex iTRAQ protocol providing
confidence in the final data set. OHW and REVs were excluded from any further
analyses. All these parameter data are presented in Table 3.1 for the propionate
quadruplet experiment; parameters for the SCFA duplicate data from the preceding
multi-plex iTRAQ experiment have been included for comparison [90]. The full list of
identified proteins is given in Appendix I.
59

Table 3.1. (a) Phenyx analysis parameters, including the numbers of peptides and proteins
identified, are listed for each multi-plex iTRAQ experiment with respect to their chosen
protein databank. (b) After submitting the Phenyx data for quantification analysis by uTRAQ
and SignifiQuant [93], the proteins differentially regulated by each SCFA treatment relative to
untreated controls were quantified. The complete list of proteins is provided in Appendix I.
a)
Parameters SCFA
duplicates
SCFA
duplicates
Propionate
quadruplets
Databank and NCBInr UniProt UniProt
Date accessed 23/07/2009 09/08/2010 05/05/2010
p-value (min peptide p value) 1x10⁻⁶ 1x10⁻⁶ 1x10⁻⁴
z score (min peptide z score) 7 6 5
Peptide matches (not including
reverse hits [REV])
705 1191 5266
Protein matches 256 313 599
No. one-hit-wonders (OHW) 140 151 340
No. protein matches #valid peptide
seq. >1
116 162 259
No. protein matches #peptide >1 132 182 359
% OHW (OHW / protein matches) 55% 48% 57%
% Revs (needs to be <5%) 0.42% 1.57% 0.00%
Labelling efficiency (needs >95%) 97.5% 96.2% 100.0%
b)
Quantifications SCFA
(NCBInr)
SCFA
(UniProt)
Propionate
(UniProt)
No. of proteins differentially regulated
(uTRAQ ‘Quant’ analysis)
82 102 331
uTRAQ >SD (68%) 26; 18; 24 n/a 78
uTRAQ >2 SD (95%) 4; 6; 4 n/a 17
SignifiQuant (MTC off; p=0.05) n/a 36 21
n/a: quantification analysis was not carried out by that method or against that databank for that dataset.
60

3.5.2. Propionate quadruplet results: Protein matches and quantification data
Phenyx analysis identified 599 proteins with 100% labelling efficiency and 0.0%
reverse hits. There were 359 protein matches >OHW. Quantification by uTRAQ
referenced against the UniProt databank identified 331 differentially regulated
proteins relative to untreated controls for all four propionate replicates (160
upregulated; 171 downregulated). Frequency analysis of the uTRAQ data showed
that 61 proteins were differentially regulated >SD (68%) and 17 by >2 SD (95%).
Subsequent quantification of the uTRAQ data by SignifiQuant identified 21 proteins
that were differentially regulated with very high significance (MTC off; p<0.05).
Although the uTRAQ frequency analysis returned more proteins as significantly
differentially regulated, the proteins identified by SignifiQuant could be accepted with
higher confidence. These figures are summarised in Table 3.1a. The full protein lists
are provided in Appendix I.
3.5.3. SCFA duplicate data-mining: Protein matches and quantification data
Quantification by uTRAQ, referenced against NCBInr and UniProt databanks,
identified 82 and 102 proteins, respectively, as differentially regulated by SCFA
treatments relative to untreated controls. Frequency analysis of the uTRAQ data
against NCBInr showed that of these, butyrate, propionate and valerate differentially
regulated 26, 18 and 24 proteins >SD; and 4, 6 and 4 proteins >2 SD, respectively.
Quantification by SignifiQuant against UniProt identified 36 proteins as differentially
regulated with a significance of p<0.05 (MTC off). These figures are summarised in
Table 3.1b.
61

3.5.4. Differential regulation of cytoskeletal proteins
The quantifications identified several of the principle cytoskeletal proteins as
significantly differentially regulated, including a group of β-tubulin isotypes. In
addition, three cytoskeletal-associated proteins were significantly differentially
regulated. These were HSP, cofilin and profilin, all of which have functions in the
stabilisation and restructuring of actin. The differential fold changes of these
cytoskeletal proteins from both data sets and quantification methods were collated
and selected based on their highest stringencies and p-values. The results are
summarised in Table 3.2 and Figures 3.3 & 3.4 give a graphical overview as a
histogram and Venn diagram, respectively. The following list gives the cytoskeletal
proteins differentially regulated by each of the SCFAs:
Butyrate: actin; keratin k19 (upregulated)
Propionate: actin; keratin k19, k18, k8; tubulin α, β, TUBB3, β2c-tubulin
(upregulated); TUBB/TUBB5 (downregulated)
Valerate: keratin k19; β-tubulin, TUBB3, β2c-tubulinβ (upregulated)
The fold changes were only significant at the highest stringencies (MTC on; p<0.05)
by propionate and valerate. Furthermore, only propionate and valerate, which are the
odd-chain SCFAs, significantly upregulated the β-tubulin isotypes, and only valerate
did so with the highest significance (MTC on; p<0.05).
Keratins 8, 18 and 19 are those most associated with the IFs in colon epithelia and
have previously been reported as differentially regulated by SCFA treatments, in
particular by butyrate [29]. Therefore, these results verified these earlier reports.
The Venn diagram shows which SCFAs each of the differentially regulated
cytoskeletal proteins were regulated by, i.e. to an individual, a pair or all three
62

SCFAs. This shows that butyrate had no significant effect on the tubulins, whereas
valerate had the greatest effect on β2c-tubulin (*** MTC on; p<0.05). Propionate had
effects in common with both butyrate and valerate. Keratin K19 was significantly
differentially regulated by all three SCFAs.
Table 3.2. Summary of cytoskeletal proteins identified as significantly differentially regulated
in SCFA-treated HCT116 cells relative to untreated controls. Fold changes are the mean
linear fold changes of all biological replicates for each SCFA. Approved protein names have
been adopted [91]. [B, butyrate; P, propionate; V, valerate; U, untreated].
Protein
(Gene name)
AC #valid
peptide seq.
B:U P:U
+V:U B:U P:U
+V:U
actin P60709 22 1.19 1.36 ** ***
keratin 18 B2RA03 5 1.78 *
keratin 19 P08727 10 1.76 1.43 1.83 ** *** **
keratin 8 P05787 25 1.25 ***
α-tubulin P68363 9 1.01 1.30 0.98 #
β-tubulin Q5JP53 7 1.06 1.44 1.65 # #
TUBB3 Q9BV28 7 1.04 1.33 1.48 # #
tubulin β-2C P68371 11 1.08 1.46 1.48 * ***
TUBB/TUBB5 P07437 19 0.73 *
# >SD (68%); * MTC off p<0.05; ** MTC off p<0.01; *** MTC on p<0.05
(+ combined propionate results from the duplicate and quadruplet replicate experiments. The
fold changes are those with highest stringency)
63

# >SD (68%); * MTC off p<0.05; ** MTC off p<0.01; *** MTC on p<0.05
Figure 3.3. Histogram showing linear fold-changes for differentially regulated cytoskeletal
proteins in SCFA-treated HCT116 cells relative to untreated cells (actins, keratins and
tubulins). The fold-changes are those at the highest significance, compiled from the two
multi-plex iTRAQ experiments (SCFA-duplicates and propionate quadruplets). The data is
given in Table 3.2.
64

Figure 3.4. Venn diagram showing how the differentially regulated cytoskeletal proteins are
related to the different SCFA treatments. The interlinks show if they are common to all
SCFA-treatments, a pair, or unique to a single SCFA-treatment. Of note is that butyrate has
no significant effect on tubulin isotypes; valerate has the greatest effect on β2c-tubulin (***
MTC on, p<0.05); and propionate shares effects with both butyrate and valerate. Fold-
change data is provided in Table 3.2. [Arrows denote up or downregulation; *** indicates
MTC on, p<0.05].
3.5.5. Correlation and cluster analyses of the biological replicates
The reproducibility of the biological replicates and iTRAQ data for the propionate
treated HCT116 samples was determined by Pearson’s correlation coefficient, as
described in the experimental methods. The plots in Figure 3.5 show positive
correlation between all the propionate samples, providing confidence in the results.
Figures 3.5a & b show the correlation between pairs of data (117:118 and 119:121).
Figure 3.5c shows the correlation between all four replicates as a two-dimensional
65

array. A positive correlation coefficient of r > 0.5 indicates a satisfactory level of
reproducibility between the replicates.
a) propionate duplicates (117:118)
correlation r = 0.704
b) propionate duplicates (117:118)
correlation r = 0.651
c) propionate quadruplets (117:118:119:121)
correlation r = 0.674
Figure 3.5. Correlation plots for the propionate biological replicates. The correlation
coefficients (r) for the duplicate comparisons are (a) 0.704 and (b) 0.651. The coefficient for
the quadruplet comparison is (c) 0.674. These results demonstrate that the propionate
samples were positively correlated, indicating satisfactory reproducibility and providing
confidence to the results. [Microsoft Excel 2010].
66

A dendrogram tree (cluster analysis) was constructed (Figure 3.6). This showed that
the propionate replicate data clustered distinctly from the untreated data and that
both sets of replicate data clustered together within their own groups. This again
verified the reproducibility of data generated by the multi-plex iTRAQ experiment.
Figure 3.6. Dendrogram tree for the propionate quadruplet biological replicates for treated
HCT116 cells compared to untreated cells. Propionate samples (117, 118, 119, 121) cluster
together on the left; untreated samples (113, 114, 115, 116) cluster together on the right.
The treated and untreated samples cluster distinctly from each other (separated by the main
branch), yet together within their own groups, verifying the quality of the experimental
protocols. Application creator, J. Noirel, The University of Sheffield [93].
3.5.6. Orthogonal validation of differential regulated proteins
Western blot analysis was employed for orthogonal validation of the multi-plex
iTRAQ data. The proteins selected for validation were β2c-tubulin and β3-tubulin,
67

and the results confirmed the multi-plex iTRAQ results. The membrane photographs
and densitometry results are given in the relevant chapter.
3.6. Multi-plex iTRAQ: Discussion
The purpose of this project had been to identify and study one or more of the
pathways that was unique to propionate and/or valerate, distinct from butyrate. A
preliminary examination of the existing proteomic data was carried out to identify
candidate proteins and pathways for further investigation [4]. The twenty proteins with
the greatest fold changes from each SCFA treatment were compared. The results
are summarised in Table 3.3. A total of 32 proteins were identified which belonged to
23 functional types (for example, ribosomes or chaperonins). Of these, nine proteins
were common to all three SCFAs. These were primarily involved in diverse generic
functions such as glycolysis, ATP metabolism and protein folding. Butyrate and
propionate had four and three unique proteins, respectively, which were also
involved in generic functions. In contrast, valerate uniquely upregulated three
proteins of which two were β-tubulin isotypes. Together, valerate and propionate
differentially regulated a further three proteins including two more β-tubulins isotypes
and alpha actinin, another member of the cytoskeletal superfamily. No other family of
proteins was similarly represented. Further evidence that an MT pathway was
targeted by the odd-chain SCFAs was provided by the complementary HCA cellomic
results, which had shown that the odd-chain SCFAs were involved in cytoskeletal
breakdown and G2/M (mitotic) arrest. This was supported by preliminary pathway
expression analysis, using Reactome’s pathway tools [99], which showed that seven
68

of the twenty pathways most enriched by SCFA treatments involved β2c-tubulin and
β3-tubulin isotypes, including the pathway representing mitotic M-M/G1 transition.
The multi-plex iTRAQ results generated by the subsequent propionate quadruplet
experiment performed during this project, and the data-mining of the SCFA duplicate
data, provided further evidence of the distinct differential regulation of β-tubulin
isoforms by the odd-chain SCFAs, propionate and valerate.
69

Table 3.3. Summary of the twenty proteins identified by multi-plex iTRAQ as having the
greatest fold changes in SCFA-treated HCT116 colon cancer cells. This shows which of the
proteins were common to all SCFA treatments and which were distinctly targeted by an
individual SCFA. The results show that the β-tubulin isotypes were uniquely regulated by
propionate and valerate, suggesting that the odd-chain SCFAs target an MT pathway. [B,
butyrate; P, propionate; V, valerate; C, untreated; * proteins associated with cytoskeletal
functions; ** β-tubulin isotypes].
Protein name(or functional type)
B:C P:C V:C Primary FunctionMean fold change
Annexin* 1.79 1.71 1.65Diverse cellular processes including linkage of membrane-associated protein complexes to the actin cytoskeleton.
Fatty acid synthase 0.32 0.34 0.32 Belongs to the family of transferases, specifically acyltransferases.
Creatine kinase 1.73 1.66 1.78 Catalyzes the transfer of phosphate between ATP and phosphogens.
Peroxiredoxin 1.60 1.55 1.70 May have a proliferative effect and play a role in cancer development or progression.
Chaperonin 0.51 0.44 0.52 Molecular chaperones assist in the folding of proteins upon ATP hydrolysis.
hCG 1.54 1.64 1.67 Human chorionic gonadotropin (hCG) is a hormone.
Tyrosine 1.52 1.55 1.46 Involved in protein synthesis.ATP synthase 1.43 1.63 1.77 Provides energy for synthesis of ATP.
Ribosomal 0.69 0.59 0.55 Ribosomes link amino acids together in the order specified by messenger RNA (mRNA).
Cyclophilin A 1.42 1.36 A highly abundant protein that binds to cyclosporine, an immunosuppressant.
Protein Disulfide Isomerase 1.54 Catalyses protein folding.
HSP90 1.38HSPs are involved in protein folding; triggered by environmental stress, such as inflammation.
SYNCRIP 0.69 Involved in nucleotide bindingAldolase 0.71 Involved in glycolysis
Histone 0.60 Packages and orders DNA; primary protein component of chromatin.
unknown 0.71 unknownEnolase 0.72 Involved in the penultimate step of glycolysis.
**Tubulin β 1.44 1.65 Cytoskeletal (microtubules).**Tubulin β1 1.37 1.49 Cytoskeletal (microtubules).
*Alpha actinins 1.34 1.51 Alpha actinins belong to the superfamily of cytoskeletal proteins.
**Tubulin β2c 1.67 Cytoskeletal (microtubules).
Nucleophosmin 1.65 Associated in the binding of single-stranded nucleic acids.
70

**Tubulin β3 1.48 Cytoskeletal (microtubules).
Altering the overall balance of β-tubulin isoforms through differential regulation
creates an aberrant tubulin code [41, 47]. This prevents the cell from correctly
performing many critical cellular functions associated with MTs, including formation
of the mitotic spindle and accurate progression through mitosis. This may explain the
loss of MT cytoskeletal integrity observed by HCA and the shift towards mitotic arrest
observed by flow cytometry.
Cancer cells display different β-tubulin expression patterns compared to normal cells
[51]. HCT116 colon cancer cells have been reported to downregulate β2c-tubulin and
β3-tubulin isotypes and to upregulate β1-tubulin relative to non-tumour tissues [51].
Different β-tubulin isotypes are associated with specific actions, such as rapid growth
of MT fibres or mitosis, therefore these pattern changes have been linked to
enhanced proliferation and invasiveness in tumours [56, 58]. The multi-plex iTRAQ data
showed that propionate and valerate treatment induced the opposite regulatory
effects by upregulating β2c-tubulin and β3-tubulin and downregulating β1-tubulin,
suggesting they may counter the tumourigenic actions of HCT116 cancer cells.
The majority of established anti-microtubule drugs are designed to either destabilise
or over-stabilise MT dynamics, thereby disrupting their cellular functions. However,
many AMDs show increasing cytotoxicity and drug resistance with successive
rounds of treatments. Identifying alternative mechanisms to disrupt MT dynamics, for
example, through differential regulation of the β-tubulin subunits, is an attractive
target in chemotherapeutics.
In summary, these multi-plex iTRAQ experiments have provided high-quality
proteomic data from HCT116 cells treated with multiple biological replicates of
71

butyrate, propionate and valerate. The results indicate that propionate and valerate,
the odd-chain SCFAs, may uniquely alter expression of the three key β-tubulin
isotypes most associated with HCT116 colon cancer cell progression. Furthermore,
quantification of the fold changes showed that valerate had the greatest and most
significant effect. In combination with the cellomic and bioinformatic evidence, these
results suggest that propionate and valerate may act as anti-mitotic agents via
differential regulation of β-tubulin isotypes, offering a novel role for odd-chain
SCFAs, in particular valerate, as potential chemopreventives against colorectal
cancer.
3.7. Multi-plex iTRAQ: Key Conclusions
The odd-chain SCFAs, propionate and valerate, uniquely differentially regulated
three key β-tubulin isotypes associated with HCT116 colon cancer cell
progression.
Valerate had the greatest effect in regulating these β-tubulin isotypes. Propionate
displayed similar actions to valerate, but at lower potency. Conversely, butyrate,
the even-chain SCFA, induced no significant effect in β-tubulin isotype regulation.
The direction of differential change induced by the valerate and propionate
(upregulation of β3-tubulin and β2c-tubulin, and downregulation of β1-tubulin)
countered the reported pattern of β-tubulin isotype expression in colon cancer
cells, believed to enhance invasiveness, aggression and proliferation [51].
72

4. High Content Analysis showed that odd-chain SCFAs distinctly
perturb MT cytoskeletal integrity and mitotic pathways
compared to even-chain SCFAs
4.1. Contribution of High Content Analysis to the overall project
High Content Analysis (HCA) is a high-throughput cellomic technique that
provides both quantitative and qualitative data on cellular structures.
HCA provided high-quality micrographs to highlight changes to cytoskeletal
integrity though fluorescent microscopy.
HCA provided quantitative cell cycle data to show different responses to odd and
even-chain SCFA treatments.
The HCA quantitative and qualitative results were complementary to multi-plex
iTRAQ proteomic analyses.
4.2. Introduction to High Content Analysis
4.2.1. HCA background
High Content Analysis (HCA), also known as High Content Biology, is an advanced
cellomic technique in fluorescence microscopy that replaces the human microscopist
with computer algorithms while retaining the information-rich images for qualitative
interpretation. By staining molecules and proteins of interest with fluorescent
antibodies, HCA generates quantitative data on cellular structures, processes or
post-translational changes, and simultaneously produces high-quality micrographs of
individual cells, cellular components and cell populations. The high-throughput
73

capacity of HCA, samples can be analysed in 96-well plates enabling throughput
technology of HCA, utilising 96-well plates, enables replicate samples and
treatments to be compared providing robust statistical analyses without operator
bias. Furthermore, systematic errors can be minimised as treatments are carried out
under identical environmental conditions. The inclusion of immunocytochemistry
(ICC), employing targeted primary antibodies with fluorescent ‘Alexa Fluor’
secondary antibodies, can provide information on post-translational modifications to
specific proteins, including acetylation. An optional step involves staining cells with
Cellomics Whole-Cell Red Stain to visualise cell shape and cytosolic area.
HCA combines the advantages of ELISA (medium-throughput and quantitative, but
not at the individual cell level); fluorescent microscopy (qualitative micrographs with
organisational information, but not quantitative or high-throughput); flow-cytometry
(quantitative cell cycle data, but not high-throughput, and not at the individual cell
level) and Western blotting (quantitative, but again not high-throughput, not at the
individual cell level, and with greater error potential).
In conclusion, HCA is a valuable tool for advancing understanding of metabolic
mechanisms and processes.
4.2.2. HCA study aims
The first part of this HCA project was to acquire and analyse quantitative cellomic
data on changes to the MT cytoskeleton (MT fibre texture, area and staining
intensity) within HCT116 cells in response to SCFA treatments. The high-throughput
capacity of HCA could be exploited to analyse a range of SCFA treatment
concentrations between 0 and 20 mM in parallel.
74

The second part of this study was to mine the unexplored HCA data on cell cycle
progression generated during the preceding study [4]. In addition to the 24 h dose
response data that had established the optimal IC50 treatment conditions for further
experimentation including multi-plex iTRAQ mass spectrometry, cell cycle data had
also been generated at 48 h over the same SCFA concentration range. Although
initial observations had implied a biphasic response in G1 and G2 cell cycle
progression that were unique to propionate and valerate treatments, these data
remained unexplored. The aim in this study was to interpret the 48 h biphasic data in
relation to the corresponding proteomic and HCA cytoskeletal experimental
observations.
Biphasic responses are defined as mechanisms which display two distinct responses
separated in time. Biphasic responses can facilitate identification of optimum
treatment conditions and provide valuable insights into the processes and
mechanisms involved. They frequently describe a reduction in the population of an
activating protein as it binds to the target proteins, whereas the target proteins
continue to replicate and recover. However, SCFAs behave as coenzymes,
catalysing acetylation reactions without loss of concentration, suggesting that the
biphasic response triggered by propionate and valerate did not involve irreversible
binding to target proteins. This mechanism remained to be determined.
The cell cycle is described in detail in the flow cytometry chapter. Briefly, it is a series
of steps in which cells progress from a stage of resting, or performing their normal
functions (G0/G1 phases), to actively dividing by first synthesising DNA (S phase),
then increasing in size before undergoing mitosis (G2/M phases) and separating into
two daughter cells. The checkpoints at G1 and G2/M ensure the preceding steps are
completed accurately before allowing the next step to progress. Cell cycle arrest
75

commonly leads to apoptosis or necrosis and cell death, which is reflected as a
decrease in cell numbers. Drug treatments often act by perturbing cellular processes
in the preceding steps or by preventing cells progressing to the following steps, for
example, anti-mitotic treatments arrest cells at G2/M phase. HCA is able to
quantitatively analyse these cell cycle parameters.
4.3. HCA: Project outline
4.3.1. HCA of MT cytoskeletal integrity
The HCA experiment was part of a collaborative project investigating the effects of
SCFA treatments on cytoskeletal integrity. Whereas this aspect of the project
investigated MT cytoskeletal structure, the collaborative project investigated
intermediate filaments (IF) via acetylation of their keratins subunits [85]. MT
composition, functions and dynamics were discussed in detail in the introduction
chapter. In relation to HCA, the three key parameters that define MT structure are
texture (or co-occurrence), fibre area (or spot-fibre size) and fluorescent intensity.
These parameters are determined by measuring the fluorescence of pixels in the
micrographs and their contrast to the background. Together they can give a measure
of filamentousness and MT-fibre integrity. The algorithms underlying these
parameters are described in the experimental methods.
4.3.2. HCA of cell cycle progression and the biphasic response
All the HCA experiments were performed at treatment conditions between 0–20 mM
SCFA; as such, they encompassed the physiological concentrations for butyrate,
76

propionate and valerate but were below the acidity levels which may compromise the
results.
A biphasic dose-response between G1 and G2/M of the cell cycle had been
observed previously at 48 h treatment times that had been unique to the odd-chain
SCFAs (propionate and valerate) [4]. However, this data had remained unexplored so
was retrospectively examined in this project to determine the underlying
mechanisms. This effect suggested a link with the multi-plex iTRAQ observations
that had also shown distinct effects with propionate and valerate. The biphasic
response is shown as a quantitative plot in Figure 4.4.
4.4. HCA: Experimental methods
4.4.1. General reagents and solutions
Cell culture for HCA was carried out in 96-well plates. The reagents and methods
were as described in the cell culture chapter unless otherwise stated. All incubations
were carried out at 37°C in a humidified atmosphere of 5% CO2.
ICC antibodies and reagents were as follows: Hoescht 33342 (Invitrogen) was used
to stain nuclei; Phalloidin and anti-β tubulin antibodies were used to stain actin and
β-tubulin, respectively. These were supplied, and applied, by Imagen Biotech Ltd.
(Manchester, UK). The secondary antibodies (Invitrogen) were Alexa Fluor 488-
donkey anti-rabbit (red) or Alexa Fluor 555-donkey anti-rabbit (green). Digitonin and
formaldehyde were purchased from Sigma.
77

4.4.2. HCT116 cell culture and treatment in 96 well-plates
Prior to cell culture, a plate map was drawn (Figure 4.1) to specify the treatment
conditions for each well: SCFA concentration; treatment time; and primary antibody.
Each treatment condition was repeated in triplicate for statistical analysis.
The HCT116 cells were cultured in Black-sided Costar 96-well plates treated for cell
culture (Sigma) following the steps described in cell culture methods. The cells were
plated at 8 x 10³ cells per 100 μl well in DMEM media; incubated for a 24 h laying-
down period at 37°C; the media were replaced with 160 μl DMEM per well; and the
cells were simultaneous treated by adding 40 μl SCFA per well (5 x SCFA stock
solutions in PBS) using a multi-channel pipette (Labret Biopette) to give a final
volume of 200 μl per well. Treatment concentrations were 0 mM, 1 mM, 5 mM, 10
mM, and 20 mM SCFA; the cells were incubated at 37°C for 24 h before being fixed
in 4 % formalin for 15 min at room temperature. Untreated samples were included as
controls.
78

a) HCT116 cytoskeletal (actin-tubulin)
plate map
b) Representative plate micrograph
Figure 4.1. HCA 96-well plate plan and micrographs of HCT116 cells after treatment with
SCFAs. a) Top panel: colour key showing SCFA treatment concentrations; Lower panel: the
plate map rows represent triplicate treatments. b) The ICC micrograph shows green
fluorescent anti-body staining of cytoskeletal structure and blue (Hoescht) nuclei. The inset
represents a single well. [vp, valproic acid; P, propionate; B, butyrate; V, valerate].
4.4.3. Immunocytochemistry of actin and tubulin cytoskeletal structures
After fixing, the nuclei were stained with Hoechst (blue) at a ratio of 1:1250 in
digitonin and incubated for 30 min at room temperature. After staining, the cells were
washed three times with PBS. The plates were sealed with a sealing film and
transported on ice at 4°C to Imagen Biotech, Manchester, where they were stained
with Phalloidin for actin and an anti-β tubulin antibody prior to HCA analysis.
4.4.4. HCA quantification of cytoskeletal integrity
HCA imaging and analysis was carried out at Imagen Biotech using x10 and x20
objectives and ArrayScan II software (v. 3.5.1.2).
79

Hoechst nuclear staining enabled Regions of Interest (ROIs) per well to be identified
and corrections to background fluorescence to be made. The total staining intensity
of the structures of interest was averaged across the ROI. The cellomics proprietary
software and a compartmental analysis algorithm averaged data from internal
triplicates for each treatment with >95% confidence.
The three principle parameters in the micrographs for defining cytoskeletal integrity
are texture and contrast, fibre area and intensity. These were measured by a
morphology algorithm as follows:
Texture was calculated as the co-occurrence intensity of structural staining and
was based on the number of occurrences of adjacent pixels at a certain intensity.
High variations give a high value of co-occurrence indicating strong texture and
filamentousness. This is where the pixels that make up the filament have very
different values from the pixels in their neighbourhood. Conversely, uniform
staining gives a low value of co-occurrence indicating cellular depolymerisation.
Fibre area was determined by spot-fibre size analysis which identifies which
pixels belong to spots and which to fibres. The mean area of all the fibres was
calculated and returned as a single measurement.
The intensity, or mean total intensity, was the averaged value of all the ROIs,
calculated as the sum of all the pixel values within each fibre ROI. Applying
background correction differentiated between genuine spots and fibres and
intracellular noise.
The intensity parameter is most often used as a quality control measure of the
experimental and staining protocol; however, it can also be used to assess fibre
integrity. The fluorescence from healthy, intact fibres should be in sharp contrast
to the background, with every pixel within the fibre’s region of interest (ROI)
80

having approximately the same intensity. As such, the SD of the pixel-intensity
within a fibre’s ROI will be low. As the fibre dissociates and becomes diffuse,
there will be both darker and brighter areas within the ROI, leading to an
increase in SD: the larger the SD, the lower the fibre integrity.
4.4.5. Data-mining HCA cell cycle data for the biphasic response
In addition to the structural parameters, other cell parameters were returned by a cell
cycle algorithm. These included the total cell count and numbers of cells at each
phase of the cell cycle (sub-G1; G1; S; G2/M; post-G2/M).
Quantitative HCA cell cycle data acquired from the earlier 48 h dose-response
treatment of HCT116 cells by SCFAs (0–20 mM) [4], was retrospectively analysed
using Prism software (GraphPad v.5). This had shown a biphasic response at low
SCFA concentrations (<5 mM) in the G1 and G2/M phases which was unique to
propionate and valerate treatments, but not observed with butyrate. The data had
been compiled from three internal repeats allowing means and SEM values to be
calculated (CI >95%). The data were plotted using Prism software (Graphpad v.5)
and Microsoft Excel 2010 (Microsoft, Redmond, W.A., USA).
4.4.6. HCA statistical analysis
Statistical analyses were performed using Prism software (GraphPad v.5) and
Microsoft Excel. All SCFA treatments had been performed in triplicate allowing the
means and SEMs to be calculated (CI >95%). Student’s t-tests (two-tailed) were
used to give p-values for the fibre integrity results for SCFA treatments relative to
untreated cells. The generated data were plotted for the cell cycle analysis and MT
81

cytoskeletal integrity results over the range of dose-response concentrations (0–20
mM SCFA).
4.5. HCA: Results
4.5.1. Defining a novel parameter for MT-fibre integrity
Interpretations of HCA data are generally made by analysing each parameter and
comparing the results individually; however, the unique behaviour of MT dynamics
meant there was a direct relationship between MT-fibre texture (co-occurrence) and
fibre area (spot-fibre size). For the purposes of this project, including providing a
single measure for parameter matching in the computational model, this relationship
was exploited to provide a single, novel, measure of ‘fibre integrity’, defined as the
ratio of co-occurrence:fibre-area. MT-fibres should be a tight linear assembly of
typically 13 protofilaments. If these dissociate, the protofilaments separate laterally
and the subunits disassemble from the tips leading to an increase in overall fibre
volume but a decrease in density. In terms of HCA quantification, this will be
reflected as a loss of co-occurrence, as tubulin subunits depolymerise, with a
concurrent increase in fibre area as the protofilaments “spread out”. Consequently,
co-occurrence:fibre-area decreases as MT integrity is lost. This effect is specific to
structures with behaviours similar to MT fibres; in contrast, an increase in fibre area
may reflect positive growth and increased integrity in other molecules, therefore this
novel parameter would be inappropriate.
82

4.5.2. Effect of SCFA treatments on MT cytoskeletal integrity
The fluorescent micrograph in Figure 4.2 shows the organisation and localisation of
microtubule and actin filaments within the HCT116 cells after treatment with the
maximum concentration of SCFA (20 mM) showed that butyrate and valerate
produced the most diffuse MT fibres compared to propionate and untreated cells
(Figure 4.2). The mean fibre integrity ± SEM (n = 3) for 20 mM butyrate, propionate
and valerate was 49% ± 6%, 69% ± 11% and 30% ± 6%, respectively (Table 4.1a).
This is shown graphically by the histograms of MT-fibre integrity (texture:area) in
Figure 4.3a.
At IC50 (G2/M) concentrations, the MT-fibre integrity was 47% ± 6%, 43% ± 4% and
27% ± 3% following treatment with butyrate, propionate and valerate, respectively
(mean ± SEM, n = 3; Table 4.1b), showing the greatest loss with propionate and
valerate (Figure 4.3b).
Student’s t-tests (two-tailed) showed that the results for valerate at 20 mM and for
both propionate and valerate at IC50 (G2/M) concentrations had the greatest
significance (p<0.05; Table 4.1a).
The histogram of mean intensity-SD (Figure 4.3c; Table 4.2) further supported the
fibre integrity results by showing the greatest level of fragmentation occurred with
butyrate and valerate, when averaged over all treatment concentrations (0–20 mM).
83

Untreated Butyrate Propionate Valerate
Figure 4.2. HCA micrographs of HCT116 cellular cytoskeletal integrity after 20 mM SCFA
treatments. SCFA treated cells show more diffuse MT fibres compared to the filamentous
fibres in untreated cells. Butyrate and valerate show the greatest loss in MT integrity
(filamentousness). [green, MT fibres; red, actin; blue, nuclei].
loss of MT-fibre integrity
% in
tegr
ity(c
o-oc
cure
nce:
fibre
-
a) SCFA dose-response [mM] b) SCFA IC50 (G2/M) c) mean fibre intensity
SD
*p<0.05
Figure 4.3. Quantification of MT-fibre integrity in HCT116 cells after SCFA treatments.
These histograms are graphical representations of the micrographs in Figure 4.2. The y-axis
gives % integrity (co-occurrence:fibre-area) relative to untreated cells; the x-axis gives the
SCFA concentration. (a) Dose response effect: increasing loss of MT fibre integrity with
increasing SCFA concentration shows that valerate induces the greatest effect. (b) Loss of
MT-fibre integrity at IC50 (G2/M) treatment concentrations (butyrate, 4 mM; propionate, 11
mM; valerate, 9 mM) again show that valerate induces the greatest loss of integrity and
butyrate induces the least. (c) An alternative measure of MT fibre fragmentation is shown by
the increase in intensity-SD (variation within pixel intensity). These show that both valerate
and butyrate induce the greatest level of MT fibre fragmentation. In contrast to the results in
(a) and (b) the SD-values are the mean of all treatment concentrations. [B, butyrate; P
propionate; V valerate].
84

Table 4.1. MT-fibre integrity (co-occurrence:fibre-area) in HCT116 colon cancer cells relative
after treatment with SCFAs at the following concentrations (a) 0–20 mM; (b) at IC50 (G2/M)
concentrations (butyrate, 4 mM; propionate, 11 mM; valerate, 9 mM). Significant results
(p<0.05) are shown as bold/italics.
a)
SCFA
MT-fibre integrity
relative to untreated samples
(co-occurrence:fibre-area)
SEM (n = 3) p-value
[mM] 1 5 10 20 1 5 10 20 1 5 10 20
B 164% 47% 89% 49% 33% 6% 19% 6% 0.46 0.15 0.43 0.21
P 175% 136% 43% 69% 6% 25% 4% 11% 0.12 0.57 0.05 0.39
V 148% 107% 27% 30% 10% 17% 3% 6% 0.30 0.87 0.04 0.02
b)
SCFA MT-fibre integrity
IC50 (G2/M) SEM
B 47% 6%
P 43% 4%
V 27% 3%
B, butyrate; P propionate; V valerate
Table 4.2. Mean MT-fibre fragmentation (pixel intensity SD) in HCT116 colon cancer cells
after treatment with 0–20 mM SCFAs. Low SD: healthy cells, high integrity; High SD: loss of
integrity. The results at IC50 G2/M treatment concentrations are given as bold italics.
SCFA MT-fibre fragmentation
(pixel intensity SD)
pixel intensity
SD
[mM] 1 5 10 20 mean SEM
B 13% 22% 12% 39% 21% 5%
P 5% 22% 19% 8% 14% 4%
V 11% 24% 20% 32% 22% 4%
B, butyrate; P propionate; V valerate
85
4.5.3. HCA cell cycle progression and the biphasic response
HCA cell cycle data were averaged for triple replicates to give the mean percentage
of HCT116 cells at G1, S and G2/M phases at both 24 h and 48 h SCFA treatment
times. The mean corresponding cell counts were also calculated. HCA cell cycle
data is given in Tables 4.3 a–b.
a) The cell count data at both 24 h and 48 h (Figure 4.4a) showed a dramatic
decrease in the number of cells after 0–20 mM SCFA treatments, indicating that
the SCFAs halted cell proliferation in a dose-dependent manner. The cell count
decreased from approximately >6500 to <2000 cells at 24 h, and from >12000 to
<2000 at 48 h.
b) The 24 h cell cycle results (Figure 4.4b) showed an increase in the proportion of
cells accumulating (arrested) at G2/M phase and a corresponding decrease in
cells arrested at G1 phase from 0–20 mM SCFA. This change was initiated at a
lower concentration by butyrate (2 mM) compared to propionate and valerate (5–
10 mM). The percentage cells accumulating at each phase reached a plateau
(steady-state) at approximately 5 mM (butyrate) and at 10 mM (propionate and
valerate). The profile of S phase was least affected by all treatments.
c) The 48 h cell cycle results (Figure 4.4c) showed a marked difference in cell cycle
profiles between treatments with butyrate (even-chain) and propionate and
valerate (odd-chain). Butyrate displayed similar cell cycle profiles at both 24 h
and 48 h. In contrast, propionate and valerate displayed a characteristic biphasic
response at 48 h: the profiles showed an initial increase in cells accumulating at
G1 at low treatment concentrations (<7.5 mM) with a corresponding decrease in
86

cells at G2/M; as the treatment concentration increased (>5–20 mM), G2/M
arrest again became dominant.
d) The proportion of cells arrested at G2/M was consistently higher by 10%–20%
when induced by butyrate compared to propionate and valerate regardless of
treatment concentrations or treatment time (i.e. at 0–20 mM SCFA and at 24 h
and 48 h). This suggested that the shift back to G1 was a constant phenomenon,
and not dose dependant.
87

Figure 4.4. HCA profiles of HCT116 colon cancer cells after treatment with 0–20 mM SCFA
for 24 h or 48 h. (b) % cells at G1, S and G2/M phase. (a) The cell count profiles for all three
SCFAs are similar for all SCFAs at both 24 h and 48 h, however the drop in cell count is
most rapid with butyrate (<5 mM). (b) In contrast, the cell cycle profiles are different at 24 h
and 48 h between butyrate (even-chain) and propionate and valerate (odd-chain). Butyrate
displays similar profiles at both 24 h and 48 h. In contrast, propionate and valerate display a
biphasic response in G1 and G2 phases at 48 h. [G1 (blue ); S (green ); G2 (red ); B,
butyrate; P, propionate; V, valerate].
88

To confirm that butyrate had not undergone a similar biphasic effect at a much lower
SCFA concentrations as a result of its more rapid loss of cell count, the cell cycle
analysis was repeated at very low SCFA concentrations (0.1, 0.5, 1.0, 2.0 mM). The
results confirmed that the biphasic effect was unique to the odd-chain SCFAs,
propionate and valerate.
Table 4.3 (a) 24 h HCA cell cycle analysis for SCFA-treated HCT116 cells showing the %
cells at each phase (G1, S, G2); SEM: n = 3.
i) Butyrate
SCFA mean % cells SEM (n = 3) SEM (%)
mM G1 S G2 G1 S G2 G1 S G2
0 31.80 19.66 45.77 1.66 0.74 1.00 5% 4% 2%
0.1 35.09 18.87 42.81 2.08 1.06 1.64 6% 6% 4%
0.5 32.24 20.05 44.33 1.50 0.56 1.25 5% 3% 3%
1.0 32.58 20.41 44.09 0.23 0.51 0.68 1% 2% 2%
2.0 35.82 17.42 43.82 3.63 2.36 1.47 10% 14% 3%
5.0 24.19 9.83 62.14 1.35 1.20 1.12 6% 12% 2%
7.5 21.48 9.78 64.37 0.40 0.61 0.46 2% 6% 1%
10.0 21.26 9.31 66.25 1.11 1.43 2.02 5% 15% 3%
15.0 18.46 10.41 66.61 0.55 0.99 1.26 3% 10% 2%
20.0 19.47 9.39 67.74 0.75 0.49 1.11 4% 5% 2%
89

ii) Propionate
SCFA mean % cells SEM (n = 3) SEM (%)
mM G1 S G2 G1 S G2 G1 S G2
0 35.05 19.83 41.87 1.29 0.43 0.98 4% 2% 2%
0.1 38.15 20.08 38.64 1.34 0.63 0.94 4% 3% 2%
0.5 43.16 19.56 32.34 5.21 0.90 6.70 12% 5% 21%
1.0 43.92 19.00 32.21 5.11 0.85 7.31 12% 4% 23%
2.0 44.81 19.17 32.75 4.21 1.21 5.87 9% 6% 18%
5.0 44.29 16.19 36.56 3.51 0.56 3.10 8% 3% 8%
7.5 40.78 14.34 41.93 1.08 0.92 0.62 3% 6% 1%
10.0 37.37 13.96 45.83 1.94 0.75 0.71 5% 5% 2%
15.0 26.01 9.65 61.26 0.83 0.51 0.45 3% 5% 1%
20.0 26.11 9.62 61.21 1.22 0.21 0.80 5% 2% 1%
iii) Valerate
SCFA mean % cells SEM (n = 3) SEM (%)
mM G1 S G2 G1 S G2 G1 S G2
0 40.00 20.00 37.09 0.90 0.16 0.90 2% 1% 2%
0.1 37.32 18.53 41.38 1.83 0.72 1.07 5% 4% 3%
0.5 41.47 19.17 35.45 1.15 0.73 1.71 3% 4% 5%
1.0 41.07 18.49 36.90 2.48 0.30 2.39 6% 2% 6%
2.0 42.89 17.80 35.57 0.77 0.18 0.68 2% 1% 2%
5.0 44.99 15.77 36.13 0.71 0.52 0.81 2% 3% 2%
7.5 42.97 13.32 40.51 0.82 0.06 0.82 2% 0% 2%
10.0 36.65 10.97 49.38 0.76 0.19 0.76 2% 2% 2%
15.0 28.29 9.75 58.85 0.48 0.26 0.17 2% 3% 0%
20.0 29.16 15.35 50.83 1.04 1.19 0.94 4% 8% 2%
90

Table 4.3 (b) 48 h HCA cell cycle analysis for SCFA-treated HCT116 cells showing the %
cells at each phase (G1, S, G2); SEM: n = 3.
i) Butyrate
SCFA mean % cells SEM (n = 3) SEM (%)
mM G1 S G2 G1 S G2 G1 S G2
0 39.62 19.85 37.57 5.05 1.53 4.13 13% 8% 11%
0.1 36.98 19.64 39.38 2.82 1.25 1.65 8% 6% 4%
0.5 40.82 18.66 37.21 3.08 1.10 2.50 8% 6% 7%
1.0 46.17 18.37 31.68 3.63 0.82 4.75 8% 4% 15%
2.0 31.99 19.27 44.86 6.83 1.25 5.83 21% 6% 13%
5.0 21.85 19.41 54.10 3.47 2.13 0.96 16% 11% 2%
7.5 16.24 15.57 61.77 0.97 1.15 1.10 6% 7% 2%
10.0 17.32 13.94 63.05 1.42 1.22 1.15 8% 9% 2%
15.0 19.34 15.01 60.10 2.89 3.32 1.38 15% 22% 2%
20.0 19.53 14.97 60.77 1.21 0.99 2.11 6% 7% 3%
ii) Propionate
SCFA mean % cells SEM (n = 3) SEM (%)
mM G1 S G2 G1 S G2 G1 S G2
0 28.91 19.50 40.33 1.83 0.58 1.37 6% 3% 3%
0.1 32.01 19.10 36.17 3.31 0.97 4.52 10% 5% 13%
0.5 30.51 21.09 39.12 2.14 0.15 2.39 7% 1% 6%
1.0 23.74 19.89 44.99 1.97 0.20 2.23 8% 1% 5%
2.0 32.00 20.27 39.29 1.09 0.12 0.27 3% 1% 1%
5.0 49.33 15.34 29.00 2.49 0.91 1.11 5% 6% 4%
7.5 44.15 13.74 33.64 0.26 0.33 0.08 1% 2% 0%
10.0 42.76 11.93 36.74 1.14 0.18 1.04 3% 1% 3%
15.0 23.41 10.55 51.21 1.35 1.01 0.60 6% 1% 1%
20.0 25.53 10.64 52.21 0.88 0.93 0.87 3% 9% 2%
91

iii) Valerate
SCFA mean % cells SEM (n = 3) SEM (%)
mM G1 S G2 G1 S G2 G1 S G2
0 36.41 19.11 32.61 0.66 0.50 0.76 2% 3% 2%
0.1 30.13 19.87 39.21 2.19 0.65 2.09 7% 3% 5%
0.5 34.64 20.86 34.49 2.26 0.86 3.12 7% 4% 9%
1.0 30.15 21.03 39.50 2.44 0.20 2.76 8% 1% 7%
2.0 41.51 19.68 29.11 3.52 0.32 2.84 8% 2% 10%
5.0 55.33 12.90 24.80 0.88 0.03 1.17 2% 0% 5%
7.5 49.17 12.70 29.66 0.50 0.34 1.01 1% 3% 3%
10.0 40.81 12.34 37.56 0.45 0.89 1.15 1% 7% 3%
15.0 30.77 11.64 47.86 0.51 0.23 0.77 2% 2% 2%
20.0 30.05 13.37 45.86 1.07 1.01 1.55 4% 8% 3%
4.6. HCA: Discussion
HCA showed that the SCFAs induced a dose-response effect in halting cell
proliferation at both 24 h and 48 h treatment times. The decrease in cell count
correlated with an increase in SCFA concentration until approximately 15 mM and
then stabilised to a steady-state.
In addition, HCA showed that MT cytoskeletal integrity was catastrophically impaired
in HCT116 colon cancer cells after treatment with SCFAs with the greatest loss of
integrity induced by valerate. It has been established that butyrate is a strong
effector of apoptotic pathways in colon epithelial cancer cells by altering expression
of both pro- and anti- apoptotic proteins leading to both G1 and G2/M cell cycle
arrest and inevitable cytoskeletal breakdown [37, 100]. This includes upregulation of
p53, a pro-apoptotic tumour suppressor, which in turn promotes p53/Bax leading to
G1 arrest, and upregulation of p53/Ser-15 which leads to G2 arrest [101].
92

It is similarly reported that propionate and valerate are poorer effectors of these
apoptotic pathways [100]. The HCA evidence in this project indicated that valerate was
as effective as butyrate at inducing MT fibre fragmentation and more effective at IC50
(G2/M) treatment concentrations (Figures 4.2 & 4.3). This suggested that valerate
acted through alternative, potentially anti-mitotic pathways, supporting the multi-plex
iTRAQ results.
At 48 h, a clear distinction in the dose-response cell cycle profiles was observed
between the odd and even-chain SCFAs. Propionate and valerate induced a
characteristic biphasic effect in G1 and G2/M arrest at low concentrations (<7.5 mM),
with an initial increase in cells accumulating at G1 before G2/M arrest became more
dominant at higher concentrations (>5 mM). Of note, was that the biphasic effect was
not observed until 48 h, when the majority of cells that had survived the first 24 h
treatment would have undergone cell division. This suggested that the biphasic
effect may be phenotype dependant and not dose-dependent.
Furthermore, the G2/M cell cycle profile for butyrate was consistently higher by
10%–20% than the profiles for propionate and valerate, independent of treatment
concentration. This could be explained by a phenomenon termed mitotic slippage, or
mitotic catastrophe [102], in which a fixed proportion of cells, matching a specific
phenotype, are able to evade the G2/M checkpoint, but are subsequently halted at
G1 in the next cell cycle.
Another study reported a biphasic mitotic effect and proposed a coupling of pre-
mitotic cell cycle progression with MT integrity, indicating a possible MT checkpoint
[103].
In conclusion, the HCA results, combined with reports from the literature, supported
the hypothesis that the odd-chain SCFAs, propionate and valerate, induced G2/M
93

arrest through mitotic pathways, in contrast to butyrate which acts through apoptotic
pathways.
4.7. HCA: Key Conclusions
HCA quantitative microscopy demonstrated that propionate and valerate, the
odd-chain SCFAs, followed a distinct mitotic pathway from butyrate.
The HCA results showed that valerate had the greatest overall impact in
perturbing MT cytoskeletal integrity in HCT116 cells.
Cell cycle analysis indicated propionate and valerate induced a unique biphasic
G2/M response. This effect was characteristic of a phenomenon termed mitotic
slippage.
These HCA observations were in accord with the multi-plex iTRAQ results which
had shown that propionate and valerate significantly differentially regulated β-
tubulin isotypes in contrast to butyrate.
94

5. Flow cytometry indicated a time-dependent difference in cell
cycle response in HCT116 cells between odd and even-chain
SCFA treatments
5.1. Contribution of flow cytometry to the overall project
Flow cytometry is a high-throughput technique that is able to provide quantitative
information on cell cycle progression from multiple treatments.
Flow cytometry could support both the multi-plex iTRAQ proteomics and HCA
cellomics results by providing time-response evidence for cell cycle progression
to verify the distinct effects observed between odd and even-chain SCFAs.
In comparison to multi-plex iTRAQ proteomics and HCA cellomics, flow cytometry
is relative low-cost and can return multiple results relatively quickly
5.2. Flow cytometry in Systems Biology
Understanding the complexity of bimolecular systems in an era of rapidly expanding
in genomic, proteomic and pathway knowledgebases is demanding new tools and
methodologies. These include large scale high-throughput quantitative techniques,
advances in computation, software and data-handling applications and new
approaches, such as Systems Biology. Flow cytometry is able to make quantitative
measurements of cells and cellular components on a molecular scale and recent
technological developments are increasing its role as a valuable and versatile tool in
the field of Systems Biology [104]. One of its advantages is the ability to rapidly and
95

quantifiably measure the proportion and state of cells at different phases of the cell
cycle over a wide range of treatment conditions.
Based on the results from both the multi-plex iTRAQ and HCA experiments it had
been proposed that cells were arrested by the odd-chain SCFAs through anti-mitotic
events. Flow cytometry could validate this proposition by demonstrating a shift
towards cell cycle arrest at G2/M phase, i.e. a failure to progress through mitosis.
A second purpose of the flow cytometry study was to determine whether the biphasic
effect in G1 and G2/M phase observed by HCA at 48 h but not at 24 h, could be
observed during a time-course flow cytometry experiment. This could identify the
time point at which it was initiated and confirm that the effect was unique to
propionate and valerate, the odd-chain SCFAs.
Interpreting flow cytometry analyses requires knowledge of the cell cycle and the
mechanisms that cause cell cycle arrest at each cell cycle checkpoint.
5.3. The cell cycle
5.3.1. The cell cycle and checkpoints
The cell cycle describes the cycle of events that lead to cell division. It is a series of
distinct phases as follows: G0 (resting, quiescence); G1 (performing regular
functions; not dividing); S (synthesis; DNA replication); G2 (growth; preparing for
mitosis); M (mitosis; cell division and separation into two daughter cells). Figure 5.1
is a schematic of the cell cycle, describing the steps that lead to cell division.
96

Figure 5.1. The cell cycle describing progression from interphase either resting (G0; grey) or
performing their cellular functions (G1, blue). As cells prepare to divide they first duplicate
their DNA via synthesis (S; orange) and grow increasing their cytoplasm (G2; red); before
progressing to mitosis (M; green) where they divide into two daughter cells.
G0 is not strictly part of the cycle, but a period of quiescence when the cell
effectively leaves the cell cycle and rests. Cells can remain in G0 for long periods
of time.
In both normal and cancerous cells, the majority of cells will be at G0/G1 phase
while taking in nutrients prior to division.
M phase is two events known as mitosis, and cytokinesis. The nucleus divides
during mitosis then the cytoplasm splits during cytokinesis into two daughter cells,
each with its own nucleus and one complete set of DNA. M phase is subdivided
into intermediate steps as follows: prophase; metaphase; anaphase; and
telophase. Typically mitosis only takes up 10% of the total cell cycle time.
The time each cell spends completing the cell cycle is cell type or tissue dependent;
however, the relative proportion of time spent at each phase is generally similar
97

between tissues. Kidney and neural cells can remain quiescent indefinitely, whereas
colon epithelial cells have a high turnover and one of the most rapid cell cycle rates,
approximately 24 h.
There are checkpoints at the interphase of G1 and G2 to ensure the preceding
phase has completed accurately before the cell can progress to the next stage.
Defects, such as DNA mutations (detected at the G1/GS checkpoint) or incomplete
or inaccurate synthesis of the sister chromosome (detected at the G2/M checkpoint)
will drive normal cells into arrest (or pause), either allowing the defect to be corrected
or the cell to enter controlled death (apoptosis). Apoptosis is a critical mechanism for
recycling or controlling the number of cells and insufficient or excessive apoptosis
can lead to cancer or degenerative diseases.
An additional important checkpoint is the mitotic, or spindle, checkpoint (SAC) which
ensures that chromosomes are correctly attached to the mitotic spindle before cell
division proceeds. If SAC is triggered this should lead to apoptosis. Failure of SAC
can lead to aneuploidy, where the wrong numbers of chromosomes are pulled
towards each daughter cell. Aneuploidy may generate phenotypes which induce
cancer or other well-known conditions, for example Down’s syndrome.
5.3.2. The cell cycle’s role in cancer development
If a checkpoint fails, defective cells can proceed and the cells can multiply
uncontrollably to become immortal and/or form tumours. A characteristic of tumour
development is that a high proportion of cells are actively dividing and therefore at
G2/M phases. This leaves more of their DNA exposed compared to normal cells,
which can be exploited by anti-cancer treatments.
98

Other regulatory proteins involved in cell cycle regulation and apoptosis include
tumour suppressors. If these are mutated the checkpoints can again fail allowing
cells to evade apoptosis, as observed in cancer. Butyrate is known to be closely
associated with both G0/GI and G2/M arrest through apoptotic pathways and
regulatory proteins [100, 105, 106], such as the transcription factor Sp1 and Sp1-regulated
genes, including p21, Bak, the tumour suppressor, p53 and the p53/p21 pathway.
Propionate and valerate are reported to be weaker inhibitors of these pathways [100].
Understanding the cell cycle can provide important insights into the molecular
mechanisms involved in cancer progression, enabling anti-cancer therapies to be
designed that target the cells at critical phases.
5.4. Introduction to flow cytometry
5.4.1. Flow cytometry cell cycle analysis
One of the primary applications of flow cytometry is cell cycle analysis. It is a
technique that can distinguish between cells at different phases of the cell cycle by
measuring the amount of DNA in the cells. In order to achieve this, the DNA is
stained with a fluorescent dye. The fluorescence intensity at the dye’s wavelength is
directly proportional to the amount of DNA in a cell, as follows: cells at G0 and G1
phases have a single strand of DNA for each chromosome; during S phase the DNA
is actively undergoing syntheses and DNA replication; at G2 and M phases the
chromosomes each have two strands of DNA, before separating into two daughter
cells which each have a single set of chromosomes. Therefore the fluorescence
intensity of a cell at G2/M phase will be twice that of a cell at G0/G1 phase and the
99

relative proportion of cells at each phase can be represented as a peak in a
histogram. The fluorescent profile acts as a signature of the cells’ condition.
Figure 5.2 is a representative flow cytometry histogram for normal, non-cancerous
cells, showing the typical proportion of cells at each phase of the cycle. The G1 peak
represents the largest proportion of cells, as the majority are undergoing their normal
functions. The G2/M peak is smaller because cells typically only remain in mitosis for
10% of the total cell cycle. However, if cells are arrested or paused at either of these
checkpoints, this will be reflected as an increase in the corresponding peak in the
histogram.
Figure 5.2. Example of a typical flow cytometry histogram profile for normal untreated cells,
giving cell count (reflected by the intensity) vs. the amount of cellular DNA (reflected by the
voltage). The majority of cells reside at G1 phase, reflected as a much higher peak; the
G2/M peak reflects the smaller amount of time cells spend at mitosis (10%) and therefore a
smaller proportion of cells; S phase spans a wider range of DNA/cell while the cells are
actively synthesising a second set of chromosomes, and so appears as a broader, lower
band [107].
It is important to note that flow cytometry records data from a fixed number of cells,
or gated events, per sample and not from a fixed sample volume. Therefore flow
100

cytometry gives the relative proportions of cells at each phase, and not the total cell
count of a sample.
5.4.2. Flow cytometry analysis of cell cycle arrest
Cell cycle arrest can arise for a number of reasons. In normal cells it usually reflects
an error in the preceding phase, such as DNA mutations, and the cycle is paused
either to correct the error or initiate apoptosis. Tumour cells have metabolic
adaptions that enable them to evade these checkpoints, allowing mutated cells or
cells equipped for invasion to proceed; however, these adaptions often involve
differential expression of genes and proteins which can be targeted by drug
treatments which won’t impact on normal cells [108]. Depending on the drug’s
mechanism, this can trigger arrest at the G1 or G2 checkpoints, by targeting
exposed DNA or anti-tumour and apoptotic proteins, or at the G2/M and mitotic
checkpoints by disrupting formation of the mitotic spindle.
A change in cell cycle arrest, either as a result of tumour progression or a drug
treatment, will cause a shift in the proportion of cells at one phase in favour of the
other phases. Flow cytometry represent the different scenarios as follows:
1. When cell cycle arrest occurs solely at G1, it prevents cells progressing to S
phase. Consequently, the number of cells at S phase decreases as those that
progress to G2 are not replaced. The proportion of cells at G2 phase may also
decreases as they are resupplied by a declining number from S phase. The
resulting profile will display a very high peak at G1, a smaller peak at G2/M, and
very low level at S phase. The hallmark of G1 arrest is this rapid reduction in S
phase cells compared to a normal cell cycle profile.
101

2. When cell cycle arrest occurs at both G1 and G2/M checkpoints, cells no longer
progress from G1 to S phase or from G2/M to G0/G1 phase. Consequently, there
will be an accumulation of cells at both these checkpoints, with the peaks
approaching equilibrium, and again a marked decrease at S phase as cells
continue to proceed to G2 phase but are not replaced from G1.
3. When cell cycle arrest occurs solely at G2/M, cells no longer progress from G2/M
to G0/G1; however they continue to progress from G1, via S phase, to G2 phase.
This is reflected by an increase in the G2/M peak, a concurrent decease in the G1
peak, but little change in the level of S phase.
5.4.3. The effect of aneuploidy and hyperploidy in flow cytometry analysis
In order to interpret flow cytometry results, certain effects need to be taken into
account including the presence of doublets or aggregates which occur during the
fixation process prior to staining. These produce false positives because a doublet at
G0/G1 contains the same amount of DNA as a single cell at G2/M, therefore they
falsely appear as dividing cells. In order to discriminate against doublets, flow
cytometry allows gating to be applied so that doublets, which also have double the
area of a single cell, can be excluded from analysis.
5.5. Flow cytometry: Project outline
For the purposes of this project, flow cytometry was employed to analyse the effect
of different SCFA treatments on the cell cycle of HCT116 colon cancer cells in a
time-dependant manner. This was achieved by treating cultured HCT116 cells at IC50
102

(G2/M) concentrations and harvesting the cells at set time points (3 h, 6 h, 12 h, 24
h). Untreated were also prepared as controls. Following harvesting, whole cells were
stained with propidium idodide fluorochrome dye (PI) and then injected into a flow
cytometer fluid system where they were individually passed through a laser within a
very narrow stream. The fluorescent pulse from each cell (488 nm) was detected at
both the forward and sideways directions allowing cell height, width and area (H, W,
A) to be measured. Data were presented in the form of 2-dimensional dot plots and
histograms, with accompanying quantification and statistics.
5.6. Flow cytometry: Experimental methods
The basic principles of flow cytometry and its multiple applications have been
extensively described by Shapiro [109] and in multiple guides and manuals [110, 111].
The cells were prepared for flow cytometry as follows: HCT116 cells were cultured,
treated with SCFAs at pre-established IC50 (G2/M) concentrations (butyrate, 4 mM;
propionate, 11 mM; valerate, 9 mM) and harvested at 3 h, 6 h, 12 h and 24 h.
Untreated cells were also harvested at these time points as controls. Whole cells
were fixed in 70% ice-cold ethanol, added drop-wise and vortexed to prevent
aggregation and cell clumping. RNAse was added to remove RNA which would also
have been stained and therefore distorted the results. Cells were flash frozen and
stored at -80C until required. Prior to the flow cytometry experiment, the cells were
brought up to 4C on ice and permeablilised to allow fluorescent PI dye to pass
though the plasma membrane and bind to the DNA. Stained cells were kept in the
dark until they were injected into the flow cytometer.
103

Flow cytometry was carried out at The Medical School, The University of Sheffield,
UK, using the fluorescent activated cell sorting (FACSCalibur) core facility service.
The procedure was carried out following established guidelines. Light scattered from
the cells in both the forward and sideways directions was detected and amplified by
photomultipliers at the flourochrome excitation wavelength. PI dye fluoresces red at
488 nm. The voltage of a pulse is proportional to fluorescence from a cell, and
therefore to the amount of DNA in each cell, so that a cell with double the DNA gives
a pulse at double the voltage. The total number of pulses at each voltage reflects the
number of cells containing the corresponding amount of DNA, i.e. the number of
cells at that phase of the cell cycle. Forward scattered light (FSC) provided
information on cell size; sideways scattered light (SSC) provided information on the
volume, granularity and complexity of the cells [112]. Cell height, width and area (H, W,
A) were measured at both FSC and SSC. The fluoroscans were analysed using
CellQuest Pro software v.5.1 (BD Biosciences, US) and the data was plotted in the
form of histograms and two-dimensional dot plots, with accompanying quantification
and statistics. These were as follows: forward vs. sideways dot-plots (FSC-H vs.
SSC-H) sub-divided cells into populations; forward area vs. forward width dot-plots
(FL3-A vs. FL3-W) gave information on approximate cell size; histograms of total
intensity (pulse counts, or total number of cells) vs. forward voltage (FL3-W), which
was proportional to the amount of DNA in the cell, provided peaks which
corresponded to the cell count at each phase of the cell cycle (subG1; G1; S; G2;
>G2). The sub-population dot plot indicated the health of a sample, as dead cells
group separately from healthy cells [110]. As shown in Figure 5.3, single cells formed a
lower G0/G1 group and upper G2/M group; doublets and aggregates formed a group
to the right of the G2/M group, having the same area but double the width; apoptotic
104

cells appeared as a smear below and to the left of the G1 group; a continuum of
diploid and hyperploid cells (those with an excess of chromosomes) extended above
the G2/M group.
a) b)
Figure 5.3. Representative flow cytometry dot plots: (a) sub-populations of cells. The red
square highlights the single cell population of interest; (b) gating of single cells at G1, S, and
G2 phases. This excluded aggregates, hyperploid and apoptotic cells [107].
Gating is a method by which the user can outline the populations of interest (Figure
5.3b). This ensures that apoptotic, hyperploid or aggregated cells are excluded from
the analyses. In the case of an experiment studying hyperploidy, the gate would be
extended to include those cells [113].
User defined parameters were set to optimise the analyses. These included setting
the total (gated) cell count for each sample to give the optimal number of cells
required for confidence and statistical analysis; setting the rate of injection to ensure
the cells were sufficiently separated as they passed through the laser; the recording
voltages were fine-tuned so that the G1 peak was observed at 200 V, the G2/M peak
105

at 400 V and doublets at 800 V. These voltages are typical for a histogram of cells
containing PI DNA-binding dye (fluorescent wavelength, 488 nm).
In addition to the histograms and dot plots, the analysis software returned tabular
data and statistical analysis of the relative proportions of cells at each phase of the
cell cycle (Table 5.1).
5.7. Flow cytometry: Results
5.7.1. Flow cytometry cell cycle spectra
Flow cytometry population dot plots and cell cycle histograms were collected for
HCT116 cells at each treatment condition at each time point (3 h, 6 h, 12 h, 24 h).
Untreated HCT116 cells were used as controls. The data, with mean and SD values,
from the three independent experiments, are given in Table 5.1. Figure 5.4 shows a
representative dot plot and spectra histogram for HCT116 cells treated with valerate
at IC50 (G2/M) concentration (9 mM) harvested at 24 h, compared to untreated cells,.
These show the shift from cells at GI (typical profile for untreated cells) to G2/M
following treatment.
106

untreated cells (at 24 h) Valerate treated cells (9 mM at 24 h)a) b)
c) d)
Figure 5.4. Flow cytometry experimental spectra: (a & c) untreated HCT116 cells; (b & d)
valerate-treated cells (9 mM at 24 h). The top dot plots (a & b) show how the G1 and G2 cell
populations are grouped and the extent of the gating. The lower histograms (c & d) show the
fluorescence intensity (cell count) vs. pulse voltage (corresponding to DNA quantity), giving
the number of cells at each phase of the cell cycle (subGI; G1; S; G2; >G2). There is a clear
shift from G1 to G2/M phase following valerate treatment at 24 h. The bars (M1, M2, M3)
correspond to the phases (G1, S, G2). These are set by the user to specify the extent of
each peak for quantification and analysis of the cells at each phase.
The complete time-course series of histograms for all three SCFA treatments
(butyrate, propionate and valerate) and untreated controls is shown in Figure 5.5.
The heights of the peaks represent the relative proportion of cells at each phase of
the cell cycle, providing a qualitative overview of the different treatments. Untreated
107

cells show little change in profile with time, with the majority of cells in the G1 peak
and a much smaller proportion undergoing mitosis in the G2/M peak. In contrast, the
treated cells show a shift of cells accumulating at G2/M which increases with
treatment time.
Figure 5.5. These flow cytometry histogram spectra show cell count vs. cell cycle phase for
the time-course series of SCFA-treatment HCT116 cells. Whereas untreated cells show a
typical normal cell cycle profile, with the majority of cells at G1, and little change over time,
there is a clear shift in the proportion of treated cells from G1 to G2/M arrest. Based on the
area under curve values (Table 5.1), the shift reaches a maximum at 12 h, where it remains
constant for butyrate-treated cells, but shows a slight reversal back towards G1 following
propionate and valerate treatments. This reversal is most noticeable with propionate.
108

5.7.2. Flow cytometry cell cycle data
The flow cytometry data were quantified using CellQuest Pro v.5.1, which calculated
the percentage of gated cells at each cell cycle phase (G1, S, G2, M) for each SCFA
treatment (butyrate, propionate, valerate, and untreated) at 3 h, 6 h, 12 h and 24 h.
The data were presented as means and SD. Three repeat experiments were
performed allowing SEM values to be calculated (n = 3). These data are presented
in Table 5.1. The histograms in Figure 5.6 give a quantitative representation of the
spectra in Figure 5.5.
Table 5.1. Mean percentage of cells at each phase of the cell cycle (G1, S, G2) for each
SCFA treatment, at the four time points (3 h, 6 h, 12 h, 24 h). The data represents the gated
cells and was calculated from the area under curve in the spectra (Figure 5.5). Each result is
the mean of three experiments. The SEM (n = 3) are given in the lower rows.
%cells Untreated Butyrate Propionate Valerate
Hrs. G1 S G2 G1 S G2 G1 S G2 G1 S G2
3 57.8% 12.9% 28.8% 64.6% 14.0% 21.0% 55.3% 13.2% 31.2% 64.9% 11.7% 22.4%
6 54.8% 15.0% 29.7% 53.8% 13.1% 32.5% 49.9% 14.7% 34.3% 50.1% 13.2% 35.5%
12 54.8% 16.5% 27.6% 45.5% 11.9% 40.1% 46.1% 11.6% 40.3% 46.6% 11.1% 40.6%
24 65.0% 11.0% 23.1% 53.4% 3.4% 40.0% 57.4% 4.4% 36.1% 51.5% 7.7% 38.0%
SEM Untreated Butyrate Propionate Valerate
Hrs. G1 S G2 G1 S G2 G1 S G2 G1 S G2
3 3% 1% 4% 5% 0% 5%
6 5% 2% 4% 8% 3% 5% 7% 2% 5% 6% 3% 5%
12 1% 3% 2% 7% 3% 4% 9% 2% 7% 7% 3% 4%
24 3% 2% 1% 4% 0% 5% 3% 1% 2% 5% 5% 5%
109

Figure 5.6. The histograms are a quantitative representation of the flow cytometry spectra in
Figure 5.5 and the data in Table 5.1. These show the percentages of cells at each cell cycle
phase with increasing treatment times (3 h, 6 h, 12 h, 24 h). Untreated (U) cells show little
change in the distribution of cells; in contrast, the treated cells show an increasing proportion
of cells accumulating at G2/M phase with time. This shift in G2/M accumulation reaches a
maximum at 12 h, after which the level remains constant for butyrate (B) treated-cells but
shows a marginal shift back to G1 with the propionate (P) and valerate (V) treated cells.
[Data are the means of 3 independent repeats].
The histograms (Figure 5.6) show that the different SCFAs induced different trends
in cell cycle arrest, suggesting different mechanisms. Untreated cells displayed a
110

typical normal profile with little change over time, with G1 cells remaining at
approximately 55%–65%, S phase cells at 10%–15% and G2/M cells at 25%–30%.
However, there was an increase of cells accumulating at G1 phase at 24 h, with a
10% increase in cells at G1 and 5% decrease at S and G2 phase. This was
characteristic of G1 arrest, as described in the introductory section. The cause is
unknown.
In contrast, the SCFA treatments showed a marked increase in cells accumulating at
G2/M phase, from 20%–30% at 3 h, to a peak of 40% at 12 h. This trend was similar
with all SCFA treatments until 12 h. Between 12 h and 24 h, differences in behaviour
between the SCFAs were observed in that propionate and valerate treated cells
showed a marginal shift back to G1 arrest. However these differences were small,
approximately 2%, and could not be considered conclusive. These observations are
described in relation to the characteristic profiles discussed in the introductory
section as follows:
Butyrate: The proportion of cells at G2/M remained approximately constant between
12 h and 24 h, however this was accompanied by an increase in cells at G1 with
four-fold decrease in cells at S phase. This was characteristic of G1 arrest.
Propionate: Between 12 h and 24 h, there was a slight decrease in the proportion of
cells at G2/M phase while the proportion at G1 increased. Furthermore, in common
with butyrate, there was a marked decrease in cells at S phase. This was most
characteristic of cell cycle arrest at both G1 and G2/M phase.
Valerate: In common with propionate, the proportion of cells at G2/M showed a
slight decrease between 12 h and 24 h while the proportion at G1 increased (~10%).
However, in contrast to propionate, there was little change in the proportion of cells
111

at S phase, less than one-fold. This was most characteristic of cell cycle arrest at
G2/M phase.
5.8. Flow cytometry: Discussion
The time-course flow cytometry results showed that SCFAs arrested HCT116 colon
cancer cells at G2/M phase in a time-dependent manner. All the SCFAs, butyrate,
propionate and valerate, displayed similar cell cycle profiles between 0 h and 12 h
treatments; however, between 12 h and 24 h, the SCFAs displayed different
behaviours. Both butyrate and propionate showed a four-fold decrease in the
proportion of cells at S phase in favour of G1 accumulation, but whereas butyrate
showed no corresponding change in the proportion of cells at G2/M phase,
propionate showed a slight reversal in favour of G1 (~2%). In contrast, valerate
showed little change in the proportion of cells at S phase but in common with
propionate, valerate also showed a slight reversal in cells arrested at G2/M in favour
of GI. This apparent reversal was only observed at the longer treatment times (12 h
to 24 h). The effect is characteristic of a process termed mitotic slippage [102],
whereby phenotypes with a greater capability of survival slip through G2/M but are
subsequently arrested at G1. As treatment times increase, the surviving cells will
include a larger proportion of the G2/M-evading phenotypes, thereby reducing the
number arrested at G2/M and increasing those arrested at G1 phase.
In summary, these trends reflect the following distinct behaviours between the
SCFAs: butyrate primarily induced G1 arrest, which is characteristic of its pro-
apoptotic functions [100]; valerate primarily induced G2/M arrest, characteristic of anti-
mitotic actions; and propionate displayed actions in common with both butyrate and
valerate.
112

These distinct behaviours between the odd-chain and even SCFAs reinforced the
observations of the multi-plex iTRAQ proteomic and HCA cellomic experiments.
Although the results were not significantly conclusive, the time-dependant reversal
from G2/M arrest to G1 arrest observed with propionate and valerate was in accord
with the biphasic response observed by HCA. HCA had indicated that the effect was
a constant phenomenon and not dose dependant. This suggested the effect may be
a mechanism termed mitotic slippage, which favours specific phenotypes.
5.9. Flow cytometry: Key Conclusions
Flow cytometry added evidence to the hypothesis that odd and even-chain
SCFAs induce unique and distinct effects in HCT116 colon cancer cells.
The results demonstrated a time-dependant a trend in the proportion of cells
arrested at G2/M phase following SCFA treatments.
Treatment with the different SCFAs induced different responses. Whereas the
effect with butyrate was characteristic of G1 arrest, propionate showed
characteristics of both G1 and G2/M arrest, and valerate was characteristic of
G2/M arrest.
The flow cytometry results were in accord with the biphasic response observed
by HCA with the odd-chain SCFAs, which could be explained by a phenomenon
termed mitotic slippage.
In agreement with the multi-plex iTRAQ results, valerate treatment induced the
greatest changes in cell cycle response in HCT116 colon cancer cells.
113

6. Western blot analysis provided orthogonal validation of the
multi-plex iTRAQ results in respect of β-tubulin isotype
expression in HCT116 cells treated with SCFAs
6.1. Contribution of Western blotting to the overall project:
Western blotting provided orthogonal validation of the multi-plex iTRAQ results in
respect of differential expression of β-tubulin isotypes in HCT116 cells following
SCFA treatments.
Western blotting was able to confirm whether the distinct effects between odd
and even-chain SCFAs were time-dependant as indicated by flow cytometry
6.2. Introduction to Western blotting
6.2.1. Western blotting background
Western blotting is a reliable method for validating results from other experimental
techniques, particularly where protein identification and differential quantification is
based on statistical algorithms, such as multi-plex iTRAQ mass spectrometry.
Western blotting enables proteins to be relatively quantified between different cell
samples by targeting them with antibodies. The amount of antibody taken up by a
cell is directly proportional to the concentration of its respective protein expressed
within that cell. The technique involves two-dimensional electrophoresis. The first
dimension separates proteins according to their molecular weight by SDS-PAGE; the
second ‘sideways’ dimension involves transferring the proteins to a membrane
114

platform with a high capacity for protein binding. The bound proteins are
subsequently targeted by antibodies before being visualised by immunofluorescence
and quantified by densitometry analysis. The blot is the membrane.
6.3. Western blotting: Experimental methods
6.3.1. Western blotting and densitometry protocols
1. The first dimension was carried out by loading whole cell lysates from SCFA-
treated HCT116 cells onto a 10% SDS-PAGE gel. Each sample contained 10
μg total protein, as measured by protein assay. Both these techniques are
described in detail in the cell culture chapter. During this stage, the proteins
were unfolded by the SDS buffer, opening them up to antibody binding.
2. Following SDS-PAGE, the gel was mounted adjacent to a polyvinylidene
difluoride (PVDF) membrane (Immobilon, Millipore) and the protein was
transferred from the gel to the membrane via a second ‘sideways’ dimension of
electrophoresis.
3. The membranes were then blocked to prevent non-specific background binding
of the antibodies to the membrane. This was achieved by immersing the
membranes in Tris-buffered saline containing 0.1% Tween20 (TBST) with 5%
non-fat milk for 1 h at 4C while gently shaking on a rocking bed.
4. The membranes were probed with the primary antibodies in 0.05% TBST by
incubation overnight at 4C, again under agitation on a mechanical rocker. The
antibody dilution factors were specific to each antibody, as recommended by
the supplier, and are typically in the range of 1:500 to 1:2000 in TBST buffer.
115

5. Followed incubation with primary antibodies, the membranes were incubated
with goat anti-rabbit or anti-mouse conjugated to horseradish peroxidase (HRP)
secondary antibodies (Dako, Cambridge, UK) in 5% non-fat milk/0.05% TBST
(1:1000) for 1 h at 4C.
6. The fluorescence intensities of the bound primary antibodies were visualised by
enhanced chemiluminescence (ECL). The images were recorded using
GeneSnap software (Syngene).
7. Quantification of the relative fluorescent intensities of the antibodies, and
thereby the relative concentrations of their respective proteins, was determined
by densitometry using GeneTools software (Syngene).
8. It was necessary to use a loading control for normalisation. For this study,
either actin or α-tubulin was selected, as these are thought to be unaltered
between the different SCFA treatments.
6.3.2. Statistical analysis
Where possible, Western blot analysis was repeated up to four times for each
protein in order to validate the proteomic or flow cytometry experiments. Statistical
analyses were performed using Microsoft Excel to give means and SEMs.
6.4. Western blotting: Results
6.4.1. Overview of the Western blotting results
The selected proteins were β-tubulin, β3-tubulin and β2c-tubulin, with actin or α-
tubulin used as loading controls. The Western blot images are shown in Figure 6.1.
116

Relative quantification data are given in Table 6.1. These were determined by
densitometry measurement of the fluorescent intensities of bound antibodies,
normalised to actin or α-tubulin loading controls. The accompanying histograms are
shown in Figure 6.2. The results indicated which β-tubulin isotypes were up or
downregulated relative to untreated samples, thereby validating the multi-plex iTRAQ
proteomic data for differentially regulated β-tubulin isotypes, and the time-course
trends observed by flow cytometry cell cycle analysis. The densitometry data are
given as means and SEM from two to four independent gels. The histogram error
bars give the SEMs. SEM<10% was considered significant; SEM<5% was taken to
be highly significant (* and **, respectively). The highest confidence results were
achieved with the valerate-treated samples.
117

Figure 6.1. Representative Western blot immunofluorescent images of antibodies bound to
β-tubulin isotypes in HCT116 colon cancer cells after SCFA treatments at IC50 (G2/M)
concentrations: (a) β-tubulin from time-course treatments at 3 h and 24 h; (b) β2c-tubulin
from time-course treatments at 6 h; (c) β3-tubulin from the iTRAQ experiment at 24 h
treatment; (d) actin and α-tubulin loading controls.
6.4.2. Expression levels of β-tubulin isotypes following 24 h SCFA treatments
The histogram in Figure 6.2a shows the fold changes of β2c-tubulin, β3-tubulin and
β-tubulin relative to untreated samples after treatment with SCFAs (butyrate,
118

propionate, valerate) for 24 h at IC50 (G2/M) concentrations (Table 6.1a). The results
confirmed that upregulation of these β-tubulin isotypes was greatest with propionate
and valerate compared to butyrate. Valerate showed the greatest effect with the
highest confidence (SEM<10% and SEM<5%, for β2c-tubulin and βc-tubulin,
respectively).
6.4.3. Expression levels of β-tubulin isotypes following time-course SCFA treatments
The histogram in Figure 6.2b shows the fold changes of β-tubulin and β2c-tubulin
relative to untreated samples for the time-course flow cytometry experiment. The
HCT116 cells had been treated with SCFAs (butyrate, propionate and valerate) at
IC50 (G2/M) treatment concentrations for at 3 h, 6 h, 12 h and 24 h. The results
showed that at 3 h there is little change in the regulation of these two β-tubulin
isotypes. At longer treatment times, 6 h and 24 h, valerate again showed the
greatest effect on β-tubulin and β2c-tubulin expression (Table 6.1b). However
Western blotting of the flow cytometry time course samples indicated increased
upregulation of β-tubulin by butyrate following 24 h treatment. This did not reflect the
multi-plex iTRAQ results. The discrepancy may be a consequence of a loading error.
Additional checks were not possible due to the limitation of available samples.
6.4.4. Western blot analysis of loading controls
The histogram and densitometry data (Figure 6.2c; Table 6.1c) for the loading
controls (α-tubulin and actin) show there was little change in regulation between the
different SCFA treatments. These results had high confidence (SEM<10% and
119

SEM<5%, respectively), confirming that these were suitable controls for
quantification of the Western blot analyses.
a) b) c)
Figure 6.2. Western blot densitometry results for β2c-tubulin, β3-tubulin and β-tubulin in
HCT116 colon cancer cells following SCFA treatments at IC50 (G2/M) concentrations. The
histograms show the fold-change data for these β-tubulin isotypes relative to untreated
samples. The data are normalised to α-tubulin or actin controls. (a) samples from the iTRAQ
proteomic experiment at 24 h (b) samples from the flow cytometry time-course treatments at
3 h, 6 h and 24 h; (c) actin and α-tubulin controls.
6.4.5. Western blot densitometry data
Tables 6.1 a–c give the densitometry quantification results for the β-tubulin isotypes
(β-tubulin; β3-tubulin; β2c-tubulin) in HCT116 colon cancer cells after SCFA
treatments. The results are the mean fluorescent intensity after background
correction normalised to actin or α-tubulin loading controls. The percentages indicate
which whether the isotypes were up or downregulated relative to untreated samples.
These observations were used for validation of multi-plex iTRAQ proteomic results
and flow cytometry time-course progression
120

Table 6.1a. 24 h SCFA treatment s at IC50 (G2/M) concentrations: β2c-tubulin; β3-tubulin; β-
tubulin, normalised to controls, relative to untreated samples. [** SEM<5%; * SEM<10%].
tubulin isotype SCFA % change SEM n
β2c-tubulin B 71% 15% 3P 91% 18% 3V 128% 3% 3 **
β3-tubulin B 95% 11% 4P 130% 23% 4V 148% 24% 4
β-tubulin B 60% 27% 4P 101% 20% 4V 118% 9% 4 *
B, butyrate; P, propionate; V, valerate
Table 6.1b. Time-course SCFA treatments at IC50 (G2/M) concentrations: β-tubulin; β2c-
tubulin, normalised to controls, relative to untreated samples.
β-tubulin isotype [treatment time]
SCFA % change
β [3h] B 120%P 73%V 99%
β2c [6h] B 86%P 98%V 128%
β [24h] B 260%P 205%V 324%
B, butyrate; P, propionate; V, valerate
121

Table 6.1c. 24 h SCFA treatment at IC50 (G2/M) concentrations: α-tubulin and actin controls
[** SEM<5%; * SEM<10%].
control SCFA % change SEM n
α-tubulin B 79% 8% 2 *P 95% 1% 2 **V 104% 1% 2 **
actin B 94% 2% 2 **P 98% 16% 2V 89% 10% 2 *
B, butyrate; P, propionate; V, valerate
6.5. Western blotting: Discussion
The Western blot analyses results supported previous observations that valerate
was the most potent of the SCFAs in upregulating β-tubulin, β3-tubulin and β2c-
tubulin at IC50 (G2/M) treatment concentrations. At 24 h, both propionate and
valerate showed greater fold-changes than butyrate in upregulating these β-tubulin
isotypes relative to untreated samples. This confirmed the multi-plex iTRAQ
proteomic data. Comparisons with the flow cytometry time-course results were less
clear; however they did confirm that there was little change in the upregulation of β-
tubulin isotypes at 3 h and reflected the trend for increased upregulation at longer
treatment times. The Western blot results with the highest confidence were those for
valerate treatments. In summary, Western blot analysis validated the multi-plex
iTRAQ and flow cytometry results, supporting the hypothesis that odd-chain SCFAs
distinctly target β-tubulin isotypes.
122

6.6. Key Conclusions: Western blotting
Western blotting provided orthogonal validation of the multi-plex iTRAQ results by
showing similar patterns of β-tubulin isotype expression following SCFA
treatments.
Although less conclusive, Western blotting also supported the flow cytometry
results by indicating that differential regulation of the β-tubulin isotypes by SCFA
treatments was a time-response effect.
In agreement with the iTRAQ proteomic, HCA cellomic and flow cytometry
observations, Western blotting showed that valerate was the most potent effector
of differential regulation of the β-tubulin isotypes associated with MT integrity and
function in HCT116 colon cancer cells.
123

7. Bioinformatics and pathway analysis confirmed that odd-chain
SCFAs, propionate and valerate, uniquely target mitotic events
in HCT116 colon cancer cells, distinctly from butyrate.
7.1. Contribution of bioinformatics to the overall project
The open-access genomic and proteomic knowledgebases verified the
hypothesis by providing details on post-translational acetylation of the
transcriptional regulators targeted by SCFA treatments in HCT116 cells. This
facilitated design of the computational models.
Pathway expression analysis identified the pathways and events associated with
the proteins differentially regulated by SCFA treatments in HCT116 cells, based
on the multi-plex iTRAQ data.
In combination, bioinformatics could support the interpretations of the
experimental results and provide valuable insights into the underlying
mechanisms.
7.2. Bioinformatics: Project outline
Advances in bioinformatic applications, along with the rapidly expanding proteomic
and genomic databases since completion of the genome project, are proving
invaluable in forwarding understanding of biological processes.
In order to explore the distinct and unique actions of SCFAs in HCT116 colon cancer
cells, a considerable amount of data had been generated by high-throughput,
124

quantitative proteomic and cellomic experimentation, including multi-plex iTRAQ
mass spectrometry, HCA microscopy and time-response flow cytometry cell cycle
analysis. These had indicated that propionate and valerate, the odd-chain SCFAs,
uniquely followed anti-mitotic pathways by differentially regulating β-tubulin isotypes.
In contrast, butyrate, the even-chain SCFA, was associated with pro- and anti-
apoptotic proteins and pathways.
The various bioinformatic tools and resources employed by this project, and their
contributions to the overall findings, are summarised as follows.
Phenyx analysis matched the peptide data from multi-plex iTRAQ against UniProt
and NCBI protein databases to return a list of proteins differentially expressed in
HCT116 cells by each of the SCFA treatments relative to untreated cells.
BLAST protein matches confirmed the Phenyx identifications and provided
additional information on proteins with shared sequence coverage, in particular
between the β-tubulin isotypes.
The SAB text mining application predicted the most likely transcriptional binding
sites at these β-tubulin genes, and offered links to the literature so that the
consequences of acetylation at these transcriptional binding sites could be
determined.
The Gene Atlas [52] provided data on the expression profile of β-tubulin isotypes in
untreated HCT116 colon cancer cells relative to normal colonocytes. This gave a
baseline for comparing the experimental observations from SCFA treated
HCT116 cells.
125

STRING [114] produced web-network diagrams of protein-protein interactions
between functional partners and shared metabolic pathways of the β-tubulin
isotypes, providing additional information on the mechanisms involved.
Reactome’s [99] Pathway Analysis tools delivered detailed information on the
mitotic pathways most affected by differential regulation of β2c-tubulin, β3-tubulin
and β1-tubulin isotypes for each SCFA treatment.
Bioinformatics provided evidence to support the formulation of the hypothesis and
contributed to the experimental interpretations. Furthermore, bioinformatics offered
valuable insights into the underlying mechanisms.
7.3. Bioinformatic tools and resources
7.3.1. Phenyx
Phenyx [115] is a software platform for identifying and characterising peptides and
proteins from mass spectrometry experiments. Phenyx matches peptide reporter
ion intensities against protein databases to predict the statistically most likely
proteins from a peptide sequence. Isobaric tagging of the samples enables
relative quantification of the protein results to be performed by in-house software
tools. Confidence values are established by applying strict user-defined
acceptance levels. Details of the methods and algorithms are given in the
proteomics methods chapter.
7.3.2. UniProt and NCBInr
UniProt and NCBI the protein databases [91, 92] were selected for Phenyx analyses.
UniProt combines the SwissProt and TrEMBL protein databases. Whereas
126
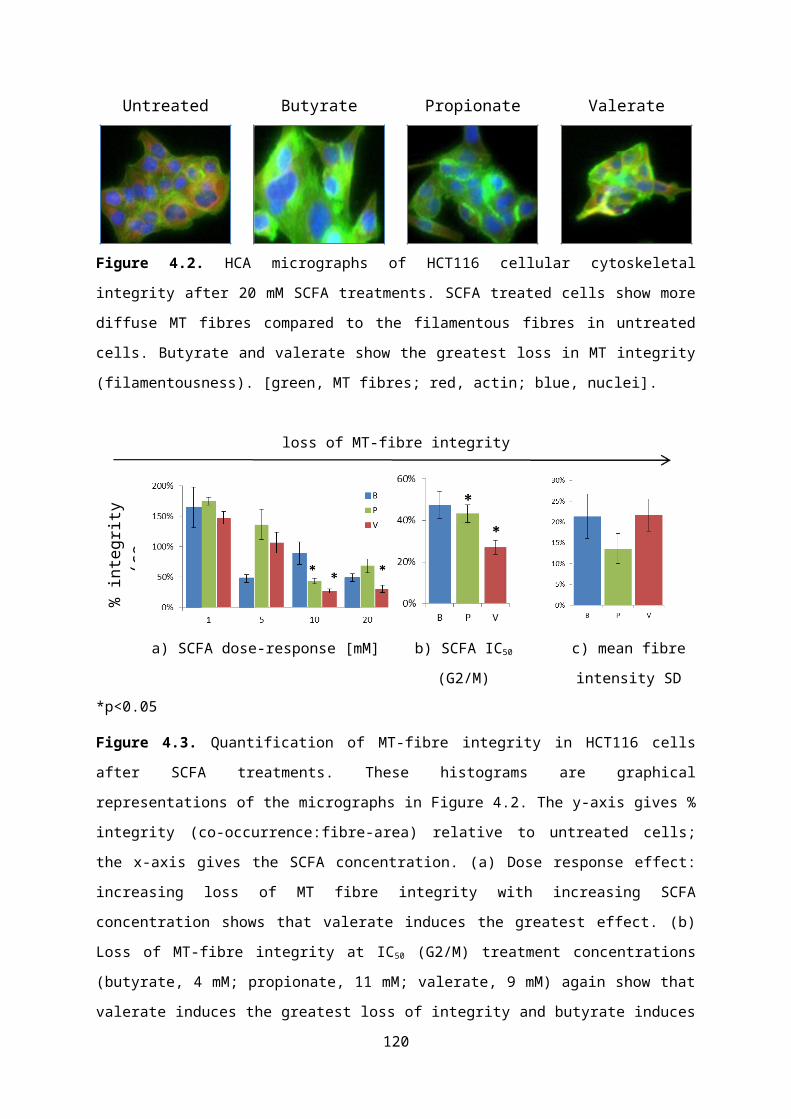
SwissProt is manually annotated and reviewed, TrEMBL is automatically
annotated but not reviewed. NCBI accesses annotated sequence data from
multiple sources including GenBank, RefSeq and TPA plus records from
SwissProt, PIR, PRF, and PDB.
7.3.3. BLAST
BLAST [116], Basic Local Alignment Search Tool, uses sequence-similarity
searching to identify proteins by aligning a submitted peptide sequence to similar
nucleotide sequences within a gene and calculating the statistical significance of a
match [116]. Confidence is increased when several peptide sequences from a single
protein can be aligned to a single gene; confidence is decreased if alignments
occur over multiple genes. Similarities between identified proteins are calculated
by the percentage of shared coverage; for example, highly conserved isotypes
which have little variability in sequences show high percentages of coverage.
BLAST also identifies binding sites for specific molecules on a gene including
transcription factors (TF) and drugs, such as GTP or paclitaxels. BLAST enabled
protein identifications to be made where Phenyx gave ambiguous or unknown
matches
7.3.4. SABioscience
The SABioscience [117] platform predicts the most relevant transcriptional binding
sites associated with a named gene by searching for ChiP qPCR primers for the
TF. The search portal is based on a proprietary DECODE
(DECiphermentOfDNAElements) database combined with the UCSC Genome
Browser and a text mining tool. These enable SAB to compile a list of predicted
binding sites for known genes from the human genome. The UCSC Genome
127

Browser is a bioinformatics pool of genome reference sequences compiled from
annotated chromosomes; the text mining application recognises and extracts
relationships between biological compounds from published reports and
knowledgebases and uses internal recognition systems to identify the genes that
are regulated by specific TFs. At the time of access (July 2012) the DECODE
database contained of over 200 human TFs.
7.3.5. Gene Expression Atlas, GXA
The Gene Expression Atlas, GXA [52], is an EMBL-EBI project [118] that incorporates
a database of expression levels for each known gene in a cell type; tissue type;
species; or disease condition. GXA identifies differential expression patterns by
re-analysing publically available gene expression data against normalised
expression data based on microarray analysis. This allows it to determine whether
they are significantly different from the mean expression for all conditions. Eligible
contributory experiments are curated before inclusion in the database.
7.3.6. Reactome’s Pathway Expression and ID mapping tools
Reactome’s Pathway Expression [99] analysis tool contains the total number of
genes and details of each known reaction event, and is built on a database of
curated, peer-reviewed human pathway data, cross-referenced to multiple
bioinformatics databases. Reaction events are grouped into pathways that are
displayed as a network map of biological interactions. By taking protein identifiers
from a submitted list, such as relative fold-changes or treatment times, and
assigning them to each known event within the database, it calculates the total
number of submitted genes that participate in that event and the probability of
observing at least that number by chance (using a one-tailed Fishers exact test). It
128

then determines which pathways are statistically overrepresented in the submitted
proteins.
The Pathway Expression analysis tool returns the over-represented pathways as
a percentage score of submitted proteins associated with that pathway relative to
the total number of proteins belonging to that pathway. Links to a cellular network
map allow each event or pathway of interest to be further mined to reveal a grid of
participatory proteins with the levels of enrichment colour-coded according to a
hierarchy spectrum.
The corresponding ID mapping tool displays the results as a colour-coded
hierarchical tree giving a visual representation of the overrepresented pathways.
Although all pathways in the tree are strongly enriched in submitted protein
identifiers, some are more enriched than others. The colour of each pathway
within the tree reflects the number of participating protein identifiers, ranging from
red, or “hot”, for those with the most participants, fading down through a colour
spectrum to blue, or “cool”, for those with the least. Those highest in the tree have
the lowest p-values; however, the two measurements provide different information
and do not necessarily correspond. Each parent pathway in the tree is expandable
to reveal a list of child pathways and participating protein identifiers, with
interactive links to provide additional information about each event or pathway. As
well as the hierarchical tree, the results can be displayed as a colour-coded
‘starry-sky’ map and in tabular format.
7.3.7. STRING
STRING [114], Search Tool for the Retrieval of Interacting Genes/Proteins, mines
databases and the literature by performing genomic context analyses to find
129

information on known and predicted protein-protein interactions. Results are
displayed as web-network diagrams, centred on the protein of interest, with links
to their closest functional partners, either directly through physical binding or
indirectly through shared metabolic pathways, based on mutual actions, evidence
or confidence.
7.4. Bioinformatics Results
7.4.1. Phenyx
The protein lists returned by Phenyx [115] analyses from the two multi-plex iTRAQ
experiments of SCFA-treated HCT116 colon cancer cells had included β2c-
tubulin, β3-tubulin and β1-tubulin. The protein identifications were sourced from
both the UniProt and NCBI databases. Subsequent quantification showed that
β2c-tubulin and β3-tubulin were upregulated by valerate and propionate and β1-
tubulin was downregulated by propionate. The results are discussed in detail in
the multi-plex iTRAQ chapter.
7.4.2. BLAST
BLAST [116] queries showed there were no unrelated protein matches to β2c-
tubulin, β3-tubulin or β1-tubulin, adding confidence to the multi-plex iTRAQ
results. However the results did show shared coverage between generic β-tubulin
isoforms. This is expected as tubulin isoforms are highly conserved with most
variations only occurring in the last 15 sequences of their c-termini tails (CTT) [48].
Percentage shared-coverage between β2c-tubulin, β3-tubulin and β1-tubulin were
between 94% and 96%.
130

7.4.3. SABioscience
The SABioscience [117] search portal predicted the most relevant transcriptional
binding sites at β2c-tubulin, β3-tubulin and β1-tubulin genes. Cross-referencing to
linked reports and extensive literature searches provided the necessary
information to determine how these transcriptional regulators would respond to
SCFA-induced acetylation. Most were enhanced or switched to transcriptional
activators and all were found to be present in colonocytes. These transcriptional
regulators promoted histone acetylation at these β-tubulin isotype genes by acting
as histone deacetylases (HDACi) or histone acetyl transferases (HAT) to open up
the DNA to TFs.
The acetylation mechanisms for each of these transcriptional regulators are
summarised as follows: acetylation of RFX and PPAR-gamma-1 & 2 enhances
transcription at the β2c-tubulin gene [119-123]; acetylation inhibits NSFR silencing
activity thereby enhancing transcription at the β3-tubulin gene [124, 125]; acetylated
NF-kappaB downregulates β1-tubulin expression by modulating transcriptional
activity. However acetylation at this gene both raises and inhibits oncogenic
activity by enhancing transcriptional activity of the p53 tumour suppressor but also
enhancing AP-1 and c-jun activity [126, 127], which are both members of oncogene
families. In addition, NF-kappaB has been linked to increased cancer risk in
patients with IBD [128].
7.4.4. The Gene Expression Atlas (GXA)
GXA indicated that β2c-tubulin (TUBB2C) and β3-tubulin (TUBB3) were
downregulated and β1-tubulin (TUBB) was upregulated in untreated HCT116 cells
relative to non-tumour cells (Figure 7.1a). This is believed to be a metabolic
131

adaption by the cancer cells to promote proliferation, invasion and to evade cell
cycle checkpoints, as discussed in the flow cytometry chapter. Similar findings
were reported based on mRNA expression analysis from a study on the
abundance of β-tubulin isoforms in human tumoural and non-tumoural
colonocytes [51]. The multi-plex iTRAQ proteomic data had shown that treatment of
HCT116 cancer cells with propionate and valerate, the odd-chain SCFAs,
produced the opposite expression pattern. This suggested that odd-chain SCFAs
are able to counter the metabolic adaptions in HCT116 colon cancer cells (Figure
7.1b).
a)
b)
Figure 7.1. Histograms of (a) Gene Expression
Atlas (GXA) predictions compared to (b) multi-
plex iTRAQ data for β-tubulin isotype expression
in HCT116 colon cancer cells. a) GXA
expression data shows that β2c-tubulin and β3-
tubulin are downregulated and β1-tubulin is
upregulated in untreated HCT116 cells relative
to non-tumoural cells (Affymetrix GeneChip
array design); b) In contrast, multi-plex iTRAQ
data shows that treatment with propionate and
valerate counters this aberrant β-tubulin isotype
expression pattern.
132

7.4.5. Pathway mapping and expression analysis
Accession numbers (AC), identified by the duplicate SCFA (butyrate, propionate,
valerate) and the quadruplet propionate multi-plex iTRAQ experiments for SCFA-
treated HCT116 colon cancer cells, were submitted for pathway ID mapping and
expression analysis [99]. The hierarchy tree of overrepresented pathways was
expanded to reveal the biological pathways in which β-tubulin isotypes
participated (Figure 7.3). The most enriched pathways were metabolism-of-
proteins (yellow; β2c- & β3-tubulin); membrane-trafficking (turquoise; β3- & β2c-
tubulin); haemostasis (turquoise; β2c- & β3-tubulin). The “cooler” pathways,
though still enriched, were developmental-biology (blue; β3- & β2c-tubulin); cell
cycle (blue; β3-, β2c-, β1-, β-tubulin); DNA-replication (blue; β3- & β2c-tubulin);
mitotic M-M/G1 phases (blue; β3- & β2c-tubulin). The p-values ranged from
1.1x10⁻⁶ for metabolism-of-proteins, with 14 participatory proteins out of a total of
461, to mitotic M-M/G1 phases, 2.9x10⁻² with 4 out of 199 participatory proteins.
The ‘starry sky’ network map, colour coded for the pathways involved, is shown in
Figure 7.2.
133

Figure 7.2. The interactive ‘starry-sky’ map in which participatory biological pathways
highlighted and colour-coded according to an enrichment hierarchy spectrum.
Figure 7.3. Reactome ID mapping [99] takes
proteomic data from multi-plex iTRAQ and returns
a colour-coded hierarchy tree. Each biological
pathway in the tree is enriched in the submitted
proteins. The tree is ordered by the most
significant p-values and each pathway is coloured
according to the number of participating protein
identifiers based on the colour spectrum (above),
where red are the most over-represented and blue
the least. Each pathway can be expanded to
reveal sub-pathways and the identifiers of
participating proteins. [Total number of events
accessed: 6874; No. of matching events: 189; No.
of genes matching submitted identifiers: 38].
134

The Pathway Expression analyses provided more informative results by including
fold-change data from the multi-plex iTRAQ experiments for each of the different
SCFA treatments. Reactome has 273 available pathways, of these butyrate
participated in 82; propionate participated in 96, and valerate participated in 34. The
pathway expression results gave the number and percentage of these differentially
regulated proteins that were overexpressed in each pathway.
By mining the network map, sub-pathways, reaction events and participatory
proteins for each of the mitotic pathways (mitotic G1-G1/S; M-M/G1; and G2-G2/S
phases) were revealed, along with the enrichment level and “colour” for each SCFA
according to the hierarchy spectrum. The results are presented in Figures 7.5 a–c
with examples of the network mining for each of the mitotic pathways. The following
differences were found between the three SCFAs, butyrate, propionate and valerate:
Butyrate was solely represented in the three G1-related mitotic pathways through
non-tubulin proteins. Valerate was solely represented in the G2-related events
through β2c-tubulin and β-tubulin isotypes. Propionate was represented in all five
mitotic pathways but at lower levels of enrichment, which included both G1 and G2-
related events and both β-tubulin and non-tubulin proteins.
The relative contribution of each in these mitotic events is graphically displayed in
pie charts (Figure 7.4). The full tabular list of all statistically over-represented
pathways and events for is given in Appendix II.
135

Figure 7.4. Reactome expression analysis [99] of mitotic pathways enriched in β-tubulin
isotypes differentially expressed in HCT116 cells by SCFA treatments. The mitotic cell cycle
is the parent pathway, the sub-pathways are those listed in the table, along with the colour of
the corresponding segment and level of enrichment. Only butyrate and propionate contribute
to regulation of the cell cycle; butyrate is only involved in G1 pathways; valerate is only
involved in G2 pathways; propionate contributes to both G1 and G2 events but to a lower
level of enrichment. The table below the pie charts gives the percentage contribution of each
SCFA to the total number of proteins in each pathway. [B, butyrate; P, propionate; V,
valerate].
The following tables and figures (7.5 a–c) show the pathway-mining results of sub-
mitotic pathways within the full known metabolic pathway map (‘Starry sky’; Figure
7.2). By submitting the differential protein expression levels induced by each SCFA
treatment (butyrate, propionate, valerate) from the multi-plex iTRAQ data, it was
possible to determine which events each individual SCFA enriched. Each of the
enriched pathways (black-box) could be further interrogated for the level of
enrichment by each SCFA-treatment. These are shown in grids with the level of
enrichment given both quantitatively and colour coded according to the hierarchy
spectrum.
136

The following representative pathways were selected. These are circled in red and
expanded in the figure insets:
(a) Mitotic G1-G1/S [G1/S Transition and G1 phase]
(b) Mitotic M-M/G1 [M/G1 Transition (DNA replication)]
(c) Mitotic G2-G2/M [G2/M Transition].
137

Mitotic G1-G1/S phases. Protein: ‘Ubiquitin-60S ribosomal protein L40 (CEP52)’; AC:
P62988.
Sub-Pathway Pathway event Level and enrichment colour
B P VG1/S Transition
Ubiquitin 1.39(red)
1.27(blue)
null(blue)
G1/S Transition
Cyclin E/A:Cdk2: multi-ubiquitinated phospho-p27/p21:SCF (Skp2): Cks1 complex
1.39(red)
1.27(blue)
null(blue)
G1 phase Ubiquitin 1.39(red)
1.27(blue)
null(blue)
G1 phase Ub-p-T401,S672,1035-RBL2 1.39(red)
1.27(blue)
null(blue)
Figure 7.5a. Mitotic G1-G1/S [G1/S Transition and G1 phase]: SCFA enrichment levels for
two representative G1/S pathway maps focusing on events in ‘G1/S transition’ and ‘G1
phase’: (a) ‘cyclin E/A:Cdk2:multiubiquitinated phospho-p27/p21:SCF(Skp2):Cks1 complex’;
(b) ‘Ub-p-T401,S672,1035-RBL2’. Only butyrate and propionate contribute to these G1/S
events with enrichment levels: B = 1.39 (red); P = 1.27 (blue); V = null (blue). Red (butyrate)
indicates the highest levels of enrichment; in contrast, valerate did not contribute to these G1
events. [B, butyrate; P, propionate; V, valerate; hierarchy spectrum is shown on the right].
138

Mitotic M-M/G1 phases. Protein: ‘Ubiquitin-60S ribosomal protein L40 (CEP52)’; AC:
P62988.
Sub-Pathway Pathway event Level and enrichment colourB P V
M/G1 Transition(DNA replication)
ubiquitin 1.39(red)
1.27(blue)
null(blue)
M/G1 Transition(DNA replication)
geminin: ubiquitin complex 1.39(red)
1.27(blue)
null(blue)
Figure 7.5b. Mitotic M-M/G1 [M/G1 Transition (DNA replication)]: SCFA enrichment levels
for a representative M/G1 pathway map focusing on events in ‘M/G1 Transition (DNA
replication)’: (a) ‘geminin: ubiquitin complex’. Again, only butyrate and propionate contribute
to this M/G1 event with enrichment levels: B = 1.39 (red); P = 1.27 (blue); V = null (blue).
Red (butyrate) indicates the highest levels of enrichment; in contrast, valerate did not
contribute to this G1 events. [B, butyrate; P, propionate; V, valerate].
139

Mitotic G2-G2/M phases and Mitotic G2-G2/M phases. Proteins: ‘β2c-tubulin’; AC: Q8N6N5
and ‘β-tubulin’; AC: Q5JP53.
i) Mitotic G2-G2/M phases. Protein: ‘β2c-tubulin’; AC: Q8N6N5
Sub-Pathway Pathway event Level and enrichment colourB P V
G2/M Transition Centrosome-nucleated microtubules 0.0(blue)
0.0(blue)
1.67(red)
G2/M Transition NuMA-bound microtubules 0.0(blue)
0.0(blue)
1.67(red)
G2/M Transition centrosome-associated NuMA 0.0(blue)
0.0(blue)
1.67(red)
ii) Mitotic G2-G2/M phases. Protein: ‘β-tubulin’; AC: Q5JP53
G2/M Transition centrosome 0.0(blue)
1.44(orange)
1.65(red)
G2/M Transition Nip-depleted centrosome 0.0(blue)
1.44(orange)
1.65(red)
G2/M Transition Centrosome associated Pk1 0.0(blue)
1.44(orange)
1.65(red)
G2/M Transition cNAP-1-depleted centrosome 0.0(blue)
1.44(orange)
1.65(red)
G2/M Transition centrosome containing phosphorylated Nip
0.0(blue)
1.44(orange)
1.65(red)
G2/M Transition Centrosomes containing recruited CDK11p58
0.0(blue)
1.44(orange)
1.65(red)
G2/M Transition Mature centrosomes enriched in gamma-TURC complexes
0.0(blue)
1.44(orange)
1.65(red)
140

Figure 7.5c. Mitotic G2-G2/M [G2/M Transition]: SCFA enrichment levels for two
representative G2-G2/M pathway maps focusing on events in ‘G2-G2/M phases’: (a)
‘Centrosome containing recruited CDK11p58’; (b) ‘Centrosome-nucleated microtubules’. The
participating proteins were βb-tubulin and β2c-tubulin respectively. Only valerate and
propionate contributed to these G2/M events with enrichment levels: (a) B = 0.00 (blue); P =
4.4 (orange). V = 1.65 (red); (b) B = 0.00 (blue); P = 0.0 (blue). V = 1.67 (red). Red (valerate)
indicates the highest levels of enrichment; orange (propionate) indicates medium
enrichment; in contrast, butyrate did not contribute to these G2 events. [B, butyrate; P,
propionate; V, valerate; hierarchy spectrum is shown on the right].
141

7.4.6. String Functional Partners
Searches for the functional partners associated with β2c-tubulin, β3-tubulin and β1-
tubulin showed there were no direct interactions between β2c-tubulin and β3-tubulin
(Figure 7.6). However there was a weak connection between β2c-tubulin (TUBB2C)
and generic β-tubulin (TUBB) and a weak indirect connection via α-tubulin between
β3-tubulin (TUBB3) and β1-tubulin (synonym, TUBB5). All three β-tubulin isotypes
interacted with multiple α-tubulin isotypes, as expected though αβ-dimerisation, and
to other protein partners in shared metabolic pathways.
a) β2c-tubulin (TUBB2C) action network b) β3-tubulin (TUBB3) action network
Figure 7.6. STRING web-network diagrams of protein-protein interactions for β2c-tubulin,
β3-tubulin and β1-tubulin isotypes, showing the closest functional partners directly linked by
physical binding or indirectly associated through shared metabolic pathways. (a) There is a
weak connection between β2c-tubulin (TUBB2C) and the generic β-tubulin (TUBB); (b) and
a weak indirect connection, via α-tubulin isoforms, between β3-tubulin (TUBB3) and β1-
tubulin (synonym, TUBB5). However, there are no direct connections between β2c-tubulin
and β3-tubulin. As expected though αβ-dimerisation, all three β-tubulin isotypes are
physically bound to multiple α-tubulin isotypes.
142

7.5. Bioinformatics: Discussion
Bioinformatics informed, validated and interpreted each step of the project by
exploiting the vast resource of available, ever-expanding, inter-connected gene and
protein databases and knowledgebases and by utilising open-source data and text
mining tools. The selected databases were compiled from curated and annotated
sources, thereby ensuring the information was robust.
The pathway expression analyses (Reactome) supported the proposal, based on the
experimental evidence, that the odd-chain SCFAs, propionate and valerate, distinctly
targeted the mitotic pathways. This was in contrast to butyrate, the even-chain
SCFA, which is associated with apoptotic pathways [106]. Furthermore, the levels of
pathway enrichment agreed with the experimental observations that valerate was the
most potent effector in G2-related pathway events. The bioinformatic searches
indicated that whereas butyrate only participated in G1 mitotic-events via non-tubulin
proteins, valerate was solely involved in G2-mitotic events via β2c-tubulin and β-
tubulin isotypes. Propionate contributed to both these G1 and G2 event, but as a
weaker partner.
By exploring the protein-protein interactions between these β-tubulin isotypes [114],
STRING confirmed that all three β-tubulin isotypes interacted with α-tubulin isotypes,
as expected through αβ-tubulin dimerisation. However, STRING also showed that
β2c-tubulin and β3-tubulin act independently of each other but both interacted with
β1-tubulin. This may suggest that upregulation of β2c-tubulin and β3-tubulin could
provoke downregulation of β1-tubulin through competitive actions. This proposition
will require further investigation.
143

Bioinformatic information derived from the Gene Expression Atlas indicated that the
observed upregulation of β2c-tubulin [52], β3-tubulin and downregulation of β1-tubulin
in HCT116 cells following treatment by propionate and valerate could potentially
counteract the metabolic adaptions of colon cancer cells [108], which promote the
opposing β-tubulin expression profile [51]. As discussed in the introduction, these
three β-tubulin isotypes have been associated with the most aggressive and invasive
cancers.
Overall, the findings and evidence from the bioinformatic searches and explorations
have provided revealing insights into previously unexplored metabolic actions of
SCFAs in colonocytes, supporting a novel pathway by which odd-chain SCFAs could
act as chemopreventives in colon cancer epithelial cells.
7.6. Key Conclusions: Bioinformatics
Bioinformatics supported the key suppositions in the hypothesised pathway by
confirming that epigenetic post-translational acetylation promoted transcription at
the β-tubulin isotype genes identified as differentially regulated by multi-plex
iTRAQ.
Pathway expression analysis, based on the multi-plex iTRAQ fold-change data
showed that the odd and even-chain SCFAs were associated with distinct mitotic
events: butyrate was solely associated with G1-mitotic events; valerate was
solely involved with G2-mitotic events; propionate was associated with both G1
and G2-mitotic events, but as a weaker partner.
144

8. Computational dynamical modelling supports a hypothesised
SCFA-targeted mitotic pathway in which odd-chain SCFAs act
as anti-mitotic destabilising agents by disrupting MT-dynamic
instability
8.1. Contribution of computational dynamical modelling to the overall project
State-of-the-art, high-throughput, quantitative experimentation had generated a
considerable volume of complex inter-related information. Systems Biology,
through a bottom up approach, could facilitate formulation of a hypothesis.
Computational dynamical modelling was able to test the plausibility of the
proposed hypothesis, make testable predictions for further investigation and
provide revealing insights into the mechanisms involved.
8.2. Introduction to computational dynamical modelling
8.2.1. Computational dynamical modelling of the hypothesised pathway
Systems Biology is a valuable technique for studying complex biological processes,
as discussed in the introduction chapter. Part of this approach is to combine
computational dynamical modelling with experimental observations. A well-designed
model is one that is simple enough to avoid the complexities of biological systems,
yet accurate enough to mimic the pathways being investigated. The computational
model enabled the hypothesised metabolic pathway of SCFAs in HCT116 colon
cancer cells to be broken down into its known or derived kinetic reactions, which
145

were then translated into ordinary differential equations (ODE). These were linked
according to set rules to allow the reactants to interact in silico. The hypothesis is
validated if simulated outcomes match experimental observations, conversely a
model can show that the assumptions underlying the hypotheses may be incorrect
and need to be revised.
The model design was refined by parameter matching the data from the multi-plex
iTRAQ and HCA cellomics experiments with the simulated outputs [75]. In addition to
testing the plausibility of the hypothesis, the model was employed to predict the
effects of different SCFA-treatment conditions and physiological scenarios by
altering their input concentrations and combinations.
8.2.2. Microtubules and dynamic instability
Microtubules (MT) are cytoskeletal proteins with critical roles in many cellular
functions, including mitosis. Their structure and functions have been described in the
introduction chapter. Their ability to rapidly grow and shrink in response to cellular
cues is central to performing their multiple roles and is achieved by sequential
addition of α and β tubulin subunits onto the fibre (polymerisation), or by dissociation
of the subunits back into the cytosol. The mechanism is termed dynamic instability
[62].
Disruption of MT dynamics is a strategy adopted by many cancer therapies. This
makes the proposed anti-mitotic behaviour of the odd-chain SCFAs in HCT116 colon
cancer cells attractive as it suggests they may be potential chemopreventives
against colorectal cancer (CRC).
The tubulin code hypothesises that the relative proportion and arrangement of the β-
tubulin isotypes along the fibre [47], and their interactions with microtubule associated
146

proteins (MAP), determine the behaviour of the MTs. For example, whether the fibre
will grow or shrink or whether the MAPs are involved in cellular transport [60, 61].
Therefore perturbing this code by differentially regulating β-tubulin isotypes can
therefore bring about failure of critical cellular processes, including formation of the
mitotic spindle, leading to cell death.
The favoured mechanism of MT dynamics is the GTP capping model [69]. This is
described as follows: each α- and β-tubulin subunit has a single GTP binding site
and can only assemble into MT-fibres in their phosphorylated form. Following
polymerisation, β-tubulin-GTP subunits are readily, though irreversibly, hydrolysed to
GDP whereas α-tubulin-GTP subunits remain non-exchangeable. Only when β-
tubulin is released back into solution can it be re-phosphorylated. The β-tubulin-GTP
form a protective, stabilising cap at the tip of MT-fibres. This is closely coupled with
the rapid hydrolysis of the preceding β-subunits, releasing the energy required for
continued polymerisation [48]. MT growth continues until the supply of free β-tubulin-
GTP subunits in the vicinity of the fibre tip falls below a critical concentration (CC) [64].
The unstable hydrolysed GDP-subunits are exposed causing rapid disassembly of
the MT-fibre, termed catastrophe. The released β-tubulin-GDP subunits re-
phosphorylate back to their GTP-form, restoring the CC, enabling fibre growth to
resume, termed rescue. Catastrophe and rescue describe a non-equilibrium,
stochastic, but highly orchestrated, cycle of MT growth and shrinkage.
Formation of the protective cap is a cooperative event in which the addition of each
new tubulin-GTP subunit expands the number of available binding sites for further
subunit attachment [70, 71]. This process may act in parallel with facilitated, or directed,
diffusion [72], which proposes that the probability of free tubulin-GTP subunits
encountering an MT-fibre increases as the length and number of MT-fibres
147

increases. The polarity of MT-fibres, by virtue of the αβ-heterodimers, then directs
the subunits toward the plus, or growth, ends of the fibres, increasing the rate of
assembly. This has also been discussed in greater detail in the introduction.
8.3. Model design and kinetic parameters
The purpose of the computational dynamical model was to construct a simple
replication of MT-dynamic instability and simulate the SCFA-induced mechanisms
that might disrupt it. The steps of the hypothesised pathway, described below,
shaped the framework of the model. The aim of the design was to include the
principle kinetic steps of the pathway while avoiding the biological complexities that
make interpreting in vivo and in vitro observations difficult. This balance of simplicity
and accuracy is fundamental to good model design.
The model design, shown schematically in Figure 8.1, follows a metabolic signalling
cascade initiated by SCFAs and culminating in perturbation of MT-dynamic
instability. The steps are as follows: (i) SCFA input provokes acetylation of
transcriptional regulators at specific β-tubulin genes (β2c-tubulin, β3-tubulin, β1-
tubulin) to enhance, or switched these regulators to transcriptional activators; (ii)
these act by driving histone acetylation to remodel chromatin, which alters the
transcriptional balance at those genes; (iii) synthesis of β2c-tubulin and β3-tubulin is
prolonged, leading to upregulation; consequently synthesis of β1-tubulin is
suppressed, leading to downregulation; (iv) the resulting aberrant expression of β-
tubulin isotypes shifts the balance of recruited MAPs towards destabilisation; (v)
thereby disrupting the cycle of MT-dynamic instability.
This model will be submitted to the BioModels database [129].
148

keySCFA input (drug) treatment
TF transcriptional regulator
Tubb differentially expressed β-tubulin
isotypes
src source in Tubb synthesis
MAP destabilising MT associated
proteins
[Cell Designer v.4.2]
Tu-GDP GDP form of β-tubulin
Tu-GTP GTP form of β-tubulin
MT microtubule fibres (MT)
ac acetylation
P phosphorylation
• grey boxes: active compounds
• white boxes: inactive compounds
• arrows: direction of reaction
• circled arrows: activation modifier
Figure 8.1. Qualitative schematic model describing the key kinetic reactions in the
hypothesised metabolic pathway. Reactants interact in silico according to kinetic rules
defined by ODEs. Input of SCFA (drug) at the top right-hand corner leads to a cascade of
downstream epigenetic acetylation reactions culminating in perturbation of MT-dynamic
instability (shown in the lower left hand corner). The ODEs are described in Table 8.1.
149

8.3.1. Design rationale
i. The Qualitative Schematic Model (Figure 8.1) was designed using CellDesigner
v4.2 [130] and the computational mechanistic model was built in COPASI v4.7 [131].
COPASI was designed, and is continually being developed, to construct,
simulate and analyse complex biochemical networks and their dynamics. It is a
biochemical network simulator that utilises the cross-platform standard Systems
Biology Mark-up Language (SBML) for inputting ODEs. COPASI can perform
both deterministic and stochastic time course simulations through ODEs and
algorithms. Added benefits include the ability to visualise temporal and steady-
state simulations of biological behaviour through customisable plots, parameter
scans or animations. Furthermore, it provides tools for optimisation and
sensitivity analyses and enables parameter estimation by linking with
experimental data. This allows a model to be continually refined through a cycle
of input experimental data and output testable predictions, in accord with a
Systems Biology approach.
ii. A single compartment was specified, the cell; volume units were set to [l];
concentration units were set to [μM]; and time units were set to [s]. Although
computational models typically describe single cell compartments, this was
acknowledged to be a simplification as experimental measurements represent
the combined actions of many millions of cells. The concentration units were
comparable with reported MT concentrations in vitro (~7 μM) [132]. Similarly, DNA
and histones exist at μM concentrations within cells, as determined through
simple estimations based on the molecular mass of DNA (330 Da) and the
typical number of bp in a cell (~109). The time units were compatible with the
reported rate of MT-dynamic instability in which MTs were observed to grow for
150

approximately 80 s then rapidly dissociate [64]. MTs have multiple functions
including mitosis and therefore they undergo multiple transitions during the
lifetime of a cell.
iii. The choice of rate law depends on the biological system being studied and the
requirements of the modeller. In vitro and in vivo MT-dynamic instability is a
stochastic, unpredictable event, appearing to be random [64]. Stochastic
simulations are best at providing information on individual behaviour but are
computationally expensive. Deterministic simulations are better at giving an
overview of a whole system. They numerically integrate many stochastic events
and so are more efficient but at the loss of individual behaviour [133]. Because
MTs display a wide range of behaviour, a deterministic approach was applied for
this model.
iv. Computational dynamical models can simulate changes to reactant
concentrations or particle numbers over time. By conserving moiety, changes in
MT-concentration were matched by changes in free tubulin concentrations, and
therefore reflected tubulin subunit assembly and disassembly. Concentration
based simulations were performed with this model.
v. Reactions involving non-participatory species have been omitted. For example,
α-tubulin subunits make up one-half of the αβ-heterodimer but are not
hydrolysed in MT-fibres and do not contribute to MAP recruitment and changes
to MT-dynamic instability. Therefore processes involving α-tubulin, such as αβ-
dimerisation, were not included in the model design.
vi. Perturbation of MT-dynamic instability by MAPs was set at the dissociation step
of the cycle. This assumption was based on experimental evidence from HCA
151

cellomics, which had demonstrated a loss of MT fibre integrity following SCFA
treatment.
vii. The 3-step MT-dynamic instability cycle model was adapted from Tyson’s 2-
species cell cycle model and incorporated as a module into the pathway [134].
This established model has been extensively cited in BioModels and subsequent
publications [129]. Both the 2-step cell cycle model and simplified MT-dynamic
instability mechanism can be described by similar kinetic equations. In addition,
the rate-limited instability of the Tyson model drives spontaneous oscillations
when constrained between upper and lower kinetic limits, and changes to kinetic
rate constants within these limits produce different behavioural responses.
These oscillations are similar to those describing MT-dynamic instability and
changes to input conditions can reflect increased or decreased stabilisation.
viii. β-tubulin isotypes were both participants and indirect modifiers of MT-dynamic
instability, via their recruitment of MAPs.
ix. Parameter matching was carried out at the β-tubulin synthesis step. There were
no pre-conceptions as to how these changes in β-tubulin isotype expression
rates would affect the simulated behaviour of the MT-dynamic instability model.
This ensured that comparisons with reported experimental observations were
objective.
x. The following abbreviations were adopted: Tu-GTP, (the GTP form of tubulin
subunits); Tu-GDP, (the GDP form of tubulin subunits); Tubb refers to the
combined weighted concentration of the differentially regulated β-tubulin isotypes
(β3-tubulin, β2c-tubulin, β1-tubulin) according to their relative abundance in
colon epithelial cells. This is described in detail in the conversion section.
152

8.3.2. Kinetic equations (ODE)
Irreversible mass action-based kinetics were applied to describe the forward and
backward reactions for acetylation, deacetylation and phosphorylation reactions.
Synthesis of β-tubulin was described as constant flux [135, 136]. Reactions were
activated or inhibited by the product of the preceding reaction based on the
concentration of that product [135, 136].
The established kinetic view of MT-dynamic instability follows three key steps [70, 71]:
co-operative second-order tubulin subunit assembly closely coupled with GTP
hydrolysis; rapid first order MT-fibre disassembly; and zero-order re-phosphorylation
of free β-tubulin-GDP. Catastrophe occurs when the concentration of phosphorylated
β-tubulin subunits (Tu-GTP) falls below CC; rescue, or re-growth, resumes when the
concentration rises above CC. (The ODEs are presented in Table 8.1).
153

Table 8.1. Ordinary Differential Equations (ODE) and rate law descriptions defining the
kinetic reactions of the computationally modelled hypothesised pathway.
Reaction ODE and rate law description
TF acetylation v_ac_tf = kac_tf [TF] [drug_SCFA]
TF deacetylation v_dac_tf = kdac_tf [TF_ac]
mass action: activator, SCFA (drug)
mass action: deacetylation
Histone acetylation v_ac_h = kac_h [hist] [TF_ac]
Histone deacetylation v_dac_h = kdac_h [hist_ac]
mass action: activator, acetylated-TF
mass action: deacetylation
Tubb synthesis v_syn = ksyn [hist_ac]
Tubb degradation v_deg = kdeg [TUBB]
constant flux: activator, acetylated-histones, i.e. remodelled chromatin and open
DNA
mass action: degradation
MAP recruitment TUBB = MAP
concentration of destabilising MAP = concentration of recruiting Tubb
MT catastrophe v_catas = kcatas [MT] [MAP]
mass action: activator, destabilising MAPs
Tu-GDP phosphorylation v_phos = kphos
first order phosphorylation of free β-tubulin-GDP prior to capping
MT rescue v_resc = [Tu_GTP] (kresc_prime + kresc [MT]^2)
Tu-GTP dephosphorylation v_dephos = kdephos [Tu_GTP]
second order, cooperative association (capping)
closely coupled with dephosphorylation of preceding β-tubulin-GTP subunit
154

8.3.3. Kinetic rate constants
Kinetic rate constants were determined by searching for similar kinetic reactions in
curated BioModels [129], the Brenda enzyme database [137] and reports in the literature.
Where data were unavailable or limited, informed estimates were made. The
following assumptions and approximations were applied:
i. Kinetic rate constants were inferred and local parameters added to reactions
where appropriate [134, 136].
ii. Although kinetic information on acetylation of specific TFs was scarce, there was
a wealth of information on phosphorylation. As acetylation and phosphorylation
are kinetically similar PTMs, with equal importance in many biological processes,
an assumption was made that they were interchangeable.
iii. Rate constants for synthesis and degradation span a wide range of values. In
addition, the basal rate of transcription is reported to be independent of substrate
concentration [138]. Mid-range values were adopted for this model.
iv. Although rate constants can often be altered by the PTMs of modifying or
catalysing proteins, this was not taken into consideration in this simplified model
[34].
The rate constants selected for the model are given in Table 8.2. The references
and kinetic ranges used to inform any estimates are detailed in Table 8.3.
155

Table 8.2. Parameter overview of the rate constants selected for the computational
dynamical model. The sources of these parameter values are given in the following Table
8.3.
Reaction parameters
Reaction k rate constant value
MT catastrophe kcatas 0.865 l/(µM*s) *
MT rescue kresc 180 s-1 *
kresc_prime 0.018 s-1 *
Tu-GDP phoshorylation kphos 0.0125 µM/(l*s) *
Tu-GTP dephoshorylation kdephos 0.001 s-1 *
β-tubulin synthesis ksyn 0.25 s-1 †
β-tubulin degradation kdeg 0.01 s-1 †
TF acetylation kac_tf 0.3 l/(µM*s) †
TF deacetylation kdac_tf 0.25 s-1 †
Histone acetylation kac_h 0.3 l/(µM*s) †
Histone deacetylation kdac_h 0.05 s-1 †
* Tyson (1991) [134]
† refer to Table 8.3
156

Table 8.3. The parameter values used in the model were based on best estimates from
those reported in the literature, the Brenda enzyme database [137] or similar modelled
processes in BioModels [129].
Reaction Typical k-rates from the literature Ref.
Histone & TF acetylation/ phosphorylation k = 0.2 to 5 [l/(µM*s)] [139] [140]
kcat = 0.3 [s-1]
kcat/km = 0.9
(kcat 0.35; km 0.38)
[141]
[137]
deacetylation k = 0.2 to 5 [s-1] [140] [141]
Tubb synthesis
(synthesis covers a wide range of k-rates depending on cell requirements at different phases.)
k = 0.01 to 0.215 [s-1]
k = 0.015 [s-1]
k = 0.01 to 0.2 [s-1]
k = 0.08 [s-1]
[135]
[134]
[136]
[142]
Tubb degradation k= 0.1 to 0.6 [s-1]
k= 0.06 to 2 [s-1]
[134]
[136]
Tu-GDP phosphorylation k = 500 [s-1]
k = 0.962 [s-1]
[142]
[140]
Tu-GTP de-phosphorylation k = 0.0012 [s-1]
k = 0.05 [s-1]
[142] [140]
(ratio of phosphorylation:de-phosphylation) (100 to 1000) [134]
8.3.4. Initial reactant concentrations
This is a semi-quantitative computational model aimed at understanding qualitative
MT behaviour as oppose to quantitative optimisation. As such, the following valid
approaches consistent with hypothetical modelling have been applied. The initial
concentrations selected for the computational dynamical model are given in Table
8.4.
157
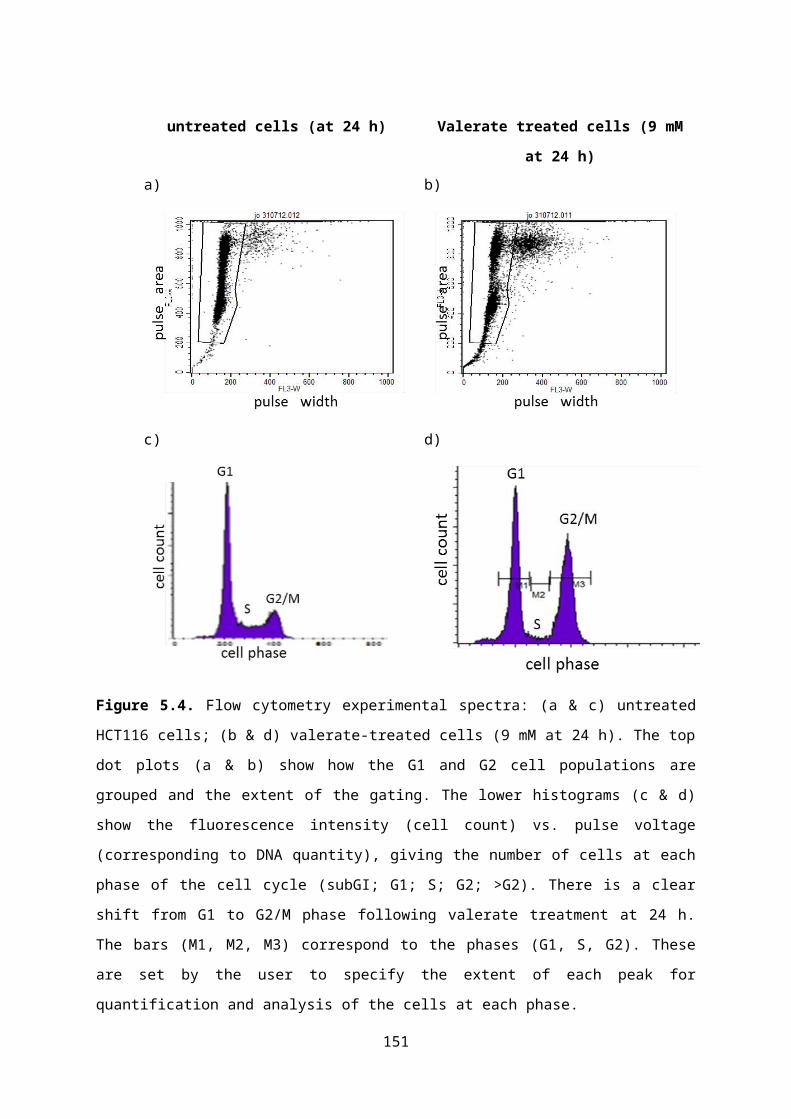
i. The total tubulin concentration (MT, Tu-GDP and Tu-GTP) was set at 4.5 μM.
This was based on in vitro concentrations reported in the literature from
experimental studies on tubulin dynamics [49, 64, 69, 132]. Conservation of moiety was
maintained (MT + Tu-GDP + Tu-GTP = constant) so that an increase in MT
concentration (mass/cell) was accompanied by a matched decrease in tubulin
subunit concentration, and vice versa.
ii. The initial concentration of Tubb was estimated from the total concentration of
DNA/chromatin in the cell and the relative abundances of β2c-tubulin, β3-tubulin
and β1-tubulin in colon epithelial cells in relation to total β-tubulin. These are
25%, 1% and 5%, respectively [61, 143].
iii. The steady-state values of Tubb for each SCFA input were set to match the
differential expression (fold-change) as determined by multi-plex iTRAQ. This
was achieved by manually adjusting the input SCFA activation coefficient, in
accord with previous authors [67]. In order to combine the iTRAQ fold changes
from the three individual β-tubulin isotypes into a single Tubb parameter, their
relative abundances were taken into account and the fold-changes weighted
accordingly. This is described in Table 8.5. The resulting steady-state Tubb
values were 1.18 (butyrate); 1.33 (propionate); and 1.40 (valerate).
iv. The different activation coefficients assigned to each SCFA was dependent on
structural characteristics, such as chain length and odd-eveness, and was
unique to this metabolic pathways.
v. MAPs are recruited by β-tubulin isotypes in MT-fibres, therefore their
concentration was assumed to be directly proportional to Tubb. According to the
model hypothesis, the MAPs recruited by β2c-tubulin, β3-tubulin and β1-tubulin
were MT-destabilising MAPs.
158

vi. The initial concentrations for TFs and histones had minimal effect on the
simulated rates of transcription, therefore they could be set to arbitrary values in
line with approaches taken by previous authors [140, 138].
vii. The concentration of protein depends on the relative forward and backward rates
of synthesis and degradation. These in turn depend on upstream PTMs of
transcriptional regulators and histones (which open up chromatin DNA to
transcription factors). In this model, Tubb synthesis and degradation rates
depended on histone acetylation and deacetylation induced by TF acetylation
and deacetylation.
Table 8.4. Parameter overview of the initial concentrations selected for the computational
dynamical model.
Initial Concentrations
Parameter Definition (where relevant) Value
moiety [MT + Tu_GDP + Tu_GTP] 4.5 µM
MT 1.5 µM
Tu_GDP 2.5 µM
Tu_GTP 0.5 µM
drug_SCFA Activation coefficient manually set for
parameter matching iTRAQ fold change to in
silico ‘Tubb’.
1–2.8 *
Tubb/MAP Initial concentration 0.5 µM
Tubb/MAP Steady-state Tubb = iTRAQ fold change 1–1.40 µM †
hist estimated from DNA per cell 0.3 µM
hist_ac 0 µM
TF estimated from BioModels 0.05 µM
TF_ac 0 µM
* refer to Table 8.6; † refer to Table 8.7
159

The SCFA (drug) activation coefficients were the only manually adjusted parameter
in the model [67]. All others parameters were dependant on their initial values, rate
constants and the cascading effect of each SCFA input coefficient during model
simulations. As such, the outcomes could not be pre-determined and depended
solely on the actions of the hypothesised pathway.
Table 8.5. Calculation of the in silico Tubb parameter: The combined fold-change of
differentially expressed β-tubulin isotypes (determined by multi-plex iTRAQ) was weighted
according to their abundance in colonocytes
Parameter β2c-tubulin β3-tubulin β1-tubulin Tubb
(β2c, β3, β1)
Abundance in colonocytes
a) relative to total β-tubulin 25% 1% 5% (31%)
b) relative to β2c, β3, β1 (Tubb) 81% 3% 16% (100%)
multi-plex iTRAQ fold-change
(relative to untreated)
1.22 1.04 --- B
1.46 1.33 0.73 P
1.48 1.48 --- V
% fold-change
(before weighting)
22% 4% --- B
46% 33% 27% P
48% 48% --- V
% fold-change
(after weighting)
18% 0% --- B
36% 1% -4% P
38% 2% --- V
B, butyrate; P, propionate; V, valerate
The final steady-state values of Tubb are given below. These were calculated by
combining their individual weighted fold-changes. The corresponding SCFA
160

activation coefficients were determined by parameter matching the iTRAQ results
to simulated Tubb expression. Untreated input was set as unity:
SCFA coefficient B: 1.37 P: 2.15 V: 2.80
Tubb [µM] 1.18 1.33 1.41
8.3.5. Physiological predictions.
An important application in computational dynamical modelling is the ability to
predict theoretical outcomes for experimental testing and validation. As such, the
model was used to predict how SCFA might behave under physiological conditions
when they would act in combination and under different concentrations.
Having calculated the SCFA activation coefficients at the following IC50 (G2/M)
treatment conditions: butyrate 4mM (B); propionate 11mM (P); valerate 9mM (V), it
was possible to combine them in different scenarios, e.g. additive (B + P + V); odd-
chain only (P + V); antagonistic (P + V vs. B) and adjust the activation weighting
according to their physiological concentrations. The physiological concentrations
were based on a study of 87 patients diagnosed as normal, with adenoma or with
colon cancer (butyrate, 6.2 mM; propionate, 7.1 mM; valerate, 1.0 mM) [13, 144]. Of
note was how these physiological concentrations, taken from both normal and
colon cancer patients, compared to the IC50 (G2/M) treatment concentrations in
HCT116 colon cancer cells where each SCFA was in isolation in vitro. This
indicated that the physiological value for butyrate was higher, whereas those for
propionate and valerate were lower. A further observation was that the IC50 (G2/M)
coefficient for butyrate was the same as that predicted for the physiological
‘antagonistic’ SCFA scenario, where butyrate acted in opposition to propionate and
valerate in this anti-mitotic pathway. The predicted SCFA coefficients are given
161

below and the corresponding Tubb concentrations were derived from the simulated
outputs:
SCFA (drug) antagonistic
(P + V - B)
odd-chain
(P + V)
additive
(B + P + V)
SCFA coefficient 1.37 1.94 2.52
Tubb [µM] 1.18 1.30 1.38
8.3.6. Comparison of computational model parameters to reported experimental in
vitro data
The in silico outputs of the MT-dynamic parameters under different input scenarios
(Tables 8.6) were compared to reported in vitro data for MTs under similar
conditions, based on time-lapse microscopy measurements of growing and shrinking
MTs (Table 8.7) [64, 69, 132]. The results provided valuable insights into SCFA
behaviours in mitotic events.
Table 8.6. Reported in vitro MT-dynamicity data from destabilisation, stabilisation and
physiological time-lapse fluorescence microscopy studies of PtK2 cells [132].
MT-dynamicity parameters in vitro destabilisation
treatments
in vitro stabilisation
treatments
control untreated (GFP)
destabilised(GFP-XKCM1)
control(IgG)
stabilised(anti-XKCM1)
growth rate [µM.s-1] 4.5 3.60 6.00 4.00 4.00
shrinkage rate [µM.s-1] 10.9 9.50 6.90 6.40 10.00
catastrophe frequency [s-1] 0.004 0.004 0.018 0.012 0.006
rescue frequency [s-1] 0.029 0.036 0.021 0.020 0.038
elongation time [s] 52.0 66.2 34.1 38.7 63.8
shrinkage time [s] 5.8 7.2 29 19.9 7.6
In the absence of in vitro data for MT-dynamicity parameters in colonocytes, data
from an in vitro experiment based on PtK2 cells was chosen for the in silico
162

comparisons [132]. The selection was based on the following criteria: PtK2 cells are an
established model for studying MT-dynamics and the mitotic process [49, 64, 69, 145]; in
common with HCT116 cells, PtK2 renal cells are an epithelial cell line; the selected
study included all three scenarios of interest (stabilising, destabilising and
physiological) thereby providing consistency for the different comparisons. Relative
values based on fold-change data were used for the comparisons, as oppose to
absolute values, because HCT116 and PtK2 cell-lines are derived from different
tissues. The PtK2 destabilising enzyme was XKCM1 with non-expressing transfected
cells used as a control. Anti-XKCM1 had been used for the stabilising treatment.
Normal, GFP expressing PtK2 cells were used for the physiological comparisons.
8.3.7. Comparison of computational model parameters to experimental data
In order to make comparisons between the simulated outputs and experimental data
from this project, conversion factors had to be derived. The in silico values are given
in Table 8.6 and were averaged over 750 s. The comparisons are given in Figure
8.6.
a) HCA MT-cytoskeletal integrity comparison: The assumption was made that
MT-fibre integrity was related to MT dissociation and thereby MT-concentration.
As such, the loss of MT-fibre integrity quantified by HCA would parallel the
decrease in mean in silico MT-concentration. A novel single HCA fibre-integrity
parameter had been defined based on MT-fibre area and texture, which allowed
direct comparisons to be made. This has been described in the HCA chapter.
b) Flow-cytometry cell cycle parameters: Cell cycle analysis of HCT116 cells
undergoing SCFA treatments was quantified by time-course flow-cytometry. The
observed shift in cell accumulation from G1 to G2/M phase under different
163

SCFAs treatment conditions had been associated with failure to undergo mitosis
due to loss of MT-fibre integrity and mitotic breakdown in line with the HCA
observations. Therefore, the flow cytometry results were again compared to the
computational outputs for mean MT-concentration.
8.4. Time-course simulations
Computational simulations were started a time t = 0 (model time), however a
suppression period of 500 s was applied to allow perturbation reactants (Tubb and
MAP) to reach steady-state concentrations before MT-dynamic instability parameters
were analysed. MT-dynamic instability output data were recorded between 500 s and
750 s to give a sufficient number of oscillations for MT-dynamic parameter
calculations. The long-term effects on MT behaviour were observed over time
periods up to 5000 s. Time-course data were output from COPASI v4.7 [131]. The data
were analysed using Microsoft Excel and the results are presented in both tabular
and graphical format.
The key parameters, termed MT ‘dynamicity’ [53], are catastrophe frequency, rescue
frequency, growth rates and shrinkage rates. Other parameters include elongation
and shrinkage periods, mean MT concentration and the critical concentration, CC.
These are described with reference to computational simulations in Figure 8.2 as
follows:
growth rate [µM.s-1]: increase of MT-concentration/elongation time
shrinkage rate [µM.s-1]: decrease of MT- concentration/shrinkage time
elongation period [s]: time between MT minima and maxima
shrinkage period [s]: time between MT maxima and minima
growth:shrinkage rate: growth rate/shrinkage rate
164

mean MT [µM]: mean MT-concentration over total simulation time
catastrophe frequency [s-1]: No. catastrophe events/total elongation time
rescue frequency [s-1]: No. rescue events/total shrinkage time
CC [µM]: free Tu-GTP concentration at the switch between catastrophes and
rescues (Figure 8.3a).
Figure 8.2. The simulations show the relationships between MT-dynamic instability
parameters, termed ‘Dynamicity’: (a) shows slow growth followed by rapid shrinkage; (b)
shows the relationship between catastrophe and rescue frequencies (defined above). Total
elongation and shrinkage times for the number of maxima, or minima are calculated by
summing all the ‘arrows’.
165

Table 8.7. Computational model outputs (absolute values) for MT-dynamicity parameters
and steady-state protein concentrations from simulated SCFA-treatments.
SCFA (drug) U B P V antagonistic
(P+V vs. B)
odd-chain
(P+V)
additive
(B+P&V)
SCFA coefficient 1.00 1.37 2.15 2.80 1.37 1.94 2.52
Tubb (MAP) [µM] 1.05 1.18 1.33 1.41 1.18 1.30 1.38
growth:shrinkage rate 0.232 0.171 0.242 1.273 0.171 0.359 0.883
catastrophe frequency [s-1]
0.030 0.024 0.027 0.068 0.024 0.026 0.063
rescue frequency [s-1]
0.128 0.143 0.116 0.065 0.143 0.072 0.071
mean elongation period [s]
33.6 41.0 36.8 14.7 41.0 38.5 16.0
mean shrinkage period [s]
7.8 7.0 8.6 15.5 7.0 13.8 14.1
mean MT [µM] 0.013 0.012 0.010 0.010 0.012 0.012 0.010
CC [Tu-GTP] [µM] 0.067 0.046 0.247 0.338 0.046 0.083 0.330U, untreated; B, butyrate; P, propionate; V, valerate
8.5. Computational dynamical modelling: Results
The concentration-rate plots ([μM/(l*s)] vs. time [s]) describe the inter-relationship
between MT fibres and β-tubulin subunits through polymerisation, hydrolysis and re-
phosphorylation (Figure 8.3a). Because conservation of moiety was maintained, a
decrease in free Tu-GTP subunit concentration was accompanied by an increase in
MT concentration, reflecting Tu-GTP subunit assembly on to the MT-fibres.
Conversely, a decrease in MT concentration reflected dissociation of hydrolysed Tu-
GDP subunits, which re-phosphorylated to Tu-GTP subunits once back in solution.
With increasing destabilisation (from untreated to valerate treated cells) the critical
Tu-GTP concentration (CC) at which catastrophe switches to rescue increased as
166

the catastrophe frequency increased and MT concentration decreased [69]. As
growth-rates increased, a shorter elongation period was required to reach a set MT-
concentration. Similarly, a decrease in shrinkage-rates resulted in longer shrinkage
periods. Consequently the growth:shrinkage ratio increased. As the number of
oscillations increased and total elongation period decreased, the catastrophe
frequency increased. Conversely a decrease in the total shrinkage period caused a
reduction of the rescue frequency.
The elongation and shrinkage periods of the simulations were found to be
comparable to the reported periodicity of dynamic instability recorded in vitro in
which MTs were observed to grow for approximately 80 s and then rapidly dissociate
[64]. In this model, elongation periods were of the order of 35 s in untreated cells with
shrinkage rates of 10 s. (Table 8.6).
The computational output data for each simulated SCFA-treatment is given in Table
8.7.
167
a)
b)
c)
Figure 8.3. (a) The inter-relationship between MT fibres and their β-tubulin subunits (Tu-
GTP) through association and dissociation. CC is the free Tu-GTP concentration at the point
where catastrophe switches to rescue, and vice versa. (b) The relationship between MT-
concentration and gowth:shrinkage rates, shows the shift from long-growth/rapid-shrinkage
periods to shorter-growth/longer-shrinkage periods with increasing perturbation by Tubb; (c)
The relationship between catastrophe and rescue frequencies and elongation and shrinkage
periods shows a greater number of catastrophes (maxima) with increasing Tubb
perturbation, and concurrent suppression of MT dynamicity. [Tubb is the weighted
concentration of β-tubulin isotypes (Table 8.5)].
168

The parameter scan of simulated Tubb synthesis (Figure 8.4a) covers the range of
input SCFA activation coefficients (1–2.80) which represent the experimental SCFA
IC50 (G2/M) treatment concentrations (4 mM, 11 mM, and 9 mM for butyrate,
propionate and valerate, respectively). The resulting steady-state concentrations
(Figure 8.4b) for Tubb were parameter-matched to the fold-changes of differentially
expressed β-tubulin isotypes from the multi-plex iTRAQ experiment.
a) Computational parameter scan of Tubb*
synthesis
b) Fold-change values for Tubb* in silico
after parameter matching to the multi-plex
iTRAQ fold-changes for β-tubulin isotypes
relative to untreated samples.
Figure 8.4. The in silico Tubb concentrations were matched to fold-change data of
differentially expressed β-tubulin isotypes from the multi-plex iTRAQ experiment by manual
adjustment of in silico SCFA activation-coefficients: (a) Temporal simulations of Tubb
synthesis for each SCFA-treatment. (b) A histogram of the steady-state in silico values of
Tubb after parameter matching to the multi-plex iTRAQ data. The consequences to
downstream MT-dynamic instability were then evaluated (Table 8.7). [* Tubb is the weighted
concentration of β-tubulin isotypes (Table 8.5); B, butyrate; P, propionate; V, valerate].
Tubb expression levels were dependent on SCFA type and concentration. Following
the simulated introduction of SCFA, the steady-state Tubb values increased from
their untreated value to their treated values, reflecting an increase in synthesis rates,
and MT-dynamic instability was concurrently suppressed. This is shown by the
169

series of simulations in Figure 8.5. This starts with the untreated simulation, then
steps through simulated treatments for butyrate, propionate and valerate, and each
hypothesised physiological SCFA combination (antagonistic, odd-chain and
additive), based on predicted Tubb concentrations. The simulations display
continuous oscillations for untreated, butyrate, physiological-odd-chain and
physiological-antagonistic treatments, indicating that these treatments allow MT-
dynamic instability to proceed correctly. In contrast, simulations for propionate,
valerate and physiologically-additive treatments display increasing dampening of the
MT-dynamic oscillations, with a concurrent reduction in MT concentration. This
indicates that propionate and valerate act as anti-mitotic agents at these treatment
concentrations. In addition, the physiological simulations indicate that for MT-
dynamic instability to proceed correctly, butyrate either plays no part or acts in
competition to propionate and valerate in this mitotic pathway. When butyrate
combines with propionate and valerate in the additive scenario, MT-dynamics
collapse.
170

Key: ant = antagonistic (even-chain [B] vs. odd-chain [P & V]); odd = odd-chain [P & V];
add = additive [B, P & V together].
Figure 8.5. The dynamical simulations show the suppression of MT-dynamics as a
consequence of SCFA (drug) treatments. Each simulation represents a different level of
SCFA input. The top arrow (left to right) indicates increasing Tubb concentrations and
perturbation as a consequence of SCFA-induced TF acetylation. Simulations for butyrate,
propionate and valerate at treatment concentrations, and SCFA combinations at
physiological antagonistic, odd-chain only and additive concentrations, are indicated. These
show a dampening of MT-dynamic instability with concurrent loss of MT-fibre concentration
as perturbation due to SCFA treatments increases. Evaluation of the plot data shows an
increase in MT-shrinkage time, decrease in MT-elongation time, increase in catastrophe
frequency, decrease in rescue frequency and increase in growth:shrinkage rates (Table 8.7).
This is consistent with in-vitro evidence for MT-destabilisation treatments.1 The plot gives MT
concentration [μM] vs. time [s]; the simulation time of 250–500 s was selected to ensure
Tubb had reached steady-state prior to evaluation of MT dynamicity; the axis provides a
constant frame of reference.
Computational model predictions of mean MT-concentration with simulated SCFA
IC50 (G2/M) treatments were compared to HCA MT fibre integrity data and time-
course flow-cytometry cell cycle data (Figure 8.6). The three plots displayed similar
profiles: the reduction of in silico MT-concentration reflects suppression of MT-
dynamic instability; the HCA results show loss of MT-fibre integrity; and the shift from
GI to G2/M (ratio of G1:G2/M) reflects increasing mitotic arrest. These clearly similar
171

profiles between in silico and in vitro results support the modelled metabolic pathway
and thereby the plausibility of the hypothesis. The exception was with the butyrate
simulations. Whereas the model predicted little, or no, involvement by butyrate in the
modelled anti-mitotic pathway, the experimental evidence showed that butyrate
induced significant loss of MT-fibre integrity and G2/M cell cycle arrest. This
discrepancy was because the computational model simulated a single metabolic
pathway; whereas the results from the HCA and flow-cytometry experiments were
the consequence of multiple pathways involved in cytoskeletal breakdown and G1-
G2 cell cycle arrest [100, 105]. These will include apoptotic pathways known to be
associated with butyrate [106], which also lead to cellular and cytoskeletal breakdown
[100].
a) in silico: mean MT
concentration over
simulated time.
b) in vitro (HCA): MT-
fibre integrity at SCFA
IC50 concentrations.
c) in vitro (flow cytometry); shift from G1
to G2 phase (G1:G2-M) with increasing
SCFA treatment times.
Figure 8.6. The histograms represent the comparisons between in silico computational
model predictions and experimental in vitro observations by HCA and flow-cytometry. In
order to equate computational model outputs with experimental data, common factors had to
be identified: model simulations showed that suppression of dynamic instability was
accompanied by a decline in mean MT-concentration (Figure 8.5); HCA data showed that a
loss of MT integrity indicated MT-fibre dissociation and consequently a decrease in MT
concentration; the time-response flow-cytometry data showed an increase in mitotic arrest,
measured as a reduction in G1:G2-M ratio, with increasing treatment times and SCFA
potency. The histograms all show a similar profile, validating the model and supporting the
hypothesis. All the plots are relative to untreated controls.
172

The hypothesised pathway proposed that odd-chain SCFAs, propionate and
valerate, destabilise MT dynamics and disrupt MT structural integrity. This was
based on HCA experimental evidence. To test this assumption model predictions
were compared to published quantitative experimental data on MT-dynamicity
parameters following stabilising or destabilising treatments [132]. The histograms
(Figure 8.7) compare in silico outputs to (a) in vitro MT-destabilising treatments and
(b) MT-stabilising treatments [132]. Each bar shows the % fold-change of a parameter
relative to untreated cells. These were plotted as log2 for clarity. There was a clear
similarity in behaviour between simulated valerate treatments and destabilising
treatments, and opposing behaviour in comparison to MT-stabilising treatments. This
positively supported the hypothesis that the odd-chain SCFAs, propionate and
valerate, were MT destabilising agents. (The data is presented in Table 8.8).
173

a) MT-Destabilising Comparisons b) MT-Stabilising Comparisons
key
in vitro: destabilising / Stabilising treatments (PtK2)
cat [s-1]: catastrophe frequency
res [s-1]: rescue frequency
elong [s]: elongation period
shrink [s]: shrinkage period
G:S rate: ratio of growth rate to shrinkage rate
Figure 8.7. The histograms compare MT-dynamicity parameters between in silico simulated
treatments of HCT116 cells (colon cancer epithelial cell line) and in vitro experimental
destabilising (a) and stabilising (b) treatments of PkT2 cells (renal epithelial cell lines) [132].
The results show a close correlation between valerate treatment and in vitro MT-
destabilising treatment, with both displaying the same fold-change pattern relative to their
respective untreated controls. In contrast, comparisons with in vitro MT-stabilising treatments
show opposing effects. These results clearly demonstrate that valerate acts in the same
manner as MT-destabilisers. [Log2 plots are used for clarity; data is presented in Table 8.8].
174

Table 8.8. MT-dynamicity comparisons between in vitro treated cells (destabilisation and
stabilisation) and computational model outputs from simulated SCFA treatments (% fold-
change data relative to untreated controls) [132]. These data are shown graphically in Figure
8.7.
SCFA (drug)in vitro
destabilisation
B P V in vitro
stabilisation
growth:shrinkage rate 211% 74% 104% 549% 64%
catastrophe frequency[s-1]
492% 82% 91% 228% 48%
rescue frequency[s-1]
74% 112% 91% 51% 186%
mean elongation period[s]
66% 122% 109% 44% 165%
mean shrinkage period[s]
500% 89% 110% 198% 38%
Table 8.9. Physiological comparisons between MT-dynamicity parameters for simulated in
silico physiological SCFA combinations (antagonistic; odd-chain; additive) against in vitro
data from normal, untreated cells [% fold changes relative to untreated controls]. The closest
comparisons (starred bold/italics) suggest that SCFA physiological behaviour is most
probably antagonistic. These data are shown graphically in Figure 8.8.
SCFA (drug)in vitro
normal, untreated
antagonistic
(P&V vs. B)
odd-chain
(P&V)
additive
(B&P&V)
growth:shrinkage rate92% * 74% * 55% 420%
catastrophe frequency[s-1] 108% * 83% * 68% 216%
rescue frequency[s-1] 125% * 113% 120% * 56%
mean elongation period[s] 127% * 122% * 152% 48%
mean shrinkage period[s] 124% * 89% * 84% 180%
175

Of interest is how SCFAs behave under physiological conditions to ensure MTs
function correctly. To replicate possible physiological SCFA combinations in silico,
the SCFA-activation coefficient for each of the following scenarios had to be
calculated, as described in the conversion section above: additive (propionate,
valerate and butyrate acting together); odd-chain only (propionate and valerate); or
antagonistic (butyrate opposing propionate and valerate). The in silico output data for
MT-dynamicity parameters were compared to published in vitro data for non-
tumoural untreated cells under physiological conditions (PtK2 epithelial cells were
again used for these in vitro comparisons [132]). The results are shown as a histogram
(Figure 8.8). Although they are less conclusive than the treated comparisons (Figure
8.7), they do give an indication of the most probable behaviour of SCFAs in HCT116
cells bathed in SCFAs under colonic physiological conditions. The closest similarity
was observed with antagonistic simulations and some similarity was observed with
the odd-chain-only predictions. In contrast, the additive predictions were clearly
different from experimental observations. These findings suggest that butyrate either
behaves competitively or is not involved in this mitotic pathway. Competitive actions
between butyrate and valerate have been reported for other mechanisms [25]. These
findings suggest possible new directions for future investigations.
176

key
in vitro:Normal, untreated cells
antagonistic: even vs. odd-chain SCFAs (B vs. P & V)
odd: odd-chain SCFAs (P & V)
additive: B, P & V acting together
cat [s-1]: catastrophe frequency
res [s-1]: rescue frequency
elong [s]: elongation period
shrink [s]: shrinkage period
G:S rate: ratio of growth rate to shrinkage rate
[B, butyrate; P, propionate; V, valerate]
Figure 8.8. The histogram gives in silico predictions of MT-dynamicity parameters for three
possible physiological SCFA combinations: antagonistic (B acting against P & V); odd-chain
only (P & V acting distinctly from B); and additive (P, V & B acting together). These are
compared with reported in vitro physiological metabolic behaviour based on observations
from normal untreated epithelial cells [132]. Percentage fold-changes relative to control cells
are given. Although the pattern matches are less conclusive than the previous comparisons
for treated cells (Figure 8.7), the in silico predictions of SCFA-antagonistic behaviour shows
the closest similarity to in vitro physiological cells (Table 8.9). These findings provide an
indication of how SCFAs may behave in this mitotic pathway under physiological conditions.
An additional test of the model’s robustness and possible versatility was performed
to establish whether it could replicate the opposing mechanism, i.e. MT-stabilisation,
by inhibiting MT-dissociation instead of inducing it. This was simulated by adjusting
the SCFA-activation coefficients to downregulate Tubb synthesis. The simulations
177

showed that MT elongation (growth) periods were extended and shrinkage periods
were shortened. This was the converse of MT-destabilising simulations (Figure 8.7).
This test not only strengthened the validity of the computational model, it also
demonstrated the model’s potential for simulating similar or related biological
processes. For example, the model could be adapted to simulate stabilising anti-
mitotic treatments, such as paclitaxels. (The full results and figures for this simulation
are not included in this project).
8.6. Discussion and Future Directions
The computational dynamical model, in combination with the experimental and
bioinformatic data, has demonstrated the plausibility of the hypothesis which
proposed that the odd-chain SCFAs may act as anti-mitotic agents. In silico
simulations of the hypothesised pathway demonstrated that at treatment
concentrations, valerate, and to a lesser extent propionate, suppress MT-dynamic
instability by promoting downstream epigenetic acetylation of transcriptional
regulators, thereby differentially expressing β-tubulin isoforms to perturb the tubulin
code and alter the cycle of dynamic instability. Dynamic instability is central to MT
functionality, therefore disrupting it can lead to failure to perform critical cellular
functions, such as mitosis.
Furthermore, the model predicted that under physiological conditions only the odd-
chain SCFAs are required to ensure MT-dynamic instability proceeds correctly.
Butyrate either plays no role in this pathway or has actions that modulate the net
effect by competing antagonistically against propionate and valerate.
178

The model predictions are consistent with experimental data from both this project
and those reported in the literature [132], supporting the proposition that SCFAs at
above-physiological concentrations act as MT-destabilising agents by promoting
dissociation of the MT-fibre. This has consequences that could be exploited for
cancer therapeutics. Established AMDs act by overstabilising or destabilising MT-
dynamic instability, suppression of MT-dynamic instability by anti-mitotic agents has
also been shown to re-activate the mitotic checkpoint [103], preventing cells from
exiting mitosis, halting proliferation and inducing cell death. However, many of these
established treatments are associated with toxicity and drug resistance. Therefore,
identifying new treatments that will be tolerated by colonocytes is an attractive option
for CRC therapeutics.
Although this model only reflects a small element of SCFA actions in colon cancer
cells, in combination with the quantitative experimental data it has demonstrated the
plausibility of a novel SCFA-driven anti-mitotic pathway in HCT116 colon cancer
cells that is unique to the odd-chain SCFAs, propionate and valerate, offering new
directions for further investigations.
179

9. Project Conclusion
9.1. Hypotheses formulation
This research project adopted a Systems Biology approach, combining state-of-the-
art high-throughput proteomic and cellomic experimentation with computational
dynamical modelling, supported by the wealth of information openly available in
proteomic and genomic knowledgebases. The aim was to explore and validate the
plausibility a novel hypothesis that SCFAs, which are essential components of the
human diet, play distinct metabolic roles in colon epithelia by virtue of their carbon
chain lengths. These may include chemoprotective actions, however the
mechanisms are not yet fully established.
9.1.1. The hypothesis
“At above-physiological concentrations, the odd-chain SCFAs, propionate and
valerate, promote downstream epigenetic acetylation at specific β-tubulin
transcriptional binding sites in HCT116 colon cancer cells, thereby altering the
expression profile of β-tubulin isotypes. This in turn creates an aberrant
tubulin code which perturbs microtubule dynamic instability and prevents
microtubules from correctly performing their cellular functions, eventually
leading to mitotic arrest and cell death.”
180

9.1.2. Experimental and bioinformatic contributions
Each element of this research project, proteomic, cellomic, bioinformatic pathway
analyses and computational modelling, contributed crucial evidence to support this
hypothesis:
1. Multi-plex iTRAQ showed that both propionate and valerate, the odd-chain
SCFAs, upregulated β2c-tubulin and β3-tubulin isotypes and downregulated β1-
tubulin in HCT116 colon cancer cells in vitro. Valerate had the greatest effect,
whereas butyrate, the even-chain SCFA, had no significant effect.
2. High Content Analysis (HCA) showed that valerate achieved the same efficacy as
butyrate in promoting loss of MT cytoskeletal integrity, despite being reported to
have a minor role in the other apoptotic pathways induced by butyrate [100]. This
suggested that valerate might act through an alternative, anti-mitotic pathway.
Propionate displayed roles in both pathways, but to a lesser extent.
3. HCA cell cycle analyses displayed a unique biphasic response in cell cycle
progression induced by propionate and valerate. An increase in G2/M (mitotic)
arrest was reversed in favour of G1 arrest at low treatment concentrations [4]. The
effect was not dose-dependent and was masked by the G2/M effect at higher
SCFA concentrations. This is characteristic of mitotic slippage [102], suggesting it
may be phenotype dependant. Flow cytometry supported this interpretation by
displaying a minor time-dependant biphasic response. This was only apparent at
longer treatment times when the phenotypes with a greater capacity for survival
would contribute a larger proportion of the remaining cells.
4. Flow cytometry showed characteristic cell cycle behaviours that suggested
butyrate primarily induced G1 arrest (characteristic of apoptotic pathways) [100],
181

valerate primarily induced G2/M arrest (characteristic of mitotic pathways) and
propionate had roles in both pathways. Although the flow cytometry results were
not significantly conclusive, they did support the other experimental observations.
5. Extensive bioinformatic searches contributed, supported and validated the
experimental observations and hypothesis generation. These searches provided
evidence that downstream epigenetic acetylation at β2c-tubulin, β3-tubulin and
β1-tubulin transcriptional sites promoted differential regulation of these isotypes
via acetylation of transcriptional regulators and subsequent chromatin
remodelling.
6. Pathway expression analysis identified the unique pathways targeted by each
SCFA based on the experimental evidence. These indicating that butyrate was
solely involved in G1-mitotic events via non-tubulin proteins, valerate was solely
involved in G2-mitotic events via β2c-tubulin and β-tubulin, and propionate
displayed roles in common with both.
7. Western blotting and the use of biological replicates provided orthogonal
confirmation and quality control of the experimental techniques.
9.1.3. Impact of computational dynamical modelling
A central part of this research project was to design a computational dynamical
model to replicate the hypothesised pathway so that temporal simulations could be
performed in silico. By matching the simulated outputs to in vitro experimental
observations, the plausibility of the hypothesis could be validated. Furthermore, by
making experimentally testable predications, the model provided valuable insights
into the underlying mechanisms and behaviour of SCFAs in colonocytes, both at
182

treatment concentrations and under physiological conditions. In addition, these
predictions offered directions for further investigations.
9.2. Project conclusions and contributions to science and medicine
The findings of this research project have conclusively established that the odd-chain
SCFAs, propionate and valerate, have unique metabolic actions distinct from
butyrate, the even-chain SCFA. Based on initial proteomic evidence, a potential anti-
mitotic pathway was identified and explored through further state-of-the-art
experimentation. Bioinformatic searches and computational dynamical modelling
supported the plausibility of this proposed pathway.
The pathway described a process in which downstream epigenetic acetylation of
transcriptional regulators at specific β-tubulin binding sites was induced by the odd-
chain SCFAs. This resulted transcriptional activation, via chromatin remodelling, and
differential regulation of β2c-tubulin, β3-tubulin and β1-tubulin isotypes, which are
reported to be pro-tumourigenic in colon epithelia [10, 55, 56]. By altering the balance and
arrangement of β-tubulin isotypes in MT fibres, this action would create an aberrant
tubulin code [47], leading to loss of MT structural integrity and failure of critical MT
cellular functions, including mitosis, resulting in G2/M mitotic arrest and eventual cell
death. In contrast, butyrate, which is known to be a potent antagonist of colon cancer
cells via anti-apoptotic pathways [100, 105], showed no significant role in this mitotic
pathway.
In addition, model predictions suggested that the odd-chain SCFAs were uniquely
involved in the correct functioning of this mitotic pathway at physiological
concentrations.
183
The experimental evidence indicated that at above physiological concentrations,
valerate, which is a minor player in the apoptotic pathways induced by butyrate [3],
was the dominant effector in this anti-mitotic pathway in HCT116 colon cancer cells.
The differential expression of β2c-tubulin, β3-tubulin, and β1-tubulin, in HCT116 cells
following SCFA treatments opposed the expression pattern of these three β-tubulin
isotypes in untreated HCT116 colon cancer cells relative to normal cells. This
suggested that propionate and valerate could effectively counter these potential
tumour adaptations.
Established anti-microtubule drugs (AMD), such as the paclitaxels or vinca alkaloids,
are among the most successful chemotherapies to date. In general AMDs act by
over-stabilising or destabilising MT dynamics, however their toxicity and drug
resistance increases with successive rounds of treatment [146]. There is increasing
interest in identifying anti-mitotic agents that act via alternative pathways, such as
differential regulation of MT β-tubulin subunits [41] and perturbation of the tubulin code
[147]. The findings of this project suggest that propionate and valerate could act prior
to, or in combination with AMDs, allowing them to be administered at suboptimal
doses to reduce their negative effects, while enhancing their efficacy. SCFAs are
natural dietary compounds, not only tolerated by normal colon epithelia but central to
their metabolism and human health. As such, propionate and valerate may serve as
novel chemotherapeutics in colorectal cancer.
184

Bibliography
1. Siavoshian, S., et al., Comparison of the effect of different short chain fatty acids on
the growth and differentiation of human colonic carcinoma cell lines in vitro. Cell Biol
Int, 1997. 21(5): p. 281-7.
2. Augenlicht, L.H., et al., Short chain fatty acids and colon cancer. Journal of Nutrition,
2002. 132(12): p. 3804S-3808S.
3. Hinnebusch, B.F., et al., The effects of short-chain fatty acids on human colon cancer
cell phenotype are associated with histone hyperacetylation. J Nutr, 2002. 132(5): p.
1012-17.
4. Kilner, J., Cellular Response of epithelial cancer cells of the colon to the short-chain
fatty acids; Butyrate, Propionate & Valerate – using proteomic approaches, in
Department of Oncology, 2009, The University of Sheffield: Sheffield.
5. Westerhoff, H.V., et al., Systems biology towards life in silico: mathematics of the
control of living cells. J Math Biol, 2009. 58(1-2): p.7-34.
6. Sauer, U., M. Heinemann, and N. Zamboni, Genetics - Getting closer to the whole
picture. Science, 2007. 316(5824): p. 550-551.
7. CancerResearchUK. Cancer Research UK: CancerStats Key Facts. 2013; Available
from: http://www.cancerresearchuk.org.
8. Alberts, B., et al., eds. Molecular biology of the cell 2002, Garland Science: New
York.
9. Wild, J., Micrograph of colon epithelia, 2012.
10. Creamer, B., Turnover of epithelium of small intestine. British Medical Bulletin, 1967.
23(3): p. 226-230.
11. Integrative-Biology, Colorectal Carcinogenesis. 2013.
12. Lenoir-Wijnkoop, I. and M. Hopkis, eds. The Intestinal Microflora. Understanding the
Symbiosis. Lenoir-Vijnkoop 2003, John Libbey Eurotext.
13. Corfe, B.M., et al., A study protocol to investigate the relationship between dietary
fibre intake and fermentation, colon cell turnover, global protein acetylation and early
carcinogenesis: the FACT study. BMC Cancer, 2009. 9: p. 332-338.
14. Baumgart, D.C. and S.R. Carding, Gastroenterology 1 - Inflammatory bowel disease:
cause and immunobiology. Lancet, 2007. 369(9573): p. 1627-1640.
15. Roediger, W.E.W., Utilization of Nutrients by Isolated Epithelial-cells of the Rat
Colon. Gastroenterology, 1982. 83(2): p. 424-429.
185

16. Cummings, J.H., et al., Digestion and physiological properties of resistant starch in
the human large bowel. British Journal of Nutrition, 1996. 75(5): p. 733-747.
17. Topping, D.L. and P.M. Clifton, Short-chain fatty acids and human colonic function:
roles of resistant starch and nonstarch polysaccharides. Physiol Rev, 2001. 81(3): p.
1031-64.
18. Kiefer, J., G. Beyer-Sehlmeyer, and B.L. Pool-Zobel, Mixtures of SCFA, composed
according to physiologically available concentrations in the gut lumen, modulate
histone acetylation in human HT29 colon cancer cells. British Journal of Nutrition,
2006. 96(5): p. 803-810.
19. Graz, C.J.M. and H.M. Cowley, Energy state in HT-29 cells is linked to differentiation.
In Vitro Cellular & Developmental Biology-Animal, 1997. 33(4): p. 277-281.
20. Wong, J.M.W., et al., Colonic health: Fermentation and short chain fatty acids.
Journal of Clinical Gastroenterology, 2006. 40(3): p. 235-243.
21. Vogt, J.A. and T.M.S. Wolever, Fecal acetate is inversely related to acetate
absorption from the human rectum and distal colon. Journal of Nutrition, 2003.
133(10): p. 3145-3148.
22. Lupton, J.R., Microbial degradation products influence colon cancer risk: the butyrate
controversy. Journal of Nutrition, 2004. 134(2): p. 479-482.
23. Emenaker, N.J., Short chain fatty acids inhibit extravasation of invasive and
metastatic human colon cancer cells. Faseb Journal, 2001. 15(5): p. A1079-A1079.
24. Hijova, E. and A. Chmelarova, Short chain fatty acids and colonic health. Bratislava
Medical Journal-Bratislavske Lekarske Listy, 2007. 108(8): p. 354-358.
25. Kristensen, N.B. and D.L. Harmon, Effects of adding valerate, caproate, and
heptanoate to ruminal buffers on splanchnic metabolism in steers under washed-
rumen conditions. Journal of Animal Science, 2005. 83(8): p. 1899-1907.
26. Sunkara, L.T., W. Jiang, and G. Zhang, Modulation of Antimicrobial Host Defense
Peptide Gene Expression by Free Fatty Acids. PLoS One, 2012. 7(11).
27. Durham, B., Novel histone deacetylase (HDAC) inhibitors with improved selectivity
for HDAC2 and 3 protect against neural cell death. Bioscience Horizons, 2012. 5.
28. Bolden, J.E., M.J. Peart, and R.W. Johnstone, Anticancer activities of histone
deacetylase inhibitors. Nature Reviews Drug Discovery, 2006. 5(9): p. 769-784.
29. Drake, P.J., et al., Application of high-content analysis to the study of post-
translational modifications of the cytoskeleton. J Proteome Res, 2009. 8(1): p. 28-34.
30. Khan, A.Q., et al., Application of high content biology demonstrates differential
responses of keratin acetylation sites to short chain fatty acids and to mitosis. Journal
of Integrated Omics, 2011. submitted.
186

31. Leech, S.H., et al., Proteomic analyses of intermediate filaments reveals cytokeratin8
is highly acetylated--implications for colorectal epithelial homeostasis. Proteomics,
2008. 8(2): p. 279-88.
32. Witt, O., et al., HDAC family: What are the cancer relevant targets? Cancer Lett,
2009. 277(1): p. 8-21.
33. Scheppach, W., H.P. Bartram, and F. Richter, Role of short-chain fatty acids in the
prevention of colorectal cancer. Eur J Cancer, 1995. 31A(7-8): p. 1077-80.
34. Corfe, B.M., Hypothesis: butyrate is not an HDAC inhibitor, but a product inhibitor of
deacetylation. Mol. BioSyst, 2012. 8: p. 1609–1612.
35. Kanehisa, M., et al., KEGG for integration and interpretation of large-scale molecular
data sets. Nucleic Acids Research, 2012. 40(D1): p. D109-D114.
36. Hague, A., et al., Sodium butyrate induces apoptosis in human colonic tumour cell
lines in a p53-independent pathway: implications for the possible role of dietary fibre
in the prevention of large-bowel cancer. Int J Cancer, 1993. 55(3): p. 498-505.
37. Waby, J.S., C.D. Bingle, and B.M. Corfe, Post-translational control of sp-family
transcription factors. Curr Genomics, 2008. 9(5): p. 301-11.
38. Chen, J.S., D.V. Faller, and R.A. Spanjaard, Short-Chain Fatty Acid Inhibitors of
Histone Deacetylases: Promising Anticancer Therapeutics? , in Current Cancer Drug
Targets2003, Bentham Science Publishers. p. 219-236.
39. Smith, K.T. and J.L. Workman, Histone deacetylase inhibitors: Anticancer
compounds. International Journal of Biochemistry & Cell Biology, 2009. 41(1): p. 21-
25.
40. Kim, O.H., et al., Influence of p53 and p21(Waf1) expression on G2/M phase arrest
of colorectal carcinoma HCT116 cells to proteasome inhibitors. International Journal
of Oncology, 2004. 24(4): p. 935-941.
41. Jordan, M.A. and L. Wilson, Microtubules as a target for anticancer drugs. Nature
Reviews Cancer, 2004. 4(4): p. 253-265.
42. Fiskus, W., et al., Co-treatment with vorinostat synergistically enhances activity of
Aurora kinase inhibitor against human breast cancer cells. Breast cancer research
and treatment, 2012. 135(2): p. 433-44.
43. Schneider, B.J., et al., Phase I study of vorinostat (suberoylanilide hydroxamic acid,
NSC 701852) in combination with docetaxel in patients with advanced and relapsed
solid malignancies. Investigational New Drugs, 2012. 30(1): p. 249-257.
44. Verdier-Pinard, P., et al., Tubulin proteomics: towards breaking the code. Anal
Biochem, 2009. 384(2): p. 197-206.
45. Luduena, R.F., Are tubulin isotypes functionally significant. Mol Biol Cell, 1993. 4(5):
p. 445-57.
187

46. Janke, C. and J.C. Bulinski, Post-translational regulation of the microtubule
cytoskeleton: mechanisms and functions. Nature Reviews Molecular Cell Biology,
2011. 12(12): p. 773-786.
47. Verhey, K.J. and J. Gaertig, The tubulin code. Cell Cycle, 2007. 6(17): p. 2152-60.
48. Bhattacharya, R., H. Yang, and F. Cabral, Class V beta-tubulin alters dynamic
instability and stimulates microtubule detachment from centrosomes. Molecular
Biology of the Cell, 2011. 22(7): p. 1025-1034.
49. Caplow, M. and J. Shanks, Induction of microtubule catastrophe by formation of
tubulin - gdp and apotubulin subunits at microtubule ends. Biochemistry, 1995.
34(48): p. 15732-15741.
50. Ohishi, Y., et al., Expression of beta-tubulin isotypes in human primary ovarian
carcinoma. Gynecologic Oncology, 2007. 105(3): p. 586-592.
51. Leandro-Garcia, L.J., et al., Tumoral and Tissue-Specific Expression of the Major
Human beta-Tubulin Isotypes. Cytoskeleton, 2010. 67(4): p. 214-223.
52. Gene-Expression-Atlas, G., Gene Expression Atlas, in EMBL-EBI 2012.
53. Kavallaris, M., Microtubules and resistance to tubulin-binding agents. Nature
Reviews Cancer, 2010. 10(3): p. 194-204.
54. Izutsu, N., et al., Epigenetic modification is involved in aberrant expression of class III
beta-tubulin, TUBB3, in ovarian cancer cells. International Journal of Oncology, 2008.
32(6): p. 1227-1235.
55. Jirasek, T., et al., Expression of class III beta-tubulin in colorectal carcinomas: an
immunohistochemical study using TU-20 & TuJ-1 antibody. Indian Journal of Medical
Research, 2009. 129(1): p. 89-94.
56. Magnani, M., et al., The beta I/beta III-tubulin isoforms and their complexes with
antimitotic agents. Febs Journal, 2006. 273(14): p. 3301-3310.
57. Katsetos, C.D., P. Draber, and M. Kavallaris, Targeting beta III-Tubulin in
Glioblastoma Multiforme: From Cell Biology and Histopathology to Cancer
Therapeutics. Anti-Cancer Agents in Medicinal Chemistry, 2011. 11(8): p. 719-728.
58. Mariani, M., et al., Class III beta-Tubulin (TUBB3): More than a Biomarker in Solid
Tumors? Current Molecular Medicine, 2011. 11(9): p. 726-731.
59. He, Z.-Y., et al., Up-regulation of hnRNP A1, Ezrin, tubulin beta-2C and Annexin A1
in sentinel lymph nodes of colorectal cancer. World Journal of Gastroenterology,
2010. 16(37): p. 4670-4676.
60. Cassimeris, L., Accessory protein regulation of microtubule dynamics throughout the
cell cycle. Current Opinion in Cell Biology, 1999. 11(1): p. 134-141.
61. Sullivan, K.F., Structure and utilization of tubulin isotypes. Annual Review of Cell
Biology, 1988. 4: p. 687-716.
188

62. Desai, A. and T.J. Mitchison, Microtubule polymerization dynamics. Annual Review of
Cell and Developmental Biology, 1997. 13: p. 83-117.
63. Nogales, E., Structural insights into microtubule function. Annu Rev Biochem, 2000.
69: p. 277-302.
64. Walker, R.A., et al., Dynamic instability of individual microtubules analyzed by video
light-microscopy - rate constants and transition frequencies. Journal of Cell Biology,
1988. 107(4): p. 1437-1448.
65. Mitchison, T. and M. Kirschner, Dynamic instability of microtubule growth. Nature,
1984. 312(5991): p. 237-242.
66. Nogales, E., Structural insights into microtubule function. Annual Review of
Biochemistry, 2000. 69: p. 277-302.
67. Caydasi, A.K., et al., A dynamical model of the spindle position checkpoint. Molecular
Systems Biology, 2012. 8: 582.
68. Gregoretti, I.V., et al., Insights into cytoskeletal behavior from computational
modeling of dynamic microtubules in a cell-like environment. J Cell Sci, 2006. 119(Pt
22): p. 4781-8.
69. Drechsel, D.N., et al., Modulation of the dynamic instability of tubulin assembly by the
microtubule-associated protein tau. Molecular Biology of the Cell, 1992. 3(10): p.
1141-1154.
70. Martin, S.R., M.J. Schilstra, and P.M. Bayley, Dynamic Instability of Microtubules -
Monte-Carlo Simulation and Application to Different Types of Microtubule Lattice.
Biophysical Journal, 1993. 65(2): p. 578-596.
71. Bayley, P.M., M.J. Schilstra, and S.R. Martin, Microtubule dynamic instability -
numerical-simulation of microtubule transition properties using a lateral cap model.
Journal of Cell Science, 1990. 95: p. 33-48.
72. Mechulam, A., et al., Polyamine Sharing between Tubulin Dimers Favours
Microtubule Nucleation and Elongation via Facilitated Diffusion. PLos Computational
Biology, 2009. 5(1).
73. Tropini, C., et al., Islands Containing Slowly Hydrolyzable GTP Analogs Promote
Microtubule Rescues. PLoS One, 2012. 7(1).
74. Noble, D., The Music of Life:Biology beyond the Genome2006: OUP Oxford.
75. Kell, D.B. and S.G. Oliver, Here is the evidence, now what is the hypothesis? The
complementary roles of inductive and hypothesis-driven science in the post-genomic
era. Bioessays, 2004. 26(1): p. 99-105.
76. Kreeger, P.K. and D.A. Lauffenburger, Cancer systems biology: a network modeling
perspective. Carcinogenesis, 2010. 31(1): p. 2-8.
189

77. Gentles, A.J. and D. Gallahan, Systems Biology: Confronting the Complexity of
Cancer. Cancer Research, 2011. 71(18): p. 5961-5964.
78. Smallbone, K., et al., Metabolic changes during carcinogenesis: Potential impact on
invasiveness. Journal of Theoretical Biology, 2007. 244(4): p. 703-713.
79. Smallbone, K., et al., Towards a genome-scale kinetic model of cellular metabolism.
BMC Systems Biology, 2010. 4.
81. Wellcome-Trust. Sanger Institute. Sanger Institute 2010; Available from:
http://www.sanger.ac.uk.
82. Gazdar, A.F., B. Gao, and J.D. Minna, Lung cancer cell lines: Useless artifacts or
invaluable tools for medical science? Lung Cancer, 2010. 68(3): p. 309-318.
83. Brattain, M.G., et al., Heterogeneity of malignant-cells from a human colonic-
carcinoma. Cancer Research, 1981. 41(5): p. 1751-1756.
84. Yeung, T.M., et al., Cancer stem cells from colorectal cancer-derived cell lines. Proc
Natl Acad Sci U S A, 2010. 107(8): p. 3722-3727.
85. Chowdry, J. and R.P. Benson, HCA fluorescent micrograph of cytoskeleton in
HCT116 colon cancer cells, 2010, Courtesy of Imagen Biotech Ltd.
86. Imagen-Biotech, High Content Analysis, in Manchester, UK 2010.
87. Aggarwal, K., L.H. Choe, and K.H. Lee, Shotgun proteomics using the iTRAQ
isobaric tags. Brief Funct Genomic Proteomic, 2006. 5(2): p. 112-20.
88. Ow, S.Y., et al., iTRAQ Underestimation in Simple and Complex Mixtures: "The
Good, the Bad and the Ugly". J Proteome Res, 2009. 8(11): p. 5347-5355.
89. Evans, C., et al., An insight into iTRAQ: where do we stand now? Analytical and
Bioanalytical Chemistry, 2012. 404(4): p. 1011-1027.
90. Kilner, J., et al., A proteomic analysis of differential cellular responses to the short-
chain fatty acids butyrate, valerate and propionate in colon epithelial cancer cells.
Molecular Biosystems, 2012. 8(4): p. 1146-1156.
91. UniProtKB, UniProt Knowledgebase, EBI, SIB, PIR, 2012.
92. NCBI, N.C.f.B.I., Protein database, 2009.
93. Noirel, J., et al., Methods in Quantitative Proteomics: Setting iTRAQ on the Right
Track. Current ProteomicsNoirel et al, Current Proteomics, Volume 8, Number 1,
April 2011 , pp. 17-30 2011. 8(1): p. 13.
94. Wei, C.M., J.N. Li, and R.E. Bumgarner, Sample size for detecting differentially
expressed genes in microarray experiments. BMC Genomics, 2004. 5: 87.
95. Gan, C.S., et al., Technical, experimental, and biological variations in isobaric tags
for relative and absolute quantitation (iTRAQ). J Proteome Res, 2007. 6: p. 821-827.
96. Gupta, N. and P.A. Pevzner, False Discovery Rates of Protein Identifications: A
Strike against the Two-Peptide Rule. J Proteome Res, 2009. 8(9): p. 4173-4181.
190

97. Kilner, J., et al., Assessing the Loss of Information through Application of the ‘Two-hit
Rule’ in iTRAQ Datasets. JIOMICS, 2011. 1: p. 124-134.
98. D'Ascenzo, M., L. Choe, and K.H. Lee, iTRAQPak: an R based analysis and
visualization package for 8-plex isobaric protein expression data. Brief Funct
Genomic Proteomic, 2008. 7(2): p. 127-135.
99. Reactome, REACTOME: a manually curated and peer-reviewed pathway database,
2010.
100. Heerdt, B.G., M.A. Houston, and L.H. Augenlicht, Short-chain fatty acid-initiated cell
cycle arrest and apoptosis of colonic epithelial cells is linked to mitochondrial
function. Cell Growth & Differentiation, 1997. 8(5): p. 523-532.
101. Ito, K., et al., Caffeine induces G(2)/M arrest and apoptosis via a novel p53-
dependent pathway in NB4 promyelocytic leukemia cells. Journal of Cellular
Physiology, 2003. 196(2): p. 276-283.
102. Vakifahmetoglu, H., M. Olsson, and B. Zhivotovsky, Death through a tragedy: mitotic
catastrophe. Cell Death and Differentiation, 2008. 15(7): p. 1153-1162.
103. Blajeski, A.L., et al., G(1) and G(2) cell-cycle arrest following microtubule
depolymerization in human breast cancer cells. Journal of Clinical Investigation,
2002. 110(1): p. 91-99.
104. Nolan, J.P. and L. Yang, The flow of cytometry into systems biology. Brief Funct
Genomic Proteomic, 2007. 6(2): p. 81-90.
105. Waby, J.S., et al., Sp1 acetylation is associated with loss of DNA binding at
promoters associated with cell cycle arrest and cell death in a colon cell line.
Molecular Cancer, 2010. 9: 275.
106. Milovic, V., et al., Effect of structural analogues of propionate and butyrate on colon
cancer cell growth. International Journal of Colorectal Disease, 2000. 15(5-6): p. 264-
270.
107. Institute, W.I.f.B.R.a.t.U.C. Cell Cycle Fundamentals: Flow Cytometry Cell Cycle
Data: Due Diligence. 2010; Available from:
http://www.icmb.utexas.edu/core/Microscopy/pdf/cell_cycle_fundamentals.pdf.
108. Jin, Z., D.T. Dicker, and W.S. El-Deiry, Enhanced sensitivity of G1 arrested human
cancer cells suggests a novel therapeutic strategy using a combination of simvastatin
and TRAIL. Cell cycle (Georgetown, Tex.), 2002. 1(1): p. 82-9.
109. Shapiro, H.M., Practical flow cytometry, Third edition. Practical flow cytometry, Third
edition1995.
110. Rahman, M., Introduction to Flow Cytometry, 2006, AbD SeroTec.
111. Biosciences, B., Introduction to Flow Cytometry: A Learning Guide, 2000, 'BD
Biosciences'.
191

112. Kowaltowski, A.J., et al., Effect of Bcl-2 overexpression on mitochondrial structure
and function. Journal of Biological Chemistry, 2002. 277(45): p. 42802-42807.
113. Prais, A.L., C. Dive, and B.M. Corfe, Butyrate-mediated cell cycle arrest of HCT116
colon carcinoma cells is accompanied by hyperploidy, in Gums and Stabilizers for the
Food Industry 12, P.A. Williams and G.O. Phillips, Editors. 2004. p. 535-538.
114. STRING, STRING 9.0 Known and Predicted Protein-Protein Interactions, EMBL-EBI,
2004.
115. Phenyx, MS/MS protein identification software, in GeneBio 2009.
116. BLAST, BLAST, Basic Local Alignment Search Tool, in NCBI, National Center for
Biotechnology Information 2009.
117. SABiosciences, Transcription Regulator Search Portal, 2010, Qiagen Inc. USA.
118. Kapushesky, M., et al., Gene Expression Atlas at the European Bioinformatics
Institute. Nucleic Acids Research, 2010. 38: p. D690-D698.
119. Zhang, X.Y., et al., The major histocompatibility complex class-ii promoter-binding
protein rfx (nf-x) is a methylated dna-binding protein. Molecular and Cellular Biology,
1993. 13(11): p. 6810-6818.
120. Xu, Y., et al., Regulatory factor for X-box family proteins differentially interact with
histone deacetylases to repress collagen alpha 2(I) gene (COL1A2) expression.
Journal of Biological Chemistry, 2006. 281(14): p. 9260-9270.
121. Annicotte, J.-S., S. Culine, and L. Fajas, Role of PPAR gamma in the control of
prostate cancer growth a new approach for therapy. Bulletin Du Cancer, 2007. 94(2):
p. 135-137.
122. Lefterova, M.I., et al., Cell-Specific Determinants of Peroxisome Proliferator-Activated
Receptor gamma Function in Adipocytes and Macrophages. Molecular and Cellular
Biology, 2010. 30(9): p. 2078-2089.
123. Sarraf, P., et al., Loss-of-function mutations in PPAR gamma associated with human
colon cancer. Molecular Cell, 1999. 3(6): p. 799-804.
124. Naruse, Y., et al., Neural restrictive silencer factor recruits mSin3 and histone
deacetylase complex to repress neuron-specific target genes. Proc Natl Acad Sci U
S A, 1999. 96(24): p. 13691-13696.
125. Kurschat, P., et al., Neuron restrictive silencer factor NRSF/REST is a transcriptional
repressor of neuropilin-1 and diminishes the ability of semaphorin 3A to inhibit
keratinocyte migration. Journal of Biological Chemistry, 2006. 281(5): p. 2721-2729.
126. Chen, L.F. and W.C. Greene, Assessing acetylation of NF-kappa B. Methods, 2005.
36(4): p. 368-375.
192

127. Crump, N.T., et al., Dynamic acetylation of all lysine-4 trimethylated histone H3 is
evolutionarily conserved and mediated by p300/CBP. Proc Natl Acad Sci U S A,
2011. 108(19): p. 7814-7819.
128. Wang, S., et al., NF-kappa B Signaling Pathway, Inflammation and Colorectal
Cancer. Cellular & Molecular Immunology, 2009. 6(5): p. 327-334.
129. BioModels-Database, BioModels Database, in EMBL-EBI2012.
130. Cell-Designer. The Systems Biology Institute. 2012 [Available from:
http://www.celldesigner.org/.
131. COPASI. COPASI: biochemical network simulator. 2011; Available from:
http://www.copasi.org.
132. Kline-Smith, S.L. and C.E. Walczak, The microtubule-destabilizing kinesin XKCM1
regulates microtubule dynamic instability in cells. Molecular Biology of the Cell, 2002.
13(8): p. 2718-2731.
133. Schilstra, M.J., S.R. Martin, and S.M. Keating, Methods for simulating the dynamics
of complex biological processes, in Biophysical Tools for Biologists: Vol 1 in Vitro
Techniques, J.J. Correia and H.W. Detrich, Editors. 2008. p. 807-842.
134. Tyson, J.J., Modeling the cell-division cycle - cdc2 and cyclin interactions. Proc Natl
Acad Sci U S A, 1991. 88(16): p. 7328-7332.
135. Schulz, E.G., et al., Sequential Polarization and Imprinting of Type 1 T Helper
Lymphocytes by Interferon-gamma and Interleukin-12. Immunity, 2009. 30(5): p. 673-
683.
136. Chen, K.C., et al., Integrative analysis of cell cycle control in budding yeast.
Molecular Biology of the Cell, 2004. 15(8): p. 3841-3862.
137. BRENDA, The Comprehensive Enzyme Information System, 2012.
138. Smolen, P., et al., Simulation of Drosophila circadian oscillations, mutations, and light
responses by a model with VRI, PDP-1, and CLK. Biophysical Journal, 2004. 86(5):
p. 2786-2802.
139. Stoops, J.K., N. Singh, and S.J. Wakil, The yeast fatty-acid synthase - pathway for
transfer of the acetyl group from coenzyme a to the cys-sh of the condensation site.
Journal of Biological Chemistry, 1990. 265(28): p. 16971-16977.
140. Chan, C., J. Stark, and A.J.T. George, Feedback control of T-cell receptor activation.
Proceedings of the Royal Society B-Biological Sciences, 2004. 271(1542): p. 931-
939.
141. Cheung, P., et al., Synergistic coupling of histone H3 phosphorylation and acetylation
in response to epidermal growth factor stimulation. Molecular Cell, 2000. 5(6): p. 905-
915.
193

142. Aslam, N. and H.Z. Shouval, Regulation of cytoplasmic polyadenylation can generate
a bistable switch. BMC Systems Biology, 2012. 6.
143. Bhattacharya, R., A. Frankfurter, and F. Cabral, A minor beta-tubulin essential for
mammalian cell proliferation. Cell Motil Cytoskeleton, 2008. 65(9): p. 708-20.
144. Corfe, B.M. et al, in preparation. 2012.
145. Rusan, N.M., et al., Cell cycle-dependent changes in microtubule dynamics in living
cells expressing green fluorescent protein-alpha tubulin. Molecular Biology of the
Cell, 2001. 12(4): p. 971-980.
146. Huzil, J.T., et al., The Roles of beta-Tubulin Mutations and Isotype Expression in
Acquired Drug Resistance. Cancer Inform, 2007. 3: p. 159-81.
147. Zhou, J. and P. Giannakakou, Targeting microtubules for cancer chemotherapy.
Current Medicinal Chemistry - Anti-Cancer Agents, 2005. 5(1): p. 65-71.
194

Appendix I: Multi-plex iTRAQ quantitation
Tables A1a–d: Multi-plex iTRAQ quantitation (uTRAQ and SignifiQuant) listing linear fold
changes and significances of proteins differentially regulated by SCFA treatments in
HCT116 cells relative to untreated controls [93].
a) SCFA duplicates uTRAQ analysis (ref NCBInr)
b) SCFA duplicates SignifiQuant analysis (ref UniProt)
c) P quadruplets uTRAQ analysis (ref UniProt)
d) P quadruplets SignifiQuant analysis (ref UniProt)
Protein ID Short Description Pep. B:C SD P:C SD V:C SD49168528 ANXA5 4 1.79 >2SD 1.71 > SD 1.65 >SD180555 creatine kinase-B 3 1.73 >SD 1.66 > SD 1.78 >SD119627382 peroxiredoxin 1 4 1.60 >SD 1.55 > SD 1.70 >SD159162689 A Chain A 3 1.54 >SD 1.21 1.16119621875 hCG23783 7 1.54 >SD 1.64 > SD 1.67 >SD54696890 tyrosine 3-monooxygenase 3 1.52 >SD 1.55 > SD 1.46 >SD89574029 mitochondrial ATP synthase 8 1.43 >SD 1.63 > SD 1.77 >SD1633054 A Chain A, Cyclophilin A 8 1.42 >SD 1.36 > SD 1.43 >SD5032051 ribosomal protein S14 4 1.40 >SD 1.20 1.07124256496 heat shock 70kDa protein 9 1.38 >SD 1.24 1.04119584991 ribosomal protein SA 4 1.37 >SD 1.21 1.58 >SD31418053 CCT8 protein 3 1.36 >SD 1.42 > SD 1.3724234699 keratin 19 6 1.34 >SD 1.29 1.21167466173 heat shock 70kDa protein 1B 12 1.34 >SD 1.22 1.0216198386 Eukaryotic translation initiat 4 1.29 1.28 1.2831416989 Pyruvate kinase 15 1.28 1.20 1.11161172138 A Chain A, Phosphorylation 5 1.26 1.17 1.15553163 keratin 8 4 1.25 1.19 1.2112653819 Keratin 18 4 1.25 1.27 1.17119610572 eukaryotic translation initiat. 4 1.24 1.20 1.2340353734 nucleophosmin 1 3 1.21 1.28 1.65 >SD15277503 ACTB protein 20 1.20 1.05 1.0049456871 TUBB 8 1.13 1.37 > SD 1.49 >SD62913980 KRT8 protein 20 1.13 1.04 1.031419564 cytokeratin 18 1.12 1.02 1.0320070125 prolyl 4-hydroxylase, beta 5 1.12 1.08 0.9418645167 Annexin A2 16 1.10 1.05 0.9849259209 A Chain A, Human B Lactate 5 1.09 1.13 1.03181250 cyclophilin 4 1.09 1.03 1.13119593153 filamin A, alpha, actin binding 3 1.08 0.95 0.9520809886 Tubulin, beta 2C 16 1.08 1.30 1.67 >SD5729877 heat shock 70kDa protein 8 16 1.08 1.00 0.85157829895 A Chain A, Crystal Structure 6 1.06 1.01 1.08
195

Protein ID Short Description Pep. B:C SD P:C SD V:C SD57209813 tubulin, beta polypeptide 12 1.06 1.44 > SD 1.65 >SD704416 elongation factor Tu 3 1.05 1.21 0.9821614499 ezrin 9 1.05 1.01 1.1938014278 TUBB3 protein 10 1.04 1.33 > SD 1.48 >SD119609105 prohibitin 2 3 1.04 1.08 0.8114043072 heterogeneous nuclear ribo 7 1.02 1.03 1.0766267425 EEF1D protein 3 1.02 0.89 1.0133874637 ACTN4 protein 6 1.02 1.34 > SD 1.51 >SD21619981 LMNA protein 7 1.01 0.97 1.0412667788 myosin, heavy polypeptide 9 8 1.01 1.20 1.13340021 alpha-tubulin 15 1.01 0.98 0.9831645 glyceraldehyde-3-phosphate 12 1.00 0.89 0.8813786849 A Chain A, Human Muscle L- 3 0.99 1.03 1.05159163287 A Chain A, Solution Structure 3 0.97 0.77 1.15153267427 enolase 3 5 0.94 0.93 0.74154146191 heat shock protein 90kDa 15 0.93 0.90 0.89181965 elongation factor 1 alpha 5 0.93 0.87 0.9062088648 tumor rejection antigen, gp96 4 0.92 1.05 1.054506671 ribosomal protein P2 3 0.90 0.87 0.61 >SD4503483 eukaryotic translation elong.n 11 0.90 0.93 0.906470150 AF188611_1 BiP 9 0.90 0.92 1.046807647 hypothetical protein 17 0.90 0.81 0.88158259731 unnamed protein product 15 0.89 0.88 0.8633096800 hypothetical protein 3 0.87 1.00 1.0312653415 Heat shock 70kDa protein 9 4 0.87 1.10 1.17124504316 HIST2H4B protein 9 0.86 0.60 > SD 0.66 >SD62988641 unknown 3 0.84 0.71 > SD 0.924503571 enolase 1 14 0.81 0.72 > SD 0.73 >SD89574129 mitochondrial malate dehyd 4 0.80 0.77 0.8275517570 HNRPA1 protein 5 0.80 0.91 1.0914625824 AF295356_1 moesin 3 0.79 0.72 > SD 1.05157838211 A Chain A, Human Platelet 7 0.78 0.76 0.72 >SD999892 A Chain A, Crystal Structure 7 0.78 0.78 0.8415126735 Heat shock 27kDa protein 1 3 0.77 0.81 0.67 >SD88942427 PREDICTED: similar to 40S 4 0.75 0.57 > SD 0.64 >SD15277711 AF397403_1 translation 8 0.75 0.81 0.7839644481 RPS2 protein 3 0.74 0.77 0.58 >SD4505763 phosphoglycerate kinase 1 3 0.74 >SD 0.93 0.893387905 glucose transporter glycoprot 3 0.74 >SD 0.78 0.97119593147 ribosomal protein L10 3 0.73 >SD 0.81 1.0710120904 A Chain Importin-Beta-Fxfg 3 0.71 >SD 0.80 0.924930167 A Chain Human Muscle Aldol 6 0.71 >SD 0.77 0.76119575944 hCG2039566, isoform CRA 4 0.70 >SD 0.72 > SD 0.65 >SD31542947 chaperonin 15 0.70 >SD 0.65 > SD 0.7713097600 AAH03518 Similar to riboso 3 0.69 >SD 0.59 > SD 0.55 >SD33874520 SYNCRIP protein 3 0.69 >SD 0.81 0.86119620390 chaperonin containing TCP1 4 0.60 >SD 0.53 > 2SD 0.67 >SD
196

Protein ID Short Description Pep. B:C SD P:C SD V:C SD119617636 chaperonin containing TCP1 5 0.51 >2SD 0.44 > 2SD 0.52 >2SD119610151 fatty acid synthase 11 0.32 >3SD 0.34 > 3SD 0.32 >3SD
Mean fold change (SD): 1.03 0.28 1.03 0.29 1.05 0.32b) SCFA duplicates SignifiQuant [93] analysis (ref UniProt); significances: *** MTC on p<0.05;
** MTC on p<0.01; * MTC off p<0.05)
AC Short Description B:U P:U V:U B P V
B0ZBD0 40S ribosomal S19 0.745 *
Q8WVW5 Actin 1.193 **
Q96BG6 ACTN4 1.861 *
P08758 Annexin A5 1.811 2.150 1.581 * ** **
Q0QEN7 ATP synthase 2.168 2.366 * *
Q7Z759 CCT8 2.021 2.435 2.341 ** ** *
Q96M80 Caspr 0.624 0.700 0.629 ** * *
B4DP56 Creatine kinase B 2.268 2.264 2.241 * * *
A8K7F6 EIF4A1 1.750 1.958 1.858 * * *
Q9BT62 Enolase 1.277 1.371 * *
B7Z5V2 Ezrin 1.590 1.592 * *
B3KTA3 FASCIN 2.101 *
Q2TSD0 G3PDH 1.224 **
P09382 Galectin-1 1.331 1.472 * *
B4DMJ7 HCG2015269 0.490 0.419 0.465 * * *
P16403 Histone H1.2 0.332 0.295 0.278 ** ** **
P10412 Histone H1.4 0.342 0.306 0.281 *** *** **
Q96KK5 Histone H2A 0.432 0.427 0.388 * * *
B7Z597 HSP60 0.583 0.602 0.678 *** *** **
B4E3B6 HSP70 1.285 1.291 * *
B2RA03 Keratin 18 1.776 *
P08727 Keratin 19 1.760 1.924 1.828 ** ** **
Q5U077 L-lactate dehydrogenase 0.880 *
P14174 MIF 2.944 *
P06748 Nucleophosmin 0.742 *
P07237 PDI 1.285 1.254 * *
D3DPZ8 Peroxiredoxin 1 1.404 *
B4DM82 PPIase c 1.590 1.654 1.682 * * *
P07737 Profilin-1 0.472 0.452 0.506 *** ** **
B4DNK4 Pyruvate kinase 1.299 1.358 1.217 * ** *
C9JD32 ribosomal L14P 0.501 *
C9J9K3 ribosomal S2P 2.169 2.570 2.697 * * *
197

B4DVU1 Transketolase 1.850 *
P60174 Triosephosphate 0.597 0.631 * *
P68371 Tubulin β-2C 1.455 1.479 * ***
P62988 Ubiquitin 1.385 1.266 * *
198

c) P quadruplets uTRAQ [93] analysis (ref NCBInr); significances: >SD; >2SD; >3SD
Protein ID Short Description Pep. P:C SDP61604 10 kDa heat shock protein 20 0.925P62258 14-3-3 protein epsilon (1 5 0.913P27348 14-3-3 protein theta 2 1.416 >SDP63104 14-3-3 protein zeta/delta 25 1.062P62191 26S protease regulatory s 2 0.866P46783 40S ribosomal protein S10 14 0.920P62280 40S ribosomal protein S11 5 0.946P25398 40S ribosomal protein S12 8 0.978P62277 40S ribosomal protein S13 6 0.874P62263 40S ribosomal protein S14 5 1.461 >SDP62841 40S ribosomal protein S15 3 1.044P62244 40S ribosomal protein S15 6 0.794 >SDP62249 40S ribosomal protein S16 13 0.735 >SDP08708 40S ribosomal protein S17 2 0.994P62269 40S ribosomal protein S18 18 0.889P39019 40S ribosomal protein S19 16 1.097P15880 40S ribosomal protein S2 5 1.085P60866 40S ribosomal protein S20 4 0.901P62266 40S ribosomal protein S23 4 0.914P62847 40S ribosomal protein S24 2 0.706 >SDP62851 40S ribosomal protein S25 15 0.971P62854 40S ribosomal protein S26 4 0.801P62857 40S ribosomal protein S28 7 1.034P23396 40S ribosomal protein S3 6 0.989P62861 40S ribosomal protein S30 2 0.827P61247 40S ribosomal protein S3a 8 1.229P62701 40S ribosomal protein S4, 12 0.931P46782 40S ribosomal protein S5, 11 0.836P62753 40S ribosomal protein S6 8 0.946P62241 40S ribosomal protein S8 8 1.007P46781 40S ribosomal protein S9 6 1.017P08865 40S ribosomal protein SA 22 0.969P08195 4F2 cell-surface antigen 4 0.773 >SDP10809 60 kDa heat shock protein 127 0.969P05388 60S acidic ribosomal prot 7 1.080P05386 60S acidic ribosomal prot 9 1.076P05387 60S acidic ribosomal prot 14 1.011P27635 60S ribosomal protein L10 13 0.735 >SDP62906 60S ribosomal protein L10 3 0.968P62913 60S ribosomal protein L11 3 0.919P30050 60S ribosomal protein L12 5 1.123P26373 60S ribosomal protein L13 12 0.807P40429 60S ribosomal protein L13 4 0.896P50914 60S ribosomal protein L14 7 0.920P61313 60S ribosomal protein L15 7 0.990
199
Protein ID Short Description Pep. P:C SDP18621 60S ribosomal protein L17 10 0.933Q07020 60S ribosomal protein L18 2 0.999P84098 60S ribosomal protein L19 5 0.718 >SDQ6P5R6 60S ribosomal protein L22 4 0.812P62829 60S ribosomal protein L23 5 0.794 >SDP62750 60S ribosomal protein L23 2 0.923P83731 60S ribosomal protein L24 7 1.134Q9UNX3 60S ribosomal protein L26 2 0.994P46776 60S ribosomal protein L27 10 0.854P39023 60S ribosomal protein L3 4 1.111P62899 60S ribosomal protein L31 10 0.771 >SDQ9Y3U8 60S ribosomal protein L36 8 0.821P63173 60S ribosomal protein L38 3 0.689 >SDP62891 60S ribosomal protein L39 3 0.828P36578 60S ribosomal protein L4 19 0.924P46777 60S ribosomal protein L5 2 1.007Q02878 60S ribosomal protein L6 13 0.931P18124 60S ribosomal protein L7 10 0.904P62424 60S ribosomal protein L7a 3 1.013P62917 60S ribosomal protein L8 6 0.752 >SDP11021 78 kDa glucose-regulated 62 0.909P39687 Acidic leucine-rich nucle 3 1.009Q92688 Acidic leucine-rich nucle 4 0.978P60709 Actin, cytoplasmic 1, N-t 192 1.355 >SDO95433 Activator of 90 kDa heat 4 0.738 >SDP07741 Adenine phosphoribosyltra 3 0.953P23526 Adenosylhomocysteinase (A 3 0.920P05141 ADP/ATP translocase 2 (AN 14 1.277P62330 ADP-ribosylation factor 6 2 0.763 >SDO43707 Alpha-actinin-4 30 1.032P06733 Alpha-enolase (NNE) 96 1.023P04083 Annexin A1 22 1.041P07355 Annexin A2 (PAP-IV) 54 1.173P12429 Annexin A3 (PAP-III) 11 0.786 >SDP08758 Annexin A5 (CBP-I) (PAP-I 26 1.360 >SDP08133 Annexin A6 (CPB-II) 2 1.526 >SDP54136 Arginyl-tRNA synthetase, 6 1.072P08243 Asparagine synthetasegl 2 1.160P00505 Aspartate aminotransferas 4 1.120P14868 Aspartyl-tRNA synthetase, 5 1.308 >SDP05496 ATP synthase lipid-bindin 2 1.229P25705 ATP synthase subunit alph 20 1.169P06576 ATP synthase subunit beta 44 1.155Q08211 ATP-dependent RNA helicas 4 1.258O00148 ATP-dependent RNA helicas 3 1.028O15523 ATP-dependent RNA helicas 2 0.557 >SDO75531 Barrier-to-autointegratio 3 1.576 >2SD
200

Protein ID Short Description Pep. P:C SDQ9Y6E2 Basic leucine zipper and 2 0.721 >SDP35613 Basigin (EMMPRIN) (TCSF) 2 0.916Q9BYX7 Beta-actin-like protein 3 2 1.395 >SDQ9HB71 Calcyclin-binding protein 2 0.599 >SDP62158 Calmodulin (CaM) 4 1.269P27824 Calnexin 5 0.888P27797 Calreticulin (ERp60) 6 1.206P60953 Cell division control pro 4 0.943O00299 Chloride intracellular ch 4 1.072Q13185 Chromobox protein homolog 2 0.903O75390 Citrate synthase, mitocho 3 1.152Q00610 Clathrin heavy chain 1 (C 18 1.138Q9H0L4 Cleavage stimulation fact 3 1.944 >3SDP23528 Cofilin-1 (p18) 12 1.276Q8NEF3 Coiled-coil domain-contai 2 1.199Q8N4S0 Coiled-coil domain-contai 3 1.162Q07021 Complement component 1 Q 3 0.746 >SDO75131 Copine-3 2 0.979P36551 Coproporphyrinogen-III ox 4 0.932P12277 Creatine kinase B-type 33 1.999 >3SDP04080 Cystatin-B 4 0.893O43169 Cytochrome b5 type B 7 1.302 >SDP00403 Cytochrome c oxidase subu 7 1.056P13073 Cytochrome c oxidase subu 4 1.145P10606 Cytochrome c oxidase subu 2 1.123O00154 Cytosolic acyl coenzyme A 4 1.528 >SDO43175 D-3-phosphoglycerate dehy 5 0.971P09622 Dihydrolipoyl dehydrogena 2 0.974P11387 DNA topoisomerase 1 4 0.921P78527 DNA-dependent protein kin 3 1.272P04843 Dolichyl-diphosphooligosa 5 1.063P68104 Elongation factor 1-alpha 53 0.939P29692 Elongation factor 1-delta 5 1.028P26641 Elongation factor 1-gamma 28 0.989P13639 Elongation factor 2 (EF-2 63 0.986P49411 Elongation factor Tu, mit 16 1.207Q9Y371 Endophilin-B1 (Bif-1)IS 2 1.713 >2SDP14625 Endoplasmin (GRP-94) 18 1.031Q14240 Eukaryotic initiation fac 10 1.317 >SDP38919 Eukaryotic initiation fac 2 0.946Q14152 Eukaryotic translation in 13 0.554 >SDP23588 Eukaryotic translation in 2 0.663 >SDP63241 Eukaryotic translation in 7 0.879P15311 Ezrin 80 1.106Q92945 Far upstream element-bind 2 0.992Q16658 Fascin 10 1.455 >SDP49327 Fatty acid synthase 23 0.868
201

Protein ID Short Description Pep. P:C SDQ01469 Fatty acid-binding protei 3 1.043P20930 Filaggrin 9 0.607 >SDP21333 Filamin-A (FLN-A) (ABP-28 14 1.390 >SDO75369 Filamin-B (FLN-B) (Trunca 2 2.167 >3SDP39748 Flap endonuclease 1 (FEN- 2 0.996P04075 Fructose-bisphosphate ald 52 1.241P09382 Galectin-1 (Gal-1) (HLBP1 11 1.790 >2SDP06744 Glucose-6-phosphate isome 8 1.127P14314 Glucosidase 2 subunit bet 2 0.717 >SDP09211 Glutathione S-transferase 9 1.079P04406 Glyceraldehyde-3-phosphat 142 1.161P41250 Glycyl-tRNA synthetase (G 4 1.311 >SDP62826 GTP-binding nuclear prote 5 0.950P63244 Guanine nucleotide-bindin 3 1.093P08107 Heat shock 70 kDa protein 43 1.148P34932 Heat shock 70 kDa protein 3 0.809P11142 Heat shock cognate 71 kDa 111 0.994P04792 Heat shock protein beta-1 16 0.913P07900 Heat shock protein HSP 90 91 1.088P08238 Heat shock protein HSP 90 199 0.893Q99729 Heterogeneous nuclear rib 5 1.583 >2SDP09651 Heterogeneous nuclear rib 23 0.960P51991 Heterogeneous nuclear rib 8 1.074Q14103 Heterogeneous nuclear rib 14 0.897P52597 Heterogeneous nuclear rib 5 0.849P38159 Heterogeneous nuclear rib 6 0.739 >SDP61978 Heterogeneous nuclear rib 16 0.954P52272 Heterogeneous nuclear rib 7 1.032O60506 Heterogeneous nuclear rib 8 0.891Q00839 Heterogeneous nuclear rib 9 1.060P22626 Heterogeneous nuclear rib 26 0.898P07910 Heterogeneous nuclear rib 19 0.970P09429 High mobility group prote 9 0.986P17096 High mobility group prote 6 1.342 >SDQ9Y5N1 Histamine H3 receptor (HH 2 0.990P07305 Histone H1.0 5 1.809 >3SDP16403 Histone H1.2 4 0.719 >SDP10412 Histone H1.4 30 0.839Q96QV6 Histone H2A type 1-A 4 1.026Q96KK5 Histone H2A type 1-H 88 0.941P0C0S5 Histone H2A.Z (H2A/z) 10 1.075O60814 Histone H2B type 1-K (H2B 106 0.898P68431 Histone H3.1 38 0.742 >SDP62805 Histone H4 122 0.883Q14974 Importin subunit beta-1 ( 3 0.847O00410 Importin-5 (Imp5) (RanBP5 3 0.858P09529 Inhibin beta B chain 2 1.515 >SD
202

Protein ID Short Description Pep. P:C SDP12268 Inosine-5'-monophosphate 13 1.047Q12905 Interleukin enhancer-bind 5 0.744 >SDQ12906 Interleukin enhancer-bind 9 1.136O75874 Isocitrate dehydrogenase 3 1.663 >2SDP05783 Keratin, type I cytoskele 41 1.083P08727 Keratin, type I cytoskele 98 1.430 >SDP05787 Keratin, type II cytoskel 126 1.253Q04760 Lactoylglutathione lyase 4 1.019P02545 Lamin-A/CISOFORM C 29 1.173P20700 Lamin-B1 4 0.891Q01650 Large neutral amino acids 3 0.894P42704 Leucine-rich PPR motif-co 6 1.333 >SDQ96AG4 Leucine-rich repeat-conta 4 1.088P00338 L-lactate dehydrogenase A 28 1.040P07195 L-lactate dehydrogenase B 26 0.887Q7Z4F1 Low-density lipoprotein r 2 0.833P05455 Lupus La protein (SS-B) 2 1.366 >SDP14174 Macrophage migration inhi 13 0.993P40925 Malate dehydrogenase, cyt 2 1.658 >2SDP40926 Malate dehydrogenase, mit 21 1.185O15479 Melanoma-associated antig 5 1.396 >SDP55145 Mesencephalic astrocyte-d 3 0.807Q16891 Mitochondrial inner membr 2 0.831O15427 Monocarboxylate transport 3 0.989P60660 Myosin light polypeptide 6 1.232P35579 Myosin-9 (NMMHC II-a) (NM 11 1.121Q13423 NAD(P) transhydrogenase, 2 0.759 >SDP15559 NAD(P)H dehydrogenasequ 2 1.164P20929 Nebulin 3 1.133Q14697 Neutral alpha-glucosidase 7 0.811P05204 Non-histone chromosomal p 4 0.922Q15233 Non-POU domain-containing 2 0.846Q9Y2X3 Nucleolar protein 58 4 0.791 >SDQ9NR30 Nucleolar RNA helicase 2 8 0.783 >SDP19338 Nucleolin 48 0.881P06748 Nucleophosmin (NPM) 39 1.073P22392 Nucleoside diphosphate ki 29 0.933P55209 Nucleosome assembly prote 6 1.001Q9NTK5 Obg-like ATPase 1ISOFOR 8 1.095A3KFT3 Olfactory receptor 2M5 2 0.808P04181 Ornithine aminotransferas 8 1.745 >2SDP62937 Peptidyl-prolyl cis-trans 60 1.036P23284 Peptidyl-prolyl cis-trans 18 0.878Q02790 Peptidyl-prolyl cis-trans 5 0.772 >SDO60664 Perilipin-3 (47 kDa MPR-b 2 1.494 >SDQ06830 Peroxiredoxin-1 (PAG) (NK 46 1.174P32119 Peroxiredoxin-2 (TSA) (NK 8 1.283
203

Protein ID Short Description Pep. P:C SDP30041 Peroxiredoxin-6 (1-Cys PR 9 1.091P00558 Phosphoglycerate kinase 1 18 0.971P18669 Phosphoglycerate mutase 1 10 1.024Q8NC51 Plasminogen activator inh 2 0.959P68402 Platelet-activating facto 2 1.139Q15102 Platelet-activating facto 2 1.239Q15149 Plectin-1 (PLTN) (PCN) (H 8 1.100P09874 PolyADP-ribose polymer 7 1.042Q15366 Poly(rC)-binding protein 2 0.962P11940 Polyadenylate-binding pro 3 0.524 >2SDP26599 Polypyrimidine tract-bind 2 0.914Q9UMS4 Pre-mRNA-processing facto 6 1.101P17844 Probable ATP-dependent RN 9 0.901P07737 Profilin-1 20 0.837P35232 Prohibitin 12 0.932P12004 Proliferating cell nuclea 8 0.961Q9UQ80 Proliferation-associated 6 0.729 >SDQ15185 Prostaglandin E synthase 3 0.880P25786 Proteasome subunit alpha 2 0.845P28066 Proteasome subunit alpha 3 1.241P07237 Protein disulfide-isomera 53 1.295 >SDP30101 Protein disulfide-isomera 18 0.999P13667 Protein disulfide-isomera 5 1.015Q15084 Protein disulfide-isomera 2 1.096Q99497 Protein DJ-1 5 1.010O60237 Protein phosphatase 1 reg 2 1.332 >SDP31949 Protein S100-A11 (MLN 70) 4 1.213P06703 Protein S100-A6 (PRA) 25 0.989Q01105 Protein SET (I-2PP2A) (TA 6 0.911Q96L16 Putative ALMS1-like prote 4 1.664 >2SDQ8IZP2 Putative protein FAM10A4 3 1.123Q92928 Putative Ras-related prot 4 1.059P32322 Pyrroline-5-carboxylate r 4 0.949P14618 Pyruvate kinase isozymes 56 1.033Q9UN86 Ras GTPase-activating pro 2 0.911P61026 Ras-related protein Rab-1 5 0.885P51149 Ras-related protein Rab-7 3 0.934Q96AH8 Ras-related protein Rab-7 6 0.919P18754 Regulator of chromosome c 2 1.097P52565 Rho GDP-dissociation inhi 3 1.124P35637 RNA-binding protein FUS 2 1.086Q9BVN2 RUN and SH3 domain-contai 2 0.922Q9Y230 RuvB-like 2 (48 kDa TBP-i 4 0.852P34897 Serine hydroxymethyltrans 2 1.282P36873 Serine/threonine-protein 4 1.274P50454 Serpin H1 (Colligin) (AsT 5 1.246
204

Protein ID Short Description Pep. P:C SDP37108 Signal recognition partic 4 1.178P62316 Small nuclear ribonucleop 2 0.677 >SDP62318 Small nuclear ribonucleop 2 0.869P54709 Sodium/potassium-transpor 2 0.909P11166 Solute carrier family 2, 7 0.586 >SDQ07955 Splicing factor, arginine 4 0.760 >SDQ13242 Splicing factor, arginine 2 1.788 >2SDP23246 Splicing factor, proline- 9 0.807P16949 Stathmin (pp19) (Op18) 2 0.859P38646 Stress-70 protein, mitoch 30 1.035P31948 Stress-induced-phosphopro 12 1.008Q96SB8 Structural maintenance of 2 1.226P00441 Superoxide dismutaseu- 2 1.161P23381 T2-TrpRS2 2 1.689 >2SDP17987 T-complex protein 1 subun 6 0.870P78371 T-complex protein 1 subun 24 0.987P50991 T-complex protein 1 subun 13 0.872P48643 T-complex protein 1 subun 8 0.791 >SDQ99832 T-complex protein 1 subun 11 0.830P49368 T-complex protein 1 subun 24 0.976P50990 T-complex protein 1 subun 16 0.916P40227 T-complex protein 1 subun 13 0.861P10599 Thioredoxin (Trx) (ADF) ( 7 1.187P30048 Thioredoxin-dependent per 2 1.913 >3SDP06454 Thymosin alpha-1 5 1.011P63313 Thymosin beta-10PEPTIDE 4 0.879P37837 Transaldolase 3 1.181Q13263 Transcription intermediar 2 1.145P55072 Transitional endoplasmic 2 1.714 >2SDP29401 Transketolase (TK) 7 1.148Q5SNT2 Transmembrane protein 201 2 0.822P60174 Triosephosphate isomerase 43 1.223P06753 Tropomyosin alpha-3 chain 16 1.543 >SDP67936 Tropomyosin alpha-4 chain 3 0.998Q71U36 Tubulin alpha-1A chain 5 1.303 >SDP68363 Tubulin alpha-1B chain 49 1.047P07437 Tubulin beta chain 11 0.729 >SDP68371 Tubulin beta-2C chain 112 1.130P08579 U2 small nuclear ribonucl 3 1.220P62988 Ubiquitin 40 1.130P68036 Ubiquitin-conjugating enz 2 1.492 >SDP61088 Ubiquitin-conjugating enz 2 1.127P22314 Ubiquitin-like modifier-a 9 1.144Q86T90 Uncharacterized protein K 3 1.013Q9BTE3 UPF0557 protein C10orf119 2 1.202Q9Y224 UPF0568 protein C14orf166 2 0.872Q96QK1 Vacuolar protein sorting- 2 1.035
205

Protein ID Short Description Pep. P:C SDA5D8V6 Vacuolar protein sorting- 2 0.886P45880 Voltage-dependent anion-s 2 0.738 >SDP13010 X-ray repair cross-comple 7 1.267P12956 X-ray repair cross-comple 21 0.909Q9BY31 Zinc finger protein 717 2 0.962
Mean fold change (SD): 1.04 0.25
206

d) P quadruplets SignifiQuant [93] analysis (ref UniProt); significances: *** MTC on p<0.05; **
MTC on p<0.01; * MTC off p<0.05)
AC Short Description peptide
s
P:C
P04075 Fructose-bisphosphate aldolase A 52 1.24
P04181 Ornithine aminotransferase, renal form 8 1.75
P04406 Glyceraldehyde-3-phosphate dehydrogenase (GAPDH) 142 1.16
P05787 Keratin 8 126 1.25
P06753 Tropomyosin alpha-3 chain (hTM5) 16 1.54
P07237 Protein disulfide-isomerase (PDI) 53 1.30
P07305 Histone H1.0 5 1.81
P07355 Annexin A2 (PAP-IV) 54 1.17
P07437 Tubulin beta chain (TUBB/TUBB5) 11 0.73
P08727 Keratin 19 98 1.43
P08758 Annexin A5 (CBP-I) (PAP-I) (PP4) (VAC-alpha) 26 1.36
P09382 Galectin-1 (Gal-1) (HLBP14) 11 1.79
P10412 Histone H1.4 30 0.84
P11166 facilitated glucose transporter member 1 (GLUT-1) 7 0.59
P12277 Creatine kinase B-type 33 2.00
P16403 Histone H1.2 4 0.72
P60174 Triosephosphate isomerase (TIM) 43 1.22
P60709 Actin 192 1.36
P68431 Histone H3.1 38 0.74
Q06830 Peroxiredoxin-1 (PAG) (NKEF-A) 46 1.17
Q16658 Fascin 10 1.46
207

Appendix II: Bioinformatics and Pathway analyses
Tables A2: Reactome pathway expression analysis of Statistically over-represented events.
Table 1 lists event name, probability and number of participatory genes; Table 2 includes
protein identifiers. (Data accessed 24/09/12).
a) Total number of genes involved in this Event
b) Un-adjusted probability of seeing N or more genes in this Event by chance
c) Number of genes in your query which map to this Event
Name of this Event a b cGlycolysis 27 4.0E-07 5Apoptosis induced DNA fragmentation 13 7.1E-07 4Activation of DNA fragmentation factor 13 7.1E-07 4Gluconeogenesis 31 8.3E-07 5Metabolism of proteins 461 1.1E-06 13Association of DFF40 with chromatin 7 6.5E-06 3Cleavage of DNA by DFF40 7 6.5E-06 3Aminoacyl-tRNA binds to the ribosome at the A-site 88 1.1E-05 6Hydrolysis of eEF1A:GTP 88 1.1E-05 6Peptide chain elongation 89 1.1E-05 6Translocation of ribosome by 3 bases in the 3' direction 89 1.1E-05 6Eukaryotic Translation Elongation 92 1.4E-05 6Prefoldin mediated transfer of substrate to CCT/TriC 26 1.4E-05 4Actin/tubulin:prefoldin complex associates with CCT/TriC 26 1.4E-05 4Cooperation of Prefoldin and TriC/CCT in actin and tubulin folding 27 1.6E-05 4Glucose metabolism 62 2.8E-05 5Influenza Life Cycle 116 5.2E-05 6Influenza Infection 121 6.6E-05 6Gap junction trafficking 42 9.9E-05 4Recycling pathway of L1 42 9.9E-05 4Interaction of Afadin with F-actin 3 1.0E-04 2Gap junction trafficking and regulation 44 1.2E-04 4Release of 40S and 60S subunits from the 80S ribosome 87 1.4E-04 5Peptide transfer from P-site tRNA to the A-site tRNA 87 1.4E-04 5Synthesis of nascent polypeptide containing signal sequence 87 1.4E-04 5unfolded actin/tubulin associates with prefoldin 18 1.5E-04 3eIF5B:GTP is hydrolyzed and released 88 1.5E-04 5The 60S subunit joins the translation initiation complex 88 1.5E-04 5Synthesis of PB1-F2 88 1.5E-04 5Eukaryotic Translation Termination 89 1.6E-04 5Polypeptide release from the eRF3-GDP:eRF1:mRNA:80S Ribosome complex
89 1.6E-04 5
208

Name of this Event a b cGTP Hydrolysis by eRF3 bound to the eRF1:mRNA:polypeptide:80S Ribosome complex
89 1.6E-04 5
GTP bound eRF3:eRF1 complex binds the peptidyl tRNA:mRNA:80S Ribosome complex
89 1.6E-04 5
Chaperonin-mediated protein folding 48 1.7E-04 4Formation of UPF1:eRF3 Complex on mRNA with a Premature Termination Codon and No Exon Junction Complex
93 1.9E-04 5
Nonsense Mediated Decay Independent of the Exon Junction Complex
93 1.9E-04 5
Hydrolysis of ATP and release of tubulin folding intermediate from CCT/TriC
20 2.0E-04 3
Formation of tubulin folding intermediates by CCT/TriC 20 2.0E-04 3ADP is exchanged for ATP in the (ADP:CCT/TriC):tubulin complex 20 2.0E-04 3Shootin-1 links L1 and retrograde actin flow 4 2.0E-04 2Release of (inferred) platelet cytosolic components 4 2.0E-04 2AKT2 Phosphorylates Myosin 5A 4 2.0E-04 2Association of a nascent polypeptide:mRNA:ribosome complex with a signal recognition particle (SRP)
95 2.2E-04 5
Translation 151 2.2E-04 6Apoptotic execution phase 52 2.3E-04 4The SRP receptor binds the SRP:nascent peptide:ribosome complex
97 2.4E-04 5
Protein folding 53 2.5E-04 4Formation of a pool of free 40S subunits 98 2.5E-04 5Viral Protein Synthesis 104 3.3E-04 5UPF1 Binds an mRNP with a Termination Codon Preceding an Exon Junction Complex
104 3.3E-04 5
SMG1 Phosphorylates UPF1 (Enhanced by Exon Junction Complex)
104 3.3E-04 5
Signal peptide cleavage from ribosome-associated nascent protein 104 3.3E-04 5MigFilin associates with Filamin and F-actin 5 3.4E-04 2F-actin capping protein binds to the barbed end of elongating F-actin
5 3.4E-04 2
RALA:GTP Activates MYO1C 5 3.4E-04 2Viral mRNA Translation 105 3.4E-04 5SMG6 Cleaves mRNA with Premature Termination Codon 107 3.8E-04 5L13a-mediated translational silencing of Ceruloplasmin expression 109 4.1E-04 53' -UTR-mediated translational regulation 109 4.1E-04 5Translocation of signal-containing nascent peptide to Endoplasmic Reticulum
109 4.1E-04 5
GTP hydrolysis and joining of the 60S ribosomal subunit 110 4.3E-04 5Nonsense-Mediated Decay 110 4.3E-04 5Phosphorylated UPF1 Recruits SMG5, SMG7, SMG6, and PP2A 110 4.3E-04 5Nonsense Mediated Decay Enhanced by the Exon Junction Complex
110 4.3E-04 5
Translocation of GLUT4 to the Plasma Membrane 62 4.5E-04 4Influenza Viral RNA Transcription and Replication 112 4.6E-04 5Linkage of L1 with treadmilling F-actin 6 5.0E-04 2Dephosphorylation of pL1 (Y1176) 6 5.0E-04 2
209

Name of this Event a b cSRP-dependent cotranslational protein targeting to membrane 114 5.0E-04 5Eukaryotic Translation Initiation 117 5.7E-04 5Cap-dependent Translation Initiation 117 5.7E-04 5Membrane Trafficking 192 8.1E-04 6Beta-tubulin:GTP + Cofactor A -> Beta-tubulin:GTP: Cofactor A 8 9.3E-04 2Beta-tubulin:GTP + Cofactor D -> Beta-tubulin:GTP: Cofactor D 8 9.3E-04 2Platelet degranulation 78 1.1E-03 4Factors involved in megakaryocyte development and platelet production
136 1.1E-03 5
Dab2 is recruited to the junctional plaques 9 1.2E-03 2Beta-tubulin:GTP: Cofactor A+ Cofactor D -> Beta-tubulin:GTP:Cofactor D + Cofactor A
9 1.2E-03 2
Folding of actin by CCT/TriC 9 1.2E-03 2Hydrolysis of ATP and release of folded actin from CCT/TriC 9 1.2E-03 2Exchange of ADP for ATP in CCT/TriC:actin complex 9 1.2E-03 2Response to elevated platelet cytosolic Ca2+ 83 1.4E-03 4Apoptosis 144 1.5E-03 5Hemostasis 477 1.5E-03 9Ubiquitination of AUF1 (hnRNP D0) 10 1.5E-03 2Metabolism of mRNA 224 1.8E-03 6Dynamin is recruited to the gap junction plaque 11 1.8E-03 2Formation of annular gap junctions 11 1.8E-03 2Internalization of gap junction plaques 12 2.2E-03 2Lysosomal degradation of gap junction plaques 12 2.2E-03 2Gap junction degradation 12 2.2E-03 2eIF3 and eIF1A bind to the 40S subunit 46 2.4E-03 3Metabolism of carbohydrates 238 2.5E-03 6Association of Golgi transport vesicles with microtubules 13 2.5E-03 2Microtubule-dependent trafficking of connexons from Golgi to the plasma membrane
13 2.5E-03 2
Insertion of connexons into the plasma membrane resulting in the formation of hemi-channels
13 2.5E-03 2
Docking of connexons into junctional, double-membrane spanning channels
13 2.5E-03 2
L1 linked to actin cytoskeleton by ankyrin 13 2.5E-03 2Formation of the 43S pre-initiation complex 49 2.9E-03 3Formation of the ternary complex, and subsequently, the 43S complex
49 2.9E-03 3
Transport of connexons to the plasma membrane 14 3.0E-03 2Beta-tubulin:GTP:Cofactor D+alpha-tubulin:GTP:Cofactor E-> Beta-tubulin:GTP:Cofactor D:alpha-tubulin:GTP:Cofactor E
14 3.0E-03 2
Metabolism of RNA 249 3.1E-03 6Beta-tubulin:GTP:Cofactor D:alpha-tubulin:GTP:Cofactor E+ Cofactor C-> Beta-tubulin:GTP:Cofactor D:alpha-tubulin:GTP:Cofactor E:Cofactor C
15 3.4E-03 2
Beta-tubulin:GTP:Cofactor D:alpha-tubulin:GTP:Cofactor E:Cofactor C-> Beta-tubulin:GDP :alpha-tubulin:GTP heterodimer +Cofactor E+ Cofactor D+ Cofactor C+ Pi
15 3.4E-03 2
210

Name of this Event a b cDissociation of L13a from the 60s ribosomal subunit 52 3.4E-03 3L1CAM interactions 108 3.6E-03 4RAB4A:GTP Activates KIF3 16 3.9E-03 2Translocation of GLUT4 Vesicle and Docking at the Plasma Membrane
16 3.9E-03 2
Ribosomal scanning 56 4.2E-03 3Formation of translation initiation complexes containing mRNA that does not circularize
56 4.2E-03 3
Post-chaperonin tubulin folding pathway 17 4.4E-03 2eIF2:GTP is hydrolyzed, eIFs are released 57 4.5E-03 3Translation initiation complex formation 57 4.5E-03 3Start codon recognition 57 4.5E-03 3Ribosomal scanning and start codon recognition 57 4.5E-03 3Formation of translation initiation complexes yielding circularized Ceruloplasmin mRNA in a 'closed-loop' conformation
57 4.5E-03 3
Activation of the mRNA upon binding of the cap-binding complex and eIFs, and subsequent binding to 43S
58 4.7E-03 3
Association of phospho-L13a with GAIT element of Ceruloplasmin mRNA
58 4.7E-03 3
Cell-extracellular matrix interactions 18 4.9E-03 2TOMM40 Complex Transports Proteins Across the Outer Mitochondrial Membrane
19 5.5E-03 2
Association of NuMA with microtubules 21 6.6E-03 2Translocation of NuMA to the centrosomes 21 6.6E-03 2Recruitment of NuMA to mitotic centrosomes 23 7.9E-03 2Reinsertion of L1 into the plasma membrane 23 7.9E-03 2Transport of L1 from C-domain to P-domain 23 7.9E-03 2Ankyrins link voltage-gated sodium and potassium channels to spectrin and L1
27 1.1E-02 2
Recruitment of mitotic centrosome proteins and complexes 80 1.1E-02 3Centrosome maturation 80 1.1E-02 3Interaction between L1 and Ankyrins 28 1.2E-02 2Rev associates with B23 31 1.4E-02 2Gap junction assembly 31 1.4E-02 2Adherens junctions interactions 31 1.4E-02 2Association of Ran-GTP with importin-beta 32 1.5E-02 2Disassembly of the Rev-importin beta-B23:Ran-GTP complex 32 1.5E-02 2G2/M Transition 91 1.6E-02 3Mitotic G2-G2/M phases 94 1.8E-02 3Kinesins move along microtubules consuming ATP 38 2.1E-02 2Kinesins bind microtubules 38 2.1E-02 2Kinesins 40 2.3E-02 2Axon guidance 280 2.3E-02 5Mitotic M-M/G1 phases 199 2.9E-02 4Exocytosis of platelet alpha granule contents 47 3.1E-02 2Platelet activation, signaling and aggregation 205 3.2E-02 4Cell Cycle 422 3.5E-02 6
211

Name of this Event a b cMitochondrial Protein Import 52 3.7E-02 2Destabilization of mRNA by AUF1 (hnRNP D0) 54 4.0E-02 2DNA Replication 221 4.0E-02 4Rev:importin beta:B23 recruited to the nuclear pore 58 4.6E-02 2Translocation of Rev:importin-beta:B23 to the nucleus 58 4.6E-02 2Cell-Cell communication 137 4.6E-02 3Nuclear import of Rev protein 60 4.9E-02 2Cell-cell junction organization 61 5.0E-02 2
212