the$uk$foodservice$market$– … stenning paper... ·...
TRANSCRIPT
The UK Foodservice Market – The complexity, the trends, and the opportuni<es
MCA. 2016 © | Oxford Farming Conference, the UK Foodservice Market, Jan 2017
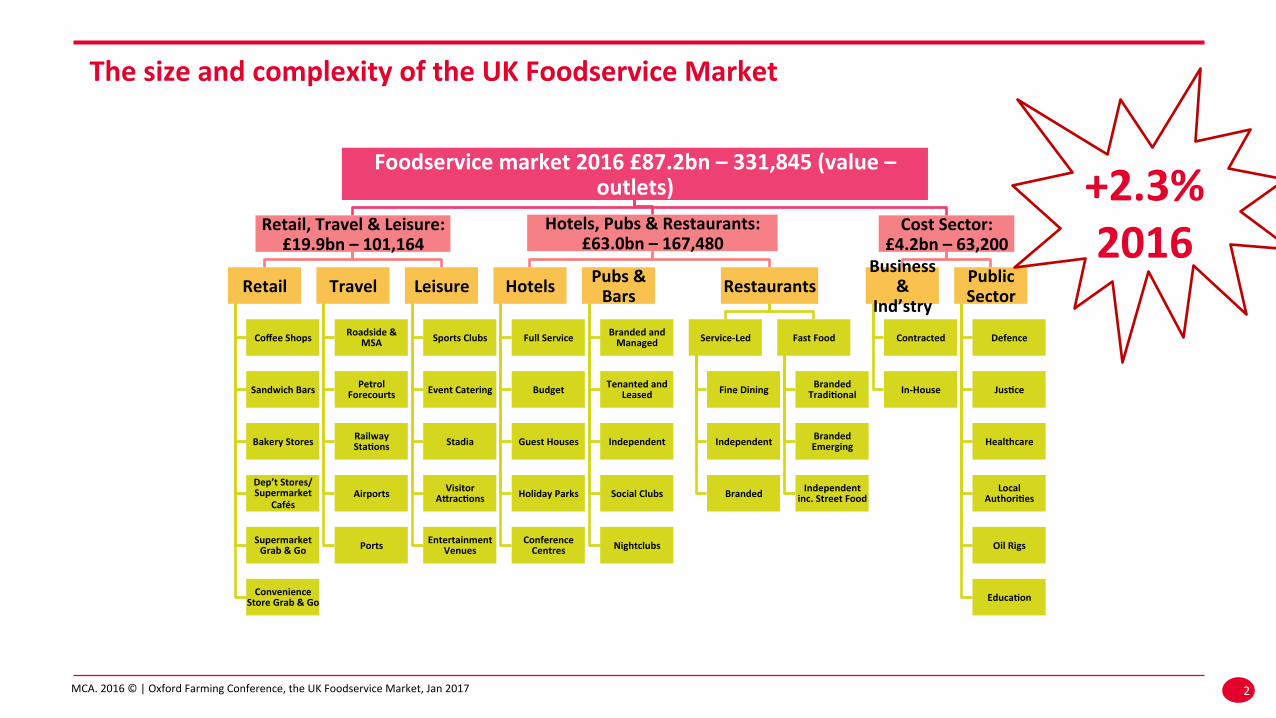
The size and complexity of the UK Foodservice Market
2
Foodservice market 2016 £87.2bn – 331,845 (value – outlets)
Retail, Travel & Leisure: £19.9bn – 101,164
Retail
Coffee Shops
Sandwich Bars
Bakery Stores
Dep’t Stores/ Supermarket
Cafés
Supermarket Grab & Go
Convenience Store Grab & Go
Travel
Roadside & MSA
Petrol Forecourts
Railway Sta<ons
Airports
Ports
Leisure
Sports Clubs
Event Catering
Stadia
Visitor Aarac<ons
Entertainment Venues
Hotels, Pubs & Restaurants: £63.0bn – 167,480
Hotels
Full Service
Budget
Guest Houses
Holiday Parks
Conference Centres
Pubs & Bars
Branded and Managed
Tenanted and Leased
Independent
Social Clubs
Nightclubs
Restaurants
Service-‐Led
Fine Dining
Independent
Branded
Fast Food
Branded Tradi<onal
Branded Emerging
Independent inc. Street Food
Cost Sector: £4.2bn – 63,200
Business &
Ind’stry Contracted
In-‐House
Public Sector
Defence
Jus<ce
Healthcare
Local Authori<es
Oil Rigs
Educa<on
+2.3% 2016
MCA. 2016 © | Oxford Farming Conference, the UK Foodservice Market, Jan 2017
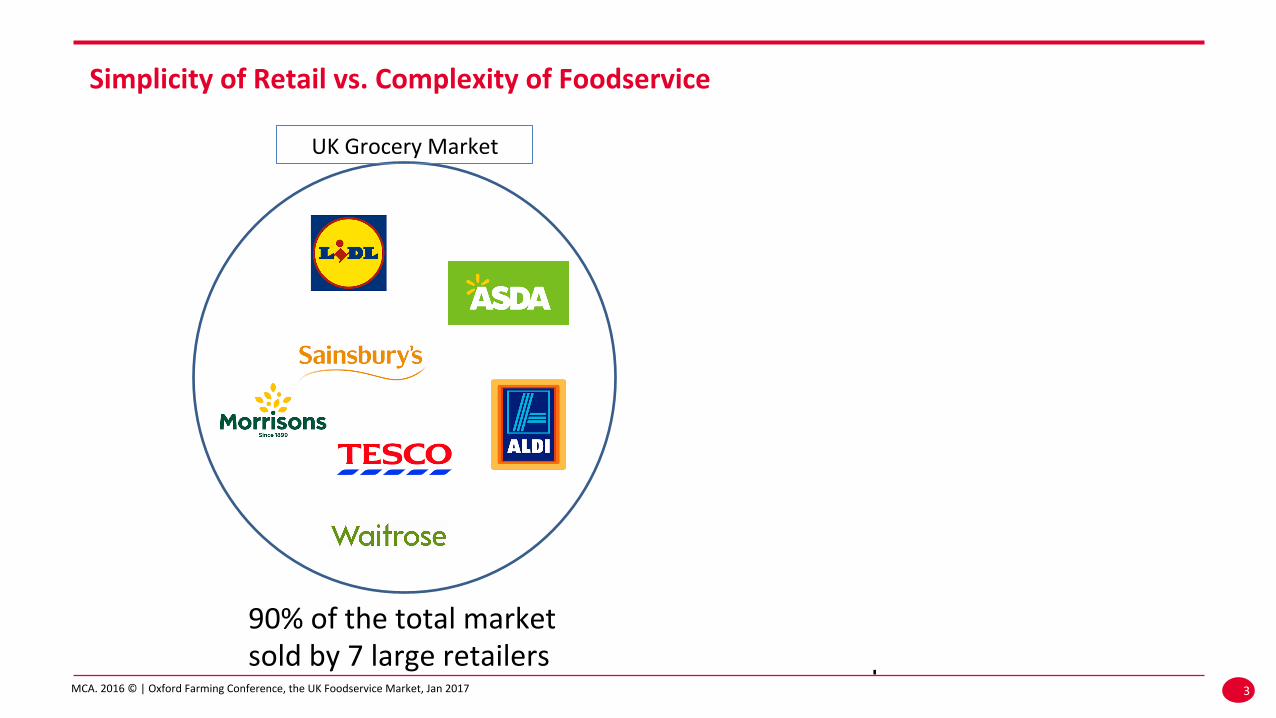
Simplicity of Retail vs. Complexity of Foodservice
3
UK Grocery Market UK Foodservice Market
90% of the total market sold by 7 large retailers
>300k outlets with c.200k companies
from
to from
to
MCA. 2016 © | Oxford Farming Conference, the UK Foodservice Market, Jan 2017
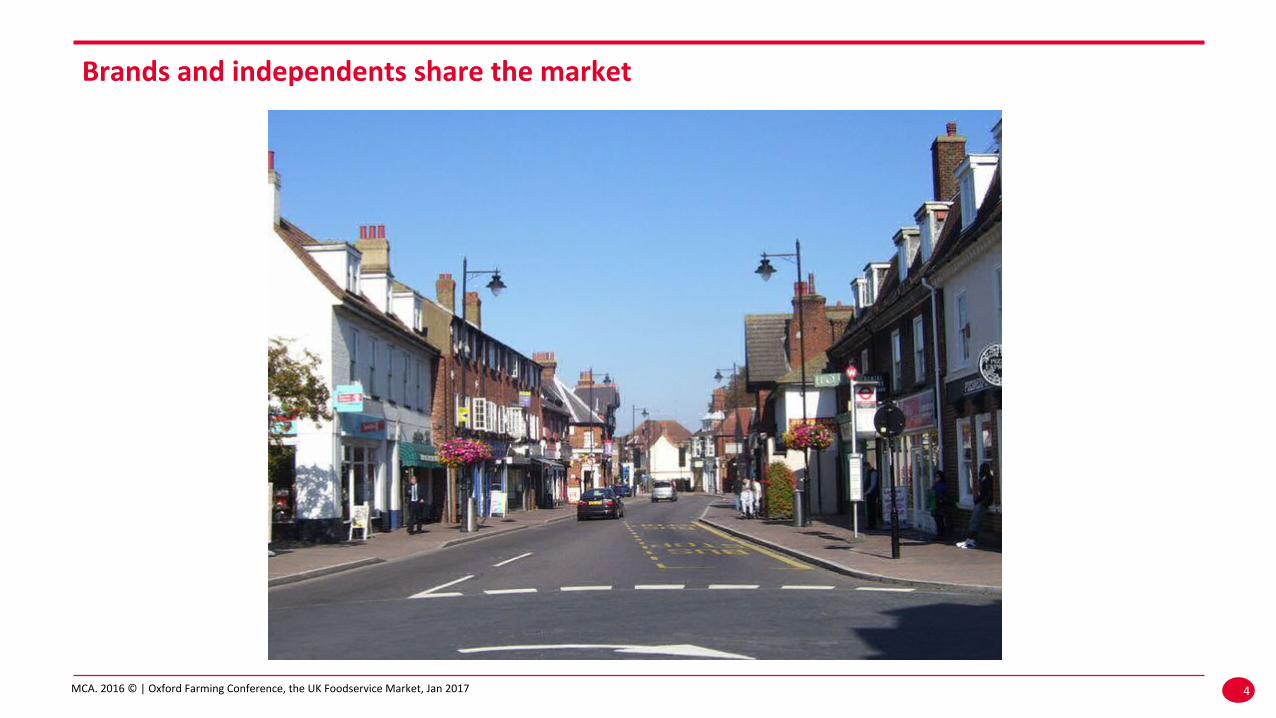
Brands and independents share the market
4
MCA. 2016 © | Oxford Farming Conference, the UK Foodservice Market, Jan 2017
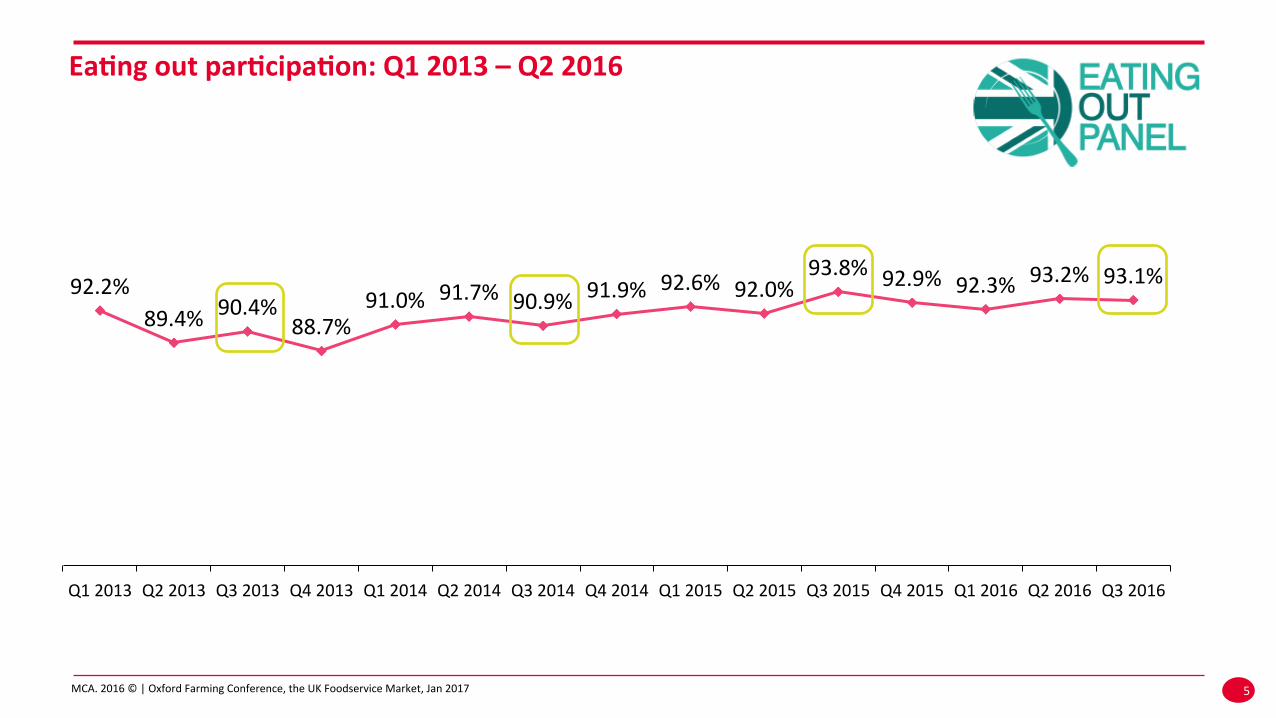
92.2% 89.4% 90.4% 88.7%
91.0% 91.7% 90.9% 91.9% 92.6% 92.0%
93.8% 92.9% 92.3% 93.2% 93.1%
Q1 2013 Q2 2013 Q3 2013 Q4 2013 Q1 2014 Q2 2014 Q3 2014 Q4 2014 Q1 2015 Q2 2015 Q3 2015 Q4 2015 Q1 2016 Q2 2016 Q3 2016
Ea<ng out par<cipa<on: Q1 2013 – Q2 2016
5
MCA. 2016 © | Oxford Farming Conference, the UK Foodservice Market, Jan 2017
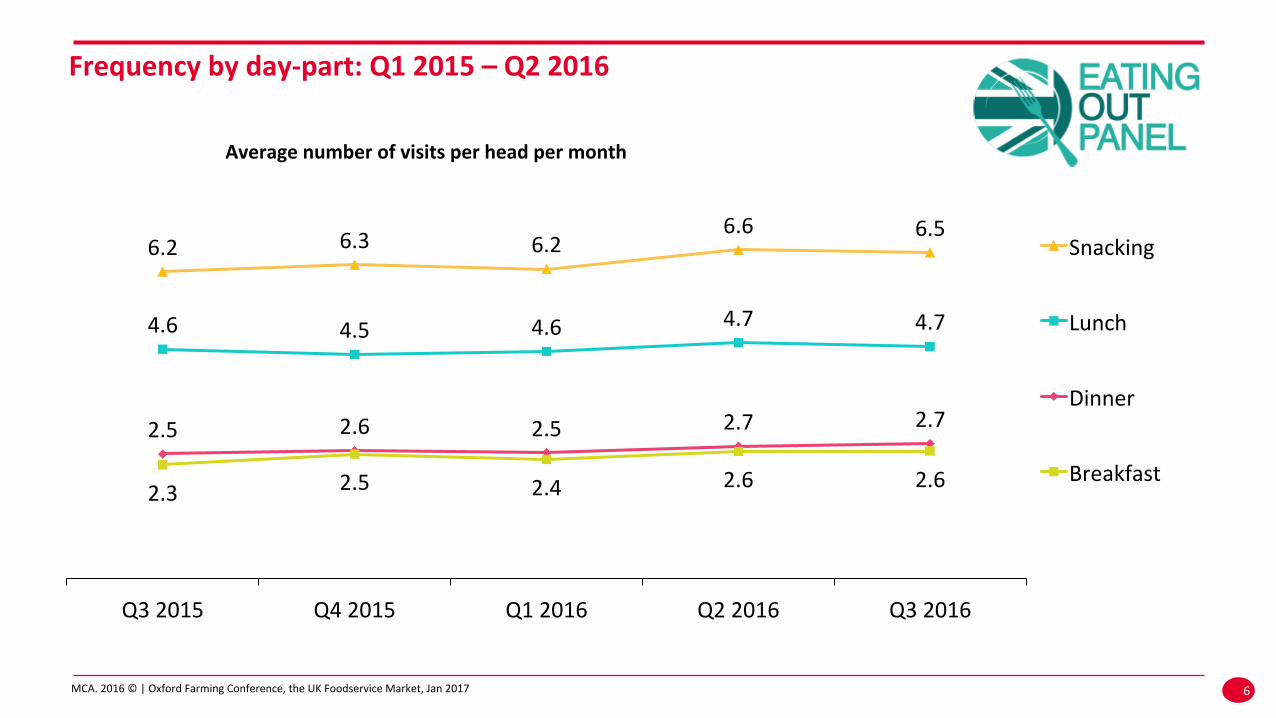
Average number of visits per head per month
Frequency by day-‐part: Q1 2015 – Q2 2016
6
6.2 6.3 6.2 6.6 6.5
4.6 4.5 4.6 4.7 4.7
2.5 2.6 2.5 2.7 2.7
2.3 2.5 2.4 2.6 2.6
Q3 2015 Q4 2015 Q1 2016 Q2 2016 Q3 2016
Snacking
Lunch
Dinner
Breakfast
MCA. 2016 © | Oxford Farming Conference, the UK Foodservice Market, Jan 2017
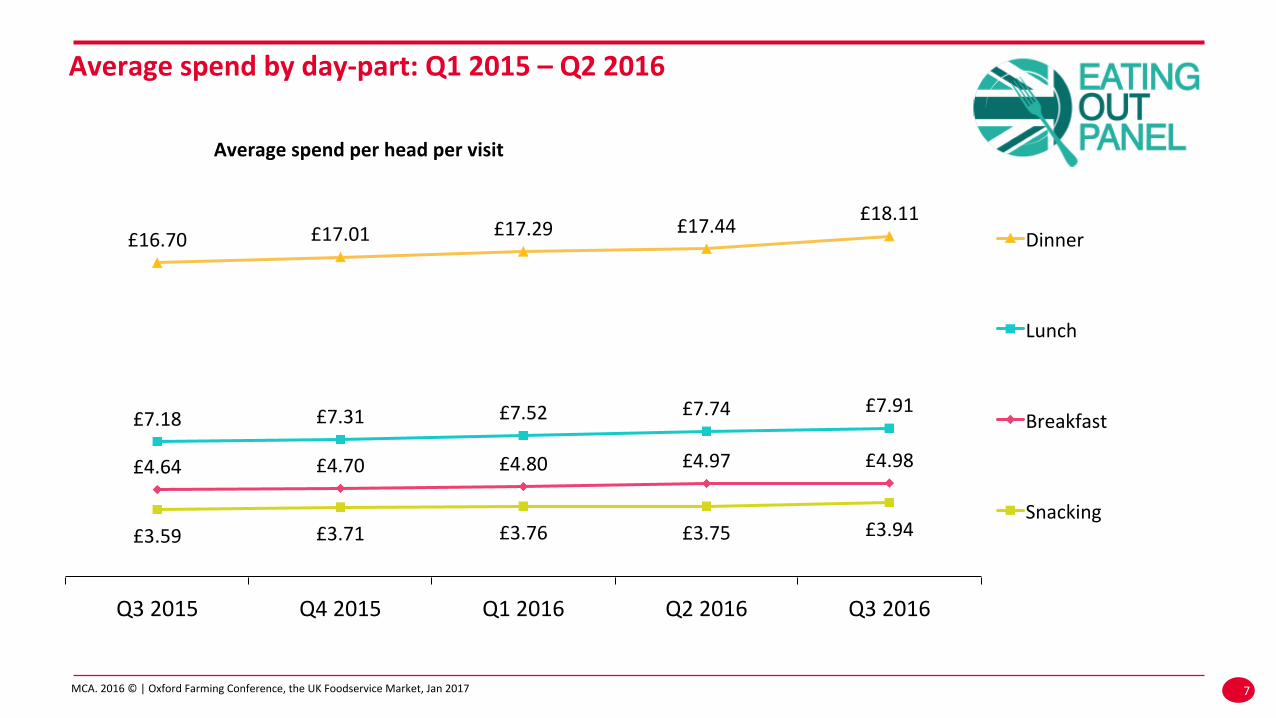
Average spend by day-‐part: Q1 2015 – Q2 2016
7
Average spend per head per visit
£16.70 £17.01 £17.29 £17.44 £18.11
£7.18 £7.31 £7.52 £7.74 £7.91
£4.64 £4.70 £4.80 £4.97 £4.98
£3.59 £3.71 £3.76 £3.75 £3.94
Q3 2015 Q4 2015 Q1 2016 Q2 2016 Q3 2016
Dinner
Lunch
Breakfast
Snacking
MCA. 2016 © | Oxford Farming Conference, the UK Foodservice Market, Jan 2017
The Ageing Consumer
8 10
MCA. 2016 © | Oxford Farming Conference, the UK Foodservice Market, Jan 2017 9
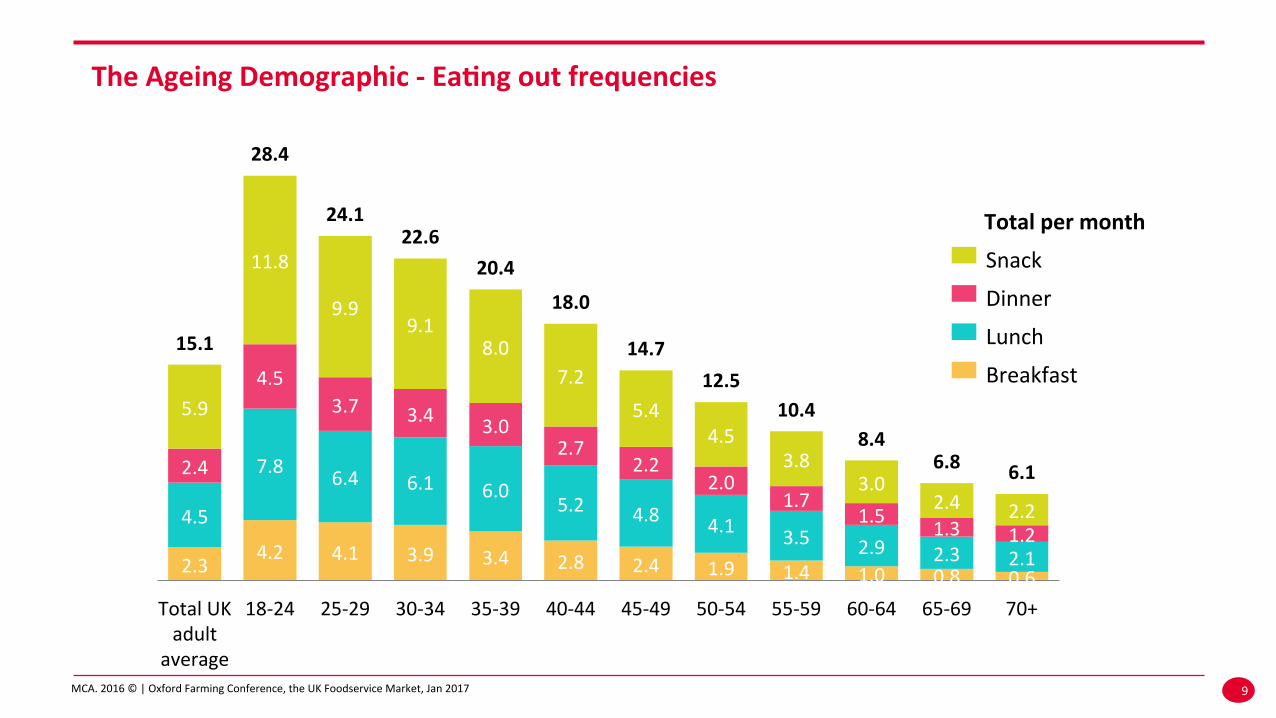
The Ageing Demographic -‐ Ea<ng out frequencies
2.3 4.2 4.1 3.9 3.4 2.8 2.4 1.9 1.4 1.0 0.8 0.6
4.5
7.8 6.4 6.1 6.0 5.2 4.8 4.1 3.5 2.9 2.3 2.1
2.4
4.5 3.7 3.4 3.0
2.7 2.2
2.0 1.7
1.5 1.3 1.2
5.9
11.8
9.9 9.1
8.0 7.2
5.4 4.5
3.8 3.0
2.4 2.2
15.1
28.4
24.1 22.6
20.4
18.0
14.7 12.5
10.4 8.4
6.8 6.1
Total UK adult
average
18-‐24 25-‐29 30-‐34 35-‐39 40-‐44 45-‐49 50-‐54 55-‐59 60-‐64 65-‐69 70+
Total per month
Snack
Dinner
Lunch
Breakfast
MCA. 2016 © | Oxford Farming Conference, the UK Foodservice Market, Jan 2017
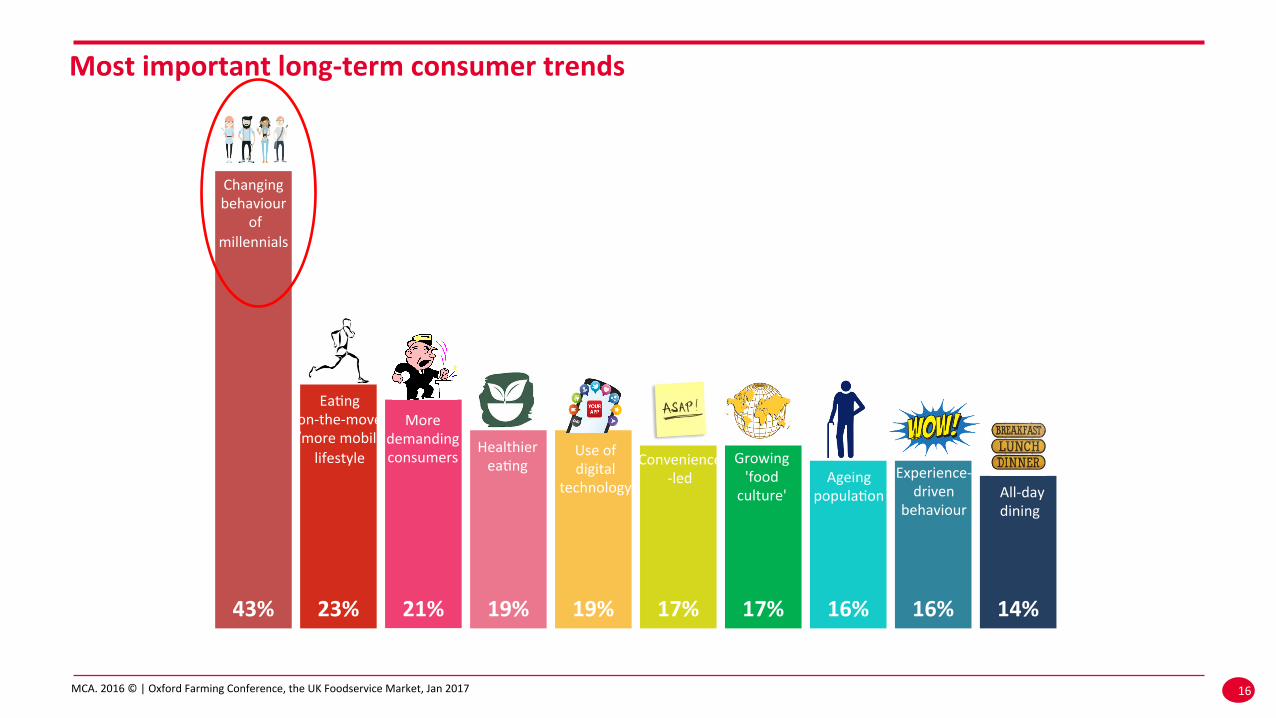
43% 23% 21% 19% 19% 17% 17% 16% 16% 14%
Most important long-‐term consumer trends
Changing behaviour of millennials Changing behaviour
of millennials
Ea\ng on-‐the-‐move /more mobile
lifestyle
More demanding consumers
Healthier ea\ng
Use of digital
technology
Convenience -‐led
Growing 'food culture'
Ageing popula\on
Experience-‐driven behaviour
Experience-‐driven
behaviour All-‐day dining
10 16
MCA. 2016 © | Oxford Farming Conference, the UK Foodservice Market, Jan 2017
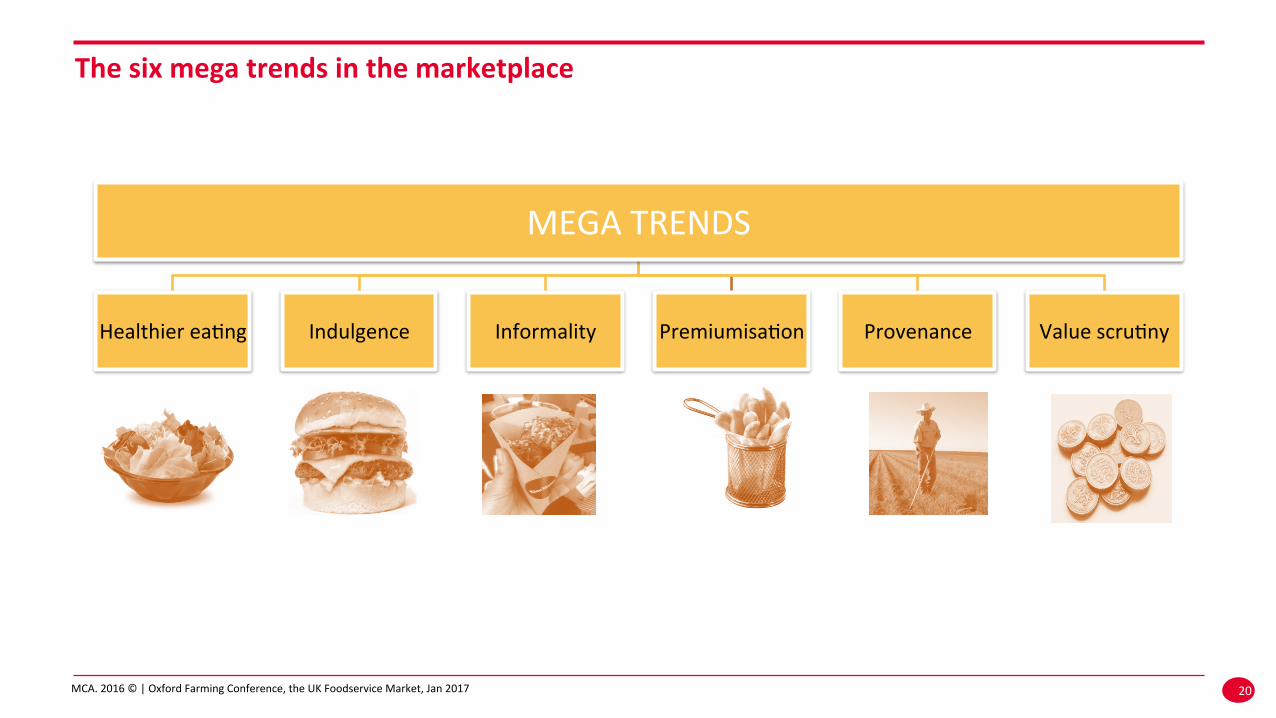
MEGA TRENDS
Value scru\ny Provenance Premiumisa\on Informality Indulgence Healthier ea\ng
The six mega trends in the marketplace
11 20
MCA. 2016 © | Oxford Farming Conference, the UK Foodservice Market, Jan 2017
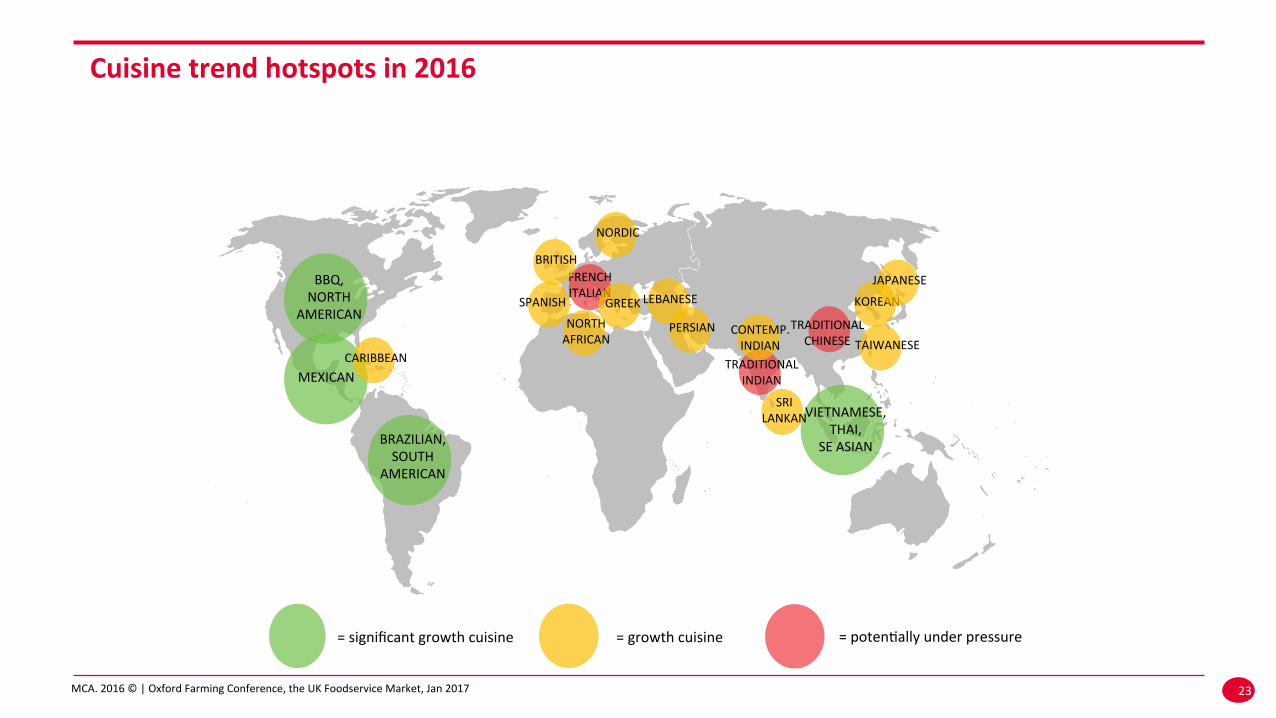
Cuisine trend hotspots in 2016
VIETNAMESE, THAI,
SE ASIAN
BBQ, NORTH
AMERICAN
BRAZILIAN, SOUTH
AMERICAN
FRENCH ITALIAN
NORTH AFRICAN
NORDIC
MEXICAN
SRI LANKAN
SPANISH
TRADITIONAL INDIAN
KOREAN LEBANESE
= significant growth cuisine = growth cuisine = poten\ally under pressure
BRITISH
CARIBBEAN
CONTEMP. INDIAN
TRADITIONAL CHINESE
JAPANESE
TAIWANESE
GREEK
PERSIAN
12 23
MCA. 2016 © | Oxford Farming Conference, the UK Foodservice Market, Jan 2017
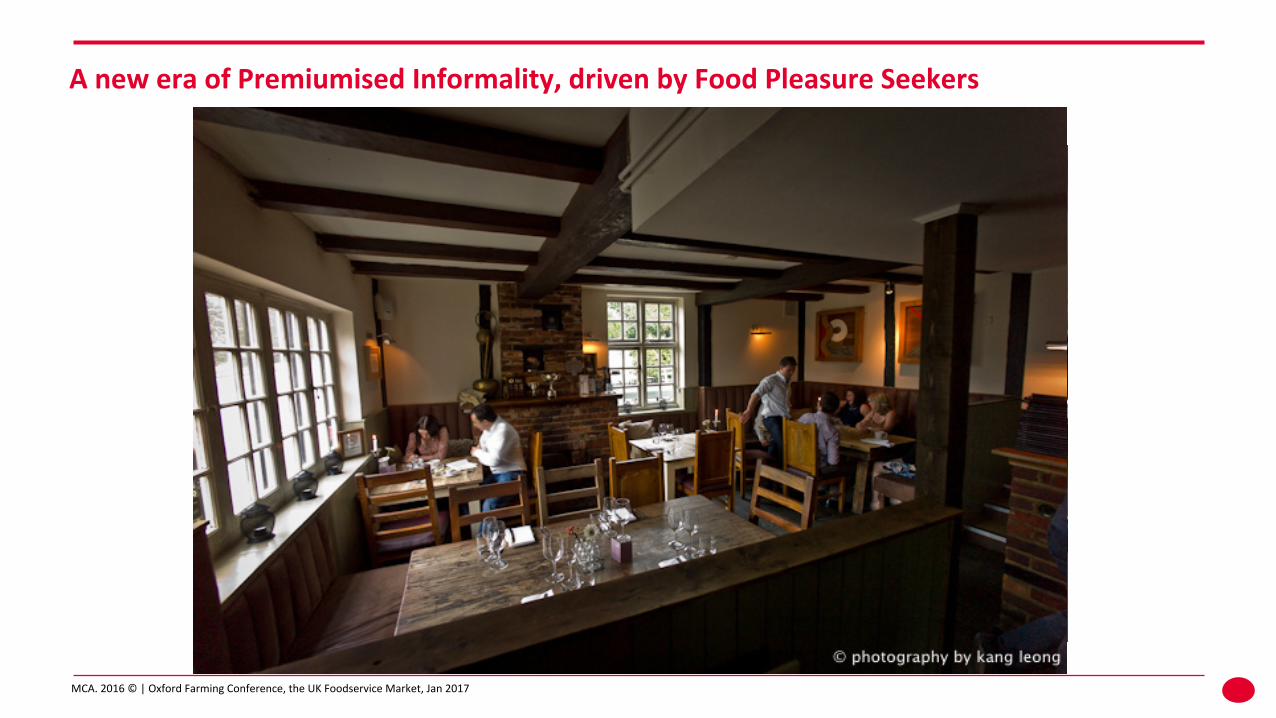
A new era of Premiumised Informality, driven by Food Pleasure Seekers
MCA. 2016 © | Oxford Farming Conference, the UK Foodservice Market, Jan 2017 14
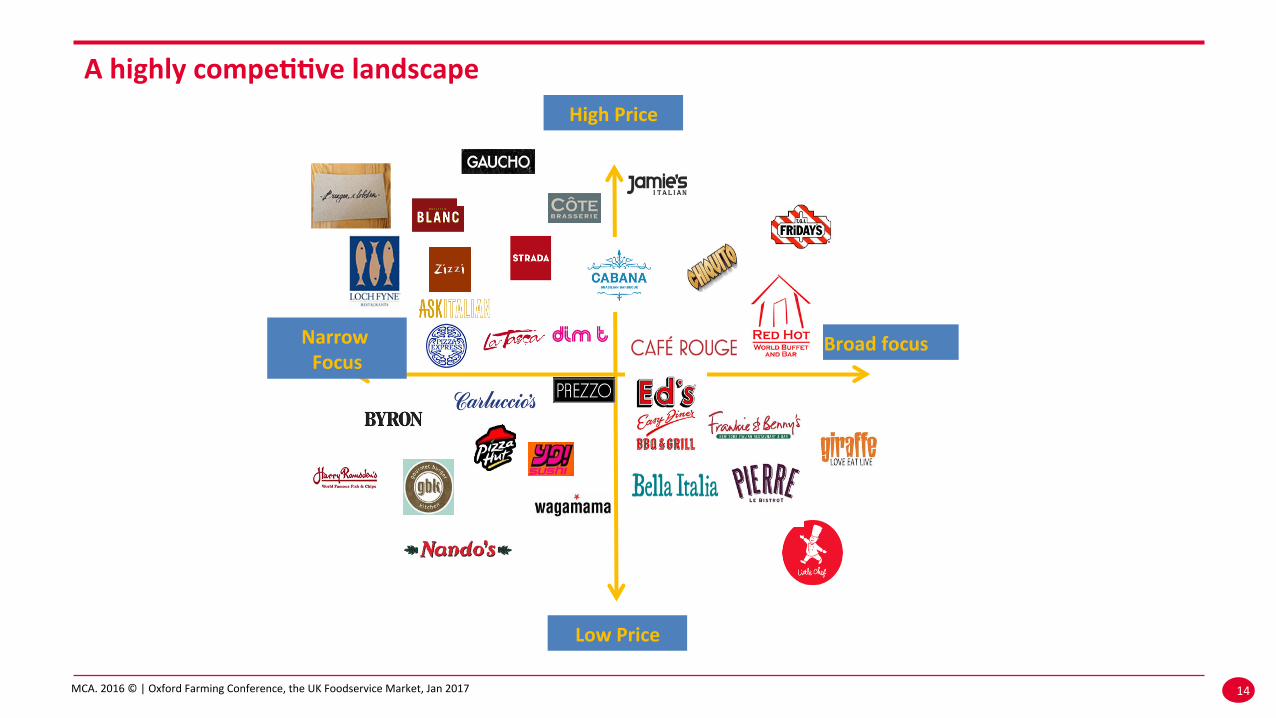
A highly compe<<ve landscape High Price
Narrow Focus
Broad focus
Low Price
MCA. 2016 © | Oxford Farming Conference, the UK Foodservice Market, Jan 2017
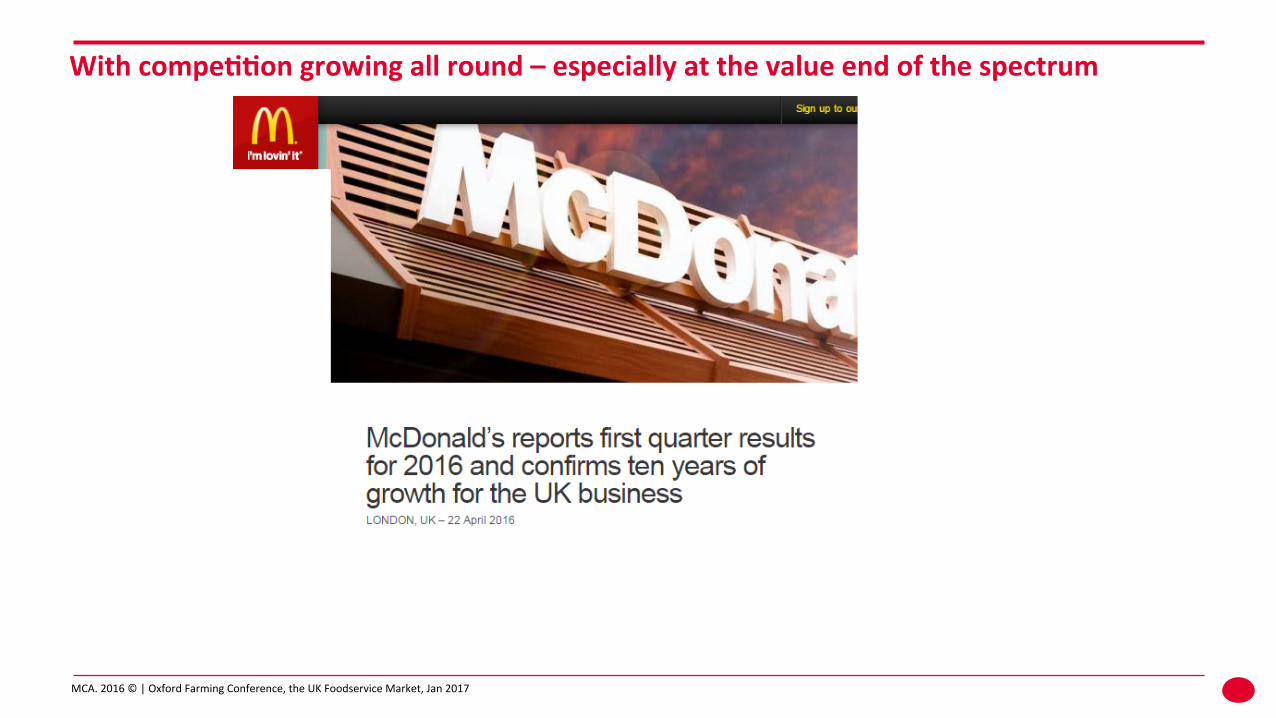
With compe<<on growing all round – especially at the value end of the spectrum
15
MCA. 2016 © | Oxford Farming Conference, the UK Foodservice Market, Jan 2017
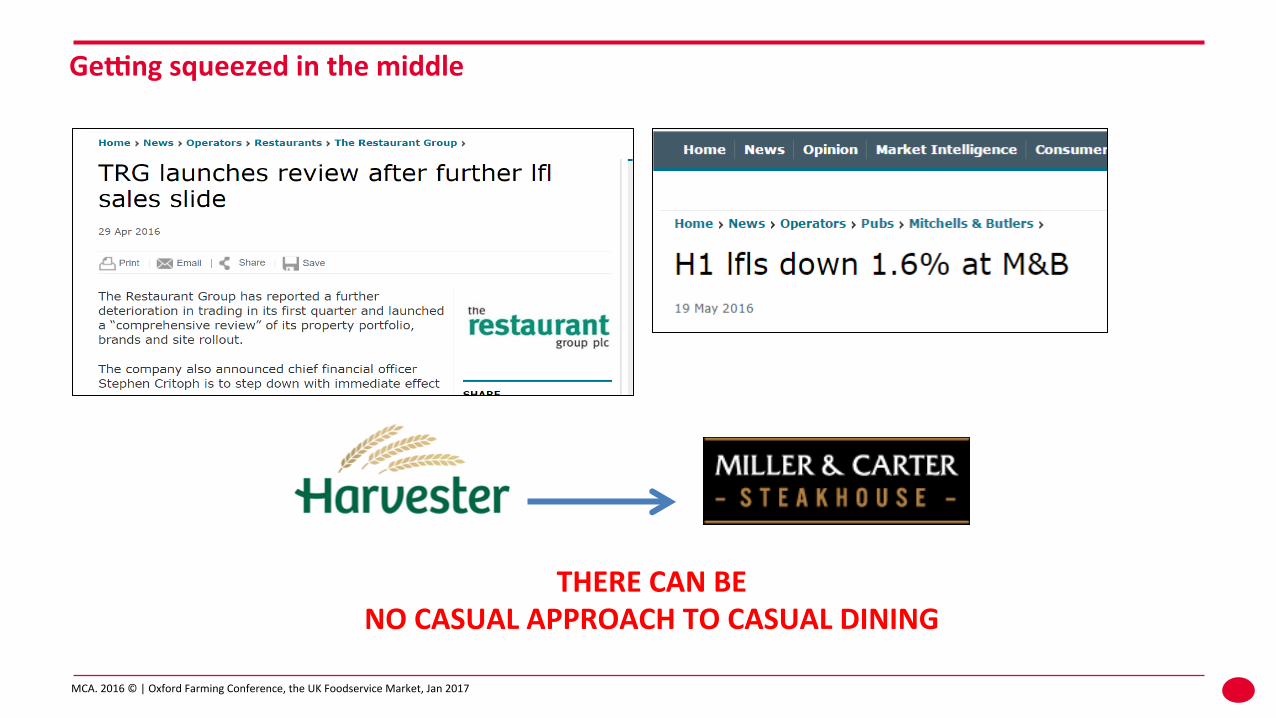
Gemng squeezed in the middle
16
THERE CAN BE NO CASUAL APPROACH TO CASUAL DINING
MCA. 2016 © | Oxford Farming Conference, the UK Foodservice Market, Jan 2017
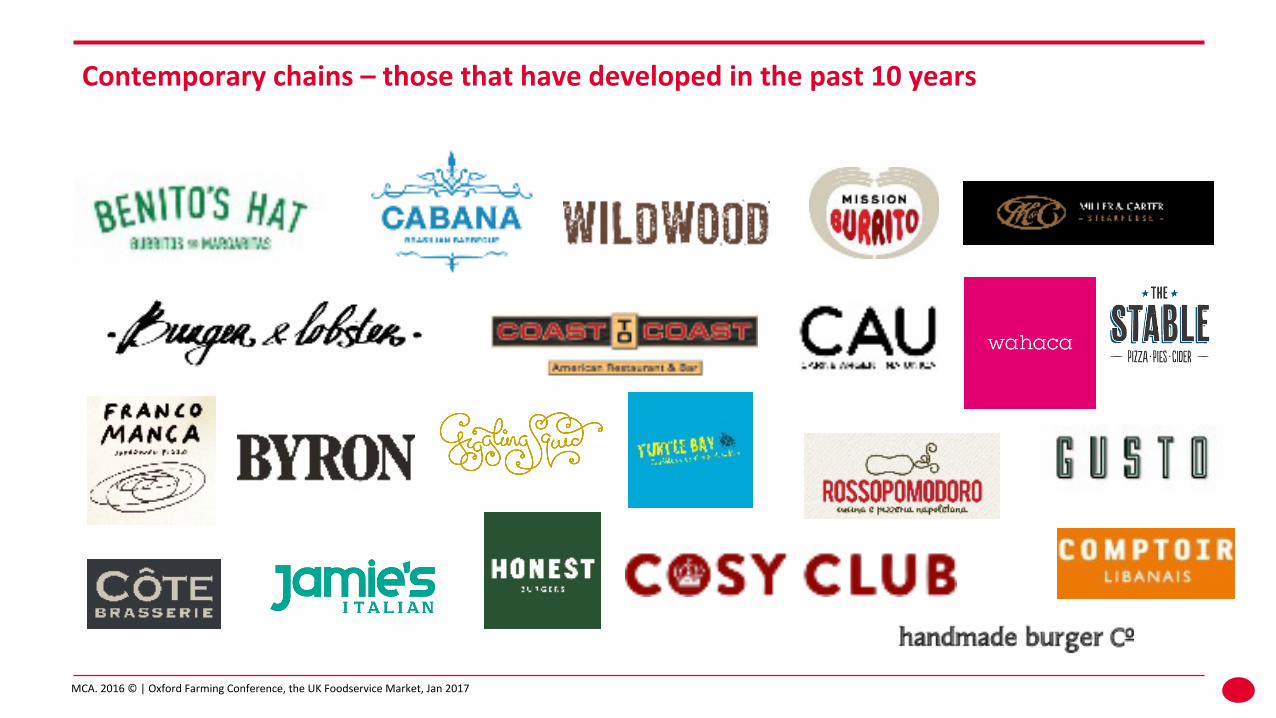
Contemporary chains – those that have developed in the past 10 years
MCA. 2016 © | Oxford Farming Conference, the UK Foodservice Market, Jan 2017
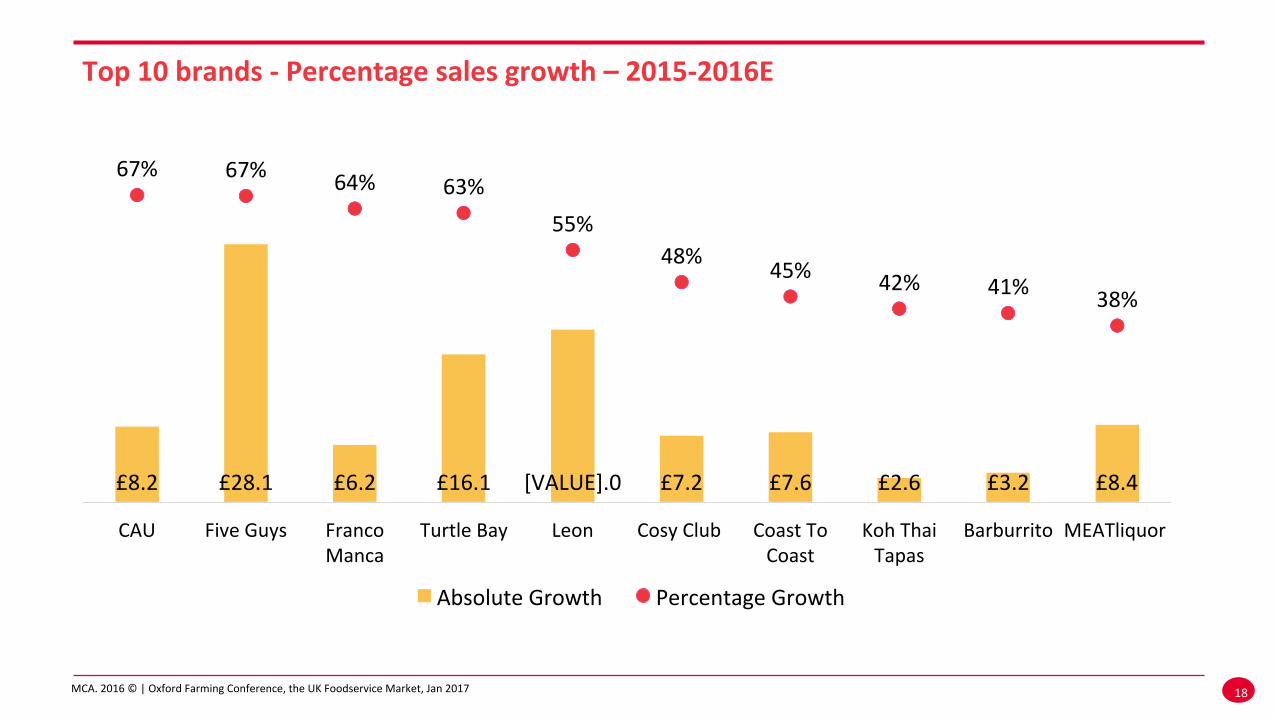
Top 10 brands -‐ Percentage sales growth – 2015-‐2016E
18
£8.2 £28.1 £6.2 £16.1 [VALUE].0 £7.2 £7.6 £2.6 £3.2 £8.4
67% 67% 64% 63% 55%
48% 45% 42% 41% 38%
CAU Five Guys Franco Manca
Turtle Bay Leon Cosy Club Coast To Coast
Koh Thai Tapas
Barburrito MEATliquor
Absolute Growth Percentage Growth
MCA. 2016 © | Oxford Farming Conference, the UK Foodservice Market, Jan 2017
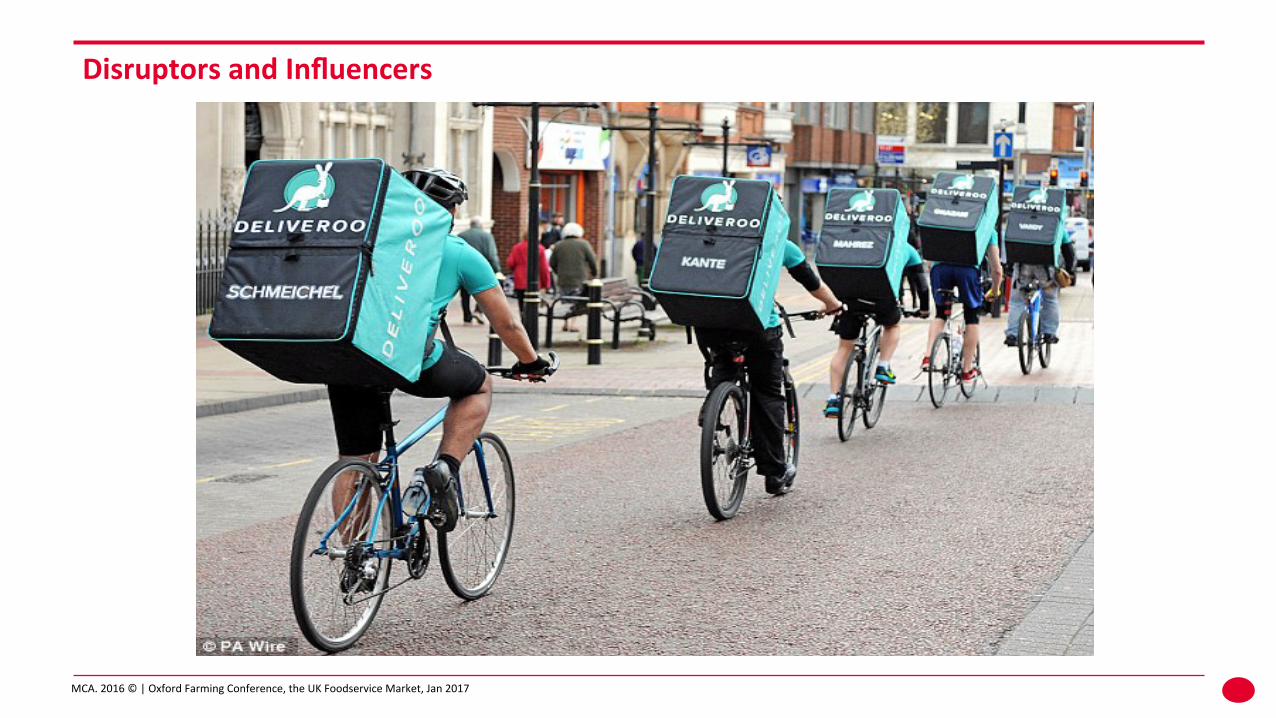
Disruptors and Influencers
MCA. 2016 © | Oxford Farming Conference, the UK Foodservice Market, Jan 2017
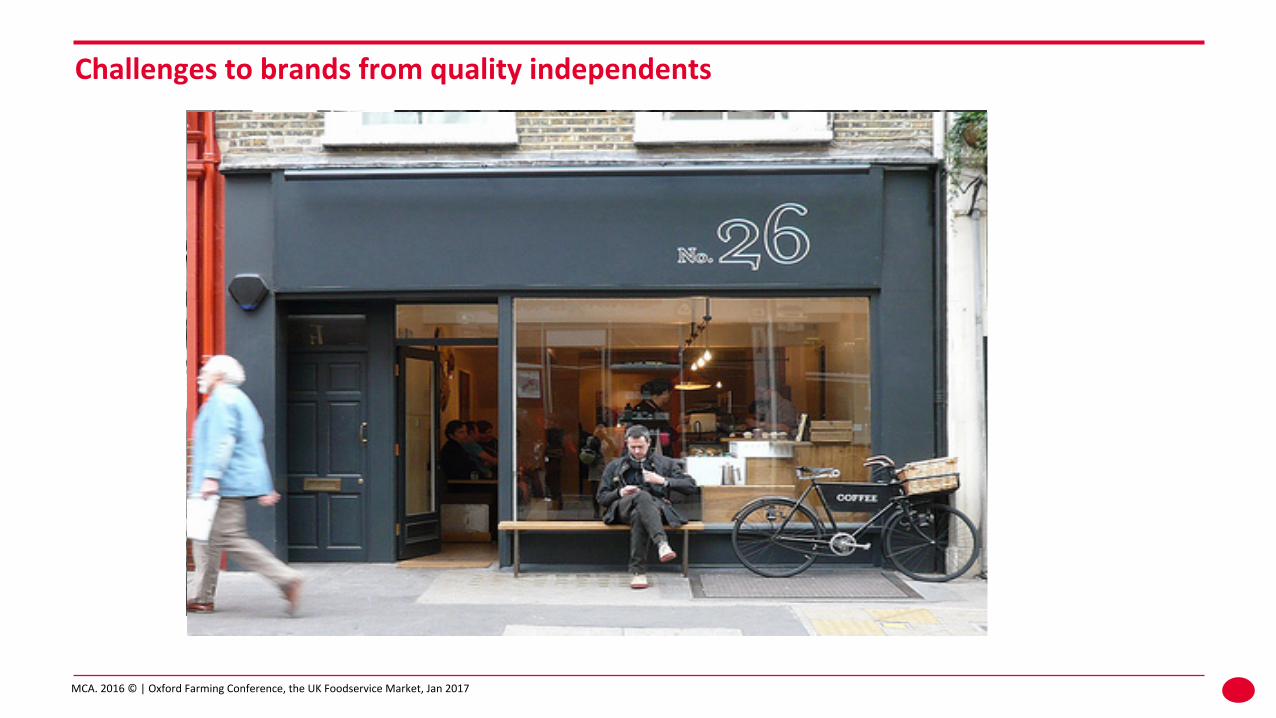
Challenges to brands from quality independents
MCA. 2016 © | Oxford Farming Conference, the UK Foodservice Market, Jan 2017
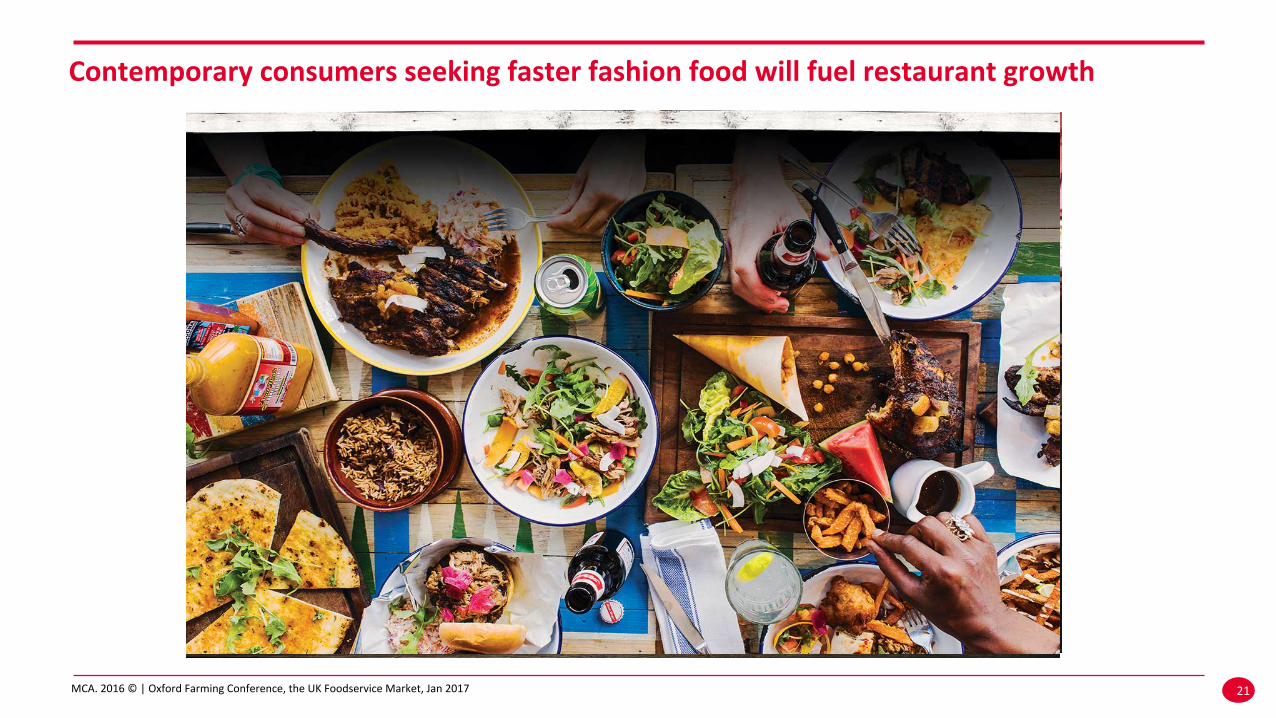
Contemporary consumers seeking faster fashion food will fuel restaurant growth
21
MCA. 2016 © | Oxford Farming Conference, the UK Foodservice Market, Jan 2017
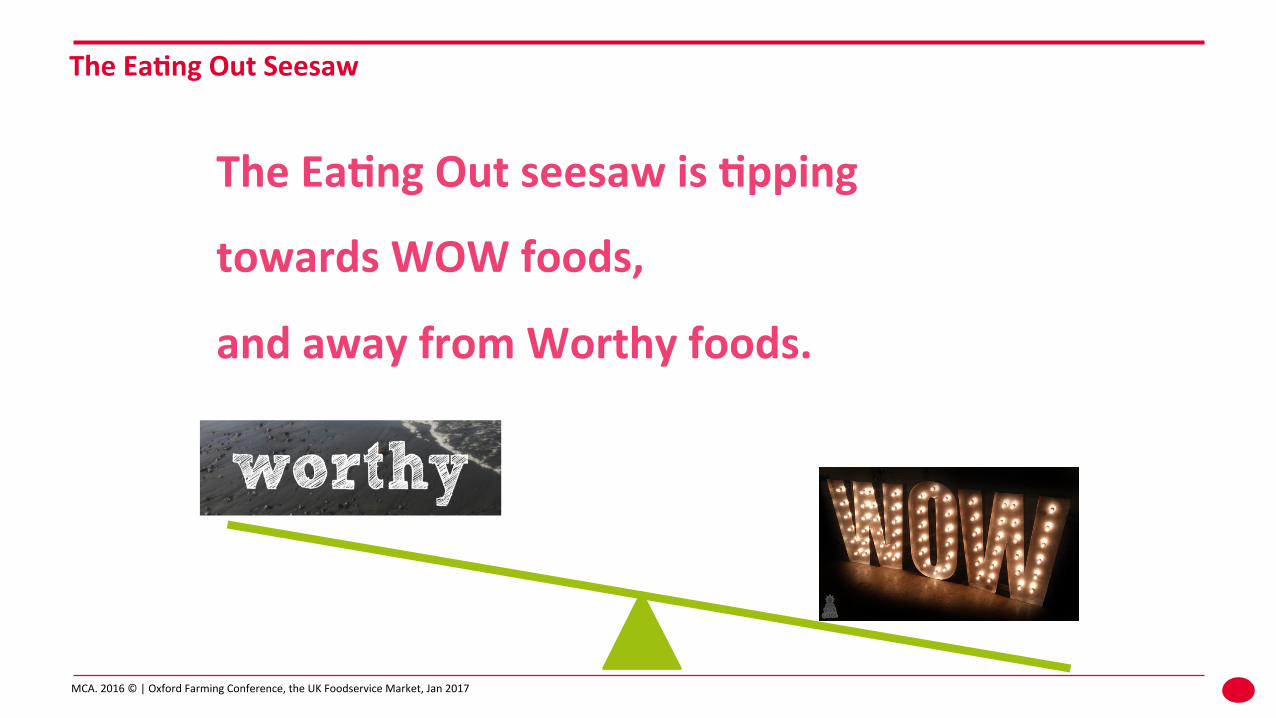
The Ea<ng Out Seesaw
22
The Ea<ng Out seesaw is <pping
towards WOW foods,
and away from Worthy foods.
MCA. 2016 © | Oxford Farming Conference, the UK Foodservice Market, Jan 2017
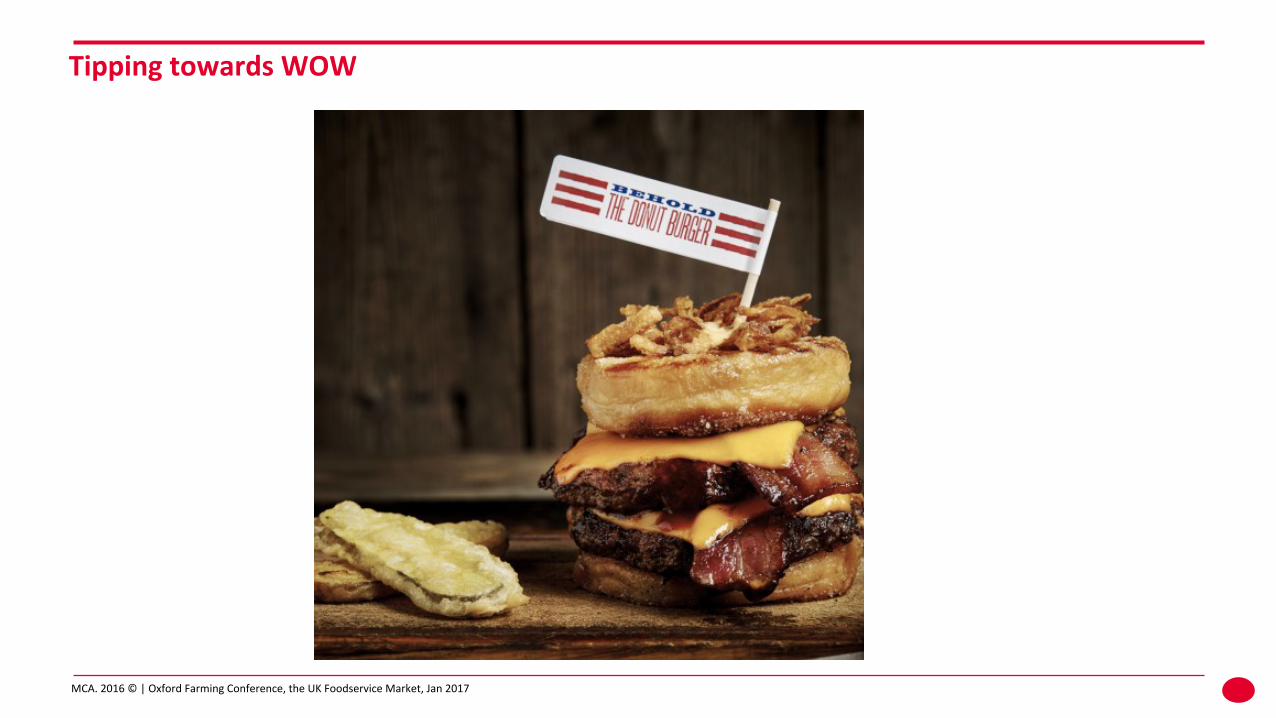
Tipping towards WOW
23
MCA. 2016 © | Oxford Farming Conference, the UK Foodservice Market, Jan 2017
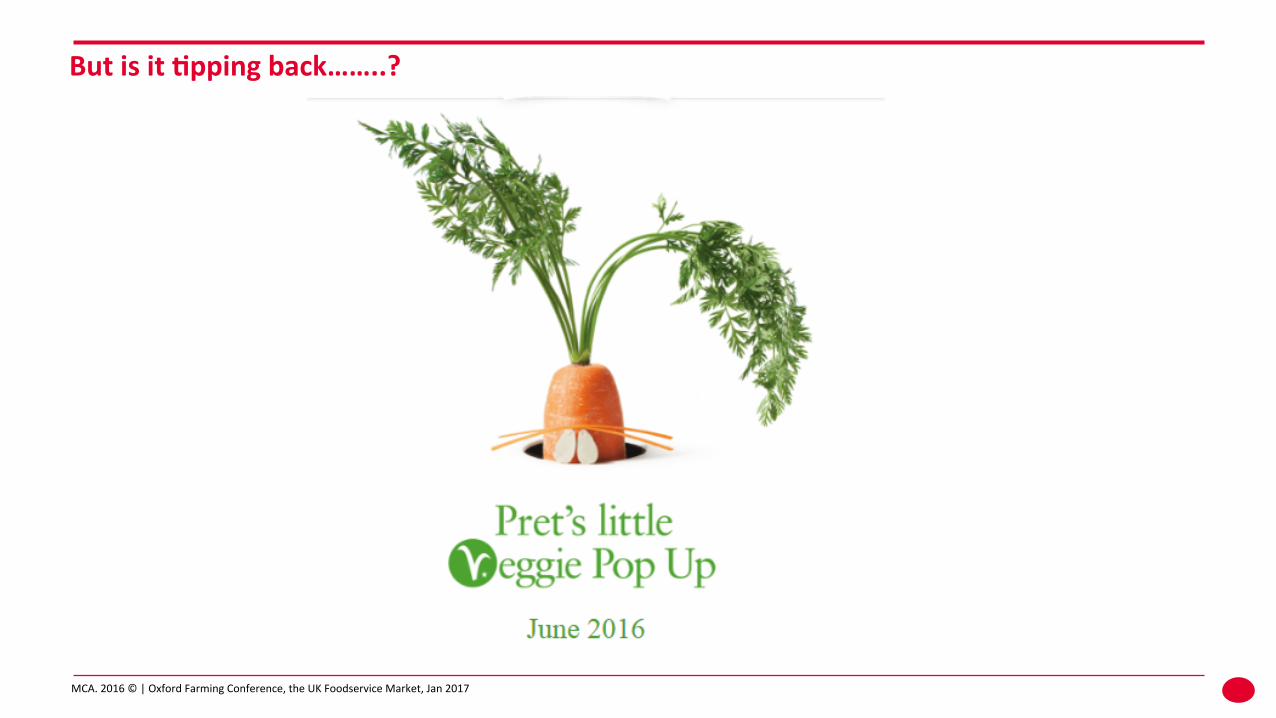
But is it <pping back……..?
24
MCA. 2016 © | Oxford Farming Conference, the UK Foodservice Market, Jan 2017
The future?
MCA. 2016 © | Oxford Farming Conference, the UK Foodservice Market, Jan 2017
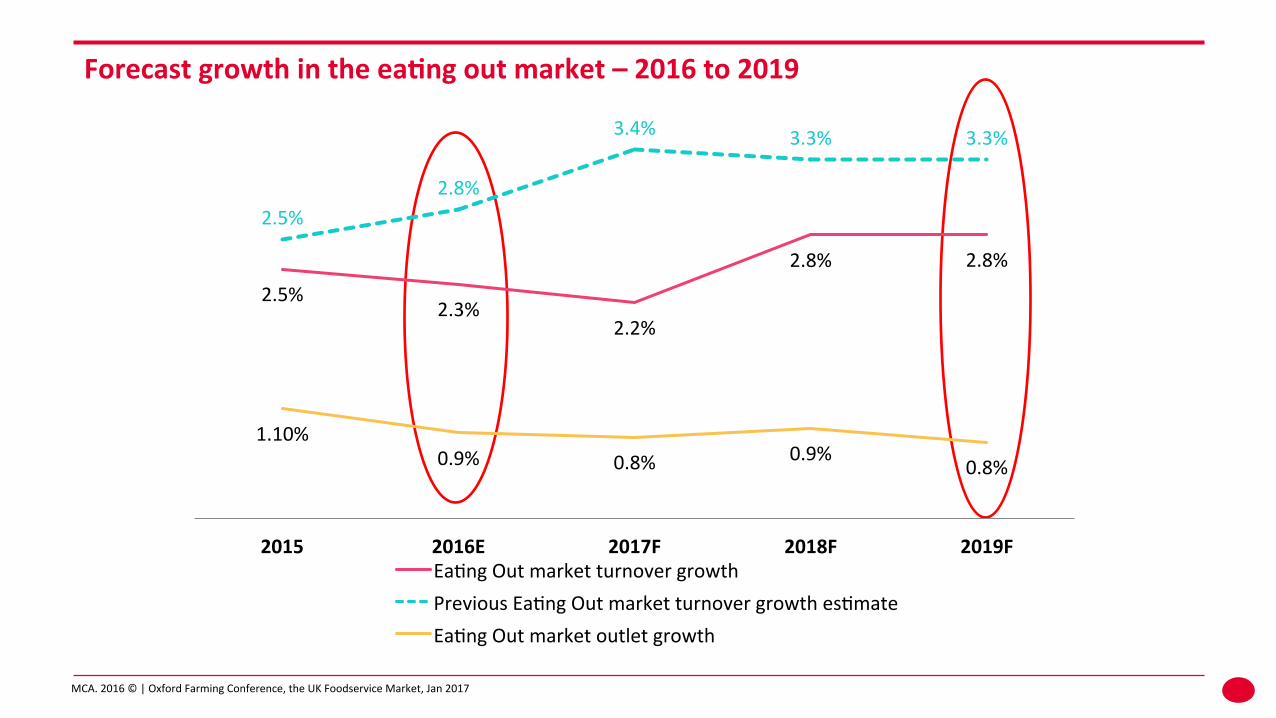
Forecast growth in the ea<ng out market – 2016 to 2019
26
2.5% 2.3%
2.2%
2.8% 2.8%
2.5% 2.8%
3.4% 3.3% 3.3%
1.10% 0.9% 0.8% 0.9%
0.8%
2015 2016E 2017F 2018F 2019F Ea\ng Out market turnover growth Previous Ea\ng Out market turnover growth es\mate Ea\ng Out market outlet growth
MCA. 2016 © | Oxford Farming Conference, the UK Foodservice Market, Jan 2017
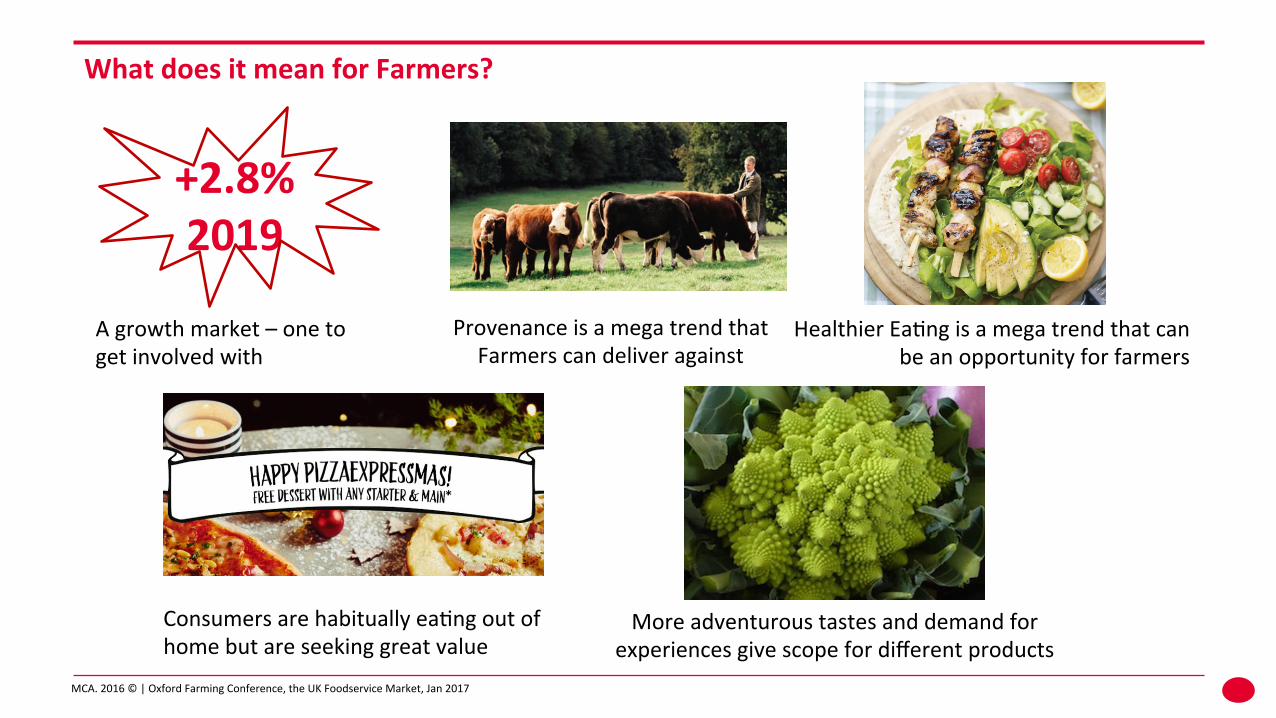
What does it mean for Farmers?
A growth market – one to get involved with
Provenance is a mega trend that Farmers can deliver against
Healthier Ea\ng is a mega trend that can be an opportunity for farmers
Consumers are habitually ea\ng out of home but are seeking great value
More adventurous tastes and demand for experiences give scope for different products
+2.8% 2019
Thank you! MCA-‐Insight.com simon.stenning@MCA-‐Insight.com