thiago oliveira nunan and homero delboni junior mining · thiago oliveira nunan and homero delboni...
TRANSCRIPT
347
Thiago Oliveira Nunan and Homero Delboni Junior
REM, Int. Eng. J., Ouro Preto, 70(3), 347-355, jul. sep. | 2017
Abstract
Increasing throughput during the mining cycle operation frequently generates sig-nificant capital gains for a company. However, it is necessary to evaluate plant capacity and expand it for obtaining the required throughput increase. Therefore, studies includ-ing different scenarios, installation of new equipment and/or optimization of existing ones are required. This study describes the sampling methodology, sample characteriza-tion, modeling and simulation of Mineração Serra Grande industrial grinding circuit, an AngloGold Ashanti company, located in Crixás, State of Goiás, Brazil. The studied scenarios were: (1) adding a third ball mill in series with existing two ball mills, (2) add-ing a third ball mill in parallel with existing mills, (3) adding a vertical mill in series with existing mills and (4) adding high pressure grinding rolls to existing mills. The four sim-ulations were carried out for designing the respective circuit, assessing the interference with existing equipment and installations, as well as comparing the energy consumption among the selected expansion alternatives. Apart from the HPGR alternative, all other three simulations resulted in the required P80 and capacity. Among the three selected simulations, the Vertimill alternative showed the smallest installed power.
Keywords: modeling, grinding, ball milling, vertical milling, simulations.
Thiago Oliveira NunanEngenheiro de Processo
AngloGold Ashanti
Nova Lima – Minas Gerais – Brasil
Homero Delboni JuniorProfessor
Universidade de São Paulo - USP
Escola Politécnica
Departamento de Engenharia de Minas e Petróleo
Simulation of the Mineração Serra Grande Industrial Grinding Circuit
MiningMineração
http://dx.doi.org/10.1590/0370-44672016700114
1. Introduction
Mineração Serra Grande is a gold mining operation located in Crixás, State
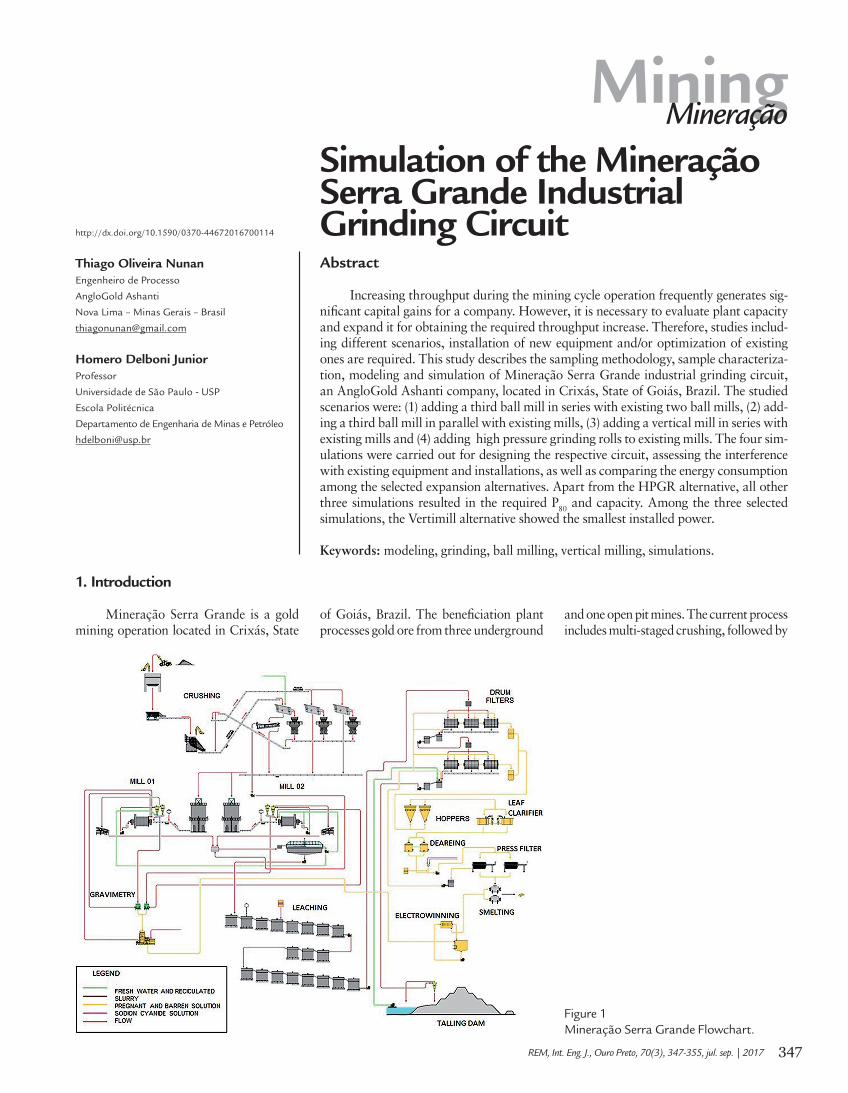
of Goiás, Brazil. The beneficiation plant processes gold ore from three underground
and one open pit mines. The current process includes multi-staged crushing, followed by
Figure 1Mineração Serra Grande Flowchart.
348
Simulation of the Mineração Serra Grande Industrial Grinding Circuit
REM, Int. Eng. J., Ouro Preto, 70(3), 347-355, jul. sep. | 2017
ball milling in closed configuration with hydrocyclones. A gravity concentration circuit is fed by part of the circulating load, while the grinding circuit product is thick-ened and leached with sodium cyanide. After leaching, the pulp is filtered, clarified and precipitated with zinc (Merrill Crowe process). The solid tailings are pumped to the tailings dam. Gold is thus produced from both Merrill Crowe and gravimetric circuits. Figure 1 shows the current Serra
Grande plant flow sheet. Mineração Serra Grande (MSG) started its operation in October 1989 with a single ball mill, pro-cessing 1,200 t of ore per day. Currently, plant capacity is approximately 3,600 t/day.
In 2008, the circuit was expanded by installing new equipment, together with various other actions, such as employing a better pumping system, hydrocyclone op-timization, adequate ball charge, installing grates in the existing ball mill, as well as
automation in the circuit. Further produc-tion increase was then focused on installing new equipment.
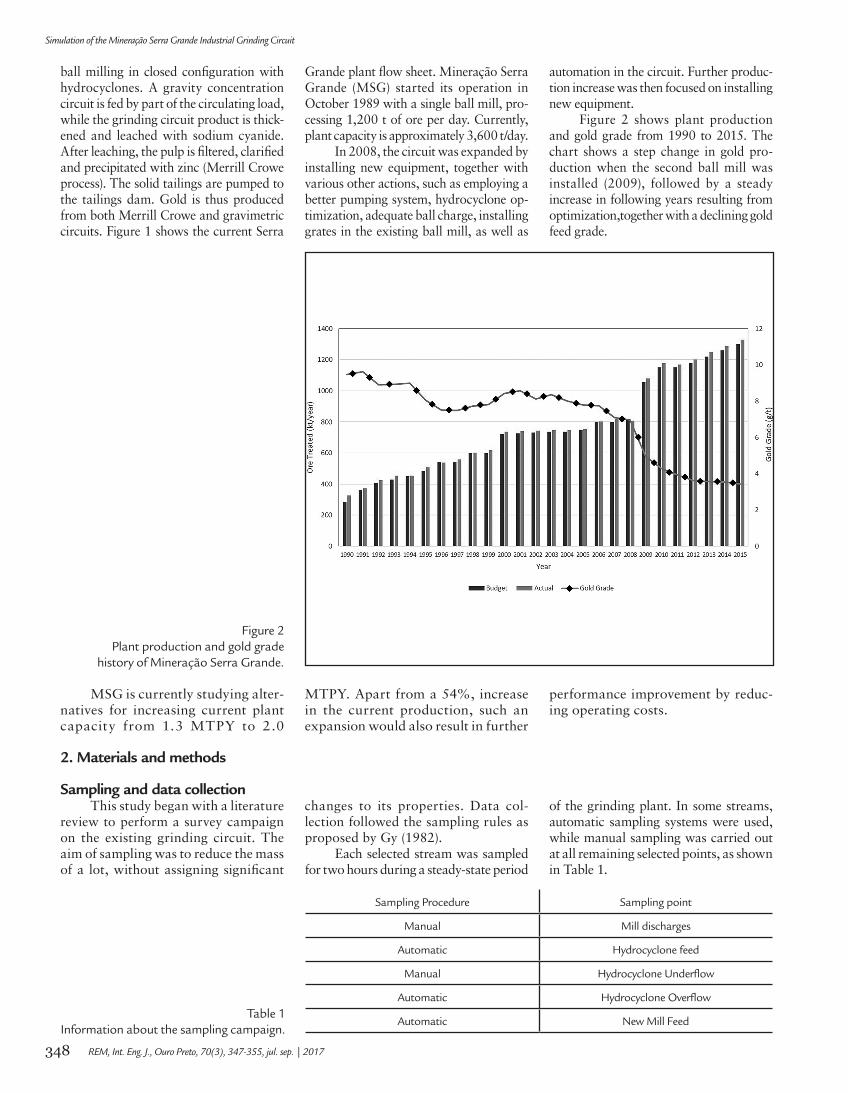
Figure 2 shows plant production and gold grade from 1990 to 2015. The chart shows a step change in gold pro-duction when the second ball mill was installed (2009), followed by a steady increase in following years resulting from optimization,together with a declining gold feed grade.
Figure 2Plant production and gold grade
history of Mineração Serra Grande.
MSG is currently studying alter-natives for increasing current plant capacity from 1.3 MTPY to 2.0
MTPY. Apart from a 54%, increase in the current production, such an expansion would also result in further
performance improvement by reduc-ing operating costs.
2. Materials and methods
Sampling and data collectionThis study began with a literature
review to perform a survey campaign on the existing grinding circuit. The aim of sampling was to reduce the mass of a lot, without assigning significant
changes to its properties. Data col-lection followed the sampling rules as proposed by Gy (1982).
Each selected stream was sampled for two hours during a steady-state period
of the grinding plant. In some streams, automatic sampling systems were used, while manual sampling was carried out at all remaining selected points, as shown in Table 1.
Sampling Procedure Sampling point
Manual Mill discharges
Automatic Hydrocyclone feed
Manual Hydrocyclone Underflow
Automatic Hydrocyclone Overflow
Automatic New Mill FeedTable 1
Information about the sampling campaign.
349
Thiago Oliveira Nunan and Homero Delboni Junior
REM, Int. Eng. J., Ouro Preto, 70(3), 347-355, jul. sep. | 2017
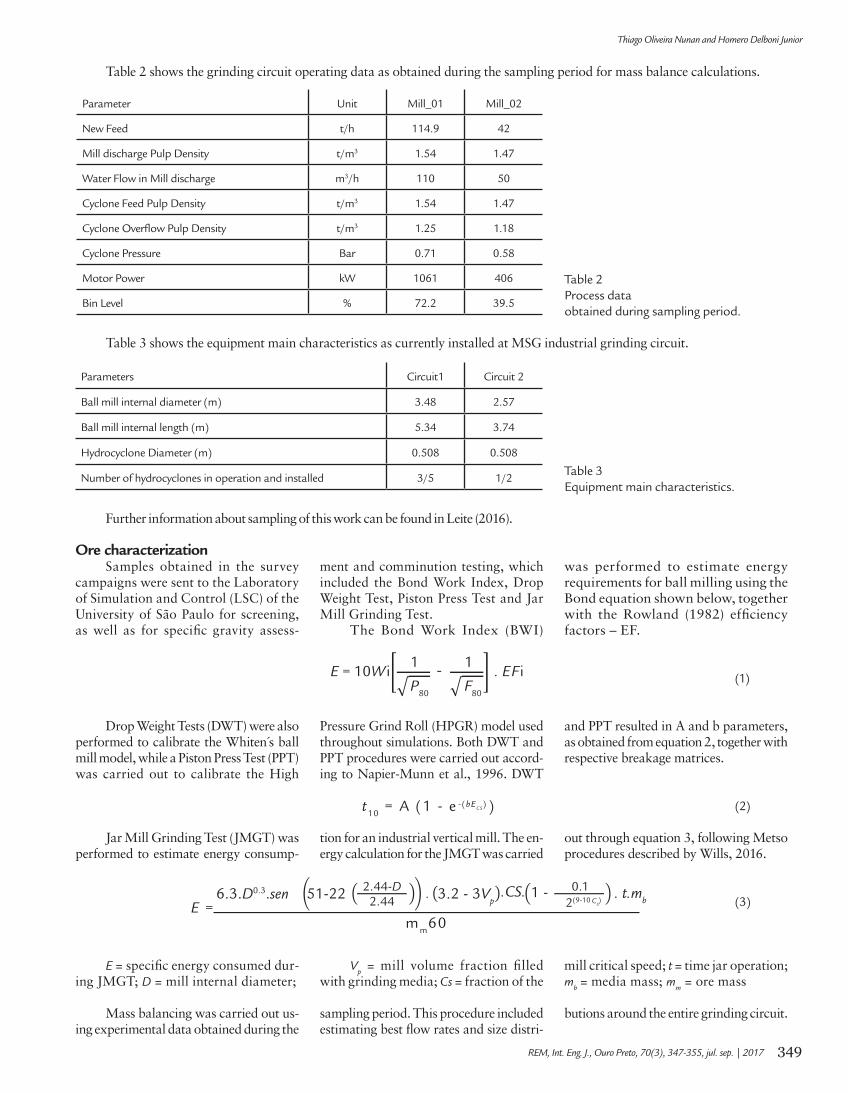
Table 2 shows the grinding circuit operating data as obtained during the sampling period for mass balance calculations.
Parameter Unit Mill_01 Mill_02
New Feed t/h 114.9 42
Mill discharge Pulp Density t/m3 1.54 1.47
Water Flow in Mill discharge m3/h 110 50
Cyclone Feed Pulp Density t/m3 1.54 1.47
Cyclone Overflow Pulp Density t/m3 1.25 1.18
Cyclone Pressure Bar 0.71 0.58
Motor Power kW 1061 406
Bin Level % 72.2 39.5
Parameters Circuit1 Circuit 2
Ball mill internal diameter (m) 3.48 2.57
Ball mill internal length (m) 5.34 3.74
Hydrocyclone Diameter (m) 0.508 0.508
Number of hydrocyclones in operation and installed 3/5 1/2
Table 2Process data obtained during sampling period.
Table 3 shows the equipment main characteristics as currently installed at MSG industrial grinding circuit.
Table 3Equipment main characteristics.
Further information about sampling of this work can be found in Leite (2016).
Ore characterizationSamples obtained in the survey
campaigns were sent to the Laboratory of Simulation and Control (LSC) of the University of São Paulo for screening, as well as for specific gravity assess-
ment and comminution testing, which included the Bond Work Index, Drop Weight Test, Piston Press Test and Jar Mill Grinding Test.
The Bond Work Index (BWI)
was performed to estimate energy requirements for ball milling using the Bond equation shown below, together with the Rowland (1982) efficiency factors – EF.
E = 10W i . EF i1 1
P80 F80
-
Drop Weight Tests (DWT) were also performed to calibrate the Whiten s ball mill model, while a Piston Press Test (PPT) was carried out to calibrate the High
Pressure Grind Roll (HPGR) model used throughout simulations. Both DWT and PPT procedures were carried out accord-ing to Napier-Munn et al., 1996. DWT
and PPT resulted in A and b parameters, as obtained from equation 2, together with respective breakage matrices.
t10 = A (1 - e )-(bECS
)
Jar Mill Grinding Test (JMGT) was performed to estimate energy consump-
tion for an industrial vertical mill. The en-ergy calculation for the JMGT was carried
out through equation 3, following Metso procedures described by Wills, 2016.
CS2(9-10 )
0.11 - . t.mb
E = mm60
6.3.D0.3.sen 51-22 3.2 - 3Vp
.CS.2.44-D2.44 .
E = specific energy consumed dur-ing JMGT; D = mill internal diameter;
Vp = mill volume fraction filled
with grinding media; Cs = fraction of the mill critical speed; t = time jar operation; m
b = media mass; m
m = ore mass
Mass balancing was carried out us-ing experimental data obtained during the
sampling period. This procedure included estimating best flow rates and size distri-
butions around the entire grinding circuit.
(1)
(2)
(3)
350
Simulation of the Mineração Serra Grande Industrial Grinding Circuit
REM, Int. Eng. J., Ouro Preto, 70(3), 347-355, jul. sep. | 2017
Equipment and process modelsThe Nageswararao (2004) model
was used for modeling the industrial hydrocyclones. The model includes both operation and design data, together with partition curve parameterization. Calibra-tion constants were back calculated for model fitting exercises.
The adapted Perfect Mixing Model
proposed by Whiten (1976) was used to model industrial ball milling.
The grinding kinetic parameter (r/d*) was determined for each ball mill during the model fitting exercises, as de-scribed by Napier-Munn (1996).
The HPGR model proposed by Mor-rell/Tondo/Shi (1997) includes three break-
age zones i.e. the pre-crusher zone, the edge effect zone and the compression zone. The throughput model component uses a stan-dard plug flow model version that has been used extensively by manufacturers and researchers. Power consumption is based on throughput and specific comminution energy input. (Morrell et al., 1997).
3. Results and discussion
Ore characterizationThe BWI test performed in the
surveyed grinding circuit feed sample resulted in 11.6 kWh/sht. Such a value was used to estimate the overall grind-ing circuit energy consumption. The
combination between such an energy consumption and the stipulated 2.0 MTPY resulted in 624 kW power to be installed in the additional parallel ball mill.
The appearance function and breakage parameters as obtained from DWT, carried out on sur-veyed samples are shown in Tables 4 and 5.
t10 t75 t50 t25 t4 t2
10 2.9 3.7 5.6 22.7 49.5
20 5.8 7.5 11.2 42.5 77.3
30 8.7 11.2 16.8 59.4 90.4
t10 t75 t50 t25 t4 t2
10 3.3 4.3 6.3 17.4 31.7
30 10.6 13.4 19.1 46 72.1
50 18 22.7 31.4 72.7 100
Time (min) Specific Energy kWh/t P80 (mm)
0 0 165
3 2.54 81.9
5 4.24 60.7
10 8.48 43.8
A 54.4
b 0.84
IQ 45.4
A 28
b 1.44
IQ 40.3
Table 4Appearance Function data - DWT.
Table 5Breakage parameters - DWT.
Table 7Breakage parameters - PPT.
Table 6Appearance Function data - PPT.
Table 8Batch grinding test results.
The appearance function and break-age parameters as obtained from PPT car-
ried out on -6.35 +4.75 mm size fraction are shown on Tables 6 and 7.
JMGT was carried out for 3, 5 and 10 min grinding periods. Table 8 shows
the results obtained in terms of specific energy and resulting product P80.
351
Thiago Oliveira Nunan and Homero Delboni Junior
REM, Int. Eng. J., Ouro Preto, 70(3), 347-355, jul. sep. | 2017
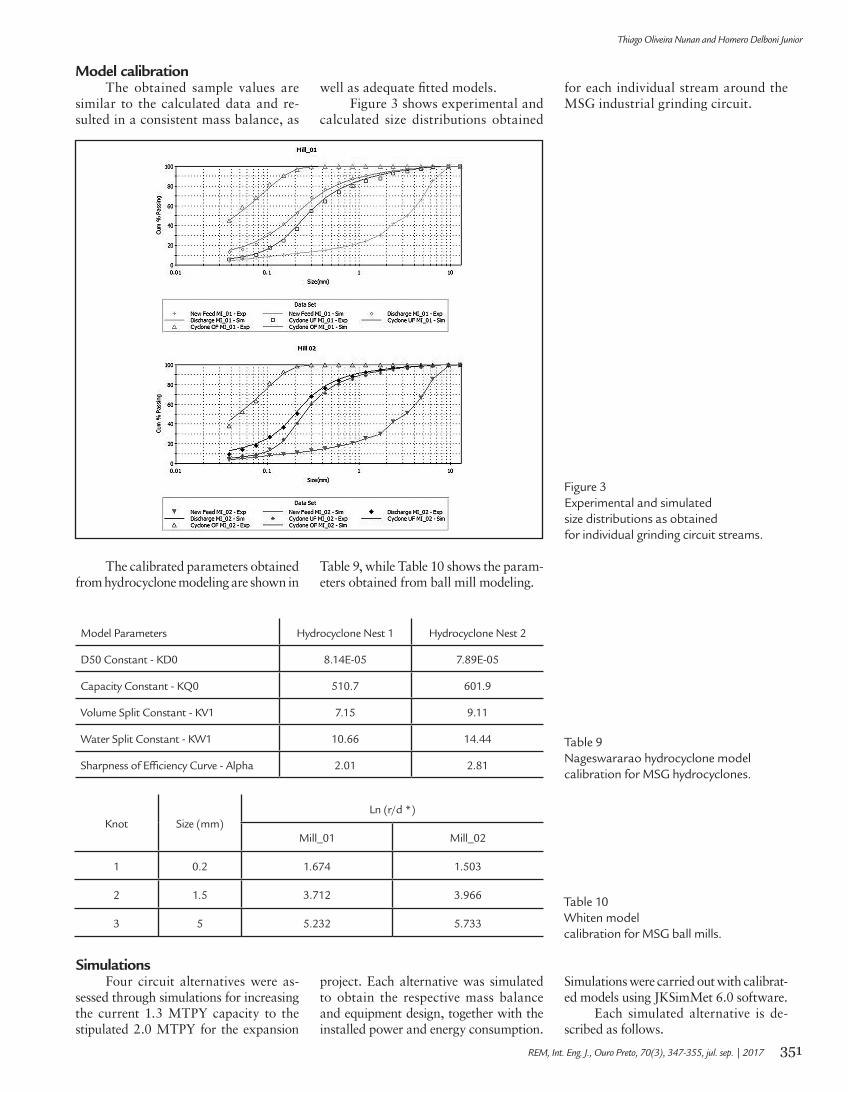
Model calibrationThe obtained sample values are
similar to the calculated data and re-sulted in a consistent mass balance, as
well as adequate fitted models.Figure 3 shows experimental and
calculated size distributions obtained
for each individual stream around the MSG industrial grinding circuit.
Figure 3Experimental and simulated size distributions as obtained for individual grinding circuit streams.
Table 9Nageswararao hydrocyclone model calibration for MSG hydrocyclones.
Table 10Whiten model calibration for MSG ball mills.
The calibrated parameters obtained from hydrocyclone modeling are shown in
Table 9, while Table 10 shows the param-eters obtained from ball mill modeling.
Model Parameters Hydrocyclone Nest 1 Hydrocyclone Nest 2
D50 Constant - KD0 8.14E-05 7.89E-05
Capacity Constant - KQ0 510.7 601.9
Volume Split Constant - KV1 7.15 9.11
Water Split Constant - KW1 10.66 14.44
Sharpness of Efficiency Curve - Alpha 2.01 2.81
Knot Size (mm)Ln (r/d *)
Mill_01 Mill_02
1 0.2 1.674 1.503
2 1.5 3.712 3.966
3 5 5.232 5.733
SimulationsFour circuit alternatives were as-
sessed through simulations for increasing the current 1.3 MTPY capacity to the stipulated 2.0 MTPY for the expansion
project. Each alternative was simulated to obtain the respective mass balance and equipment design, together with the installed power and energy consumption.
Simulations were carried out with calibrat-ed models using JKSimMet 6.0 software.
Each simulated alternative is de-scribed as follows.
352
Simulation of the Mineração Serra Grande Industrial Grinding Circuit
REM, Int. Eng. J., Ouro Preto, 70(3), 347-355, jul. sep. | 2017
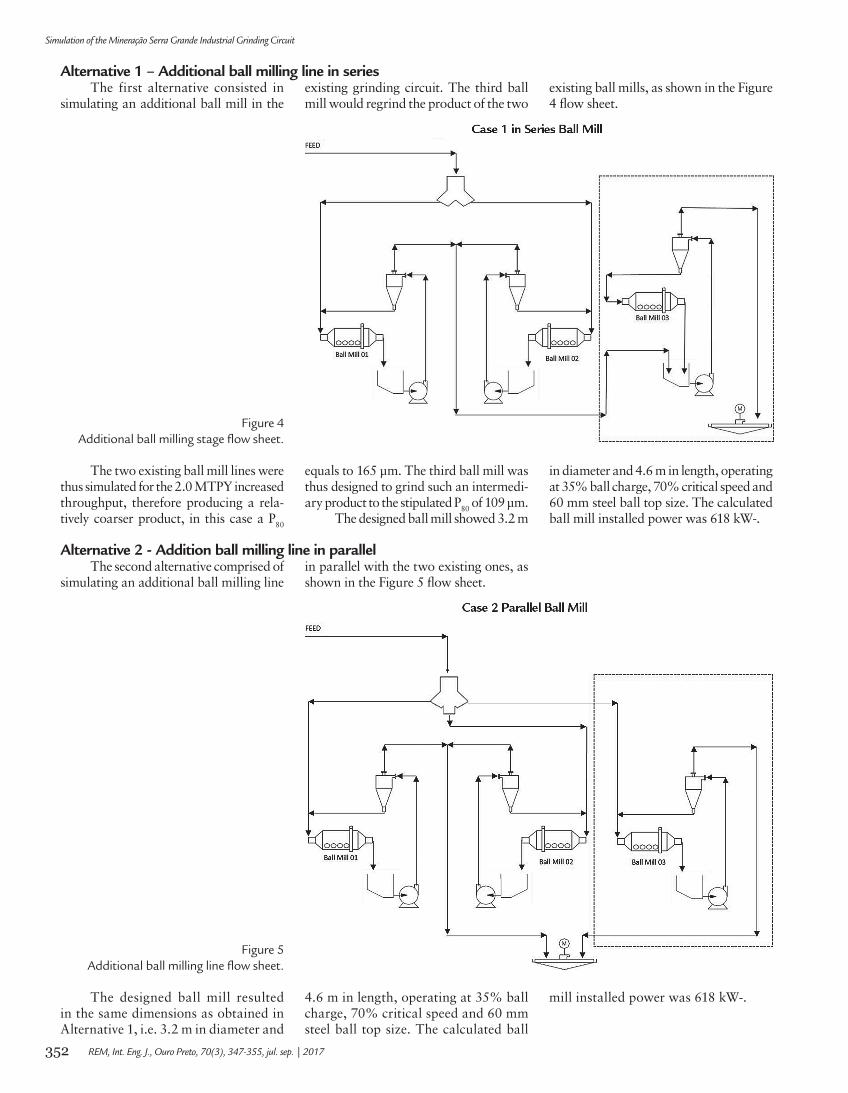
Alternative 1 – Additional ball milling line in seriesThe first alternative consisted in
simulating an additional ball mill in the existing grinding circuit. The third ball mill would regrind the product of the two
existing ball mills, as shown in the Figure 4 flow sheet.
Figure 4Additional ball milling stage flow sheet.
The two existing ball mill lines were thus simulated for the 2.0 MTPY increased throughput, therefore producing a rela-tively coarser product, in this case a P80
equals to 165 µm. The third ball mill was thus designed to grind such an intermedi-ary product to the stipulated P80 of 109 µm.
The designed ball mill showed 3.2 m
in diameter and 4.6 m in length, operating at 35% ball charge, 70% critical speed and 60 mm steel ball top size. The calculated ball mill installed power was 618 kW-.
Alternative 2 - Addition ball milling line in parallelThe second alternative comprised of
simulating an additional ball milling line in parallel with the two existing ones, as shown in the Figure 5 flow sheet.
Figure 5Additional ball milling line flow sheet.
The designed ball mill resulted in the same dimensions as obtained in Alternative 1, i.e. 3.2 m in diameter and
4.6 m in length, operating at 35% ball charge, 70% critical speed and 60 mm steel ball top size. The calculated ball
mill installed power was 618 kW-.
353
Thiago Oliveira Nunan and Homero Delboni Junior
REM, Int. Eng. J., Ouro Preto, 70(3), 347-355, jul. sep. | 2017
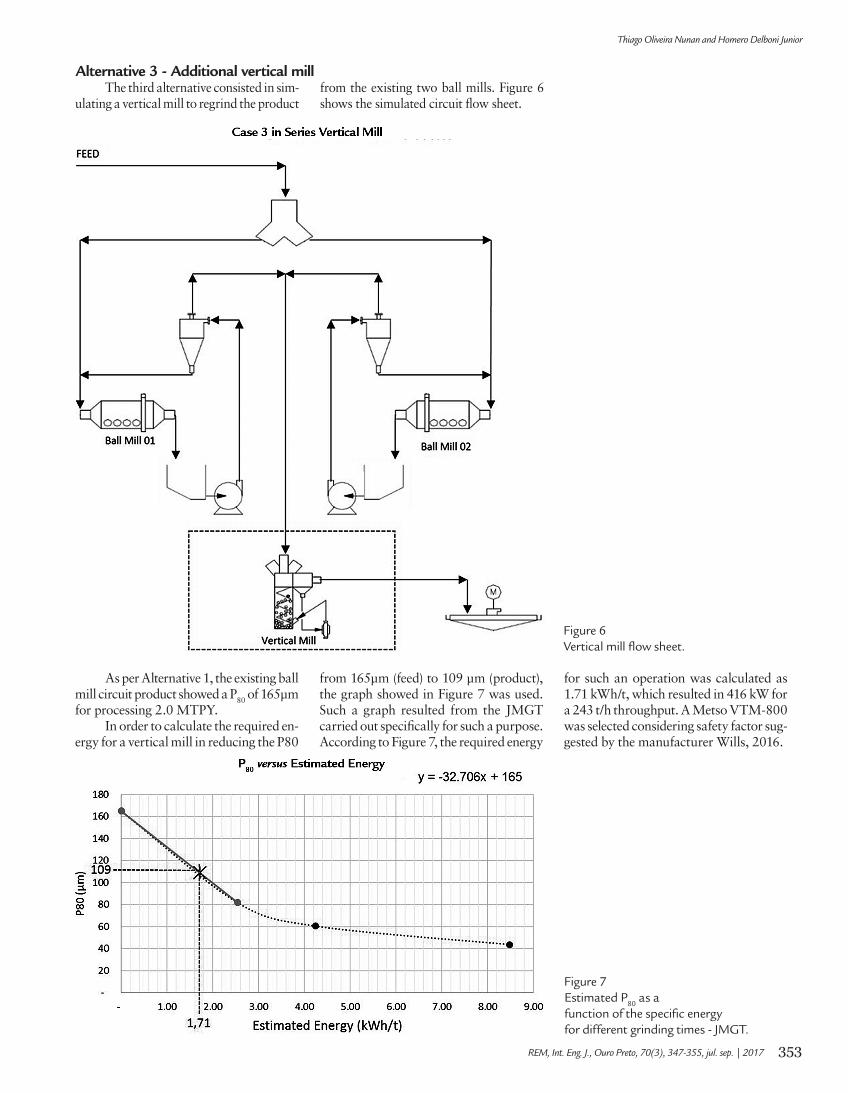
Alternative 3 - Additional vertical millThe third alternative consisted in sim-
ulating a vertical mill to regrind the product from the existing two ball mills. Figure 6 shows the simulated circuit flow sheet.
Figure 6Vertical mill flow sheet.
As per Alternative 1, the existing ball mill circuit product showed a P80 of 165µm for processing 2.0 MTPY.
In order to calculate the required en-ergy for a vertical mill in reducing the P80
from 165µm (feed) to 109 µm (product), the graph showed in Figure 7 was used. Such a graph resulted from the JMGT carried out specifically for such a purpose. According to Figure 7, the required energy
for such an operation was calculated as 1.71 kWh/t, which resulted in 416 kW for a 243 t/h throughput. A Metso VTM-800 was selected considering safety factor sug-gested by the manufacturer Wills, 2016.
Figure 7Estimated P80 as a function of the specific energy for different grinding times - JMGT.
354
Simulation of the Mineração Serra Grande Industrial Grinding Circuit
REM, Int. Eng. J., Ouro Preto, 70(3), 347-355, jul. sep. | 2017
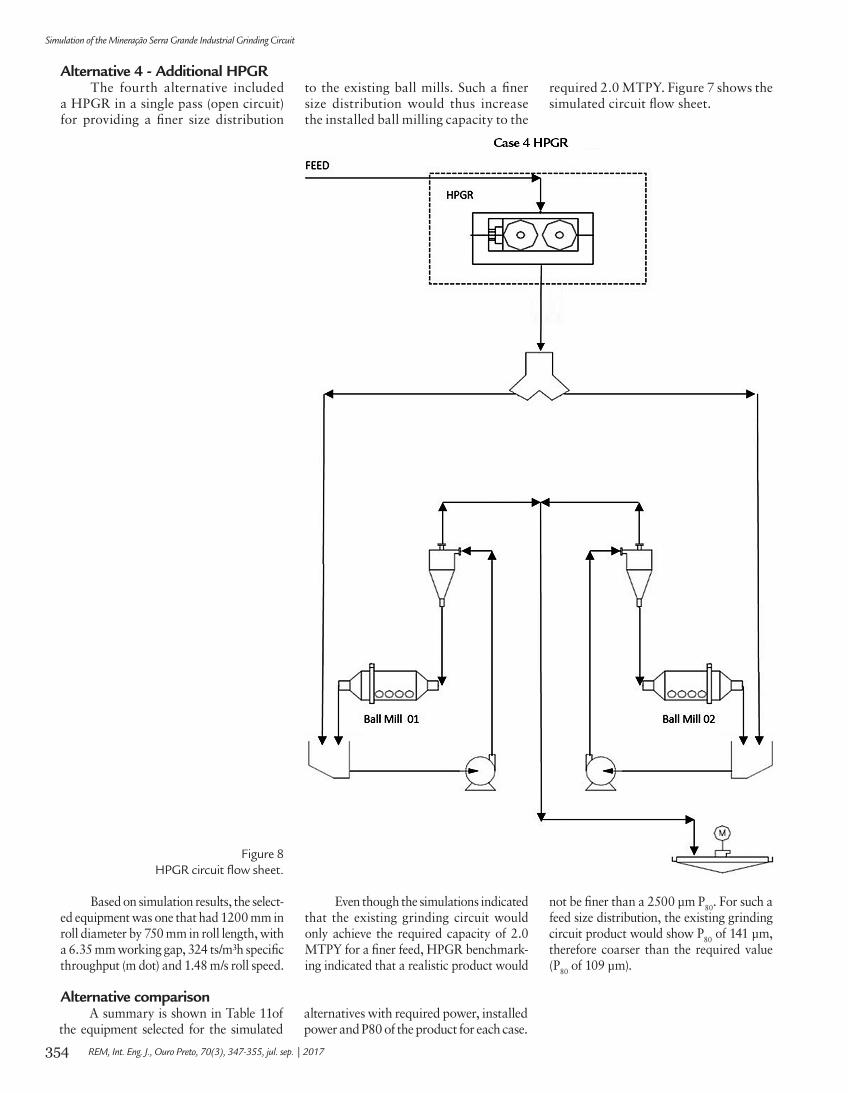
Alternative 4 - Additional HPGRThe fourth alternative included
a HPGR in a single pass (open circuit) for providing a finer size distribution
to the existing ball mills. Such a finer size distribution would thus increase the installed ball milling capacity to the
required 2.0 MTPY. Figure 7 shows the simulated circuit flow sheet.
Figure 8HPGR circuit flow sheet.
Based on simulation results, the select-ed equipment was one that had 1200 mm in roll diameter by 750 mm in roll length, with a 6.35 mm working gap, 324 ts/m³h specific throughput (m dot) and 1.48 m/s roll speed.
Even though the simulations indicated that the existing grinding circuit would only achieve the required capacity of 2.0 MTPY for a finer feed, HPGR benchmark-ing indicated that a realistic product would
not be finer than a 2500 µm P80. For such a feed size distribution, the existing grinding circuit product would show P80 of 141 µm, therefore coarser than the required value (P80 of 109 µm).
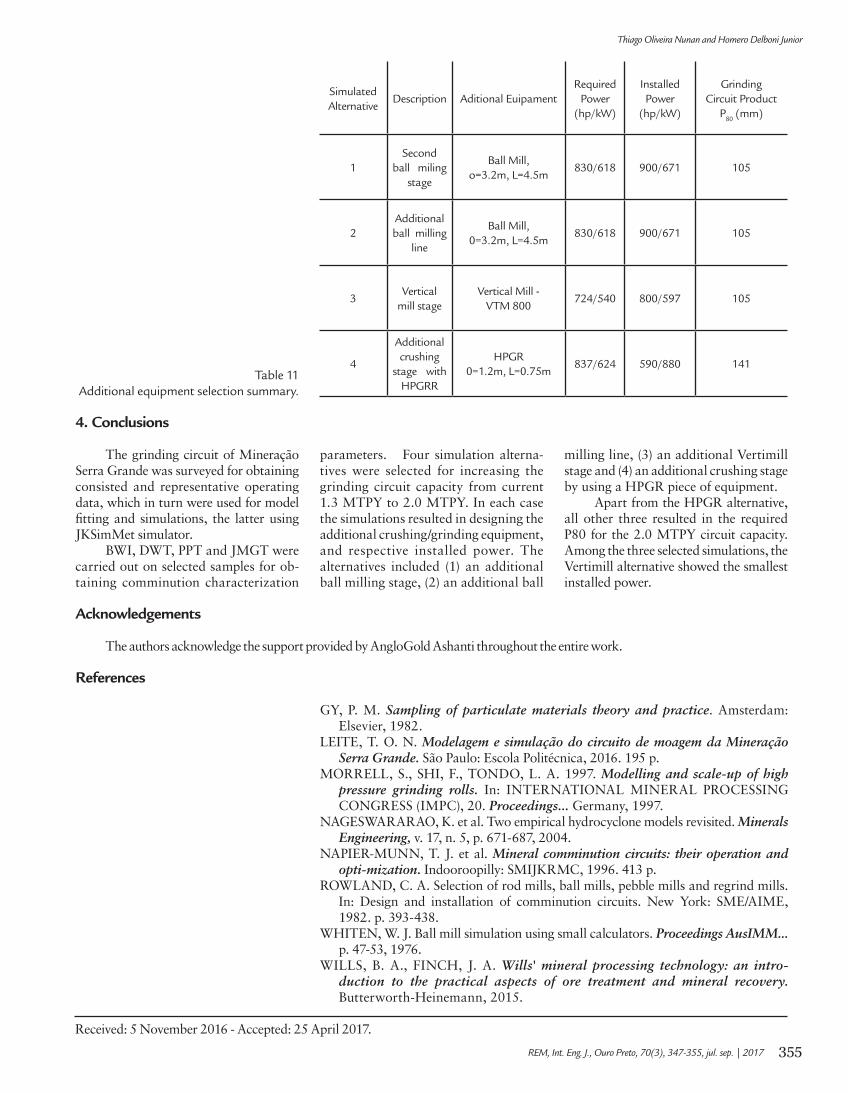
Alternative comparisonA summary is shown in Table 11of
the equipment selected for the simulated alternatives with required power, installed power and P80 of the product for each case.
355
Thiago Oliveira Nunan and Homero Delboni Junior
REM, Int. Eng. J., Ouro Preto, 70(3), 347-355, jul. sep. | 2017
Simulated Alternative
Description Aditional EuipamentRequired
Power (hp/kW)
Installed Power
(hp/kW)
Grinding Circuit Product
P80 (mm)
1Second
ball miling stage
Ball Mill,o=3.2m, L=4.5m
830/618 900/671 105
2Additional ball milling
line
Ball Mill,0=3.2m, L=4.5m
830/618 900/671 105
3Vertical
mill stageVertical Mill -
VTM 800724/540 800/597 105
4
Additional crushing
stage with HPGRR
HPGR0=1.2m, L=0.75m
837/624 590/880 141Table 11
Additional equipment selection summary.
4. Conclusions
The grinding circuit of Mineração Serra Grande was surveyed for obtaining consisted and representative operating data, which in turn were used for model fitting and simulations, the latter using JKSimMet simulator.
BWI, DWT, PPT and JMGT were carried out on selected samples for ob-taining comminution characterization
parameters. Four simulation alterna-tives were selected for increasing the grinding circuit capacity from current 1.3 MTPY to 2.0 MTPY. In each case the simulations resulted in designing the additional crushing/grinding equipment, and respective installed power. The alternatives included (1) an additional ball milling stage, (2) an additional ball
milling line, (3) an additional Vertimill stage and (4) an additional crushing stage by using a HPGR piece of equipment.
Apart from the HPGR alternative, all other three resulted in the required P80 for the 2.0 MTPY circuit capacity. Among the three selected simulations, the Vertimill alternative showed the smallest installed power.
Acknowledgements
The authors acknowledge the support provided by AngloGold Ashanti throughout the entire work.
References
GY, P. M. Sampling of particulate materials theory and practice. Amsterdam: Elsevier, 1982.
LEITE, T. O. N. Modelagem e simulação do circuito de moagem da Mineração Serra Grande. São Paulo: Escola Politécnica, 2016. 195 p.
MORRELL, S., SHI, F., TONDO, L. A. 1997. Modelling and scale-up of high pressure grinding rolls. In: INTERNATIONAL MINERAL PROCESSING CONGRESS (IMPC), 20. Proceedings... Germany, 1997.
NAGESWARARAO, K. et al. Two empirical hydrocyclone models revisited. Minerals Engineering, v. 17, n. 5, p. 671-687, 2004.
NAPIER-MUNN, T. J. et al. Mineral comminution circuits: their operation and opti-mization. Indooroopilly: SMIJKRMC, 1996. 413 p.
ROWLAND, C. A. Selection of rod mills, ball mills, pebble mills and regrind mills. In: Design and installation of comminution circuits. New York: SME/AIME, 1982. p. 393-438.
WHITEN, W. J. Ball mill simulation using small calculators. Proceedings AusIMM... p. 47-53, 1976.
WILLS, B. A., FINCH, J. A. Wills' mineral processing technology: an intro-duction to the practical aspects of ore treatment and mineral recovery. Butterworth-Heinemann, 2015.
Received: 5 November 2016 - Accepted: 25 April 2017.