thibaut lust and jacques teghem - connecting repositories · thibaut lust 1and jacques teghem...
TRANSCRIPT

RAIRO-Oper. Res. 42 (2008) 3–33 RAIRO Operations Research
DOI: 10.1051/ro:2008003 www.rairo-ro.org
MEMOTS: A MEMETIC ALGORITHM INTEGRATINGTABU SEARCH FOR COMBINATORIAL
MULTIOBJECTIVE OPTIMIZATION ∗
Thibaut Lust1
and Jacques Teghem1
Abstract. We present in this paper a new multiobjective memeticalgorithm scheme called MEMOX. In current multiobjective memeticalgorithms, the parents used for recombination are randomly selected.We improve this approach by using a dynamic hypergrid which allowsto select a parent located in a region of minimal density. The secondparent selected is a solution close, in the objective space, to the firstparent. A local search is then applied to the offspring. We experi-ment this scheme with a new multiobjective tabu search called PRTS,which leads to the memetic algorithm MEMOTS. We show on the mul-tidimensional multiobjective knapsack problem that if the number ofobjectives increase, it is preferable to have a diversified research ratherusing an advanced local search. We compare the memetic algorithmMEMOTS to other multiobjective memetic algorithms by using differ-ent quality indicators and show that the performances of the methodare very interesting.
Keywords. Combinatorial multiobjective optimization, hybrid meta-heuristic, memetic algorithm, Tabu Search, Knapsack.
Mathematics Subject Classification. 90C29, 90C59.
Received November 19, 2006. Accepted October 30, 2007.
∗ T. lust thanks the “Fonds National de la Recherche Scientifique” for a research fellow grant(Aspirant FNRS) .1 Laboratory of Mathematics & Operational Research, Faculte Polytechnique de Mons, 9, ruede Houdain, 7000 Mons, Belgium; [email protected]
Article published by EDP Sciences c© EDP Sciences, ROADEF, SMAI 2008

4 THIBAUT LUST AND JACQUES TEGHEM
Introduction
A multiobjective combinatorial optimization problem (P ) (or multiobjectivelinear programming problem with binary variables), with K objectives, n variablesand q constraints is defined in the following way:
⎡⎢⎢⎢⎢⎣〈〈min
X∈D〉〉 zk(X) = ckX k = 1, . . . , K
where D = {X : X ∈ LD, X ∈ Bn}LD = {X : AX ≤ b, X ≥ 0}
with A = (q × n), ck = (1× n), X = (n× 1), b = (q × 1)and B = {0, 1}
⎤⎥⎥⎥⎥⎦.
Due to the contradictory features of the objectives, it does not exist a solutionsimultaneously minimizing each objective (and for this reason the notation 〈〈min〉〉is used), but a set of solutions called efficient solutions. A solution X∗ ∈ Dis efficient for the problem (P ) if there are no other solutions X ∈ D such as:zk(X) ≤ zk(X∗), k = 1, . . . , K with at least a strict inequality. We will indicateby E(P ) the whole efficient solution set of the problem (P ), which is representedin the objective space by a Pareto front or a trade-off surface.
In this paper, only a minimal complete set will be sought, i.e. no equivalentefficient solution (two solutions X1 and X2 are equivalent if zk(X1) = zk(X2),k = 1, . . . , K) will be retained, and each solution found will correspond to adistinct non-dominated point in the objective space.
Metaheuristics showed their effectiveness to obtain a good approximation of thesolution of difficult optimization problems. So, they were adapted to multiobjec-tive problems [3,8,10], and constitute a research field under full development, sincethe multiobjective case requires a method which combines different properties atthe same time, i.e. able to find solutions located in all the zones of the objectivespace, but also close to the efficient solutions. This is why it is relevant to hybriddifferent metaheuristics in order to combine the advantages of each one of them.If we refer to the taxonomy of hybrid metaheuristics of Talbi [30], the memetic al-gorithms, employed in this paper and based on the cooperation between a geneticalgorithm and a local search method, belong to the LTH (Low-level TeamworkHybrid) class. The LTH class regroups the cooperations resulting from an opti-mization method with population of solutions where the operator acting on thesolutions, in an individual or total way, is replaced by an optimization method (inthe memetic algorithms, the mutation operator of the genetic algorithm is replacedby the local search).
This paper is organized as follows: after a short presentation of the existingmultiobjective memetic algorithms, we present the MEMOX scheme, a generalmemetic algorithm scheme for multiobjective optimization. At Section 3, wepresent the local search that will be used in the MEMOX scheme, the original mul-tiobjective tabu search PRTS, what gives rise to the method called MEMOTS. Weexpose then how the MEMOTS algorithm has been adapted to the multiobjectivemultidimensional knapsack problem, how the MEMOTS parameters have been
MEMOTS: A MEMETIC ALGORITHM 5
fixed and how the parameter values influence the algorithm performances. Vari-ous indicators of quality of an approximation are presented. Finally, we comparethe MEMOTS performances with respect to MOGLS [19], a particularly power-ful method for this problem, and two other multiobjective memetic algorithms:PMA [18] and IMMOGLS [13].
1. Brief overview of memetic algorithms
for multiobjective optimization
A memetic algorithm (or genetic local search) is a genetic algorithm wherethe mutation operator is replaced by a local search method applied to every newoffspring generated [26]. The memetic algorithms are particularly well adaptedto the resolution of multiobjective optimization problems since a set of diversifiedsolutions (from where the interest to use a population) but also close to the Paretofront (what is ensured by the local search) is required.
In an interesting survey of memetic algorithms for multiobjective optimiza-tion [23], Knowles and Corne distinguish three principal groups of authors whodeveloped memetic multiobjective algorithms: Ishibuchi and Murata with theIMMOGLS (Ishibuchi Murata MultiObjective Genetic Local Search)method [13], Jaszkiewicz with two methods, MOGLS (MultiObjective GeneticLocal Search) [15,19] and PMA (Pareto Memetic Algorithm) [18] and finally,Knowles and Corne with the M-PAES (Memetic Pareto Archived Evolution Strat-egy) method [22].
The three methods IMMOGLS, MOGLS and PMA are all the three based onthe same principle: a scalarizing function is used, defined thanks to a weightvector randomly drawn, to select probabilistically two parents being good on thisfunction. The two parents are then crossed, to generate an offspring. The localsearch is applied to the offspring and finally, the improved offspring competes withthe population for survival to the next generation.
The only point on which the three algorithms differ is the choice of the parentsemployed for recombination. In IMMOGLS, the parents are selected from thecurrent population using the roulette wheel selection scheme with a linear scaling.The two parents in MOGLS are randomly selected from a temporary populationof small size composed of the best solutions on the current scalarizing function. InPMA, the selection is based on a tournament, where the two solutions selected arethe winners of a tournament between solutions coming from a sample drawn atrandom from the population. The selection procedure of PMA is faster than thatof MOGLS, but the determination of the sample size of PMA is quite difficult.
The M-PAES method is rather different from the three preceding ones, sincenone scalarizing function is used, either in the local search or the parents selection.The solution evaluation is instead based on a form of Pareto ranking. The localsearch is the (1+1)-PAES method [21], which is a procedure for maintaining afinite size archive of non-dominated solutions. In (1+1)-PAES, a new solution isgenerated from the current solution, and, to check if this new solution is accepted,

6 THIBAUT LUST AND JACQUES TEGHEM
a comparison with the current solution and the population is realized. The rule ofacceptation is as follows:
• If the new solution is dominated by the current solution: not accepted;• If the new solution dominates at least one solution of the population:
accepted;• If the new solution is not dominated by at least one solution of the popula-
tion but does not dominate any solutions of the population: the solution isaccepted at the condition that the solution brings diversity. The diversityis measured by a hypergrid created in the objective space.
In addition, the M-PAES method employs periodically a crossover operator torecombine the solutions found by the (1+1)-PAES procedure.
The M-PAES method is known as being parsimonious in term of number of eval-uations because no non-dominated solution is discarded contrarily to algorithmsusing scalarizing functions, since in these algorithms, solutions are rejected if theyare bad on the current scalarizing function. On the other hand, a Pareto rankingevaluation takes more time than applying a scalar acceptance function.
As M-PAES, the algorithm developed in this paper does not use scalarizingfunctions, which also avoids the necessity of specifying weights sets and normalizingthe objectives.
2. MEMOX: a new memetic algorithm scheme
for multiobjective optimization
2.1. Presentation of the scheme
We present in this section a new scheme of resolution of multiobjective op-timization problems, called MEMOX, and based on a memetic algorithm. Theresolution scheme MEMOX combines elements of the algorithms presented at theprevious section, without using scalarizing functions for the parents selection.
Indeed, as illustrated at Figure 1, a negative point of this selection is thatthe distribution of the solutions of the population in the objective space is nottaken into account; parents being located in a zone already well exploited couldthus be selected for the recombination because the weight set λ used to build thescalarizing function on which the selection is based is randomly generated.
The functioning of the MEMOX scheme, presented at Figure 2, is as follows.In an initialization phase, an initial population of non-dominated solutions (or
potentially efficient), and ideally diversified, is generated by a heuristic or a localsearch. At each new solution Xs generated, the set of potentially efficient solutions,noted PE, is actualized by elimination of the potentially efficient solutions of PEwhich could be found dominated following the addition of the new solution Xs.
Then, two solutions from the population are selected (the parents). The firstselected solution, called X1, is one of the solutions of the population having aminimal density, defined by the number of solutions being in the same hypervolume

MEMOTS: A MEMETIC ALGORITHM 7
�
z1
�
�
�
�
�
�
�
�
�
�
z2
�
�
�
�
�λ
Figure 1. Problem of the selection of MOGLS, IMMOGLS and PMA.
as the solution. The technique employed to realize this division is explained atSection 2.2 (this is the main difference with respect to the other multiobjectivememetic algorithms).
The second one, called X2, is one of the solutions of PE among the r closest [14]solutions to the first solution according to the euclidean distance in the objectivespace. It should be noted that if the number of potentially efficient solutions foundby the algorithm, noted |PE|, is lower or equal to r, the selection of the secondsolution is realized among the |PE| − 1 closest solutions.
The both solutions X1 and X2 are then combined by a crossover operatorfor thus obtaining a new solution called X3 (the offspring). The solution X3 isadded to the set |PE| of potentially efficient solutions, and this set is consequentlyactualized to keep only the non-dominated solutions.
Finally, a local search method X (that can be the same than the one usedduring the initialization phase) is applied from the offspring X3 until no moreimprovement in the solution set happens during a certain iterations number itstop.Finally, this process is reiterated by again selecting the minimal density solution.
The role of the local search is to intensify the research by generating new solu-tions close to the selected solution of minimal density X1. The diversification ofthe method is ensured by the improvement of solutions of minimal density, whichmakes it possible to generate new solutions in little or not exploited zones. Animportant parameter of the MEMOX scheme is the itstop parameter, i.e. after howmany iterations without improvement we have to stop the local search, knowingthat the total number of iterations is limited. It can thus be preferable to startagain the local search from a solution of minimal density rather than to stronglyintensify in a precise zone.

8 THIBAUT LUST AND JACQUES TEGHEM
Parameters
itstop: iterations number of the local search without improvementr: number of solutions taken into account for the selection of the closest solutionS : number of initial solutionsn: maximum number of iterations
Notations
i: current iterations numbernls : counter of the iterations number of the local searchPE : list of non-dominated solutions, potentially efficient|PE|: number of potentially efficient solutionsD(X) : density of a potentially efficient solution X
Initialization
i← 0PE ← ØGenerate S admissible solutions thanks to a local search method or aconstruction heuristicFor each solution Xs generated (s = 1, . . . , S), do:
PE ← PE + {Xs}Actualize PE
Iteration i
For each solution of PE calculate the density D(Xl) l = 1, . . . , |PE|Calculate D∗ = min D(Xl)Choose randomly a solution X1 among the solutions which respect D(Xl) = D∗
Choose a solution X2 among the min(r, |PE| − 1) solutions of PE closest to X1
Cross the two solutions X1 and X2 for obtaining a new solution X3
PE ← PE + {X3}Actualize PEApply a local search method X from X3 until no more improvement in PE whileitstopi← i + nls
Stop Criterion
Iteration count i = n
Figure 2. MEMOX scheme.

MEMOTS: A MEMETIC ALGORITHM 9
The algorithm has the advantage of being easily adapted to any type of multiob-jective optimization problems, provided that a local search (and the correspondingneighborhood), a crossover operator and a means of generating an initial popula-tion are defined.
An important parameter of the MEMOX scheme is the itstop parameter, i.e. af-ter how many iterations we have to stop the local search, knowing that the totalnumber of iterations is limited. It can thus be preferable to start again the localsearch from a solution of minimal density rather than strongly intensifying in aprecise zone.
2.2. The dynamic hypergrid
An another important point not explained in this scheme is how to measure thedensity of a potentially efficient solution.
Two authors have already used the concept of density within the framework ofmultiobjective optimization:
• Deb with the concepts of hyperniche [28] and hypercube [6], introducedinto the genetic algorithms NSGA (Non dominated Sorting Genetic Algo-rithm), for the selection of individuals through a population.• Knowles and Corne with the hypergrid, introduced into the (1+1)-PAES
method [21], employed in the rule of acceptance of a new solution andalso used to limit the number of solutions generated.
An inconvenient of the hyperniche and hypercube measures is the high calculationcomputational time, because each solution has to be compared to all the otherto obtain the density of all the solutions. Another argument in discredit of thehyperniche measure is that this measure is extremely dependent on the size of theniche [7].
Consequently, we use a hypergrid in MEMOX, created by a division of theobjective space in hypervolumes. The density of a solution is thus defined bythe number of solutions being in the same hypervolume as the solution. In thisway, it is quite easy to measure the density of a solution by always having inmemory the number of solutions in each hypervolume and the coordinates of thesolutions in the hypergrid. Thus, if we want to know the density of a solution, itis enough to read the number of solutions present in the hypervolume identifiedby the coordinates of the solution.
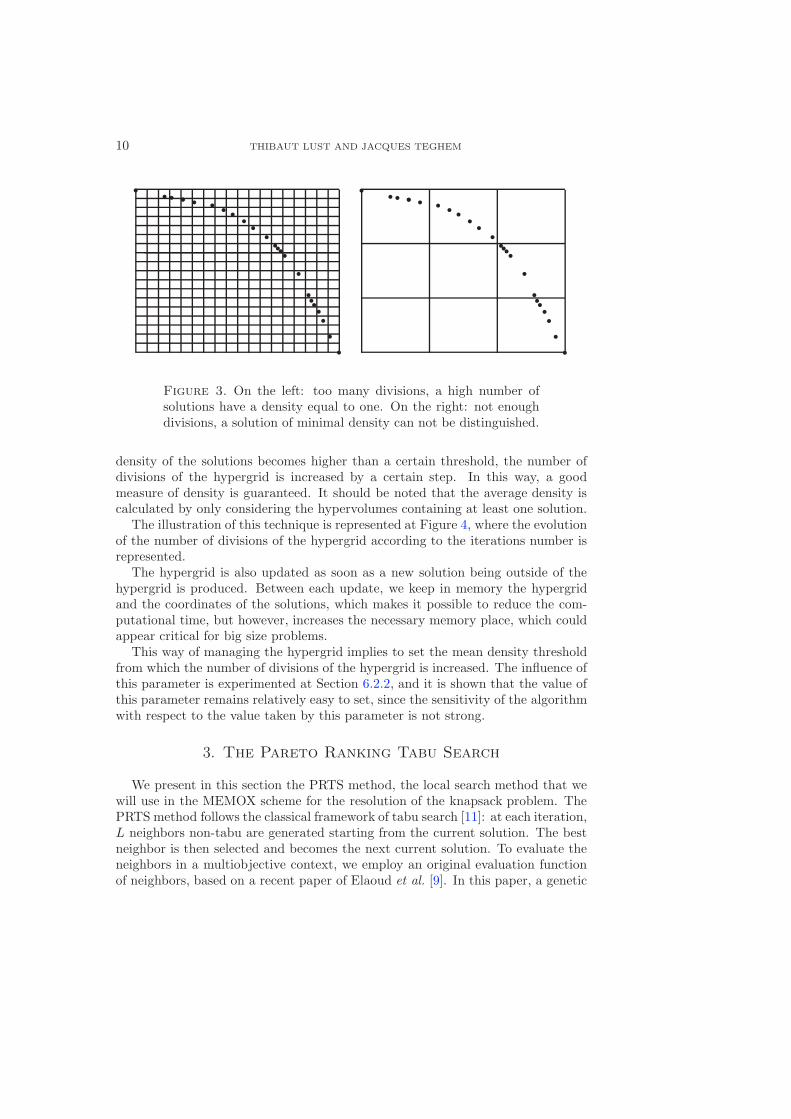
The hypergrid size has to be managed. Indeed, if the number of hypervolumesthat compose the hypergrid is to high, all the solutions will be on different hy-pervolumes. On the other hand, if there are not enough hypervolumes, a lot ofsolutions will be on the same hypervolumes (see Fig. 3).
In these two cases, it will be difficult to distinguish a solution of minimal density.That is why the hypergrid size is dynamically updated. As the method starts froma low number of solutions and this number is, for the majority of the cases, inconstant increase when a multiobjective problem is solved, the number of divisionsof the hypergrid is also constantly increased. The rule is as follows: if the average
10 THIBAUT LUST AND JACQUES TEGHEM
��
��
�
�
�
�
�
�
�
�
�
�
�
�
�
� ��
�
�
�
�
��
��
�
�
�
�
�
�
�
�
�
�
�
�
�
� ��
�
�
�
�
Figure 3. On the left: too many divisions, a high number ofsolutions have a density equal to one. On the right: not enoughdivisions, a solution of minimal density can not be distinguished.
density of the solutions becomes higher than a certain threshold, the number ofdivisions of the hypergrid is increased by a certain step. In this way, a goodmeasure of density is guaranteed. It should be noted that the average density iscalculated by only considering the hypervolumes containing at least one solution.
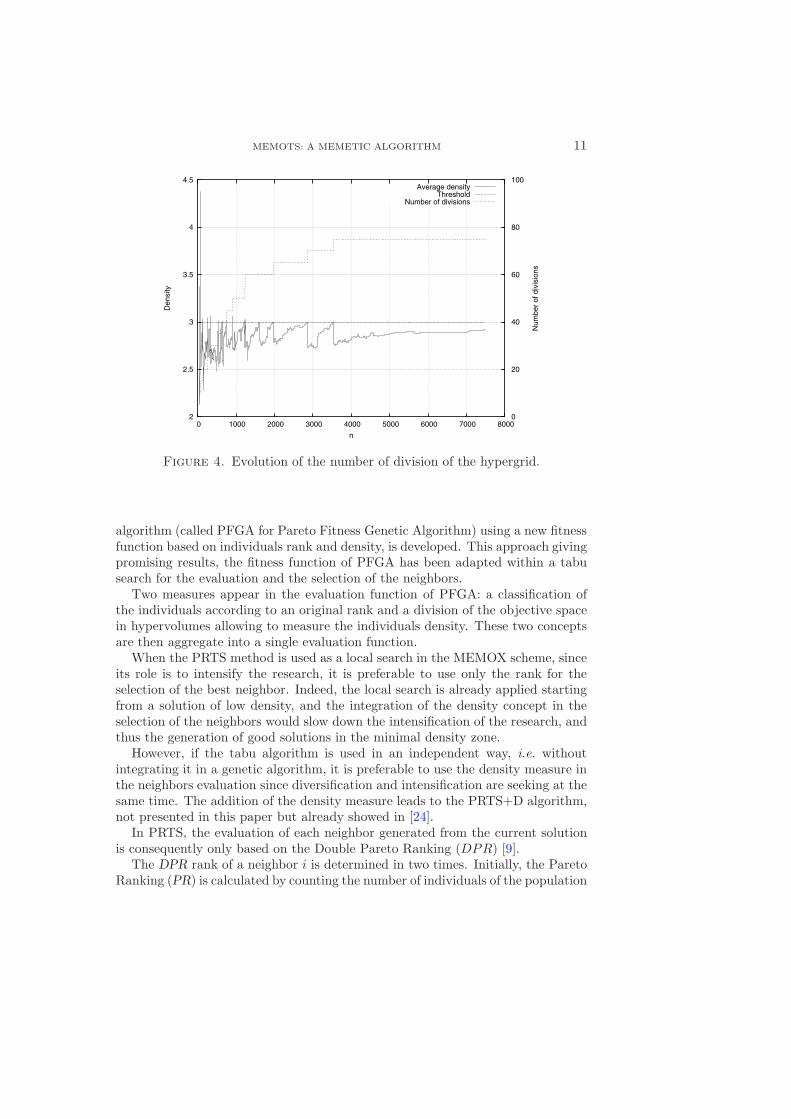
The illustration of this technique is represented at Figure 4, where the evolutionof the number of divisions of the hypergrid according to the iterations number isrepresented.
The hypergrid is also updated as soon as a new solution being outside of thehypergrid is produced. Between each update, we keep in memory the hypergridand the coordinates of the solutions, which makes it possible to reduce the com-putational time, but however, increases the necessary memory place, which couldappear critical for big size problems.
This way of managing the hypergrid implies to set the mean density thresholdfrom which the number of divisions of the hypergrid is increased. The influence ofthis parameter is experimented at Section 6.2.2, and it is shown that the value ofthis parameter remains relatively easy to set, since the sensitivity of the algorithmwith respect to the value taken by this parameter is not strong.
3. The Pareto Ranking Tabu Search
We present in this section the PRTS method, the local search method that wewill use in the MEMOX scheme for the resolution of the knapsack problem. ThePRTS method follows the classical framework of tabu search [11]: at each iteration,L neighbors non-tabu are generated starting from the current solution. The bestneighbor is then selected and becomes the next current solution. To evaluate theneighbors in a multiobjective context, we employ an original evaluation functionof neighbors, based on a recent paper of Elaoud et al. [9]. In this paper, a genetic
MEMOTS: A MEMETIC ALGORITHM 11
2
2.5
3
3.5
4
4.5
0 1000 2000 3000 4000 5000 6000 7000 8000 0
20
40
60
80
100
Den
sity
Num
ber
of d
ivis
ions
n
Average densityThreshold
Number of divisions
Figure 4. Evolution of the number of division of the hypergrid.
algorithm (called PFGA for Pareto Fitness Genetic Algorithm) using a new fitnessfunction based on individuals rank and density, is developed. This approach givingpromising results, the fitness function of PFGA has been adapted within a tabusearch for the evaluation and the selection of the neighbors.
Two measures appear in the evaluation function of PFGA: a classification ofthe individuals according to an original rank and a division of the objective spacein hypervolumes allowing to measure the individuals density. These two conceptsare then aggregate into a single evaluation function.
When the PRTS method is used as a local search in the MEMOX scheme, sinceits role is to intensify the research, it is preferable to use only the rank for theselection of the best neighbor. Indeed, the local search is already applied startingfrom a solution of low density, and the integration of the density concept in theselection of the neighbors would slow down the intensification of the research, andthus the generation of good solutions in the minimal density zone.
However, if the tabu algorithm is used in an independent way, i.e. withoutintegrating it in a genetic algorithm, it is preferable to use the density measure inthe neighbors evaluation since diversification and intensification are seeking at thesame time. The addition of the density measure leads to the PRTS+D algorithm,not presented in this paper but already showed in [24].
In PRTS, the evaluation of each neighbor generated from the current solutionis consequently only based on the Double Pareto Ranking (DPR) [9].
The DPR rank of a neighbor i is determined in two times. Initially, the ParetoRanking (PR) is calculated by counting the number of individuals of the population
12 THIBAUT LUST AND JACQUES TEGHEM
z2
z1
�
�
�
�
�
�
�
I1
I2
�
�
�
�
��
�
�
0,0
3,3
1,1
4,5
7,15
1,1
0,0 1,1
3,5
4,9
PR,DPR
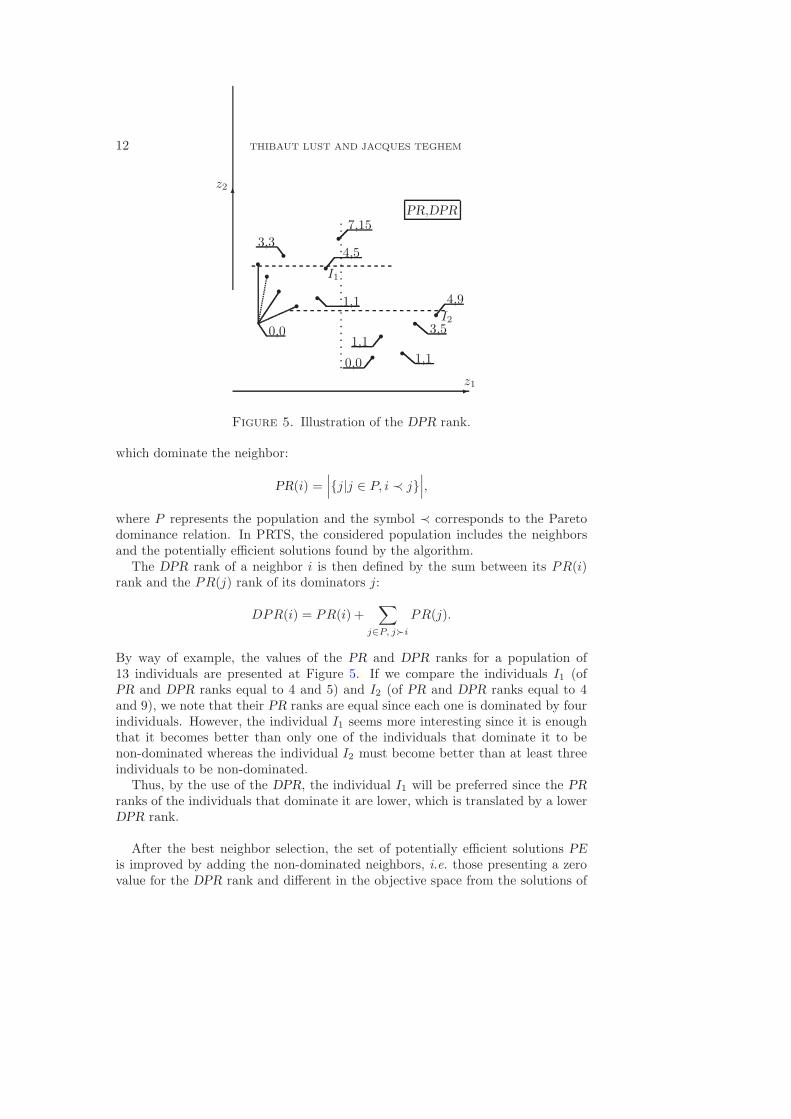
Figure 5. Illustration of the DPR rank.
which dominate the neighbor:
PR(i) =∣∣∣{j|j ∈ P, i ≺ j}
∣∣∣,where P represents the population and the symbol ≺ corresponds to the Paretodominance relation. In PRTS, the considered population includes the neighborsand the potentially efficient solutions found by the algorithm.
The DPR rank of a neighbor i is then defined by the sum between its PR(i)rank and the PR(j) rank of its dominators j:
DPR(i) = PR(i) +∑
j∈P, j�i
PR(j).
By way of example, the values of the PR and DPR ranks for a population of13 individuals are presented at Figure 5. If we compare the individuals I1 (ofPR and DPR ranks equal to 4 and 5) and I2 (of PR and DPR ranks equal to 4and 9), we note that their PR ranks are equal since each one is dominated by fourindividuals. However, the individual I1 seems more interesting since it is enoughthat it becomes better than only one of the individuals that dominate it to benon-dominated whereas the individual I2 must become better than at least threeindividuals to be non-dominated.
Thus, by the use of the DPR, the individual I1 will be preferred since the PRranks of the individuals that dominate it are lower, which is translated by a lowerDPR rank.
After the best neighbor selection, the set of potentially efficient solutions PEis improved by adding the non-dominated neighbors, i.e. those presenting a zerovalue for the DPR rank and different in the objective space from the solutions of
MEMOTS: A MEMETIC ALGORITHM 13
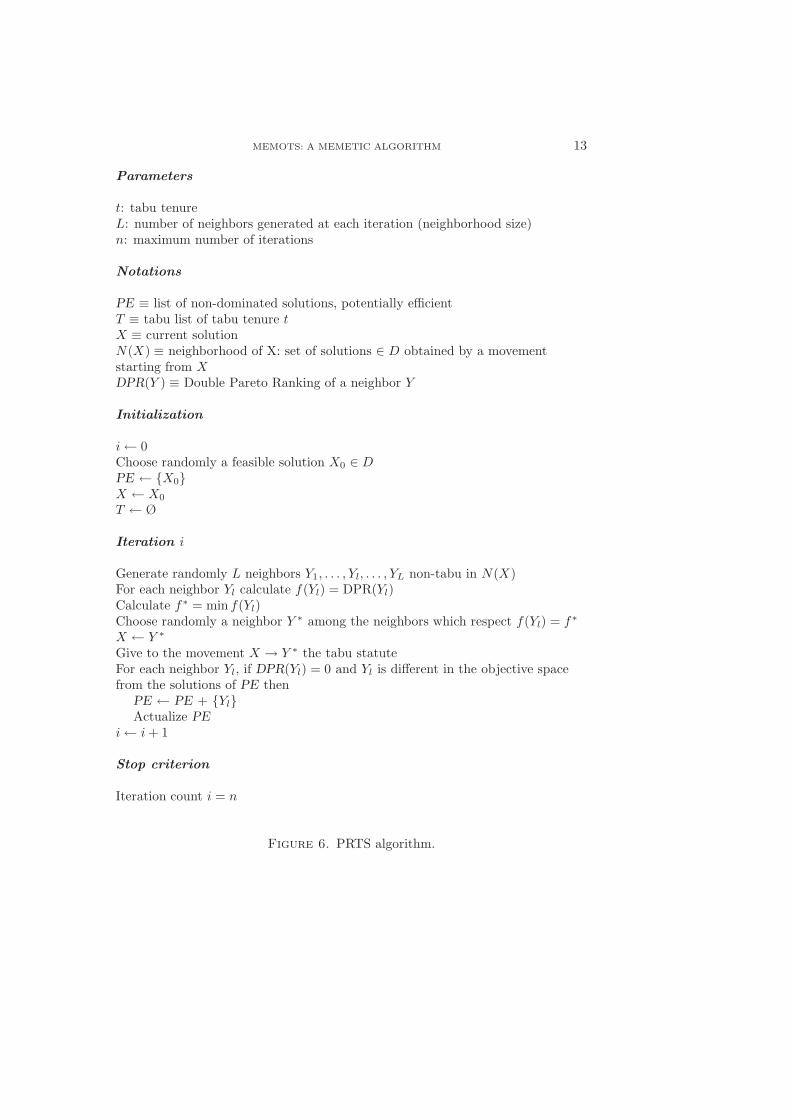
Parameters
t: tabu tenureL: number of neighbors generated at each iteration (neighborhood size)n: maximum number of iterations
Notations
PE ≡ list of non-dominated solutions, potentially efficientT ≡ tabu list of tabu tenure tX ≡ current solutionN(X) ≡ neighborhood of X: set of solutions ∈ D obtained by a movementstarting from XDPR(Y ) ≡ Double Pareto Ranking of a neighbor Y
Initialization
i← 0Choose randomly a feasible solution X0 ∈ DPE ← {X0}X ← X0
T ← Ø
Iteration i
Generate randomly L neighbors Y1, . . . , Yl, . . . , YL non-tabu in N(X)For each neighbor Yl calculate f(Yl) = DPR(Yl)Calculate f∗ = min f(Yl)Choose randomly a neighbor Y ∗ among the neighbors which respect f(Yl) = f∗
X ← Y ∗
Give to the movement X → Y ∗ the tabu statuteFor each neighbor Yl, if DPR(Yl) = 0 and Yl is different in the objective spacefrom the solutions of PE then
PE ← PE + {Yl}Actualize PE
i← i + 1
Stop criterion
Iteration count i = n
Figure 6. PRTS algorithm.

14 THIBAUT LUST AND JACQUES TEGHEM
PE. In addition, the set PE is actualized by elimination of the potentially efficientsolutions of PE which could be found dominated following the addition of the newsolutions.
The algorithm of the PRTS method is given at Figure 6. The algorithm presentsthree parameters, which depend on the problem and on the user requirements:the tabu tenure t, the number L of neighbors generated at each iteration and themaximum number of iterations n.
4. Quality indicators
In single optimization, it is quite easy to measure the quality of a solution or tocompare the solutions obtained by various methods. That is more difficult in themulticriteria case [35], because the solutions are represented by a trade-off surfacecomposed of a solution set, and the problem of the quality measurement of sucha set is thus also and logically a multicriteria problem.
Consequently, we use several indicators to measure the quality of an approxi-mation of a solution set:
• the hypervolume H (to be maximized) [34]: approximation of the volumeincluded under the curve formed by the evaluation of the solutions. Thisindicator is only calculated for the two objective instances since it takeshigh computational time if the number of objectives and solutions increase,even if works are led to reduce this time [32];• the spacing out metric SM (to be minimized) [27]: measure the uniformity
of the distribution of the solutions composing the trade-off surface. Morethe value is close to zero, the best will be the distribution of the solutionson the trade-off surface;• the R measure (to be minimized) [17], correlated to the distance between
a reference point and the solutions of the approximation. The referencepoint used can be found in [17];• the average distance D1 and maximal distance D2 (to be minimized) [4,31]
between the solutions of the reference set and the solutions of the approx-imation, by using the euclidean distance. Ideally, the reference set is thePareto front;• the percentage of efficient solutions found, only calculated when the effi-
cient solutions are available, noted |EP |(%);• the number of potentially efficient solutions found, noted |PE|.
An illustration of these indicators for a two objectives example is given at Figure 7.The two distances D1 and D2 are rather good indicators, provided that the ref-
erence set is of good quality. The distance D1 reflects the capacity of an algorithmto reach solutions close to the reference set, so it can be interpreted as an indicatorto measure the intensification property of a multiobjective algorithm.
Being given that the solution set obtained by the algorithms are in generaluniform (no zones without solutions), the maximum distance between the solutions

MEMOTS: A MEMETIC ALGORITHM 15
z2
z1
� Approximation
Reference set
� Reference point
�
�
�
�
�
�
�
�
H
�
�SM
�
�
�
R�D1
�D2
Figure 7. Quality indicators.
of the reference set and the solutions of the approximation appears generally in theextreme zones. In this way, the distance D2 seems a good indicator to measure thediversification property of an algorithm, interpreted here by the capacity to findsolutions in the extreme zones (which are important solutions since they optimizeone of the objectives).
5. The knapsack problem
We apply the MEMOX scheme to the knapsack problem. The local searchmethod used is the PRTS method. The integration of this tabu search to theMEMOX scheme leads to a method called MEMOTS. We define in this sectionthe knapsack problem and how the MEMOTS method has been adapted to thisproblem.
5.1. Problem definition
The knapsack problem consists, in its unidimensional and unicriteria case, tochoose a set of objects to put in a bag. Each object having a weight and a profit,the objects should be selected to maximize the total profit while not exceedingthe bag capacity. In the multiobjective case, K profits are associated at eachobject and in the multidimensional case, q bags are considered, which means thatq constraints are added. The multidimensional multiobjective knapsack problem

16 THIBAUT LUST AND JACQUES TEGHEM
is defined as follows:⎡⎢⎢⎢⎢⎢⎣
max zk(X) =n∑
i=1
cki xi k = 1, . . . , K
s.tn∑
i=1
wlixi ≤ bl l = 1, . . . , q
xi ∈ {0, 1} i = 1, . . . , n
⎤⎥⎥⎥⎥⎥⎦
with n the number of objects available, X the decision vector, formed of the binaryvariables xi (xi = 1 means that the object i is in the knapsack), ck
i the profit k ofthe object i, wl
i the weight l of the object i, bl the capacity of the knapsack l andzk the value taken by the objective k.
5.2. Data sets
We use the knapsack instances published by Zitzler [33]. The data sets in-clude 250, 500 and 750 objects, with two objectives and two constraints or threeobjectives and three constraints.
We have generated a minimal complete set of the efficient solutions of the twoobjectives instances which is particularly useful to measure the quality of the ap-proximations, by applying a lexicographic method [29] coupled with the commer-cial CPLEX solver. We did not use the solutions published by Zitzler [33], becausewe noted that they were some mistakes in these solutions (solutions are missing),probably due to a bad parameterization of the solver employed by Zitzler.
For the three objectives instances, we approximate the efficient solutions by ap-plying several times the MEMOTS and MOGLS methods during a great iterationsnumber. We then retain only the non-dominated solutions.
However, these sets are not optimal and a new non-dominated solution could befound by one of the algorithms tested in this chapter, what can very often arrivesince the number of non-dominated solutions of the three objectives instances ofthe knapsack problem tested in this paper is very high. The quality indicators ofthe algorithm would be penalized because the distance between the new solutionand the reference set would be non-null. Thus, we improve in an artificial way thesereference sets by adding a certain value ε to the evaluation of each solution of thereference sets. The value is determined experimentally: the value must be smallbut sufficiently large in order to avoid the problem of generation of non-dominatedsolutions not being in the reference sets.
It should be noted that, thereafter, when we will speak about, for example, the250-2 instance, it will mean the instance with 250 objects and two objectives.
5.3. Adaptation of the MEMOTS algorithm to the knapsack problem
To adapt the MEMOTS algorithm to the knapsack problem, we have to definea crossover operator, the neighborhood and the tabu list management of the PRTSmethod and also a means of generating an initial population.
MEMOTS: A MEMETIC ALGORITHM 17
5.3.1. Crossover operator
We must define the crossover operator and also a repair procedure for a solutionthat does not respect the constraints of the knapsack problem, what can arriveafter the recombination of the two solutions X1 and X2.
The crossing is carried out thanks to a one-point operator starting from the twosolutions X1 and X2. As this operation can produce two solutions, we keep onlythat which has the left part of X1 and the right part of X2, which gives a newsolution called X3.
The solution X3 can then not respect the constraints problem. We thus applya repair procedure, inspired by the Michalewicz and Arabas procedure [25] for thesingle objective knapsack problem, which consists in removing the objects j in theincreasing order of the following ratio:
K∑k=1
λkckj
q∑l=1
(wl
j ·max(0,
n∑i=1
wlixi − bl
))
until satisfaction of the constraints.For an object j, this ratio corresponds to the linear aggregation of the profits
generated by the object on the sum of the weights of the object in the different bags,by only considering the bags that violate the capacity constraints and by givingmore importance to the bags whose constraints are strongly transgressed (mea-sured by
∑ni=1 wl
ixi− bl). This procedure is also used in the MOGLS method [19].In MOGLS, the weight set λ is the same weight set than the one employed to
build the scalarizing function used for the selection of X1 and X2. In the MEMOXscheme, a scalarizing function is not employed in the selection, and the use of arandom weight set could lead to a solution X3 being enough far from X1 and X2,and thus not being located in a zone of minimal density.
So, the weight set is determined according to the efficient solution X1 selected,in order to guarantee that the better the evaluation of the solution X1 accordingto an objective is, the more the value of the weight according to this objective willbe high. The computation formula of the weight set λ is thus the following one:
λk =R(k, zk(X1)
)K∑
k=1
R(k, zk(X1)
) k = 1, . . . , K
where the function R(k, zk(X1)
)gives the number of potentially efficient solutions
whose evaluation according to the objective k is lower (or higher if the objectivemust be minimized) than zk(X1). The value of this function is ranged between 0and |PE| − 1, where |PE| represents the number of potentially efficient solutions.
18 THIBAUT LUST AND JACQUES TEGHEM
In this way, we obtain a weight set for the repair procedure which goes in thedirection of the minimal density solution X1.
5.3.2. Neighborhood
The neighborhood N(X) used in the PRTS algorithm, which must allow togenerate several good solutions from only one, is defined in the following way:
• Generate a weight set λ;• Create a list containing the objects j present in the current solution X
(identified by xj = 1) sorting out it in the increasing order of the followingratio:
K∑k=1
λkckj
q∑l=1
wlj
·
The objects placed at the beginning of the list are thus the objects of lowratio profit/weight. The size of the list is limited at β percent of no, withno equal to the number of objects present in the solution X .• Generation of the neighbors:
– Remove a combination of m objects from the solution X by randomlyselecting them from the list.
– Fill to the maximum the bags with the objects j not in the solutionX (identified by xj = 0) taken in the decreasing order of the followingratio:
K∑k=1
λkckj
q∑l=1
(wl
j
bl −∑n
i=1 wlixi
+ 1
)
This procedure is also used in MOGLS [19], and consists in filling thebags with the objects of high profit and low weight, by giving higherinfluence to the bags whose the load (measured by
∑ni=1 wl
ixi) is closeto the maximum capacity (bl).
So, roughly speaking, the neighbors are generated by removing the ‘worst’ objectsfrom the current solution and by adding the ‘best’ objects not in the current solu-tion. We fix the number of neighbors generated at each iteration to the minimumbetween β ·no (size of the list) and Cβ·no
m (number of combinations of objects thatcan be removed). If the number m of objects that have to be removed is higherthan β · no, we only remove β · no objects.
For the first iteration of the tabu search PRTS, the weight set λ used is theweight set determined in the crossover operator (this weight set is thus determinedeven if the solution X3 respects the constraints). The weight sets for the nextiterations are randomly generated.

MEMOTS: A MEMETIC ALGORITHM 19
The neighborhood parameters are thus β, the percentage of objects present inthe solution X appointed at being removed and m, the number of objects removed.The influence of these two parameters are studied at Section 6.2.1.
The movement can thus be characterized by an array giving the objects removedand by the weight set used to select the objects filling the bags. These two variablesare considered as the movement attribute.
5.3.3. Tabu list management
At each movement X ← Y ∗, we record only a part of the movement attribute,namely the array giving the objects removed. The choice of these objects to fillthe bags is then forbidden for the t (tabu tenure) next iterations.
5.3.4. Initial population generation
The initial population is simply generated by application of the PRTS methodstarting from a solution randomly generated, and by using for the neighborhood arandom weight set. The generation of the initial population is stopped when r +1non-dominated solutions has been generated.
6. Results
Initially, we present the influence of the selection based on the density measure.Then, a study of the influence of the parameter values on the performances ofthe MEMOTS algorithm is carried out, which gives a very useful help to set theparameters employed for the performances comparison, presented at the end ofthis section.
To realize these experimentations, the basic values employed for the variousparameters are presented in table 1, where n corresponds to the iterations number,β and m are the neighborhood parameters, density is the density threshold fromwhich the number of divisions of the hypergrid is increased by the value taken bythe step parameter (the starting number of divisions is fixed at 5), r is the numberof solutions taken into account for the selection of the closest solution to the firstparent and itstop is the iterations number of the local search without improvementafter which the local search is stopped; itstop equal to 0 means that only oneiteration of the tabu search is realized. The computer used for the experiments isa 3 GHz Pentium IV and 20 runs of the algorithms are performed each time.
6.1. Influence of the selection based on the density measure
We compare in this section the performances of two ways of selection of thefirst parent, an important point of the MEMOX scheme:
• random selection of the first parent;• selection based on the density measure.

20 THIBAUT LUST AND JACQUES TEGHEM
Table 1. Parameter values of MEMOTS used for the study ofthe parameters influence.
Instance n β m density step t r itstop250-2 7500 10 1 3 5 5 20 0500-2 10000 10 1 3 5 5 20 0750-2 12500 10 1 3 5 5 20 0250-3 10000 10 1 5 5 5 20 0500-3 12500 5 2 5 5 5 20 0750-3 15000 5 3 5 5 5 20 0
Figure 8. Influence of the selection based on the density measurefor the 250-3 instance. On the left: random selection. On theright: selection based on the density measure.
We represent at Figure 8 the influence of the way to select the first parent on theperformances of the algorithm.
The graphs represent the evolution of the indicators D1 and D2 according tothe iterations number n for the 250-3 instance, and for the two ways of selectingthe first parent. We chose to represent the data in the form of ‘Box-and-WhiskerPlot’, allowing to reproduce the distribution of the variable studied. The ends ofthe box represent the first and third quartiles of the distribution and the horizontalline in the box gives the median. We also added segments at the ends of the

MEMOTS: A MEMETIC ALGORITHM 21
box up which go up to the extreme values of the distribution. We note thatif the selection of the first parent is carried out in a random way, the speed ofconvergence of the indicator D1 is slightly lower than if the first parent selectedis that of minimal density, although the end value is of the same quality. On theother hand, for the D2 indicator, convergence is not only slower, but moreover,the final distribution is of worse quality (higher value of the median and strongvariations in the distribution). The interest to select the parent of minimal densityis thus rather large, but essentially in order to reduce the D2 indicator.
6.2. Parameters tuning
6.2.1. Neighborhood parameters
We have to set the β parameter (related to the number of objects present inthe current solution that can be removed from the current solution) and the mparameter (number of objects removed to generate a neighbor). We can see atFigures 9 and 10 the influences of the β and m parameters on the D1 and D2
indicators for all the instances treated in this paper. To ensure the visibility of thegraphs, we only indicate the average value obtained by the D1 and D2 indicators.
For the β parameter, a value equal to 10 seems good, since there are no moresignificant improvements after 10. For the m parameter, it appears that to mini-mize the D1 indicator, it is preferable to remove only one object (m = 1), exceptfor the 750-3 instance. We can explain that by the fact that removing only oneobject improves the intensification property of the algorithm, although, for the750-3 instance, removing only one object is not sufficient. On the other hand, forinstances with more than 250 objects, to minimize D2, it is better to remove morethan one object (m > 1). But removing one object in the place of removing morethan one object has only large influence on the D2 indicator for the instances withmore than 2 objectives and more than 250 objects (500-3 and 750-3).
So, it is more difficult to set parameters of multiobjective metaheuristics, be-cause various contradictory criteria occur in the performance measure. Conse-quently, we will use for the parameter values, a compromise between intensification(D1 minimization) and diversification (D2 minimization).
6.2.2. Influence of the density threshold
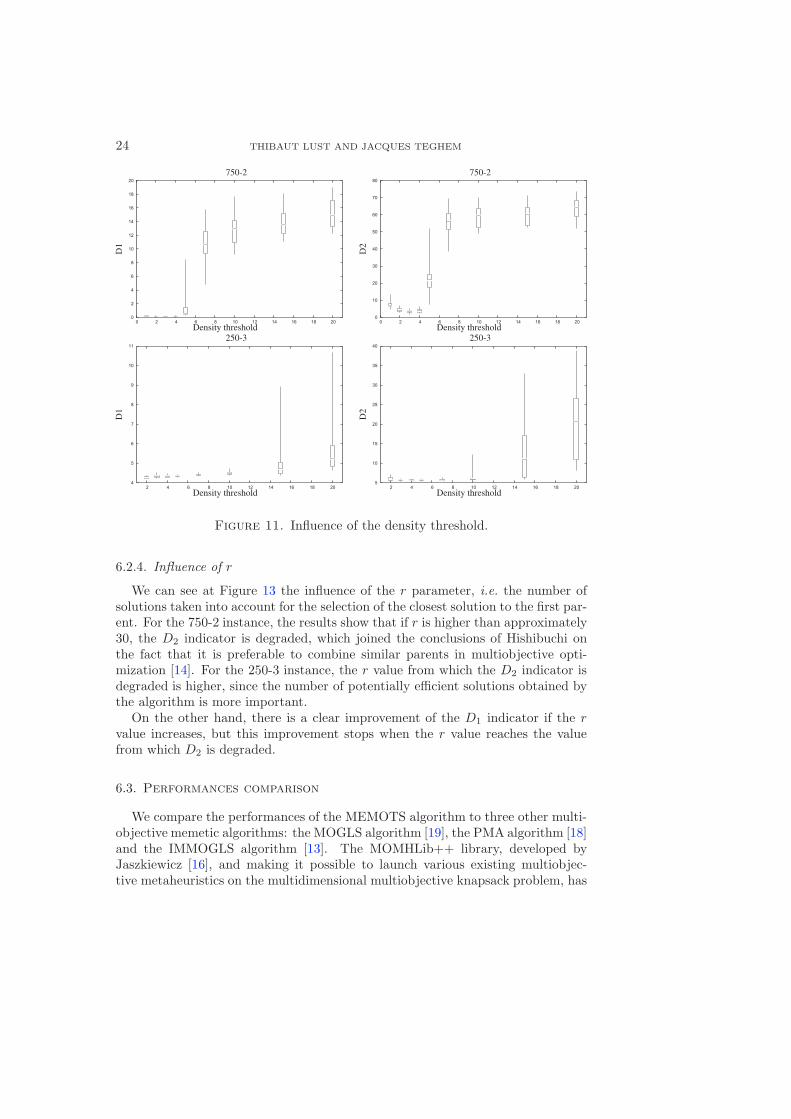
We study in this section the influence of the mean density threshold from whichthe number of division of the hypergrid is increased. We can see at Figure 11 theinfluence of this threshold on the D1 and D2 indicators for the 750-2 and 250-3instances.
We note that a value equal to 3 seems the best value for both instances andusing a value upper to 4 for the two objectives instance and upper to 10 for thethree objectives instance strongly degrades the performances. We also studiedthe influence of the threshold on the other instances and we obtained the sameconclusion.

22 THIBAUT LUST AND JACQUES TEGHEM
Figure 9. Neighborhood - 2 objectives instances. � : m = 1,× : m = 2, � : m = 3.
So as mention at Section 2.2, it’s quite easy to set this parameter, since a valuearound 3 gives good performances for all the instances.
6.2.3. Influence of itstop
The influence of the iteration count itstop without improvement after whichthe local search is stopped is represented at Figure 12 for the 500-2 and 500-3instances.
For the 500-2 instance, a value of itstop equal to 1 seems to be an optimal valuesince this value makes it possible to minimize at the same time the D1 and D2
indicators.
MEMOTS: A MEMETIC ALGORITHM 23
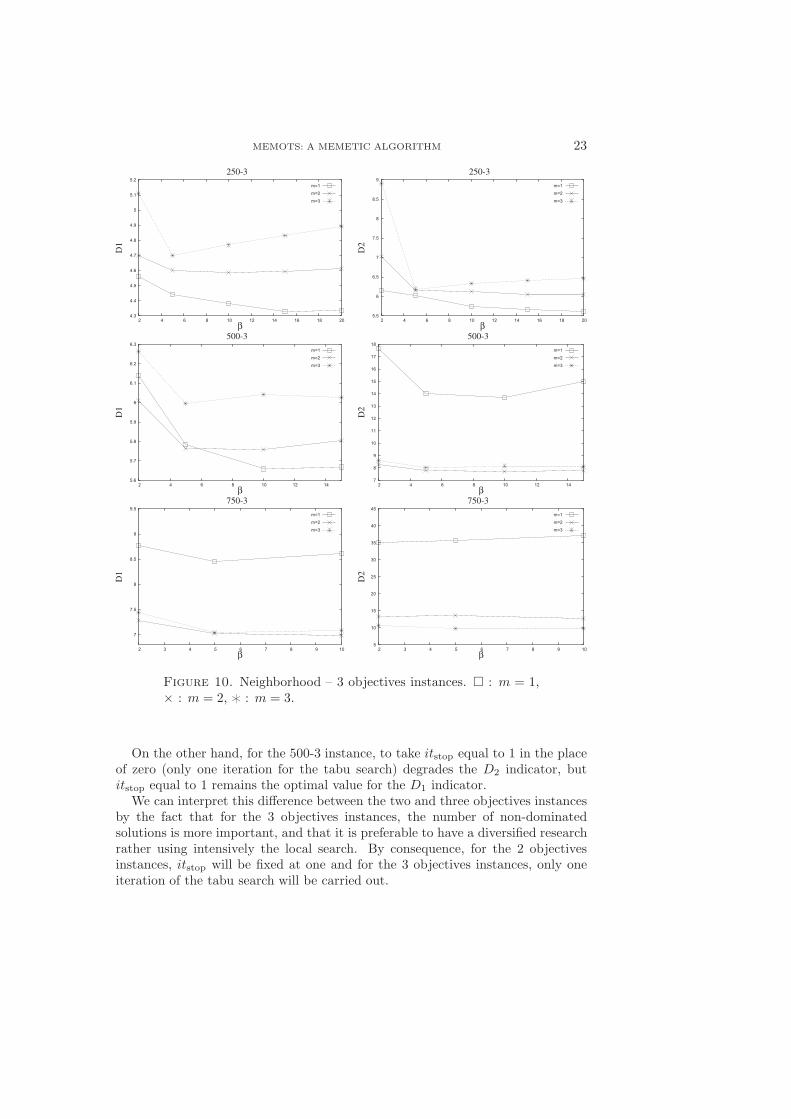
Figure 10. Neighborhood – 3 objectives instances. � : m = 1,× : m = 2, � : m = 3.
On the other hand, for the 500-3 instance, to take itstop equal to 1 in the placeof zero (only one iteration for the tabu search) degrades the D2 indicator, butitstop equal to 1 remains the optimal value for the D1 indicator.
We can interpret this difference between the two and three objectives instancesby the fact that for the 3 objectives instances, the number of non-dominatedsolutions is more important, and that it is preferable to have a diversified researchrather using intensively the local search. By consequence, for the 2 objectivesinstances, itstop will be fixed at one and for the 3 objectives instances, only oneiteration of the tabu search will be carried out.
24 THIBAUT LUST AND JACQUES TEGHEM
Figure 11. Influence of the density threshold.
6.2.4. Influence of r
We can see at Figure 13 the influence of the r parameter, i.e. the number ofsolutions taken into account for the selection of the closest solution to the first par-ent. For the 750-2 instance, the results show that if r is higher than approximately30, the D2 indicator is degraded, which joined the conclusions of Hishibuchi onthe fact that it is preferable to combine similar parents in multiobjective opti-mization [14]. For the 250-3 instance, the r value from which the D2 indicator isdegraded is higher, since the number of potentially efficient solutions obtained bythe algorithm is more important.
On the other hand, there is a clear improvement of the D1 indicator if the rvalue increases, but this improvement stops when the r value reaches the valuefrom which D2 is degraded.
6.3. Performances comparison
We compare the performances of the MEMOTS algorithm to three other multi-objective memetic algorithms: the MOGLS algorithm [19], the PMA algorithm [18]and the IMMOGLS algorithm [13]. The MOMHLib++ library, developed byJaszkiewicz [16], and making it possible to launch various existing multiobjec-tive metaheuristics on the multidimensional multiobjective knapsack problem, has

MEMOTS: A MEMETIC ALGORITHM 25
Figure 12. Influence of itstop.
been used to generate the results of these three algorithms (but has not beenemployed to generate the MEMOTS results). The values used for the variousparameters of these algorithms correspond to the default values defined in thelibrary.
We do not employ for the comparison the memetic algorithm M-PAES [22],because it has been shown by Ishibuchi [12] that the performances of MOGLSwere better than M-PAES on the knapsack problem. Also, we do not use the clas-sic multiobjective genetic algorithms SPEA [36] and NSGA-II [6] because severalstudies [1,2,17,19] have shown than MOGLS outperforms these methods.
It should be noted that we do not employ the solutions of MOGLS publishedon the web site of Jaszkiewicz [16] because the specific procedures to the knap-sack problem integrated in the MOGLS algorithm which made it possible togenerate these solutions [15] do not correspond to the last procedures used byJaszkiewicz [20] (and also employed in the MEMOTS method). Thus, we usethe library of Jaszkiewicz (where the last MOGLS adaptation is implemented) togenerate better solutions that those published.
The values of the parameters used by MEMOTS for the comparison are givenat Table 2. The iterations number has been fixed to the same number employedby the other memetic algorithms used for the comparison. The values of the other

26 THIBAUT LUST AND JACQUES TEGHEM
Figure 13. Influence of r.
Table 2. Parameter values of MEMOTS used for the perfor-mances comparison.
Instance n β m density step t r itstop250-2 7500 10 1 3 5 3 30 1500-2 10000 10 1 3 5 5 30 1750-2 12500 10 1 3 5 7 30 1250-3 10000 10 1 3 5 / 200 0500-3 12500 5 2 3 5 / 300 0750-3 15000 5 3 3 5 / 400 0
parameters were fixed by considering the results of the preceding section presentingthe influence of the parameter values on the MEMOTS performances.
We represent at Tables 3 and 4 the average value for the various indicators ofquality obtained by the four memetic algorithms on all the knapsack instancesstudied in this paper (for each instance, the results correspond to the four firstlines).
For the two objectives instances, MEMOTS outperforms the other algorithmsfor the D1 indicator, the percentage of efficient solutions found, the spacing metric,the number of potentially efficient solutions found and the R measure. The D2
indicator of the other memetic algorithms is slightly better than MEMOTS on the

MEMOTS: A MEMETIC ALGORITHM 27
Table 3. Comparison of the MEMOTS, MOGLS, IMMOGLSand PMA indicators for the 2 objectives instances.
Instance Algorithm H(107) SM R D1 D2 |EP | |PE| Time(%) (S)
250-2
MEMOTS 9.87 3.00 246.56 0.083 1.91 21.51 399.25 4MOGLS 9.86 4.22 248.97 0.23 2.69 3.96 202.35 7IMMOGLS 9.86 7.03 253.44 0.55 3.88 0.84 82.80 6PMA 9.86 4.59 249.69 0.28 2.51 2.80 169.30 5GREEDY 9.85 9.69 256.78 0.72 3.88 0.75 42.50 2MEMOTS+ 9.87 3.07 246.49 0.073 1.08 25.01 393.20 6
500-2
MEMOTS 40.77 2.62 432.53 0.10 3.12 2.72 828.30 15MOGLS 40.76 4.48 435.88 0.25 2.41 0.32 281.85 22IMMOGLS 40.74 7.79 441.06 0.51 2.29 0.067 96.40 23PMA 40.76 4.68 436.41 0.27 2.86 0.30 260.35 20GREEDY 40.74 8.88 442.24 0.58 2.49 0.081 73.75 13MEMOTS+ 40.78 2.61 431.89 0.074 2.24 6.19 844.30 28
750-2
MEMOTS 89.30 2.57 744.63 0.11 3.83 0.16 1455.80 40MOGLS 89.33 5.41 750.01 0.29 1.49 0.081 329.25 53IMMOGLS 89.31 8.73 755.82 0.52 2.13 0.066 121.60 57PMA 89.33 5.44 750.13 0.30 1.51 0.094 323.45 50GREEDY 89.31 9.03 756.84 0.57 2.52 0.076 109.90 37MEMOTS+ 89.35 2.53 743.47 0.070 1.52 1.15 1557.85 77
500-2 and 750-2 instances. The hypervolume of MEMOTS is better than the otheralgorithms, except for the 750-2 instance.
For the 250-3 instance, MEMOTS is better than the other algorithms on all thequality indicators. For the 500-3 and 750-3 instances, MEMOTS is better thanMOGLS and PMA only for the SM and |PE| indicators, but remains better thanIMMOGLS for the 500-3 instance.
To take into account the variations in the results of the algorithms, we alsocarried out the non-parametric statistical test of Mann-Whitney [5], allowing tocompare the MEMOTS distributions to the distributions of the other algorithms.
The results of the comparison of MEMOTS with the three other memetic algo-rithms are given to the Tables 5 and 6. We used only the D1 and D2 indicators,particularly revealing. We test the following assumption: ‘an algorithm is betterthan an other’ for the D1 or D2 indicator on a given instance. When the assump-tion is checked, the result ‘>’ (MEMOTS is better) or ‘<’ (MEMOTS is worse) isgiven as well as the value of the corresponding risk (the ‘p-value’, given betweenbrackets). When the assumption is not checked, the sign ‘=’ is indicated.
28 THIBAUT LUST AND JACQUES TEGHEM
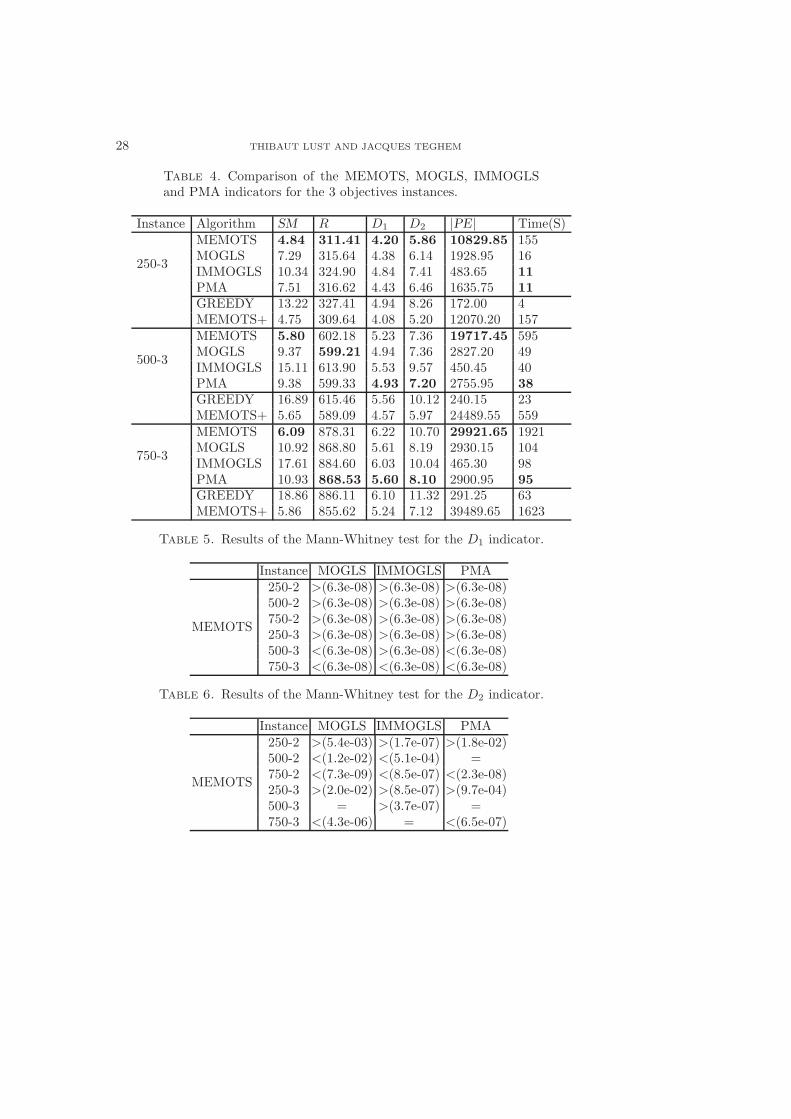
Table 4. Comparison of the MEMOTS, MOGLS, IMMOGLSand PMA indicators for the 3 objectives instances.
Instance Algorithm SM R D1 D2 |PE| Time(S)
250-3
MEMOTS 4.84 311.41 4.20 5.86 10829.85 155MOGLS 7.29 315.64 4.38 6.14 1928.95 16IMMOGLS 10.34 324.90 4.84 7.41 483.65 11PMA 7.51 316.62 4.43 6.46 1635.75 11GREEDY 13.22 327.41 4.94 8.26 172.00 4MEMOTS+ 4.75 309.64 4.08 5.20 12070.20 157
500-3
MEMOTS 5.80 602.18 5.23 7.36 19717.45 595MOGLS 9.37 599.21 4.94 7.36 2827.20 49IMMOGLS 15.11 613.90 5.53 9.57 450.45 40PMA 9.38 599.33 4.93 7.20 2755.95 38GREEDY 16.89 615.46 5.56 10.12 240.15 23MEMOTS+ 5.65 589.09 4.57 5.97 24489.55 559
750-3
MEMOTS 6.09 878.31 6.22 10.70 29921.65 1921MOGLS 10.92 868.80 5.61 8.19 2930.15 104IMMOGLS 17.61 884.60 6.03 10.04 465.30 98PMA 10.93 868.53 5.60 8.10 2900.95 95GREEDY 18.86 886.11 6.10 11.32 291.25 63MEMOTS+ 5.86 855.62 5.24 7.12 39489.65 1623
Table 5. Results of the Mann-Whitney test for the D1 indicator.
Instance MOGLS IMMOGLS PMA
MEMOTS
250-2 >(6.3e-08) >(6.3e-08) >(6.3e-08)500-2 >(6.3e-08) >(6.3e-08) >(6.3e-08)750-2 >(6.3e-08) >(6.3e-08) >(6.3e-08)250-3 >(6.3e-08) >(6.3e-08) >(6.3e-08)500-3 <(6.3e-08) >(6.3e-08) <(6.3e-08)750-3 <(6.3e-08) <(6.3e-08) <(6.3e-08)
Table 6. Results of the Mann-Whitney test for the D2 indicator.
Instance MOGLS IMMOGLS PMA
MEMOTS
250-2 >(5.4e-03) >(1.7e-07) >(1.8e-02)500-2 <(1.2e-02) <(5.1e-04) =750-2 <(7.3e-09) <(8.5e-07) <(2.3e-08)250-3 >(2.0e-02) >(8.5e-07) >(9.7e-04)500-3 = >(3.7e-07) =750-3 <(4.3e-06) = <(6.5e-07)
MEMOTS: A MEMETIC ALGORITHM 29
We can thus affirm with a very low risk (equal to 6.3e-08) that, for the D1
indicator, MEMOTS is better than the three other algorithms for the 250-2, 500-2,750-2 and 250-3 instances. For the 500-3 instance, MEMOTS is of less quality thanPMA and MOGLS but remains better than IMMOGLS. For the 750-3 instance,MEMOTS is worse than the three other algorithms.
For the D2 indicator, MEMOTS is better than the three other memetic algo-rithms for the 250-2 and 250-3 instances. For the 500-3 instance, MEMOTS isincomparable with MOGLS and PMA but is better than MOGLS. For the theother instances, MEMOTS is either worse, or incomparable with the other algo-rithms.
We can explain that MEMOTS does not reach the performances of the othermemetic algorithms on certain instances and for certain indicators by the followingfact. The other memetic algorithms need two initialization phases. The aimof the first one is to provide an approximation of an ideal point, necessary tothe evaluation functions used in the various procedures of the algorithms. Thesecond one is employed to generate an initial population of solutions. A greedyalgorithm, particularly effective for the knapsack problem, is used. The MEMOTSalgorithm does not use this initialization phase, and starts from a simple solutionrandomly generated, to show that there is not a too great dependence between theperformances of the algorithm and the quality of the initialization phase.
To prove the importance of the initialization phase in the MOGLS, IMMOGLSand PMA algorithms, we add in Tables 3 and 4, the indicators values of thesolution set obtained after the initialization phase (called GREEDY) of the threeother memetic algorithms (which use the same initialization phase). We can seethat these results are already quite good, which means that the main iterationsof MOGLS, IMMOGLS and PMA do not bring so many improvements in thesolution set.
Moreover, we also add in the Tables 3 and 4 the results of MEMOTS, whichuses as initial solutions, the non-dominated solutions generated by the initializationphase of MOGLS, IMMOGLS and PMA (the GREEDY algorithm). These resultsare given under the name of MEMOTS+. In this way, although the execution timeof the algorithm increases for the 2 objectives instances, the application of thisinitialization phase makes it possible to improve the MEMOTS performances andto make MEMOTS+ better than the other algorithms on all the instances and forall the quality indicators used, except for the D2 indicator of the 750-2 instance.Thus, when for a given problem, an effective algorithm allowing to generate goodinitial solutions is available, it is interesting to use it in order to improve theMEMOTS performances, but it’s not essential since the MEMOTS performancesstarting from a simple solution randomly generated remain very good.
For the execution time, we can see that MEMOTS is faster for the 2 objectivesinstances but for the 3 objectives instances, the MEMOTS time is higher thanthe others algorithms. It is simply because the number of solutions generated byMEMOTS is very high in comparison to the other algorithms, and the updatingof the potentially efficient solution set as well as the calculation of the DPR rankstake more time in this case. On the other hand, the number of evaluations of the
30 THIBAUT LUST AND JACQUES TEGHEM
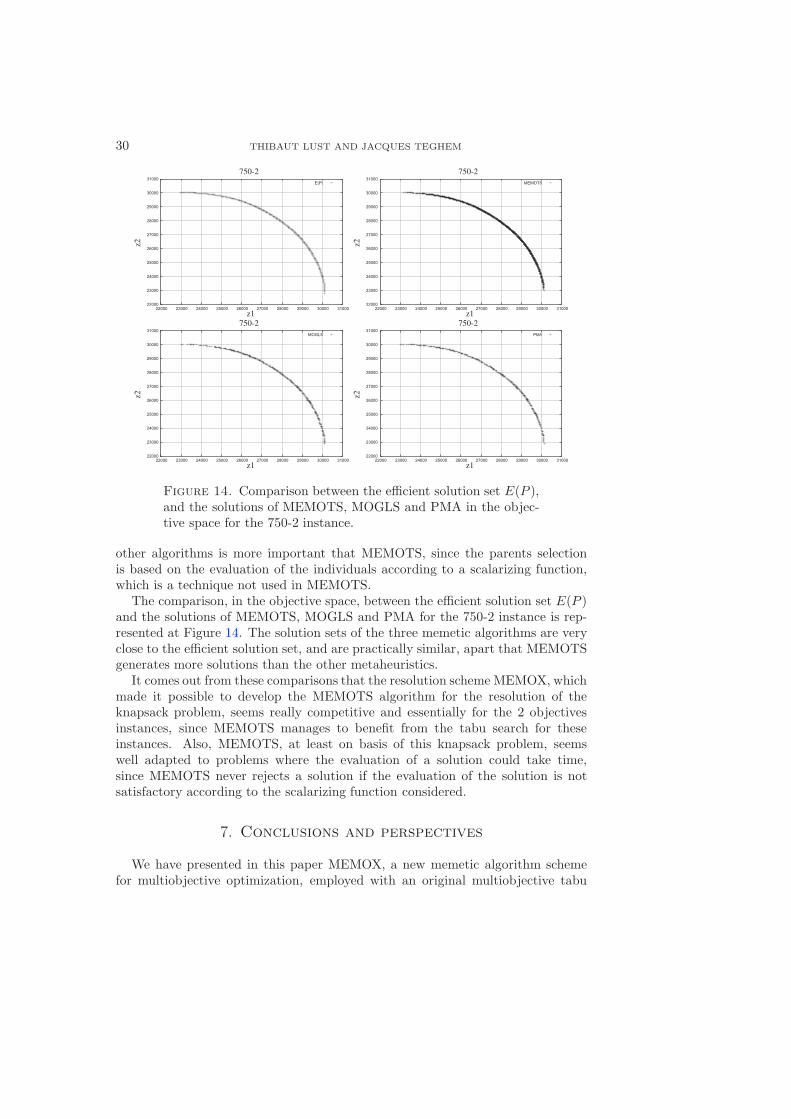
Figure 14. Comparison between the efficient solution set E(P ),and the solutions of MEMOTS, MOGLS and PMA in the objec-tive space for the 750-2 instance.
other algorithms is more important that MEMOTS, since the parents selectionis based on the evaluation of the individuals according to a scalarizing function,which is a technique not used in MEMOTS.
The comparison, in the objective space, between the efficient solution set E(P )and the solutions of MEMOTS, MOGLS and PMA for the 750-2 instance is rep-resented at Figure 14. The solution sets of the three memetic algorithms are veryclose to the efficient solution set, and are practically similar, apart that MEMOTSgenerates more solutions than the other metaheuristics.
It comes out from these comparisons that the resolution scheme MEMOX, whichmade it possible to develop the MEMOTS algorithm for the resolution of theknapsack problem, seems really competitive and essentially for the 2 objectivesinstances, since MEMOTS manages to benefit from the tabu search for theseinstances. Also, MEMOTS, at least on basis of this knapsack problem, seemswell adapted to problems where the evaluation of a solution could take time,since MEMOTS never rejects a solution if the evaluation of the solution is notsatisfactory according to the scalarizing function considered.
7. Conclusions and perspectives
We have presented in this paper MEMOX, a new memetic algorithm schemefor multiobjective optimization, employed with an original multiobjective tabu
MEMOTS: A MEMETIC ALGORITHM 31
search PRTS, what gave rise to the memetic algorithm MEMOTS. However, theMEMOX scheme can be used with any local search.
The experiments carried out on this algorithm made it possible to highlight thefollowing points:
• The problem of the parameters determination is even less obvious in mul-tiobjective optimization since various properties in the solution set arerequired.• The neighborhood must be adapted according to the instance. A question
arises then: why not use several neighborhoods, and using that which isbest adapted to the zone of the objective space where the current solutionis located. For example, if the solution is in a zone of low density, smallneighborhood step, and if the solution is in a zone of high density, greatneighborhood step.• The first parent selection based on the density measure improves the di-
versity of the solutions and the convergence speed.• The conclusions of Ishibuchi were confirmed: it is better to select two
parents quite close in the objective space.• The parameters of the dynamic hypergrid, making it possible to measure
the density of the individuals, are relatively easy to set, and this techniquecould be easily integrated in other multiobjective algorithms.• The use of tabu search did not appear necessary for the 3 objectives in-
stances, where it is preferable to use a diversified exploration of the re-search space.
Also, the comparisons of the MEMOTS performances with other multiobjectivememetic algorithms showed the excellent properties of the algorithm. To reducethe computational time of MEMOTS on the instances with more than two ob-jectives, one point of view would be to reduce the number of solutions generated(if only a small set of diversified solutions is required), while being based on the(1+1)-PAES method [21], where new solutions are rejected if they do not bringdiversity, measured by the hypergrid.
The diversity in the solution sets obtained could also be improved by using amore diversified population of solutions, i.e. which is not only composed of non-dominated solutions.
Lastly, the adaptation of MEMOTS to other multiobjective combinatorial opti-mization problems will be interesting, to see if the performances of MEMOTS areconfirmed and if the facility of determination of the parameters of the hypergridis always present.
References
[1] V. Barichard and J-K. Hao, Genetic tabu search for the multi-objective knapsack problem.J. Tsinghua Sci. Technology 8 (2003) 8–13.
[2] V. Barichard and J.K. Hao, An empirical study of tabu search for the mokp, in Series ofInformation & Management Sciences, editor, in Proc. of the First International Workshopon Heuristics, China (2002) Vol. 4, 47–56.

32 THIBAUT LUST AND JACQUES TEGHEM
[3] Y. Collette and P. Siarry, Optimisation multiobjectif. Eyrolles (2002).[4] P. Czyzak and A. Jaszkiewicz, Pareto simulated annealing – a metaheuristic technique for
multiple-objective combinatorial optimization. J. Multi-Crit. Decis. Anal. 7 (1998) 34–47.[5] P. Dagnelie, Statistique theorique et appliquee. De Boeck-Universite, Bruxelles (1998).[6] K. Deb, S. Agrawal, A. Pratab and T. Meyarivan, A Fast Elitist Non-Dominated Sorting
Genetic Algorithm for Multi-Objective Optimization: NSGA-II, in Proc. of the ParallelProblem Solving from Nature VI Conference, Paris, France (2000). Springer Lect. NotesComput. Sci. 1917 (2000) 849–858.
[7] K. Deb and D.E. Goldberg, An investigation of niche and species formation in geneticfunction optimization, in Proc. of the 3rd International Conference on Genetic Algorithmsedited by J.D. Schaffer, Washington. Morgan Kaufmann Publishers, San Francisco, CA,USA (1989) 42–50.
[8] M. Ehrgott and X. Gandibleux, Multiple Criteria Optimization: State of the Art AnnotatedBibliographic Surveys. Kluwer Academic Publishers, Boston (2002).
[9] S. Elaoud, T. Loukil and J. Teghem, Pareto fitness genetic algorithm. Eur. J. Oper. Res.177 (2007) 1703–1719.
[10] X. Gandibleux, M. Sevaux, K. Sorensen and V. T’Kindt, Metaheuristics for MultiobjectiveOptimisation. Springer (2004).
[11] F. Glover and M. Laguna, Tabu Search. Kluwer Academic Publishers, Dordrecht, TheNetherlands (1998).
[12] H. Ishibuchi and S. Kaige, Comparison of Multiobjective Memetic Algorithms on 0/1 Knap-sack Problems, in 2003 Genetic and Evolutionary Computation Conference. Workshop Pro-gram, edited by Alwyn Barry, Chicago, Illinois, USA. AAAI (2003) 222–227.
[13] H. Ishibuchi and T. Murata, Multi-Objective Genetic Local Search Algorithm. in Proc. ofthe 1996 International Conference on Evolutionary Computation, edited by Nagoya, JapanToshio Fukuda and Takeshi Furuhashi. IEEE (1996) 119–124.
[14] H. Ishibuchi and K. Narukawa, Recombination of Similar Parents in EMO Algorithms, InEvolutionary Multi-Criterion Optimization. edited by C.A. Coello Coello, A. HernandezAguirre, and E. Zitzler Third International Conference, EMO 2005, Guanajuato, Mexico.Springer. Lect. Notes Comput. Sci. 3410 (2005) 265–279.
[15] A. Jaszkiewicz, Genetic Local Search for Multiple Objective Combinatorial Optimization.Technical Report RA-014/98, Institute of Computing Science, Poznan University of Tech-nology (1998).
[16] A. Jaszkiewicz, Experiments done with the momhlib: http://www-idss.cs.put.poznan.pl/jaszkiewicz/momhlib/. Technical report (2000).
[17] A. Jaszkiewicz On the Performance of Multiple-Objective Genetic Local Search on the 0/1Knapsack Problem – A Comparative Experiment. Technical Report RA-002/2000, Instituteof Computing Science, Poznan University of Technology, Poznan, Poland, July (2000).
[18] A. Jaszkiewicz, A comparative study of multiple-objective metaheuristics on the bi-objectiveset covering problem and the Pareto memetic algorithm. Technical Report RA-003/01, In-stitute of Computing Science, Poznan University of Technology, Poznan, Poland (2001).
[19] A. Jaszkiewicz, Genetic Local Search for Multiple Objective Combinatorial 0ptimization.Eur. J. Oper. Res. 137 (2002) 50–71.
[20] A. Jaszkiewicz, On the Performance of Multiple-Objective Genetic Local Search on the 0/1Knapsack Problem – A Comparative Experiment. IEEE Trans. Evol. Comput. 6 (2002)402–412.
[21] J. Knowles and D. Corne, The Pareto Archived Evolution Strategy: A New Baseline Al-gorithm for Multiobjective Optimisation, in 1999 Congress on Evolutionary Computation,Washington, D.C., July 1999. IEEE Service Center (1999) vol. 1, 98–105.
[22] J. Knowles and D. Corne, M-PAES: A Memetic Algorithm for Multiobjective Optimization.In 2000 Congress on Evolutionary Computation, Piscataway, New Jersey, July 2000. IEEEService Center (2000) vol. 1, 325–332.

MEMOTS: A MEMETIC ALGORITHM 33
[23] J. Knowles and D. Corne, Memetic algorithms for multiobjective optimization: issues, meth-ods and prospects, in Recent Advances in Memetic Algorithms, edited by N. Krasnogor, J.E.Smith, and W.E. Hart, Springer (2004) 313–352.
[24] T. Lust and J. Teghem, PRTS+D et MEMOTS : Nouvelles Metaheuristiques pourl’Optimisation Combinatoire Multicritere. In Actes des articles longs selectionnes lors du7eme congres de la roadef, Lille, February 2006. Presses Universitaires de Valenciennes,(2006) 137–151.
[25] Z. Michalewicz and J. Arabas, Genetic algorithms for the 0/1 knapsack problem. In Method-ologies for Intelligent Systems Conference (ISMIS), edited by Z.W Ras and M. Zemankova.Berlin (1994) 134–143.
[26] P. Moscato, On evolution, search, optimization, genetic algorithms and martial arts: towardsmemetic algorithms. Technical Report C3P 826, Caltech Concurrent Computation Program(1989).
[27] J.R. Schott, Fault tolerant design using single and multicriteria genetic algorithm optimiza-tion. Ph.D. thesis, Institute of Technology, Department of Aeronautics and Astronautics,Massachusetts (1995).
[28] N. Srinivas and K. Deb, Multiobjective Optimization Using Nondominated Sorting in Ge-netic Algorithms. Evol. Comput. 2 (1994) 221–248.
[29] R. Steuer, Multiple Criteria Optimization: Theory, Computation and Applications. JohnWiley & Sons, New-York (1985).
[30] E-G. Talbi, A taxonomy of hybrid metaheuristics. J. Heuristics 8 (2002) 541–564.[31] E.L. Ulungu, J. Teghem, Ph. Fortemps and D. Tuyttens, MOSA Method: A Tool for Solving
Multiobjective Combinatorial Optimization Problems. J. Multi-Criteria Decision Analysis8 (1999) 221–236.
[32] L. While, L. Bradstreet, L. Barone and P. Hingston, Heuristics for optimising the calcula-tion of hypervolume for multi-objective optimisation problems. In Proc. of the 2005 IEEECongress on Evolutionary Computation, Edinburgh, UK (2005).
[33] E. Zitzler, http://www.tik.ee.ethz.ch/∼zitzler/testdata.html.
[34] E. Zitzler, Evolutionary Algorithms for Multiobjective Optimization: Methods and Appli-cations. Ph.D. thesis, Swiss Federal Institute of Technology (ETH), Zurich, Switzerland,November (1999).
[35] E. Zitzler, M. Laumanns, L. Thiele, C. M. Fonseca and V. Grunert da Fonseca, Why Qual-ity Assessment of Multiobjective Optimizers Is Difficult. in Proc. of the Genetic and Evo-lutionary Computation Conference (GECCO’2002), edited by W.B. Langdon, E. Cantu-Paz, K. Mathias, R. Roy, D. Davis, R. Poli, K. Balakrishnan, V. Honavar, G. Rudolph,
J. Wegener, L. Bull, M.A. Potter, A.C. Schultz, J.F. Miller, E. Burke, and N. Jonoska, July2002. Morgan Kaufmann Publishers, San Francisco, CA, USA (2002) 666–673.
[36] E. Zitzler and L. Thiele, Multiobjective Evolutionary Algorithms: A Comparative CaseStudy and the Strength Pareto Approach. IEEE Trans. Evol. Comput. 3 (1999) 257–271.