thilageswary kumutharanjan (1) study of the efficacy of … · 2015-07-20 · siddha maruthuvam....
TRANSCRIPT

[ 1 ]
Abstract: The disease moolaroga is caused by eatingJams (Excluding KarunaiKizhangu) hot food items inexcess, taking dull food, sitting in a position at longduration ,riding at horse backs, practicing yogaexcessively, suppressing breathing women at the periodof expecting a child, hereditary (K.N. Kuppusamymudaliyar-1989, yogi maamunivar-1998)
The common symptoms are faeces passing out invery dried condition, passing out in the form of piecesof curd, passing out in pointed form and blossominglike lotus bud and air passing out, along with that, likedrops of honey coming out from lotus flower. Faecescome out in liquidized state with noise of pouring ofwater. There will be pain when the stools pass out,blood will bleed out,
To study the efficacy of Karunaikizhanguthandu -choornam in clinical patients suffering frommoolarogam. It is a Quasi experimental studyconducted at Govt Siddha Ayurvedic clinicsfunctioning under vadamarachy area. A population of90 patients both males and females between the age of30-60 yrs were selected. Patients reporting withirritation and itching at the anus, constipation,bleeding after daefacation, burning sensation at theanal canal, aching discomfort and exacerbated bydaefacation were selected for observation. Patients withthrombosed or strangulated haemorrhoids with acutepain, third degree piles remain outside of the analcanal margin and severe anaemia were excluded in this
study. This choornam consist of Typhoniumtrilobatumbased on a recommendation of Murugesamuthaliyar,Gunapadam –part -1 and K.N KupusamyMudaliyar-Siddha Maruthuvam.
Among the selected 90 patients were treated withthis choornam at the rate of 5 gram for a period of 48-49 days by oral administration twice a day with ghee
Continuous observation of the patients was doneat weekends. With this observation was continued for49 days. Continuous observations on signs andsymptoms such as irritation, constipation, and itchingin anal region were gradually disappeared among 80%of patients at the end of two weeks. Other signs suchas bleeding after defecation , burning sensation aroundthe anal canal, discomfort and pain exacerbated bydefecation were recorded in 70% of the above 80% ofpatients until 5th week and these were disappearedgradually during 6- 7th weeks. 10% of the patients werenot corporate with the treatment. . Who observed alldiet restrictions. But no significant changes wereobserved in 10 % of the patients of using thischooranam who ignored above food restriction. 10%of the patients were not corporate with the treatment.The result reveals that this KarunaiKilanguthandu -choornam is the best healer of moolanoi and it ensuredno any adverse effects among users in study area.
Keywords: Moolanoi, Haemorrhoids, SiddhhaMedicine, Karunaikillangu, Typhoniumtrilobatum
Thilageswary Kumutharanjan(1)
Study of the efficacy of KarunaiKizhanguthand uchoornam (Typhoniumtrilobatum)
on clinical patients suffering from Moolanoi(Haemorrhoids) at Vadamaraddchy area,
Jaffna(1) Unit of Siddha Medicine, University of Jaffna, Sri Lanka.
(email: [email protected])

Proceedings of the Third International Symposium,SEUSL: 6-7 July 2013, Oluvil, Sri Lanka
[ 2 ]
Introduction:
Moolaroga is enlarged, engorged and cushionsand these may bleed, prolapsed or result in minormucus or faecal leakage, particularly when passingflatus.
The disease MoolarogaNoi is called by differentnames MoolaNoi, ArippuNoi, AdimoolaNoi,EruvaaiMoolaNoi. Further If there is inflammation inone or more of the seven carborate pipes found in theintestinal path leading from lower intestine to Anus,there will be some kind of burning sensation andirritation in the mouth of anus and it will result inconstipation and the patient has to experiencedifficulty in passing out stools. The stools will be dryand when sent out forcibly it would cause abrasions inthe blood vessels and blood will ooze out and passalong with the stools and the resultis the disease piles.
“In books” Siddha Maruthuvam (K.N.KupusamyMauthaliyar HPIM – 1954). YoogiVaithiyaSinthamany(S.Piremachandrran – 1998) Sidha MaruthuvaNoinaada NoiMuthanaadalthirattu part II(Dr.S.Shanmugavel HPIM – 1955) the followingsymptoms are cited for this disease. Faeces passing outin very dried condition, passing out in the form ofpieces of curd, passing out in pointed form andblossoming like lotus bud and air passing out, alongwith that, like drops of honey coming out from lotusflower.Facescome out in liquidized state with noise ofpouring water, blood oozing out. These symptoms willappear.
There will be pain when the stools pass out,blood will bleed out, if one tries to push in the pointedstool, it will come out again and this process willcontinue. Finally after the stool is pushed in there willbe burning and pain. This pointed stool which ispushed in will become enlarged and will stay onpermanently without one’s knowledge this pointedstool could cause unbearable pain when anus contractsand could cause bleeding too.
In the same books the flowing have been Quotedas the causes of this disease as eating jams (Excludingkarunai) hot food items in excess, Sitting in a position,
Which may cause irritation to anus, riding athorsebacks, taking dull food practicing yogaexcessively, suppressing breathing women at the periodof expecting a child, when the embryo becomes Largerand larger the anus gets pressed Shorttime. It beamshereditary from either father or mother As a result ofthe above conditions the bottom part of the anusbecome brightened and increase of warmness of thelower part of anus will cause this disease.
In “Gunapadam – Part I page 185Typhoniumtrilabatum powder added with ghee isrecommended as a medicine for it. The other namesmentioned for it are “Sooranathandu”,“Karunaithandu”. Its botanical name is mentioned asTyphoniumtrilobatum and in English it is called astelugu potato amorphophalus (Elephant’s foot).
TyphoniumtrilobatumAgasthiyar’s verse is quotedbelow;
“rj;jFjhq;Fuj;ijJl;fgk; Nkijajp
fj;ijtpyf;Fq; fwpaikf;fpw; - gj;jp;akhQ;
rPuzj;ijaq;nfhbajPgdj;ijAq;nfhLf;FQ;
#uzj;jpd; jz;nldNtnrhy;”
Fzghlk; 1;k; ghfk; - (m.F) Page 185
Thereforepeel off the skin of the TyphoniumTrilabatum and washed then cut into small pieces anddried in shade and pounded in wooden motar, sievedin cloth (Vashirakayam) and preserved in on air tightcontainer.
Aim of the study:
To study the effectiveness of KarunaiKilanguthanduchoornam (Typhoniumtrilobatum) onthe patient affected by moolanoi and also this study hasnot been undertaken by any one up to now. Hence Ihave selected this research study.
Uses of the research
According to this research if this drug is found tobe effective for Moolanoi

The patients will be able to benefit with less cost
The establishments manufacturing these dragswill increase their production and there by distributeto other medical clinics also
Objective
General ObjectiveTo assess the effectiveness of Karunai
Kilanguthanduchoornam for Moolanoi
Specific ObjectiveTo observe the changes in symptoms of Moolanoi
by use of this ChooranamTo know the period need for cure of this diseaseTo study the influence of the diet and weather on
MoolaNoi
UtilityTyphoniumtrilobatumis used to keep under
control the Moolanoi
Methodology (by research)
The study procedure followed is as follows 90patients were selected from among those who came fortreatment at Govt Siddha Ayurvedic Medical clinicsand they were briefed about the research and theirwritten consent was obtained. The medical history ofthe patient, Inspection of the anal orifice was recordedin the case record prepared by the researcher.Thepatients were also instructed about diet restrictionsand also not to use any other drugs in this period.Before starting on the main research, pilot study wasmade on five Moolanoi patients.Permission for thestudy has been sought from the Chief medical officer,Govt Siddha Ayurveda Medical clinics functioning inVadamaradchyPiradeshasaba.
The patient was asked to report once in 07 daysfor 7 times and progress of signs and symptomsrecorded. The researcher observes the patient andassesses the progress. At the same time thecomplainswill also be entertained. The patient’sremarks of satisfaction regardingTyphoniumTrilabatum powder will be taken into
account. This observation and assessment will becontinued at the end of the next seven days too. Thepatient’s remarks about the nature of symptoms likeirritation, itching, constipation, bleeding afterdefecation, burning sensation in the anal region will berecorded through score scale.
The continuous observation of the patient at theend of each 1st, 2nd,3rd,4th 5th,6th& 7th were done for 7weeks.
The progress of sign and symptoms on eachpatient obtained and recorded as below
This will be recorded in the score scale.
Score Scale
Discussion and Conclusion
The collected data were statistically recorded andanalysis made according to the analysis. The signs andsymptoms such as irritation itching in analorifice,constipation were gradually disappeared among80 % of patients at the end of two weeks. Other signssuch as bleeding after defecations, burning sensationin the anal region discomfort and pain exacerbated bydefecation were recorded in 70% of the above 80 % ofpatients until 5th weeks and these were disappearedgradually during 6 -7 weeks. Who observed all dietrestrictions. But no significant changes were observed
[ 3 ]
Irritation
Itching
Constipation
Bleeding afterdefecation
Burningsensation in theanal region
Achingdiscomfort andpain exacerbatedby defecation
Symptoms
Weeks
1st 2nd 3rd 4th 5th 6th 7th
Thilageswary KumutharanjanStudy of the efficacy of KarunaiKizhanguthand uchoornam
Proceedings of the Third International Symposium,SEUSL: 6-7 July 2013, Oluvil, Sri Lanka
[ 4 ]
in 10 % of the patients of using this chooranam whoignored above food restriction. 10% of the patientswere not corporate with the treatment. The resultreveals that this KarunaiKilanguthanduchoornam isthe best healer of moolanoi and it ensured no anyadverse effects among users in study area.
Signs anal Symptoms of moolanoiare almostsimilar to hemorrhoids. Hence this Chooranam can beused in hemorrhoids without any adverse effectbecause of TyphoniumTrilabatum is a food product ofwhich we use in our day to day life.
References:
1. GeorgeBurkitt HClive..Quice R.G, EssentialSurgery 3rd edition
2. Ponniapillai I, Pararajasegaram, pp. 65.
3. MurugesuMudaliyar K S, Gunapadam, I,pp. 185.
4. KuppusamyMudaliyar K N 1954, SiddhaMaruthuvam pp. 1430.
5. Nadkarnis K M N, Indian MateriaMedicaPublication – Popular Prakashan Pvt. Ltd.
6. Shanmugavel S, Siddha, Maruthuva NoinaadalNoimuthnaadalthiraddu- Part II, pp 364.
7. YookiMamunivar, pp 261.

[ 5 ]
Abstract: An experiment was carried out toinvestigate the effect of liquid organic fertilizer (namedas Amuthakaraisal) on dry matter content ofgroundnut. The experimental design was randomizedcomplete block design (RCBD) with three replications.Treatments were defined as follows: T1-Recommended inorganic fertilizer application ascontrol, T2- Amuthakaraisal applied at fifteen days,T3- Amuthakaraisal applied at fifteen and thirty days,T4- Amuthakaraisal applied at fifteen, thirty and forty-five days and T5- Amuthakaraisal applied at thirty andforty-five days. The results revealed that there weresignificant (p<0.05) differences in fresh and dryweights of stem and highly significant (p<0.01)differences in fresh and dry weights of pods and plantbiomass among the treatments. The results showed thatthe plants responded best and gave higher biomass inT4 than that of the control. The dry weight of pods andtotal biomass increased by 22.99% and 26.36%respectively in T4 when compared to the control. Theresults indicated that continuous frequent applicationof Amuthakaraisal increased the dry matter content ofgroundnut. Application of Amuthakaraisal once infifteen days could be practiced to increase dry matterproduction. From this study, it could be stated that,Amuthakaraisal application at fifteen days regularinterval can be adapted by farmers in groundnutcultivation as it is less harmful to the environment andhealth.
Keywords: Amuthakaraisal, dry matter content,groundnut, sandy regosol
Introduction
The groundnut (Arachis hypogaea) is an plantmostly growing in Asian countries. China leads inproduction of groundnuts, having a share of about41.5% of overall world production and followed byIndia (18.2%). It is a crop which cultivated inhighlands under rainfed condition in maha season andin paddy lands under irrigation during yala season indry and intermediate zones in Sri Lanka. Thoughgroundnut is an oil crop, in Sri Lanka it is demandedas snacks and confectionaries. Groundnut has beencultivated by the traditional farmers with increasedapplication of chemical fertilizers especially nitrogenas it shows higher response to applied nitrogen.According to statistical data, chemical fertilizersaccounted over 50% of increased yield. Sri Lanka hadimported NPK fertilizer in 1950-1951were only 20,000tons and by 1999 it increased to 612,000 MT(Weerakoon, 2009). However, during past few yearsthere was yield reduction even with increased fertilizerusage (Thedchanamoorthy, 1998) and high yieldingvarieties were susceptible to many pests that traditionaltypes would be tolerated. To counteract these pests,vast amount of pesticides were used (Arun andSharma, 2000).
There are microorganisms and earthworms insoil which are precious properties of soil whichdetermine the nutrient availability to the plants. Theincreased and often indiscriminate use of fertilizersand pesticides immensely harmed biological activity ofthe soil and rendering it almost lifeless in vast areas.The increased applications of fertilizers lead to more
Selvarajah Viharnaa(1), Thayamini H. Seran(1) and A. M. Hassaan(1)
Dry matter content of groundnut(Arachis hypogaea) fertilized with liquid
organic fertilizer (1) Department of Crop Science, Faculty of Agriculture, Eastern University, Chenkalady, Sri Lanka.
(email: [email protected])

Proceedings of the Third International Symposium,SEUSL: 6-7 July 2013, Oluvil, Sri Lanka
[ 6 ]
succulent crops which are vulnerable for the attack byvarious species of insects and diseases (Palekar, 2005).Inorganic fertilizers not only suppress the growth ofnative soil microorganisms but also alter soil structureand its properties. Excessive high application of Nfertilizer is the usual practice in agricultural operationsand N losses from cropping systems may thus be animportant source of ground water pollution (Almasriand Kaluarachchi, 2007). Nutrients such as nitrogen(N), phosphorus (P) and potassium (K) are the majorelements required by plants in large quantities. Due tothis reason, most of the inorganic fertilizers are mainlycontain NPK while fertilizers with micronutrients arevery rare. It is another problem with using suchchemical fertilizers since they deplete themicronutrients from the soil and also it affects the soilliving organisms and human minerals consumption(Thedchanamoorthy, 1998).
Low use efficiencies of inorganic fertilizerscoupled with their rising costs has directed theattention of farmers towards organic fertilizers. Hence,presently farmers are engaged in organic agriculturalproduction, uses no/limited synthetic fertilizers andpesticides. It is due to continuous increase in price forsynthetic chemicals in addition to environmental andhealth hazards. Organic farming provides severalbenefits to the growers. It reduces production cost andis an environmental friendly method of cultivation.Maintaining soil fertility and productivity onsustainable basis is of primary importance forcontinuous agriculture production. In comparisonwith conventional farming, organic farming haspotential benefits in improving food quality and safety(Giles, 2004), promoting soil structure formation(Pulleman et al., 2003), alleviating environmentalstresses (Macilwain, 2004), and enhancing soilbiodiversity (Oehl et al., 2004). Much attention hasbeen paid in recent years to manage different organicwaste resources in order to minimize cost ofproduction as well as eco-friendly basis (Suthar, 2007).There are limited information on use of organicfertilizer in crop cultivation. Therefore this experimentwas done to study the dry matter production ofgroundnut grown with liquid organic fertilizer knownas Amuthakaraisal.
Materials and methods
This experiment was conducted at the Easternregion of Sri Lanka which is located in the latitude of7o 43’ and the longitude of 81o 42’E. It belongs to theagro ecological region of low country dry zone in SriLanka. The mean annual rainfall ranges from 1400mmto 1680mm and temperature varies from 30o C to 32o
C. The soil type is sandy regosol.
Experimental designThe experiment was laid out in Randomized
Complete Block Design (RCBD) with five treatmentsand three replications. The treatments were as shownin Table 1. The cow dung (10 t/ha) was applied to eachplot for treatments T2 – T5 two weeks before plantingand the required amount of recommended inorganicfertilizers (35 kg/ha of urea, 100 kg/ha of triple superphosphate and 75 kg/ha of muriate of potash) wereapplied to treatment T1 (control treatment) as basalfertilizer in groundnut cultivation. The plot size was 1.5m x 1.2 m. The seeds were sown at the spacing of 45cm between rows and 15 cm within rows.
Preparation of AmuthakaraisalLiquid organic mixture known as
Amuthakaraisal was prepared in a 15 L plastic barrelwith the ingredients at the rate of 3.5 kg of fresh cowdung and 1.3 L of urine from indigenous cow as wellas 150 g of Jaggery. These ingredients were mixed in aplastic barrel and stirred well then the barrel wascovered with cotton cloth. The barrel was placed undershade for fermentation and following day the preparedliquid mixture was diluted and applied.
Application of AmuthakaraisalAmuthakaraisal was diluted 10 times with water
and then sprayed around the root zone of plants assplit dosage. Land was wetted before application ofAmuthakaraisal. Application of Amuthakaraisal wasstarted at fifteen days of planting for all treatmentsexcept T1 and T5 treatment. For the control treatment(T1), Amuthakaraisal was not applied during thewhole growing period while for other treatmentsAmuthakaraisal was applied at 300 ml/m2 as indicatedin Table 1.

Table 1:Treatments in the experiment
Other cultural practices Irrigation was done daily except rainy days by at
the initial stage of seedlings thereafter irrigated twicea day. Then watering was reduced. Weeds cause muchdamage to the groundnut crop during the first 45 daysof its growth. The most critical period of weedcompetition is from 3-6 weeks after sowing. Handweeding was done at three and six weeks after planting.Earthingup was done during second weeding. Urea (30kg/ha) was applied at flowering stage as top dressingfor the control treatment (T1). Amuthakaraisal wasapplied for treatments T2-T5 according to differentfrequencies as mentioned in Table 1. No pesticide wasused because of less pest and disease attacks.
Agronomic parameters The fresh weights of leaf, stem, root and pods
were measured by using an electronic balance. The dryweights of leaf, stem, root and pods were recordedseparately by using an electronic balance after dryingin oven at 1050C over night. The biological yield wascalculated on dry basis.
Statistical analysisThe collected data were analyzed using SAS 9.1
version statistical software package. The treatmentmeans were compared by using Duncan’s MultipleRange Test (DMRT) at 5% level.
Results and Discussion
Fresh weight of plant parts Statistically analyzed data showed no remarkable
difference (P>0.05) in fresh weight of leaves (Table 2)and the maximum value of 19.51 g was recorded in T1and followed by 18.62 g in T4. The minimum value ofleaves was observed in T2. It was found that there wassignificant difference (p<0.05) in fresh weight of stemamong the treatments. The maximum average freshweight of 48.75 g was recorded in T4, followed by T5(37.32 g) and T3 (36.5 g). Statistically analyzed datashowed no remarkable difference (P>0.05) in freshweight of root (Table 2) and the root weight rangedfrom 5.65 g (T2) to 7.58 g (T4). Further, it was foundthat there was highly significant difference (p<0.01) infresh weight of pods among the treatments. Themaximum fresh weight of 69.85g was recorded in T4,followed by T1 (52.73) and T3 (36.5). The minimumfresh weight of pods was recorded in T2.
Table 2:The effect of Amuthakaraisal on fresh
weights of leaves, stem and root of groundnut.
Dry weight of plant parts There was highly significant difference (P<0.01)
among the treatments in dry weight of pods (Table 3).T4 had significant variation (P<0.05) from othertreatments. There were no remarkable differencesamong the treatments in dry weight of leaf and root.
[ 7 ]
Selvarajah Viharnaa, Thayamini H. Seran and A. M. HassaanDry matter content of groundnut(Arachis hypogaea) fertilized with liquid organic fertilizer
T1 Recommended inorganic fertilizerapplication as control
T2 Amuthakaraisal applied at 15 daysafter sowing
T3 Amuthakaraisal applied at 15 and 30days after sowing
T4 Amuthakaraisal applied at 15, 30 and45 days after sowing
T5 Amuthakaraisal applied at 30 and 45days after sowing
Treatments Fertilizer application as top dressing
T1 19.51 ± 2.92 34.30± 04.19 ab 6.49± 0.35 52.73 ± 2.22 b
T2 15.29 ± 1.89 26.23 ± 02.45 b 5.65± 0.32 42.69 ± 2.44 b
T3 18.33 ± 1.20 36.50± 04.46 ab 5.69± 0.35 46.02 ± 5.00 b
T4 18.62 ± 2.59 48.75 ± 08.48 a 7.58± 0.52 69.85 ± 3.79 a
T5 17.45 ± 3.46 37.32± 04.33 ab 6.34± 0.41 52.12 ± 2.47 b
F test ns * ns **
Treat-ments
Leafweight (g)
Stemweight (g)
Rootweight (g)
PodWeight (g)
Value represents mean ± standard error of four replications..F test:-ns: not significant; *: P<0.05, **: P<0.01.Meansfollowed by the same letter are not significantly differentaccording to Duncan’s Multiple Range Test at 5% level.

Proceedings of the Third International Symposium,SEUSL: 6-7 July 2013, Oluvil, Sri Lanka
[ 8 ]
But it was found that there was significant differences(p<0.05) among the treatments on dry weight of stem.The highest value of stem dry weight was observed inT4. The maximum pod dry weight of 35.58 g wasrecorded in T4 and the minimum weight of 20.89 gwas observed in T2.
Table 3:The effect of Amuthakaraisal on dry
weights of leaves, stem and root of groundnut.
Plant biomassThere was highly significant difference (p<0.01)
among the treatments on average plant biomass. Themaximum plant dry weight of 59.63 g was recorded inT4, followed by T5 (49.09 g) and T1 (47.22 g). Theminimum plant dry weight of 36.64 g was recorded inT2. According to DMRT at 5% level of significance,there was no significant difference between T1, T3andT5 in plant biomass. Likewise the highest total biomass(biological yield) of 11.36 t/ha was recorded in T4 butstatistically not differed with T5 while lowest totalbiomass (6.98 t/ha) was recorded in treatment T2.Plant biomass associated with dry matter productionof plant parts. The higher value of leaf weight was recorded in treatments which receivedAmuthakaraisal in continuous regular interval thancontrol treatment.
Table 4:The effect of Amuthakaraisal on plant
biomass
Organic liquid fertilizer (Amuthakaraisal) is aneffective microbial culture and act as bio inoculants toenhance the microbial activities and improve theavailability of nutrients toward the roots. Sheng andLian (2002) who observed that dry weights of stem,leaves, root and pods in effective microbial treatmentswere significantly higher than chemical treatment.Muthaura et al (2010) reported inoculation of effectivemicroorganisms can increase the available nutrition forplant roots and improve photosynthesis. Vanaja et al(2006) found that increments in root volume willincrease the root bio mass. This leads to increase intotal biomass. Xu et al. (1997) reported that organicfertilizers promote root growth and activity of sweetcorn plants than inorganic fertilizers. Generally theplant having a better system can absorb more waterand support for photosynthesis. This leads higher drymatter production.
Amuthakaraisal also could be an alternativeorganic source of plant nutrient since cow dung andcow urine are the major ingredients. The application oforganic manures which improved physical andbiological properties of soil resulting in better supplyof macro and micro nutrients for better pod yield ofgroundnut and maintaining soil fertility. It is supportedwith the findings of Bache and Helathcote (1969) whoreported that the use of farm yard manure significantly
T1 6.00 ± 1.08 9.67 ± 0.79 b 2.62 ± 0.16 28.93 ± 1.37 b
T2 4.63 ± 0.28 8.52 ± 0.56 b 2.60 ± 0.08 20.89 ± 1.87 c
T3 4.79 ± 0.62 9.81 ± 1.30 b 2.62 ± 0.14 26.12 ± 1.46 b
T4 6.09 ± 0.92 14.85 ± 2.01 a 3.11 ± 0.18 35.58 ± 2.32 a
T5 5.28 ± 0.21 10.60 ± 1.12 b 2.82 ± 0.13 30.39 ± 1.66 b
F test ns * ns **
Treat-ments
Leafweight (g)
Stemweight (g)
Rootweight (g)
PodWeight (g)
T1 47.22 b 8.99 b
T2 36.64 c 6.98 c
T3 43.34 b 8.25 b
T4 59.63 a 11.36 a
T5 49.09 b 9.35 ab
F-test ** **
Treatments Plant biomass(g)
Biological yield(t/ha)
Value represents mean ± standard error of four replications..F test:-ns: not significant; *: P<0.05, **:P<0.01. Meansfollowed by the same letter are not significantly differentaccording to Duncan’s Multiple Range Test at 5% level.
Value represents mean ± standard error of four replications.F test: **:P<0.01. Means followed by the same letter are notsignificantly different according to Duncan’s Multiple RangeTest at 5% level.

increase soil carbon, nitrogen, pH, cation exchangecapacity and exchangeable Ca, Mg and K to enhancecrop yield. Akandy (2006) stated that phosphoruscontent in soil was increased with application of cowdung. Natarajan (2003) also stated that urine is a goodsource of urea and contains 1.0% of N, 1.35% of K.Improved plant height and leaf area in plants byorganic manure application has been reported(Boateng et al., 2006; Muhammad and Khattak, 2009).
The liquid organic top dressing treatmentsexhibited high dry matter production. Even thoughorganic fertilizers are generally slow releasingfertilizers. The results showed that after fifteen days ofplanting with continuous regular application gavehigher dry matter production. Hoeft (2004) stated thathigher soil microbial activities at early stage of maizereduce the plant growth due to microbialimmobilization. The present results indicated clearlythe vital role of N in plant life and its contribution inincreasing pod yield. Maximum fresh weight of podswas recorded in T4 while minimum pod dry weightwas recorded in T2 but there was no significantdifference between T2 and control treatment. It clearlyindicates that continuous application ofAmuthakaraisal favours the groundnut plant growthby increasing the available nutrients in soil. Ingroundnut cultivation N plays a major role in plantgrowth and development. Marschner (1995) stated thatN is essential for cell division, elongation as well as forroot growth and dry matter content in maize plant.
Soldati et al., (1984) reported that an increase indry matter accumulation leads to an increase in leafarea because proportion of dry matter allocated toleaves remain fairly constant while an increase in leafarea leads to an increase in rate of dry matteraccumulation because light interception is directlyrelated to leaf area during this phase of development.Marambe et al. (1997) who stated that unamendedcontrol plot produced lowest dry matter than plottreated with EM and other organic source. Increase inleaf area would be attributed to increased leaf weight.
Conclusion
Amuthakaraisal application helps to enriched andimproves the soil structure and helps to increase thenutrient cycle in an eco friendly manner. From theseresults it could be concluded that application ofAmuthakaraisal as an organic source of nutrient hadsignificant effects on tested dry matter production ofgroundnut over the control. In comparisons betweencontrol and selected treatment T4, T4 had highervalues of 35.58 g, 59.63 g and 11.36 t/ha while controltreatment T1 had values of 28.93 g, 47.22 g and 8.99t/ha for average oven dry weight of pods, plant biomassand biological yield respectively. From these results itcould be concluded that continuous application ofAmuthakaraisal once in fifteen days produced moredry matter production than other treatments. Based onthe findings, it could be concluded that continuousapplication of Amuthakaraisal once in fifteen days withincorporation of cow dung as basal can be thealternative organic source of nutrient to obtainoptimum yield in sustainable and environmentalfriendly manner in sandy regosol of Eastern region.Since the application of this liquid organic fertilizer isa natural product it causes less harm to environmentand improves the nutrient availability in soil, the costfor inorganic fertilizer can be saved.
References
Akandy, M.O., Oluwatoyinbo, F.I.,Kayode, C.O. andOlowokere,F.A. (2006). Response of Maize (Zeamays) and Okra (Abelmoschus esculentus)Intercrop Relayed with Cowpea (Vignaunquiculata) to Different Cow dung AmendedPhosphate Rock. World Journal of AgricultureScience 2 (1): 119-122.
Almasri, M.N. and Kaluarachchi, J.J. (2007). Modelingnitrate contamination of ground water inagricultural watersheds. J. Hydrol. 343:211–229.
Arun. K. Sharma. (2000). A Hand book of OrganicFarming. Pp: 123-124.
[ 9 ]
Selvarajah Viharnaa, Thayamini H. Seran and A. M. HassaanDry matter content of groundnut(Arachis hypogaea) fertilized with liquid organic fertilizer

Proceedings of the Third International Symposium,SEUSL: 6-7 July 2013, Oluvil, Sri Lanka
[ 1 0 ]
Bache BM and Healthcote RG 1969 Effects of fertilizerand manure on soil and leaves of cotton inNigeria. Exp. Agric. 5:214-219.
Boateng, S.A., Zichermann, J. and Kornahrens, M.(2006). Poultry manure effect on growth andyield of maize. West Africa J. Appl. Ecol., 9: 1–11.
Giles, J .(2004). Is organic food better for us? Nat.(Lond.). 428: 796797.
Hoeft, R. (2004). Predicting and measuring nitrogenloss. Univ. of IL Pest Mgmt Newsletter. 28 May2004. Online at . edu/bulletin/article.
Macilwain, C .(2004). Is organic farming better for theenvironment? Nat. (Lond.), 428: 797-798.
Marambe, B. and Sangakkara, U.M. (1997). Impacts ofEffective Microorganisms on Dry Matterpartitioning in maize (Zea mays L). Dept of CropScience, Faculty of Agriculture, University ofPeradeniya, Sri Lanka.
Marschner, H. (1995). Mineral Nutrition of HigherPlants. Academic Press International, San Diego,CA, USA.
Muhammad, D. and Khattak, R.A. (2009). Growth andnutrient concentration of maize in pressmudtreated saline-sodic soils. Soil Environ., 28: 145–155.
Muthaura.C, M.Davi, M.Joseph, A.Ogur, V.Samuel andOkello (2010). Effective micro organisms andtheir influence on growth and yield ofpigweed.1(5),17-22.
Natarajan, K. (2003). Panchakavya – A Manual. OtherIndia Press, Goa, India. 32 pp.
Oehl, F., Sieverding, E., Mäder, P., Dubois, D., Ineichen,K., Boller, T.et al,. (2004). Impact of long-termconventional and organic farming on thediversity of arbuscular mycorrhizal fungi.Oecologia, 138: 574-583.
Palekar,S. (2005). Zero budget Natural farmingmovement.pp 8-38.
Pulleman, M.A.,Jongmans,J. and Bouma,J. (2003).Effects of organic versus Conventional arablefarming on soil structure and organic matterdynamics in a marine loam in the Netherlands.Soil Use Manage. 19:157-165.
Sheng.Y.P and X.H.Lian(2002). Influence of EMBokashi on nodulation,physical characters andyield of peanut in nature farmingfields.J.Sustain.Agric.19,105-112.
Soldati, A., Stehli, A. and Stamp, P. (1984).Temperature adaptation of tropical highlandMaize (Zea mays L.) during early growth and incontrolled conditions. Crop Sci., 24:28-32.
Suthar, S. (2007). Vermicomposting potential Perionyxsansibaricus (Perrier) in different waste materials.Bioresour.Technol.,98 (6):1231-1237.
Thedchanamoorthy, K. (1998). Sustainable agriculture.Eastern University, Sri Lanka,pp: 25-47.
Vanaja,Ratnakumar,Vagheera,Jyothi,R.Reddy,Lakshmi,Maheshwari and Yadev (2006).Initial Growthresponses of blackgram(Vigna mungo L.Hepper)under elevated CO2 and moisture stress,Plantsoil environ.52,11,499-504.
Weerakoon, L. (2009). Sustainable small farmerAgriculture and Food Security. Centre ForSustainable Agriculture Research andDevelopment (C-SARD) Movement for Land andAgriculture Reform (MONLAR),pp: 12-34.
Xu, H. L., Kato, S. Yamada, K.,Fujita, M. and Katase, K.(1997). Soil root interface water potential insweet corn plants affected by organic fertilizationand effective microbes application. Jap. J. CropSci.66: 110-111.

[ 1 1 ]
Abstract: Sri Lanka is faced with several aspects of landdegradation, many of which are human induced. Thecountry is free of serious natural hazards such asvolcanic activity and earthquakes resulting from climaticextremes, but there are impacts of many naturaldisasters, such as landslides, floods and droughts, theintensity and frequency of which are increasing due tohuman interventions. Some areas of Sri Lanka are alsoperiodically subject to cyclones that occur due toclimatic conditions and geographical locations.
Land degradation denotes all natural or anthropogenicprocesses that diminish or impair productivity of land.This occurs mainly through soil erosion, loss of organicmatter and nutrients in the soil; salinization and largescale land degradation in Sri Lanka. Its manifestationstoday are heavy loss of soil, siltation in the waterbodies, reservoirs and coastal waters, unplannedsettlements, loss of arable land leading to decliningproductivity in agricultural lands and intensification ofimpacts of natural hazards such as flooding andlandslides.
Land degradation is a major problem in EasternCoastal Area from Kalmunai to Nintavur DSDs ofAmpara District. However, there is a considerablespatial heterogeneity exists within this area in terms ofland use, topography, land management and socio-economic conditions. Therefore, land degradationassessment studies are very important for thesustainable development of the area. Considering theabove background, this study was conducted with theobjectives of developing a land degradation assessmentmodel using a GIS based approach.
Key Words: Land Degradation, Soil Erosion and GIS.
IntroductionLand degradation is a dynamic process and is the
result of both natural and biotic forces operating on theearth. The scientific information of degraded lands isthus essential for formulation of strategic plan to arrestthe menace of land degradation, generation of realisticinformation on degraded lands of the country is theutmost necessity and taken on a mission mode inorder to check further degradation of the environmentand loss of top fertile soils.
Land degradation is a dynamic process operatingon the earth due to natural biotic forces and humanactivities. Development of degraded lands is one of theoptions available for the growing population and torestore the fragile ecosystems in Sri Lanka. Theinformation on the extent and spatial distribution ofvarious kinds of degraded lands is thus essential forstrategic planning. Soil is a dynamic non-renewableresource which is essential for the continuedagricultural productivity and to prevent degradation.
As long as the soil and land are used according totheir potentials, it is good, continued unplanned andunscientific exploitation results in land degradation.The information on land degradation is needed for avariety of purposes, like planning the reclamationprogrammes. The land degradation problem hasreached an alarming proposition due to various factorslike over exploitation and mismanagement of naturalresources and socio-economic factors.
The concern for protecting the productivity ofnatural resources without further degradation is thekey issue for both the developed and the developingnations to sustain the future generations. The satelliteremote sensing and GIS technologies should be fully
Kaleel. M.I.M(1)
GIS Based Land Degradation Analysis onCoastal Area of Ampara District
(from Kalmunai to Nintavur DSDs)(1) Department of Geography, South Eastern University of Sri Lanka, Oluvil, Sri Lanka.

Proceedings of the Third International Symposium,SEUSL: 6-7 July 2013, Oluvil, Sri Lanka
[ 1 2 ]
utilized for monitoring the land degradation(Venkataranam and Ravisankar, 2003).
Land degradation, including soil erosion,continues to be a global constraint to economicdevelopment. Despite decades of efforts to arrest landdegradation, many farmers are reluctant or unable toadopt appropriate land use practices. Often, thesepractices fail to combine high productivity, increasedsoil fertility, reduced soil erosion and enhancedwelfare. Still, soil conservation is proposed as a viableroute to obtain these objectives.
The methodology for land degradation mapping,using remote sensing techniques developed by theorganization, is based on the expertise in the field ofsoil survey and remote sensing acquired sinceinception. Database with spatial distribution of varioussoil and land attributes is a pre-requisite fordevelopment of strategic planning of any landdevelopment programme.
The information system on degraded lands in thecountry could be developed using remote sensing andgeographical information systems towards strategicdevelopment of degraded lands and monitoring thestatus in a periodic timescale (Das, 2003).
Study AreaThe study area is located between the latitudes of
7o25’ 24”N and 7o 27’ 25” N and the longitudes of 81o
45’ 31” E and 81o 50’ 32” E. (Figure 1)
Materials and Method
The following spatial and non spatial data wereused in this study: Spatial data on Contour, Soil, Landuse, Streams, Reservoirs, Road map of 1:50,000 scaletopographic maps of the Survey Department of SriLanka, demographic data (Population Density,Education, Income, Land to man ratio, and agro landto man ratio), ground truth information. Further thespatial data analysis was carried out using Arc GIS 9.3.
The land degradation severity map was preparedby integrating all spatial data layers. Weights weregiven to each spatial data layers according to theirpossible contribution towards soil erosion. Sincerainfall induced soil erosion is the most influentialfactor in land degradation, more weight was assignedto this data layer during the analysis. The assignedweightage values are shown in Table 1.
Table 1:Weightage values for different
spatial data type
Land degradation severity was assessed by usingWeighted Sum algorithm in ArcGIS software. Applyingsimple arithmetic calculations, final land degradationmap was produced.
Results and Discussion
An analysis about the overall patterns of gain andloss of different categories of land degradation providesgreater insights into an understanding of the changesin land uses and resultant degradation. Table 2 showsthe net changes in gains and losses due to degradationof land during 1981-1991, 1991-2001, 2001-2006 and1981-2006 in the study area.
Figure 1: Study Area
Soil loss 45
Population density 25
Agro land-man ratio 15
Land-man ratio 10
Samurdhi beneficiaries 05
Spatial data type Weightage (%)

Table 2: Land Degradation in Kalmuani to Nintavur
(extent in km2) 1981‐2006
The highly degraded land has experienced also aloss of -6.36 per cent during the 25 years ofobservation, which is a sign of deterioration. This classof land has experienced a loss of -2.19 per cent (1981to 1991), -1.41 per cent (1991 to 2001) and -2.76 (2001to 2006) during the various periods in the overallperiod of analysis. The overall loss of a sizeableproportion of lands in the highly degraded categoryreveals that measures should be taken on a war footingto preserve the quality of land in the study area (seeFigures 6.17 to 6.20).
Figure 3: Land Degradation in Kalmuani to Nintavur
DSDs 1981 and 1991
Figure 4:Land Degradation in Kalmuani to Nintavur
DSDs 2001 and 2006.
Kaleel. M.I.MGIS Based Land Degradation Analysis on Coastal Areaof Ampara District (from Kalmunai to Nintavur DSDs)
[ 1 3 ]
Figure 2: Land Degradation in Kalmuani to Nintavur
1981‐2006
Highly 14.30 15.79 16.75 18.62
Moderately 9.73 10.04 9.80 10.11
Less 9.71 10.45 11.10 11.18
Non 34.17 31.63 30.26 28.00
Total 67.91 67.91 67.91 67.91
ClassificationDegraded
1981 1991 2001 2006
Source: Field measurements and Computation using GIS (M.I.M. Kaleel, 2010)
Km
2

Proceedings of the Third International Symposium,SEUSL: 6-7 July 2013, Oluvil, Sri Lanka
[ 1 4 ]
Conclusions
Based on the analysis of dynamics of landdegradation in the study area, the followingconclusions have been drawn:
1. The study area has experienced an adverse effectin land degradation throughout the study period1981-2006.
2. The annual degradation score has shown anincreasing trend during 1981 to 1991 and 2001 to2006, which is an unhealthy development.
3. The negative annual degradation rates indicate ahigher level of human interference anddisturbance in the normal processes in the studyarea.
4. Human interference has been the highest and thishas been validated by the fact that nearly 70 per cent of the settlements of the area haveshown wider human impacts on theenvironment.
5. There is a strong positive relationship betweenland degradation and soil erosion as well as landdegradation and population density while strongnegative relationship can be observed betweenland degradation and land to man ratio. A soundcorrelation could not be observed between landdegradation and poverty level.
References
1. Venkataratnam L and Ravisankar T, (2003):Remote Sensing for Soils and Land Degradation,BSP.BS Publication, Hyderabad, 4-4-309:158-168.
2. Das S.N., (2003): Land Degradation Status inIndia, BSP.BS Publication, Hyderabad, 4-4-309:171-177.
3. State of Environment in Sri Lanka, (2002): LandDegradation and Natural Hazards in Sri Lanka,Environmental Economics and Global AffairsDivision, The Ministry of Environment andNatural Resources, Colombo, Sri Lanka, 61-72.
4. Swan S. B. St. C, (1965): Coast Erosion Principlesand a Classification of South-West Ceylon abeaches on the bias of their Erosional Stability,Bullcey Geogr, Soc. Vol.19.
5. Wijesekera S. and Samarakoon L., (2001).Extraction of parameters and modeling soilerosion using GIS in a GRID environment. [access27 September, 2007]. Available from internet: .
6. Hesadi H., Jalili K. and Hesadi M., (2003).Applying RS and GIS for Soil Erosion andSediment Estimation by MPSIAC Model - A casestudy of Kenesht watershed in Kermanshah, Iran.[Access 27 September, 2007].
7. geology/geomorphology/geogmf001.htm.

[ 1 5 ]
Abstract: Land use / land cover information is thebasic pre-requisite for managing land, water andvegetation resources. The information on land use /land cover available today in the form of thematicmaps and published statistical figures in records.Publications are inadequate, inconsistent, and do notprovide updated information on the changing land usepatterns, process and their spatial distribution. Acomprehensive household sample survey, enterprisesample survey, institutional survey and formalinterviews were carried out as primary data source. Inorder to supplement the data gathered in the field,secondary data were gathered such as relevant researchreports and articles written on the town and itsfunctions, land issues and official publications andreports issued by the UDA, Land CommissionersDepartment, Title Settlement Department and theDepartment of Census and Statistics, publications byrelevant authorities. The samples were processed andanalyzed using advanced spatial informationtechniques. Geographic Information System (GIS) hasbeen utilized to generate maps and diagrams and tofind suitable areas for the stipulated criteria. Thecurrent research focused the main characteristics of theAddalaichenai Divisional Secretariat area and itsimmediate periphery. However, the area covering thecoastal belt will be considered as the potentialdevelopment areas.
Further the rapid development such as high ways,Oluvil port project, urbanization, re-greening projects,etc., after the disaster (war & tsunami) are the primeelements in the process of Land use / land coverchanges in Addalaichenai DS Division.
It has grown up to be urban town in the south eastregion with it slim of its municipality.
Key Words: Land use / land cover, thematic maps,supervised classification and spatial informationtechniques
Introduction
Land use / land cover information is the basicpre-requisites for managing land, water and vegetationresources. The information on land use / land coveravailable today in the form thematic maps, andpublished statistical figures in records. Publications areinadequate, inconsistent and do not provide updatedinformation on the land use patterns, process and theirspatial distribution. Land is one of the prime naturalresources and is the basic unit of all materialproductions. It is a limited resource which has to beused very carefully due to the rapid increase inpopulation growth which would result in decline ofland resources. The concept of land use / land cover isparts of a whole and should be studied together butthey do contain inherent differences (Burly, 1961).
Land use is generally defined as the activityoccurring on the land and as such human valuesattached to it (Burly, 1961; Clawson et al, 1965;Campbell, 1981). This also applies to the visiblelandscape and describes what is on the land. Land userefers to “men activities and the various uses which arecarried on land” (NRSA, 1987). Land cover refers to“national vegetation, water bodies, rock, soil, artificialcover and other result due to land transformation”. Inthe urban areas, the problems related to the rapid
M.H. Mohamed Rinos(1), H.F.N. Ameera Farook(1)
Land Use/Land Cover Changes inAddalaichenai DS Division
From 1991 to 2011(1) Dept. of Geography, South Eastern University of Sri Lanka, Oluvil, Sri Lanka.
(email: [email protected])

Proceedings of the Third International Symposium,SEUSL: 6-7 July 2013, Oluvil, Sri Lanka
[ 1 6 ]
transformation that are taking place in terms of theland cover and land use now very much pronounced(Okunuki, 2001). Urbanization has often been viewedas a sign of the vitality of the regional economy;however, the urbanization had greatly accelerated theenvironmental pressure on the eco-system, thusplacing enormous burden on responsibility oforganization for the planning and management ofurban areas authority (Herald et al, 2003).
Land use is a primary indicator of the extent ofmans impressions on the earth. It reflects the socio-economic and cultural aspects of human activity andprovides an index of environs he has settled in. Thescience of land use deals with the study of land coveredunder different usages like forest land covered underdifferent categories like forest, agricultural, non-agricultural, waste land, barren land, water bodies,industrial, rural, urban centre, waste disposal sites, etc.
Land use system depends upon a combination ofcomplex dynamic factors like hydrology, soil, micro-climatic and community of biotic assemblages that arecontinuously interacting under the influence of staticnatural processes such as geology, topography andother anthropogenic activities.
With the growing population on limited landresources the relevance of land use study andmanagement assumes significance. The concept ofoptimal land use is basic which aims at balancing thecompetitive demands in a scientific manner forsustainable development. The purpose of land usestudy is to regulate uses on the misuse, abuse or overuse of the land. To extract maximum utilization withminimum interception with ecosystem is the solepurpose of the land use study. Land use studyconsiders the ecosystem in the entire process.Management of land, water and biotic form in unionwith human beings is an integrated system. Themanagement of one is complementary to the other(Kaleel M.I.M, 2010).
Geo Information Technology; GeographicInformation System (GIS), Remote Sensing and GlobalPositioning System (GPS) provided the environment
to undertake this study with maximum efficiently. TheGIS with the added values of earth observationtechniques widely known as remote sensing techniques(image analysis) have already shown their value ofmapping dynamic areas, and as data sources for theanalysis and modeling of urban growth and land usechanges (Jensen & Cowen, 1999). Remote sensingprovides especially consistent data set of large areacoverage in both high spatial details with highertemporal frequency in multi spectral regions (Heraldet al, 2002).
It is observed that the land cover classes of theAddalaichenai DS Division have undergone extremechanges in the recent past due to the rapiddevelopment; high ways, Oluvil port project,urbanization, re-greening projects, etc.,. As such, theneed of the estimate extent and change dynamics ofeach land cover classes in this area is essential to enablefor proper management strategy that is necessary toensure effective planning for sustainable development.
Objective of the Research
The prime aim of the research is to assess thechanges of spatial extent of each land cover classes dueto anthropogenic activities. The research has beenundertaken with the following objective in order toachieve this aim;
1. To map out of present and past land usepattern of Addalaichenai DivisionalSecretariat area
2. To compare them to past and present land usepattern
3. To assess the pattern of changes in the landclass cover.
Study Area
Addalaichenai Divisional Secretariat of AmparaDistrict has been selected to undertake this research.The costal DS areas of the Ampara district areKalmunai, Sainthamaruthu, Karaitivu, Nintavur,Addalaichenai, Akkaraipattu, Alayadivemb,Thirukkovil, Pottuvil and Lahugala. The population
M.H. Mohamed Rinos, H.F.N. Ameera FarookLand Use/Land Cover Changes in AddalaichenaiDS Division From 1991 to 2011
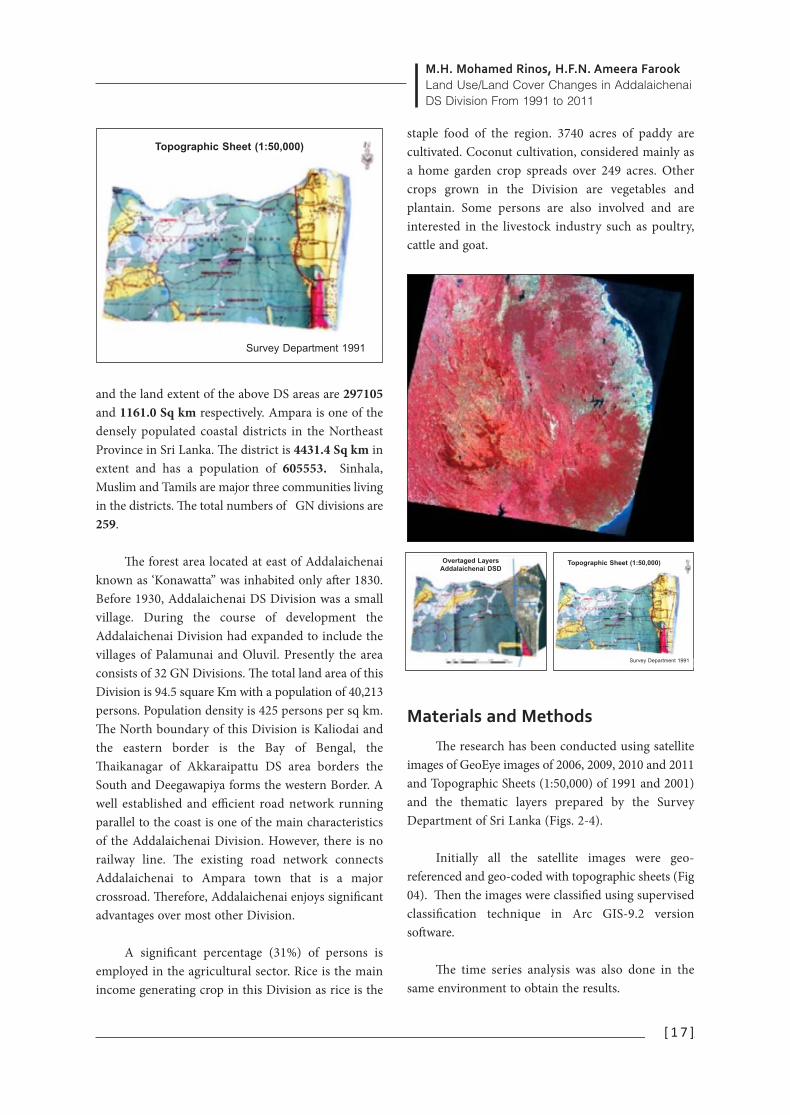
and the land extent of the above DS areas are 297105and 1161.0 Sq km respectively. Ampara is one of thedensely populated coastal districts in the NortheastProvince in Sri Lanka. The district is 4431.4 Sq km inextent and has a population of 605553. Sinhala,Muslim and Tamils are major three communities livingin the districts. The total numbers of GN divisions are259.
The forest area located at east of Addalaichenaiknown as ‘Konawatta” was inhabited only after 1830.Before 1930, Addalaichenai DS Division was a smallvillage. During the course of development theAddalaichenai Division had expanded to include thevillages of Palamunai and Oluvil. Presently the areaconsists of 32 GN Divisions. The total land area of thisDivision is 94.5 square Km with a population of 40,213persons. Population density is 425 persons per sq km.The North boundary of this Division is Kaliodai andthe eastern border is the Bay of Bengal, theThaikanagar of Akkaraipattu DS area borders theSouth and Deegawapiya forms the western Border. Awell established and efficient road network runningparallel to the coast is one of the main characteristicsof the Addalaichenai Division. However, there is norailway line. The existing road network connectsAddalaichenai to Ampara town that is a majorcrossroad. Therefore, Addalaichenai enjoys significantadvantages over most other Division.
A significant percentage (31%) of persons isemployed in the agricultural sector. Rice is the mainincome generating crop in this Division as rice is the
staple food of the region. 3740 acres of paddy arecultivated. Coconut cultivation, considered mainly asa home garden crop spreads over 249 acres. Othercrops grown in the Division are vegetables andplantain. Some persons are also involved and areinterested in the livestock industry such as poultry,cattle and goat.
Materials and Methods
The research has been conducted using satelliteimages of GeoEye images of 2006, 2009, 2010 and 2011and Topographic Sheets (1:50,000) of 1991 and 2001)and the thematic layers prepared by the SurveyDepartment of Sri Lanka (Figs. 2-4).
Initially all the satellite images were geo-referenced and geo-coded with topographic sheets (Fig04). Then the images were classified using supervisedclassification technique in Arc GIS-9.2 versionsoftware.
The time series analysis was also done in thesame environment to obtain the results.
[ 1 7 ]
Topographic Sheet (1:50,000)
Survey Department 1991
Overtaged Layers
Addalaichenai DSDTopographic Sheet (1:50,000)
Survey Department 1991

Proceedings of the Third International Symposium,SEUSL: 6-7 July 2013, Oluvil, Sri Lanka
[ 1 8 ]
Data collection and methodology
The research has been undertaken with theprimary and secondary data sources to focus on bothqualitative and quantitative data analysis. The primarydata were collected through questionnaires as well aspersonal observations and by interviewingstakeholders and old inhabitants. The primary dataused in the study was thus taken from a social surveyof households using questionnaires.
Secondary data were collected from thepublished and unpublished sources. Published sourcesare listed in the bibliography. The basic mapping ofgeology, physiography and land use was carried outfrom the sources available at the Survey Department,Colombo, Sri Lanka from which the villageinformation on land use population and occupationalstructures were obtained.
The research focused on preparing acomprehensive land use profile of Addalaichenai DSarea and to identify the land use changes between1991, 2001 and 2011. A comprehensive householdsample survey, enterprise sample survey, institutionalsurvey and formal interviews were carried out asprimary data source. In order to supplement the datagathered in the field, secondary data were gatheredsuch as relevant research reports and articles writtenon the town and its functions, land issues and officialpublications and reports issued by the UDA, LandCommissioners Department, Title SettlementDepartment and the Department of Census andStatistics, publications by relevant authorities. Thesamples were processed and analyzed using advancedspatial statistical techniques. Geographic InformationSystem (GIS) techniques were utilized to generatemaps and diagrams and to find suitable areas for thestipulated criteria. The current research focused themain characteristics of the Municipal area and itsimmediate periphery. However, the area covering thecoastal belt will be considered as the potentialdevelopment areas.
Results and Discussion
Land use changes in Addalaichenai DSdivision
Land use pattern in Addalaichenai can becategorized into residential or Built-up area, wetland,agriculture (paddy, coconut and other crops) andmarshy lands. At present Addalaichenai faces thethreat of the land and environmental degradation dueto the unplanned urbanization and rapid developmentactivities. Due to the influence of various factors ofmany origins, land cover has undergone dynamicchanges (for an example, creating heat island).
The land use changes shown in Table-1 wereselected as the basis of time series analysis. Afterselecting proper classification system, the areaencompassed (in km2) by each land use type for allyears (1991, 2001 and 2011) were computed. Minorchanges of land uses are common in everywhere dueto localized factors and seasonal variation in weather& climate and anthropogenic activities. But theresearch focuses the major changes due to Oluvilharbour construction, highway development, posttsunami rehabilitation & reconstruction andagricultural blooming, over the period have only beenconsidered. Subsequently, land use maps were drownfor each year and visual assessment as made to analyzethe spatial patterns of land use changes as experiencedfrom 1991 to 2011 (figures 04 to 08).
Overall accuracy of the classified images derivedfrom “error matrix” under supervised classificationmethod was 87.5%, 85.3% and 91.2% respectively forall three images.

Table 1:Land Use Changes from 1991 to 2011
Table 2:Present land extents of land use classes
(2011)
Conclusion
1.155 sq Km residential area near to the beachhas been occupied by the government for Oluvilharbour development. The relocated public has beenresettled in a coconut plantation area close toAkkaraipattu Kalmunai main road and an area of 0.134sq Km Coconut plants were removed from the vicinity.In addition to the Oluvil Harbour construction a hugeamount of sea sand deposited in southern part of theharbour site and a coastal erosion experienced inNorthern side. The coastal erosion has been eradicatedby constructing special barriers in Sea (figs. 05-09).
Further the tsunami disaster in 2004 hasevacuated a large settlement from the coastal area andmoved to many places where 6.148 sq Km of scrubland area close to Aalam Kulam and Aalim Chenaiwhere human-elephant conflict are common in pastdays.
Due to the High way development under“Mahinda Chintana” facilitated the old main roadconnecting the Trinco Road to be expanded wherebycommercial area of 0.023 sq Km and paddy area of0.0178 sq Km were added to the road premises.
A solid waste management project was located ina Forest area where 0.0021sq km area was deforested(Fig 07 & 08). Further 6.873451 sq km of forest andscrub land were converted into Paddy land during thecourse of development.
The GIS environment and the remote sensinginput are giving excellent tools to carry out thisresearch accurately and quickly.
M.H. Mohamed Rinos, H.F.N. Ameera FarookLand Use/Land Cover Changes in AddalaichenaiDS Division From 1991 to 2011
[ 1 9 ]
Residential
Scrub Land
Coconutplantation(Harbour)
CommercialArea
Paddy Area
Forest &Scrub Land
Sea-water
Major land use Changes in 2011 (Area in sq Km)
Har
b
Setl
Pad
Beac
h
Road
SWM
1.15
6.15
0.13
0.02
0.02
6.87
0.02
0.16
Land
use
s in
1991
Built up 101.50Residential 1789.07Paddy 3930.88Rock 14.86Sand 65.96Scrub Land 1014.13Streams 132.75Water 79.55Total 7128.68
Type Area (ha)
Extent of Landuse Classes - 2011
Are
a (h
a)
4000.003500.003000.002500.001500.001000.00
500.000.00
Area (ha)
Builtup
101.50
Residential
1789.07
Paddy
3930.88
Rock
14.86
Sand
65.96
ScrubLand
1014.13
Streams
132.75
Water
79.55
Extent of Landuse Classes - 2011
Are
a (h
a)
4000.003500.003000.002500.001500.001000.00
500.000.00
Area (ha)
Builtup
101.50
Residential
1789.07
Paddy
3930.88
Rock
14.86
Sand
65.96
ScrubLand
1014.13
Streams
132.75
Water
79.55
Extent of Landuse Classes - 2011

Proceedings of the Third International Symposium,SEUSL: 6-7 July 2013, Oluvil, Sri Lanka
[ 2 0 ]
References
1. Gobu, B, Aruchamy, S (2002) Land Use Changesin Upper Gundar Basin: South India, The IndianGeographic Journal 77(1): 66-76
2. Goodchild, M.F (1992) GeographicalInformation Science, International Journal ofGeographical Information Science 6 (1): 31-45.
3. Herald, M., Clarke K. C., and Scepan J., (2002)Remote Sensing and Landscape metrics todescribe structures and changes in urban landuses, Environmental and Planning A, 34, 1443-1458.
4. Herald, M., Golldstein Noah C. and Clarke KeithC. (2003), The spatiotemporal forms urbangrowth: measurement, analysis and modeling,Remote Sensing of Environment, 86 (5) 86-302.
5. Heywood, I, Cornelius, S. and Carver, S. (1998)Introduction to Geographical InformationSystem, Logman, UK.
6. Kavitha, N, Jayanthi, M, Sakthivel, M (2007)Land Use/ Land Cover Changes in NelloreDistrict, The Indian Geographic Journal, 82(1&2)
7. Okunuki, K. (2001), Urban Analysis with GIS,GeoJournal, 52(3): 181-188
8. Statistical Handbook of Ampara District, (1991,2001 and 2011), District Secretariat, Ampara
Landuse Map of Addalaichenai - 2011
Landuse Map of Addalaichenai - 1991
Landuse Changes from 1991-2011
Figures: 05 – 09

[ 2 1 ]
Abstract: This paper is an attempt made to estimatethe generation and composition of Municipal SolidWastes from different waste streams in AlayadevembuPradeshiya Sabha, Ampara District. Solid wastescollected from different streams were quantified. Then,collected sample were separated into different materialcategories of wastes. The data were analyzed usingMicrosoft Excel Software. The average per capita wastegeneration was 0.48 ± 0.23 kg. This value is computedto give 12.54 tonnes/day. The composition analysisindicated that the biodegradable materials contributedthe major portion in all waste streams.
Keywords: Municipal Solid Waste, Waste streams,biodegradable waste
Introduction
The generation of solid wastes has become acritical global issue over the last decade due to theescalating growth of population. This increase in solidwaste generation poses numerous questionsconcerning the adequacy of conventional wastemanagement systems and their environmental effects(Warith, 2003). Ultimate disposal method of MunicipalSolid Wastes (MSW) in most of the urban and ruralareas of developing countries (including Sri Lanka) isopen dumping. This practice causes public health andenvironmental problems due to formation of largeamount of highly polluted leachate and landfill gases,which will create a long term threat to public health,water resources, land resources, air, and biodiversity inthe country (Visvanathan et al., 2004; Nagendran et al.,
2006). Sustainable waste management implies lessreliance on landfill and greater amounts of recyclingand composting. Recycling is the reprocessing ofdiscarded materials into new useful products, and it isusually a better alternative compared to burning ordumping wastes (Cunningham and Saigo, 1995).
Proper establishment of solid waste managementsystems require basic information on the nature ofwastes, its composition, physical & chemicalcharacteristics and generated quantities. Compositionof Municipal Solid Waste provides a description of theconstituents of the wastes and it differs widely fromplace to place. The most striking difference is thedifference in organic content which is much higher inthe low income areas than the high income areas.Generally wealthy individuals are toward to discardmore recyclables and items that can be repaired orreused (Martin Medina, 2000). This reflects thedifference in consumption pattern, cultural andeducational differences. In higher income areas,disposable materials and packaged food are used athigher quantities. Alayadevembu Pradesiya Sabhaconsists of different waste streams and the compositionof Municipal Solid Waste also differs from one streamto another. Though the hospitals, schools, institutions, etc. serve a vital role to public, thegeneration of solid waste is unavoidable. Since there isno reliable data on the quantum of solid wastegeneration and its composition, this study wasconducted to estimate the quantum of solid wastegeneration and its composition in AlayadevembuPradeshiya Sabha, Ampara District.
M.R. Thivyatharsan(1) and M. Rajendran(1)
Estimation and Characterization of MunicipalSolid Waste Generation in Alayadevembu
Pradeshiya Sabha, Ampara District(1) Department of Agricultural Engineering, Faculty of Agriculture, Eastern University,
Sri Lanka, Chenkalady, Batticaloa. (email: [email protected])

Proceedings of the Third International Symposium,SEUSL: 6-7 July 2013, Oluvil, Sri Lanka
[ 2 2 ]
Materials and methods
The information on the nature of wastes, itscomposition and quantities generated are basic needsfor the planning of a solid waste management system.Hence, a study was formulated to assess the generationand composition of wastes in AlayadevembuPradeshiya Sabha to estimate quantum of dailycollected waste, total number of collected waste loadswithin a day weighed for several days. A compositesample from each load was analyzed for composition.
Sampling methods for field survey
Alayadevembu Pradeshiya Sabha was dividedinto six sections based on similarity of demographicsand geographic features. To ensure adequaterepresentation, a statistically 10% were allocated with3 replicates from each sector. Labeled bags weredistributed among selected sampling points. For studypurpose, the waste stream was divided into differentsectors such as households, shops, markets andhospitals. Collected samples were weighed andrecorded individually. Then samples were separatedand weighed in order to find out its composition.
Per capita waste generation was calculated byusing the sampling procedure and compositionanalysis, considering total population. In order toestimate the quantum of daily collected waste inAlayadevembu Pradeshiya Sabha, total number ofcollected waste loads within a day was weighed.Meanwhile, a composite sample from each load wasanalyzed for its composition. In addition to that, acomposite sample of collected waste within a week wasalso analyzed. The composite samples were preparedby mixing the daily collected waste loads within a weekat the dumpsite of Local Authority. The data analysiswas carried out using Microsoft Excel (MS Excel)software.
Results and Discussion
Per capita waste generation and Householdwaste composition
The results indicated that the per capita wastegeneration was 0.48 + 0.23 kg and this value iscomputed to give 12.54 tonnes/day. Household waste
composition revealed that the higher percentage(67.7%) of long term biodegradable materials while8.18 % of short term biodegradable wastes (Fig.1). Inaddition, the percentage of recyclable wastes such aspaper, polyethylene & plastics, and cardboard wasteswere 5.62%, 5.4% and 4.14% respectively. The wastescollected in this region are deposed as open dumpingin bare lands without any treatment. It’s polluting theground water severely. Inefficient management of thesolid waste along with increasing population becomesa cause of environmental degradation (Adeoye et al.,2011). Hence, proper management strategies should beimplemented based on the composition of householdwastes. Since the percentage of biodegradable solidwastes was high in waste loads, composting could bepossible way to minimize the environmental problemin Alayadevembu Pradeshiya Sabha.
Fig. 1: Household waste composition
Shop waste composition
Study showed that long term biodegradablewastes and short term biodegradable wastes are themajor types of waste generated in shops. In thecollected waste loads, 61.98% was long termbiodegradable wastes while 11.62% was short termbiodegradable wastes (Fig.2). However, paper,cardboard and polyethylene were also significant.Improper dumping of these wastes creates healthhazards and environmental degradation. Generation ofleachate, gas, odour, and potential fire hazards are thecommon environmental problems in the existingdumping sites and cause threats to human andenvironment. The uncontrolled dumping of such
M.R. Thivyatharsan and M. RajendranEstimation and Characterization of Municipal Solid WasteGeneration in Alayadevembu Pradeshiya Sabha, Ampara District
wastes have not only brought about increasing numberof incidents of health hazards but also causing theground water contamination and thus posing seriousthreat to the human being (Ramachandra andBachamanda, 2007).
Fig. 2: Shop waste composition
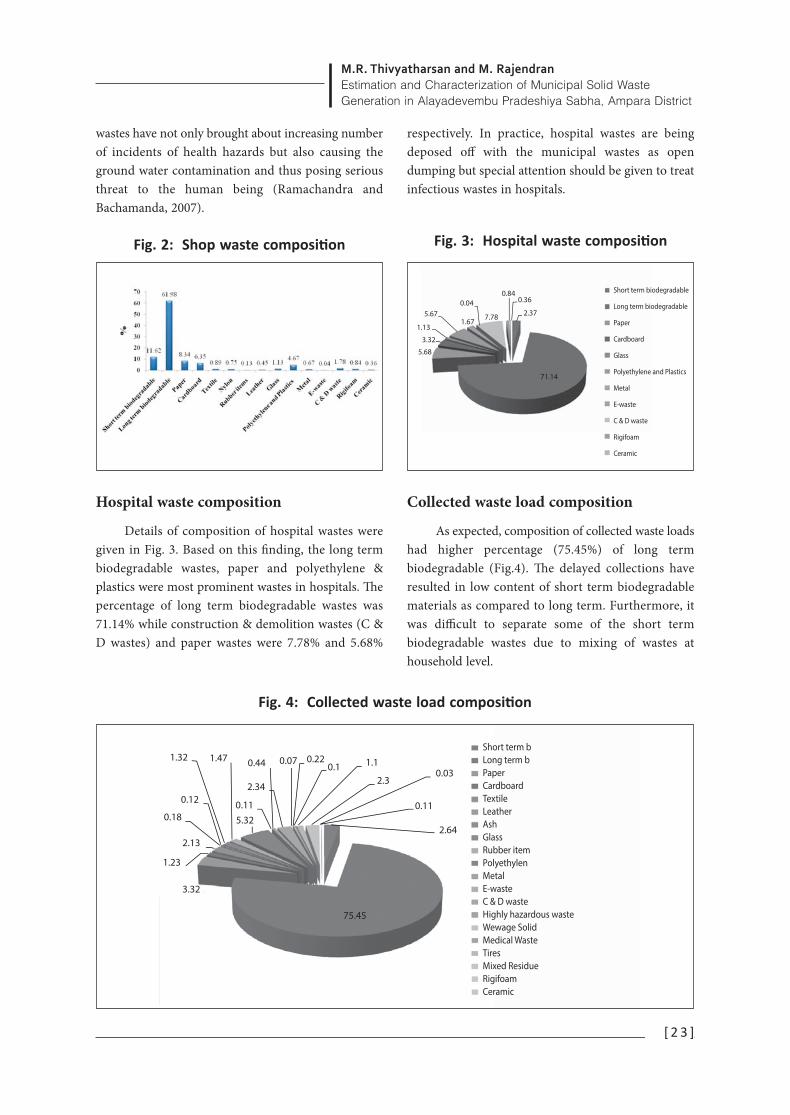
Hospital waste composition
Details of composition of hospital wastes weregiven in Fig. 3. Based on this finding, the long termbiodegradable wastes, paper and polyethylene &plastics were most prominent wastes in hospitals. Thepercentage of long term biodegradable wastes was71.14% while construction & demolition wastes (C &D wastes) and paper wastes were 7.78% and 5.68%
respectively. In practice, hospital wastes are beingdeposed off with the municipal wastes as opendumping but special attention should be given to treatinfectious wastes in hospitals.
Fig. 3: Hospital waste composition
Collected waste load composition
As expected, composition of collected waste loadshad higher percentage (75.45%) of long termbiodegradable (Fig.4). The delayed collections haveresulted in low content of short term biodegradablematerials as compared to long term. Furthermore, itwas difficult to separate some of the short termbiodegradable wastes due to mixing of wastes athousehold level.
[ 2 3 ]
75.45
3.32
1.23
2.13
0.18
0.12
1.32 1.47
5.320.11
2.34
0.44 0.07 0.220.1 1.1
2.30.03
0.11
2.64
Short term b Long term b PaperCardboardTextileLeatherAshGlassRubber itemPolyethylenMetalE-wasteC & D wasteHighly hazardous wasteWewage SolidMedical WasteTiresMixed ResidueRigifoamCeramic
2.37
71.14
0.360.84
7.78
0.04
1.675.67
1.13
3.32
5.68
Short term biodegradable
Long term biodegradable
Paper
Cardboard
Glass
Polyethylene and Plastics
Metal
E-waste
C & D waste
Rigifoam
Ceramic
Fig. 4: Collected waste load composition

Proceedings of the Third International Symposium,SEUSL: 6-7 July 2013, Oluvil, Sri Lanka
[ 2 4 ]
Conclusion
The composition study indicated that thegeneration of short term biodegradable materials waslow in comparison to long term biodegradablematerials. The percentages of long term biodegradablematerials were similar in all streams studied. Inhousehold wastes, biosolids were present and it is aserious threat to human health. Another health issueis the presence of clinical wastes found in collectedwaste loads.
By using this basic data, it is possible to designthe integrated solid waste management system toAlayadevembu Pradeshiya Sabha in order to preventthe environmental problems.
References
Adeoye, P. A., Sadeeq, M. A., Musa, J. J. andAdebayo, S. E. (2011). Solid waste management inMinna, North Central Nigeria: present practices andfuture challenges, Journal of Biodiversity andEnvironmental Sciences (JBES), 1 (6): 1-8.
Cunningham, P. and Saigo, B. W. A. (1995).Environmental Science. Global concern: WilliamBrown. Publisher Dubuque.
Martin Medina. (2000). Scavenger cooperativesin Asia and Latin America, received 28 July 1999;received in revised form 24 April 2000; accepted 15th
May 2000.
Nagendran, R., Selvam, A., Joseph, K. andChiemchaisri, C. (2006). Phytoremediation andrehabilitation of Municipal Solid Waste landfills anddumpsites. Waste Mgt, 26: 1357–1369.
Ramachandra., T. V and Bachamanda, S. (2007).Environmental audit of Municipal Solid WasteManagement, Int. J. Environmental Technology andManagement, 7: 369-391.
Visvanathan, C., Trankler, J., Kurian Joseph,Basnayake, B. F. A. and Chart Chemichaisri. (2004).Municipal Solid Waste Management in Asia. AsianRegional Research Programme on EnvironmentalTechnology, (Asian Institute of Technology, Bangkok),ISBN:974- 417-258-1.
Warith, M. A. (2003). Solid waste management:New trends in landfill design. Emirates Journal forEngineering Research, 8 (1): 61-7.

[ 2 5 ]
Abstract: Daily temperature variations in the sevenoutlets of Mahaoya thermal spring cluster wasmonitored over a period of one month. Temperatureof water was compared with rainfall events and thedischarge of each outlet. The results revealed that thetemperature variations are sensitive to the rainfall and,in individual outlets to the rate of discharge.
Keywords: Daily temperature, precipitation, thermalsprings, discharge
Introduction
Geothermal waters acquire heat either fromsubsurface hot bodies or through deep percolationunder the geothermal gradient of the earth. Theyemerge at the surface as naturally discharging hotwater springs through the weak structuraldiscontinuities. Further, the temperature of thegeothermal waters decreases when in contact withambient environments or by mixing with ground waterat shallow depths.
There are ten low-enthalpy (34-620C) thermalsprings situated at different places along the easternboundary of Highland complex and Vijayan rockcomplexes of the country. Mahaoya thermal springscluster in the eastern lowlands has temperature around34-600C (Senevirathna and Balendran, 1968). There areseven overflowing outlets, presently developed as smallwells for recreational purposes (Fig.1).
Several studies have being done on this springsite considering the geochemistry of thermal waters
(Chandrajith et al., 2012) and the origin of the springs(Dissanayaka and Jayasena, 1988). However there is nostudy found considering the temperature variations ofthermal waters in Sri Lanka.
Therefore, the purpose of the study was toevaluate the temperature variations of the outlets overa period of one month by taking the rainfall data intothe account. Some workers have identified the rainfallvariations is a factor to control some elementconcentrations and hence the temperatures of thermalwaters (Popit, et al. 2005)
Methodology
A series of daily temperature measurements weredone in the period of January, 2008. The temperatureof each outlet was measured using a mercurylaboratory thermometer by immersing thethermometer bulb in to the water. Initially theatmospheric temperature was measured by keeping thethermometer in the environmental conditions until thetemperature is constant within about 10 minutes. Thethermometer reading was readjusted to theenvironmental temperature before taking readingsfrom each outlet. The steady discharge of each outletwas also recorded using a graduated container.
Results and Discussion
The daily ambient temperatures show highfluctuations during the first half of the month andnearly constant values during the second half (Fig.2).Similar behavior can be seen in the temperatures of the
A.M.N.M.Adikaram(1), H.A.Dharmagunawardhane(2)
Diurnal temperature variations in thermalwater springs: A case study at Mahaoya
thermal spring cluster, Sri Lanka.(1) Department of Physical Sciences, Faculty of Applied Sciences,
South Eastern University of Sri Lanka, Sammanthurai, Sri Lanka. +94718318140
(2) Department of Geology, University of Peradeniya, Sri Lanka.

Proceedings of the Third International Symposium,SEUSL: 6-7 July 2013, Oluvil, Sri Lanka
[ 2 6 ]
lowest discharging two outlets (Well No. 5 and 6). Thehigher temperature outlets (Well 1, Well 2, Well 3, Well4 and Well 7) show nearly constant temperatures withlow fluctuations of ambient temperature in the monthJanuary, 2008.
Heim (Cited in Conrad, 1956) reported thatyielding thermal springs show higher ratios (5-10) ofMaximum to minimum temperature where as smallerratios (2) in low yielding ones. Maximum to minimumratios of Mahaoya thermal springs are in the range of1.0 (Table 1).
Table 1: Statistical analysis on temperatures of
thermal springs for January, 2008
Weekly temperature variation at North Californiahot springs is about 4.9 0C (Hobba et al (1979). Thesefluctuations are reported to be due to mixing with coolriver water. Conrad (1956) also suggested the low
temperatures of thermal waters at Badgastein, AustrianAlps in different periods of the year is due to mixingof infiltrated cool surface water. Figure 2 shows thetemperature variations of the Mahaoya springs inrelation to rain fall during the studied period. Ambienttemperature as well as the temperature of the lowyielding outlets appears to be significantly influence bythe rainfall. The higher yielding outlets however,appear to be unaffected by the rainfall associatedtemperature fluctuations. This probably indicates thatthe low discharges (Table 2) as well as the lowtemperatures of those are a result of barricading theflow paths of thermal water in the weatheredoverburden and mixing with infiltrated cool rain water.Higher discharging and high temperature outletsrepresent fast flow through overburden (preferentialflow paths probably acting as conduits) hampering the mixing with shallow groundwater in theoverburden.
Table 2 Calculated discharges of theMahaoya spring cluster
Discharge 0.28 0.09 0.12 0.22 <0.03 <0.01 0.11(L/Sec)Average 57 55 56 58 38 44 57temp.Max. 57 56 57 58 42 48 58temp.Min. 56 54 56 57 34 41 56temp.Standard 0.3 0.5 0.5 0.5 1.9 1.9 0.5deviationMax:Min 1.0 1.0 1.0 1.0 1.2 1.2 1.0
Well1
Well2
Well3
Well4
Well5
Well6
Well7
Well 1 55 0.28
Well 2 53 0.09
Well 3 54 0.12
Well 4 55 0.22
Well 5 37 <0.03
Well 6 42 <0.01
Well 7 54 0.11
Well name Temperature of theparticular day
(°C )
Discharge(l/s)

A.M.N.M.Adikaram, H.A.DharmagunawardhaneDiurnal temperature variations in thermal water springs: A case study at Mahaoya thermal spring cluster, Sri Lanka.
[ 2 7 ]
Figure 1: Well locations at Mahaoya thermal spring cluster
Figure 2: Daily temperature of Mahaoya thermal spring cluster in January, 2008

Proceedings of the Third International Symposium,SEUSL: 6-7 July 2013, Oluvil, Sri Lanka
[ 2 8 ]
Conclusion
The study reveals that the slow yielding outlets ofthe Mahaoya thermal spring cluster is in goodhydraulic connection with the shallow groundwaterand the high yielding outlets have more effectivepreferential paths extending to depths.
References
Chandrajith, R., Barth, J.A.C., Subasighe, N.D., MertenD. and Dissanayaka, C.B. (2012) ‘Geochemicaland isotope characterization of geothermal springwaters in Sri Lanka:Evidence for steeper thanexpected geothermal gradients’, Journal ofHydrology, vol. 476, pp. 360-369
Conrad V. (1956) ‘On thermal Springs, A contributionto the knowledge of their nature’, Meteorology andatmospheric physics, vol. 9, no. 3, pp. 371-405.
Dissanayaka C.B. and Jayasena H.A.H. (1988) ‘Origin
of Geothermal systems of Sri Lanka’, Geothermics,vol. 17, no. 4, pp. 657-669.
Hobba, W.A., D.W. Fisher, F.J Pearson and J.C.Chemeris (1979) ‘Hydrology and Geochemistry ofthermal springs of the Appalachians’, U.SGovernment Print Off. Washinton.
Popit, A., Vaupotic, J and Dolenec T. (2005)‘Geochemical and Geophysical monitoring ofthermal waters in Slovenia in relation to Seismicactivity’, Annals of Geophysics, vol. 48, no.1, pp.73-83
Seneviratne LK, Balendran VS. (1968) ‘ThermalSprings of Ceylon’, Proceedings of the AnnualConference of the Ceylon Association forAdvancement of Science].

[ 2 9 ]
Abstract: Pinga Oya is a tributary of the RiverMahaweli, which mainly runs through the Akuranatown along A9 highway and falls into River Mahaweliat Katugastota. This stream is one of the pollutedstreams/rivers in Kandy district. This paper attemptsto assess the ‘river health’ of ‘Pinga Oya’, in terms of itswater qulity and its watershed ecosystem, as it is animportant political, social, and economic issue of theregion.
Keywords: Pinga Oya, River health, Water quality
Introduction
Rain water, surface water and ground water arethe main sources of water for mankind. Rivers andstreams are important resources, crucial to a range ofwater and land-based ecosystems and activities. Therestoration and maintenance of ‘healthy’ riverecosystems have become important objectives of rivermanagement (Gore, 1985; Karr, 1991; Rapport, 1991).Their health is influenced by natural factors such asclimate and soil and rock type; however their health isalso significantly affected by human activities. Whatpeople put into water, either directly throughdischarges or indirectly via run-off from land, affectsthe quality of water and its suitability for drinking,recreation, industrial use and aquatic life.
Water quality refers to the chemical, physical andbiological characteristics of water. It is a measure of thecondition of water relative to the requirements ofone/more biotic species and/or to any humanneed/purpose. Water quality is closely linked to wateruse and to the state of economic development, humanhealth and social class.
The term ‘river health’, applied to the assessmentof river condition, is often seen as being analogous
with human health, giving many a sense ofunderstanding. Traditionally the assessment of riverwater quality has been based solely on themeasurement of physical, chemical and somebiological characteristics. Measurement of aquaticbiota have now gained acceptance for river assessment.(Norris and Thomas, 1999)
Post independent years in Sri Lanka have sadlyseen erosions in the health of its rivers. River abusethrough domestic waste dumping, industrial pollutionand catchment erosion has grammatically increased.(Athukorala, 2002)
Akurana is a small town in the Kandy Districtsurrounded by mountainous areas and fed by streams.Pinga Oya (Fig. 1) the main river that goes through theAkurana town, along A9 highway is one of the mostpolluted rivers in the Kandy district. This has caused
Nawas Farook(1)
Water quality and health of Pinga Oya (1) South Eastern University of Sri Lanka, Faculty of Applied Sciences,
Sammanthurai, Sri Lanka.
Fig. 1: Pinga Oya

Proceedings of the Third International Symposium,SEUSL: 6-7 July 2013, Oluvil, Sri Lanka
[ 3 0 ]
numerous environmental problems. Further, it floodsfrequently nowadays causing huge economical loss tothe inhabitants and blocking the transport along A9highway (Fig. 2).
Fig. 2: Flooding Pinga Oya along A9 Road(Dec 17, 2012)
To mitigate the economic losses andenvironmental problems due to the polluted PingaOya, which floods frequently the water quality and thereason and fequency of flooding must be studied in thelong run. Hence, one of the objectives of this majorwork is to monitor Pinga Oya (water chemistry andbiology) regularly for its health across the region toassess the current state of water quality, changes overtime and the nature of contaminants.
Methodology
The exploratory research technique based oninter-disciplinary was mainly used in this river healthassesment study of Pinga Oya. Assessment of riverhealth involves comparisons. Comparisons were madeby looking at various research studies at different timeperiods. Indicators thought to represent river healthare generally compared between sites that are thoughtto be similar in the absence of degradation. There are
many possible indicators of river health, includingmeasures of structure and function both of the bioticand of the physical components (Norris and Thoms,1999). The changing patterns of the ecosystem wasidentified through selected indicators. One suchindicators was chemical parameters.
Waters quality
Water quality parameters such as pH, dissolvedoxygen (DO), biological oxygen demand (BOD5),chemical oxygen demand (COD), turbidity, electricalconductivity (salinity) and nutrients (nitrogen andphosphorus) are important indicators of ecosystemhealth and can provide a measure of damage to PingaOya attributed to human activity. Significant deviationof these parameters from ‘natural’ levels can result inecosystem degradation and may impact environmentalqualities and beneficial uses. Measuring parameters,including a group of major anions and cations such aschloride, bromide, magnesium, iron and magnesiumwill enable further characterise the chemistry of thewaters, determine groundwater inputs and identify anycontamination. Inumeration of faecal coliformsindicate how much bacteria are present in that water.High nutrient and bacteria levels reflect the region’sextensive agricultural development and particularlyinfluence of domestic (kitchen and sewage) wastes onPinga Oya.
Results and discussions
This is based on the field suevys and secondarydata obtained from various sources. The unhealthystatus of Pinga Oya is subject to pollution by varioussources.
According to Wijekoon and Herath, (2001)elevated levels of faecal coliforms (500 – 7,000cfu/100ml) and relatively lower DO concentration(range of 6.5 – 2 mg/l in most occasions) wererecorded. This may be due to sewage discharges fromhousehold septic tanks along the river basin. Further,they report low levels of nutrients (less than 2 ml/l)and the BOD5 (less than 5mg/l) and reasoning out aseffects of good dilution and high assimilation.However, higher COD value were recorded at some
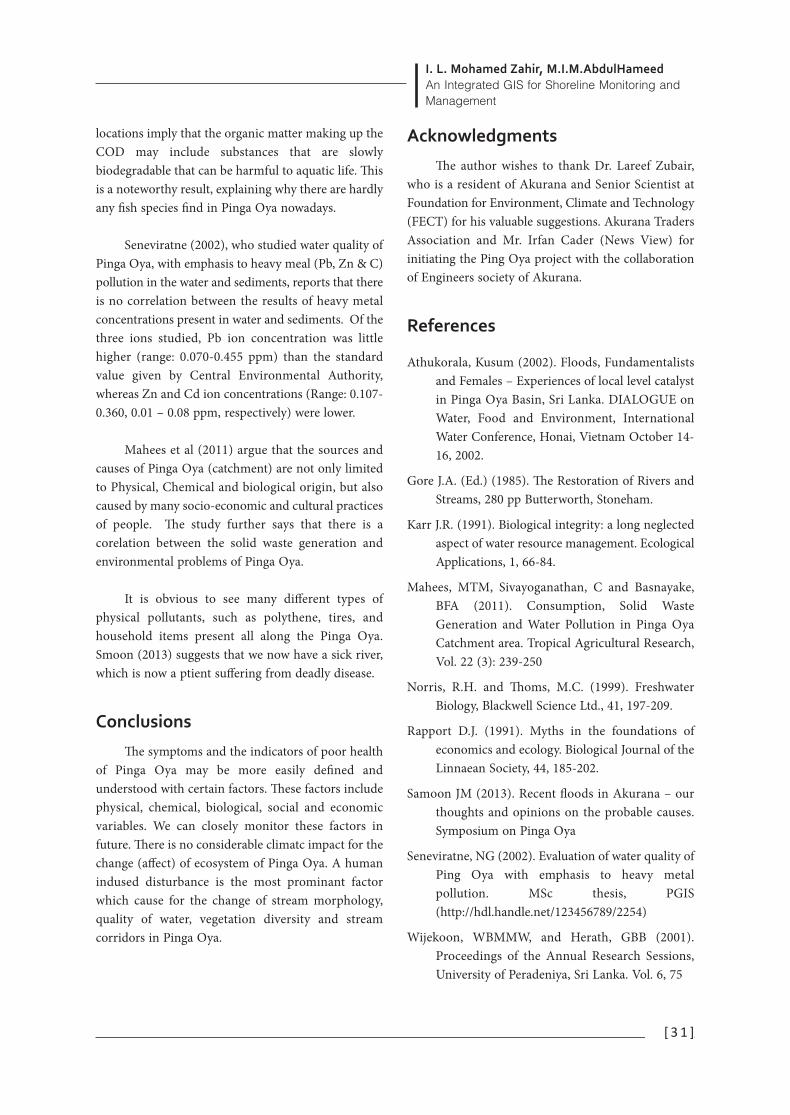
I. L. Mohamed Zahir, M.I.M.AbdulHameedAn Integrated GIS for Shoreline Monitoring andManagement
locations imply that the organic matter making up theCOD may include substances that are slowlybiodegradable that can be harmful to aquatic life. Thisis a noteworthy result, explaining why there are hardlyany fish species find in Pinga Oya nowadays.
Seneviratne (2002), who studied water quality ofPinga Oya, with emphasis to heavy meal (Pb, Zn & C)pollution in the water and sediments, reports that thereis no correlation between the results of heavy metalconcentrations present in water and sediments. Of thethree ions studied, Pb ion concentration was littlehigher (range: 0.070-0.455 ppm) than the standardvalue given by Central Environmental Authority,whereas Zn and Cd ion concentrations (Range: 0.107-0.360, 0.01 – 0.08 ppm, respectively) were lower.
Mahees et al (2011) argue that the sources andcauses of Pinga Oya (catchment) are not only limitedto Physical, Chemical and biological origin, but alsocaused by many socio-economic and cultural practicesof people. The study further says that there is acorelation between the solid waste generation andenvironmental problems of Pinga Oya.
It is obvious to see many different types ofphysical pollutants, such as polythene, tires, andhousehold items present all along the Pinga Oya.Smoon (2013) suggests that we now have a sick river,which is now a ptient suffering from deadly disease.
Conclusions
The symptoms and the indicators of poor healthof Pinga Oya may be more easily defined andunderstood with certain factors. These factors includephysical, chemical, biological, social and economicvariables. We can closely monitor these factors infuture. There is no considerable climatc impact for thechange (affect) of ecosystem of Pinga Oya. A humanindused disturbance is the most prominant factorwhich cause for the change of stream morphology,quality of water, vegetation diversity and streamcorridors in Pinga Oya.
Acknowledgments
The author wishes to thank Dr. Lareef Zubair,who is a resident of Akurana and Senior Scientist atFoundation for Environment, Climate and Technology(FECT) for his valuable suggestions. Akurana TradersAssociation and Mr. Irfan Cader (News View) forinitiating the Ping Oya project with the collaborationof Engineers society of Akurana.
References
Athukorala, Kusum (2002). Floods, Fundamentalistsand Females – Experiences of local level catalystin Pinga Oya Basin, Sri Lanka. DIALOGUE onWater, Food and Environment, InternationalWater Conference, Honai, Vietnam October 14-16, 2002.
Gore J.A. (Ed.) (1985). The Restoration of Rivers andStreams, 280 pp Butterworth, Stoneham.
Karr J.R. (1991). Biological integrity: a long neglectedaspect of water resource management. EcologicalApplications, 1, 66-84.
Mahees, MTM, Sivayoganathan, C and Basnayake,BFA (2011). Consumption, Solid WasteGeneration and Water Pollution in Pinga OyaCatchment area. Tropical Agricultural Research,Vol. 22 (3): 239-250
Norris, R.H. and Thoms, M.C. (1999). FreshwaterBiology, Blackwell Science Ltd., 41, 197-209.
Rapport D.J. (1991). Myths in the foundations ofeconomics and ecology. Biological Journal of theLinnaean Society, 44, 185-202.
Samoon JM (2013). Recent floods in Akurana – ourthoughts and opinions on the probable causes.Symposium on Pinga Oya
Seneviratne, NG (2002). Evaluation of water quality ofPing Oya with emphasis to heavy metalpollution. MSc thesis, PGIS(http://hdl.handle.net/123456789/2254)
Wijekoon, WBMMW, and Herath, GBB (2001).Proceedings of the Annual Research Sessions,University of Peradeniya, Sri Lanka. Vol. 6, 75
[ 3 1 ]

[ 3 2 ]
Abstract: A coastal Geographic Information System(GIS) has been developed to support modernizedcoastal shoreline monitoring and management. Thedata in the study are diverse, including spatial data,time series data, socio-economic data, and aerialphotographs. The spatial data are coastal shorelinelocations, topographic data, parcel data, buoy locationsand others. Time series data, such as wind and waveobservations, were integrated with spatial data throughthe location of sensors. The GIS contains threesubsystems: coastal shoreline erosion monitoring,coastal engineering management, and coastal datainventory. The results and experience gained from thisare beneficial for similar application in othergeographic area.
Keywords: GIS, coastal erosion, shorelinemanagement
Introduction
Coastal zone for the aim of this paper, shall meanthe area, on both side of the actual land water interface,where both territorial as well as marine environmentalinfluences each other. In addition, interaction betweenvarious natural processes and human activity areimportant factors in the coastal area. The coastal zoneshows high population density with large number ofurban conglomeration and in consequence, a fastpopulation growth. Also as a consequence, coastalzone are characterised by a high concentration ofeconomic and, in particular, industrial activities withall the resulting problems of resource consumption,waste management and technological risk. On coastalwater side, fisheries and aquaculture exploits a
generally highly productive system. Very specific, andvaluable as well as vulnerable, typical coastalecosystems include estuaries, salt marshes, mangroves,coral reefs etc. Offshore activities such as oil and gas,as well as mining, are additional forms of exploitationof the coastal zone. In addition, the coastal zone is alsothe recipient of all water borne waste streams,primarily attributable to agriculture, its fertilizers andagrochemical, and all treated and untreated wastewater the hinter land produce in their respectivecatchment. They all drained in to the coastal waters.Therefore, there is an urgent need for intelligentmanagement of coastal zone.
GIS Technology and coastalmanagement
Determining the accurate length of the coastlineis important for such coastal zone managementapplication as shoreline classification, monitoringerosion, mapping biological resources, habitatassessment and for the planning and response tonature (e.g. storm surges) and man made disasters (e.g.oil spills). Coastal zone management, by definition, isspatial management. Geo referenced spatial data ismap data in a digital form which mean that each of theearth’s features that are stored as spatial data has aunique geographic reference such as latitude andlongitude. The increasing use of spatial data and GIS(Geographic Information System) by organizations andresearchers is a valuable tool to help solve the planningand management issues in the coastal zone. There aremany different Geographic Information Systems in usetoday and they tend to differ in certain aspects such as“how they link geographic location with information
I. L. Mohamed Zahir(1), M.I.M.AbdulHameed (2)
An Integrated GIS for Shoreline Monitoringand Management
(1) CC & CRMD, Divisional Secretariat, Addalaichchenai, Sri Lanka.
(2) Department of Physical Science, Faculty of Applied Sciences, South Eastern University of SriLanka, Sammanthurai, Sri Lanka.

I. L. Mohamed Zahir, M.I.M.AbdulHameedAn Integrated GIS for Shoreline Monitoringand Management
about those locations, the accuracy with which theyspecify geographic location, the level of analysis theyperform and the way they present information asgraphic drawing”.
What is GIS?
At this point it is useful to consider exactly whatGeographical Information System is (and what it isnot). The definition of GIS are numerous but a usefulone is that it is a data base system in which most of thedata are spatially indexed and upon which a set ofprocedures operates in order to answer queries aboutthe spatial entities in the data base. Thus it is aninformation system whose relation basis is co-ordinatedata of the form X, Y, Z, a concept familiar to thesurveyor. The function of an information system is toimprove a user’s ability to make decision in research,planning and management; a GIS is thereforeessentially a management tool.
Why GIS for coastal zonemanagement?
Since the coast all around the world are fastdeveloping and firm management policies have to beestablished. However, for any management of the shoreto be effective, it is necessary for the policies to bebased on informed decision-making. This in turnrequires ready access to appropriate, reliable and timelydata and information, in suitable form for the task athand. Since much of this information and data is likelyto have spatial component, one branch of informationtechnology with apparent potential for contributingsignificantly to coastal management in a number ofways. These include:
r The ability to handle much larger databases andto integrate and synthesise data from a muchwider range of relevant criteria than might beachieved by manual methods. This in turnmeans that more balanced and coordinatedmanagement strategies may be developed forconsiderably longer lengths of coast.
r GIS encourages the development and use ofstandards for coastal data definition,
collection and storage, which promotescompatibility of data and processingtechniques between projects anddepartments, as well as ensuring consistencyof approach at any one site over time.
r The use of a shared database (especially ifthe access is provided via a data network)also facilitates the updating of records, andthe provision of a common set of data to themany different departments or offices thatmight typically be involved in managementof a single stretch of coast. A shared databaseimplies reduction or elimination ofduplicated records, and thus the potential forsignificant economic savings as well asimproved operational efficiency.
r Provides efficient data storage and retrievalfacilities.
r GIS also offers the ability to model, test andcompare alternate management scenarios,before a proposed strategy is imposed on thereal-world system. Computer technologyallows the consideration of much morecomplex simulations; their application tovery much larger data bases: and alsoenables compression of temporal and spatialscales to more manageable dimensions.
Accuracy of GIS
Map accuracy is relatively a minor issue incartography, and the map user are rarely aware of theproblem. But when the same map is digitised and inputto GIS, the mode of use changes. The new uses extendwell beyond the domain for which the original mapwas intended and designed. Therefore, accuracyproblem in GIS requires consideration of both objectoriented and field oriented views of geographicvariations. Moreover, the machines used to makemeasurement in GIS (Digital computers) areinherently more precise than the machine ofconventional map analysis. Error analysis in spatialdata base is very important with a direct bearing on theaccuracy on GIS and hence require due consideration.
[ 3 3 ]

Proceedings of the Third International Symposium,SEUSL: 6-7 July 2013, Oluvil, Sri Lanka
[ 3 4 ]
One of major requirements in the Digital TopographicData Bases (DTDB) of a large country is considerationof a variety of features. Digital Stereo photogrammetrymay be useful in extraction of cartographic featureswith a greater accuracy. The Digital Elevation data inthe form of contours, thus digital monoplotting can beconsidered as a quicker method of plotting the data formaintenance of DTDB. Some of the other factors thatalso must be considered are:
r The type of spatial data
r The scale and resolution of the spatial data
r The type of map projection
r The measuring unit
r Horizontal and vertical datum forGeographic co-ordinates
r Metadata
Data and information requirementsfor coastal zone management
In order to be of any value, it is necessary that theinformation products output from a CZMs shouldcorrespond with the actual requirements of the varioususer communities. These information requirementsinclude; given a number of potential users of coastalzone data and information, what are the main areas ofcommon interest or significant diversity regardingboth information desired, and the data needed to beprocessed in order to obtain that information. Thevarious information required for achieving the goal ofan effective management of the coastal zone could becategorised broadly under following headings.
Geographical data: an organised, planned andcoherent coastal database should therefore a basicrequirement of a good and constant management.Many of the data to be found within a coastalmanagement database will be geographic in nature andcan be called a Geographical data. It is a “data, whichrefers specially to features that describe the earth’ssurface”. Geographical data has both location andattributes. We can define the where something is as theSpatial component of data, is the spatial or attributecomponent of data.
Table 1.1: Spatial Component of Data
r Spatial data: It is an explicit spatial/locational reference and can involve absoluteor relative locations. These are often referredto as point, lines, areas, or surfaces or canrefer to some attribute that is continuous(e.g. elevation), or discrete (e.g. Male/Femaleor soil categories).
r Attribute Data: Attribute data describes whatis a some location and has some linkbetween it and the spatial data.
For example: A map with country boundaries vsthe same map with country names have a spatialdimension to them, and in many cases this spatialcomponent can be harnessed as the common factor,which unites the disparate data elements into acoherent and integrated structure.
Table 1.2: Classification of CoastalInformation Data
EstuariesSea grassMacro algaeInter-tidalSalt-marshMangrovesWadersRookeriesShellfish
Sandy BeachRocky beachRocky cliffInter-tidalMangrovesSalt marshOthers
Roads(major)Roads (minor)Major PortsHarboursMarinasBoat rampsAirportsNav channelNav MarkersFerry routes
Habitats Coast Transport
Bathymetry< 2 m< 5 m< 10 mInter tidalSpoil dumpOthers
ResidentialIndustrialCommercialRecreationalPortsHarboursMarinasMooringBoat ramps
National ParksTerrestrialMarineCultural featuresSacred sitesRisk to personnelNavigationMilitaryZoning
Seabed Infrastructure Restricted Zones

Classification of Coastal Information Data: Manycoastal databases will, in potential or in reality, displaymany classic characteristics of databases found in GIS.As with any other GIS application, the data involved increating a coastal GIS database fall into a number ofdistinct categories. Depending on the method ofclassification used, these include:
v Basic Geodetic or Planimetric Data: Itestablishes the geographic referencingsystem against which coastal entities orprocesses of interest may be placed.
v Topographic Data: It records the locationand distribution of natural and culturalfeatures(beaches, cliffs, dunes, roads,settlements, harbours, etc) within thelandscape;
v Qualitative and Quantitative Attribute Data:It provides further information about theproperties (size of sediments on beach,morphodynamic indices, tidal range, valueof coastal properties, amount of shippingvisiting selected ports, etc) of coastal entitiesand phenomena.
v Time series data: It allows temporaldatabases to be compiled (Langran,1990),and information to be gleaned about thevariability of coastal entities , attributes andrelationships in both space and time; and
v Metadata: It allows estimations to be madeof currency, completeness, history,ownership, and reliability of information,derived from the system.
Sources of Coastal Information Data: Asidentified above, two types of data are inputinto a GIS, spatial and attribute. A widevariety of data sources exist for both spatialand attribute data.
Application areas for coastal zonemanagement
Given the diversity of tasks facing the coastalmanager and also the range of data processingfunctions that may exist in a typical GIS, there is amultiplicity of potential application areas for coastalGIS technology. Few generic areas of applications areas follows:
Coastal resource survey and management:Continuing expansion of human population increasespressure on the shore for living space, leisure andrecreation, and a host of the purposes. At the sametime, the oceans and coastal waters of the world arealso important hunting grounds for a wide range ofeconomic resources, of value to society. As theseresources gradually depleted, there is a correspondingincrease in the need to explore conservation measureson remaining sticks. GIS has considerable potential toassist in these tasks. Few examples are as follows:
v Within the leisure and recreation sectors,GIS has been used to assist in thedevelopment of new or improvedinfrastructure including development ofnew shore-based facilities such as marinas,and the management of recreation activitiesin the areas of fragile coastal dune systems.
v In the fishing and aquaculture industries,GIS may be used to find optimal locationsfor fish-farms, through the analysis ofsalinity, bathymetry, shelter, land uses,proximity to other facilities, etc.
v GIS is also a major technology within themining and oil exploration industries,where it is harnessed to assist in thediscovery, assessment and exploration ofnew mineral wealth.
[ 3 5 ]
Bottom TypeSandHard clayRock, mudshellCoral reefsOthers
Benthic FloraSea grassSeaweedCoral
IntakesOutfallsFresh waterPowergenerationHinterlandEducationMedical facilities
Ecologicallysensitive areaBreeding &spawning groundHistorical areasHeritage area
I. L. Mohamed Zahir, M.I.M.AbdulHameedAn Integrated GIS for Shoreline Monitoringand Management

Proceedings of the Third International Symposium,SEUSL: 6-7 July 2013, Oluvil, Sri Lanka
[ 3 6 ]
Coastal change monitoring and analysis: Thecoastal zone is highly dynamic, and the scientist ormanager increasing requires access to technologies thatcan represent these dynamics, particularly to evaluateand deal appropriately with changes in the geometryor the shore. Two main divisions of coastal changeanalysis may be recognised, namely monitoring andsimulation modeling respectively.
In monitoring studies, the primary objective is torecord what aspects of the coast are changing, andwhere and why these changes are taking place.Monitoring at its simplest involves recording what ispresent at one baseline instance in time, and thencomparing this pattern with that of subsequent stages.
GIS has been applied at the coast in order to keeptrack of a wide range of natural and human-inducedchanges, including:
v Changes in the extent and ecology ofwetlands
v Analysis of erosion and shoreline changes
v Assessment of potential and actual floodhazard and damage.
v The silting up of harbours and theeffectiveness and impacts of mitigationefforts such as dredging.
v Monitoring the changes of land use in thecoastal hinterlands, in particular thegrowing urbanization of the coastal fringe;and
v Monitoring the behaviour of oil spillages incoastal environments.
Modelling coastal process: While monitoring canhelp identify and evaluate changes that are taking placeat the shore, effective management of the coastal zoneoccasionally requires intervention and manipulation ofthe processes, controls, feedback and interrelationshipsat work along, within and across the shore, in order toarrive at more desirable ends. Modeling and simulationof coastal phenomena are extremely valuabletechniques for assessing the effectiveness and likelyimpacts of such intervention.
Traditional modeling of coastal phenomena hasmostly relied on experiments with wave tanks andother large physical models. However, it is becomingincreasingly common to us computer-based simulationmodeling techniques wherever appropriate. Amongthe other benefits, computerised simulation has thepotential to overcome scale limitations that may bepresent in a physical model; may avoid the need forphysical destruction or alteration of materials understudy; can provide greater degree of control over thetemporal aspects of the simulation (includingcompression of long time periods into moremanageable extent, temporary halting or even reversalof the model to examine specific aspects in greaterdetail; etc.); and may be much cheaper and moremanageable than construction of a physical model.Furthermore, development of a successful computersimulation depends on the creation of a robust datamodel for representing the system variables within theGIS, and this in turn requires a meaningfulconceptualisation of the phenomena under study.Thus, the process of setting up the simulation can,itself, promote greater awareness of the constituent andrelationships at work within the coastal system.
A number of examples are documented in theliterature, describing the use of GIS technology formodeling processes and events within the coastal zone.Typical applications include the use of GIS forassessing the threat of sea level rise on the coast ofmaine, and the likely responses of coastal sand dunesto such rise. Modeling of oil spills with a view tominimising their environmental impacts, modellingpossible impacts of dredge spoil dumping, modelingfor multiple use of estuarine waters, and assessment ofpossible sites for aquaculture development.
GIS for coastal decision-making and policyformulation: by combining rapid data retrieval withanalytical and modeling functions, GIS has the abilityto respond rapidly and flexibly to ad hoc ‘what if typequestions’. Thus, a well-designed coastal zoneinformation system could be significant as a decision-support tool, to aid development of integrated andsustainable coastal management strategies.

Conclusion
GIS should be viewed as an opportunity for themarine community to advance in the field of coastalzone management. GIS represents the latest essentialtools to solve the spatial data-handling problem.Proper use of GIS required the data knowledge of thesalt grimed hydrographic surveyor, the mapcomposition skills of the experienced cartographer, thedata base management skill of the data processingperson, the scientific insight of geographer, thecomputer knowledge of a system analyst, and thepersonnel and organisation skill of the manager. Thecoastal zone GIS are currently enjoying a majorupsurge in the level of interest and there are groundsfor optimism in believing that the significant advancesin this direction is not too far away. It can beconcluded that the use of GIS in coastal zonemanagement is very useful.
References
Anderson, V. and Skrizhevskaya, E.V. (1997)IntegratedCoastal Zone Management with GIS: the case ofUkrainian Black Sea Region. 738-747, In:Geographical Information '97. Proceedings of theThird Joint European Conference and Exhibitionon Geographical Information, Austria Center,Vienna, April 16-18 1997. 402-411. IOS Press,Amsterdam.
Cicin-Sain, B., 1993, Sustainable development andintegrated coastal management.Ocean & CoastalManagement, 21 (1-3), pp.11-43.
Dr. Robin K H Falconer (1990) “ Experience withGeographic Information System (GIS) in themarine world”. Hydrographic Journal.
Feoli, E. (1995)Data Analysis and Data Integration inCoastal Zone Management: the ICS experience.Public Enterprise 15:65-73.
Garofalo, G., Fortunati, L, Cannizzaro, L. and Scalisi,M. (1997)Mapping of Marine Resources byMeans of Geostatistical Analysis and GISTechnology.832-837, In: Özhan, E. [ed.]Proceedings of the Third InternationalConference on the Mediterranean CoastalEnvironment MEDCOAST 97, November 11-141997; Qawra, Malta.
MD Joshi and R Shivakumar (2000) Some aspects ofAccuracy in GIS” GIS@Development, Vol. 2 Issue2.
R G Humphreys A. R. I. C. S., Dip. H. S. (1989)“Marine Information System” the HydrographicJournal.
Romão, T., Sousa, I., Molendijk, M. and Scholten, H.(1997)Multidimensional Visualisation Tools inCoastal Zone Management. In: GeographicalInformation '97. Proceedings of the Third JointEuropean Conference and Exhibition onGeographical Information, Austria Center,Vienna, April 16-18 1997. 402-411. IOS Press,Amsterdam.
UNEP (1995)Guidelines for Integrated Planning andManagement of Coastal and Marine Areas in theCaribbean.RCU/CEP/UNEP, Kingston, Jamaica.
[ 3 7 ]
I. L. Mohamed Zahir, M.I.M.AbdulHameedAn Integrated GIS for Shoreline Monitoringand Management

[ 3 8 ]
Abstract: In a pot culture experiment differentorganic phosphorus sources (farmyard manure,poultry manure, vermicompost and sewage sludge)were evaluated with standard inorganic source ofsingle superphosphate to improve soil nutrient content,all applied on equal P basis @ 34 kg P2O5 ha-1. The sixtreatments, including no-P (control) were replicatedfour times in a CRD. Groundnut was sown in each pot.The experimental results revealed that phosphorusincreased the post-harvest soil nutrients availability.Highest availability of nitrogen, phosphorus, potassiumand sulphur was recorded in poultry manure treatmentand sewage sludge exhibited a considerable increase inavailable nitrogen and sulphur content.
Keywords: Inorganic phosphorus source, Organicphosphorus source,
Introduction
Oilseeds are energy rich crops and their nutrientrequirement is high (Hegde, 2000). Low or no use ofplant nutrients is one of the most important factors forlow productivity of oilseeds. The estimated nutrientremoval by oilseeds crop during 2003 – 2004 was 3.24million tonnes (N, P and K), while the contribution tonutrient uptake from fertilizer was only 15.4 per cent(Hegde, 2006).
Soil fertility cannot be maintained with theapplication of inorganic fertilizers alone. Besidesinorganic chemical fertilizers, there are several sourcesof plant nutrients like organic manures, crop residues,and industrial wastes. No single source can meet theincreasing nutrient demands for agriculture. Toachieve sustainability in production, there is a need tointegrate both organic and inorganic sources ofnutrients. Such an integration of nutrient sources will
enhance the nutritional use efficiencies (Hegde andSudhakarababu, 2001) besides maintaining soil fertility.Phosphorus can be termed as “life mineral” because ofits crucial role in metabolic and energy transferreactions in living systems. Phosphorus has a great rolein energy storage and transfer and as a constituent ofnucleic acid, phytin and phospholipids in plants. Anadequate supply of phosphorus early in plant life isimportant for the reproductive parts of the plants.
The availability of phosphate in soils is oftenlimited by fixation reactions, which convert themonophosphate ion to various insoluble forms. Theavailability of soil phosphate is enhanced by additionsof organic manures, presumably due to chelation ofpolyvalent cations by organic acids and other decayproducts. Varalakshmi et al., (2005) demonstrated thatincorporation of farm yard manure along withinorganic phosphorus increases the availability ofphosphorus and this is attributable to reduction infixation of water soluble phosphorus, increasedmineralization of organic phosphorus due to microbialaction and enhanced mobility of phosphorus. Specificattention needs to be given to harness the residualeffect of phosphorus (Kumaran and Solaimalai, 2000).
Materials and Methods
The soil used in this study contained 15.5, 6.5 and78.0 percent clay, silt and sand respectively and loamysand in texture. The contents of available nitrogen,phosphorus potassium and sulphur were 261.8, 8.70191.0 kg ha-1 and 8.07 mg kg-1 respectively and theorganic carbon content was 6.3 g kg-1. The phosphoruscontent of organic manures used was 1.12, 3.80, 0.94and 1.81 percent in farmyard manure, poultry manure,vermicompost and sewage sludge respectively.
Punitha Premanantharajah(1) and Fathima Rifka M. Jainudeen(2)
Effect of local amendments as a partialsubstitute for phosphorus on soil quality
(1), (2) Department of Agricultural Chemistry, Faculty of Agriculture, Eastern University,Chenkalady, Sri Lanka. (email:[email protected])

Punitha Premanantharajah and Fathima Rifka M. JainudeenEffect of local amendments as a partial substitute forphosphorus on soil quality
The processed soil samples were filled in earthenpots, at the rate of 8 kg soil per pot. There were fourorganic sources (farmyard manure, poultry manure,vermicompost and sewage sludge) evaluated incomparison with the standard inorganic source ofsingle superphosphate. The six treatments, including ano-P (control) were replicated four times in acompletely randomized design (making a total of 24pots). To all the 24 pots, common basal applications of17 kg N ha-1 as urea, 54 kg K2O ha-1 as muriate ofpotash and 74.34 kg S ha-1 as gypsum were given.
Organic sources of P were applied to each pot, also theinorganic SSP as reference source, all on equivalent Pbasis @ 34 kg P2O5 ha-1 (0.054 g P per pot).
Seeds of groundnut (five per pot) were sown ineach pot. After the germination, the plants werethinned to 3 per pot. Routine cultural practices wereadopted in raising the crop. After the harvest ofgroundnut, the soil in the pots were removed, and soilnutrient content was analyzed by using followingmethods (Tab 1).
[ 3 9 ]
Table 1: Analytical methods used in the study
Particulars Procedure Reference
Organic carbon Chromic acid wet digestion Walkley and Black (1934)
KMnO4 Nitrogen Alkaline permanganate method Subbiah and Asija (1956)
Olsen’s Phosphorus 0.5 M NaHCO3 (pH 8.5) Olsen et al. (1954)
NH4OAc Potassium Neutral N ammonium acetate Stanford and English (1949)
0.15 % CaCl2 Sulphur Turbidimetry Chesnin and Yien (1950)
Results and Discussion
Table 2: Effect of phosphorus sources on post‐harvest soil nutrient availability
Phosphorus sources Organic C (g kg-1)
Available P (kg ha–1)
Available N (kg ha–1)
Available K (kg ha–1)
Available S (mg kg-1)
Control 4.0d 10.9 e 272.7d 110.3d 7.3e
Farmyard manure 6.9b 25.2b 295.1b 194.5a 21.9bc
Poultry manure 6.5c 28.5a 311.9a 203.5a 26.7a
Vermicompost 7.2a 17.5d 286bc 180.3b 18.7cd
Sewage sludge 6.3c 22.2c 314.7a 170.3b 24.3ab
Superphosphate 5.7e 15.0d 285.3c 150.3c 17d
CD (P = 0.05) 0.2 2.78
9.64 13.5
3.20
Mean followed by the same letters in each column are not significantly different at p<0.05 according to DMRT

Proceedings of the Third International Symposium,SEUSL: 6-7 July 2013, Oluvil, Sri Lanka
[ 4 0 ]
Soil organic carbon contentPhosphorus application significantly increased
the soil organic carbon content. Among thephosphorus sources, vermicompost was foremost (7.2g kg-1). Superphosphate treated soil recorded the lowestorganic carbon content (5.7 g kg-1) and wassignificantly higher than control.
The increase in organic carbon content might bedue to the addition of organic manures whichstimulated the growth and activity of microorganisms,and also due to better root growth. These observationsare in line with the findings of Varalakshmi et al.(2005) in groundnut – finger millet cropping sequence.Organic carbon content was also high in inorganicphosphorus (single super phosphate) treated soil. Thismight be due to the improvement in root and shootgrowth. Higher production of biomass might haveincreased the organic carbon content (Babhulkar et al.,2000).
Soil available phosphorus contentThe results pertaining to the available
phosphorus content in post-harvest soils indicated thatthe phosphorus application through different sourcessignificantly increased the phosphorus content in soilfrom 10.9 (control) to 28.5 kg ha-1 after the harvest ofgroundnut. The highest phosphorus content wasrecorded in poultry manure treated soil. Farmyardmanure was the second best source. Among organicsources vermicompost recorded the lowest value (17.5kg ha-1). But it was significantly superior tosuperphosphate treatment.
Phosphorus availability increased significantlyfrom 10.9 kg ha-1 under control to 25.2 kg ha-1 withfarmyard manure application and to 28.5 kg ha-1 withpoultry manure. Organic acids and chelates areproduced during microbial decomposition of organicresidues. These organic acids help in the solubility ofnative phosphorus as a result of which increase inavailable phosphorus content in wheat (Tomar et al.,1984). Applied organic manure leads to the formationof coating on the sesquioxides because of which thephosphorus fixing capacity of soil was reduced inmanure treated plots in groundnut (Seshadri Reddy,2005). Mohamad Tariq and Stephen Robinson (2003)
confirmed the decreases in soil phosphorus sorptioncharacteristics following the application of animalmanures and effluents.
Kalita and Kalita (1992) reported that theavailable phosphorus and exchangeable calciumcontents increased after harvest of green gram withincreasing rates of phosphorus added to green gramthrough single superphosphate. This increase inphosphorus availability might be attributed to thehumic substances secreted by roots, mineralizationeffect of soil microflora and carbon-di-oxideproduction by greengram roots and associatedmicroorganisms.
Soil available nitrogen contentThe analysis of the post-harvest soil for available
nitrogen indicated that the application of phosphorussources significantly increased the nitrogen availability.Among the organic sources sewage sludge exhibited aconsiderable increase in available nitrogen content(314.7 kg ha-1). It was comparable with poultry manuretreatment (311.9 kg ha-1). Vermicompost recorded thelowest nitrogen content in post-harvest soil (286 kg ha-
1). Vermicompost and superphosphate treatments didnot show any significant difference among them butwere significantly superior to control.
Application of organic manures had significantimpact on the available nitrogen content. Among theorganic sources poultry manure and sewage sludgeexhibited a considerable increase in available nitrogencontent. Organic manures provide energy fornodulation and nitrogen fixation by microorganisms.Similar views were expressed by Rao (2003).
Soil available potassium contentApplication of phosphorus sources exhibited
considerable increase in soil available potassiumcontent in post-harvest soil after groundnut. Poultrymanure recorded the highest available potassiumcontent in soil (203.5 kg ha-1). It was comparable withfarmyard manure treatment (194.5 kg ha-1).Superphosphate recorded the lowest value amongtreatments. But it was significantly higher than control.

The higher availability of potassium in soil mightbe due to the beneficial effects of organic manures onthe reduction of potassium fixation; added organicmatter interacted with potassium - clay to releasepotassium from the non-exchangeable fraction to theavailable pool (Seshadri Reddy, 2005).
Soil available sulphur contentThe results of sulphur content in post-harvest soil
indicated that poultry manure recorded the highestavailable sulphur in soil (26.7 mg kg-1). This was on parwith sewage sludge treatment (24.3 mg kg-1). Farmyardmanure treated soil had 21.9 mg kg-1 of sulphur afterthe harvest of groundnut. But this was significantlylower than poultry manure and sewage sludge treatedsoils. Among the phosphorus treatmentssuperphosphate recorded the lowest value (17 mg kg-
1). Pandey et al. (2000) confirmed that sulphuravailability was significantly and positively influencedby organic matter due to release of organic acids ondecomposition of organic matter, causingsolubilization of insoluble sulphur complexes. Post-harvest soil nutrients availability was significantlyhigher in phosphorus treated soils. Organic carbon,available nitrogen, available phosphorus, availablepotassium and available sulphur contents of soil weresignificantly improved with different phosphorussources. Among the different phosphorus sources,poultry manure increased the available nitrogen,phosphorus, potassium and sulphur status over controlmore than other sources. Poultry manure is richorganic manure since solid and liquid excreta areexcreted together resulting in no urine loss (MohamedAmanullah et al., 2007).
Conclusion
The highest availability of phosphorus, potassiumand sulphur in post-harvest soil after groundnut wasrecorded in poultry manure treatment. Sewage sludgeexhibited a considerable increase in available nitrogencontent of post-harvest soil and was comparable withpoultry manure treatment.
References
Babhulkar, P.S., Wandile, R.M., Badole, W.P. andBalpande, S.S. 2000. Residual effect of long-termapplication of farmyard manure and fertilizers onsoil properties and yield of soybean. J. Indian Soc.Soil Sci., 48 (1): 89–92.
Chesnin, L. and Yien, C.H. 1950. Turbidimetricdetermination of available sulphur. Soil Sci. Soc.Am. Proc. 15: 149-151.
Hegde, D.M. 2000. Nutrient management in oilseedcrops. Fert. News, 45 (4): 31 -41.
Hegde, D.M. 2006. Finding newer niches imperative.The Hindu Survey of Indian Agriculture, Kasturi& Sons Ltd., Chennai, pp. 66-69.
Hegde, D.M. and S.N. Sudhakarababu. 2001. Nutrientmanagement strategies in agriculture: A futureoutlook. Fert. News, 46 (12): 61-72.
Kalita, M.M. and Kalita, B. 1992. Direct and residualeffect of phosphorus and lime on green gram(Phaseolus radiatus) – rapeseed (Brassica napus)sequence. Indian J. Agron., 37: 549–551.
Kumaran, S. and Solaimalai, A. 2000. Effect of organicmanure and inorganic fertilizers on yield andnutrient uptake of irrigated groundnut. Crop Res.,20 (1): 35-38.
Mohamad Amanullah, M., Somasundaram, E.,Vaiyapuri, K. and Sathyamoorthi, K. 2007.Poultry manure to crops – A review. Agric. Rev.,28 (3): 216-222.
Mohamad Tariq. S. and Stephen Robinson, J. 2003.Phosphorus sorption and availability in soilsamended with animal manures and sewagesludge. J. Environ. Qual., 32: 1114-1121.
Olsen, S.R., Cole, C.V., Watanabe, F.S. and Dean, A.L.1954. Estimation of available phosphorus in soilsby extraction with sodium bicarbonate. Circular
[ 4 1 ]
Punitha Premanantharajah and Fathima Rifka M. JainudeenEffect of local amendments as a partial substitute forphosphorus on soil quality

Proceedings of the Third International Symposium,SEUSL: 6-7 July 2013, Oluvil, Sri Lanka
[ 4 2 ]
No.: 939, USDA, US Govt. Printing Office,Washington DC.
Pandey, S.P., Singh, R.S. and Mishra, S.K. 2000.Availability of phosphorus and sulphur inInceptisols of Central Uttar Pradesh. J. IndianSoc. Soil Sci., 48 (1): 118-121.
Stanford, S. and English, L. 1949. Use of flamephotometer in rapid soil test of K and Ca. Agron.J., 41: 446-447.
Subbiah, B.V. and Asija, G.L. 1956. A rapid procedurefor estimation of available N in soils. Curr. Sci.,25: 259–260.
Rao, S.S. 2003. Nutrient balance and economics ofintegrated nutrient management in groundnut(Arachis hypogaea) - mustard (Brassica juncea).Madras Agric. J., 90 (7-9): 465–471.
Seshadri Reddy, S. 2005. Effect of different organicmanures on available NPK status and organic
carbon after harvest of groundnut. Crop Res., 30(1): 26–29.
Tomar, N.K., Gupta, A.P. and Khanna, S.S. 1984.Evaluation of rock phosphate superphosphatemixtures by incubation in organic matter forefficient use in wheat. Fert. News, 29: 37–38.
Varalakshmi, L.R., Srinivasamurthy, C.A. and Bhaskar,S. 2005. . Effect of integrated use of organicmanures and inorganic fertilizers on organiccarbon, available nitrogen, phosphorus andpotassium in sustaining productivity ofgroundnut – finger millet cropping system. J.Indian Soc. Soil Sci., 52 (3): 315-318.
Walkley, A. and Black, C.A. 1934. An examination ofthe Degtjareff method for determining soilorganic matter and a proposed modification ofthe chromic acid titration method. Soil Sci. 40:233-243.

[ 4 3 ]
Abstract: Polypropylene is accumulated in theenvironment that serious cause for society and human.It’s degradation under artificial climate was studied inthis research. Polypropylene pieces (3*15cm ) wereweighted and they were kept under artificial thermalcondition for 0-12 hours at 80,100,120,140˚Ctemperature and weight were recorded at different timeinterval. Average weight loss of polypropylene sampleswere 0.3 – 0.4 % at end of 12 hours. The order ofreaction (n) varies was obtained respect to degradationof polypropylene. The toughness of material wasrecorded, it varied from 35% to 95% from initialvalues.
Keywords: Polypropylene, Isothermal condition,Weight loss, Order of reaction
Introduction
Plastic has become an environmental problemsince it is not properly disposed and takes significantpercentage in solid waste / garbage. Polypropylene (PP)has been widely used as materials in the householdappliance, medical equipment, automotive and otherindustries. Therefore, polypropylene has takenconsiderable amount in solid waste of plastic. Theamount of accumulating polypropylene solid wasteshould be reduced by recycling or degradation.However, PP easily undergoes oxidative degradationunder the influence of elevated temperature orsunlight, and the degradation leads to a deteriorationof the mechanical properties (Madras & Bamtord,2000). Since thermal degradation behavior of
polypropylene is helpful to mitigate this wasteaccumulation problem and as well as this knowledgeis important for recycling process to control theprocess parameter. Many kinetic models have beendeveloped to describe kinetic degradation. Thesemodels were based on weight loss due to isothermalcondition (Won, Sung & Seung, 2000).
In this study various models, such as; Kissinger,Fridman, Ozawa were applied to explain the thermal-degradation (Roy, Surekha, Rajagopal & Choudhary,2007), and obtain the activity energy, frequency factor,and reaction order for the thermal degradation of eachsample. Generally, the reaction rate of degradation isproportional to concentration of the reactant. In thecase of polymer degradation it is usual to assume thatthe rate of conversion is proportional to theconcentration of the material which remains to react.Meanwhile, the temperature dependence of the rateconstant is given by Arrhenius expression (Huimin,Xiaoming & Edward, 2004). This paper is intended toinitiate isothermal degradation studies ofpolypropylene and, obtained order of reaction and aswell as toughness changed at different temperature.
Methodology
Commercial polypropylene samples, plastic boxesused in ice cream manufacturing industry with amedium density of 0.92g/cm3 were used as aninvestigating material. Dumbbell shape 0.2 mmthickness standard size samples were cut using cuttingmachine. The isothermal heating of polypropylene was
L.P.S. Rohitha(1), S.S.N. Perera(2) and M.A.B. Prashantha(3)
Behaviour of order of reaction andtoughness of polypropylene at artificial
thermal condition(1) Department of Earth Resources Engineering, University of Moratuwa, Sri Lanka.
(2) Research & Development Centre for Mathematical Modelling, Department of Mathematics,University of Colombo, Sri Lanka.
(3) Department of Chemistry, University of Sri Jayewardenepura, Sri Lanka.

Proceedings of the Third International Symposium,SEUSL: 6-7 July 2013, Oluvil, Sri Lanka
[ 4 4 ]
done at 80,100,120,140˚C various temperature. Theweight of sample was reported at every two hour timeinterval from the beginning. Three replicate run ofseveral representative samples and average value hasbeen taken. There after data of experiment wereanalyzed. Using tensile test, tensile stress and tensilestrain curves were obtained. There after toughens wascalculated using tensile stress and tensile strain curves.
Kinetic model
The overall rate of polymer degradation iscommonly described by Equation (1) (Flynn, 1989 &
Roy, 2007).
Parameters of the above formula are as follows. αis the polymer conversion, t is the time, T is thetemperature (K), R is the gas constant (8.3134 KJmol-
1 K-1), A is the pre-exponential factor (min-1), E is theactivation energy (KJmol-1), and n is order of reaction.The deficiencies of such a model-based approach arewell known. In addition to the difficulty ofdetermining a unique reaction model, the degradationof polymers tends to demonstrate complex kineticsthat cannot be described by the single equationthroughout the whole temperature region. Theoreticalconversion could be by integrated of above formula.Such as;
where ; t = time (min)
Using integrated vision of Arrhenius equationand it was arranged (y= mx +c) (Ahmad , 2001).
y = m x + cAccording to above equation gradient, m = slop ofgraph =
y = m x + cAccording to above equation gradient, m = slop ofgraph =
Results and Discussion
Figure 1 shows behavior of weight reduction ofpolypropylene plastic material with time at differenttemperate. Rate of weight loss was initially high andwith time it also reduced. Order of reaction n valueswere obtained by through graph and fit the linerequation (y= mx +c). Interpreted both graph sets areshown in below Figure 1. Correlation (r) of graphs isnearly 0.96. Weight loss of polypropylene at eachtemperature is shown in Table 1.
g
� � � ���
�
��
g�
� � � ���
�
��
� � � ���
�
�� � � � ���
�
�� � � ��
��
��� �� � ������
��
�� ��������� � ����
�
��� ����� � � � ��
��
��� � � ��� ������� t = time (min)
�����
�
���� �
���� �
���� �
����
�
��� ���� � �
�����
� ��
��
��� � � ��� ����
���� �
���� �
���� �
����
� �
t )nim(emit= �
���� �
���� �
���� �
���� �
���� �
���� �
���� �
���� �
���� �
���� �
���� �
���� �
���� �
���� �
���� �
���� �
���� �
���� �
���� �
���� �
���� �
���� �
���� �
����
�
� � � ����� � � � ��
��
��� � �
�
�
�
�
�
�
�
�
�
�
�
� � � ���� �
� � � � ��
��
��� � �
�
�
�
�
�
�
�
�
�
�
�
�
�
�
�
�
�
�
�
�
�
�
�
�
� � � ����� � � � ��
��
��� � �
�
�
�
�
�
�
�
�
�
�
�
�
�
�
�
�
� � � ���� �
� � � � ��
��
��� � �
�
�
�
�
�
�
�
�
�
�
�
�
�
�
�
�
�
�
y = 0.395 x + 1r2 = 0.945, n=2.4
Time (hours)
54.5
43.5
32.5
21.5
10.5
00 5
y = 0.245 x + 1r2 = 0.966, n=2.4
y = 0.137 x + 1r2 = 0.975, n=2.3
y = 0.058 x + 1r2 = 0.971, n=2
1000C
800C
1/ (1
-a)n-
1
Figure 1:Weight loss of polypropylene vs Time

L.P.S. Rohitha, S.S.N. Perera and M.A.B. PrashanthaBehaviour of order of reaction and toughness ofpolypropylene at artificial thermal condition
[ 4 5 ]
Time (hours)
120
100
80
60
40
20
00 10 20 30
1000C
1200C
Toug
hnes
s (a
s pr
ecen
tage
)
Figure 2:Behavior of toughness vs Time
Since existing mathematical model was suitableto predict order of reaction for polypropylene withrespect to some specific values of n. Order of reactionn was 2, 2.3, 2.4, 2.5 with respect to80˚C,100˚C,120˚C,140˚C temperature. Since order ofreaction can be predicted by using Arrhenius modeland other two parameters can be calculated by usingdifferentiation. Order of reaction of Isothermaldegradation of polypropylene plastic can be predictedby utilizing weight loss vs time curve. This methodcannot be used to predict level of degradation fornatural accumulated polypropylene since initial weighof plastic sample and manufacture date are alsounknown.
Figure 2 is shown behavior of toughness ofpolypropylene vs time at different temperature. (80˚C100˚C, 120˚C, 140˚C ).
Table 2 is indicated toughness values have at100˚C, 120˚C, 140˚C after 20 hours. Toughness valueswere rapidly reduced above manner and it shows someaspects of isothermal degradation.
Conclusions
Polypropylene 0.3-0.4% average weight loss wasapparent from 80˚C to 140˚C temperature for after 12hours. The toughness variations were very significantfrom 80˚C to 140˚C temperature and it showsisothermal degradation has started. Using Arrheniusformula order of reaction (n) can be predicted, andlevel of isothermal degradation can also be predicted,if initial weight was known.
References
Madras G., Kumar S., Chattopadhyay S.: Continuousdistribution kinetics for ultrasonic degradation ofpolymers, Polymer Degradation and Stability 69(2000) 73
Bamtord,C.H, Degradation of Polymer, 2000.
Temperature (˚C)
80˚C
100˚C
120˚C
140˚C
Percentage weight loss
0.30
0.33
0.38
0.40
Table 1:Weight loss at different temperature
for after 12 hours.
Temperature (˚C)
80˚C
100˚C
120˚C
140˚C
Percentage toughnessvalue reduction from
initial value
95
60
40
35
Table 02:Toughness at different temperature for
after 20 hours.
Proceedings of the Third International Symposium,SEUSL: 6-7 July 2013, Oluvil, Sri Lanka
[ 4 6 ]
Won, I.K, Sung, D.K, Seung, B.L, and In Kwon, H,2000,J.ind.Eng.Chem.,Vol.6, No.5,P-348-355.
Roy,P.K, Surekha,P, Rajagopal,C and Choudhary, V,2007, P-208-215
Huimin W, Xiaoming T and Edward N, Polym Int, Vol53:20–26 (2004).
Flynn, J. H. Mark, N. M. Bikales, C. V. Overberger, J.I. Kroschwitz, in: ‘‘Encyclopedia of PolymerScience and Engineering’’, John Wiley & Sons,New York, 1989,Suppl. Vol., p. 690.
Roy, P. K, Surekhai, C. Rajagopal, V. Choudhary,Thermal degradation studies of LDPEcontaining cobaltstearate as pro-oxidan,eXPRESS Polymer Letters Vol.1, No.4,(2007)208–216.
Ahmad N, Iranian Polymer Journal,Volume 10,Number 6 (2001), 371-376.

[ 4 7 ]
Abstract: Pottuvil DS division is located in DryZone of Sri Lanka. Based on the soil types, slopes, soildepth and erodability of soils in this D.S. Division iscategorized in to clusters Sengaman, whole Komari 1and Northern Komari 2 and Hijra Nigar and smallportion of Southern Komari 2. In general soil organicmatter content in top soil was less than 1% in majorityof chena fields in Pottuvil. Chena cultivated area hasbeen restricted in research area due to the securityproblem. However, none of the Chena lands have usedsoil conservation measures to reduce erosion ororganic manure for enrichment soil organic carboncontent and soil fertility. No incorporation of organicmatter (residues) to soil is practiced; instead burn thembefore land preparation. Majority of farmers do notknow about soil conservation and their positiveimpacts. Even the few farmers who possess someknowledge about soil conservation or have heard ofthis, they are not practicing soil conservation ororganic matter addition to their Chena fields. Soilconservation measures are required especially forcertain areas (Sengaman and Komari-1 Cluster) andimmediate attention should be given toimplementation of such measures. In most cases, costeffective best conservation measures are to establishearth bunds and live hedges.
Keywords: Chena cultivation, Soil Erosion, land use.
Introduction
Soil erosion is an extensive problem in uplandcultivation areas in Pottuvil DS Division, wheretraditionally large extents of land cleaned by filling andburning prior to the onset of the north east monsoon
for chena cultivation. The cleared areas aresubsequently planted with fast growing crops (e.g.ground nut, cow pea, chilly, green gram, corn). Lack ofany kind of soil and water conservation techniquesresults in the heavy monsoon rains washing away athin layer of top soil every year. In the research area,this situation is exacerbated as the predominant soiltypes are Reddish Brown Earths and Non CalcicBrown; soils which because of their poor physicalcharacteristics, are inherently vulnerable to soilerosion. The annual loss of soil from agricultural landsresults in serial losses of soil fertility. Further, theenvironmental damages caused by the eroded soil,which increases sediment loads discharged into rivers,lagoons and coastal water bodies, negatively affectaquatic resource as well. Farmers in these regions arenot adopting any conservation or soil improvementmeasures mainly because they are unaware about theseproblems and given any training to upgrade theirknowledge on the same
Objectives: l To identify the soil erosion in Chena cultivation
Areasl To identify the causes of soil erosionl To identify the impacts of soil erosion areas l to make recommendation for the soil erosion
in Chena cultivation Areas
Methodology
Basic information about the DS Division ofPottuvil from Ampara Divisional Secretariat, Fieldsurvey at the Pottuvil DS Division were collected fromfarm families currently practicing Chena. They were
Kuraisiya Kalanthar(1)
A Case Study of Soil Erosion Impacts inChena Cultivation Areas in Pottuvil
DS Division(1) Department of Geography, South Eastern University of Sri Lanka, Oluvil, Sri Lanka.
(email: [email protected])

Proceedings of the Third International Symposium,SEUSL: 6-7 July 2013, Oluvil, Sri Lanka
[ 4 8 ]
selected for the detail investigation. Chena lands of thelisted farm families were visited and information wascollected. These farmers were interviewed and theirsocial and cultivation related information wasrecorded. On site Chena farm evaluation was carriedout and physical characteristics of the lands such asslope, erosion status, soil types and their aggregatestabilities and other physical characteristics wereevaluated. In selected Chena farms soil profiles Detailcollected from collected soil sample. Data collectedwere analyzed using appropriate statistical tools.Relevant recent digital maps showing geographicaland administrative boundaries, agriculture and land-use patterns, soil types, and Chena cultivated areashave been used to create map using Arc GIS software.
Results and Discussion
Causes of erosion in Chena cultivation area
1. Soils type:
The dominant soils in the area are ReddishBrown Earths (RBE) and Low Humic Gley onundulating terrain, Non-Calcic Brown (NCB) soils onold alluvium & Solonets on undulating terrain, Alluvialsoils of variable drainage and texture on flat terrain andRegosols on recent beach and sand dunes. Most of theChena lands in the area are located in well drainedupper and mild slopes of the undulating terrain withReddish Brown Earths. The best expression of coarsetextured NCB soils occur towards inlands of the studyarea. Success of rainfed upland cultivation on NCB isless compared to that on RBE, due to its low nutrientavailability and moisture holding capacity, thus thereare no significant extents under Chena, i.e. rain fed upland cultivation, in these soils. The DS divisions underconsideration consist of alluvial soils and those aremainly restricted to flat flood plains as well as to valleydepressions.Sandy Regosols’s texture of the soilmaterial ranges from fine sand to moderately coarsesand. Generally, these soils show no structuredevelopment and both the surface soil and subsoil aresingle grain, structure less and with a looseconsistence. The infiltration rates are high and themoisture holding capacity is less. However, theinfiltrated water is in the underlying static lens of fresh
water, which permits growth of deep rooted trees orirrigated agriculture with the use of ground waterresources.
Figure 1: Soil types
2. Land-uses:
Predominant land-use in Pottuvil DS divisions isnatural forest and scrub jungles. Agricultural landsprimarily used for paddy cultivation, humansettlements, scrubs, water bodies and lands utilized forchena or rainfed upland cultivation are the otherdominant land uses occurring in the area. Coconutplantations are commonly found land-use type inPottuvil DS Division. Different land uses and theirextents in DS division are given in Table - 01.
Figure 2: Land use of Pottuvil area
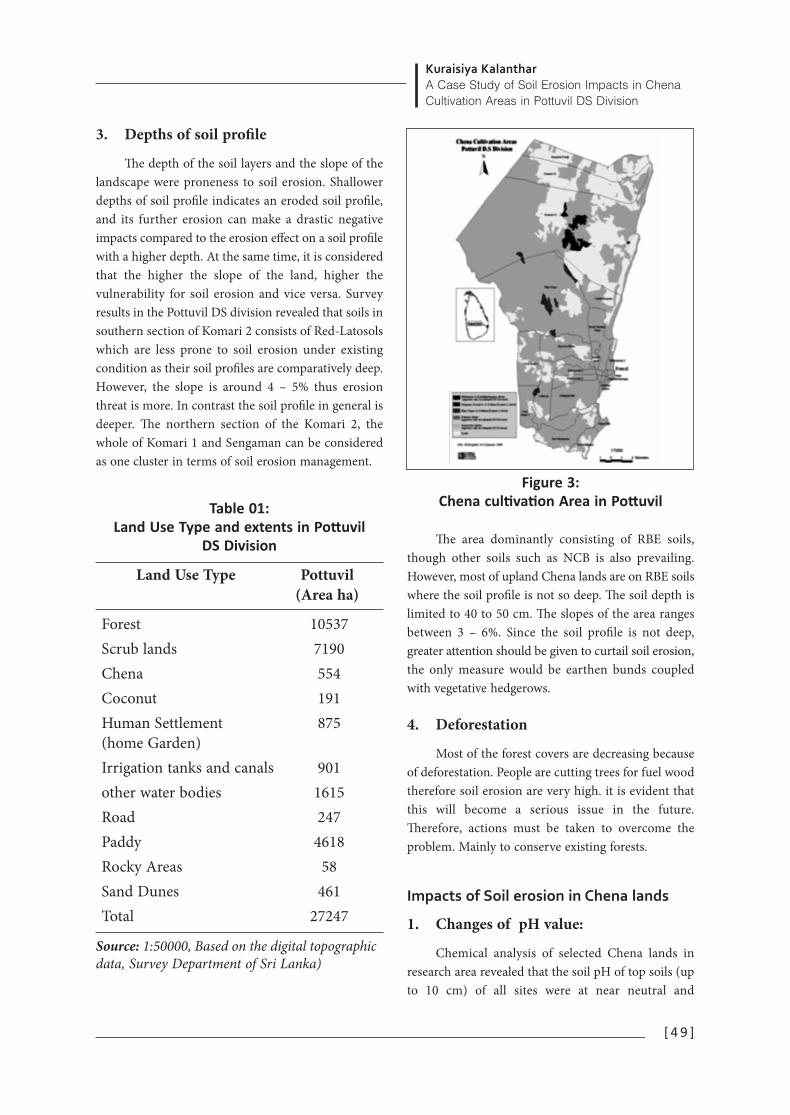
Kuraisiya KalantharA Case Study of Soil Erosion Impacts in ChenaCultivation Areas in Pottuvil DS Division
[ 4 9 ]
3. Depths of soil profile
The depth of the soil layers and the slope of thelandscape were proneness to soil erosion. Shallowerdepths of soil profile indicates an eroded soil profile,and its further erosion can make a drastic negativeimpacts compared to the erosion effect on a soil profilewith a higher depth. At the same time, it is consideredthat the higher the slope of the land, higher thevulnerability for soil erosion and vice versa. Surveyresults in the Pottuvil DS division revealed that soils insouthern section of Komari 2 consists of Red-Latosolswhich are less prone to soil erosion under existingcondition as their soil profiles are comparatively deep.However, the slope is around 4 – 5% thus erosionthreat is more. In contrast the soil profile in general isdeeper. The northern section of the Komari 2, thewhole of Komari 1 and Sengaman can be consideredas one cluster in terms of soil erosion management.
Figure 3:Chena cultivation Area in Pottuvil
The area dominantly consisting of RBE soils,though other soils such as NCB is also prevailing.However, most of upland Chena lands are on RBE soilswhere the soil profile is not so deep. The soil depth islimited to 40 to 50 cm. The slopes of the area rangesbetween 3 – 6%. Since the soil profile is not deep,greater attention should be given to curtail soil erosion,the only measure would be earthen bunds coupledwith vegetative hedgerows.
4. Deforestation
Most of the forest covers are decreasing becauseof deforestation. People are cutting trees for fuel woodtherefore soil erosion are very high. it is evident thatthis will become a serious issue in the future.Therefore, actions must be taken to overcome theproblem. Mainly to conserve existing forests.
Impacts of Soil erosion in Chena lands
1. Changes of pH value:
Chemical analysis of selected Chena lands inresearch area revealed that the soil pH of top soils (upto 10 cm) of all sites were at near neutral and
ForestScrub landsChenaCoconutHuman Settlement(home Garden)Irrigation tanks and canalsother water bodiesRoadPaddyRocky AreasSand DunesTotal
105377190554191875
9011615247
461858
46127247
Land Use Type Pottuvil(Area ha)
Table 01:Land Use Type and extents in Pottuvil
DS Division
Source: 1:50000, Based on the digital topographicdata, Survey Department of Sri Lanka)
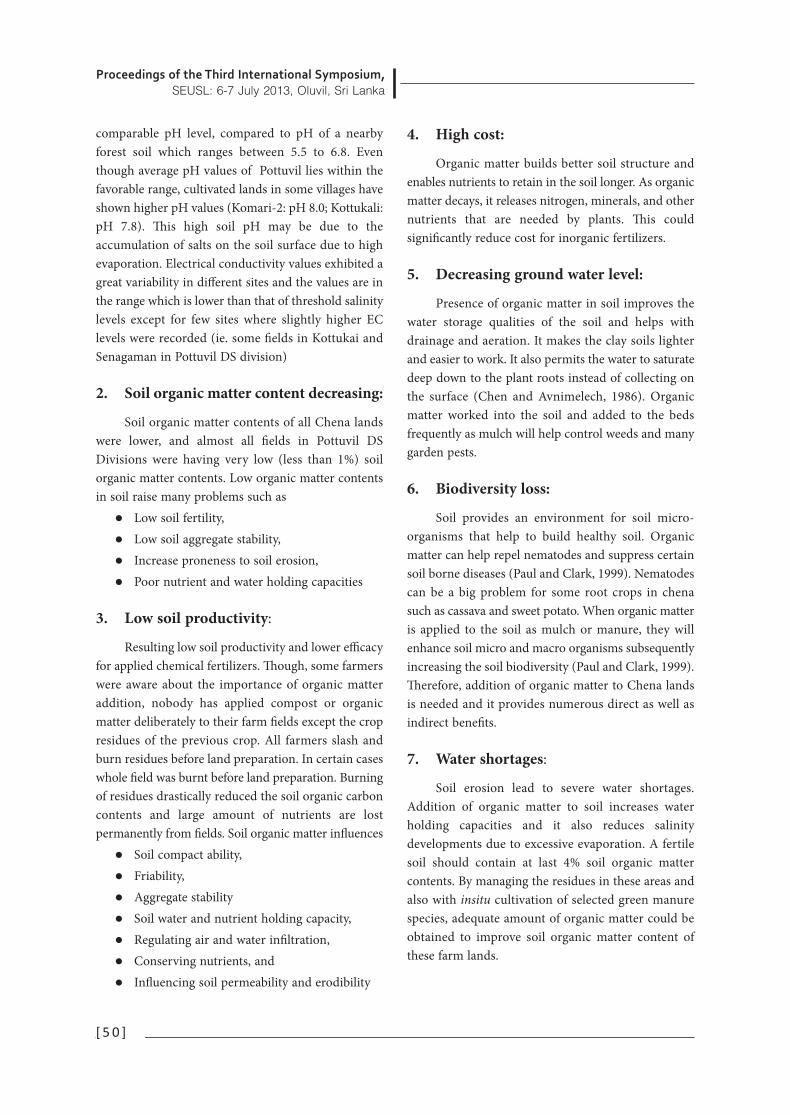
Proceedings of the Third International Symposium,SEUSL: 6-7 July 2013, Oluvil, Sri Lanka
[ 5 0 ]
comparable pH level, compared to pH of a nearbyforest soil which ranges between 5.5 to 6.8. Eventhough average pH values of Pottuvil lies within thefavorable range, cultivated lands in some villages haveshown higher pH values (Komari-2: pH 8.0; Kottukali:pH 7.8). This high soil pH may be due to theaccumulation of salts on the soil surface due to highevaporation. Electrical conductivity values exhibited agreat variability in different sites and the values are inthe range which is lower than that of threshold salinitylevels except for few sites where slightly higher EClevels were recorded (ie. some fields in Kottukai andSenagaman in Pottuvil DS division)
2. Soil organic matter content decreasing:
Soil organic matter contents of all Chena landswere lower, and almost all fields in Pottuvil DSDivisions were having very low (less than 1%) soilorganic matter contents. Low organic matter contentsin soil raise many problems such as
l Low soil fertility, l Low soil aggregate stability,l Increase proneness to soil erosion, l Poor nutrient and water holding capacities
3. Low soil productivity:
Resulting low soil productivity and lower efficacyfor applied chemical fertilizers. Though, some farmerswere aware about the importance of organic matteraddition, nobody has applied compost or organicmatter deliberately to their farm fields except the cropresidues of the previous crop. All farmers slash andburn residues before land preparation. In certain caseswhole field was burnt before land preparation. Burningof residues drastically reduced the soil organic carboncontents and large amount of nutrients are lostpermanently from fields. Soil organic matter influences
l Soil compact ability, l Friability, l Aggregate stability l Soil water and nutrient holding capacity, l Regulating air and water infiltration, l Conserving nutrients, andl Influencing soil permeability and erodibility
4. High cost:
Organic matter builds better soil structure andenables nutrients to retain in the soil longer. As organicmatter decays, it releases nitrogen, minerals, and othernutrients that are needed by plants. This couldsignificantly reduce cost for inorganic fertilizers.
5. Decreasing ground water level:
Presence of organic matter in soil improves thewater storage qualities of the soil and helps withdrainage and aeration. It makes the clay soils lighterand easier to work. It also permits the water to saturatedeep down to the plant roots instead of collecting onthe surface (Chen and Avnimelech, 1986). Organicmatter worked into the soil and added to the bedsfrequently as mulch will help control weeds and manygarden pests.
6. Biodiversity loss:
Soil provides an environment for soil micro-organisms that help to build healthy soil. Organicmatter can help repel nematodes and suppress certainsoil borne diseases (Paul and Clark, 1999). Nematodescan be a big problem for some root crops in chenasuch as cassava and sweet potato. When organic matteris applied to the soil as mulch or manure, they willenhance soil micro and macro organisms subsequentlyincreasing the soil biodiversity (Paul and Clark, 1999).Therefore, addition of organic matter to Chena landsis needed and it provides numerous direct as well asindirect benefits.
7. Water shortages:
Soil erosion lead to severe water shortages.Addition of organic matter to soil increases waterholding capacities and it also reduces salinitydevelopments due to excessive evaporation. A fertilesoil should contain at last 4% soil organic mattercontents. By managing the residues in these areas andalso with insitu cultivation of selected green manurespecies, adequate amount of organic matter could beobtained to improve soil organic matter content ofthese farm lands.

Kuraisiya KalantharA Case Study of Soil Erosion Impacts in ChenaCultivation Areas in Pottuvil DS Division
Soil properties of pH, EC and % organic mattercontents of top soil samples of different Chena landsof selected villages in Pottuvil DS Divisions
Conclusion
Based on the field observations and also theinformation received from Grama Niladari,Agriculture officers and other key informants in theregion and CBO Officers, it was revealed that Chenacultivation in Pottuvil DS division had been very muchrestricted due to terrorist’s threats. In fact number offarmers practicing Chena during this period was veryless in Pottuvil. In some villages, farmers have startedChena cultivation during the Maha season, 2008 after28-30 years. Pottuvil regions Chena cultivation waslimited mainly to roadsides of Panama to Thirukkovil.Though there are several GN divisions in the PottuvilDS division, the Chena cultivation is being practicedonly in few villages. Paddy cultivation is prominent inmany areas. Chena cultivation at present is very muchrestricted due to security problems. Farmers do not usethe forested areas for cultivation, where many of thevillages had their traditional Chena lands.
Recommendations
l Immediate erosion control measures should beintroduced especially to Sengaman, Komaricluster in the Pottuvil DS Divisions.
l Awareness on soil conservation and sustainableland management, low cost conservationmeasures (ie Alley cropping and SALT) areneeded since most of the farmers are unawareof the adverse impacts of soil erosion andremedial measures. So Conduct awarenessprograms to educate farmers on the use oforganic manure
l Government involvement is needed inproviding credit facilities to implementconservation measures.
l Monitoring of successful implementation andsustainable management of proposedconservation measures by the local authoritiesare essential.
l Introduced regulation to prevent burning ofresidues and promote making their owncompost.
l Promote insitu cultivation of green manure(introducing leguminous species such asgliricidia for hedgerows in alley cropping/SALTsystems and for fences, and also growing sunn-hemp during fallowing period.
l Vegetative hedgerows coupled with earth bundswould give both cost effective and technicallysuitable solution for soil erosion control undersuch situations. As the land slope is notexceeding 5%, inter-bund spacing can be up to30 meters but in the middle establishment of avegetative hedgerow would be beneficial.
l Possible expansion of Chena lands based onsuitability. Identification of lands should bebased on the land suitability analysis. Farmersare eager to expand their cultivating area if thesecurity situation becomes favorable. Since thesecurity situation has improved, definitelycultivating extent may definitely be increasedand they may even encroach in to governmentlands (scrub jungles).
[ 5 1 ]
DS Divisions
Soil pH
EC (�S/cm)
% Organic matter
Kottukal 7.80 33.42 0.338 Komari 2-1 5.98 4.27 0.541 Komari 2-2 5.55 58.92 0.263 Komari 2-3 6.66 10.01 0.608 Komari 2-4 6.16 4.72 0.811 Komari 2-5 8.00 9.58 0.811 Urani - 1 5.56 55.62 0.729 Urani - 2 4.88 28.71 0.464 Kijra Nagar -1
6.60 7.24 0.938
Kijra Nagar -1
6.63 6.95 0.967
Komari 1-1 6.01 11.32 0.947 Komari 1-2 6.34 2.67 0.772 Komari 1-3 7.34 22.00 0.676 Sengaman -1
4.86 132.21 0.398
Sengaman -2
7.15 14.17 0.978
Sengaman -3
6.42 32.22 0.663
Source: NECCDEP report, 2010

Proceedings of the Third International Symposium,SEUSL: 6-7 July 2013, Oluvil, Sri Lanka
[ 5 2 ]
l The land user or the farmer may have thefeeling of the ownership and they could beconvinced to pay more attention to protectthose. the land ownership has an impact on theimplementation of soil conservation measures.Most of the farmers are unwilling to invest onany soil conservation measures or evencultivation of perennial based green manurespecies because of the temporary and illegalnature of the farming.
l One major problem with granting ownershipfor the cultivating land has been the landfragmentation with time. This could beaddressed by introducing strict regulations andalso through maintaining farming populationat a near constant by introducing alternativeincome generating activities such as agro-basedand other industries which may wean out thepressure on farmlands.
l Soil conservation is not totally a responsibilityof the farmer. It should be done, not only toprotect the land itself, but to avoid offsiteadverse impacts. Thus, cost of conservationshould not be totally borne by the farmerhimself but should be assisted or subsidizeddepending on the farming community.Majority of the farmers in Pottuvil DS Divisionis very poor and they can’t afford for any kindof conservation measures, unless someassistance is provided.
l Training of trainers in the field of land andcrop management is a must. In the process, soilconservation and its necessities, appropriate soilconservation techniques probably site specific,should be properly addressed. Other thantraining, awareness creation and attitudeimprovement programs particularly amongfarming community should be launched.
References
Topo Maps of Sri Lanka scale 1:50,000, Department ofSurveys,1987.
De Alwis K.A. and Panbokke C.R. Handbook of Soilsof Sri Lanka 1972, Journal of Soil Science, SriLanka 2:1-9.
Panabokke, C.R., 1996. Soils and agro-ecologicalenvironments of Sri Lanka. Natural ResourcesSeries -No.2. Natural Resources, Energy andScience Authority of Sri Lanka. No. 47/5,Maitland Place,Colombo - 7, Sri Lanka.
Punyawardena, B.V.R., Bandara, T.M.J., andMunasinghe, M.K.R., Banda, N.J., andPushpakumara, S.M.V. 2003. Agro-ecologicalregions of Sri Lanka. Sri Lanka Atlus, 2007.
Paul, E.A., and Clark, F.E. 1996. Soil microbiology andbiochemistry. Academic Press. Inc.
Tate, R.L. 1987. Soil organic matter, biological andecological effectors. Wiley, New York.
Steppler, H.A., and Nair, P.K.R. 1987. Agrofrestry: adecade of development. International Council forResearch in Agroforestry, Nairobi, Kenya.
Wilson, W.S. 1991. Advances in soil organic matterresearch. The impact on agriculture andenvironment. R. Sco. Chem. Cambridge.

[ 5 3 ]
Abstract: There is a deficiency of row materials forhousing in Sri Lanka because of population growth. Sothere is an unfulfilled demand for traditional rowmaterials such as river sand and clay. Seriousenvironmental problems are caused because of overexcavation of above row materials. To minimize theenvironmental problems, it should be focused towardslow cost and environmental friendly alternative rowmaterials which are occurring in sufficient amount inSri Lanka. In order to fulfill the demand of rowmaterial for housing and other constructions, lateritesoil can be used with quarry dust and cement asadditives. Particle size distribution of the laterite waspoorly graded and addition of quarry dust correctedthis deficiency. The bricks which are made from lateriteand quarry dust mixture can be stabilized using lowamount of cement while achieving requiredcompressive strength for walling. This material mixtureis more economical and environmental friendly forbricks production.
Keywords: Laterite soil; Quarry dust; Bricksproduction
Introduction
Masonry construction is essential for housingindustry because it provides the main structure of thehouse, weather protection and fire protection, act asthermal and sound insulations and divides the spaceof the house in to sub divisions (Isaac OlufemiAgbede,2008, Eze Uzomaka et al., 2010). Traditionalrow materials such as mud and timber were mainly
used in the past for masonry construction which hasvery low strength and durability. In present both claybricks and sand-crete blocks are mainly used astraditional walling materials (Jayawardena et.al., 2006).
There is a deficiency of row materials for housingin Sri Lanka because of population growth. So there isan unfulfilled demand for traditional row materialssuch as river sand and clay. Therefore the prices ofthose row materials are increasing day by day. Alsoserious environmental problems are caused because ofover excavation of above row materials. To prevent thissituation we should focus towards low cost andenvironmental friendly alternative row materials whichare occurring in sufficient amount in Sri Lanka.Sustainable concept and green concept are also veryimportant and well accepted concepts which mainlybased on environmental friendly constructionmaterials and methods.
Laterites are soil types rich in iron and aluminum(Lecomte-nana et al., 2009). They are developed byintensive and long-lasting weathering of the underlyingparent rock. In Sri Lanka laterites are mainly locatedin south-western part of Sri Lanka specially inColombo and Gampaha districts (Dahanayake, 1980,Dissanayake et al., 1980, Herath et al., 1983). The mainchemical compounds found in Sri Lankan laterites aresilicon dioxides, aluminum oxide and hematite.
Compressed Stabilized Earth Bricks (CSEB) andblocks are newly introduced material for walling undersustainable construction concept (Jayasinghe 1976).
A.N.R. Wickramasinghe(1) and N.W.B. Balasooriya(2)
Manufacturing of Laterite Bricks as anEnvironmental Friendly Alternative
Row Material(1) Uva Wellassa University, Passara Road, Badulla, Sri Lanka
(2) Faculty of Applied Science, South Eastern University, Sammanthurai (E.P.), Sri Lanka.(email: [email protected])

Proceedings of the Third International Symposium,SEUSL: 6-7 July 2013, Oluvil, Sri Lanka
[ 5 4 ]
CSEB are manufactured using mainly laterite soil andcement. Because of the lack of the required particle sizedistribution the strength of the earth bricks can bereduced. Differential shrinkage can be happened whendrying because of high amount of finer particles(Walker, 1995, James Isiwu). Then the shape of thebrick can be changed and cracks can be raised andstrength of the brick is reduced.
Quarry dust is a waste obtained during quarryingprocess which consists of crushed and powdered rockparticles (Sivakumar et al. 2011) . The addition ofquarry dust for fine to course aggregate, enhance thecompressive properties as well as elastic modulus.Under this research it is experimented that enhancedproperties of laterite brick after adding various ratiosof quarry dust and cement.
Materials and Methods
Laterite samples which have suitable physicalcharacteristics to produce bricks were collected fromvarious locations in the Gampaha district (Fig.1).
All the samples were analyzed manuallyconsidering purity, particle size, the thickness of thelayer, how easy to extract and abundance volume of thelaterite. By considering all above parameters onesample was selected which has high purity andconsiderable particle size distribution. Three graniticgneiss crushing plants were inspected aroundVayangoda area and one was selected to get quarrydust for experiment which has low impurities, lowparticle size distribution and low amount of ferromagnesium minerals s such as biotite and hornblende.Portland limestone cement was purchased from theopen market.
Laterite and quarry dust were air dried for 24hours and passed through 10 mm sieve. Particlespassing through the sieve were used for brickproduction. Predetermined quantities of air driedlateritic soil and quarry dust were mixed with constantamount of Portland cement (5% by weight). Thereafteran amount of water necessary to give the requiredmoisture content was added to the dry mixtures.
Figure 1: Map of sample collected area

A.N.R. Wickramasinghe and N.W.B. BalasooriyaManufacturing of Laterite Bricks as anEnvironmental Friendly Alternative Row Material
Six bricks from each samples were made using10cm*10cm*10cm mould by providing homogeneousforce and conditions (Fig.2). Tamping was carried outwith a 20 mm diameter rod. The produced bricks werekept under controlled condition for 28 days andcompressive strength test was done for three bricks indry condition and three from wet condition from eachsample. Wet compressive strength is determined afterplacing brick in water for 24 hours.
Figure 2: Prepared brick
Based on the above 28 days results, laterite brickswere produced using laterite soil, quarry dust andcement mixtures with 0 and 45% quarry dust contentand 2, 4, 6, and 8 cement content. The dry and wetcompressive strength was measured as above steps.Sieve analyze was done for laterite soil, quarry dust andthe best material mixture to get the particle sizedistribution of above materials. Also the wet and drymasses and sizes of the every bricks were measured.
Results and Discussion
Preliminary test: The load at failure of brickssamples which produced using various ratios of lateritesoil and constant percentage of cement (5% by volume)were tested. The areas of all the bricks are constant(100mm*100mm) and the maximum compressivestrength of all the bricks can be calculated as bellowformula.
Average area of bed face = 10000mm2
Figure 3: The compressive strengthvariation of laterite brick with quarry dust
percentage
According to fig. 3 it can be seen that the wet anddry compressive strengths of the blocks are increasingwith the quarry dust percentage. The maximumstrength was obtained from the mixture which content45% of quarry dust.
According to the fig. 4 it can be observed that thelaterite soil is poorly graded. Quarry dust has a goodparticle size distribution. The size distribution of thesmall particles of the quarry dust is well graded.Quarry dust does not contain much larger particles.The distribution curve for laterite admixed with quarrydust is smooth, implying that the poorly graded lateritesoil was greatly improved by the addition of quarrydust.
Figure 4: Particle size distributions oflaterite, quarry dust and laterite treated
with quarry dust.
[ 5 5 ]
Proceedings of the Third International Symposium,SEUSL: 6-7 July 2013, Oluvil, Sri Lanka
[ 5 6 ]
Secondary test: The compressive strength resultsof bricks which produced from the mixture of 45%quarry dust and 55% laterite by changing the cementpercentage are shown below for dry and wetconditions. The average load at failure was calculatedby testing three bricks from each composition
Figure 5: The compressive strengthchanging with cement percentage for 45%
quarry dust and 55% laterite
According to figure 5and 6 both wet and drycompressive strengths of the blocks (45% of quarrydust and 100% of laterite) were increased with cementpercentage. But the strength of material mixture (45%of quarry dust) is higher than 100% quarry dust atboth wet and dry conditions. It was obtained that thedry strength of the mixture (45% quarry dust and 55%of laterite) is increasing at increasing rate with cementcontent. The wet strength of above mixture isincreasing at constant rate.
Figure 6: The compressive strengthchanging with cement percentage for
100% laterite
Figure 7: The compressive strengthchanging with cement percentage for
various material percentages (dry strength)
According to the fig. 7 it can be seen that whencement percentage is increased the strengths of allbrick types are increased. Bricks which are producedfrom 55% of laterite and 45% of quarry dust need lessamount of cement to obtain certain strength whenconsidering other bricks typed. Also the bricks whichare produced from 100% laterite soil need a largeamount of cement to obtain certain strength.
Cost analysis for material was done to produce10cm cube to identify the costs of various materialcombinations. Before doing the cost analysis all requiremarket prices and other information were wasgathered. The prices for cement, quarry dust andlaterite were gathered from various locations inGampaha district on 3rd week of October 2012 withtransport cost. But the values can be snidely changedwith time, place and quality of the material.

A.N.R. Wickramasinghe and N.W.B. BalasooriyaManufacturing of Laterite Bricks as anEnvironmental Friendly Alternative Row Material
According to above table 1 it can be seen thatprice for quarry dust is higher than laterite soil. Alsothe required amount of cement and price for cement ishigher in the brick which made from laterite. Thelowest price for cement is shown in the brick whichproduced from 45% quarry dust + 55% lateritematerial mixture.
When considering total costs for material, for thebrick which produced from 100% quarry dust hashighest price (Rs 4.32). But the bricks which areproduced from 100% laterite and 45% quarry dust +55% laterite mixture show considerably same and lowprice for materials (Rs 3).
Conclusion
Particle size distribution curve of the laterite wasused in this study was poorly graded and addition of45% quarry dust corrected this deficiency. The brickwhich is made from laterite and quarry dust mixturecan be stabilized using low amount of cement whichgives higher compressive strength than 100% lateritesoil. This brick is more suitable for wet conditions aswell as dry conditions. Because of this brick, 55% ofquarry dust can be saved while achieving highercompressive strength than 100% quarry dust. Thebricks which are made from 100% laterite have verylow compressive strength in wet conditions. Thematerial mixture (45% of quarry dust with laterite) ismore economical and environmental friendly for brickproduction for walling.
References
K. Dahanayaka; Laterite of Sri Lanka a Reconnaissancestudy; Mineral Deposit, 17,1980, pp.245-256.
C.B. Dissanayake, Mineralogy and chemicalcomposition of some laterites of Sri Lanka;Geoderma; 23(2), 1980, pp. 147-155.
Eze Uzomaka, Osondu Johnson, Agbo Daniel;Suitability of quarry dust as improvement tocement stabilized-laterite for road bases; EJGE15,2010, pp.1053-1066.
W. Herath, H.C.N.C. Pathirana, Genesis andConstitution of Sri Lanka Laterites;J.Natn.Sci.Coun.Sri Lanka 1983 11(2), pp.277-292.
Isaac Olufemi Agbede F. and Manasseh Joel, Use ofCement-Sand Admixture in Laterite BrickProduction for Low Cost Housing; LeonardoElectronic Journal of Practices and Technologies;Issue 12,
2008; pp. 163-174.
James Isiwu; Performance of laterite-cement blocks aswalling units in relation to Sand-Crete blocks;Department of Civil Engineering; FederalUniversity of Technology; Minna; Nigeria.
G.L. Lecomte-nana, E. Lesueur, J.P.Bonnet, G.Lecomte;Characterization of laterite geo material and itselaboration through a chemical route;
[ 5 7 ]
Table 2: Cost analysis for 10cm cube which has 20 N/mm2 compressive strength after 28 days

Proceedings of the Third International Symposium,SEUSL: 6-7 July 2013, Oluvil, Sri Lanka
[ 5 8 ]
Construction and Building Materials 23,2009,pp.1126–1132.
C. Jayasinghe and N. Kamaladasab; Compressivestrength characteristics of cement stabilizedrammed earth walls; Construction and BuildingMaterials; 21 (2007); 1971-1976.
S. Jayawardena and D.M.S. Dissanayake; Use ofquarry dust instead of river sand for futureconstructions in Sri Lanka; IAEG2006; Papernumber 38.
A. Sivakumar and Prakash; Characteristic studies onthe mechanical properties of quarry dust additionin conventional concrete; Journal of CivilEngineering and Construction Technology 2,2011,pp.218-235.
P.J. Walker; Strength, durability and shrinkagecharacteristics of cement stabilized soil blocks;cement and concrete composites 17,1995, pp.301-310.

[ 5 9 ]
Abstract: Red algae of the genus Laurencia Harvey(Ceramiales, Rhodomelaceae) is a complex genus,encompassing a large variety of morphologically-complex algal species. In continuation of our work onchemistry and biological activity studies of some SriLankan seaweeds, we examined the chemistry ofMeOH extract of Laurencia hetroclada collected fromTangalle coast. Above extract was subjected to columnchromatography followed by PTLC gave a newbrominated sesquiterpene 1 along with two knowncompounds, algoane 2, and caulerpin 3. The 13C NMRspectrum along with the DEPT experiments of 1revealed only 15 carbon signals corresponding to fourmethyls, five methylene, one methine and fivequaternary carbons. The 1H NMR (CD3OD, 500 MHz)spectrum of 1 showed signals due to three methyls,four methylenes, and two methine protons. Thesinglets resonated at 1.25 (3H, s), 1.27 (3H, s), and1.85 (3H, s) were assigned to Me-8’, Me-6’, and Me-9’,respectively. The characteristic downfield proton at4.83 (dd, J = 4.2,15 Hz) was assigned to H-4, geminalto the Br atom, whereas the proton that resonated at3.96 (d, J = 1.7 Hz) was assigned to the oxymethine H-1. Furthermore, the olefinic singlet resonated at 5.26was assigned to Ha-7’ and Hb-7. The down fieldcarbon atoms resonated at 110.2 and 165.2 wereassigned to olefinic carbon atoms. The positive CI MSof 1 showed the molecular ion peak [M+H]+ at m/z349 along with isotopic peak at m/z 351 (1:1),indicating the presence of a Br atom in the molecule.The above MS data were found to be consistent with
the molecular formula C15H25O4Br with 3 degreesof unsaturation. A comparison of the NMRspectroscopic data of 1 with those of 2 suggested asimilar skeleton with differences in substitution patternand unsaturation sites. From the above spectral data,the structure of 1 was confirmed as a new naturalproduct 4-bromo-5-methyl-2-(3’-hydroxy-1’,3’-dimethyl-2’ methylenecyclopentyl) cyclohexane-1,2,5-triol. Caulerpin (3) showed a significant dosesuppressive effect with an IC50 5.8 ± 1.0 μg/mL on T-cell proliferation assay.
Keyword: Seaweeds, Laurencia hetroclada, T-cellproliferation assay
Introduction:
Red algae of the genus Laurencia Harvey(Ceramiales, Rhodomelaceae) is a complex genus,encompassing a large variety of morphologically-complex algal species with worldwide distribution andambiguous taxonomy (Lyakhova EG, Kalinovsky A.I,Dmitrenok A.S, Kolesnikova S.A, Fedorov S.N,Vaskovsky V.E, 2006).
In continuation of our work on the chemistryand biological activity studies of Sri Lankanseaweeds[2], we investigated Laurencia hetrocladawhich was collected in Tangalle of the southern coastof Sri Lanka, and isolated a new brominatedsesquiterpenoids, 4-bromo-5-methyl-2-(3’-hydroxy-
M. H. Haroon(1, 2) and H. Ranjith W. Dharmaratne(1, 3)
New brominated sesquiterpenes from the redalga Laurencia hetroclada Harvey,
and their immunosuppressive activity studies (1) Natural Products Programme, Institute of Fundamental Studies, Kandy, Sri Lanka.
(2) Faculty of Applied Sciences, South Eastern University of Sri Lanka, Sammanthuri, Sri Lanka.(email: [email protected])
(3) Present Address: National Center for Natural Products Research, School of Pharmacy,University of Mississippi, University, MS 38677, USA

Proceedings of the Third International Symposium,SEUSL: 6-7 July 2013, Oluvil, Sri Lanka
[ 6 0 ]
1’,3’-dimethyl-2’methylenecyclopentyl) cyclohexane-1,2,5-triol (1), along with two known compounds,algoane (2), caulerpin (3).
Phagocytes like neutrophils and macrophagesscavenge microbes and other harmful agents enteringthe body. They start their action by the release ofreactive oxygen species (ROS) to destroy invaders in aprocess collectively known as oxidative burst. T-cellsalong with other white blood cells (WBC) subset playa major role on fight against infections (Nielsen M,Gerwien J, Geisler C, Ropke C, Svejgaard A, OdumN, 1998). These cells can cause disorders in theimmune system due to changes of stimuli.
In this juncture immunosuppressants arerequired in the case of a hyperactive immune system,probably caused due to inflammation or a transplantrejection. On the other hand immunostimulatingdrugs are needed when the immune system stopsfighting against infections. As a considerable numberof naturally occurring diterpenes has shownimmunosuppressant activity, diterpenes 1 and 2 alongwith bisindole alkaloid caulerpin (3) were tested fortheir immunosuppressant activity. The effect of theabove compounds on ROS production, by whole bloodphagocytes and in vitro activation and proliferation ofT-cells were investigated. Chemiluminescence (CL) ofthese tests revealed that there is no effect of all thetested compounds 1 and 2. However, in the case of T-cell proliferation, caulerpin (3) showed a significantsuppressive effect with IC50 5.8 ± 1.0 that iscomparable with the widely used immunosuppressivedrug prednisolone.
Methodology
Extraction and isolation procedure
The red alga, Laurencia hetroclada, was collectedat Tangalle. Processed alga was dried, finely powderedand extracted with methanol using an ultrasonicator.The MeOH extract was subjected to columnchromatography (CC) on flash Silica gel (230 -400mess size, E-Merck) using n-hexane, ethyl acetate,methanol and water as eluants. Further purification of
some column fractions using PTLC and gravitycolumn yielded three pure compounds, and theirstructures were proposed using NMR and MS data.
T-Cell proliferation assay:
The T-cell proliferation assay was performed onisolates as described by Nielson et al (1996). In short,lymphocytes were isolated by gradient centrifugationof blood in presence of lymphocyte sedimentationmedium. Cell suspension (50 μL) (106/mL) with orwithout compounds (3.1-50 μg/mL) was added to eachwell of a 96 well round bottom tissue culture plate. TheT-cell activator PHA (50 μL) was added in each well toa final concentration of 5 μg/mL. The plates wereincubated at 37 oC for 72 hours (95 % humidity, 5 %CO2). Methyl-3H thymidine 0.5 μCi was added in eachwell and the plate was incubated for further 18 hours.Cells were harvested on Type G-7 filter paper using cellharvester. The radioactivity was measured using a -scintillation counter. The concentration of compoundgiving 50% of inhibition was calculated, comparing theactivity of compound treated cells measure as the levelof radioactivity incorporated in the proliferating cells(CPM) with that of the non-treated cells (control cells).
Results and Discussion
Three compounds have been isolated and thestructures of three of them were established usingspectral data.
4β-bromo-5β-methyl-2-(3’α-hydroxy-1’β,3’β-dimethyl-2’-methylenecyclopentyl)cyclohexane-1β,2α,5 α -triol (1)
The 1H NMR (CD3OD, 500 MHz) spectrum of 1showed signals due to three methyls, four methylenes,and two methine protons. The singlets resonated at1.25 (3H, s), 1.27 (3H, s), and 1.85 (3H, s) wereassigned to Me-8’, Me-6’, and Me-9’, respectively. Thecharacteristic downfield proton at 4.83 (dd, J = 4.2,15Hz) was assigned to H-4, geminal to the Br atom,whereas the proton that resonated at 3.96 (d, J = 1.7Hz) was assigned to the oxymethine H-1.Furthermore, the olefinic singlet resonated at 5.26 wasassigned to Ha-7’ and Hb-7.’

M. H. Haroon and H. Ranjith W. DharmaratneNew brominated sesquiterpenes from the red alga Laurenciahetroclada Harvey, and their immunosuppressive activity studies
The bromine-bearing carbon resonated at 63.0.Four methylene carbons resonated at 34.7 (C-5’), 40.1(C-3), 40 (C-4’), and 47.9 (C-6). These assignments ofmethylene protons were supported by the COSYspectrum of 2. The COSY spectrum showedcorrelations between Ha - 3 and Hb - 3, between H -4 and Ha - 3, between H - 4 and Hb - 3, between Hb- 6 and Ha - 6, between Hb - 6 and H - 1, between Ha- 6 and H – 1, and between Hb - 3 and H – 1.Similarly, correlations were observed between Hb - 5’and Ha - 5’, between Hb - 5’ and Ha - 4’, and betweenHa - 5’ and Hb - 4’. HMBC correlation of C-8’ ( 1.25)with C-2 (78.9), C-1’ (53.2), C-5’ (34.7), and C-2’(165.5) clearly indicated the connectivity of the twostructural units in the molecule (Figure 2). The relativestereochemistry of 1was deduced by analysis of thecoupling constants and NOESY experiments. The largecoupling constants between H-4 and H-3a (15 Hz)suggested that H-4 have an axial orientation (-configuration). As no cross-peak could be detectedbetween Me (9’) and H-4, and H-1, in the NOESYexperiments, it is concluded that the Me group at theC-5 position should be in the -configuration. Further,the orientation of the exomethylene group in thecyclopentane ring was predicted from the strongNOESY correlations between H-1 and exocyclicolefinic protons (Ha/Hb-7’). The CH3 group at C-3’was due to have a -configuration whereas the CH3group at C-1’ has a -configuration, as there were nocross-peaks detected between those groups andselected atoms in the NOESY experiments. From theabove spectral data, structure of 1 was deduced as 4-bromo-5-methyl-2-(3’-hydroxy-1’,3’-dimethyl-2’methylenecyclopentyl) cyclohexane-1,2,5-triol.According to the literature, compound 1 is a newmember of the non aromatic cuparane class ofsecondary metabolites. The structures of knowncompounds were identified by comparison of theirspectroscopic data with the reported data (McPhail KL,Davies-Coleman MT, Copley RCB, EgglestonD.S,1999, Anjaneyulu A.S.R, Prakash C.V.S,Mallavadhani U.V, 1991;, Govenkar, M.B, Wahidulla,S, 2000, Ali MS, Ahmad VU, Mazhar F, Azhar,I,Usmanghani, K, 1999).
Figure 1: Structures of Compounds 1 ‐ 3.
Figure 2: Key HMBC Correlations of 1
T-Cell proliferation assay:
In order to study the immunomodulatorypotential of 1, 2 and 3 isolates, their effect on ROSproduction was analyzed on whole blood phagocytes.In our investigation, no effect on ROS production wasnoted with compound 1 and 2, whereas caulerpin (3)showed a weak activity with IC50 75.6 ± 3.1 μg/mL. Inaddition, they were tested for their effect on T-cellproliferation, and only compound 3 showed asignificant dose suppressive effect with an IC50 5.8 ±1.0 μg/mL that is comparable with the positive controlprednisolone which is a widely usedimmunosuppressive drug. Compounds 1 and 2showed no activity on T-cell proliferation and had theIC50 value greater than 50 μg/mL. However,Compound 2 showed a mild suppressive effect at lowerconcentrations (3.12 and 12.5 μg/mL) when comparedwith higher concentration 50 μg/mL . This reverseorder effect could be attributed to the poor solubility
[ 6 1 ]

Proceedings of the Third International Symposium,SEUSL: 6-7 July 2013, Oluvil, Sri Lanka
[ 6 2 ]
of 2. Above observation of the immunosuppressiveactivity of 3 is in good agreement with the recentreport on the anti-inflammatory activity of thisbisindole alkaloid 3.
Algoane (2):
The compound 2 was isolated as a whitecrystalline solid with a melting point of 190-192 °(C.Its specific rotation was found to be +70°(c = 0.5,MeOH) which indicated the presence of chirality in themolecule. The negative FAB MS of LH-1 showed itsmolecular ion peaks at m/z 488 corresponding to the[M-H]+ together with isotopic peaks at m/z 490, and492 confirmed the presence of halogen atoms in themolecule and the molecular formula was deduced tobe C17H27Br2ClO4 with three degree of unsaturation.The 1H NMR spectrum of 2 showed signals due to fivemethyl, three methylene and four methine protons.The 1H NMR spectrum exhibited five methyl signals at0.88 (3H, s), 1.0 (3H, s), 1.4 (3H, s), 1.74 (3H, s), and2.06 (3H, s). Literature review (McPhail etc.,1999)revealed this structure is a non aromatic, cuprane–typesesquiterpene algoane-1, which has been isolated fromSouth African specimen of the sea hare, Aplysiadactylomela.
Caulerpin (3):
The compound 3 was isolated as orange redprisms with a melting point of 313-317 °(C. The EI MSof 3 showed a strong molecular ion peak at m/z 398and the molecular formula was deduced to beC24H18N2O4. The 1H NMR signals between 7.07 and7.40 indicated the presence of ortho substituted phenylrings. The protons resonated at 7.28 (1H, d, J 6, 7 = 8Hz), 7.16 (1H, t, J 6, 7 =, J 6, 5 = 7.5 Hz), 7.07 (1H, t,J 5, 6 = J 5, 4 7.5 Hz), 7.40 (1H, d, J 4, 5 = 7.9 Hz) wereassigned to H-7/17, H-6/18, H-5/19 and H-4/20respectively. The methoxy groups resonated at 3.88were assigned to Me-1' and Me-2' while the NHprotons resonated at 9.17. The protons resonated at8.03 were assigned to H-9/H-13. Based on spectralstudies (1H, 13C NMR and MS) and comparison withthe literature values the compound was identified ascaulerpin which was previously reported from greenalga Caulerpa racemosa (Govenkar etc., 2000)
Acknowledgment
M.H. Haroon thanks the Third World Academyof Science for Developing World (TWAS), Trieste, Italy,for providing financial support to conduct a part of hisPh.D. research at the H. E.J. Research Institute ofChemistry, International Center for Chemical andBiological Sciences, University of Karachi, Pakistan.
References
Ali MS, Ahmad V.U, Mazhar F, Azhar,I, Usmanghani K.Some chemical constituents from marine algae ofKarachi coast (Arabian Sea). Turkish Journal ofChemistry 1999; 23(2): 181-183
Anjaneyulu ASR, Prakash CVS, Mallavadhani UV. TwoCaulerpin Analogs and a Sesquiterpene fromCaulerpa racemosa. Phytochemistry 1991; 30(9):3041-3042
Govenkar MB, Wahidulla S. Constituents of Chondrinarmata. Phytochemistry 2000: 54(8): 979-981
Haroon MH, Premaratne SR, Dharmaratne HRW .Chemistry and Biological activity Studies of Ulvalactuca Linnaeus and Amphiroa anceps. Chemtech,Colombo, Sri Lanka, 2007, July 20-23, Poster 30, pp79
Lyakhova EG, Kalinovsky AI, Dmitrenok AS, KolesnikovaSA, Fedorov SN, Vaskovsky VE. Structures andabsolute stereochemistry of nipponallene andneonipponallene, new brominated allenes from thered alga Laurencia nipponica. Tetrahedron Letters2006; 47(37): 6549-6552
McPhail KL, Davies-Coleman MT, Copley RCB, EgglestonDS. New halogenated sesquiterpenes from SouthAfrican specimens of the circumtropical sea hareAplysia dactylomela. Journal of Natural Products 1999;62(12): 1618-1623
Nielsen M, Gerwien J, Geisler C, Ropke C, Svejgaard A,Odum N. MHC Class II Ligation Induces CD58(LFA-3)-Mediated Adhesion in Human T Cells, Exp.Clin. Immunogenet 1998; 15: 61-68

[ 6 3 ]
Abstract: Polypyrrole (PPY) is a prime candidate fora polymer actuator; but has the disadvantage that theelectronic conductivity decreases by two or threeorders of magnitude as the polymer is reduced. Thisreduces the actuator performance. A Standard way ofovercoming this problem is to add Au or Pt layers asthin patterns or as helices on the polymer. The presentwork is an attempt to use a second more highlyconducting polymer, poly(3,4-ethylenedioxythiophene), (PEDOT), to enhance theelectronic conductivity.
Bilayer and multilayers with PEDOT and PPY,each containing dodecyl benzenesulfonate (DBS) asimmobile dopant species were synthesized and theirelectrochemical behaviour was investigated usingcyclic voltammetry, optical absorption spectroscopyand electrochemical quartz crystal microbalance(EQCM) techniques. Bilayer results show combinedcharacteristics of each individual polymer. In trilayerfilms, the reduction of inner and outer PPY layers takesplace at two different potentials. The oxidation occursat one potential only. The pentalayer film confirmedthis: three reduction peaks were observed. Theseparation between the two reduction peaks dependson the thickness of PEDOT layer, the scan rate and theconcentration of cycling electrolyte. This separationbecomes smaller with the number of cycling,indicating the enhancement of ion diffusion throughthe PEDOT layer. The optical spectra of the trilayersshow clearly distinguishable peaks belonging toPEDOT and PPY polymers, confirming theindependent behaviour of the PEDOT in the system.Two important conclusions of relevance for actuatorperformance were reached: it is possible to makebilayer and multilayer films that do not delaminate –
the two polymers are compatible; and both polymersare active in the redox process. Ionic diffusion in thetrilayer which is responsible for the actuation can becontrolled by choosing appropriate thicknesses for thethree layers.
Keywords: Polypyrrole, PEDOT, actuators, EQCM,cyclicvoltammetry
Introduction
In recent years, poly(3,4-ethylene -dioxythiophene) (PEDOT) has emerged as one of themost important materials in the field of conductingpolymers. PEDOT is highly insoluble in almost everysolvent, exhibits quite a high conductivity, changes incolour depending on the applied potential, ispractically transparent in the form of thin oxidizedfilm, is very stable in the doped state and exhibits a lowreduced band gap (ca. 1.6-1.7 eV) [1]. All theseproperties make this conducting polymer useful formany applications. On the other hand, polypyrrole(PPy) has been used as a prime candidate in the fieldof polymer actuators since it shows great volumechanges during the redox cycling. But PPy has thedisadvantage that the electronic conductivity decreasesby two or three orders of magnitude as the polymer isreduced. This causes a decrease in actuatorperformance; since only a small part of the polypyrrolefilm will then be actively contributing to the actuation[2]. A standard solution to this problem involves theaddition of an extra electron conductor on the surfaceof the polypyrrole film, e.g. Au or Pt as helices or as thin patterns [3,4]. The use of a corrugated goldlayer on PPy improved the performance of the actuator[5].
U.L. Zainudeen(1) and M.A. Careem(2)
A Cyclic Voltammetry Study on Bi Layer andMulti Layer Conducting Polymer Films
(1) Department of Physical Sciences, South Eastern University of Sri Lanka,Sammanthurai, Sri Lanka. ((email: [email protected])
(2) Centre of Ionics, University of Malaya, 50603 Kuala Lumbur, Malaysia.

Proceedings of the Third International Symposium,SEUSL: 6-7 July 2013, Oluvil, Sri Lanka
[ 6 4 ]
The present work is an attempt to solve theconductivity problem by using a second, more highlyconducting polymer, PEDOT to enhance the electronicconductivity. Generally, mechanical properties ofconducting polymers such as length and stiffness varyas ions from a cycling electrolyte moves in and out ofthe polymer during cycling. An exact knowledge ofthe nature and amount of ionic motion is thereforecrucial to understanding and controlling the actuationprocess of these combined actuator system. In thispaper, we report the preliminary characterization ofthe bilayer and multilayer systems having twoconducting polymers of PEDOT and PPy using cyclicvoltammetry, electrochemical quartz crystalmicrobalance (EQCM). Both polymers are dopedelectrochemically with dodecyl benzenesulfonate(DBS) anions to have homogeneous dopants in thefilm. Different thickness combinations in bilayer andtrilayer configurations were tested, and were comparedwith those of pure PEDOT and PPy films.
Experimental
Pyrrole (Aldrich 98%) monomer was distilledunder nitrogen and stored in a freezer in sealed vialsprior to use. EDOT monomer (Aldrich 98%) was usedwithout any further purification. Other chemicals,sodium dodecyl benzenesulfonate (NaDBS) (Aldrich)and NaCl (Merck) were used as received. BothPEDOT(DBS) and PPy(DBS) layers were formed bygalvanostatic electropolymerization with a currentdensity of 1 mA cm-2. Bilayer PEDOT/PPy films wereobtained by electropolymerization of PEDOT on thepre-prepared PPy films. Similarly tri-layerPPy/PEDOT/PPy films were obtained byelectropolymerization of PPy on the pre-preparedPPy/PEDOT films. After synthesis, each layer wasrinsed thoroughly in distilled water before thepreparation of the next layer. 0.05M SDBS aqueouselectrolyte containing 0.05 M pyrrole or 0.02 M EDOTwas used for the synthesis of PPy(DBS) andPEDOT(DBS) layers respectively. For the cyclicvoltammetric experiments films were prepared on Ptwire (10-mm length, 0.5 mm diameter). Nickel foil andAg/AgCl in 3 M KCl were used as counter andreference electrodes respectively. The cycling
electrolyte (NaCl) was purged with nitrogen gas toreduce the oxygen concentration.
An Electrochemical Quartz Crystal Microbalancesetup using 1 cm, 10 MHz crystals with 0.2 cm2 goldelectrodes controlled by a Hewlett-Packard E4916Acrystal analyzer in combination with a potentiostat(Autolab PGSTAT 30) was used to measure the changeof mass during polymerization and cycling.
Results and Discussion
Cyclic voltammograms (CVs) of PEDOT(DBS)and PPy(DBS) are different in shape and size as shownin figure 1 (note that the current scales are verydifferent). The CV of the pure PPy(DBS) film exhibitsstrong and well defined reduction and oxidation peaks.In the PPy film, the reduction takes place in a narrowpotential while the oxidation occurs over a range ofpotentials. On the other hand, the PEDOT(DBS) has acapacity-like current and the redox peaks are barelydistinguishable. Furthermore, the capacitance which isproportional to the area covered by the CV is muchsmaller in PEDOT compared to that in PPy. This is notsurprising since it is well known that a PPy film ismuch compact than a PEDOT film. It has beenreported that PEDOT forms a highly porous structurein aqueous solution and therefore electrochemicalredox reactions are fast in this material [6].
As shown in figure 2, when these two polymersare combined as a bilayer system, CVs are mostlysimilar to that of a single PPy film without muchchanges in the main features of the CV. This revealsthat PPy seems to play a dominant role in the bilayersystem, and this also indicates that PEDOT does notdiminish the PPy response. However, PEDOT doesinfluence the CV, especially at lower potentials (< 0.7V). This is more clearly observed with bilayers havinga thinner layer of PPy. This shows that both PEDOTand PPy take part in the redox process. EQCM resultsobtained for the PEDOT/PPy bilayer (outer layer isPPy) are shown in fig. 3.
In this experiment, the total thickness of thebilayer is less than 1 μm. For comparison, the resultsobtained for single PEDOT(DBS) and PPy(DBS) layers

U.L. Zainudeen and M.A. CareemA Cyclic Voltammetry Study on Bi Layer andMulti Layer Conducting Polymer Films
are plotted in the same figure. Results (Fig. 3) showthat the electrode mass change is small in the singlePEDOT(DBS) film compared to that results obtainedfor the PEDOT/PPy bilayer (outer layer is PPy) areshown in fig. 3. In this experiment, the total thicknessof the bilayer is less than 1 μm. For comparison, theresults obtained for single PEDOT(DBS) andPPy(DBS) layers are plotted in the same figure. Results(Fig. 3) show that the electrode mass change is smallin the single PEDOT(DBS) film compared to that ofthe PPy(DBS) during both the cathodic and anodicparts of the cycle and this may be due to the fact that
the PEDOT(DBS) may have less tendency toaccommodate both ions and solvent. However, thesum of the frequency changes of the pure films isalmost equal to the frequency change observed for thebilayer film during reductive/oxidative cycling. Thisindicates the active participa tion of the inner PEDOTlayer in the redox process of the bilayer film. This is ingood agreement with results reported by Y. Syritski etal. [7]. They claimed that the bilayer structure is redoxactive and that PEDOT influences redox processeseven after complete coverage with PPy suggesting theformation of a three dimensional electrode.
[ 6 5 ]
Fig. 1: Cyclic voltammograms of PPy(DBS) andPEDOT(DBS) films in 2 M NaCl electrolyte.
Scan rate 10 mV s‐1. Current scales are different.
Fig. 3 mass change plots of (i) a PEDOT(DBS) film,(ii) a PPy(DBS) film and (iv) a PEDOT/PPy bilayer
(outer layer is PPy) in 1 M NaCl aqueous solution.Scan rate 10 mV s‐1. Sum of the (i) and (ii) are
indicated by (iii).
Fig. 2: Cyclic voltammograms of PPy, bilayer andtrilayer films in 2 M NaCl electrolyte.
Scan rate 10 mV s‐1.

Proceedings of the Third International Symposium,SEUSL: 6-7 July 2013, Oluvil, Sri Lanka
[ 6 6 ]
In trilayer films, PPy/PEDOT/PPy, the reductionof PPy seems to take place at two different potentials(Fig. 2) with two well separated peaks. The middlePEDOT layer is responsible for this separation. Thiswas confirmed by keeping the PEDOT thickness sameand changing the thicknesses of outer and inner layersof PPy. During reduction of the trilayer film, at first theouter PPy layer, exposed to the electrolyte, is reducedwithin a narrow potential range centered at around -0.55 V and then the reduction of the inner PPy layeroccurs at around -0.95 V over a wider range ofpotentials. The pentalayer film reconfirmed thisphenomenon where three reduction peakscorresponding to the three PPy layers were observed.The separation of reduction peaks is due to thepartially blocking behaviour of the middle layer ofPEDOT. On the other hand, in the trilayer filmoxidation occurs at one potential (-0.38 V) only forboth PPy layers with a peak current twice of thatexpected for a single layer. The observed peak currentconfirms further the coincidence of the two oxidationpeaks at one potential. Furthermore, for a trilayer filmwith fixed inner and outer PPy layer thicknesses, theseparation between the two reduction peaks dependson the thickness of PEDOT layer; the separationincreasing as the thickness of PEDOT is increased asshown in Table 1. Evidently, the first reduction peakpotential which corresponds to the outer PPy layer isindependent of the PEDOT thicknesses and only thesecond peak position seems to shift to more negativepotential as the thickness of PEDOT increases givingrise to the peak separation. Thus the blocking effect ofthe PEDOT film becomes larger as the thickness of thefilm increases. From Table 1, it can be concluded thatthe trilayer system with a thin PEDOT at the middle ispreferable for use in actuators since there will be lessinterference from the PEDOT on the ionic motion.Moreover, interestingly the reduction peak of the innerPPy layer becomes a little broader with increasingthickness of PEDOT while that of the outer layerremains same. This shows slower kinetics taking placein the inner PPy layer due to the presence of PEDOTlayer. However, after a number of consecutive cycles ata particular scan rate, the separation between the tworeduction peaks becomes smaller and smaller andfinally vanishes. This indicates the enhancement of ion
diffusion through the PEDOT layer with the numberof cycles. Furthermore, it was found that the peakseparation also depends on the scan rates and on theconcentration of cycling electrolyte. The scan rate effectagain suggests a kinetic explanation, whereas theconcentration effect is more difficult to understand. Atslower scan rates and lower concentrations of theelectrolyte the separation becomes negligibly small,increasing with either increasing scan rates orincreasing concentration as shown in Tables 2 and 3.
The CV and EQCM result obtained for a trilayerfilm are shown in figure 4. Corresponding results for asingle PPy layer are also shown in the same figure forcomparison. The reduction peak separation in thetrilayer film is very small due to the thin nature of thePEDOT film used. Each frequency curve shows a steepdrop exactly centered at the potential of thecorresponding reduction peak maximum. Accordingly,there are two such steep drops seen clearly on thefrequency curve observed for the trilayer filmcorresponding to the two peak maxima. This againconfirms that reductions are taking place at twodifferent potentials in the trilayer films. The totalfrequency changes during the cathodic and anodicprocesses are little higher in the trilayer film than thoseof the single PPy layer indicating some contribution ofthe PEDOT to the mass change of the trilayer system.In other words, the PEDOT layer is also active in theredox process and does not weaken the PPy response.
Conclusions
We have succeeded in making bilayer andmultilayer films that do not delaminate with PEDOTand PPy conducting polymers by electrochemicaltechnique. In multilayer configuration, it is found thatthe PEDOT polymer does not affect the PPyperformance and thus these two polymers arecompatible for use in actuator applications. In redoxprocesses, both polymers of the multilayers are foundto be active, however the thicker layer plays thedominant role. Ionic diffusion in the trilayer which isresponsible for the actuation can be controlled bychoosing appropriate thicknesses for the three layers.

U.L. Zainudeen and M.A. CareemA Cyclic Voltammetry Study on Bi Layer andMulti Layer Conducting Polymer Films
References
Q. Pei, G. Zuccarello, M. Ahlskog and O. Inganas,Polymer 35, 1347 (1994).
L. Bay, K. West, N. Viachopoulos and S. Skaarup,Proceedings of SPIE, The International Society forOptical Engineering 54-58, 4329 (2001).
D. Zhou, G.M. Spinks, G.G. Wallace, C.Tiyapiboonchayia, D.R. MacFarlane, M. Forsythand J. Sun, Electrochim. Acta 48, 2355 (2003).
S. Hara, T. Zama, W. Takashima and K. Kaneto, Synth.Met. 146, 47 (2004).
L. Bay, K. West, P.S. Larson, S. Skaarup and M.Benslimane, Adv. Mater. 15, 310 (2003).
S. Ghosh, and O. Inganas, Adv. Mater 11, 1214 (1999).
V. Syritski, K. Idla and A. Opik, Synth. Met. 144, 235(2004).
[ 6 7 ]
PEDOTthickness.(μm)
Peakseparation
(V)
Half widthof the 1streductionpeak (V)
Half widthof the 2ndreductionpeak (V)
0.1
0.25
0.5
1.0
2.0
0.07
0.11
0.21
0.31
0.32
0.4
0.4
0.4
0.4
0.4
0.049
0.065
0.115
0.16
0.22
Table 1:Different thickness of middle layer PEDOT
Scan ratemV/s
peakseparation (V)
1
2
5
10
0.050
0.067
0.187
0.305
Table 2:Different scan rate
Concentration ofNaCl (M)
peak separation (V)
0.05
0.1
0.5
1.0
2.0
3.0
4.0
0.140
0.140
0.190
0.190
0.344
0.409
0.623
Table 3:Different concentration of cycling

[ 6 8 ]
Abstract: Polypyrrole polymer films doped withlarge surfactant anions, dodecyl benzene sulfonate,(PPy/DBS) can be used as soft actuators and theirperformance and stability depend on the type of thecycling electrolytes and their concentrations. In anattempt to discover suitable electrolytes for suchactuators, the diffusion of counter ion into PPy/DBSfilms in various aqueous electrolytes has beeninvestigated in this work. The PPy/DBS films werecycled at different scan rates in various alkali halideaqueous electrolytes having concentrations rangingfrom 0.1-1 M in order to determine the diffusioncoefficients of alkali halide ions. The effective diffusioncoefficients were found to increase with theconcentration of the electrolytes and decrease with theincrease in size of cations. Since the effective diffusioncoefficient of counter ions is a direct measure of thespeed of response when such films are used aselectrodes in artificial muscles or in batteries, thisfinding is especially useful for the design of fastactuators based on PPy/DBS polymers.
Introduction
Polypyrrole (PPy) films have been found to beuseful to fabricate soft actuators [1,2]. The mechanismof actuation in such actuators is theinsertion/expulsion of counter ions present in aqueouselectrolytes as the polymer is redox cycled between thereduced and oxidized states [3]. During the actuationprocess, a considerable change in volume of PPyactuator occurs as the insertion/expulsion of counterions is accompanied by water molecules present in the
cycling electrolyte. Even though the electrochemicalbehavior of PPy films depends on a variety ofconditions such as concentration of the cyclingelectrolyte, type and size of counter ions, type ofsolvent used, etc. [4], the concentration of the cyclingelectrolytes mainly determines the actuationbehaviour. This is because the amount of wateraccompanying the counter ions depends not only onthe solvating ability of the counter ions but alsodepends on the osmotic pressure of water inside andoutside the film [5-7]. The present work is focused onPPy films doped with large surfactant anions, dodecylbenzene sulfonate (DBS), operating in aqueouselectrolytes, since the films have been shown to be apromising system for use in soft actuators [8-10]. Oneof the advantages of the PPy(DBS) actuator is its lowcost.
In PPy/DBS polymer system, the speed ofresponse of the films is one of the severe limitationswhen such films are used in artificial muscles or aselectrodes in batteries and other devices [9, 10]. Thediffusion of counter ions into the PPy/DBS filmsduring the redox actuation determines the speed ofresponse of the films and strongly depends on theoperating cycling electrolytes [9]. In this study, we haveinvestigated the effect of the concentration of thecycling electrolyte and of the size of counter ions onthe diffusion of counter ions in PPy/DBS films in orderto identify cycling electrolytes which can providelarger speed of response. In this investigation, theeffective diffusion coefficients of counter ions inPPy/DBS films operating in various alkali halide
M.J.M. Jafeen(1), S. Skaarup(2), M.A. Careem(3)
A Study of Electrochemical Behaviour ofPolypyrrole Films in Highly Concentrated
Aqueous Electrolytes(1) Department of Physical Sciences, South Eastern University of Sri Lanka, Oluvil, Sri Lanka.
(2) Department of Chemistry, Technical University of Denmark, DK 2800 Lyngby, Denmark.
(3) Centre for Ionics University of Malaya, Department of Physics, University of Malaya,50603 Kuala Lumpur, Malaysia.

M.J.M. Jafeen, S. Skaarup and M.A. CareemA Study of Electrochemical Behaviour of PolypyrroleFilms in Highly Concentrated Aqueous Electrolytes
aqueous electrolytes having different concentrationswere determined using cyclic voltammetrymeasurements and the optimum cycling electrolyteamong the alkali halide electrolytes for high speedresponse is reported.
Experimental
Pyrrole (Aldrich 98%) monomer was distilledunder nitrogen and stored in a freezer in a sealed vialprior to use. Other chemicals, sodium dodecyl benzenesulfonate (SDBS) (Aldrich, technical quality), LiCl(Merck, analar grade), MgCl2, SrCl2 BaCl2 (of purity99.9 %, Aldrich) and CaCl2 (of purity ≥ 99.5 %, Sigma-Aldrich) were used as received. For allpolymerizations, a 0.05 M SDBS aqueous solutioncontaining 0.05 M pyrrole was used and the films wereprepared using galvanostatic electropolymerizationwith a constant current density of 0.1 mA cm-2. ThePPy/DBS films were prepared on the Pt wire to havea thickness of 5 μm corresponding to a synthesischarge of 800 mC [11] and the aqueous electrolytes ofMgCl2, CaCl2 ,SrCl2 and BaCl2 havingconcentrations ranging from 0.05 M to 1.5 M wereused. All cycling aqueous electrolytes used werethoroughly purged with nitrogen gas for an hour toremove dissolved oxygen. All electrochemicalinvestigations were carried out using a three electrodearrangement with a Pt sheet and a standard Ag/AgCl(3 M KCl) electrode serving as the counter andreference electrodes respectively.
Results and Discussion
In order to investigate the effect of concentrationof cycling electrolytes on the diffusion of counter ionsinto the PPy/DBS polymer matrix, which plays the keyrole in determining the speed of response of thePPy/DBS soft actuator in aqueous media, the effectivediffusion coefficients for PPy/DBS films operating inalkali earth metal cation halide electrolytes weredetermined using the model as adopted by Careemet.al. [12]. Accordingly, in the present context of oursystem, when it is assumed that transport in PPy/DBScoatings is treated as a planar diffusion and chargeinsertion is related linearly with potentials in thepotential range investigated, then a mathematical
equation for the charge accumulated at the cathodemay be written as
where, U is defined as the ratio of the chargeaccumulated in the electrode relative to the maximalcharge that can be accumulated under equilibriumconditions, E1-E2 is the potential window used for thescan and τ is the time constant for diffusion in theelectrode and α is the scan rate. Plots of U vs. 1/√α forPPy/DBS films cycled in aqueous electrolytes shoulddemonstrate that U is approximately proportional to1/√α down to a critical sweep rate, and at lower sweeprates U becomes independent of α. From this plot, τcan be determined from the critical sweep ratemarking the transition between the two linear regimes.Then the effective diffusion coefficient of ionmovements in the polymer film can be obtained usingthe relation
3.1
where l is the length of diffusion and τ is timeconstant . If the diffusion is assumed to occur acrossthe film uniformly, l will correspond to the thicknessof the film. For this investigation, the aqueouselectrolytes of MgCl2, CaCl2, SrCl2 and BaCl2 havingconcentrations ranging from 0.05 M to 0.1 M wereused.
Figs. 1 (a-d) show a series of cyclicvoltammograms at different sweep rates for a 5 μmthick PPy/DBS film cycled in 0.1 M MgCl2, CaCl2,SrCl2 and BaCl2 electrolytes respectively. In each casethe film was cycled in non sequential order of sweeprates. To avoid the problem caused by ‘memory effects’or ‘slow relaxation’, the sweep rate test was done oneach film after 10 initial conditioning cycles. In orderto facilitate comparison of all curves the current valueswere divided by the sweep rates. In the resultingdifferential capacity versus voltage diagrams, the areaunder a curve is a direct measure of the charge that iscycled in and out of the film during redox cycling.
���)(
34 21 EEU �= �
�2lD =
[ 6 9 ]

Proceedings of the Third International Symposium,SEUSL: 6-7 July 2013, Oluvil, Sri Lanka
[ 7 0 ]
Significant changes are observed in the cyclicvoltammograms with the sweep rate. The scan ratesignificantly affects the positions of nearly all peaksand this fact proves the important role of kineticfactors in the redox process.
Fig. 1: A set of cyclic voltammograms obtainedfor a 5 μm thick PPy/DBS film cycled in 0.1 Melectrolytes of (a) MgCl2 at different sweeprates:10,50,100, 200,300,400, 500, 600, 700, 800, 900,1000 and 1150 mV/s : (b) CaCl2 at different sweeprates: 10, 50, 100, 150, 200, 250, 300, 350, 400, 450,480, 520, 540, 580, 600, 650, 700 and 750 mV/s:(c)SrCl2 at different sweeprates5,10,50,125,150,200,250, 300, 325,350,380,400,450,500,550 and 600 mV/s and (d) BaCl2 atdifferent sweep rates 20,50, 80, 100, 130, 150,200,230,250 and 280 mV/s.
The cyclic voltammograms in alkali earth metalelectrolytes have the characteristic feature of a sharpcathodic peak during the reduction of the film (due toinsertion of cations) and two oxidation peaks duringthe oxidation (1st - smaller peak due to expulsion ofcations whereas 2nd - broad peak due to insertion ofanions). It can be seen from each figure that withincreasing scan rate the cathodic peaks becomeprogressively broader and shift to more negativepotentials, whereas the 1st anodic peaks becomegradually smaller while 2nd anodic peaks becomeprogressively broader, and both anodic peaks shiftto more positive potentials. Further, all peaks turn outto be smaller at higher scan rates. This implies that thecations and anions are no longer able to participatefully in the doping/dedoping process at high sweeprates. Interestingly, 1st anodic peak changes more thanthe 2nd one with increasing scan rate and the first peakoverlaps with the second peak and become one peakat higher scan rates. This may be caused because theexpulsion of cations is a slower process than theinsertion of anions into the polymer matrix.
Figs. 2 (a-d) show a series of cyclicvoltammograms at different sweep rates for 5 μm thickPPy/DBS films cycled in 1 M MgCl2, CaCl2, SrCl2 andBaCl2 electrolytes respectively. As in 0.1 Mconcentration, the cyclic voltammograms obtained for1 M MgCl2, CaCl2 and SrCl2 electrolytes have a sharpcathodic peak and two oxidation peaks but thecathodic peak obtained for 1 M BaCl2 is not welldefined (even in the extended potential window) anddiminishes with increasing scan rate. This is becausethe insertion of Ba2+ ions into the PPy/DBS film in 1M BaCl2 has great difficulty in entering the polymer
(a)
(b)
(c)
(d)

matrix and this becomes a very slow process. Thisobservation indicates that the kinetics of redox processof PPy/DBS film in highly concentrated BaCl2electrolyte is a slower process and results in low speedof response.
Fig. 2: A set of cyclic voltammogramsobtained for a 5 μm thick PPy/DBS film in 1 Melectrolytes of (a) MgCl2 at different sweep rates :50, 200, 400, 500, 600, 800, 1000, 1400, 1600, 1900and 2150 mV/s : (b) CaCl2 at different sweep rates:5, 50, 100, 200, 300, 400,500,600,650,700 and 800mV/s: (c) SrCl2 at different sweep rates 5, 10, 50,75, 150,200,250,275,300,325,350,400, 450, 500,550and 600 mV/s and (d) BaCl2 at different sweeprates 10, 20,50,100,150,200,250, 300,350, 400,450and 500 mV/s.
It can be easily seen from each figure except in 1M BaCl2 electrolyte that the electrode charge duringthe cathodic scan decreases with the increasing scanrate. However, in 1 M BaCl2 electrolyte, even thoughthe cathodic peaks are not well defined, the 2nd anodicpeak (due to insertion of Cl-) is well developedprogressively and its position shifts to more positivepotentials with increasing scan rates. It is a clear signto indicate that the system switches to anionmechanism [8]. For the determination of the diffusioncoefficient for the PPy/DBS film in 1 M BaCl2, the 2nd
anodic peak (due to insertion of Cl-) was used.
In order to find the diffusion coefficient for thePPy/DBS film in each electrolyte used, the cathodicelectrode charge vs. inverse square root of the sweeprates was plotted for each electrolyte using the datafrom Figs. 3.6 (a-d) and Figs. 2 (a-d). Fig. 3 shows theelectrode charge during the cathodic scan of thePPy/DBS film in 0.1 M (a) MgCl2, (b) CaCl2, (c)SrCl2 and (d) BaCl2 and in 1 M (e) MgCl2, (f)CaCl2, (g) SrCl2 and (h) BaCl2 as a function of theinverse square root of sweep rates. As predicted in [12],it can be seen from each figure that the electrodecharge during the cathodic scan increases linearly withthe inverse square root of scan rate at high scan rates,and then reaches an approximately constant maximumvalue at low scan rates (high values of the inversesquare root of scan rate) except in 1 M BaCl2 .However, a similar relation was obtained for the 2nd
anodic peak (due to insertion of Cl-) using the data inFig. 2 (d). The intersection of the tangent to the curvethrough the origin and a linear approximation to thedata obtained at low sweep rates is used to get thetransition scan rate. Finally, the diffusion coefficientsof the PPy/DBS film in 0.1 M and 1 M MgCl2, CaCl2,
[ 7 1 ]
(a)
(b)
(c)
(d)
M.J.M. Jafeen, S. Skaarup and M.A. CareemA Study of Electrochemical Behaviour of PolypyrroleFilms in Highly Concentrated Aqueous Electrolytes

Proceedings of the Third International Symposium,SEUSL: 6-7 July 2013, Oluvil, Sri Lanka
[ 7 2 ]
SrCl2 and BaCl2 were estimated using the equation 3.1are given in Table 1.
(a)
(b)
(c)
(d)
(e)
(f)
(g)
(h)

Fig. 3. The electrode charge vs. inverse squareroot of the sweep rates for a PPy/DBS film cycled in0.1 M (a) MgCl2, (b) CaCl2, (c) SrCl2 and (d) BaCl2electrolytes and in 1 M (e) MgCl2, (f) CaCl2, (g)SrCl2 and (h) BaCl2 electrolytes. Film thickness: 5μm.
The results shown in Table 1 confirm that theeffective diffusion coefficient for a PPy/DBS film inalkali earth cation halide cycling electrolyte increaseswith the concentration of the electrolytes and thecoefficients decrease with the increase in size of cationsin the electrolyte. The increase of effective diffusioncoefficient with concentration is an indication that at0.1 M, part of the diffusion limitation is in theelectrolyte phase. Since the effective diffusioncoefficient of counter ions is a direct measure of thespeed of response when such films are used aselectrodes in artificial muscles or in batteries, thisfinding is especially useful for the design of fastactuators based on PPy/DBS polymers. As seen in thetable, since the diffusion coefficient for the PPy/DBSfilm in 1 M MgCl2 electrolyte is larger, it can beconcluded that the speed of response of a PPy/DBSfilm may be enhanced by operating the film inconcentrated electrolytes having smaller cations suchas Mg2+.
Table 1: Effective diffusion coefficients for aPPy/DBS film cycled in MgCl2, CaCl2, SrCl2 andBaCl2 electrolytes of 0.1 M and 1 M concentrations.The thickness of the film is 5 μm.
Conclusions
The diffusion of counter ions into PPy/DBS filmsin alkali earth cation halide cycling electrolyte has beenstudied. The effective diffusion coefficient for aPPy/DBS film in alkali earth cation halide cyclingelectrolyte increases with the concentration of theelectrolytes and the coefficients decrease with the
increase in size of cations in the electrolyte. Theincrease of effective diffusion coefficient withconcentration is an indication that at lowconcentrations � 0.1 M part of the diffusion limitationis in the electrolyte phase. Since the effective diffusioncoefficient of counter ions is a direct measure of thespeed of response when such films are used aselectrodes in artificial muscles or in batteries, thisfinding is especially useful for the design of fastactuators based on PPy/DBS polymers. In this studythe diffusion coefficient for the PPy/DBS film in 1 MMgCl2 electrolyte is the largest and therefore it can beconcluded that the speed of response of a PPy/DBSfilm may be enhanced by operating the film inconcentrated electrolytes having smaller cations suchas Mg2+.
References
A.G. MacDiarmid, Agnew. Chem. 113, 2649 (2001).
E. Smela, Adv. Mater. 15, 481 (2003).
M.R.Gandhi, P. Murray, G.M. Spinks, G.G.Wallace,Synth. Met.73,247 (1995)
S. Skaarup, in Solid State Ionics: Advanced Materialsfor Emerging Technologies, M.A. Careem,M.A.K.L. Dissanayake, R.M.G.
Rajapakse and V.A. Seneviratne (Eds.), WorldScientific, Singapore, 768 (2006).
L. Bay, T. Jacobsen, S. Skaarup, K. West, J. Phys. Chem.,B105 (2001) 8492.
Y. Velmurugu, S. Skaarup, Ionics, 11 (2005) 370. M. J. M.
Jafeen, M. A. Careem, S. Skaarup, J. Solid StateElectrochem. 16 (2012)1753.
M.A. Careem, K.P. Vidanapathirana, S. Skaarup, K.West, Solid State Ionics 175(2004)725.
G. M. Sprinks, G. Alici, S. McGovern, Binbin Xi, G.G. Wallace In: Biomedical Applications ofElectroactive Polymer Actuators, Eds. : Federico
[ 7 3 ]
Con. (M)
Effective Diffusion Coefficients D (m2 s-1)
MgCl2 CaCl2 SrCl2 BaCl2
0.1 11.1 � 10-12
9.4 � 10-12
9.1 � 10-12 4.1 � 10-12
1 27.0 � 10-12
14.7 � 10-12
11.0 � 10-12
5.3 � 10-12
M.J.M. Jafeen, S. Skaarup and M.A. CareemA Study of Electrochemical Behaviour of PolypyrroleFilms in Highly Concentrated Aqueous Electrolytes

Proceedings of the Third International Symposium,SEUSL: 6-7 July 2013, Oluvil, Sri Lanka
[ 7 4 ]
Carpi and Elisabeth Smela, John Wiley & SonsLtd, U.K. (2009) 195.
E. Smela In : Biomedical Applications of ElectroactivePolymer Actuators Eds.:Federico Carpi andElisabeth Smela , John Wiley & Sons Ltd, U.K.(2009) 249.
M. Benslimane, P. Gravesen, K. West, L. Bay, S.Skaarup, Proc. 7th Int. Conf. New Actuators,Bremen, Germany (2000) 635.
M.A. Careem, Y. Velmurugu, S. Skaarup and K. West,J. Power Sources 159 (2006) 210.

[ 7 5 ]
Abstract: Quality assurance activities that are carriedout in the Sri Lankan university system since 2002were introduced to the alternative higher educationsector in 2010. External quality assessment reviews ofHigher National Diploma (HND)programme offeredin eleven Advanced Technological Institutes (ATIs)located in different regions of the country were carriedout to identify the best practices, strengths andweaknesses and make suitable recommendations toimprove the quality of those programmes. The aspectsreviewed were curriculum design, content and review;teaching, learning and assessment methods; quality ofstudents, their progress and achievements; use ofstudent feedback; peer observation; skills development;and academic guidance and counseling. The objectiveof the present study was to determine whether thereare regional differences among ATIs when bestpractices that are in place in different HNDprogrammes are considered. Best practices identifiedby the reviewers in external quality assessment reviewreports of HND programmes in Accountancy,Agriculture, Business administration, English,Information Technology and Management conductedin Ampara, Dehiwala, Jaffna, Kandy, Kegalle,Kurunegala, Labuduwa and Trincomalee ATIs wereanalysed using Principal Component Analysis todetermine whether there are regional differencesamong ATIs with respect to best practices that are inplace in each programme. Results indicated that thegood practices identified by reviewers in differentHND programmes do not depend on the location ofthe ATI, the ethnicity of the majority community and
prevalence of deterrent factors such as armedsecessionist conflicts in the area. Differences in theresources available and the motivation and dedication of the staff may have contributed to thedifferences in the good practices that are in place indifferent ATIs.
Keywords: Quality assurance, good practices, Sri Lanka
Introduction
Quality assessment reviews of HND programmesoffered by ATIs (MOHE 2010).All members ofacademic staff of ATIs were trained in 2010in carryingout self evaluations of HND programmes. Senormembers of ATIs were trained as reviewers for externalquality assessments. External quality assessmentreviews of HND programmes were started in January2011 (HETC 2012).Review teams of these qualityassessments comprised of 3-4 members who areexperienced academics from Sri Lankan universities teaching the same disciplines and hadcarried out external quality assessment reviews in theuniversity sector, and senior members of the academicstaff of ATIs who were trained as reviewers. In someinstances, reviewers were selected from the industry too.
H.S.S. Bandara(1) and M.J.S. Wijeyaratne(2)
External Quality Assessment of HigherNational Diploma Programmes Offered in
Sri Lanka: An Account of Best Practices(1) Higher National Diploma in Management Division, Advanced Technological Institute,
Kandy, Sri Lanka.
(2) Department of Zoology, University of Kelaniya, Kelaniya, Sri Lanka.

Proceedings of the Third International Symposium,SEUSL: 6-7 July 2013, Oluvil, Sri Lanka
[ 7 6 ]
Material and Methods
HND programmes where at least one batch haspassed out were selected for quality assessmentreviews. The programmes that were reviewed in eachATI until 31stOctober2012 are listed in Table II. Eachreview was conducted for three days. When the QAsystem was introduced to Sri Lankan universities, eightaspects were identified to be evaluated under subjectreviews (CVCD and UGC 2002). All these aspects sanspostgraduate studies were selected to be reviewed inquality assessment reviews of HND programmes.These seven aspects are listed in the Table III.
The self evaluation report of a particular HNDprogramme prepared by the ATI was provided to thereview team at least two weeks before the review visit.During the review visit, information was gatheredthrough discussions held with the Director of the ATI,academic staff, non-academic
Table i. Higher National Diploma programmesoffered by the Sri Lanka Institute of AdvancedTechnological Education (Source: WWW.SLIATE.NET).The abbreviations are given within parentheses.
1. Higher National Diploma in Accountancy(HNDA)
2. Higher National Diploma in BuildingServices Engineering (HNDBSE)
3. Higher National Diploma in BusinessAdministration (HNDBA)
4. Higher National Diploma in BusinessFinance (HNDBF)
5. Higher National Diploma in Engineering(Civil) (HND Eng Civil)
6. Higher National Diploma in Engineering(Electrical) (HND Eng Elec)
7. Higher National Diploma in Engineering(Mechanical) (HND Eng Mech)
8. Higher National Diploma in English(HNDE)
9. Higher National Diploma in FoodTechnology (HNDFT)
10. Higher National Diploma in InformationTechnology (HNDIT)
11. Higher National Diploma in Management(HNDM)
12. Higher National Diploma in QuantitySurveying (HNDQS)
13. Higher National Diploma in Technology(Agriculture) (HNDT Agri)
14. Higher National Diploma in Tourism andHospitality Management (HNDTHM)
Staff, administrative staff, students, alumni andemployers. In addition, teaching in theory andpractical classes and the facilities available at the ATIwere observed. Relevant documents were also perused.
After the review, a report incorporating thefindings was prepared. The strengths, best practicesand weaknesses have indicated in the report togetherwith the recommendations which will be useful toovercome the weaknesses. These reports are submittedto the QA unit of the World Bank funded HigherEducation for the Twenty First Century (HETC)project of the Ministry of Higher Education. These arethen sent to the relevant ATI for comments. Anydisagreement is resolved through discussion and the
Figure 1: Locations of Advanced TechnologicalInstitutes in Sri Lanka

H.S.S. Bandara and M.J.S. WijeyaratneExternal Quality Assessment of Higher National DiplomaProgrammes Offered in Sri Lanka: An Account of Best Practices
reports are published in the HETC websitewww.hetc.lk. The strengths and best practices indicatedin these published reports were analyzed in the presentstudy. The objective of this study was to determinewhether there are differences in good practices andstrengths among ATIs offering the same programme.Data were analyzed principal component analysisusing Minitab Ver. 15.0 software package. Since thesame curriculum designed by SLIATE is taught in allATIs, in determining the regional diversity instrengths, the aspect of curriculum design, content andreview were excluded from the analysis.
Table iii: the aspects reviewed in programmereviews (Source: MOHE 2010)
1. Curriculum design, content and review
2. Teaching, learning and assessment methods
3. Quality of students, their progress andachievements
4. Use of student feedback
5. Peer observation
6. Skills development
7. Academic guidance and counseling
Results
Best practices and strengths common to thecurriculum design content and review of all HNDprogrammes are given in Table IV.
Table iv: strengths and good practices relatedto curriculum design, content and review of all HNDprogrammes (source: WWW.HETC.LK).
o Curricula are credit based, facilitating credittransfers.
o The total number of credits exceeds theminimum number required for a HigherDiploma Programme, which is 60 Carnegiecredits.
o Courses to develop skills in InformationTechnology are included in the curriculum.
o Curricula contain courses aimed atdeveloping communication skills ofstudents.
o Curricula consist of liberal educationmodules (15-20% of the total),occupationally/professionally relatedcourses (15-20% of total) and coreoccupational/professional courses (60-70%
[ 7 7 ]
Programme ATI HNDA HNDM HNDEng
(Mech) HNDIT HNDE HNDBA HNDT
(Agri) Dehiwala Kandy Badulla Labuduwa Ampara Mattakkuliya Kurunegala Naiwala Jaffna Trincomalee Kegalle /
Table ii: The programme reviews conducted at each ATI (as at 30.09.2012)

Proceedings of the Third International Symposium,SEUSL: 6-7 July 2013, Oluvil, Sri Lanka
[ 7 8 ]
of the total) which help to get employed inthe globalised knowledge economy.
o An industrial training component isincluded in the curriculum.
o Syllabuses are of adequate depth andbreadth.
o Detail contents of each course module, timeallocation for each topic, evaluation criteriaand recommended text are given in thecurricula.
In addition to these common good practices,there are some good practices specific for each HNDprogramme when the aspect of curriculum design,content and review is considered. For example, bestpractices and strengths of the HNDA programmeinclude covering a wide range of subject matter whichhelps to get exemptions from some modules ofBachelors degree programmes of universities andcarrying out curriculum revisions as per the marketdemands in order to enhance employability. Inaddition, when the learning effort is considered, thenumber of credits in the HNDA programme isequivalent to that of a Bachelors degree programme. Asimilar strength was identified in the HNDMprogramme too. Regular revision of the syllabi andgiving much emphasis to business communication arethe other strengths of the HNDM programme. Regularrevision of syllabi is a good practice identified in theHNDIT programme too. Providing opportunities tospecialize in three broad areas, viz. developer track,administrator track and analyst track, availability oflateral entry and exit points and incorporation ofcurrent trends in IT in the curriculum are the otherstrengths of the HNDIT curriculum. Availability ofoptional modules is a strength observed in thecurriculum of HNDT (Agriculture) programme.
Best practices and strengths of the aspects ofteaching learning and assessment methods, and qualityof students, their progress and achievements of allHND programmes are listed in Tables V and VIrespectively.
Table v: strengths and best practices ofteaching, learning and assessment methods commonto all HND programmes (source: WWW.HETC.LK).
o Medium of instruction is English whichhelps in improving English language skillsthat facilitate employment of diplomaholders.
o Monitoring of teaching at the ATI level bythe Director of the ATI at Academic Boardmeetings and by the Director General ofSLIATE at the Academic Syndicatemeetings to ensure that syllabuses arecovered.
o Variety of teaching methods such aslectures, practicals and field work are used.
o Teaching aids such as multimedia andhandouts are used in teaching.
o Question papers are moderated by externalexaminers.
o Student evaluation is done throughcontinuous assessments and semester endexaminations.
o Panel marking of the answer scripts ofsemester end examination under theguidance and supervision of a chiefexaminer who is an experienced seniormember of the academic staff in therelevant discipline is carried out.
Table vi: good practices/strengths common to all HND programmes with respect to quality of students, their progress and achievements (source: WWW.HETC.LK).
o Students should have passed the GCE(Advanced Level) Examination
o Students are selected through an interview.
There are several good practices and strengthsspecific to different HND programmes when teachinglearning and assessment methods are considered. Inthe HNDE programme, a variety of teaching methodssuch as role plays and software packages are used.Software packages used in the industry are used in the

HNDA programme. In some ATIs, additionalassignments other than those sent by SLIATE are givento the students in HNDA programme.
Use of a variety of teaching methods is anothergood practice common to all HND programmes. Inaddition to lectures, discussion classes and assignmentsare used in the teaching learning process. Industrialvisits are also carried out in HNDA, HNDM, andHNDBA programmes. Field classes and laboratoryclasses are conducted in the HNDT (Agriculture)programme. Although most of the teaching learningprocess is teacher centered, student centered learningactivities such as discussion classes and assignmentsalso help to enhance knowledge and understanding ofstudents.
All students who are recruited to HNDprogrammes have fulfilled the entry requirements tonational universities. However, due to unavailability ofvacancies, they have missed the opportunity offollowing a degree programme. Nevertheless, due tothe admission policy of the University GrantsCommission where only 40% of the students arerecruited a merit, 55% on a district basis and 5% fromunder-privileged districts, some of the students whoenrolled in the HND programmes have performed inthe General Certificate of Education (Advanced Level)examination, which is also the university entranceexamination, better than some of those who had gotadmitted to state universities. In some ATIs, thereviewers have identified the good attitudes andbehaviour among students as strengths. In addition,high employability of students in some programmeswas also identified by the reviewers as a strength.However, a detail tracer study of the HNDqualification holders has to be carried out to confirmsuch statements.
In some HND programmes student feedback isobtained in a formal manner using a questionnaire. Insome programmes, the feedback obtained isquantitatively analyzed. The feedback is usuallyobtained at the end of the semester. There is a highvariation in the way of obtaining student feedbackamong different ATIs as well as among different HNDprogramme of the same ATI. Informal feedback is
obtained verbally from students in many HNDprogrammes. However, in such instances due to theprevailing culture of respecting the teachers, it is veryunlikely that the students provide adverse comments.
Peer observation of teaching is practiced only insome HND programmes. This culture was introducedto ATIs by the recent QA progrmmes. Even in theuniversity sector, peer observation of teaching was notcarried out until the implementation of externalquality assessments. Reviewers have identifiedmoderation of question papers and panel markingunder the supervision of a senior teacher also asexamples for peer observation.
Many best practices are in place for skillsdevelopment of HND students. In order to developEnglish language skills, an intensive programme fornew recruits is conducted in every ATI. Curricula ofall programmes contain modules to develop Englishcommunication skills and IT skills. Software packagesare used in programmes such as HNDA and HNDIT.In the HNDT (Agriculture) programme, laboratorypracticals and field work are included to developsubject specific skills. In the HNDE programme varietyentertainments and concerts are organized to enhanceEnglish language skills, which also help to developleadership qualities. These activities vary from ATI toATI as well as from programme to program resultingin different numbers as shown in Table VII, whichgives the numbers of good practices/strengths withrespect to quality assurance aspects of all HNDprogrammes of different ATIs other than curriculumdesign, content and review.
In all ATIs a good practice is that academicguidance and counseling is provided in an informedmanner. Recently student counselors had beenappointed. All these counselors have undergone a shortterm training on student counseling. Career guidancecounselors have also been appointed in each ATI.
The results of the Eigen analysis of the variablesin the PCA are given in Table VIII. The bi-plots of the1st and 2nd components of the PCA are given in Figure 2.
[ 7 9 ]
H.S.S. Bandara and M.J.S. WijeyaratneExternal Quality Assessment of Higher National DiplomaProgrammes Offered in Sri Lanka: An Account of Best Practices

Proceedings of the Third International Symposium,SEUSL: 6-7 July 2013, Oluvil, Sri Lanka
[ 8 0 ]
Table vii: The number of goodpractices/strengths with respect to the qualityassurance aspects of different HND programmes inthe ATIs (source: WWW.HETC.LK).
p g ATI QA Aspect
Dehiwala C1
Jaffna C2
Kandy C3
Kegalle C4
Kurunegala C5
Labuduwa C6
Trincomalee C7
TLA 8 6 9 4 9 9 10 QS 6 7 6 7 6 6 8 SF 3 2 2 2 1 3 3 PO 2 4 1 2 0 3 0 SD 2 2 3 1 4 4 5 AG 2 2 2 1 2 2 2 Total 23 23 23 17 23 27 28
Legend: TLA – Teaching, learning and assessment methods; QA – Quality of students, their progress andachievements; SD – Skills development; SF – Students’ feedback: PO – Peer observation; AG – Academic guidanceand counselling; C1-C30: codes given to each programme in the Principal Component Analysis
HNDA Programme
p g ATI QA Aspect
Badulla C8
Jaffna C9
Dehiwala C10
Kandy C11
Kurunegala C12
Labuduwa C13
TLA 8 10 6 9 13 7 QS 3 4 3 6 6 2 SF 2 1 0 0 2 3 PO 2 0 0 0 0 0 SD 3 3 3 3 4 1 AG 2 4 2 3 5 2 Total 22 22 14 21 30 15
HNDE Programme
g ATI QA Aspect
Ampara C14
Jaffna C15
Kandy C16
Kegalle C17
Kurunegala C18
Labuduwa C19
TLA 6 6 6 6 7 4 QS 5 8 5 6 9 6 SF 2 4 3 3 4 4 PO 1 1 1 1 1 1 SD 4 5 4 4 5 5 AG 1 2 1 3 1 4 Total 19 26 20 23 27 24
HNDIT Programme

[ 8 1 ]
g ATI QA Aspect
Badulla C20
Dehiwala C21
Jaffna C22
Kandy C23
Kurunegala C24
Labuduwa C25
TLA 9 8 6 8 6 3 QS 5 5 2 3 1 1 SF 3 3 2 4 3 2 PO 3 1 1 0 0 0 SD 4 3 3 3 4 3 AG 6 5 1 2 3 2 Total 30 25 15 20 17 11
HNDM Programme
( g ) g ATI QA Aspect
Labuduwa C26
Naiwala C27
Ampara C28
TLA 5 8 7 QS 4 2 6 SF 4 2 4 PO 1 0 1 SD 3 6 7 AG 2 3 2 Total 19 21 27
HNDT (Agriculture) Programme
( g ) g ATI QA Aspect
Labuduwa C26
Naiwala C27
Ampara C28
TLA 5 8 7 QS 4 2 6 SF 4 2 4 PO 1 0 1 SD 3 6 7 AG 2 3 2 Total 19 21 27
HNDBA Programme
H.S.S. Bandara and M.J.S. WijeyaratneExternal Quality Assessment of Higher National DiplomaProgrammes Offered in Sri Lanka: An Account of Best Practices

Proceedings of the Third International Symposium,SEUSL: 6-7 July 2013, Oluvil, Sri Lanka
[ 8 2 ]
Table viii: summary of the results of principalcomponent analysis
Eigenanalysis of the Covariance Matrix of C1, C2,C3, C4, C5, C6, C7
Eigenanalysis of the Covariance Matrix of C8, C9,C10, C11, C12, C13
Eigenanalysis of the Covariance Matrix ofC14, C15,C16, C17, C18, C19
Eigenanalysis of the Covariance Matrix ofC20, C21,C22, C23, C24, C25
Eigenanalysis of the Covariance Matrix of C26, C27,C28
Eigenanalysis of the Covariance Matrix of C29, C30
Eigenvalue 52.633 4.685 1.280 0.772 0.230 0.000 -0.0Proportion 0.883 0.07 0.021 0.013 0.004 0.000 -0.0Cumulative 0.883 0.962 0.983 0.996 1.000 1.000 1.0
Variable PC1 PC2 PC3 PC4 PC5 PC6 PC7C1 0.340 -0.109 -0.214 -0.652 0.363 0.246 0.457C2 0.267 -0.615 -0.352 0.503 0.001 0.417 0.017C3 0.418 0.130 -0.202 -0.125 0.367 -0.127 0.775C4 0.240 -0.646 0.525 -0.161 -0.040 -0.470 0.032C5 0.453 0.308 0.000 0.498 0.306 -0.418 -0.428C6 0.345 0.062 -0.453 -0.178 -0.743 -0.294 -0.040C7 0.506 0.278 0.555 0.029 -0.295 0.517 0.054
Eigenvalue 57.440 2.430 0.673 0.372 0.085 -0.000Proportion 0.942 0.040 0.011 0.006 0.001 -0.000Cumulative 0.942 0.981 0.993 0.999 1.000 1.000
Variable PC1 PC2 PC3 PC4 PC5 PC6C8 0.288 0.277 0.862 -0.161 0.228 0.140C9 0.459 0.034 -0.121 0.531 0.508 -0.483C10 0.286 -0.299 0.301 0.361 -0.749 -0.216C11 0.446 -0.544 -0.088 -0.663 0.096 -0.220C12 0.589 0.047 -0.290 0.143 -0.054 0.737C13 0.280 0.731 -0.244 -0.319 -0.341 -0.330
Eigenvalue 29.806 1.640 0.686 0.172 0.063 -0.000Proportion 0.921 0.051 0.021 0.005 0.002 -0.000Cumulative 0.921 0.972 0.993 0.998 1.000 1.000
Variable PC1 PC2 PC3 PC4 PC5 PC6C14 0.371 -0.449 0.356 0.143 -0.716 -0.000C15 0.468 0.242 -0.279 0.012 -0.045 0.802C16 0.363 -0.385 0.195 0.532 0.632 0.000C17 0.341 0.060 0.549 -0.711 0.270 0.000C18 0.581 -0.020 -0.586 -0.181 -0.013 -0.535C19 0.241 0.766 0.335 0.398 -0.110 -0.267
Eigenvalue 22.980 2.708 1.122 0.556 0.102 -0.000Proportion 0.837 0.099 0.041 0.020 0.004 -0.000Cumulative 0.837 0.935 0.976 0.996 1.000 1.000
Variable PC1 PC2 PC3 PC4 PC5 PC6C20 0.428 0.548 -0.213 -0.467 -0.289 0.412C21 0.464 0.505 -0.084 0.450 0.385 -0.416C22 0.356 -0.232 0.433 -0.617 0.451 -0.221C23 0.531 -0.265 0.518 0.417 -0.329 0.313C24 0.399 -0.459 -0.540 -0.088 -0.369 -0.441C25 0.187 -0.332 -0.448 0.132 0.566 0.563
Eigenvalue 14.976 2.024 0.567Proportion 0.853 0.115 0.032Cumulative 0.853 0.968 1.000
Variable PC1 PC2 PC3C26 0.303 -0.436 0.847C27 0.719 0.688 0.097C28 0.626 -0.579 -0.522
Eigenvalue 9.8034 2.0632Proportion 0.826 0.174Cumulative 0.826 1.000
Variable PC1 PC2C29 0.360 0.933C30 0.933 -0.360

[ 8 3 ]
Figure 2:Bi‐plots of the 1st and 2nd components of the PCA of variables C1 ‐ C30.
(The programmes conducted in different ATIs denoted by C1 – C30 are given in Table 7).
H.S.S. Bandara and M.J.S. WijeyaratneExternal Quality Assessment of Higher National DiplomaProgrammes Offered in Sri Lanka: An Account of Best Practices

Proceedings of the Third International Symposium,SEUSL: 6-7 July 2013, Oluvil, Sri Lanka
[ 8 4 ]
Discussion
Credit based modular system has beenintroduced to HND programmes since 2011. Asindicated in the Sri Lanka Qualifications Framework,all HND programmes consist of more than 60 credits,where one credit is equivalent to 45-50 hours oflearning effort which include lectures, practicals andself studies (SLQF 2012). Curricula of all HNDprogrammes contain core occupational/professionalmodules which contribute to 60-70% while the balanceconsists of occupationally/professionally relatedmodules and liberal education modules which help todevelop interpersonal soft skills essential to getemployed in the globalised knowledge economy.Curricula of all HND programmes conform to thebenchmark statements of higher diploma programmesoffered in Sri Lanka (HETC 2012). These curricula aredesigned centrally by SLIATE and revisions are alsodone in the same manner. The role of ATIs is toimplement these curricula and no revisions are allowedin the ATI level. Therefore, there are no differencesamong ATIs, when the QA aspect of curriculumdesign, content and review is considered.
An industrial training component is alsoincluded in the curricula of all programmes. Everystudent is assigned to a state or non state sectorestablishment for six months, which helps them to getexposed to the world of work. After this training moststudents get employed in the same establishment.Therefore, such an arrangement enhances theemployability of HND qualification holders.
Although the same curriculum is offered and thestudents sit for a common semester end examination,good practices in QA aspects such as teaching learningstrategies employed, the quality of students and theirprogress, obtaining student feedback, peer observationof teaching, skills development and providingacademic guidance and counseling may vary from ATIto ATI depending on the availability of resources andmotivation of staff.
The accepted norm in higher education is“encouraging the identification of academic strengthsand weaknesses in order to strengthen the former and
amend the latter” (Trow 1996). The external qualityassessment reviews help to identify the strengths andweaknesses of the academic programmes offered by aninstitution, in this instance the HND programmesoffered at ATIs. These reviews provide improvementoriented evaluation which helps development as doneby the European University Association for its memberuniversities (Rosa et al. 2011). For ATIs, this activity iscarried out at present by the QA division of the WorldBank funded Higher Education for the Twenty FirstCentury (HETC) Project of the Ministry of HigherEducation. However, when sharing good practices,some convergence would occur as observed in theEuropean higher education system due toimplementation of quality evaluation system (Cardosoet al 2011).
The eleven ATIs in Sri Lanka are of diversenature. Dehiwala and Mattakkuliya ATIs are located inhighly urbanized areas closer to Colombo city. Jaffnaand Trincomalee ATIs are in the northern and easternregions of the country respectively that are severelyaffected by three decades of armed secessionist conflictof ethnic lines. Other ATIs are located in comparativelysimilar environments with respect to the localeconomy and urbanization. However, it appears thatthese regional differences do not affect the strengthsand best practices that are in place in HNDprogrammes. For example, when the PCA of goodpractices of HNDA programmes is considered,Kurunegala and Trincomalee ATIs, Kegalle and JaffnaATIs and Dehiwala and Labuduwa ATIs are in threedifferent clusters. Of the first cluster, Trincomalee ATIalthough in a war stricken area is more or less similarto Kurunegala ATI when best practices of HNDAprogramme are considered. Similarly, Jaffna ATIalthough located in a heavily affected area due toarmed secessionist conflict is similar to Kegalle ATIwhich is located in a calm and peaceful area since itsinception. Location of an ATI in an urbanized area inclose proximity to the city centre also does not affectthe good practices that are in place as evident by thefact that the Dehiwla ATI located in a highly urbanizedarea closer to the city centre and Labduwa ATI locatedin a fairly rural area away from urbanized city centreare grouped together in the PCA of best practices andstrengths of the HNDA programme. Similarly, when

good practices of HNDM programmes are consideredBadulla and Dehiwala ATIs are clustered together. AsLabuduwa ATI, Badulla ATI is also located in an areadominated by tea estates far away from Colombo city.When best practices/strengths of HNDIT programmeare considered, Ampara and Kandy ATIs could beclustered together. When HNDE, HNDBA and HNDT(Agriculture) programmes are considered, none of theATIs could be clustered based on bestpractices/strengths that are in place. Similarobservation had been made by Rosa et al. (2011), forEuropean universities who recorded that there are nosignificant regional influences on the goodpractices/strengths identified by external qualityassurance reviews. The present study also shows thatin addition to geographic location, ethnicity of themajority community and prevalence of deterrentfactors such as internal wars do not affect the goodpractices and strengths that are in place in differentATIs. According to the review teams, most of the staffin the ATIs is highly dedicated and with whatever theshortcomings and difficulties they face employ as manybest practices as they can. The good relationshipbetween teachers and students had also contributed tothis. Staff student relationship has been identified as astrength in several European universities too (Rosa etal. 2011).
External quality assessment reviews should trustand give high regard to internal quality enhancementprocesses within the ATIs as stated by Kohler et al.(2006) for European universities. These internalprocesses help to develop a quality culture within theATIs. With the development of a quality culture, futurequality assessment reviews could aim at accreditingindividual HND programmes offered at each ATI. Theexternal quality assessment reviews in the Sri Lankanuniversity system were started in 2004 (Wijeyaratne etal. 2012) and the first cycle of reviews are beingcontinued even today. After the first review cycle, it isexpected introduces an accreditation programme tothe degree programmes offered at these universities.Nevertheless, there is criticism on the external qualityassessments as they are based on peer review. Toomuch friendliness has been identified as a risk in peerreviewing (Rosa et al. 2011). Further, over reliance onself evaluation report has also been identified as a
weakness (Stensaker 1999). However, in the qualityassessment reviews of HND programmes, risk of over-friendliness was avoided by getting the services ofuniversity academics in review panels as the reviewchair. The over-reliance on self evaluation reports wasalso overcome by giving more emphasis to perusal ofrelevant documents, discussions with students, alumni,academic staff, administrative staff and non-academicstaff and observing teaching and facilities available.Therefore, as Barblan (1996) has pointed out externalquality assessment reviews carried out in ATIs wereaimed at evaluating the procedures available formaintaining quality rather than individual units.
In conclusion, it can be pointed out that manygood practices are in place at ATIs in order to promoteand ensure quality of the academic programmes theyoffer. The review reports published in www.hetc.lk listout all these good practices. The number of bestpractices that are in place does not depend on thelocation, ethnicity of the majority community andprevalence of deterrent factors such as internal armedsecessionist conflicts. Differences in the resourcesavailable and the motivation and dedication of the staffmay have contributed to the differences in the goodpractices that are in place in different ATIs.
References
Barblan, A. 1996. Institutional evaluation: Assessingthe pilot phase, CRE action, 107: 55-73
Cardoso, S., M. J. Rosa. D. A. Tavares and A. Amaral2011. Increasing role of market forces in highereducation: Is the EUA institutional evaluationprogramme playing a role? In Teixiera P. N. andD. D. Dill (eds). Public Vices, Private Virtues?Assessing the Effects of Marketization in HigherEducation, Sense Publishers, Rotterdam.
CVCD and UGC 2002. Quality Assurance Handbookfor Sri Lankan Universities. Committee of Vice-Chancellors and Directors and University GrantsCommission, Sri Lanka. 104 pp.
CVCD and UGC 2003. Academic ProceduresHandbookfor Sri Lankan Universities. Committee
[ 8 5 ]
H.S.S. Bandara and M.J.S. WijeyaratneExternal Quality Assessment of Higher National DiplomaProgrammes Offered in Sri Lanka: An Account of Best Practices

Proceedings of the Third International Symposium,SEUSL: 6-7 July 2013, Oluvil, Sri Lanka
[ 8 6 ]
of Vice-Chancellors and Directors and UniversityGrants Commission, Sri Lanka.
HETC 2012. Programme Benchmark Statements.www. hetc. lk (Accessed on 14.11.2012)
Kohler, J., J. Huber and S. Bergan 2006. HigherEducation Governance Between DemocraticCulture, Academic Aspirations and Market Forces.Strasbourge: Council of Europe HigherEducation Service No. 5.
Mendis B. R. R. N., L. L. Ratnayake, C. Fonseka, S.Bandaranayake, H. P. M. Gunasena, M. A.Careem and S. R. H. Hoole 2006.TheDevelopment of the University system of Sri Lanka2001-2006; The Sixth University GrantsCommission, University Grants Commission, SriLanka. 145 pp.
MOHE 2010. Quality Assurance Handbook forAdvanced Technological Education. HigherEducation for Twenty First Century Project,Ministry of Higher Education, Sri Lanka. 57 pp.
Rosa, M. J., S. Cardoso, D. Dias and A. Amaral 2011.The EUA institutional evaluation programme: anaccount of institutional best practices. Quality inHigher Education, 17(3): 369-386.
SLQF 2012. Sri Lanka Qualifications Framework.Ministry of Higher Education Sri Lanka. 46 pp.
Stensaker, B., 1999. External quality auditing inSweden: Are departments affected? HigherEducation Quarterly, 53(4): 353-368.
Trow, M. 1996. Trust, markets and accountability inhigher education: a comparative perspective.Higher Education Policy, 9(4): 309-324.
Wijeyaratne, M.J.S., E.R.K. Perera and S.M.P.P. Bandara2012. Quality Assurance in the Higher EducationSector in Sri Lanka. Paper presented at theQuality Assurance Workshop, British Counciland Quality Assurance Agency, U.K. 17-18October 2012. Colombo, Sri Lanka. 8 pp.

[ 8 7 ]
Abstract: This study reveals the scenario of landslidehazards and non-structural preparedness among thecommunity. During the NE monsoon rainfall in 2012,the study area experienced a high level of risk fromlandslide occurrences. Due to the lack of preparedness,people were not alert enough in the pre-disaster stage.Since the study area has been identified as a high riskarea, potential landslides could be expected in thefuture as well. Therefore, it is necessary to be preparedfor landslide hazards, in order to reduce the impacts tominimum level.
Keywords: NE Monsoon Rainfall, Landslide,Impacts, Risk, Preparedness
Introduction
Sri Lanka, as a small highland, is facing seriousthreats from various types of natural hazards such asfloods, droughts, landslides and extreme weatherconditions due to its different types of physicalfeatures. Among them, the landslide is one of the verycommon natural hazards in the country. Sri Lanka hasbeen experiencing a spate of landslides over extensiveareas of the central hill country and south westernregion since the early eighties (Amaratunga, 1994).World Atlas of Natural Hazards also states that,landslides are the most frequent and widespreadnatural hazard on Earth (Jelinek. R, et, al, 2007). Theterm ‘Landslide’ is restricted to movement of rock andsoil in the broad range of velocities even slowmovements which are rarely a direct hazard to life candestroy buildings or break buried utility lines(Kularathna, 1998). Some landslides move slowly andcause damage gradually; whereas others move sorapidly that they can destroy properties and take lives
unexpectedly. The threats which caused by landslideevents in Sri Lanka are considered to have significantnegative consequences on various sectors which arehighly depending on environmental conditions.
In general, landslides are associated with theperiods of heavy rainfall. History of Landslide eventsin Sri Lanka clearly indicates that continuous andintensive rainfall has triggered a number ofcatastrophic landslide events in the hill country region.This tendency has attested by most of the Sri Lankanresearchers with apposite verification. North-Eastmonsoon, which is one of the predominant climaticseasons in Sri Lanka, having variability in rainfall,brings extreme weather conditions to Sri Lanka in therecent past. Accordingly, during the recent North-Eastmonsoon rainy season in Sri Lanka which started inthe month of December 2012 aggravate the situationof the country by causing a significant number ofnatural hazards such as landslides and flood events.Those negative situations were caused not onlyprofound harm to the lives and properties but alsosevere decrease in economy and social development ofthe country.
This status clearly indicates that the impacts oflandslide hazards drive the people into high risk andsocioeconomic structure of the people is becomingworse. Thus, it is necessary to take appropriateremedial actions to avoid the impacts of landslidehazards. The people who are living in landslide proneareas should be guarded from the losses of lives andproperties. In general, lack of mitigation andpreparedness measures cause high level of impacts,besides mitigate or prevent the landslides will not bepossible always. However, by implementing proper
Vasanthakumary Selvanayagam(1)
NorthEast Monsoon Rainfall InducedLandslide Hazard and Nonstructural
Preparedness(1) Department of Geography, Eastern University, Chenkalady, Sri Lanka.
(email: [email protected])

Proceedings of the Third International Symposium,SEUSL: 6-7 July 2013, Oluvil, Sri Lanka
[ 8 8 ]
preparedness measures, the impacts of landslidehazards can be reduced. Though, the landslide eventsusually occur with a short notice, it can be predicted.Because of that, preparedness phase is becoming as amost important part in the disaster management.
Preparedness is shortly defines as planning howto respond to a hazard. This phase involves two mainparts which are structural preparedness measures andnon structural preparedness measures. Preparednessmeasures include preparedness plans; training;warning systems; communication system; evacuationplans and training; resource inventories; and publicinformation /education (International Strategy forDisaster Reduction (ISDR), 2012). Part of thispreparedness depends on how the community has theknowledge and how they respond to landslide hazards(Iyengar, 1998). Accordingly, this research addresses animportant problem in the pre-disaster stage andparticularly discusses the non-structural preparednesstowards landslide hazards.
Background of the Problem
The Matale District situated above 2147 feet fromMean Sea Level (MSL) experiences a number oflandslides and subsequent floods due to the intensiverainfall in this period. Several areas in the Mataledistrict were affected by landslide occurrences causeda number of deaths, displacement and damages to theproperties. Among them Rattota is a key area whichfaced severe negative circumstances due to landslidehazards. Eight deaths were reported and 3,242 personsbelonging to 1,029 families were displaced. They havebeen accommodated in 14 temporary shelters. TheMinistry of Disaster Management has allocated overRs.2.5 million additional funds for disaster relief in theMatale district. These records showed that, the peopleliving in landslide prone areas of Rattota had avulnerable situation from landslide hazards which weretriggered by last North-East monsoon rainfall. On theother hand, these catastrophic events have caused hugeimpacts on the economy and social structure of thepeople in this district.
Through the investigation carried out in landslideprone areas especially in Ukuwela, Rattota and Naula,
it has been ascertained that 127 areas in 29 GNDivisions have a high risk of landslide events in MataleDistrict (NBRO, 2012). Most of them are belonging tothe Rattota DS Division. Bodhikotuwa, Alakolamada,Punchiselvakande, Kandenuwra West, KandenuwaraEast, Madakumbura, Dhambagolla, Hungrankandha,Velangahawatta, Bambarakiriyella are some areas thathave been identified as high and moderate risk area forlandslide hazards. Out of them, Punchiselvakande andKandenuwara East have been selected for thisparticular study to analyze the scenario of landslidehazards and non-structural preparedness level towardsthe landslide hazards.
Accordingly, the research question of this studyis, how the people were affected by NE monsoonrainfall induced landslide hazards in December 2012and how much they are ready to face the landslidehazards to be occurred in future. The objectives of thisresearch are to understand the scenario of North-Eastmonsoon rainfall induced landslide hazard, identifythe impacts and to assess the level of non-structuralsafety and preparedness measures towards thelandslide hazards.
Materials and Methods
Since the study primarily focusing on thescenario of landslide hazards and the preparednesslevel, disaster management theories were applied tothis study. Out of the major phases of the disastermanagement cycle, considerable priority has beengiven to the phase of risk reduction to analyze thepreparedness level. While identifying the scenario,these study mainly emphases on non-structuralmeasures like awareness, knowledge and practicesamong the community. Though, the study deals withboth primary and secondary data, primary data werethe fundamental data source of this study. These datawere collected through key informant interview, focusgroup discussions and questionnaire survey. Amongthem, a questionnaire survey was occupied as keyprimary data collection method for acquiringinformation on the experience of affected people andthe preparedness level towards the landslide hazards.Apart from this, group discussions were carried outwith the community to identify the general picture of

Vasanthakumary SelvanayagamNorth-East Monsoon Rainfall Induced LandslideHazard and Nonstructural Preparedness
the preparedness. Key informant interviews wereconducted with a social development officer and ruraldevelopment officer of the Rattota DS division. Inaddition, secondary data were also accommodated tounderstand the nature of problem, impacts, affectedfamilies and provided reliefs to those families. 30families were selected from the affected familiesthrough purposive sampling techniques for the survey.Collected data were analyzed through quantitative andqualitative analysis methods. Ranking and descriptivemethods specifically used to analyze the qualitativedata. This qualitative analysis part identifies why thesecommunities are having problems and how they aregoing to face forthcoming landslides.
Study Area
The study area is situated in the southern part ofthe Matale district in Central Province of Sri Lanka.The total land extent of the study area is about 478ha.The study area experiences frequent rainfall almostthroughout the year. Since the study area belongs toUpcountry Intermediate Zone, it receives annualrainfall of about 110 inches during both southwest andNortheast Monsoons. The average temperature is about180C. Both Punchiselvakande and Kandenuwara Eastare tea estates; majority of the people who lives in theseestates are working as estate labors with low income.Each of these areas has specific and different economicand socio cultural characteristics. The workforcecomprises of 266 workers, who are on daily paid.Location map of the study area is shown in figure 01.The study area is also shown in landslide hazard mapof Matale district prepared by the National BuildingResearch Organization.
Results and Discussion
The study revealed that the study area has beenexperiencing a significant number of small and largescale landslide hazards and identified as a high riskarea for landslide hazard by the National BuildingResearch Organization. Figure 02 shows the 3D mapof the study area and it indicates that, the eastern partconsists of the higher elevation of more than 1000m.Northern and western parts consist of valleys and low-lying areas. Occurrence of the slope failures in the
rainy season is a common phenomenon in this area. Itdiffers from smaller scale earth slide to larger scalerock falls. It is important to note the history oflandslide hazards where there was a huge landslideoccurred in the study area in 1983 causing 13casualties and severe damages to lives and properties.
Although, smaller scale slope failures typicallyoccur along the roads and the slopes in this area,during December 2012 North-East rainfall aggravatethe disastrous situation. The natural factors of studyarea such as topography, geology, slope types, soilstructure and tributaries are mechanically leading tohigh potential landslide hazards. However, intensiveand continues rainfall is the major triggering factor forseveral landslide occurrences which were experiencedduring last northeast monsoon season.
[ 8 9 ]
Figure 1: Map of Landslide Hazard Zonesand Location map of the Study Area
Figure 2: 3D Map the Study Area
Source: National Building Research Organization (NBRO)Source: Prepared by Researcher, 2013

Proceedings of the Third International Symposium,SEUSL: 6-7 July 2013, Oluvil, Sri Lanka
[ 9 0 ]
Figure 03 shows the average annual rainfallstatistics of the study area from 1999 to 2012. Duringthis period, the month of December has received morethan 600 mm rainfall in both 2006 and 2012. Thisshort term high intense rainfall in 2012 has directrelationship with occurrence of landslide hazards inthe several parts of the study area. As per the globaltrend, there is going to be a particular increase inrainfall intensity in Sri Lanka. Recently antecedentrainfalls and short term high intense rainfalls havebecome a general weather condition in the country(Rathnaweera, et, al, 2012). During the last ten years ithas become evident that most devastating landslideevents tend to occur as a result of comparatively shortduration, high intense rainfall compared to thepreviously had lower intense prolonged rainfalls in SriLanka (Ibid). This will lead to the potential landslidehazards as increasing trend.
Apart from natural factors, anthropogenic factorsalso contribute to the landslide occurrences in thisarea. More than 85% of the land area is utilized forcultivation, particularly tea. The slope areas of themountainous region have been entirely changed byhuman interventions. Figure 04 illustrates the land usepattern of this area. In addition to agriculturalactivities, clearance of land and construction of thehouses on the slope areas are foremost factors whichare influencing on the slope failures. Due to thishazardous situation, a significant number of houseshave been identified as high and moderate risk for
landslide hazards. Among them 33 houses have beenidentified in high risk areas in Kandenuwara East andPunchiselvakande GN divisions and it have beenpointed out in table 01. These statistics are clearlynotified that, the landslide hazards will become aserious issue and the severity of the problem will beleading to high vulnerability in the future.
This Disastrous situation caused significantimpacts to the community. During the phase oflandslide hazard, the community was helpless. Intenserainfall blocked the transportation by causing rockslides along the roads of the study area, and it causedcomplicated situation to the officers of local authoritiesto guard the people from hazardous situations.However, next to the clearance of the blocked roads,they could manage to reach the affected areas anddirect the people for the safeguard. Subsequently,people were asked to move to the nearby school bylocal authorities and they were accommodated in
Pitakande Maha Vidyalayam. Those affected peoplefaced lots of challenges when they were asked todisplace. Even as rank the impacts of landslide hazardsbased on the priorities, loss of lives (two children)comes first. Next to that, loss of houses, displacement,fractures and cracks in the houses, loss of livestock, are some important impacts aroused due to thishazard.
Figure 3: December Rainfall Trend in Study Area
Source: Reports of Pitakande Estate and MeteorologicalDepartment Data
Figure 4: Land use map of the Study Area
Source: Prepared by Researcher, 2013
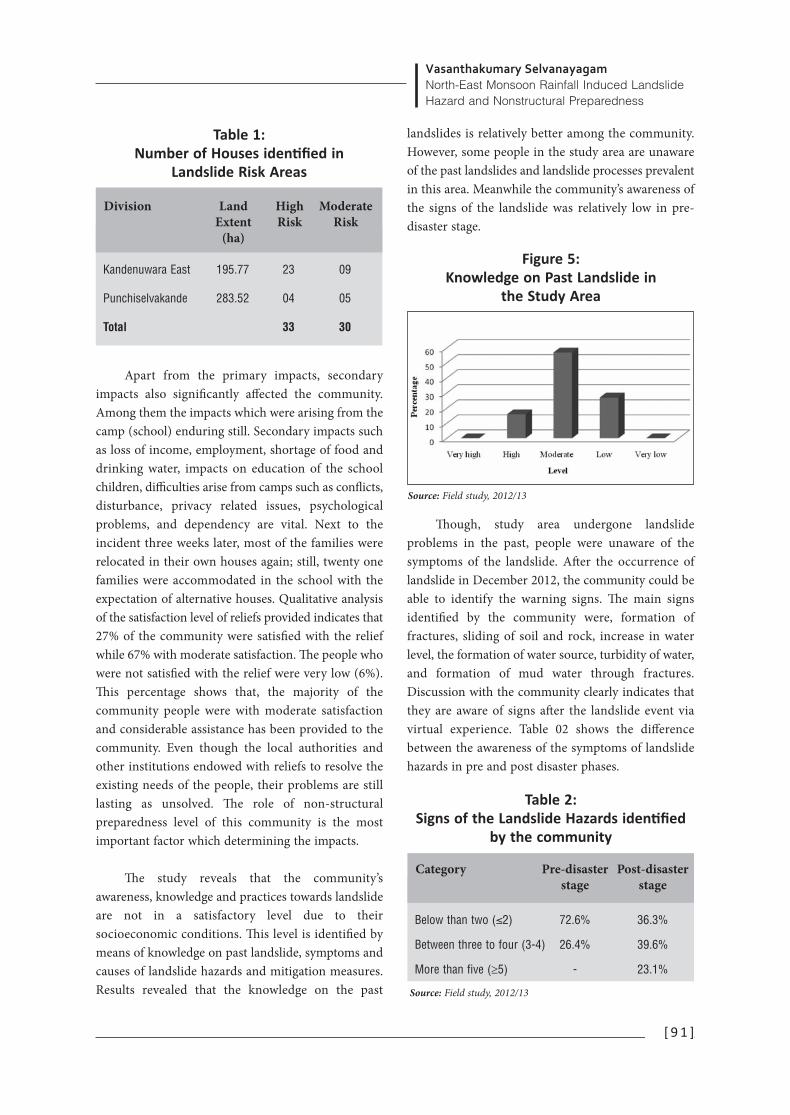
Vasanthakumary SelvanayagamNorth-East Monsoon Rainfall Induced LandslideHazard and Nonstructural Preparedness
Apart from the primary impacts, secondaryimpacts also significantly affected the community.Among them the impacts which were arising from thecamp (school) enduring still. Secondary impacts suchas loss of income, employment, shortage of food anddrinking water, impacts on education of the schoolchildren, difficulties arise from camps such as conflicts,disturbance, privacy related issues, psychologicalproblems, and dependency are vital. Next to theincident three weeks later, most of the families wererelocated in their own houses again; still, twenty onefamilies were accommodated in the school with theexpectation of alternative houses. Qualitative analysisof the satisfaction level of reliefs provided indicates that27% of the community were satisfied with the reliefwhile 67% with moderate satisfaction. The people whowere not satisfied with the relief were very low (6%).This percentage shows that, the majority of thecommunity people were with moderate satisfactionand considerable assistance has been provided to thecommunity. Even though the local authorities andother institutions endowed with reliefs to resolve theexisting needs of the people, their problems are stilllasting as unsolved. The role of non-structuralpreparedness level of this community is the mostimportant factor which determining the impacts.
The study reveals that the community’sawareness, knowledge and practices towards landslideare not in a satisfactory level due to theirsocioeconomic conditions. This level is identified bymeans of knowledge on past landslide, symptoms andcauses of landslide hazards and mitigation measures.Results revealed that the knowledge on the past
landslides is relatively better among the community.However, some people in the study area are unawareof the past landslides and landslide processes prevalentin this area. Meanwhile the community’s awareness ofthe signs of the landslide was relatively low in pre-disaster stage.
Though, study area undergone landslideproblems in the past, people were unaware of thesymptoms of the landslide. After the occurrence oflandslide in December 2012, the community could beable to identify the warning signs. The main signsidentified by the community were, formation offractures, sliding of soil and rock, increase in waterlevel, the formation of water source, turbidity of water,and formation of mud water through fractures.Discussion with the community clearly indicates thatthey are aware of signs after the landslide event viavirtual experience. Table 02 shows the differencebetween the awareness of the symptoms of landslidehazards in pre and post disaster phases.
[ 9 1 ]
Figure 5: Knowledge on Past Landslide in
the Study Area
Source: Field study, 2012/13
Source: Field study, 2012/13
Division LandExtent
(ha)
HighRisk
ModerateRisk
Kandenuwara East
Punchiselvakande
Total
195.77
283.52
23
04
33
09
05
30
Table 1:Number of Houses identified in
Landslide Risk Areas
Category Pre-disasterstage
Post-disasterstage
Below than two (≤2)
Between three to four (3-4)
More than five (≥5)
72.6%
26.4%
-
36.3%
39.6%
23.1%
Table 2:Signs of the Landslide Hazards identified
by the community

Proceedings of the Third International Symposium,SEUSL: 6-7 July 2013, Oluvil, Sri Lanka
[ 9 2 ]
Similarly, the community was not conscious withthe factors responsible for landslide hazards in thisparticular area. The majority of the community,pointed out that, rainfall is the main triggering factorof slope failures, but they were unaware of humanfactors which are responsible for that. This implies that,they completely deem that human intervention on theslopes will not trigger the landslides. This can bedemonstrated through the several improper humaninterventions which already incorporated on theslopes. For an example, houses have been constructedon the steep slope area which already undergonelandslide problem without the approval from therelevant authorities. Even though, relevant authoritiesinstructed the people to avoid the constructions,activities were taken place due to several necessities ofthe community.
Due to the low level of awareness of thecommunity on the precise causes and the warningsigns of landslide hazards, the steps to be taken duringthe periods of heavy rainfall were not taking place.Even after the identification of the signs, they didn’ttake immediate action to move to safer places due tothe ignorance and dispassion. While continuing theintense rainfall and NBRO’s landslide warning; thepeople were staying at their house; even after theyaccommodated in camps, some of the people inparticular, males having the practice to go their housesto sleep at night and they back to the camps next day.This kind of dispassion happened due to the improperguidance and awareness. Being a community with avery poor educational background, they face lot ofchallenges to understand the instructions given by theauthorities, such as understanding and languageproblems etc. However, it could be noticed that,younger generation, in particular school children; haveconsiderable knowledge of the signs and causes,mitigation measures than the elder people to a certainextent.
This community believes that; the landslide is anunavoidable hazard and it cannot be mitigated; movingto the landslide free zones is the best solution to getprotection; but, they have no choice of alternativelands, houses and livelihood. Also majority of thepeople were not interested to move to a different place
due to their traditional occupation. As mentionedearlier, though, the reliefs have been provided soonafter the incident, awareness programs were notconducted in this community. Apart from abovementioned non-structural preparedness measures,structural measures also inadequately practiced in thisarea. With the proper slope management measuresmost of the slope failures which occur in this area canbe mitigated. However, none of such practices wereimplemented yet, besides, such structural practicesrequire advanced technical approach and also it is veryexpensive.
Conclusion and Recommendations
December 2012 rainfall induced landslide eventwhich caused a number of negative impacts to thecommunity and there are potential landslides can beexpected in the future as well. Though the governmenthas taken several steps to improve the existingmitigation and preparedness level; impacts of thelandslide hazards have not reduced yet in the studyarea. Particularly, the National Building ResearchOrganization has undertaken a number of programs toreduce the risk. However the devastation of the lastevent occurred in December 2012 reminds thatlandslide problem has not resolved yet. Therefore thecommunity has to be prepared to reduce the high levelof vulnerability. If proper attention is given by therelevant authorities considering the economiccondition, educational level and language of thecommunity, impacts of landslide hazards could havebeen minimized. Therefore, the study clearlyenlightens that vulnerable community has lessawareness and hence need more attention towardsmore focused preparedness programs. The followingrecommendations will support to reduce the impactsand improve the preparedness level of the community.
o Develop the sustainable slope managementpractices in the high slope area andimplement different types of landslidehazard risk reduction measures for differentparts of the slops

Vasanthakumary SelvanayagamNorth-East Monsoon Rainfall Induced LandslideHazard and Nonstructural Preparedness
o Minimize the human intervention on thehill slop region through stringent legislationor by appropriate awareness programs,particularly, construction of houses in thesteep slope area should be avoided
o Provide proper trainings to build theknowledge and undertake necessary actionsto avoid improper human interventions onslops.
o Provide alternative lands and livelihoodfacilities in secure places according to theirpreference
o Strengthen the skills of the communitythrough appropriate and sufficientawareness program towards risk reduction
o The community should aware of theirvicinity, landslide processes prevalent in thearea and potential sites for landslidehazards
o Educate the public on the causes, symptomsand the mitigation measure of thelandslides and people should be trained torecognize immediate actions to be takensoon after the identification of thesymptoms of landslide hazards, particularly,during the rainy season
o More focused awareness programs shouldbe implemented based on the socio-culturalcharacteristics of the community
References
Dahanayake, K., (2009) “Approaches for LandslidesDisaster Risk Reduction and MakingCommunities Resilient” National Symposium onCreating Disaster Free Safer Environment, NBRP& Ministry of Disaster Management & HumanRights : Colombo.
Hemachandra, D.,(2009) “Community BasedStrategies for Management of LandslideDisasters A case study on Napititenna Village inNuwara Eliya District” National Symposium onCreating Disaster Free Safer Environment, NBRP& Ministry of Disaster Management & HumanRights : Colombo.
Gunathilaka, P., (1994) “Problem of Housing andSettlements in Disaster Prone areas withparticular reference to landslides” NationalBuilding Research Organization, Sri Lanka:Colombo.
Katupotha, K.N.J., (1998). “Socio – Economic aspectsof Disasters related victims and vulnerablecommunities” Proceedings of the workshop onRole of Research & Development Institutions inNatural Disaster Management, Centre forHousing Planning & Building, Sri Lanka:Colombo.
Kulatunga, A.A & Sapukotana, U., (1998). “Impact ofNational and Sectoral Policies on Landslides –Sri Lanka” Proceedings of the workshop on Roleof Research & Development Institutions inNatural Disaster Management, Centre forHousing Planning & Building, Sri Lanka:Colombo.
Rathnaweera, T. D., Palihawadana, M. P., Rangana, H.L. L, and Nawagamuwa, U. P., (2012), “Effects ofclimate change on landslide frequencies inlandslide prone districts in Sri Lanka;Overview” Civil Engineering Research ExchangeSymposium 2012, Faculty of EngineeringUniversity of Ruhuna: Sri Lanka.
[ 9 3 ]

[ 9 4 ]
Abstract: A Potculture experiment was conducted toevaluate the yield and quality of groundnut withpoultry manure as partial substitute for P and S.Poultry manure (PM) was integrated with chemicalfertilizers (CF), SSP and elemental S at different ratios.There were six treatments replicated three times in acompletely randomized design (T1-Control, T2-100%PM, T3-75% PM + 25% CF, T4-50%PM+50%CF,T5- 25% PM + 75% CF and T6 100%CF.Highest pot yield (45.50 g/pot) and oil content (45.2%)was obtained forT5 and Maximum protein content(12.50%) was recorded for T3.
Keywords: oil content, poultry manure, proteincontent, yield.
Introduction
Groundnut (Arachis hypogaea) is aneconomically important and valuable oil seed cropcultivated extensively throughout the world.Groundnut prefers light-textured and well drainedsoils. The excellent soil group is sandy loam with agood supply of nutrients. In general these are deficientin nutrients. Therefore application of fertilizer isessential to increase the yield and quality of groundnut.
The nutrient removal by oilseeds crop was higher(N, P and K), while the contribution to nutrient uptakefrom fertilizer was low (Hegde, 2006). There is agrowing deficiency of nutrients due to intensivecropping coupled with continuous use of high analysisfertilizers without any organic manure addition.
Phosphorus has a great role in energy storage andtransfer and as a constituent of nucleic acid, phytin andphospholipids in plants. An adequate supply ofphosphorus early in plant life is important for thereproductive parts of the plants. It plays an essentialrole in carbohydrate metabolism, fat metabolism andalso in respiration of plants. The availability ofphosphate in soils is often limited by fixation reactions,which convert the monophosphate ion to variousinsoluble forms. The availability of soil phosphate isenhanced by additions of organic manures, presumablydue to chelation of polyvalent cations by organic acidsand other decay products. Varalakshmi et al., (2005)demonstrated that incorporation of farm yard manurealong with inorganic phosphorus increases theavailability of phosphorus and this is attributable toreduction in fixation of water soluble phosphorus,increased mineralization of organic phosphorus due tomicrobial action and enhanced mobility ofphosphorus. The supply of P through manures notonly provides enough P to growing plants but alsoincreases the soil solution P (intensity factor, I) andquantity of available P (quantity factor, Q) (Patiram,1993). In a study on the impact of FYM and poultrymanure on P availability Rao (2003) observed that theavailable P content in soil increased significantly from19.5 kg ha–1 under control to 20.8 and 21.5 kg ha–1 with10 t FYM and 5 t poultry manure ha-1, respectively.
Sulphur is recognized as the fourth majornutrient after nitrogen, phosphorus and potassium(Tandon, 1995). Field scale deficiencies of sulphur insoils and plants are becoming increasingly important.When a soil is deficient in sulphur, and this deficiencyis not rectified, then the full potential of a crop variety
Punitha Premanantharajah(1) and Komathy Prapagar(1)
Effect of poultry manure as partial substitutefor P and S on the yield and quality of
groundnut(1) Department of Agricultural Chemistry, Faculty of Agriculture,
Eastern University, Chenkalady, Sri Lanka.(email: [email protected])

Punitha Premanantharajah and Komathy PrapagarEffect of poultry manure as partial substitute for P and S on the yield and quality of groundnut
cannot be realized regardless of the optimum supply ofother nutrients and adoption of improved seeds or topclass husbandry practices. Sulphur deficiency is mostlyreported in coarse textured soils, in soils having loworganic matter, in sites away from industrial activityassociated with the emission of sulphur containinggases, in high rainfall areas, in crop rotations involvingpulses and oilseeds and due to continuous use ofsulphur free fertilizers (Tandon, 1995). Sulphurimproves crop yields, oil percentage in oilseeds, plantproteins, etc. Radhamani et al. (2001) observed that oilcontent of sesame was higher with S application ascompared to treatments without S application.
A field experiment conducted in loamy sand tostudy the individual and interaction effect of P and Son cluster bean showed that the levels of P and Ssignificantly increased the seed and stover yield overcontrol (Seshadri Reddy, 2005).On a sandy loam soillinseed crop responded to applied S and P applicationswith increased yields and oil content over control(Chaubey, 1992). The synergistic relationship betweenP and S was observed at 35 kg P and 50 kg S ha-1
resulting in highest seed, straw and oil yields in boththe years. Protein content also increased with P and S.Uptake of total and fertilizer P and S by soybean alsoenhanced significantly with the addition of P and Sfertilizers to the soil. Higher utilization of fertilizer Pand S were observed at their respective lower levelsthat increased significantly when both were appliedtogether (Khajanchi Lal et al., 1996).
Soil fertility cannot be maintained with theapplication of inorganic fertilizers alone. Besidesinorganic chemical fertilizers, there are several sourcesof plant nutrients like organic manures, crop residues,and industrial wastes. No single source can meet theincreasing nutrient demands for agriculture. Toachieve sustainability in production, there is a need tointegrate both organic and inorganic sources ofnutrients. Such an integration of nutrient sources willenhance the nutritional use efficiencies (Hegde andSudhakarababu, 2001) besides maintaining soil fertility.Poultry manure occupied a place of pride as it is richin nutrients than the other manures (MohamadAmanullah et al. 2007). Vijaya Sankar Babu et al.(2007) concluded that the uptake of N, P, K, Ca and
Mg was higher in poultry manure and fertilizer treatedplots in both the planted and ratoon crops ofsugarcane.
Information on the exact quantity of phosphorusand sulphur rendered available to crops from theapplied manures is scanty, and such preciseinformation could be obtained only with the aid oftracer techniques.
Against this backdrop, the present investigationwas contemplated with the following objectives:
Objective
To study the yield, and quality of produce ingroundnut consequent to the application of organicmanures;
To find out the suitable organic and inorganicsource combination to increase the yield and qualityparameters of ground nut.
Materials and Methods
Pot culture experiment: The experimental soil is yellowish red, very deep,
fine loamy, non-calcareous, and well drained. The bulksoil collected was air-dried in shade, gently poundedwith a wooden mallet and sieved to pass through a2mm sieve. Processed soil samples were filled inearthen pots at 8 kg soil per pot. There were sixtreatments and three replications, making a total of 18pots.
T1: Control T2: 100% of recommended dose of fertilizers
(RDF) as poultry manure (PM)T3: 75% of RDF as PM + 25% as inorganicT4: 50% of RDF as PM + 50% as inorganicT5: 25% of RDF as PM + 75% as inorganicT6: 100% of RDF as inorganic
Sowing of cropsTo all pots common basal applications of 17 kg N
ha-1 as urea, 54 kg K2O ha-1 as muriate of potash and93.1 kg Ca ha-1 as CaCl2 were given. Single superphosphate (SSP) and elemental sulphur (S) chosen as
[ 9 5 ]

Proceedings of the Third International Symposium,SEUSL: 6-7 July 2013, Oluvil, Sri Lanka
[ 9 6 ]
reference source of Chemical fertilizer and poultrymanure as reference organic source. Single superphosphate(SSP) applied @ 34 kg P2O5 ha-1 andelemental S applied @ 75 kg S ha-1 to all on equivalentP and S basis (0.054 g P per pot and 0.27 g S per pot),respectively. Seeds of groundnut five per pot weresown in each pot. After the germination, the plantswere thinned to 3 per pot. Routine cultural practiceswere followed in raising the crop
Pod yieldGroundnut was grown to maturity and harvested.
Pods from each pot were weighed and total yield wasexpressed in kg ha-1.
Oil contentThe oil content in the kernels was determined by
Soxhlet extraction using petroleum ether (Boilingpoint 40 – 60 ºC) as solvent as per the standard AOACprocedure (Horowitz, 1984). Five grams of kernelswere extracted with petroleum ether in a Soxhletapparatus for five hours and then the solvent wasdistilled off at 60 ºC. The oil content was calculatedfrom the weight of oil and weight of kernels andreported as percentage.
Protein contentProtein content of kernel was estimated by
multiplying nitrogen content (%) of kernel with 6.25.
Results and Discussion
Yield of groundnutThe pod yield data revealed that the highest pot
yield was for integrating 25 % poultry manure with75% chemical fertilizer, with a significant yield
improvement over control. All the treatments weresignificantly superior to control. The second best podyield was due to 75% poultry manure with 25%chemical fertilizer and was comparable with thetreatment combining 50% poultry manure with 50%chemical fertilizer.
Application of phosphorus and sulphur throughdifferent sources promoted the number of pods, podweight and shelling percentage over control. This is inagreement with the results obtained by Maity andGajendra Giri (2003) who reported that there was asignificant positive interaction of phosphorus andsulphur on pod yield of groundnut with the combinedapplication of phosphorus and sulphur. It could beattributed to the complimentary role played by thenutrients in successful growth and development ofgroundnut.
Combining poultry manure with chemicalfertilizer significantly influenced the dry matter yield.Enhanced dry matter accumulation might be due tothe integrated effects of poultry manure and chemicalfertilizer in improving the major and micronutrientsavailability, as well as improving soil physical, chemicaland biological properties (Dwivedi et al., 1990).Besides this, the dry matter yield might also have beenincreased due to the interaction effect of phosphorusand sulphur. Randhawa and Arora (2000) had earlierconfirmed the positive interaction effect of phosphorusand sulphur on dry matter production of wheat.
Analyte Procedure Reference
Oil content
Nitrogen content
standard AOACprocedure
Micro Kjeldahlmethod
Horowitz,1984
Jackson(1973)
Table 1:Methods of analysis of plant samples
Treatments Pod yield (g pot-1)
Control
100% PM
75 % PM + 25% CF
50 % PM + 50 % CF
25 % PM + 75% CF
100 % CF
CD (P = 0.05)
28.43 e
38.07 c
41.03 b
40.33 b
45.50 a
29.77 d
1.29
Table 2:Effect of poultry manure and chemicalfertilizer on the pod yield of groundnut

Punitha Premanantharajah and Komathy PrapagarEffect of poultry manure as partial substitute for P and S on the yield and quality of groundnut
When phosphorus was combined with sulphur,the yield was significantly higher than control. Thismight be due to the synergistic effect of phosphorusand sulphur applications on the yield and could beattributed to the enhanced root activities and rootnodulation of plants leading to higher uptake ofnutrients in soybean – wheat- moong sequence(Balanagoudar et al., 1999).
The yield data in this present investigationrevealed that the highest yield and yield attributes wasfor the treatment integrating 25% poultry manure with75% chemical fertilizer. The increase in yield mightalso be attributed to the beneficial effects of combineduse of poultry manure with fertilizers as nutrientavailability increased through enhanced microbialactivity, conversion from unavailable to available formsand also due to improved physical, chemical and bio-chemical conditions. These results are in conformitywith the findings of Babhulkar et al. (2000) in soybean.
When poultry manure was combined withchemical fertilizer, the pod yield of groundnut wasincreased significantly as compared to sole applicationof either poultry manure or superphosphate. Thismight probably because of the increased release of themacro- and micronutrients in soil resulting in betterextraction of nutrients by the crop.
Well-developed pods with fully filled kernels areessential for increasing shelling percentage. Applicationof phosphorus and sulphur favored higher shellingpercentage. This might be attributed for a favorable pegformation and pod development with well filledkernels resulting in increased shelling percentage.Patel and Patel (1987) observed significance on shellingpercentage due to application of phosphorus ingroundnut.
Quality of groundnut
Oil content The results (Table 3) of the present investigation
indicated that the oil content of groundnut wassignificantly higher due to the application ofphosphorus and sulphur. The beneficial effect ofphosphorus and sulphur on oil content is due to the
increase in linoleic acid content and probably due tothe increase glucosides, which, on hydrolysis, producedhigher amount of oil. Phosphorus and sulphurapplications accelerated the metabolic pathway oflinoleic acid synthesis. The beneficial effect ofphosphorus and sulphur application on oil content hasalso been reported by Chaubey et al. (1992) in linseed.
Combining poultry manure with chemicalfertilizers significantly influenced the oil content thansole application. In this investigation 25% poultrymanure with 75% chemical fertilizer exhibited aconsiderable increase in oil content (45.20%). Poultrymanure is a rich source of all nutrients. Dosani et al.(1999) have confirmed the possibility of substitutingrecommended dose of fertilizers by 3 t ha-1 poultrymanure in groundnut. When poultry manure iscombined with chemical fertilizer this might increasethe availability of nutrients. In addition to nitrogen,phosphorus and sulphur other secondary andmicronutrients also required for oil production whichmight have been rendered available (Hegde, 2000).
Protein content Phosphorus and sulphur applications
significantly increased the kernel protein content (Tab3). Maximum protein content was recorded in thetreatment combining 75% poultry manure with 25%chemical fertilizer (12.50%). This was followed by 25%
[ 9 7 ]
Phosphorus andsulphur sources
Oilcontent
(%)
Proteincontent
(%)
Control
100% PM
75 % PM + 25% CF
50 % PM + 50 % CF
25 % PM + 75% CF
100 % CF
CD (P = 0.05)
31.30e
42.53bc
43.50b
41.57c
45.20a
39.73d
1.32
6.26 d
10.60 b
12.50 a
10.46 b
10.75 b
10.04 c
0.29
Table 3:Effect of poultry manure and chemical
fertilizer on quality of groundnut

Proceedings of the Third International Symposium,SEUSL: 6-7 July 2013, Oluvil, Sri Lanka
[ 9 8 ]
poultry manure with 75% chemical fertilizer treatment(10.75%) which in turn was on par with the treatmentthat received poultry manure alone (10.60%) and thetreatment that received 50% poultry manure combinedwith 50% chemical fertilizer (10.46%). The treatmentof chemical fertilizer alone recorded the lowest proteincontent (10.04%) but this was significantly higher thanin control (6.26%).
The results with respect to protein contentshowed a significant influence due to the appliedphosphorus and sulphur. This might be due to theincreased uptake of nitrogen, which in turn might beincorporated in the protein molecule. Maragatham andChellamuthu (2000) reported that increased dose ofnitrogen, phosphorus and sulphur had positive andsignificant influence on seed yield and protein contentof sunflower.
Combined effect of phosphorus and sulphurmight have stimulated the proliferation roots andthereby enhanced the absorption of nitrogen whichmight have contributed for the increased proteincontent in seed. These results corroborated with thefindings of Yadav and Harishankar (1980) in sunflower.
Conclusion
Combining poultry manure with chemicalfertilizer significantly increased the pod yield, proteinand oil content of kernel. In this investigation 25%poultry manure with 75% chemical fertilizer exhibitedhighest pod yield and considerable increase in oilcontent (45.20%). Maximum protein content wasrecorded in the treatment combining 75% poultrymanure with 25% chemical fertilizer (12.50%).
References
Babhulkar, P.S., Wandile, R.M., Badole, W.P. andBalpande, S.S. 2000. Residual effect of long-termapplication of farmyard manure and fertilizers onsoil properties and yield of soybean. J. Indian Soc.Soil Sci., 48 (1): 89–92.
Balanagoudar, S.R., Deb, D.L., Sachdev, M.S. andSachdev, P. 1999. Phosphorus sulphurrelationship in soybean in soybean – wheat –moong sequence. J. Nuclear Agric. Biol., 28 (1):45–53.
Chaubey, A.K., Dwivedi, K.N. and Yadav, R.S. 1992.Effect of nitrogen, phosphorus and sulphur onlinseed. J. Indian. Soc. Soil Sci., 40: 758–761.
Dosani, A.A.K., Talashilkar, S.C. and Mehta, V.B. 1999.Effect of poultry manure applied in combinationwith fertilizers on the yield, quality and nutrientuptake of groundnut. J. Indian Soc. Soil Sci., 47(1): 166–169.
Dwivedi, M., Upadhyay, R.M. and Dwivedi, G.K. 1990.Effect of inorganic, organic and biofertilizers onyield, protein and aminoacids contents of blackgram and wheat grown in sequence. Ann. Agric.Res., 11 (2): 191-198.
Hegde, D.M. 2000. Nutrient management in oilseedcrops. Fert. News, 45 (4): 31 -41.
Hegde, D.M. 2006. Finding newer niches imperative.The Hindu Survey of Indian Agriculture, Kasturi& Sons Ltd., Chennai, pp. 66-69.
Hegde, D.M. and S.N. Sudhakarababu. 2001. Nutrientmanagement strategies in agriculture: A futureoutlook. Fert. News, 46 (12): 61-72.
Horowitz, W. 1984. Methods of analysis of theAssociation of Official Analytical Chemists,Washington DC.
Jackson, M. L .1973. Soil Chemical Analysis, PrenticeHall of India (P) Ltd., New Delhi
Khajanchi Lal, Deb, D.L., Sachdev, M.S. and Sachdev,P. 1996. Phosphorus and sulphurinterrelationships in soybean using 32P and 35S. J.Nuclear agric. Biol., 25 (4): 196–204.

Punitha Premanantharajah and Komathy PrapagarEffect of poultry manure as partial substitute for P and S on the yield and quality of groundnut
Maity, S.K. and Gajendra Giri. 2003. Influence ofphosphorus and sulphur fertilization onproductivity and oil yield of groundnut (Arachishypogaea) and sunflower (Helianthus annus) inintercropping with simultaneous and staggeredplanting. Indian J. Agron., 48 (4): 267–270.
Maragatham, S. and Chellamuthu, S. 2000. Responseof sunflower to nitrogen, phosphorus andsulphur in Inceptisols. J. Soils and Crops, 10 (2):195–197.
Mohamad Amanullah, M., Somasundaram, E.,Vaiyapuri, K. and Sathyamoorthi, K. 2007.Poultry manure to crops – A review. Agric. Rev.,28 (3): 216-222.
Patel, B.D. and Patel, P.G. 1987. Response of summergroundnut to Rhizobium inoculation and gradedlevels of nitrogen, phosphorus and potassium.Gujarat Agri. Univ. Res. J., 12: 36–38.
Patiram. K. 1993. Effect of organic manures andnitrogen application on potassium quantity –intensity relationships in an acid Inceptisol. J.Indian Soc. Soil Sci., 42: 136–139.
Radhamani, S. Balasubramanian, A. and Chinnusamy,C. 2001. Effect of sulphur application and foliarspray of nutrient and growth regulators on seedyield and oil content of sesame. Madras Agric. J.,88 (10-12): 732–733.
Randhawa, P.S. and Arora, C.L. 2000. Phosphorus-sulphur interaction effects on dry matter yieldand nutrient uptake by wheat. J. Indian Soc. SoilSci., 48 (3): 536-540.
Rao, S.S. 2003. Nutrient balance and economics ofintegrated nutrient management in groundnut(Arachis hypogaea) - mustard (Brassica juncea).Madras Agric. J., 90 (7-9): 465–471.
[ 9 9 ]

[ 1 0 0 ]
Abstract: Aim of the work was to investigate thepollutants level specially Nitrate- N in the groundwaterand compare the obtained results with WHO standard.Groundwater sample were collected from sixty wellsconsists of thirty cancer patients well as case and otherthirty as control within 100 m distance from highlyaffected three areas of oesophagus and stomach cancer.Questionnaire was used for case- control study. Thedetermined values expressed by hazard quotientindicate that the water pollutants and theirconcentrations do not exceed unity. Chunnakam wasshown the high odds ratio which was greater than one.But in relative risk was greater than one in all theselected three areas. Ingestion with water is the mainpathway for nitrates than the vegetables in areas wheregroundwater with high nitrate content.
Keywords: Hazard Quotient, Odd Ratio, RelativeRisk and Health risks
Introduction
Pollution problems in Sri Lanka are more seriousproportions as urban communities grow, industryexpands, rural areas develop, farmers intensityagriculture and mining and other developmentprograms unfold. Groundwater is a potential source ofa safe water supply for drinking. Contamination ofdrinking water by nitrate is evolving public healthconcern since nitrate can undergo endogenousreductions and can form nitroso compounds, which
are carcinogens. There were past history ofcontamination of nitrate- N in drinking water and highincidences of cancer in Jaffna Peninsula (Jayakumarn,2008). Hence the objective of this study was selected asdetermination of nitrate – N and nitrite concentrationin groundwater at high risk area, and health riskassessment link with the esophagus and stomachcancer.
Nitrate contamination is the major factor whichsignificantly polluting the groundwater today. In manycountries nitrate levels of groundwater has beenincreased significantly due to extreme use ofnitrogenous fertilizers. Nitrogenous compounds in wellwater for drinking are considered as a possible riskfactor for oesophageal cancer (Zhang, 1996). Nitrate ispotentially hazardous when present at sufficiently highconcentrations in drinking water. Nitrates which couldbe converted into carcinogenic substances such asnitrosamines within the body are of importance in thecarcinogenesis of esophageal and stomach cancers(Dissanayake, 1988). An ecologic study done on nitratein municipal drinking water and cancer incidence inTrnava district, Slovakia supports the hypothesis thatthere is a positive association between nitrates indrinking water and cancer (Gulis et.al., 2002).According to Jeyakumaran, (2008) that there is“possible cancer hazards from pesticide residues infood have been much discussed and hotly debated inthe scientific literature”.
M. Thushyanthy(1), K. Gunalan(2), H.B. Asanthi(2), T.P.D. Gamage(2) and S.Saravanan(3)
Hazard Quotient, Odd Ratio and RelativeRisk: As the methods for assessment of
health risks(1) Dept. of Agricultural Engineering, Faculty of Agriculture, University of Jaffna, Jaffna, Sri Lanka.
(email: [email protected])
(2) Dept. of Limnology, Faculty of Fisheries and Marine Sciences & Technology, University ofRuhuna, Matara, Sri Lanka.
(3) National Water Supply and Drainage Board, Jaffna, Sri Lanka

M. Thushyanthy, K. Gunalan, H.B. Asanthi, T.P.D. Gamage and S.SaravananHazard Quotient, Odd Ratio and Relative Risk:As the methods for assessment of health risks
Materials and Methods
Selection of location for water samplingOut of all cancer patients history sheet,
Oesophagus and stomach cancer patients wereseparated based on the guidance given by theOncologist of Jaffna Teaching hospital. Then thepatients were grouped according to DivisionalSecretariat. Thirty patients were selected randomlyfrom three Divisional Secretariats (ten from each) suchas Jaffna, Vadamaradchchi and Chunnakam based onhighly affected area and groundwater samples werecollected from selected thirty wells. Another 30 wellswere selected from the neighboring area of within 100m distance from cancer patients well as control. Alltogether 60 wells were selected for sampling.
Collection of data for case - control studyA questionnaire was used to collect the
information of patients and their family members. Thepersonal information of cancer patients were takenfrom close relatives in their families due to ethicalreasons.
Collection of water samplesGroundwater samples were collected at 20 cm
depth from the water surface of the well. Monthlysamples were taken during the wet period ofDecember 2010 to February 2011. Cadmium reductionmethod was used to analyze NO3 - N and NO2 - Nand NH4+ were not considered for measurement sincethe compounds were no stable in water and oxidized.
Calculation of Odd Ratio (OR), RelativeRisk (RR) and Hazard Quotient (HQ)
Risk assessment is the processes of estimating theprobability of occurrence of an event and the probablemagnitude of adverse health effects over a specific timeperiod. Relative risk is a ratio of probabilities. Itcompares the incidence or risk of an event amongthose with those who were not exposed. Case-controlstudies reveal the relationship between exposure anddisease by comparing people with the disease (cases),with people without the disease (controls). Themeasure of case-control study is called odd ratio, orrelative odds (Joseph and Thomas, 2007).
Odd ratio is the ratio between the odds exposurein the case group to the odds of exposure in the controlgroup. Due to the consumption of nitratecontaminated water relative risk to human wascalculated using the equation RR =PEC/PNEC Where;PEC –Probable of exposure concentration and PNEC–Probable of non- exposure concentration. If therelative risk greater than 1, the risk will be greater inexposed persons than non-exposed and there is apositive relationship with the exposure parameter. Ifthe relative risk of less than 1 that indicates there is norelationship between the risk factors and the cases(Joseph and Thomas, 2007)
The estimated uptake of a potential toxin by thehuman body through contact with a contaminant isestimated using the chronic daily intake (CDI). TheCDI value indicates the quantity of chemical substanceingested through body per kilogram of body weightper day (Gao et al., 2012 and Pawelczyk, 2012).Potential noncarcinogenic risks for exposure tocontaminants of potential concern were evaluated bycomparison of the estimated contaminant intakes withthe reference dose.
In which C = Pollutants concentration (mg/l)IR = Drinking rate (l/day)ED = Exposure duration (year)EF = Exposure frequency (d/year)BW = Average body weight (Kg)AT = Average exposure time (days)
The above said parameters were taken from thequestionnaire survey.Hazard quotient (HQ)
Rfd = Reference dose (mg/kg/day) value forNO3- N as 3.7 mg/kg/day
Analysis of dietary intake of NitrateAverage nitrate content in mg/Kg on fresh weight
basis were analyzed by taking the samples from localThirunelvelly market. Results revealed that the content
[ 1 0 1 ]
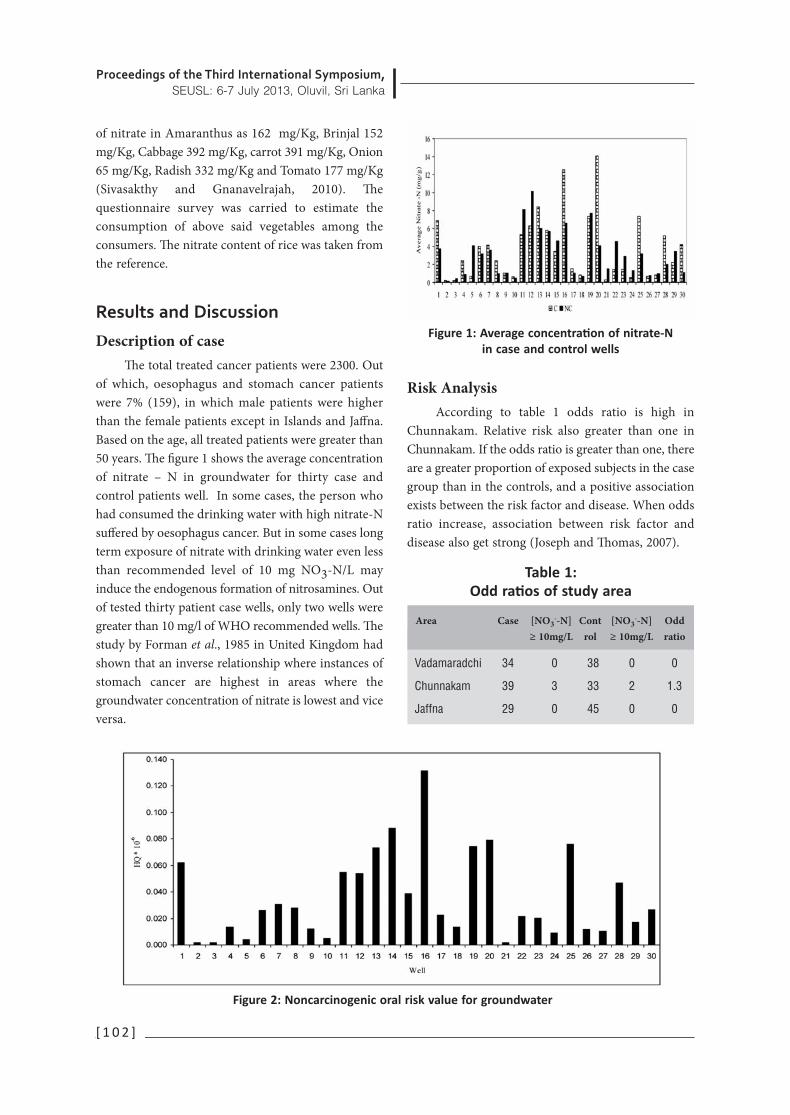
Proceedings of the Third International Symposium,SEUSL: 6-7 July 2013, Oluvil, Sri Lanka
[ 1 0 2 ]
of nitrate in Amaranthus as 162 mg/Kg, Brinjal 152mg/Kg, Cabbage 392 mg/Kg, carrot 391 mg/Kg, Onion65 mg/Kg, Radish 332 mg/Kg and Tomato 177 mg/Kg(Sivasakthy and Gnanavelrajah, 2010). Thequestionnaire survey was carried to estimate theconsumption of above said vegetables among theconsumers. The nitrate content of rice was taken fromthe reference.
Results and Discussion
Description of caseThe total treated cancer patients were 2300. Out
of which, oesophagus and stomach cancer patientswere 7% (159), in which male patients were higherthan the female patients except in Islands and Jaffna.Based on the age, all treated patients were greater than50 years. The figure 1 shows the average concentrationof nitrate – N in groundwater for thirty case andcontrol patients well. In some cases, the person whohad consumed the drinking water with high nitrate-Nsuffered by oesophagus cancer. But in some cases longterm exposure of nitrate with drinking water even lessthan recommended level of 10 mg NO3-N/L mayinduce the endogenous formation of nitrosamines. Outof tested thirty patient case wells, only two wells weregreater than 10 mg/l of WHO recommended wells. Thestudy by Forman et al., 1985 in United Kingdom hadshown that an inverse relationship where instances ofstomach cancer are highest in areas where thegroundwater concentration of nitrate is lowest and viceversa.
Risk AnalysisAccording to table 1 odds ratio is high in
Chunnakam. Relative risk also greater than one inChunnakam. If the odds ratio is greater than one, thereare a greater proportion of exposed subjects in the casegroup than in the controls, and a positive associationexists between the risk factor and disease. When oddsratio increase, association between risk factor anddisease also get strong (Joseph and Thomas, 2007).
Figure 1: Average concentration of nitrate‐N in case and control wells
Area Case
Vadamaradchi
Chunnakam
Jaffna
34
39
29
[NO3--N]
≥ 10mg/L
0
3
0
Control
38
33
45
[NO3--N]
≥ 10mg/L
0
2
0
Oddratio
0
1.3
0
Table 1:Odd ratios of study area
Figure 2: Noncarcinogenic oral risk value for groundwater

Chunnakam was shown the high odds ratiowhich greater than one which express there may bepositive association between risk factor and disease butwe cannot confirm that without detailed studies ofepidemiology. Chunnakam is one of the intensiveagricultural areas of the peninsula. In case of relativerisk, it was greater than one in three selected areas. Ifthe relative risk was greater than 1 that indicates thereis a relationship between the risk factors and the cases.
Figure 2 shows hazard quotient values forselected thirty case wells. The hazard quotient assumesthere is a level of exposure below which it is unlikelyfor even sensitive population to experience adversehealth effects. There may be a concern arising for thepotential noncarcinogenic effects if the HQ exceeds 1X 10⁻⁶(Unity). The results showed that the levels ofnoncarcinogenic oral risk ranged from 0.01 to 0.13 X10⁻⁶ .
The World Health Organization InternationalAgency for Research on Cancer (IARC) ranked nitratesand nitrites high on the priority list for upcomingreview of possible carcinogenicity of ingested nitratesand nitrites. Analysis of local vegetables available inlocal market revealed that none of the tested vegetablessamples had nitrate content above the risk level of 3.7mg/Kg body weight/day when consumed alone(Sivasakthy and Gnanavelrajah, 2010). According tothe Questionnaire survey, the total intake of nitratefrom the vegetables was 200.9 mg/day and from thewater it was 144 mg/day. Hence the total consumptionof nitrate was 344.9 mg/day. If the average body weightis 60 Kg, possibility of average level of exposure is 222(3.7 * 60) mg/kg/day. Hence
consumption of nitrate was high than the averagelevel of exposure. This was due to consumption of highnitrate content water than the vegetables. Furtherresearch with a detailed analysis of dietary nitrate isneeded to more precisely define the relation betweennitrate and stomach cancer.
References
Dissanayake, C.B. (1988). Nitrate in the groundwaterin Sri Lanka – Implication for community health.Journal of the Geological society of Sri Lanka. 1:80- 84.
Forman, D., Al-Dabbagh, S., and R. Doll. (1985).Nitrates, nitrites and gastric cancer in GreatBritain. Nature. 313: 620-625.
Gao, Y., Yu, G. Luo, C, and P. Zhow (2012).Groundwater nitrogen pollution and assessmentof its health risks: A case study of a typical villagein rural – Urban continuum, china. Plos ONE7(4): e333982. Doi:10.1371/journal.pone.0033982.
Gulis, G., Czompolyova, M. and J.R. Cerhan. (2002).An ecologic study of nitrate in municipaldrinking water and cancer incidence in TrnavaDistrict, Slovakia. Environmental Research. 88:182–187.
Jayakumaran, S. (2008). Cancer Incidences in JaffnaPeninsula. Memorial Lectures of late Prof.S.Maheswaran.- 2008. University of Jaffna
Joseph, V.R. and A.B. Thomas. (2007). Epidemiologyand Environmental Risk Assessment. In: P.Calow(ed.) Hand book of Risk Assessment andManagement.
Pawelczyk, A. (2012). Assessment of health hazardassociated with nitrogen compounds in water.Water science technology. 66(3):66- 72
Sivasakthy, K and N. Gnanavelrajah. (2010). Nitratecontent of selected vegetables grown in Jaffna andpotential to reduce nitrate accumulation inAmaranthus. Proceedings of Jaffna scienceassociation. 17(01):21
Zhang, W.L., Tian, Z.X., Zhang, N. and X.Q. Li. (1996).Nitrate pollution of groundwater in northernChina. Agricultural Ecosystem Environment. 59:223–231.
[ 1 0 3 ]
Area PEC PNEC RR
Vadamaradchi
Chunnakam
Jaffna
2.52
6.1
2.61
2.61
6.00
2.10
1.17
1.02
1.24
Table 2: Relative risk of study areas
M. Thushyanthy, K. Gunalan, H.B. Asanthi, T.P.D. Gamage and S.SaravananHazard Quotient, Odd Ratio and Relative Risk:As the methods for assessment of health risks

[ 1 0 4 ]
Abstract: The chemical stuff containing domesticand industrial waste effluents are principal sources todegrade the quality of agricultural land through watersupplying practices from its related inland waterbodies. The contribution of domestic and otherimproper waste disposal to the inland water bodieswere monitored over a period of six months for threeof different water bodies at South Eastern Region. Thesignificant level of sodium, dissolved oxygen (DO),pH, temperature, salinity, Total dissolved solid (Tds)and specific conductivity (SC) were measured.
Impact of the inorganic matters on these waterbodies were studied based on the specific conductivityvalues and the influence of this parameter was studiedwith other parameters. Absorption of the nutrients wasdisturbed by the increasing level Sodium AbsorptionRatio (SAR). Mainly calcium and magnesium intakeability of the crop massively disturbed by this sodiumcontaining wastewater and as a result of long termimproper maintenance of wastewater practicessignificantly affect the paddy cultivation in this region.
Keywords: Water bodies, Dissolved Oxygen, Salinity,Total dissolved solid, Specific conductivity and SodiumAbsorption Ration.
Introduction
The water is a sustainable source for the futuregeneration therefore naturally occurring water sourcesshould be protected in a good condition. Inland watersystems may be natural, as well as human-altered such
as canals, ponds, and reservoirs (Cole 1994). Pondsand lakes are diverse in form and function and aretypically distinguished by size and depth with pondstypically smaller than lakes (Summerfelt 1993, U.S.EPA 2010). Both systems lack notable flow and may befound at any elevation. The origin of ponds and lakesmay be natural or human-made.
2010s people especially individual householdthought the water is used for both activities such aspersonal hygiene and the transportation of householdwaste to the distant inland water bodies. Disposal offaecal materials, urine and cloth washing are thepersonal hygiene while general household water useincludes washing, cooking utensils, floors, cleaning andpreparing food and flushing unwanted materials awayin the wastewater sink. Environmental characteristicsof inland water bodies are also toughly influenced bychemical stuff, elevation, precipitation, topography,soils and vegetation (Heinz Center 2008), and humanalterations-both direct and indirect. The consumptionof chemicals is an essential element of domesticwastewater, which is to assist the washing action ofclean water such as laundry detergents, soap, bleachesand bactericides. Similarly other chemicals used on thebody (toothpaste, make-up, powders) and in kitchen(tea leaves, oils, detergents and greases). Thesechemicals are partly decompose its neighboring waterbodies to release nitrates, phosphate, sodium and acomplex array of the other chemicals, alter the pH ofthe same.
The open disposal of the wastewater from thehousehold, factories, municipal and market is theproblem to the soil. The use of a conventional water
M.C.A.M. Haniffa(1), R. Senthilnithy(2), K. R.R. Mahanama(3)
Effect of Sodium Concentration of InlandWater Bodies Related to Paddy Cultivated
Land in South Eastern Region( 1), (2) Department of Physical Sciences, Faculty of Applied Sciences, South Eastern University of
Sri Lanka, Sammanthurai, Sri Lanka. (email: [email protected])
(3) Department of Chemistry, University of Colombo, Colombo, Sri Lanka.

M.C.A.M. Haniffa, R. Senthilnithy and K. R.R. MahanamaEffect of Sodium Concentration of Inland Water BodiesRelated to Paddy Cultivated Land in South Eastern Region
bodies offering primary treatment to all wastewaterand disposal of the effluent to subsoil disposal. Theseactivities are to increased sodium concentration, aquality of the paddy land imparting through the use ofsodium rich chemicals in house. The purpose of thisstudy was to evaluate and study the effect of sodiumon paddy field related to its nearby water sink throughthe individual household activities.
Material and Methods
Study areaThe location A, which is 1Km offshore from the
Kalmunai shoreline and completely closed to thepaddy field, was having an open water column depthof 2.5m. Aerial view of this location was illustrated inthe figure 1.
The satellite image of the location B was shownat figure 2, with water column depth of 1.5 m whichwas 0.1 Km from the paddy field of Ninthavur and the
location C was widely open to agricultural land and itwas located around 12 Km from the Karaitivu offshorehaving the water column depth of 2 m and the aerialview of this location was illustrated at figure 3.
The water samples were collected once a monthfrom June to November in 2011 between 09:00 am to12:00 noon. These were transferred into sterile plasticcontainers and transported to the laboratory usinginsulated containers. The physical and chemicalparameters were measured on the following day of thewater sampling.
The work focused on sodium concentration andother related parameters in the locations A, B, & C.Further pH, DO, Tds, salinity, SC and temperature (T)were determined in situ using portable meters. Theconcentration of sodium was analyzed using SystronicsFlame Photometer 128 with series of standard solution.
Standard PreparationsA sodium chloride standard solution was
prepared and the following approximateconcentrations were made: 20, 40, 60, 80 and 100mg/ml as Sodium by using this stock solution. Thedeionized water was used to clean the glassware andfor the dilution. These standards were prepared inclean/ dry volumetric flasks and transfer the solutionsto plastic bottles.
[ 1 0 5 ]
The following satellite images were taken at May 2013
Figure 1: Satellite image of the location A Figure 2: Satellite image of the location BFigure 3: Satellite image of the location C

Proceedings of the Third International Symposium,SEUSL: 6-7 July 2013, Oluvil, Sri Lanka
[ 1 0 6 ]
Results and Discussion
The locations were received different types ofinorganic stuff including sodium and other organicwaste. The wastewater were collected from threelocations namely location A, B & C.
SE = Standard error, upper and lower rangesequivalent to 95% confidence interval, Co. Var =Coefficient of Variation.
The variations in physico-chemical properties ofthe location A (Table 1), Increases in sodium rangedfrom 3.34 to 10.68 mg/l, at the beginning of this studyshown low sodium while it has increased during beforeending period and it may happen because of analyzingperiod is monsoon.
The location B has higher concentration ofsodium rather than other locations due to getting hugelevel of laundry detergents directly from the edge ofthe channel of the location. Inclusion of organic wastesuch as leaves, grass clippings, dead plant (algae andwater based plants) sewage and animal dropping arealso significantly higher at this location.
SE = Standard error, upper and lower rangesequivalent to 95% confidence interval, Co. Var =Coefficient of Variation.
Then this organic matter gets decomposed bybacteria and these bacteria may have consumed thedissolved oxygen. Depending on the organic wastemore bacteria may grow and they can use moreoxygen, as a result DO concentrations can drop.Higher levels of Tds, salinity and SC were observedduring the study and which were summarized in theTable 2. It may be due to the remaining enormousnumber of anions, cations and other ionic compoundsthrough the evaporation of huge amount of water fromthis location.
The range of sodium 8.83 – 26.80 mg/l wasobserved during this study period, while it has highervalue at the end of middle period such as fourthmonth. This period was obviously used by the hugenumber of laundry activities on the edge of the channelof the location. As a results salinity and specificconductivities also increases during this period. Thelocation C has number of waste effluents, especiallydomestic, hospital and other effluents. However, it waslocated far from the household activities.
SE = Standard error, upper and lower rangesequivalent to 95% confidence interval, Co. Var =Coefficient of Variation.
The location C have been receiving comparativelylow level of above types of waster effluent than theother location because, it was located geographicallyfar away from household, hospital and other wasteeffluent. However the above said waste effluents wereattained to this location by passing long distance.
Variables Mean ± SE Range Co.Var. (%)
pH 5.51 ± 0.05 5.17 - 5.82 5.63
Salinity (‰) 0.27 ± 0.01 0.17 - 0.40 29.63
Tds mg/l 394.37 ± 15.01 112.60 - 795.00 6.24
DO mg/l 2.06 ± 0.17 0.86 - 3.35 49.51
SC (µS/cm) 792.67 ± 90.05 444.07 - 1232.40 68.16
Sodium (Na) 7.28 ± 0.53 3.34 - 10.68 43.77
Table 1:Sodium concentration and physico‐
chemical parameters of the location A
Variables Mean ± SE Range Co.Var. (%)
pH 7.92 ± 0.82 5.68 – 8.01 2.02
Salinity (‰) 0.36 ± 0.05 0.10 – 0.80 80.56
Tds mg/l 604.55 ± 15.96 104.91 – 1000.20 14.90
DO mg/l 3.38 ± 0.15 2.13 – 4.79 27.22
SC (µS/cm) 864.32 ± 52.34 254.73 –1590.00 36.33
Sodium (Na) 17.24 ± 1.36 8.83 – 26.80 44.50
Table 2:Sodium concentration and physico‐
chemical parameters of the location B
Variables Mean ± SE Range Co.Var. (%)
pH 5.46 ± 0.06 5.21 – 6.06 6.96
Salinity (‰) 0.24 ± 0.01 0.13 – 0.33 33.33
Tds mg/l 219.88 ± 11.96 127.67 – 314.57 32.64
DO mg/l 1.53 ± 0.01 0.67 – 2.74 5.23
SC (µS/cm) 508.20 ± 26.21 323.70 – 692.33 30.95
Sodium (Na) 7.26 ± 0.53 2.54 – 10.31 48.25
Table 3:Sodium concentration and physico‐
chemical parameters of the location C

The range of sodium, from 2.54 – 10.31 mg /l,was very significant and it was shown that the Table 3.Higher level of sodium concentration exhibits, for thesample collected at the ending period of this study.Due to the excess waste effluent attained to thislocation with having huge level of sodium containingwastewater.
DO concentrations significantly vary within thelocations and the low level of DO concentration wasobserved at location C (Table 4) to other locations. TheDO level of the location A significantly varies from thelocation B with but not in the case of the location C.Because of the location B have huge level of DO and itwas cleared that this effect can be occurred by the vastlevel of laundry activities.
Significantly low level of Tds record at location Band its level investigated before and aftercontamination of the household, laundry and otherwastewater activities. Significantly a higher level of Tds
was observed from the location C compared to theother two locations A and B.
Sodium concentration of the location B has hugevalues 17.24 mg/l rather than the other locations and itwas clearly exhibited that the location highlycontaminated by the sodium containing waste effluentsuch as laundry detergents and other householdpractices. However, the location A and C hasapproximately equal level of sodium but both aredifferent in nature as well as the connection between thetype of waste sources and the distance to the locations.
The method has been authenticated from thesquare values of Pearson product moment correlationcoefficients (positive correlation) with r2 = 0.8694 ofthe correlation of sodium concentration Vs pH. It hasclearly exhibited, that the location heavilycontaminated by the salt active waste effluent. As aresult of these salt active substances the location wasled to basic nature.
[ 1 0 7 ]
Location T (oC)
Mean ± SD
pH
Mean ± SD
STY (‰)
Mean ± SD
DO (mg/l)
Mean ± SD
Tds (mg/l)
Mean ± SD
Na (mg/l)
Mean ± SD
SC (µS/cm)
Mean± SD
A 29.46 ± 0.50 5.51 ± 0.31 0.27 ± 0.08 2.06 ± 1.02 394.37± 4.60 7.28 ± 3.18 792.67 ± 0.31
B 29.88± 0.49 7.92 ± 0.16 0.36 ± 0.29 3.38 ± 0.92 219.88 ± 1.77 17.24 ± 9.31 864.32 ± 94.02
C 30.14 ± 1.22 5.46 ± 0.38 0.24 ± 0.08 1.53 ± 0.08 604.55 ± 0.08 7.26 ± 3.06 508.02 ± 57.24
Table 4:Sodium concentration and physico‐chemical properties for the locations
Physical parameters and the concentration ofsodium in the water sink and its variation within thelocations are summarized in Table 4. During the studyperiod, the temperature of the locations doesn’t exhibitany critical changes on its surrounding; however thevalues were changed within 29.88 to 30.14 oC. Thefreshwater ecosystem processes like development,productivity, food web relationship, and interruptintegral decomposition rates (IPCC AR4 2007). On theother hand, the pH was changed 5.46 ± 0.38 forlocation C and 7.92 ± 0.16 for location B.
Similarly, the positive correlation among theconcentration of sodium and pH with higher (r2 =0.7817 and r2 = 0.8193) r2 values were observed forlocation A and the location C respectively It has clearlydescribed in the figure 4. But salinity, DO, SC and thesodium concentration values of this location such as0.36 ± 0.29‰, 3.38 ± 0.92 mg/l, 864.32 ± 94.02 mg/land 17.24 ± 9.31 mg/l also increase rather than theother locations.
M.C.A.M. Haniffa, R. Senthilnithy and K. R.R. MahanamaEffect of Sodium Concentration of Inland Water BodiesRelated to Paddy Cultivated Land in South Eastern Region

Proceedings of the Third International Symposium,SEUSL: 6-7 July 2013, Oluvil, Sri Lanka
[ 1 0 8 ]
All the locations were dynamically involved toreceiving the household wastewater, market andhospital effluent. The household activities such aslaundry detergents, soap, bleaches and bactericides,similarly other chemicals used on the body(toothpaste, make-up, powders) and in kitchen (tealeaves, oils, detergents and greases) were significantlycontributed to increase the sodium concentration tothis locations.
The locations were situated sink like water bodyand which were opened to the paddy field, when whichfilled by the waste water. From the nature of thelocations, the study was concluded that the locationssignificantly contributed to increase the SAR in thepaddy field.
Figure 4:The correlations between the concentration of sodium and the pH with square values of Pearson
product moment correlation coefficients for all locations.
Figure 5: The variation of sodium concentration with months for locations
Location A may have huge possibilities toreceiving the householder effluent than the otherlocations. Nevertheless, among the locations, locationB has shown that the detergents and the chemicalsmassively contributed to the sodium effect and thiseffect clearly described with all locations in the figure5. Highly contaminated chemicals including laundrydetergents and other household detergents weresubjected to this effect.
Calcium and Magnesium intake ability of thecrop massively disturbed by this sodium containingwastewater through ion exchange properties and whichwas don as a function of each component (Ca, Mg andNa) in soil samples. SAR and ionic concentrationshould also be affecting the diffusion type such as porediffusion and mass transfer diffusion of the soil. As aresult of long term wastewater practices to thelocations significantly affect the yield of paddycultivation.
References
Cole, G.A. 1994. Textbook of Limnology. 4th Edition.Waveland Press, Inc. Prospect Heights, IL. 426pp.
Hansen, M. J., N.P. Lester, and C.C. Krueger. 2010.Natural Lakes. In Inland Fisheries Management,3rd edition. pp. 449-500.
Heinz Center (The H. John Heinz III Center forScience, Economics and the Environment). 2008.The State of the Nations Ecosystems. Island Press,Washington, D.C.
IPCC. 2007. Climate Change 2007. Synthesis Report.Contribution of Working Groups I, II and III tothe Fourth Assessment Report of theIntergovernmental Panel on Climate Change(AR4). 104 pp.
Summerfelt, R.C. 1993. Lake and Reservoir HabitatManagement in C. C. Kohler and W.A Hubert,editors North America. Inland FisheriesManagement. American Fisheries Society,Bethesda, MD USA. 594 pp.
U.S. EPA (U.S. Environmental Protection Agency.2010. Freshwater Ecosystems. December 8,2010.02.
Willis, D.W., R.D. Lusk, and J.W. Slipke. 2010. FarmPonds and Small Impoundments. In InlandFisheries Management, 3rd edition. pp. 501-54.
[ 1 0 9 ]
M.C.A.M. Haniffa, R. Senthilnithy and K. R.R. MahanamaEffect of Sodium Concentration of Inland Water BodiesRelated to Paddy Cultivated Land in South Eastern Region