thingworx and azure iot hub reference benchmark
TRANSCRIPT

ThingWorx and Azure IoT Hub
Reference Benchmark Document Version 1.0.1
September 2020

1
Copyright © 2020 PTC Inc. and/or Its Subsidiary Companies. All Rights Reserved.
User and training guides and related documentation from PTC Inc. and its subsidiary companies (collectively
“PTC”) are subject to the copyright laws of the United States and other countries and are provided under a
license agreement that restricts copying, disclosure, and use of such documentation. PTC hereby grants to
the licensed software user the right to make copies in printed form of this documentation if provided on
software media, but only for internal/personal use and in accordance with the license agreement under
which the applicable software is licensed. Any copy made shall include the PTC copyright notice and any
other proprietary notice provided by PTC. Training materials may not be copied without the express written
consent of PTC. This documentation may not be disclosed, transferred, modified, or reduced to any form,
including electronic media, or transmitted or made publicly available by any means without the prior written
consent of PTC and no authorization is granted to make copies for such purposes.
Information described herein is furnished for general information only, is subject to change without notice,
and should not be construed as a warranty or commitment by PTC. PTC assumes no responsibility or liability
for any errors or inaccuracies that may appear in this document.
The software described in this document is provided under written license agreement, contains valuable
trade secrets and proprietary information, and is protected by the copyright laws of the United States and
other countries. It may not be copied or distributed in any form or medium, disclosed to third parties, or used
in any manner not provided for in the software licenses agreement except with written prior approval from
PTC.
UNAUTHORIZED USE OF SOFTWARE OR ITS DOCUMENTATION CAN RESULT IN CIVIL DAMAGES AND CRIMINAL
PROSECUTION. PTC regards software piracy as the crime it is, and we view offenders accordingly. We do not
tolerate the piracy of PTC software products, and we pursue (both civilly and criminally) those who do so
using all legal means available, including public and private surveillance resources. As part of these efforts,
PTC uses data monitoring and scouring technologies to obtain and transmit data on users of illegal copies of
our software. This data collection is not performed on users of legally licensed software from PTC and its
authorized distributors. If you are using an illegal copy of our software and do not consent to the collection
and transmission of such data (including to the United States), cease using the illegal version, and contact
PTC to obtain a legally licensed copy.
Important Copyright, Trademark, Patent, and Licensing Information: See the About Box, or copyright notice,
of your PTC software.
United States Governments Rights
PTC software products and software documentation are “commercial items” as that term is defined at 48
C.F.R. 2.101. Pursuant to Federal Acquisition Regulation (FAR) 12.212 (a)-(b) (Computer Software) (MAY 2014)
for civilian agencies or the Defense Federal Acquisition Regulation Supplement (DFARS) at 227.7202-1 (a)
(Policy) and 227.7202-3 (a) (Rights in commercial computer software or commercial computer software
documentation) (FEB 2014) for the Department of Defense, PTC software products and software
documentation are provided to the U.S. Government under the PTC commercial license agreement. Use,
duplication or disclosure by the U.S. Government is subject solely to the terms and conditions set forth in the
applicable PTC software license agreement.
PTC Inc., 121 Seaport Boulevard, Boston, MA 02210 USA

2
Document Revision History ............................................................................................................... 2
What is a Reference Benchmark? .................................................................................................. 3
Benchmark Scenario Overview....................................................................................................... 3
What is Microsoft Azure IoT Hub? .................................................................................................... 3
ThingWorx Azure IoT Hub Connector .......................................................................................... 4
Use-Case Overview ........................................................................................................................... 4
Edge Load ........................................................................................................................................... 5
User Load ............................................................................................................................................. 7
Additional Data Processing in ThingWorx Foundation ............................................................... 7
Implementation Architecture .......................................................................................................... 7
Azure IoT Hub Configuration ........................................................................................................ 8
Simulator for Devices & Messages .................................................................................................. 9
Simulation Parameters and KPIs .................................................................................................... 10
Soak Test ......................................................................................................................................... 10
Simulation Matrix 1 – Data Ingestion Every 180 seconds.......................................................... 11
Simulation Matrix 2 – Data Ingestion Every 90 Seconds ........................................................... 12
Simulation Matrix 3 – Data Ingestion Every 45 Seconds ........................................................... 13
Simulation Matrix 4 – Data Ingestion of 25 Properties Every 180 Seconds ............................ 14
Simulation Matrix 5 – Alerts CPU Utilization .................................................................................. 15
Recovery from ThingWorx Outage ............................................................................................... 15
Multiple Connection Server............................................................................................................ 16
Analysis and Conclusions................................................................................................................ 16
Document Revision History
Revision Date Version Description of Change
July 2020 1.0 Initial Version
September 2020 1.0.1 Fixed formatting issues
3
What is a Reference Benchmark?
As stated in previous benchmarks, a great way to evaluate how an IOT implementation will
perform is to compare it against a reference, helping to:
• Understand the results and limitations in a known reference scenario
• Identify what differences exist between the implementation and the reference
• Evaluate how those differences change the behavior of the system
The purpose of this document is to provide a known reference scenario that can be used
for these purposes and is targeted at a reader familiar with ThingWorx architecture and
implementations. The third in a series of documents, this furthers the IOT EDC’s goal of
providing a rich catalog of baselines, each which can be used to inform the scalability and
viability of different field implementations.
Benchmark Scenario Overview
The goal of this reference benchmark was to scale test a specific implementation
architecture using generic data ingestion scenarios. The implementation combined
ThingWorx Foundation and ThingWorx Azure IoT Hub Connector v.3.0.0 with the
Microsoft Azure IoT Hub.
The deployment architecture was tested with different edge workload configurations to
record the behavior and scalability limits of this specific architecture as the number of
edge devices or data properties is scaled upwards to increase the amount of data
ingestion.
While adjustments to the deployment architecture and configuration parameters can
typically solve many scale challenges, specific adjustments are intentionally not in
scope for this document. This is not a sizing nor a performance guide. The benchmark
goal is to establish a baseline reference for comparison and initial estimates. Modified
deployment architectures for other use-cases and/or protocols may be documented in
separate reference benchmark documents.
What is Microsoft Azure IoT Hub?
Microsoft Azure IoT Hub is a cloud-hosted solution backend that facilitates secure and
reliable communication between an IoT application such as ThingWorx and the devices
it manages. For more information about Azure IoT Hub, including pricing, see:
https://azure.microsoft.com/en-us/services/iot-hub/
Azure IoT Hub, when used in conjunction with ThingWorx, is an additional device
management layer between the Connection server(s) and remote devices.
The Microsoft Azure IoT Hub offering provides the following basic functions needed for
IoT devices:

4
• Reliable, bi-directional communication between edge devices and back-end
applications. The Service Level Agreement for IoT Hub is 99.9%.
• Multiple paths for telemetry messages, in addition to ThingWorx, can be
configured.
• Secure device communication, using per-device security credentials and access
control.
• Azure IoT Edge Device and Azure IoT Edge Device Module SDKs for Java, C, .NET
(C#), and Javascript (Node.js). The SDKs support sending messages to and
receiving messages from back-end applications.
• Optional data storage capabilities for incoming telemetry messages.
• Data retention of incoming telemetry messages for up to 7 days.
ThingWorx Azure IoT Hub Connector
The ThingWorx Azure Iot Hub Connector is a specialized implementation of the
ThingWorx Connection Server. It is used to connect ThingWorx Foundation to the Azure
IoT Hub. Edge devices can send and receive information from ThingWorx using the
Azure IoT Hub connected using this connector.
For more information about the ThingWorx Azure IoT Hub Connector v.3.0.0, see:
http://support.ptc.com/help/thingworx_scm_azure/r3.0/en/
Use-Case Overview
A healthy Remote Monitoring of Assets implementation balances parallel workloads of
ingesting edge data, rapid processing of any business logic (checking data conditions
or thresholds to generate alarms and events) and responding to data visualization
requests in user mashups.
In addition to handling constant workloads, the combined system must have enough
capacity in reserve to handle spikes in activity without causing data loss or significant
delays in event processing or user requests. Azure IoT Hub increases the availability,
data retention and overload handling of the data ingestion system. In some cases,
ThingWorx Foundation could have a smaller overall footprint as a result.
In this benchmark PTC checked the reliability and scalability of ingesting data through
the Azure IoT Hub into ThingWorx Azure IoT Hub Connector(s) and ThingWorx
Foundation. The resulting Writes Per Second measurements from various data loads
can be used as a starting point for estimating the initial size of the ThingWorx Foundation
server and ThingWorx Azure IoT Hub Connectors, but such estimates must be further
refined, modeled and tested if extensive business logic and/or data visualization is
required.

5
The criteria for a “successful” test of data ingestion was arbitrarily lowered to 60%
Average CPU Utilization and 85% Maximum CPU Utilization for ThingWorx Foundation, in
order to allow for additional processing to be applied outside of data ingestion. In most
circumstances, the unused CPU resources would be enough to allow for typical user
loads and/or data processing (subscriptions, alerts, and events).
In addition to benchmark testing of data ingestion through the Azure IoT Hub, further
testing explored additional scenarios, such as load balancing between Azure IoT Hub
and multiple ThingWorx Azure Iot Hub Connectors, downtime and recovery of
ThingWorx components, and throttling of incoming data due to exceeding Azure IoT
Hub subscription limits.
Edge Load
The target edge configuration for this scenario was 60,000 assets, each with 25
changed properties and a 3-minute (180 second) sampling rate (MQTT message rate).
These assets were created and simulated using Azure IoT SDK and ThingWorx RESTful
APIs.
Once the correct implementation architecture was identified for this target edge, a
total of 39 edge configurations were evaluated by varying the number of assets,
properties, transmission frequency and alerts, as indicated in the following tables:
Number of Things ( T )
Properties per Thing ( P )
Frequency ( F )
5,000 50 45 seconds
15,000 100 90 seconds
30,000 200 180 seconds Table 1: Data Ingestion Input Variations for Matrix 1,2,3

6
Number of Things
(T)
Alerts Properties per Thing
(P)
Frequency
(F)
30,000 *0
*25 *180
seconds
*60,000 5
10
90,000 0
100,000 Table 2: Alert-based Input Variations for Matrix 4-5
Note: Asterisk (*) indicates target edge configuration used for deployment sizing
This variance created scenarios where the performance of similar edge data volumes
can be compared to see how performance changes.
For example, five scenarios result in the same expected Writes Per Second (WPS) from
the Edge:
Things ( T )
Properties ( P )
Frequency ( F )
Series Count ( T × P )
Expected WPS ( T × P ) ÷ F
15,000 50 45 sec 750 K 16,667
15,000 100 90 sec 1.5 M 16,667
15,000 200 180 sec 3.0 M 16,667
30,000 50 90 sec 1.5 M 16,667
30,000 100 180 sec 3.0 M 16,667 Table 3: Configurations with Similar Expected WPS
All properties designated (25, 50, 100, 200) within each test were changed during each
update period.
Note that the 100 and 200 property cases are extremely large and unlikely to occur in
typical implementations. These were used to stress test the system. Smaller property sets
with shorter update intervals (higher frequency) are more likely in real-world scenarios.

7
User Load
This benchmark did not simulate user load. Depending on future data collected about
customer implementations of these combined systems, PTC may add a user load to
later versions of this benchmark.
In most ThingWorx sizing guide scenarios, PTC simulates a user workload that either views
historical device data for human analysis and/or responds manually to a logic-triggered
alarm. Note that there are many other possible user actions and custom mashups in
ThingWorx; these can have greatly varying data loads and response times. An in-depth
discussion of modeling Data Visualization is featured in the ThingWorx Platform Sizing
Guide(s).
In the preliminary version of this benchmark the primary focus was not on simulating user
activity, but rather on how the Azure IoT Hub’s capabilities modify and/or enhanced
the data ingestion and device management capabilities of ThingWorx. In most typical
remote monitoring scenarios, most of the ThingWorx resource utilization is generated by
data ingestion rather than visualization or business logic.
Additional Data Processing in ThingWorx Foundation
To measure the effect of simple business logic in ThingWorx, basic alerting for 5 and 10
properties was used in several of the 25-property tests to allow for some CPU utilization
comparison versus a pure data ingestion workload. These results are outlined in Matrix 5.
For more information about business logic strategies and optimizations for performance
of the overall system, see the PTC ThingWorx Help Center and/or the ThingWorx SCP
Remote Monitoring of Assets Benchmark.
Implementation Architecture
The following deployment model was used for this simulation, leveraging Microsoft
Azure and based on the size needed for the target edge configuration (60,000 assets,
25 properties per asset, 180 second transmission frequency) and data ingestion rates.
Due to compatibility requirements for the ThingWorx Azure IoT Hub Connector v.3.0.0,
this simulation was performed using ThingWorx Platform version 8.5.4, PostgreSQL 9.5.17
and InfluxDB 1.7.

8
Figure 1 - Architecture diagram for this simulation.
Azure IoT Hub Configuration
The benchmark utilized an S2 Standard Tier edition of the Azure IoT Hub. One or more
IoT Hub “units” were allocated as needed in order to accomplish each test based on
the predicted number of messages, size of messages, and number of devices.
In addition to the choice of pricing tier, customers also select the number of partitions
when creating the hub. Values typically range from 4 (default) to 32. In this benchmark,
we selected 8 partitions in order to emulate a typical implementation while maintaining
flexibility, if needed, as the number of devices scaled up. Any failures traced back to
the Azure IoT Hub element would have resulted in recreating the hub using different
partition sizes as needed.

9
Note that the number of partitions cannot be changed after creating an Azure IoT Hub,
but the pricing tier (S1, S2, S3) and number of units can be modified after creation.
For more details, see: https://docs.microsoft.com/en-us/azure/iot-hub/iot-hub-scaling
Simulator for Devices & Messages
The simulator written for this benchmark had several primary functions:
• Provision matching devices/things in Azure IoT Hub and ThingWorx Foundation.
The devices were defined with a configurable number of properties of various
types (Boolean, String, Number, Integer) and value ranges.
• Generate MQTT payload of json objects that update a configurable number of
property updates.
• Delete devices from both servers.
• Update device connection SaS tokens when needed.
The simulator controlled the number of connected devices, the number of properties
being updated, the property value ranges, and the sampling rate at which new
payloads occurred. At higher device counts, network limitations required the simulation
to be split between multiple simulators on several hosts to load the system.
Note that there are Demo Applications available and documented in the ThingWorx
Azure IoT Hub Connector Help Center. However, these demo apps were not designed
with controls and provisioning to scale up to the range of values selected for this
benchmark.
10
Simulation Parameters and KPIs
To check the system performance and reliability, the following KPIs were monitored:
D2C (hub) Cxn Server Ingestion Processing
Primary
KPIs
Total Messages
Used
Telemetry
Messages Sent
Connection
CPU Utilization
Connection
Memory
Utilization
Value Stream
WPS
InfluxDB CPU
Utilization
Foundation
CPU/Mem
Utilization
Alert Rate
Secondary
KPIs
Connected
Devices
Number of
Throttling Errors
Cxn-to-IoT Log
metrics
Log errors
Value Stream
Queue Size
Alert Queue
Size
The simulations consisted of one-hour executions of each edge configuration.
Soak Test
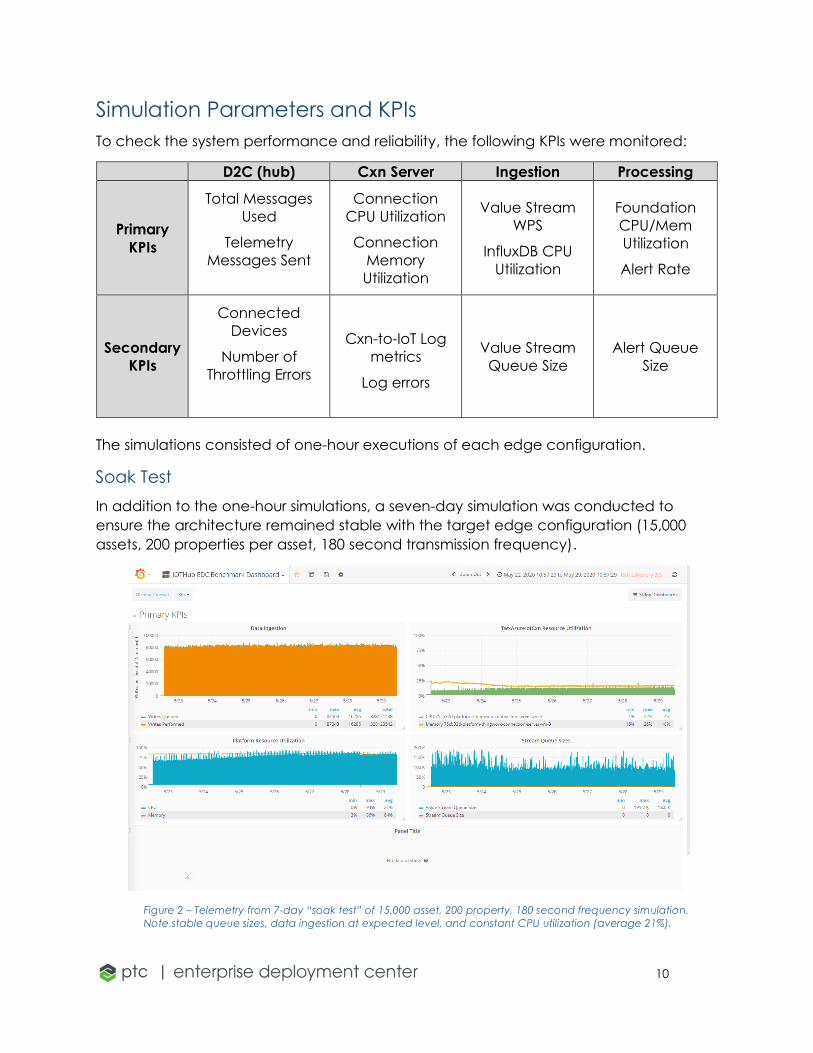
In addition to the one-hour simulations, a seven-day simulation was conducted to
ensure the architecture remained stable with the target edge configuration (15,000
assets, 200 properties per asset, 180 second transmission frequency).
Figure 2 – Telemetry from 7-day “soak test” of 15,000 asset, 200 property, 180 second frequency simulation.
Note stable queue sizes, data ingestion at expected level, and constant CPU utilization (average 21%).

11
Simulation Matrix 1 – Data Ingestion Every 180 seconds
180s Frequency (F)
Number of Things (T)
5,000 15,000 30,000
Fre
qu
en
cy
(F)
Pro
pe
rtie
s p
er
Thin
g (
P) 5
0
WPS: 1,377
CPU Min/Avg/Max:
5% / 7% / 14%
Memory Avg:
68%
WPS: 4,133
CPU Min/Avg/Max:
5% / 10% / 26%
Memory Avg:
80%
WPS: 8,264
CPU Min/Avg/Max:
5% / 14% / 42%
Memory Avg:
83%
10
0
WPS: 2,732
CPU Min/Avg/Max:
5% / 8% / 24%
Memory Avg:
79%
WPS: 8,664
CPU Min/Avg/Max:
5% / 15% / 49%
Memory Avg:
81%
WPS: 16,722
CPU Min/Avg/Max:
5% / 23% / 67%
Memory Avg:
82%
20
0
WPS: 5,400
CPU Min/Avg/Max:
5% / 11% / 44%
Memory Avg:
80%
WPS: 16,419
CPU Min/Avg/Max:
5% / 24% / 80%
Memory Avg:
82%
WPS: 32,957
CPU Min/Avg/Max:
5% / 42% / 87%
Memory Avg:
83%
Analysis
The Foundation architecture is oversized for scenarios below 8,700 writes-per-second (in
blue above). A smaller Azure VM size for the platform (D8s_v3) may work, and InfluxDB
may not be needed if
PostgreSQL is resized
to compensate.
Both 16,667 write-per-
second scenarios
completed (in green
above) with peak
CPU utilization still at
80% or below.
The 32,957 write-per-
second run (in orange
above) has a high
maximum CPU
utilization but the
average still leaves
some room for alerts
and/or other business
logic.
Figure 3 – These charts are from the 30,000 asset, 200 property scenario. Note the CPU
Utilization spikes at 180s intervals and the initial stabilization of a herd of streams incoming from
the Azure IoT Hub.

12
Simulation Matrix 2 – Data Ingestion Every 90 Seconds
90s Frequency (F)
Number of Things (T)
5,000 15,000 30,000
Fre
qu
en
cy
(F)
Pro
pe
rtie
s p
er
Thin
g (
P) 5
0
WPS: 2,548
CPU Min/Avg/Max:
5% / 8% / 15%
Memory Avg:
83%
WPS: 8,058
CPU Min/Avg/Max:
5% / 13% / 42%
Memory Avg:
83%
WPS: 15,909
CPU Min/Avg/Max:
5% / 23% / 50%
Memory Avg:
83%
10
0
WPS: 5,510
CPU Min/Avg/Max:
5% / 11% / 27%
Memory Avg:
83%
WPS: 16,585
CPU Min/Avg/Max:
5% / 23% / 84%
Memory Avg:
83%
WPS: 31489
CPU Min/Avg/Max:
5% / 37% / 68%
Memory Avg:
84%
20
0
WPS: 10,687
CPU Min/Avg/Max:
5% / 18% / 41%
Memory Avg:
83%
WPS: 32,056
CPU Min/Avg/Max:
5% / 41% / 94%
Memory Avg:
83%
WPS: 54,066
CPU Min/Avg/Max:
6% / 58% / 95%
Memory Avg:
84%
Analysis
Similar to the 180-second simulations, the scenarios below 10,700 writes-per-second
could run on the next smallest Azure VM size for the platform (D8s_v3) and may not
require InfluxDB if PostgreSQL is resized to compensate.
The scenarios between 10,700 WPS and 31,500 WPS ran correctly on the current Azure
VM size, with some room for additional business logic.
For the 32,056 WPS and 54,066 WPS cases, the maximum CPU utilization exceeded 90%,
indicating no additional room for alerts and/or other business logic.
Note there was no data loss in these scenarios.
13
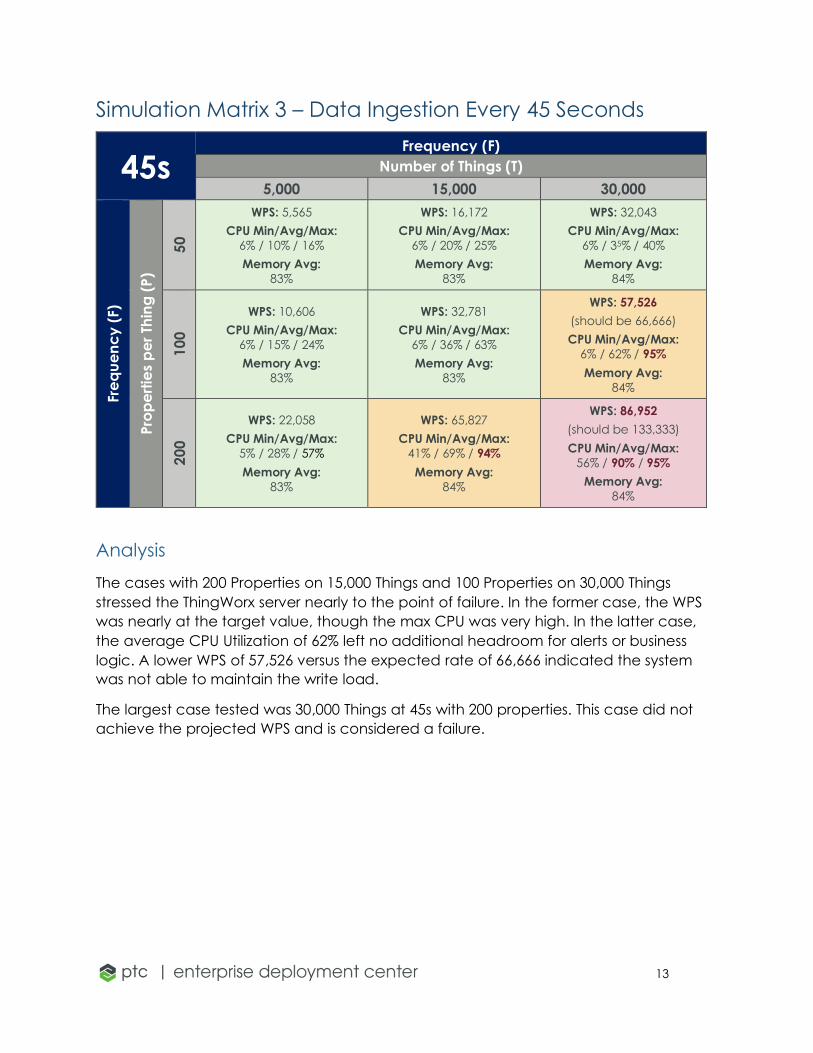
Simulation Matrix 3 – Data Ingestion Every 45 Seconds
45s Frequency (F)
Number of Things (T)
5,000 15,000 30,000
Fre
qu
en
cy
(F)
Pro
pe
rtie
s p
er
Thin
g (
P)
50
WPS: 5,565
CPU Min/Avg/Max:
6% / 10% / 16%
Memory Avg:
83%
WPS: 16,172
CPU Min/Avg/Max:
6% / 20% / 25%
Memory Avg:
83%
WPS: 32,043
CPU Min/Avg/Max:
6% / 35% / 40%
Memory Avg:
84%
10
0
WPS: 10,606
CPU Min/Avg/Max:
6% / 15% / 24%
Memory Avg:
83%
WPS: 32,781
CPU Min/Avg/Max:
6% / 36% / 63%
Memory Avg:
83%
WPS: 57,526
(should be 66,666)
CPU Min/Avg/Max:
6% / 62% / 95%
Memory Avg:
84%
20
0
WPS: 22,058
CPU Min/Avg/Max:
5% / 28% / 57%
Memory Avg:
83%
WPS: 65,827
CPU Min/Avg/Max:
41% / 69% / 94%
Memory Avg:
84%
WPS: 86,952
(should be 133,333)
CPU Min/Avg/Max:
56% / 90% / 95%
Memory Avg:
84%
Analysis
The cases with 200 Properties on 15,000 Things and 100 Properties on 30,000 Things
stressed the ThingWorx server nearly to the point of failure. In the former case, the WPS
was nearly at the target value, though the max CPU was very high. In the latter case,
the average CPU Utilization of 62% left no additional headroom for alerts or business
logic. A lower WPS of 57,526 versus the expected rate of 66,666 indicated the system
was not able to maintain the write load.
The largest case tested was 30,000 Things at 45s with 200 properties. This case did not
achieve the projected WPS and is considered a failure.
14
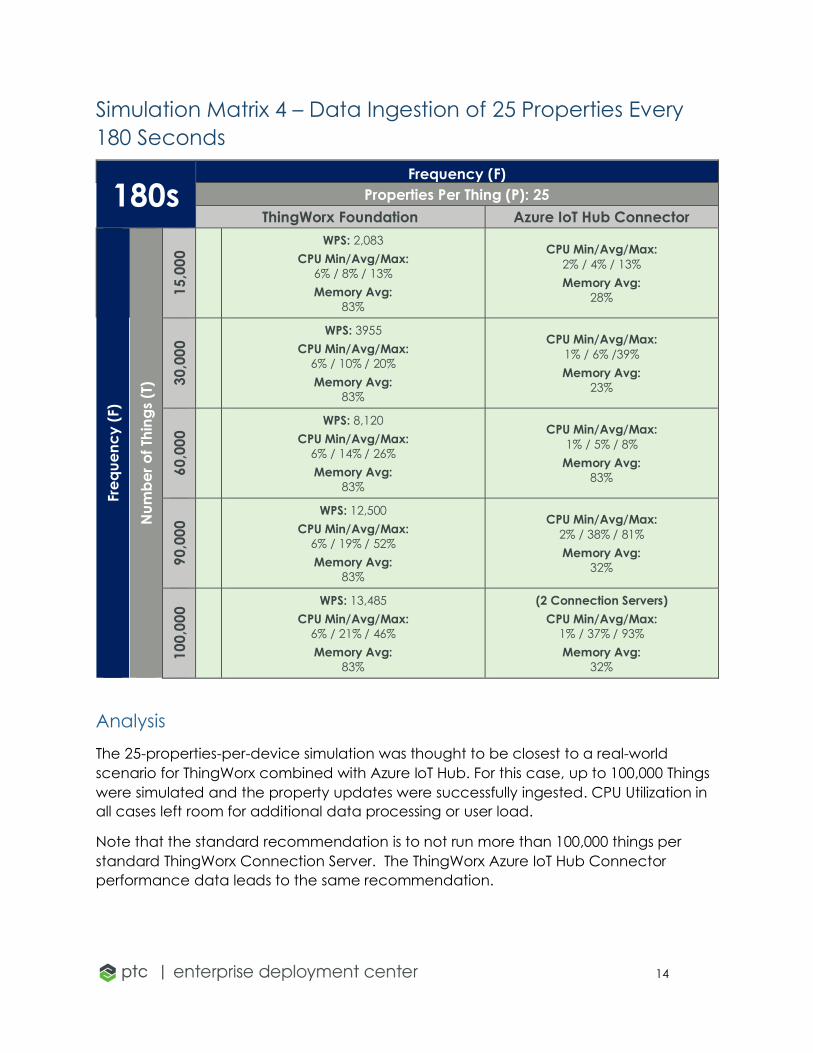
Simulation Matrix 4 – Data Ingestion of 25 Properties Every
180 Seconds
180s Frequency (F)
Properties Per Thing (P): 25
ThingWorx Foundation Azure IoT Hub Connector
Fre
qu
en
cy
(F)
Nu
mb
er
of
Thin
gs
(T)
15
,00
0
WPS: 2,083
CPU Min/Avg/Max:
6% / 8% / 13%
Memory Avg:
83%
CPU Min/Avg/Max:
2% / 4% / 13%
Memory Avg:
28%
30
,00
0
WPS: 3955
CPU Min/Avg/Max:
6% / 10% / 20%
Memory Avg:
83%
CPU Min/Avg/Max:
1% / 6% /39%
Memory Avg:
23%
60
,00
0
WPS: 8,120
CPU Min/Avg/Max:
6% / 14% / 26%
Memory Avg:
83%
CPU Min/Avg/Max:
1% / 5% / 8%
Memory Avg:
83%
90
,00
0
WPS: 12,500
CPU Min/Avg/Max:
6% / 19% / 52%
Memory Avg:
83%
CPU Min/Avg/Max:
2% / 38% / 81%
Memory Avg:
32%
10
0,0
00
WPS: 13,485
CPU Min/Avg/Max:
6% / 21% / 46%
Memory Avg:
83%
(2 Connection Servers)
CPU Min/Avg/Max:
1% / 37% / 93%
Memory Avg:
32%
Analysis
The 25-properties-per-device simulation was thought to be closest to a real-world
scenario for ThingWorx combined with Azure IoT Hub. For this case, up to 100,000 Things
were simulated and the property updates were successfully ingested. CPU Utilization in
all cases left room for additional data processing or user load.
Note that the standard recommendation is to not run more than 100,000 things per
standard ThingWorx Connection Server. The ThingWorx Azure IoT Hub Connector
performance data leads to the same recommendation.
15
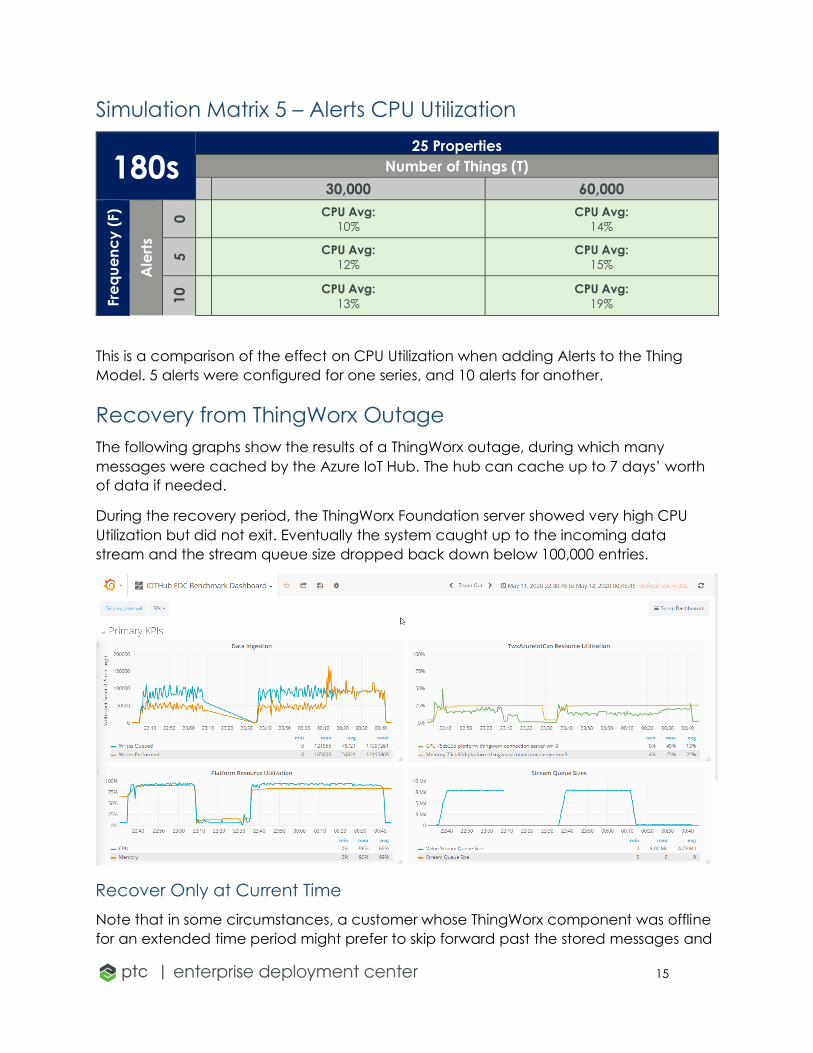
Simulation Matrix 5 – Alerts CPU Utilization
180s 25 Properties
Number of Things (T) 30,000 60,000
Fre
qu
en
cy
(F)
Ale
rts
0 CPU Avg:
10%
CPU Avg:
14%
5 CPU Avg:
12%
CPU Avg:
15%
10
CPU Avg:
13%
CPU Avg:
19%
This is a comparison of the effect on CPU Utilization when adding Alerts to the Thing
Model. 5 alerts were configured for one series, and 10 alerts for another.
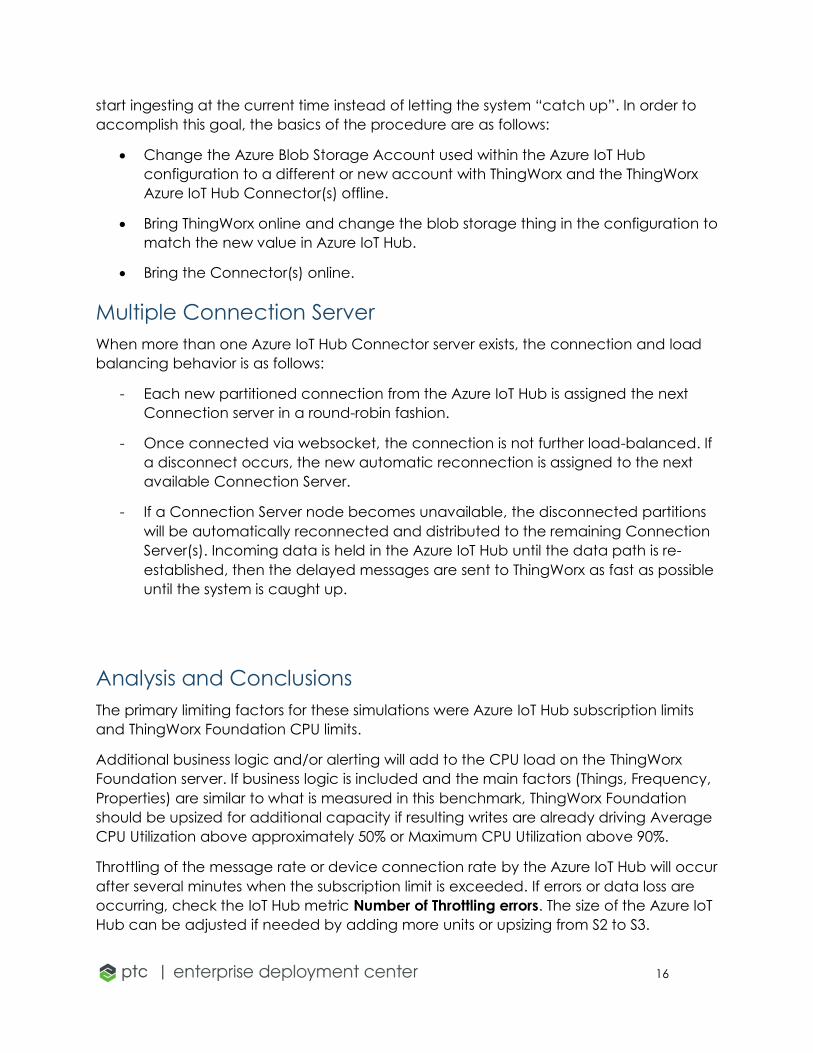
Recovery from ThingWorx Outage
The following graphs show the results of a ThingWorx outage, during which many
messages were cached by the Azure IoT Hub. The hub can cache up to 7 days’ worth
of data if needed.
During the recovery period, the ThingWorx Foundation server showed very high CPU
Utilization but did not exit. Eventually the system caught up to the incoming data
stream and the stream queue size dropped back down below 100,000 entries.
Recover Only at Current Time
Note that in some circumstances, a customer whose ThingWorx component was offline
for an extended time period might prefer to skip forward past the stored messages and
16
start ingesting at the current time instead of letting the system “catch up”. In order to
accomplish this goal, the basics of the procedure are as follows:
• Change the Azure Blob Storage Account used within the Azure IoT Hub
configuration to a different or new account with ThingWorx and the ThingWorx
Azure IoT Hub Connector(s) offline.
• Bring ThingWorx online and change the blob storage thing in the configuration to
match the new value in Azure IoT Hub.
• Bring the Connector(s) online.
Multiple Connection Server
When more than one Azure IoT Hub Connector server exists, the connection and load
balancing behavior is as follows:
- Each new partitioned connection from the Azure IoT Hub is assigned the next
Connection server in a round-robin fashion.
- Once connected via websocket, the connection is not further load-balanced. If
a disconnect occurs, the new automatic reconnection is assigned to the next
available Connection Server.
- If a Connection Server node becomes unavailable, the disconnected partitions
will be automatically reconnected and distributed to the remaining Connection
Server(s). Incoming data is held in the Azure IoT Hub until the data path is re-
established, then the delayed messages are sent to ThingWorx as fast as possible
until the system is caught up.
Analysis and Conclusions
The primary limiting factors for these simulations were Azure IoT Hub subscription limits
and ThingWorx Foundation CPU limits.
Additional business logic and/or alerting will add to the CPU load on the ThingWorx
Foundation server. If business logic is included and the main factors (Things, Frequency,
Properties) are similar to what is measured in this benchmark, ThingWorx Foundation
should be upsized for additional capacity if resulting writes are already driving Average
CPU Utilization above approximately 50% or Maximum CPU Utilization above 90%.
Throttling of the message rate or device connection rate by the Azure IoT Hub will occur
after several minutes when the subscription limit is exceeded. If errors or data loss are
occurring, check the IoT Hub metric Number of Throttling errors. The size of the Azure IoT
Hub can be adjusted if needed by adding more units or upsizing from S2 to S3.

17
Increasing the frequency of updates or the number of properties per device will cause
more significant increases in CPU processing than increasing the number of devices.
The 7-day soak test showed that the Azure IoT Hub reliably maintains connections and
ingests data to pass along to ThingWorx. The test stability compared favorably to
Remote Monitoring of Assets Benchmark soak test.
Testing showed that Azure IoT Hub preserves data even when other components like
the Connection server or ThingWorx become non-responsive for short periods.
Future refinements to this benchmark may include certain business logic scenarios,
Cloud-to-Device updates, file transfers, and other message protocols like OPC-UA.
Additional References
ThingWorx Platform 9.0 Sizing Guide:
https://www.ptc.com/en/support/refdoc/ThingWorx_Platform/9.0/ThingWorx%20Platfor
m%209%20Sizing%20Guide
ThingWorx SCP Remote Monitoring of Assets Reference Benchmark:
https://community.ptc.com/t5/IoT-Tech-Tips/IOT-EDC-Reference-Benchmark-Remote-
Monitoring-of-Assets/m-p/641031
Azure IoT Hub: https://azure.microsoft.com/en-us/services/iot-hub/
Azure IoT Hub communication protocols: https://docs.microsoft.com/en-us/azure/iot-
hub/iot-hub-devguide-protocols