third quarter 2015 - alfa laval laval ab (publ) interim report july 1 – september 30, 2015 page 2...
TRANSCRIPT
Third quarter 2015
Alfa Laval AB (publ) PO Box 73 SE-221 00 Lund Sweden Corporate registration number: 556587-8054
Visiting address: Rudeboksvägen 1 Phone: + 46 46 36 65 00 Website: www.alfalaval.com
For more information, please contact: Gabriella Grotte, Investor Relations Manager Phone: +46 46 36 74 82, Mobile: +46 709 78 74 82, E-mail: [email protected]
Summary
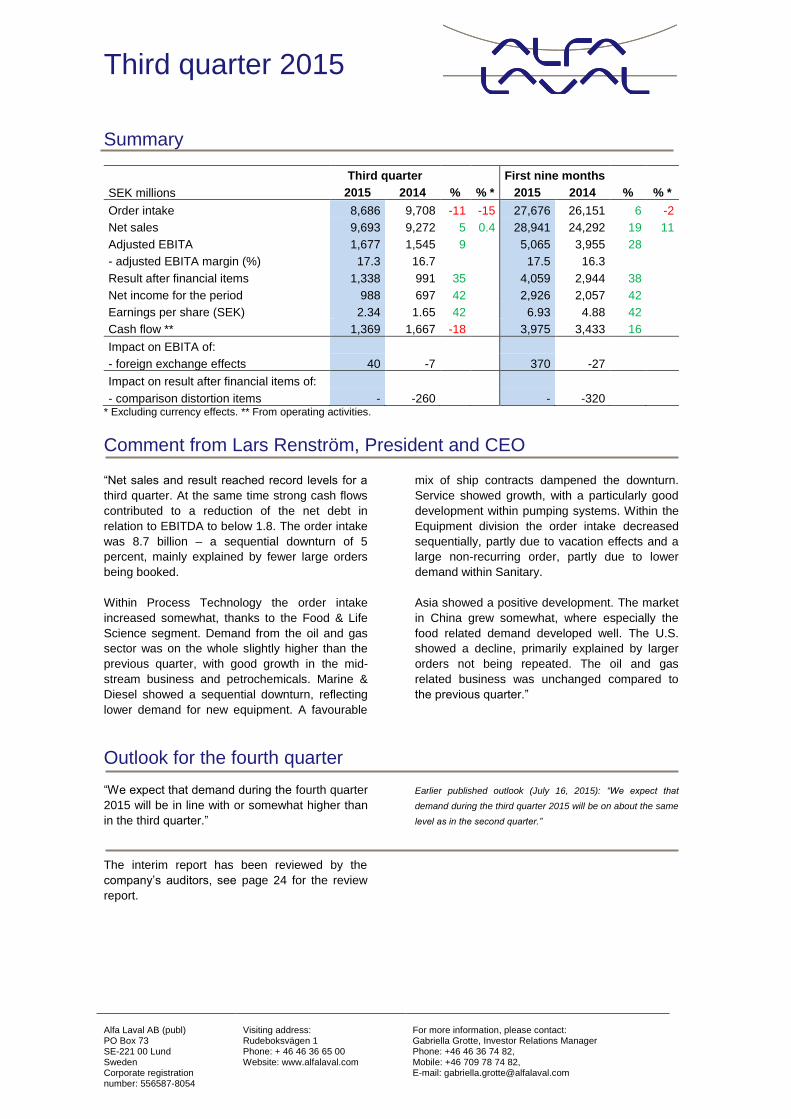
Third quarter First nine months
SEK millions 2015 2014 % % * 2015 2014 % % *
Order intake 8,686 9,708 -11 -15 27,676 26,151 6 -2
Net sales 9,693 9,272 5 0.4 28,941 24,292 19 11
Adjusted EBITA 1,677 1,545 9 5,065 3,955 28 - adjusted EBITA margin (%) 17.3 16.7
17.5 16.3
Result after financial items 1,338 991 35 4,059 2,944 38 Net income for the period 988 697 42 2,926 2,057 42 Earnings per share (SEK) 2.34 1.65 42 6.93 4.88 42 Cash flow ** 1,369 1,667 -18 3,975 3,433 16
Impact on EBITA of:
- foreign exchange effects 40 -7 370 -27
Impact on result after financial items of:
- comparison distortion items - -260 - -320
* Excluding currency effects. ** From operating activities.
Comment from Lars Renström, President and CEO “Net sales and result reached record levels for a
third quarter. At the same time strong cash flows
contributed to a reduction of the net debt in
relation to EBITDA to below 1.8. The order intake
was 8.7 billion – a sequential downturn of 5
percent, mainly explained by fewer large orders
being booked.
Within Process Technology the order intake
increased somewhat, thanks to the Food & Life
Science segment. Demand from the oil and gas
sector was on the whole slightly higher than the
previous quarter, with good growth in the mid-
stream business and petrochemicals. Marine &
Diesel showed a sequential downturn, reflecting
lower demand for new equipment. A favourable
mix of ship contracts dampened the downturn.
Service showed growth, with a particularly good
development within pumping systems. Within the
Equipment division the order intake decreased
sequentially, partly due to vacation effects and a
large non-recurring order, partly due to lower
demand within Sanitary.
Asia showed a positive development. The market
in China grew somewhat, where especially the
food related demand developed well. The U.S.
showed a decline, primarily explained by larger
orders not being repeated. The oil and gas
related business was unchanged compared to
the previous quarter.”
Outlook for the fourth quarter
“We expect that demand during the fourth quarter
2015 will be in line with or somewhat higher than
in the third quarter.”
Earlier published outlook (July 16, 2015): “We expect that
demand during the third quarter 2015 will be on about the same
level as in the second quarter.”
The interim report has been reviewed by the
company’s auditors, see page 24 for the review
report.

Alfa Laval AB (publ) Interim report July 1 – September 30, 2015
Page 2 (24)
Management’s discussion and analysis
Important events during the third quarter During the third quarter 2015 Alfa Laval received
large orders1)
for SEK 280 (780) million:
An order to supply Alfa Laval Aalborg boiler
modules for an FPSO vessel to be built in
China. The order, booked in the Marine &
Offshore Systems segment, has a value of
approximately SEK 90 million and delivery is
scheduled for 2016.
An order from a leading multinational brewery
group, to supply a process solution for one of
its plants in India. The order is booked in the
Food Technology & Life Science segment,
has a value of approximately SEK 60 million
and delivery is scheduled for 2016.
An order to supply two process lines for edible
oil refining in China. The order is booked in
the Food Technology & Life Science segment
and has a value of approximately SEK 75
million. Delivery is scheduled for 2016.
An order in Italy to supply various pieces of
equipment to a new petrochemical plant in
Slovakia. The order, booked in the Energy &
Process segment, has a value of
approximately SEK 55 million and delivery is
scheduled for 2016.
In addition it can be noted that:
Alfa Laval has been appointed the preferred
supplier of ballast water treatment systems by
a major ship-owner in Asia. The agreement is
expected to generate orders worth approxi-
mately SEK 70 million until March 2016.
Under the agreement, the Alfa Laval Pure-
Ballast systems, developed in cooperation
with Wallenius Water, will be retrofitted on-
board 33 vessels. Half of the order value will
be booked this year and half in the first
quarter of 2016. Deliveries will be spread out
over three years, starting 2016.
Order intake
Orders received has amounted to SEK 8,686
(9,708) million for the third quarter and to SEK
27,676 (26,151) million for the first nine months
2015. Compared with earlier periods the
development per quarter has been as follows.
0
5,000
10,000
15,000
20,000
25,000
30,000
35,000
40,000
0
2,000
4,000
6,000
8,000
10,000
12,000
Q412 Q113 Q213 Q313 Q413 Q114 Q214 Q314 Q414 Q115 Q215 Q315
SEK millions12 months
SEK millionsquarter Orders received
Order intake per quarter Orders received rolling 12 months value
-5%
+1
%
+4
%
+1
6%
+5
%
+1
8%
+2
6%
+2
2%
-7%
% = change by quarter compared to corresponding period last year, at constant rates
+1
1%
-15
%
+1
9%
1. Orders with a value over EUR 5 million.

Alfa Laval AB (publ) Interim report July 1 – September 30, 2015
Page 3 (24)
The change compared with the corresponding
periods last year and the previous quarter can be
split into:
Consolidated Order bridge
Change
Order intake Excluding currency effects After currency effects Order intake
Prior Structural Organic
Currency Current
periods change
2) development
3) Total effects Total periods
SEK millions (%) (%) (%) (%) (%) SEK millions
Q3 2015/2014 9,708 0.2 -15.0 -14.8 4.3 -10.5 8,686
Q3/Q2 2015 9,146 0.2 -3.7 -3.5 -1.5 -5.0 8,686
YTD 2015/2014 26,151 7.2 -9.5 -2.3 8.1 5.8 27,676
The organic development during the third quarter
according to the above table includes positive
effects from the revaluation of the order backlog
with about 2 percent, mostly due to the
appreciation of the USD in relation to NOK.
Orders received from Service4 constituted 30.8
(25.6) percent of the Group's total orders
received during the third quarter and 28.7 (26.4)
percent during the first nine months 2015.
Excluding currency effects, the order intake for
Service increased by 1.4 percent during the third
quarter 2015 compared to the corresponding
quarter last year (the corresponding organic
development was an increase by 0.7 percent)
and increased with 2.7 percent compared to the
previous quarter (the corresponding organic
development was an increase by 2.0 percent).
For the first nine months 2015 the increase was
5.1 percent compared to the corresponding
period last year (the corresponding organic
development was a decrease by 1.3 percent).
Order backlog
6,672 7,371 8,014
8,399
15,029 14,103
0
10
20
30
40
50
60
70
80
0
3,000
6,000
9,000
12,000
15,000
18,000
21,000
24,000
27,000
2013 2014 2015
%SEK millions Order backlog September 30
For delivery nextyear or later
For delivery duringrest of current year
Order backlog's partof last 12 months'
invoicing (proformafor Frank Mohn)
15,071
22,400 22,117
Excluding currency effects and adjusted for
acquisition of businesses the order backlog was
7.6 percent smaller than the order backlog at
September 30, 2014 and 6.4 percent smaller than
the order backlog at the end of 2014.
2. Acquired businesses are: K-Bar Parts LLC (renamed to Alfa Laval Kathabar Inc) in the US at July 31, 2015, an
aftermarket company specialized in separation technology at July 3, 2015, CorHex Corp at November 4, 2014 and Frank Mohn AS at May 22, 2014.
3. Change excluding acquisition of businesses. 4. Parts and service.

Alfa Laval AB (publ) Interim report July 1 – September 30, 2015
Page 4 (24)
Net sales Net invoicing was SEK 9,693 (9,272) million for
the third quarter and SEK 28,941 (24,292) million
for the first nine months 2015. The change
compared with the corresponding periods last
year and the previous quarter can be split into:
Consolidated Sales bridge
Change
Net sales Excluding currency effects After currency effects Net sales
Prior Structural Organic
Currency Current
periods change development Total effects Total periods
SEK millions (%) (%) (%) (%) (%) SEK millions
Q3 2015/2014 9,272 0.2 0.2 0.4 4.1 4.5 9,693
Q3/Q2 2015 10,177 0.2 -4.1 -3.9 -0.9 -4.8 9,693
YTD 2015/2014 24,292 10.9 -0.1 10.8 8.3 19.1 28,941
Net invoicing relating to Service constituted 26.1
(26.4) percent of the Group's total net invoicing in
the third quarter and 26.5 (27.5) percent in the
first nine months 2015.
Excluding currency effects, the net invoicing for
Service decreased by 2.8 percent during the third
quarter 2015 compared to the corresponding
quarter last year (the corresponding organic
development was a decrease by 3.4 percent) and
decreased with 2.9 percent compared to the
previous quarter (the corresponding organic
development was a decrease by 3.5 percent). For
the first nine months 2015 the increase was 4.6
percent compared to the corresponding period
last year (the corresponding organic development
was a decrease by 0.1 percent).
Alfa Laval AB (publ) Interim report July 1 – September 30, 2015
Page 5 (24)
Income
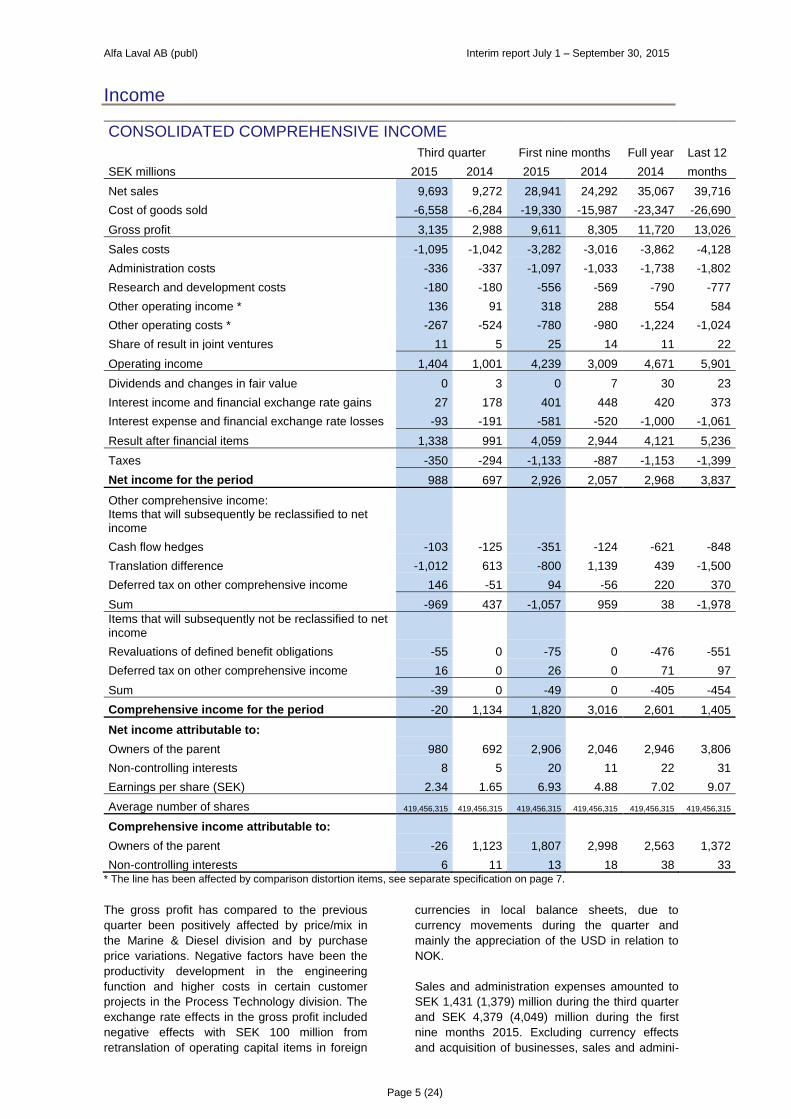
CONSOLIDATED COMPREHENSIVE INCOME
Third quarter First nine months Full year Last 12
SEK millions 2015 2014 2015 2014 2014 months
Net sales 9,693 9,272 28,941 24,292 35,067 39,716
Cost of goods sold -6,558 -6,284 -19,330 -15,987 -23,347 -26,690
Gross profit 3,135 2,988 9,611 8,305 11,720 13,026
Sales costs -1,095 -1,042 -3,282 -3,016 -3,862 -4,128
Administration costs -336 -337 -1,097 -1,033 -1,738 -1,802
Research and development costs -180 -180 -556 -569 -790 -777
Other operating income * 136 91 318 288 554 584
Other operating costs * -267 -524 -780 -980 -1,224 -1,024
Share of result in joint ventures 11 5 25 14 11 22
Operating income 1,404 1,001 4,239 3,009 4,671 5,901
Dividends and changes in fair value 0 3 0 7 30 23
Interest income and financial exchange rate gains 27 178 401 448 420 373
Interest expense and financial exchange rate losses -93 -191 -581 -520 -1,000 -1,061
Result after financial items 1,338 991 4,059 2,944 4,121 5,236
Taxes -350 -294 -1,133 -887 -1,153 -1,399
Net income for the period 988 697 2,926 2,057 2,968 3,837
Other comprehensive income:
Items that will subsequently be reclassified to net
income
Cash flow hedges -103 -125 -351 -124 -621 -848
Translation difference -1,012 613 -800 1,139 439 -1,500
Deferred tax on other comprehensive income 146 -51 94 -56 220 370
Sum -969 437 -1,057 959 38 -1,978
Items that will subsequently not be reclassified to net income
Revaluations of defined benefit obligations -55 0 -75 0 -476 -551
Deferred tax on other comprehensive income 16 0 26 0 71 97
Sum -39 0 -49 0 -405 -454
Comprehensive income for the period -20 1,134 1,820 3,016 2,601 1,405
Net income attributable to:
Owners of the parent 980 692 2,906 2,046 2,946 3,806
Non-controlling interests 8 5 20 11 22 31
Earnings per share (SEK) 2.34 1.65 6.93 4.88 7.02 9.07
Average number of shares 419,456,315 419,456,315 419,456,315 419,456,315 419,456,315 419,456,315
Comprehensive income attributable to:
Owners of the parent -26 1,123 1,807 2,998 2,563 1,372
Non-controlling interests 6 11 13 18 38 33 * The line has been affected by comparison distortion items, see separate specification on page 7.
The gross profit has compared to the previous
quarter been positively affected by price/mix in
the Marine & Diesel division and by purchase
price variations. Negative factors have been the
productivity development in the engineering
function and higher costs in certain customer
projects in the Process Technology division. The
exchange rate effects in the gross profit included
negative effects with SEK 100 million from
retranslation of operating capital items in foreign
currencies in local balance sheets, due to
currency movements during the quarter and
mainly the appreciation of the USD in relation to
NOK.
Sales and administration expenses amounted to
SEK 1,431 (1,379) million during the third quarter
and SEK 4,379 (4,049) million during the first
nine months 2015. Excluding currency effects
and acquisition of businesses, sales and admini-

Alfa Laval AB (publ) Interim report July 1 – September 30, 2015
Page 6 (24)
stration expenses were 1.1 percent higher and
1.9 percent lower respectively than the
corresponding periods last year. The
corresponding figure when comparing the third
quarter 2015 with the previous quarter is a
decrease with 5.1 percent.
The costs for research and development during
the first nine months 2015 corresponded to 1.9
(2.3) percent of net sales. Excluding currency
effects and acquisition of businesses, the costs
for research and development have decreased by
1.3 percent during the third quarter and by 9.4
percent during the first nine months 2015
compared to the corresponding periods last year.
The decrease is explained by the earlier decided
efficiency programme.
The net income attributable to the owners of the
parent, excluding depreciation of step-up values
and the corresponding tax, was SEK 8.34 (5.94)
per share for the first nine months 2015.
Consolidated Income analysis
Third quarter First nine months Full year Last 12
SEK millions 2015 2014 2015 2014 2014 months
Net sales 9,693 9,272 28,941 24,292 35,067 39,716
Adjusted gross profit * 3,408 3,272 10,437 8,931 12,624 14,130
- in % of net sales 35.2 35.3 36.1 36.8 36.0 35.6
Expenses ** -1,567 -1,575 -4,886 -4,580 -6,164 -6,470
- in % of net sales 16.2 17.0 16.9 18.9 17.6 16.3
Adjusted EBITDA 1,841 1,697 5,551 4,351 6,460 7,660
- in % of net sales 19.0 18.3 19.2 17.9 18.4 19.3
Depreciation -164 -152 -486 -396 -565 -655
Adjusted EBITA 1,677 1,545 5,065 3,955 5,895 7,005
- in % of net sales 17.3 16.7 17.5 16.3 16.8 17.6
Amortisation of step up values -273 -284 -826 -626 -904 -1,104
Comparison distortion items - -260 - -320 -320 -
Operating income 1,404 1,001 4,239 3,009 4,671 5,901 * Excluding amortisation of step up values. ** Excluding comparison distortion items.
30.0
32.0
34.0
36.0
38.0
40.0
42.0
0
2,000
4,000
6,000
8,000
10,000
12,000
Q412 Q113 Q213 Q313 Q413 Q114 Q214 Q314 Q414 Q115 Q215 Q315
%SEK millions Net sales & adjusted gross profit margin
Net sales Adjusted gross profit in % of net sales
4.0
8.0
12.0
16.0
20.0
24.0
0
400
800
1,200
1,600
2,000
Q412 Q113 Q213 Q313 Q413 Q114 Q214 Q314 Q414 Q115 Q215 Q315
%SEK millionsAdjusted EBITA
Adjusted EBITA Adjusted EBITA in % of net sales

Alfa Laval AB (publ) Interim report July 1 – September 30, 2015
Page 7 (24)
Comparison distortion items
The operating income has been affected by
comparison distortion items of SEK - (-260)
million for the third quarter and SEK - (-320)
million for the first nine months 2015. Comparison
distortion items are reported gross in the
comprehensive income statement as a part of
other operating income and other operating
costs.
The comparison distortion cost of SEK -260
million in the third quarter last year related to a
cost reduction programme. The remaining
SEK -60 million related to one time acquisition
costs in the first quarter 2014 in connection with
the acquisition of Frank Mohn AS.
Consolidated Comparison distortion items
Third quarter First nine months Full year Last 12
SEK millions 2015 2014 2015 2014 2014 months
Operational
Other operating income 136 91 318 288 554 584
Comparison distortion income - - - - - -
Total other operating income 136 91 318 288 554 584
Other operating costs -267 -264 -780 -660 -904 -1,024
Comparison distortion costs - -260 - -320 -320 -
Total other operating costs -267 -524 -780 -980 -1,224 -1,024
Consolidated financial net
The financial net for the first nine months 2015
has amounted to SEK -172 (-156) million,
excluding realised and unrealised exchange rate
losses and gains. The main elements of costs
were interest on the debt to the banking
syndicate and on the bridge loan of SEK -13 (-46)
million, interest on the bilateral term loans of SEK
-61 (-54) million, interest on the private placement
of SEK -7 (-8) million, interest on the commercial
papers of SEK -1 (-4) million, interest on the
corporate bonds of SEK -64 (-4) million and a net
of dividends and other interest income and
interest costs of SEK -26 (-40) million. The net of
realised and unrealised exchange rate
differences has amounted to SEK -8 (91) million.
Key figures
Consolidated Key figures
September 30 December 31
2015 2014 2014
Return on capital employed (%) * 21.8 20.6 20.5
Return on equity capital (%) * 21.8 17.9 17.6
Solidity (%) ** 31.9 31.9 30.8
Net debt to EBITDA, times * 1.79 2.79 2.45
Debt ratio, times ** 0.79 0.88 0.88
Number of employees ** 17,392 17,820 17,753 * Calculated on a 12 months’ revolving basis. ** At the end of the period.
Please note that all key figures calculated on a 12
months’ revolving basis have not been proforma
adjusted for the acquisition of Frank Mohn AS.

Alfa Laval AB (publ) Interim report July 1 – September 30, 2015
Page 8 (24)
Business divisions The development of the order intake for the
divisions and their customer segments appears in
the following chart.
Industrial Equipment
9%
Sanitary10%
OEM5%
Service5%
Marine & Diesel
Equipment7%
Marine & Offshore
Systems5%
Marine & Offshore
Pumping Systems
10%
Service12%
Energy & Process
12%
Food & Life Science
11%
Water & Waste Treatment
1%
Service13%
Orders received by customer segment Q3 2015
-/-
- / = - / -
= / -
+ / -
= / =
- / -
- / -= / +
- / =
+ / +
- / +
Q3 2015 compared to
Q3 2014 / Q3 2015
compared to Q2 2015
Industrial Equipment
9%Sanitary
10%
OEM5%
Service5%
Marine & Diesel
Equipment8%
Marine & Offshore
Systems6%Marine &
Offshore
Pumping Systems
11%
Service11%
Energy & Process
12%
Food & Life Science
9%
Water & Waste Treatment
2%
Service12%
Orders received by customer segment YTD 2015
+- -
=
=
=
-
-=
-
=
*
YTD 2015 compared to YTD 2014
+ increase
- decrease
= unchanged (+/- 3 %)
at constant rates adjusted for acquisition of businesses
* New customer segment, no
comparison figures exist.
▲Equipment
▲Process Technology
▲ Marine & Diesel

Alfa Laval AB (publ) Interim report July 1 – September 30, 2015
Page 9 (24)
Equipment division
Consolidated
Third quarter First nine months Full year Last 12
SEK millions 2015 2014 2015 2014 2014 months
Orders received 2,545 2,462 7,946 7,344 9,867 10,469
Order backlog* 1,818 1,665 1,818 1,665 1,571 1,818
Net sales 2,671 2,531 7,806 7,158 9,787 10,435
Operating income** 365 306 996 913 1,320 1,403
Operating margin 13.7% 12.1% 12.8% 12.8% 13.5% 13.4%
Depreciation and amortisation 52 46 157 134 188 211
Investments 20 9 37 33 59 63
Assets* 6,656 5,890 6,656 5,890 6,424 6,656
Liabilities* 932 938 932 938 764 932
Number of employees* 2,537 2,662 2,537 2,662 2,667 2,537 * At the end of the period. ** In management accounts.
Consolidated Change excluding currency effects
Order intake Net sales
Structural Organic
Structural Organic
% change development Total change development Total
Q3 2015/2014 - -3.3 -3.3 - -1.2 -1.2
Q3/Q2 2015 - -10.6 -10.6 - 0.0 0.0
YTD 2015/2014 - -1.2 -1.2 - -0.4 -0.4
All comments below are excluding currency
effects.
Order intake
Order intake declined in the third quarter
compared to the second. While all capital sales
segments reported lower order intake, it was
particularly evident in Industrial Equipment where
a large district heating order taken in the second
quarter was not repeated. Demand for spare
parts and services remained on the same high
level as in the previous quarter. Geographically,
most major markets declined. India, however,
had good order intake in the quarter, especially in
Sanitary.
The Sanitary segment declined due to lower
volumes in food, whereas demand from
customers in personal care and pharma was very
good. The main explanatory factor for the decline
in Industrial Equipment was the non-repeat
large district heating order in the comfort
business. Excluding this order, comfort volumes
were only somewhat lower. Air products also
declined, partly due to lower demand among
customers, partly an effect of the closing of air
products manufacturing in the Netherlands and
moving it to Italy and Poland. The OEM segment
had a lower demand compared to the second
quarter, mainly due to slower activity among
customers in A/C, diesel engines and heat
pumps, following their stocking up on products
already in the second quarter, ahead of the
vacation period.
Operating income
The increase in operating income for Equipment
during the third quarter 2015 compared to the
corresponding period last year is mainly
explained by a higher sales volume, positive
foreign exchange effects and lower operating
costs.

Alfa Laval AB (publ) Interim report July 1 – September 30, 2015
Page 10 (24)
Process Technology division
Consolidated
Third quarter First nine months Full year Last 12
SEK millions 2015 2014 2015 2014 2014 months
Orders received 3,256 3,586 9,706 10,343 14,271 13,634
Order backlog* 8,285 8,777 8,285 8,777 8,440 8,285
Net sales 3,467 3,619 10,410 10,054 14,410 14,766
Operating income** 352 523 1,259 1,594 2,230 1,895
Operating margin 10.2% 14.5% 12.1% 15.9% 15.5% 12.8%
Depreciation and amortisation 92 82 267 237 325 355
Investments 42 21 96 68 111 139
Assets* 11,285 10,488 11,285 10,488 11,893 11,285
Liabilities* 4,507 4,835 4,507 4,835 4,237 4,507
Number of employees* 5,228 5,427 5,228 5,427 5,342 5,228 * At the end of the period. ** In management accounts.
Consolidated Change excluding currency effects
Order intake Net sales
Structural Organic
Structural Organic
% change development Total change development Total
Q3 2015/2014 0.1 -14.1 -14.0 0.2 -9.5 -9.3
Q3/Q2 2015 0.1 5.1 5.2 0.1 -9.1 -9.0
YTD 2015/2014 0.0 -15.1 -15.1 0.1 -5.3 -5.2
All comments below are excluding currency
effects.
Order intake
The order intake in the Process Technology
division grew somewhat versus the second
quarter, driven by the Food & Life Science
segment, whereas the Energy & Process
segment was unchanged. For the division as a
whole orders with a value above SEK 5 million
developed strongly, while the base business*
declined. The very large orders with a value
above SEK 50 million were on about the same
level as in the second quarter. Geographically,
most regions recorded growth – the exception
being North America.
The unchanged order level in Energy & Process
reflected a continued low activity level in the oil
and gas industry. A contraction upstream was
more than compensated by a good development
in the midstream business. In a climate with
continued limitations on capex spending for pure
capacity-related investments, customers prioritize
efficiency investments and general upgrades.
Downstream, the market unit Petrochemicals saw
a strong recovery, driven by Europe and Asia.
The market unit Inorganics, Metals & Paper also
developed favourably. The market units Refinery
and Power, however, were below the second
quarter. The base business declined for the
segment as a whole, mirroring the prevailing
uncertainty in the oil and gas sector as a whole.
The Food & Life Science segment saw a strong
order increase compared to the previous quarter,
boosted by large capacity-related brewery and
vegetable oil orders from emerging markets.
North America and Europe, however, declined.
Order intake in the Water & Waste Treatment
segment declined in the quarter, primarily in
North America.
The Service segment was unchanged. Demand
from the whole oil and gas chain was slightly up,
driven by activity in the up- and midstream
sectors, while Water & Waste Treatment noted a
somewhat weaker development.
Operating income
The decrease in operating income for Process
Technology during the third quarter 2015
compared to the corresponding period last year is
explained by a lower sales volume, a weak
productivity development within engineering and
higher costs in certain customer projects.
* Base business and base orders refer to orders with an order value of less than EUR 0.5 million.
Alfa Laval AB (publ) Interim report July 1 – September 30, 2015
Page 11 (24)
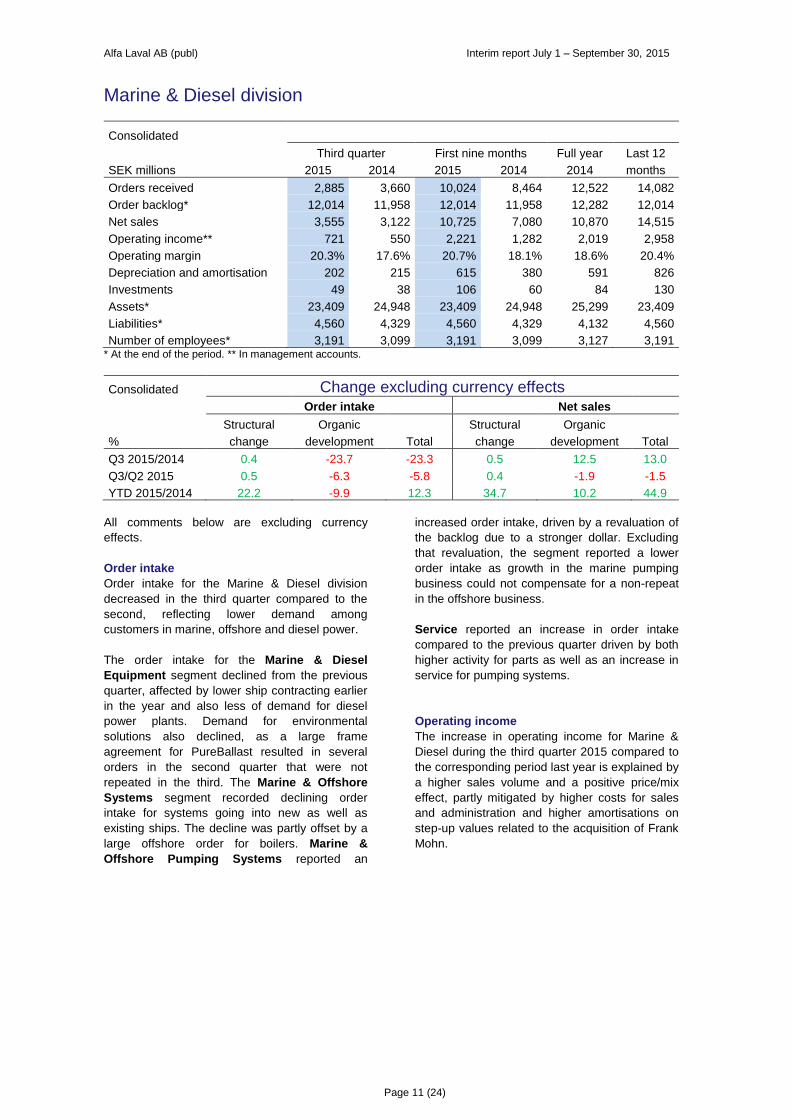
Marine & Diesel division
Consolidated
Third quarter First nine months Full year Last 12
SEK millions 2015 2014 2015 2014 2014 months
Orders received 2,885 3,660 10,024 8,464 12,522 14,082
Order backlog* 12,014 11,958 12,014 11,958 12,282 12,014
Net sales 3,555 3,122 10,725 7,080 10,870 14,515
Operating income** 721 550 2,221 1,282 2,019 2,958
Operating margin 20.3% 17.6% 20.7% 18.1% 18.6% 20.4%
Depreciation and amortisation 202 215 615 380 591 826
Investments 49 38 106 60 84 130
Assets* 23,409 24,948 23,409 24,948 25,299 23,409
Liabilities* 4,560 4,329 4,560 4,329 4,132 4,560
Number of employees* 3,191 3,099 3,191 3,099 3,127 3,191 * At the end of the period. ** In management accounts.
Consolidated Change excluding currency effects
Order intake Net sales
Structural Organic
Structural Organic
% change development Total change development Total
Q3 2015/2014 0.4 -23.7 -23.3 0.5 12.5 13.0
Q3/Q2 2015 0.5 -6.3 -5.8 0.4 -1.9 -1.5
YTD 2015/2014 22.2 -9.9 12.3 34.7 10.2 44.9
All comments below are excluding currency
effects.
Order intake
Order intake for the Marine & Diesel division
decreased in the third quarter compared to the
second, reflecting lower demand among
customers in marine, offshore and diesel power.
The order intake for the Marine & Diesel
Equipment segment declined from the previous
quarter, affected by lower ship contracting earlier
in the year and also less of demand for diesel
power plants. Demand for environmental
solutions also declined, as a large frame
agreement for PureBallast resulted in several
orders in the second quarter that were not
repeated in the third. The Marine & Offshore
Systems segment recorded declining order
intake for systems going into new as well as
existing ships. The decline was partly offset by a
large offshore order for boilers. Marine &
Offshore Pumping Systems reported an
increased order intake, driven by a revaluation of
the backlog due to a stronger dollar. Excluding
that revaluation, the segment reported a lower
order intake as growth in the marine pumping
business could not compensate for a non-repeat
in the offshore business.
Service reported an increase in order intake
compared to the previous quarter driven by both
higher activity for parts as well as an increase in
service for pumping systems.
Operating income
The increase in operating income for Marine &
Diesel during the third quarter 2015 compared to
the corresponding period last year is explained by
a higher sales volume and a positive price/mix
effect, partly mitigated by higher costs for sales
and administration and higher amortisations on
step-up values related to the acquisition of Frank
Mohn.
Alfa Laval AB (publ) Interim report July 1 – September 30, 2015
Page 12 (24)
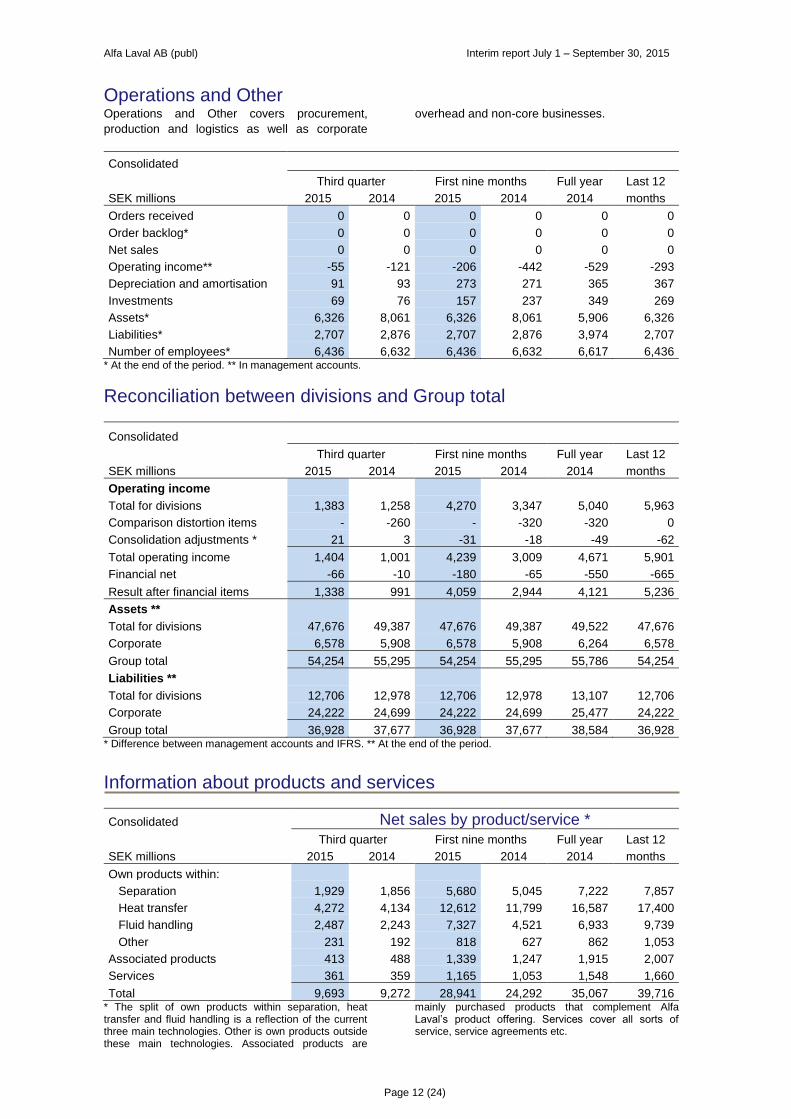
Operations and Other Operations and Other covers procurement,
production and logistics as well as corporate
overhead and non-core businesses.
Consolidated
Third quarter First nine months Full year Last 12
SEK millions 2015 2014 2015 2014 2014 months
Orders received 0 0 0 0 0 0
Order backlog* 0 0 0 0 0 0
Net sales 0 0 0 0 0 0
Operating income** -55 -121 -206 -442 -529 -293
Depreciation and amortisation 91 93 273 271 365 367
Investments 69 76 157 237 349 269
Assets* 6,326 8,061 6,326 8,061 5,906 6,326
Liabilities* 2,707 2,876 2,707 2,876 3,974 2,707
Number of employees* 6,436 6,632 6,436 6,632 6,617 6,436 * At the end of the period. ** In management accounts.
Reconciliation between divisions and Group total
Consolidated
Third quarter First nine months Full year Last 12
SEK millions 2015 2014 2015 2014 2014 months
Operating income
Total for divisions 1,383 1,258 4,270 3,347 5,040 5,963
Comparison distortion items - -260 - -320 -320 0
Consolidation adjustments * 21 3 -31 -18 -49 -62
Total operating income 1,404 1,001 4,239 3,009 4,671 5,901
Financial net -66 -10 -180 -65 -550 -665
Result after financial items 1,338 991 4,059 2,944 4,121 5,236
Assets **
Total for divisions 47,676 49,387 47,676 49,387 49,522 47,676
Corporate 6,578 5,908 6,578 5,908 6,264 6,578
Group total 54,254 55,295 54,254 55,295 55,786 54,254
Liabilities **
Total for divisions 12,706 12,978 12,706 12,978 13,107 12,706
Corporate 24,222 24,699 24,222 24,699 25,477 24,222
Group total 36,928 37,677 36,928 37,677 38,584 36,928 * Difference between management accounts and IFRS. ** At the end of the period.
Information about products and services
Consolidated Net sales by product/service *
Third quarter First nine months Full year Last 12
SEK millions 2015 2014 2015 2014 2014 months
Own products within:
Separation 1,929 1,856 5,680 5,045 7,222 7,857
Heat transfer 4,272 4,134 12,612 11,799 16,587 17,400
Fluid handling 2,487 2,243 7,327 4,521 6,933 9,739
Other 231 192 818 627 862 1,053
Associated products 413 488 1,339 1,247 1,915 2,007
Services 361 359 1,165 1,053 1,548 1,660
Total 9,693 9,272 28,941 24,292 35,067 39,716 * The split of own products within separation, heat transfer and fluid handling is a reflection of the current three main technologies. Other is own products outside these main technologies. Associated products are
mainly purchased products that complement Alfa Laval’s product offering. Services cover all sorts of service, service agreements etc.

Alfa Laval AB (publ) Interim report July 1 – September 30, 2015
Page 13 (24)
New products during the third quarter
During the third quarter Alfa Laval has introduced
among others the following new product:
Alfa Laval Culturefuge 200
Centrifuge for advanced drug production in the biopharmaceutical industries
Alfa Laval Culturefuge 200 expands the separator
range of hermetic cell culture centrifuges,
designed for gentle harvesting of shear-sensitive
material in applications involving mammalian cell
cultures and precipitated proteins. The
Culturefuge separator features Alfa Laval’s
unique hollow spindle feed arrangement, which
ensures a very gentle, low-shear acceleration of
particles. Special care has been taken with
maintaining hygienic standards and the unit can
be sterilized and cleaned-in-place. In addition, the
solids-ejecting system with fast and partial
discharge ensures low product losses. Benefits at
a glance:
Compact and flexible design
Sterilisable
CIP (Cleaning-In-Place)
Alfa Laval Culturefuge 200 was first presented at
the ACHEMA 2015 trade show in Frankfurt in
June.

Alfa Laval AB (publ) Interim report July 1 – September 30, 2015
Page 14 (24)
Information by region
Nordic
Western Europe
Central & Eastern Europe
Asia
Latin America
North America
Other
8%
20%
6%
42%
6%
16%
2%
Orders received third quarter
= Compared to Q3 2014 / Q2 2015 excluding currency effects
-1% / -27%
-4% / -9%
-6% / +4%
-12% / +7%
-44% / -20%
+13% / +41%
Nordic
Western Europe
Central & Eastern Europe
Asia
Latin America
North America
Other
10%
20%
5%
40%
5%
18%
2%
Orders received YTD 2015
= Compared to YTD 2014 excluding currency effects
+26%
-3%
-8%
+3%
-19%
-7%
All comments are excluding currency effects.
Western Europe including Nordic Order intake decreased in the third quarter
compared with the second, affected by fewer
large contracts and a decline in the base
business*. Energy & Process, Water & Waste
Treatment and Marine & Offshore Systems
developed well while OEM, Sanitary, Industrial
Equipment, Marine & Diesel Equipment and Food
& Life Science all declined. From a country
perspective Germany grew, while the rest
declined.
Central and Eastern Europe The region reported an increase in order intake
compared to the second quarter, driven by a
positive development in Russia and Turkey.
Order intake in Russia grew following a very
strong quarter for the service business in Marine
& Diesel, as well as Process Technology. At the
same time, the Energy & Process segment grew,
recovering from the very low levels seen in both
the first and second quarter. In Turkey, the
positive development was driven by the
Equipment division, as well as a strong service
business in the Marine & Diesel and Process
Technology divisions.
* Base business and base orders refer to orders with an order value of less than EUR 0.5 million.

Alfa Laval AB (publ) Interim report July 1 – September 30, 2015
Page 15 (24)
North America North America reported a decline in order intake
in the third quarter compared to the second, due
to fewer larger orders and a decline in the base
business. All segments came in lower, except
Service that reported an unchanged level. From a
country perspective Canada reported growth,
while the U.S. saw a decline, among other things
due to a non-repeated larger order within Water &
Waste Treatment.
Latin America Latin America had a strong development of the
order intake and recovered from a very weak
second quarter, lifted by a good base business in
Process Technology and Equipment, an increase
in larger orders and a good service performance
in all three divisions. While there was still no
improvement of the general business climate in
Brazil, the order intake grew. Larger orders in the
food and process-related businesses, as well as
a positive base business development contrib-
uted to the increase.
Asia Order intake showed a positive development
during the third quarter, lifted by growth in China,
India, Japan and parts of South East Asia. The
best performance was reported in the Process
Technology division, with large orders concerning
vegetable oil in China as well as brewery in India.
The order intake for market units Oil & Gas and
Petrochemicals were also up compared to the
weak levels seen in the second quarter. The
Marine & Diesel division grew somewhat as the
marine business in the Marine & Offshore
Pumping Systems segment continued to see a
positive impact from a beneficial ship contracting
mix (high proportion chemical and product
tankers) and the revaluation of the order backlog.
The Equipment division showed a decline as a
large district heating order in the second quarter
was not repeated. Meanwhile, the Sanitary and
OEM businesses both did well. Sanitary was
lifted by improved demand in the food-related
businesses in China and South East Asia, while
OEM benefitted from an increase in construction-
related demand in Japan. China grew somewhat
compared to the previous quarter. Partly this was
a result of a positive development in the land-
based business, where particularly the food-
related business did well. Service in China also
showed good growth across all three service
segments when compared to the previous
quarter.
Consolidated Net sales
Third quarter First nine months Full year Last 12
SEK millions 2015 2014 2015 2014 2014 months
To customers in:
Sweden 217 189 639 599 820 860
Other EU 2,249 2,260 6,744 6,323 9,153 9,574
Other Europe 665 591 2,154 1,741 2,575 2,988
USA 1,661 1,498 5,028 3,927 5,446 6,547
Other North America 186 297 720 766 1,105 1,059
Latin America 446 587 1,377 1,603 2,205 1,979
Africa 63 71 243 232 364 375
China 1,209 1,083 3,422 2,655 3,838 4,605
South Korea 1,309 1,295 3,911 2,580 3,952 5,283
Other Asia 1,558 1,287 4,366 3,510 5,122 5,978
Oceania 130 114 337 356 487 468
Total 9,693 9,272 28,941 24,292 35,067 39,716
Net sales are reported by country on the basis of
invoicing address, which is normally the same as
the delivery address.
Alfa Laval AB (publ) Interim report July 1 – September 30, 2015
Page 16 (24)
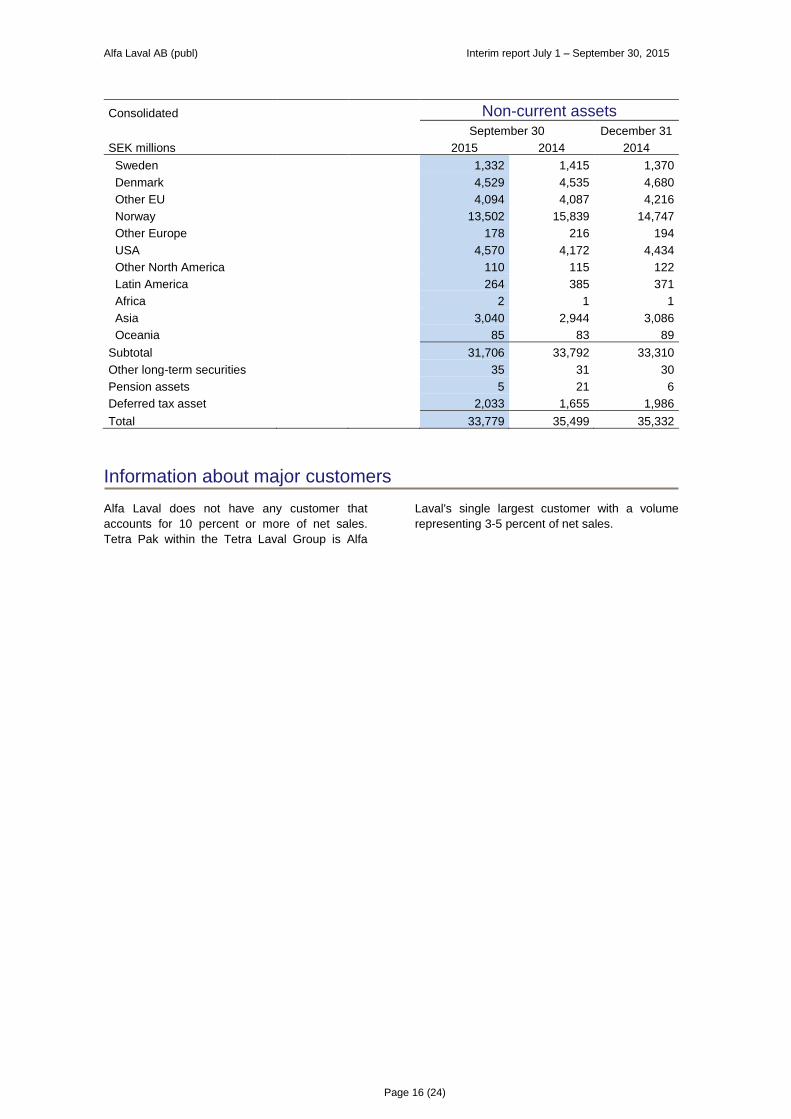
Consolidated Non-current assets
September 30 December 31
SEK millions 2015 2014 2014
Sweden
1,332 1,415 1,370
Denmark
4,529 4,535 4,680
Other EU
4,094 4,087 4,216
Norway
13,502 15,839 14,747
Other Europe
178 216 194
USA
4,570 4,172 4,434
Other North America
110 115 122
Latin America
264 385 371
Africa
2 1 1
Asia
3,040 2,944 3,086
Oceania
85 83 89
Subtotal
31,706 33,792 33,310
Other long-term securities
35 31 30
Pension assets
5 21 6
Deferred tax asset
2,033 1,655 1,986
Total 33,779 35,499 35,332
Information about major customers
Alfa Laval does not have any customer that
accounts for 10 percent or more of net sales.
Tetra Pak within the Tetra Laval Group is Alfa
Laval's single largest customer with a volume
representing 3-5 percent of net sales.

Alfa Laval AB (publ) Interim report July 1 – September 30, 2015
Page 17 (24)
Cash flows
CONSOLIDATED CASH FLOWS
Third quarter First nine months Full year Last 12
SEK millions 2015 2014 2015 2014 2014 months
Operating activities
Operating income 1,404 1,001 4,239 3,009 4,671 5,901
Adjustment for depreciation and amortisation 437 436 1,312 1,022 1,469 1,759
Adjustment for other non-cash items 0 -70 -231 -121 -83 -193
1,841 1,367 5,320 3,910 6,057 7,467
Taxes paid -317 -321 -1,151 -1,027 -1,422 -1,546
1,524 1,046 4,169 2,883 4,635 5,921
Changes in working capital:
Increase(-)/decrease(+) of receivables 139 375 417 95 -282 40
Increase(-)/decrease(+) of inventories -38 -113 -298 -376 -99 -21
Increase(+)/decrease(-) of liabilities -331 67 -340 595 596 -339
Increase(+)/decrease(-) of provisions 75 292 27 236 273 64
Increase(-)/decrease(+) in working capital -155 621 -194 550 488 -256
1,369 1,667 3,975 3,433 5,123 5,665
Investing activities
Investments in fixed assets (Capex) -180 -144 -396 -398 -603 -601
Divestment of fixed assets 10 1 11 1 76 86
Acquisition of businesses -73 -9 -73 -14,393 -14,443 -123
-243 -152 -458 -14,790 -14,970 -638
Financing activities
Received interests and dividends 20 25 63 67 114 110
Paid interests -111 -79 -248 -206 -281 -323
Realised financial exchange differences -80 -208 -194 26 -266 -486
Dividends to owners of the parent - - -1,678 -1,573 -1,573 -1,678
Dividends to non-controlling interests 0 0 -18 -4 -5 -19
Increase(-)/decrease(+) of financial assets -83 4 -128 84 54 -158
Increase(+)/decrease(-) of borrowings -765 -997 -1,637 13,387 12,207 -2,817
-1,019 -1,255 -3,840 11,781 10,250 -5,371
Cash flow for the period 107 260 -323 424 403 -344
Cash and bank at the beginning of the period 1,620 1,665 2,013 1,446 1,446 1,975
Translation difference in cash and bank -67 50 -30 105 164 29
Cash and bank at the end of the period 1,660 1,975 1,660 1,975 2,013 1,660
Free cash flow per share (SEK) * 2.68 3.61 8.38 -27.08 -23.48 11.98
Capex in relation to sales 1.9% 1.6% 1.4% 1.6% 1.7% 1.5%
Average number of shares 419,456,315 419,456,315 419,456,315 419,456,315 419,456,315 419,456,315
* Free cash flow is the sum of cash flows from operating and investing activities.
During the first nine months 2015 cash flows from operating and investing activities amounted to SEK 3,517 (-11,357) million. Depreciation, ex-
cluding allocated step-up values, was SEK 486 (396) million during the first nine months.

Alfa Laval AB (publ) Interim report July 1 – September 30, 2015
Page 18 (24)
Financial position and equity
CONSOLIDATED FINANCIAL POSITION
September 30 December 31
SEK millions 2015 2014 2014
ASSETS Non-current assets Intangible assets 26,893 28,784 28,306
Property, plant and equipment 4,813 5,008 5,004
Other non-current assets 2,073 1,707 2,022
33,779 35,499 35,332
Current assets Inventories 8,183 7,941 7,883
Assets held for sale 6 - 6
Accounts receivable 6,047 5,973 6,684
Other receivables 3,591 3,170 2,995
Derivative assets 148 113 176
Other current deposits 840 624 697
Cash and bank * 1,660 1,975 2,013
20,475 19,796 20,454
TOTAL ASSETS 54,254 55,295 55,786
SHAREHOLDERS' EQUITY AND LIABILITIES Equity Owners of the parent 17,206 17,512 17,077
Non-controlling interests 120 106 125
17,326 17,618 17,202
Non-current liabilities Liabilities to credit institutions etc 14,550 16,805 16,454
Provisions for pensions and similar commitments 2,344 1,658 2,221
Provision for deferred tax 2,765 2,890 3,074
Other provisions 527 501 543
20,186 21,854 22,292
Current liabilities Liabilities to credit institutions etc 1,589 1,194 1,251
Accounts payable 2,833 2,750 2,904
Advances from customers 3,491 3,723 3,796
Other provisions 1,920 1,837 1,862
Other liabilities 6,067 6,080 5,507
Derivative liabilities 842 239 972
16,742 15,823 16,292
Total liabilities 36,928 37,677 38,584
TOTAL SHAREHOLDERS' EQUITY & LIABILITIES 54,254 55,295 55,786 * The item cash and bank is mainly relating to bank deposits.

Alfa Laval AB (publ) Interim report July 1 – September 30, 2015
Page 19 (24)
Consolidated Financial assets and liabilities at fair value
Valuation hierarchy September 30 December 31
SEK millions level 2015 2014 2014
Financial assets
Other long term securities 1 and 2 35 31 30
Bonds and other securities 1 741 459 532
Derivative assets 1 148 113 176
Financial liabilities
Derivative liabilities 1 842 239 972 Valuation hierarchy level 1 is according to quoted prices in active markets for identical assets and liabilities. Valuation hierarchy level 2 is out of directly or indirectly observable market data outside level 1.
Consolidated Borrowings and net debt
September 30 December 31
SEK millions 2015 2014 2014
Credit institutions 1,201 3,863 2,981
Swedish Export Credit 3,027 2,821 2,975
European Investment Bank 2,309 2,246 2,332
Private placement 922 795 864
Commercial papers 1,200 999 999
Corporate bonds 7,480 7,275 7,554
Capitalised financial leases 61 74 73
Interest-bearing pension liabilities 0 0 0
Total debt 16,200 18,073 17,778
Cash, bank and current deposits -2,500 -2,599 -2,710
Net debt 13,700 15,474 15,068
Alfa Laval has a senior credit facility of EUR 400
million and USD 544 million, corresponding to
SEK 8,333 million with a banking syndicate. At
September 30, 2015 SEK 779 million of the
facility was utilised. The facility matures in June
2019, with two one year extension options.
The corporate bonds are listed on the Irish stock
exchange and consist of one tranche of EUR 300
million that matures in September 2019 and one
tranche of EUR 500 million that matures in
September 2022.
The bilateral term loans with Swedish Export
Credit consist of one loan of EUR 100 million that
matures in June 2017 and one loan of EUR 100
million that matures in June 2021 as well as a
loan of USD 136 million that matures in June
2020.
The loans from the European Investment Bank is
split on one loan of EUR 130 million that matures
in March 2018 and an additional loan of EUR 115
million that matures in June 2021.
The private placement of USD 110 million
matures in April 2016.
The commercial paper programme is SEK
2,000 million, out of which nominally SEK 1,200
million with 3-5 months duration was utilised at
September 30, 2015.

Alfa Laval AB (publ) Interim report July 1 – September 30, 2015
Page 20 (24)
CHANGES IN CONSOLIDATED EQUITY
First nine months Full year
SEK millions 2015 2014 2014
At the beginning of the period 17,202 16,162 16,162
Changes attributable to:
Owners of the parent
Comprehensive income
Comprehensive income for the period 1,807 2,998 2,563
Transactions with shareholders
Dividends -1,678 -1,573 -1,573
-1,678 -1,573 -1,573
Subtotal 129 1,425 990
Non-controlling interests
Comprehensive income
Comprehensive income for the period 13 18 38
Transactions with shareholders
Non-controlling interests in acquired companies - 17 17
Dividends -18 -4 -5
-18 13 12
Subtotal -5 31 50
At the end of the period 17,326 17,618 17,202
Acquisition of businesses Alfa Laval has as from July 3, 2015 acquired 100
percent of an aftermarket company specialized in
separation technology. The company will remain
a separate organisation and offer its own parts
and services under its own brand name. On a
whole year basis revenues are estimated to
amount to about SEK 50 million this year. The
acquisition is in line with the strategy of the Alfa
Laval Group of acquiring companies that
complement the existing business in terms of
products, geography or in the form of new sales
channels. In this case the Alfa Laval Group adds
a complementary aftermarket channel. “With the
acquisition we are adding presence in an
important niche of the aftermarket,” says Lars
Renström, President and CEO of the Alfa Laval
Group.
On July 31, 2015 Alfa Laval has acquired 100
percent of K-Bar Parts LLC, which is a small
aftermarket company in the US. The company
has since them been renamed to Alfa Laval
Kathabar Inc.
The purchase price allocation relating to the
acquisition of CorHex Corp at November 4, 2014
is still preliminary.

Alfa Laval AB (publ) Interim report July 1 – September 30, 2015
Page 21 (24)
The acquisitions during the first nine months
2015 can be summarized as follows. Please
observe that the purchase price allocations for
the two acquisitions during 2015 are still
preliminary.
Consolidated Acquisitions 2015
Total
Adjustment
Book to fair Fair
SEK millions value value value
Trademarks (1)
- 35 35
Inventory 50 - 50
Accounts receivable 2 - 2
Other receivables 13 - 13
Accounts payable -1 - -1
Other liabilities -40 - -40
Deferred tax - -6 -6
Acquired net assets 24 29 53
Goodwill (2)
18
Purchase price -71
Costs directly linked to the acquisitions (3)
-2
Payment of amounts retained in prior years 0
Effect on the Group's liquid assets -73
1. The step up value for trademarks is amortised over 10 years. 2. The goodwill is relating to estimated synergies in procurement, logistics and corporate overheads and the
companies' ability to over time recreate its intangible assets. The value of the goodwill is still preliminary. 3. Refers to fees to lawyers, due diligence and assisting counsel. Has been expensed as other operating costs.
Parent company The parent company's result after financial items
was SEK 63 (162) million, out of which dividends
from subsidiaries SEK 69 (130) million, net
interests SEK 0 (32) million, realised and
unrealised exchange rate gains and losses
SEK -2 (3) million, costs related to the listing
SEK -4 (-3) million, fees to the Board SEK -3 (-4)
million, cost for annual report and annual general
meeting SEK -2 (-2) million and other operating
income and operating costs the remaining SEK 5
(6) million.
Alfa Laval AB (publ) Interim report July 1 – September 30, 2015
Page 22 (24)
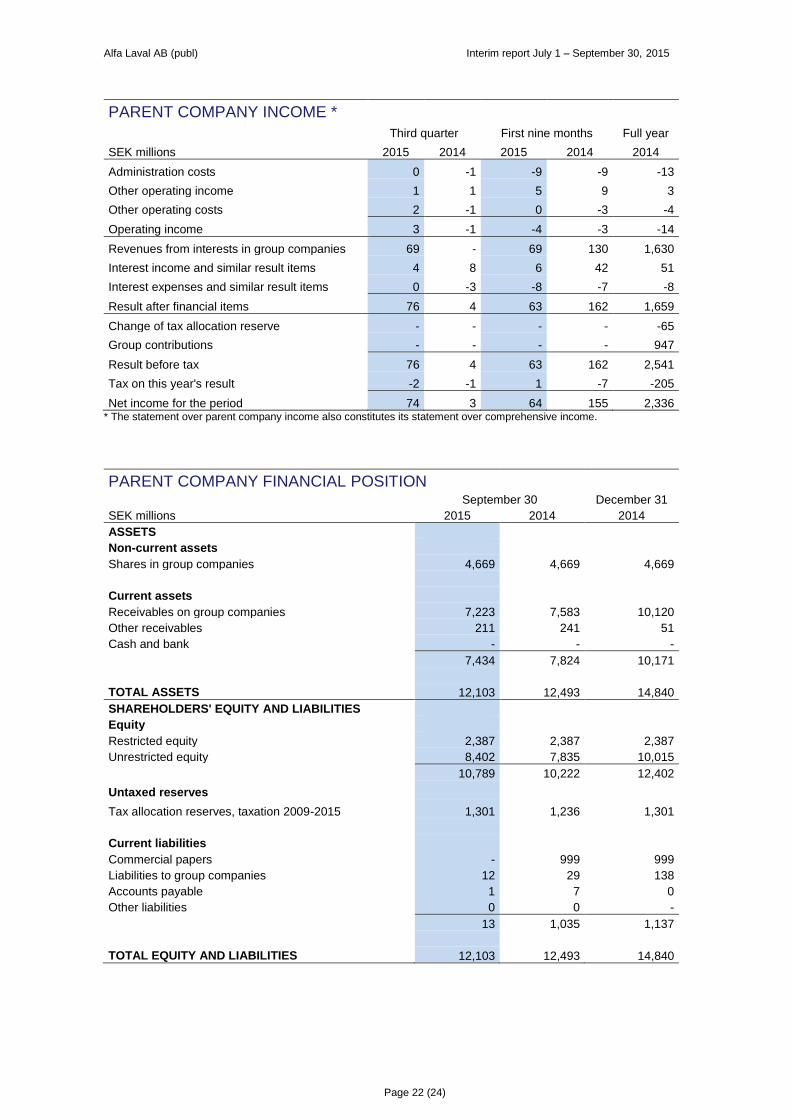
PARENT COMPANY INCOME *
Third quarter First nine months Full year
SEK millions 2015 2014 2015 2014 2014
Administration costs 0 -1 -9 -9 -13
Other operating income 1 1 5 9 3
Other operating costs 2 -1 0 -3 -4
Operating income 3 -1 -4 -3 -14
Revenues from interests in group companies 69 - 69 130 1,630
Interest income and similar result items 4 8 6 42 51
Interest expenses and similar result items 0 -3 -8 -7 -8
Result after financial items 76 4 63 162 1,659
Change of tax allocation reserve - - - - -65
Group contributions - - - - 947
Result before tax 76 4 63 162 2,541
Tax on this year's result -2 -1 1 -7 -205
Net income for the period 74 3 64 155 2,336 * The statement over parent company income also constitutes its statement over comprehensive income.
PARENT COMPANY FINANCIAL POSITION
September 30 December 31
SEK millions 2015 2014 2014
ASSETS Non-current assets Shares in group companies 4,669 4,669 4,669
Current assets Receivables on group companies 7,223 7,583 10,120
Other receivables 211 241 51
Cash and bank - - -
7,434 7,824 10,171
TOTAL ASSETS 12,103 12,493 14,840
SHAREHOLDERS' EQUITY AND LIABILITIES Equity Restricted equity 2,387 2,387 2,387
Unrestricted equity 8,402 7,835 10,015
10,789 10,222 12,402
Untaxed reserves Tax allocation reserves, taxation 2009-2015 1,301 1,236 1,301
Current liabilities Commercial papers - 999 999
Liabilities to group companies 12 29 138
Accounts payable 1 7 0
Other liabilities 0 0 -
13 1,035 1,137
TOTAL EQUITY AND LIABILITIES 12,103 12,493 14,840

Alfa Laval AB (publ) Interim report July 1 – September 30, 2015
Page 23 (24)
Owners and shares Owners and legal structure Alfa Laval AB (publ) is the parent company of the
Alfa Laval Group. The company had 38,483
(38,185) shareholders on September 30, 2015.
The largest owner is Tetra Laval B.V., the
Netherlands who owns 26.1 (26.1) percent. Next
to the largest owner there are nine institutional
investors with ownership in the range of 6.0 to 0.8
percent. These ten largest shareholders owned
55.9 (54.1) percent of the shares.
Nomination Committee for the Annual General Meeting 2016 In accordance with a resolution taken at the
Annual General Meeting of Alfa Laval AB on April
23, 2015, the Chairman of the Board, Anders
Narvinger, has contacted the largest
shareholders to constitute the Nomination
Committee in preparation of the Annual General
Meeting 2016. The following persons have
accepted to be part of the Nomination
Committee: Finn Rausing, Tetra Laval, Claes
Dahlbäck, Foundation Asset Management,
Ramsay Brufer, Alecta, Jan Andersson,
Swedbank Robur Fonder and Lars-Åke
Bokenberger, AMF Pension.
The Annual General Meeting of Alfa Laval AB will
be held at Sparbanken Skåne Arena,
Klostergårdens idrottsområde, Stattenavägen,
Lund, Sweden on Monday April 25, 2016, at
16.00 (CET).
Shareholders who wish to submit proposals for
the Nomination Committee in preparation of the
Annual General Meeting can turn to the Chair-
man of the Board of Alfa Laval AB, Anders
Narvinger or to the other shareholder representa-
tives. Contact can also be made directly via e-
mail to [email protected].
Risks and other
Material factors of risk and uncertainty The main factors of risk and uncertainty facing
the Group concern the price development of
metals, fluctuations in major currencies and the
business cycle. It is the company’s opinion that
the description of risks made in the Annual
Report for 2014 is still correct.
Asbestos-related lawsuits The Alfa Laval Group was as of September 30,
2015, named as a co-defendant in a total of 749
asbestos-related lawsuits with a total of
approximately 750 plaintiffs. Alfa Laval strongly
believes the claims against the Group are without
merit and intends to vigorously contest each
lawsuit.
Based on current information and Alfa Laval’s
understanding of these lawsuits, Alfa Laval
continues to believe that these lawsuits will not
have a material adverse effect on the Group’s
financial condition or results of operation.
Accounting principles The interim report for the third quarter 2015 is
prepared in accordance with IAS 34 Interim
Financial Reporting and the Swedish Annual
Accounts Act. The accounting principles are
according to IFRS (International Financial
Reporting Standards) as adopted by the
European Union.
“Third quarter” refers to the period July 1 to
September 30 and “First nine months” refers to
the period January 1 to September 30. “Full year”
refers to the period January 1 to December 31.
“Last 12 months” refers to the period October 1,
2014 to September 30, 2015. “The corresponding
period last year” refers to the third quarter 2014
or the first nine months 2014 depending on the
context. “Previous quarter” refers to the second
quarter 2015.
In the report the measures adjusted EBITA and
adjusted EBITDA are used. Adjusted EBITA is
defined as earnings before interests, taxes,
amortisation of step up values and comparison
distortion items. Adjusted EBITDA is defined as
earnings before interests, taxes, depreciation,
amortisation of step up values and comparison
distortion items.
The accounting and valuation principles of the
parent company comply with the Swedish Annual
Accounts Act and the recommendation RFR 2
“Accounting for legal entities” issued by the
Council for Financial Reporting in Sweden.
Date for the next financial report The fourth quarter and full year 2015 report will
be published on February 2, 2016.
Alfa Laval will publish interim reports during
2016 at the following dates:
Interim report for the first quarter April 25
Interim report for the second quarter July 18
Interim report for the third quarter October 25
Alfa Laval AB (publ) Interim report July 1 – September 30, 2015
Page 24 (24)
The interim report has been issued on October 27, 2015 at CET 7.30 by the President and Chief Executive Officer Lars Renström by proxy from the Board of Directors.
Lund, October 27, 2015,
Lars Renström
President and Chief Executive Officer
Alfa Laval AB (publ)
Review report
Introduction We have reviewed the summary interim financial
information (the interim report) of Alfa Laval AB
(publ) as of September 30, 2015 and the nine
months’ period then ended. The Board of
Directors and the President are responsible for
the preparation and presentation of this interim
report in accordance with IAS 34 and the
Swedish Annual Accounts Act. Our responsibility
is to express a conclusion on this interim report
based on our review.
Scope of review We conducted our review in accordance with
International Standard on Review Engagements
ISRE 2410 “Review of Interim Financial
Information Performed by the Independent
Auditor of the Entity”. A review consists of making
inquiries, primarily of persons responsible for
financial and accounting matters, and applying
analytical and other review procedures. A review
is substantially less in scope than an audit
conducted in accordance with the International
Standards on Auditing and other generally
accepted auditing practices. The procedures
performed in a review do not enable us to obtain
a level of assurance that would make us aware of
all significant matters that might be identified in
an audit. Therefore, the conclusion expressed
based on a review does not give the same level
of assurance as a conclusion expressed based
on an audit.
Conclusion Based on our review, nothing has come to our
attention that causes us to believe that the interim
report, in all material aspects, is not prepared for
the Group in accordance with IAS 34 and the
Swedish Annual Accounts Act and for the Parent
company in accordance with the Swedish Annual
Accounts Act.
Lund, October 27, 2015,
Håkan Olsson Reising Helene Willberg
Authorised Public Authorised Public
Accountant Accountant